Embed Size (px)
Citation preview
1
Collision Avoidance of Golden Eagles at Wind Farms under the
‘Band’ Collision Risk Model
D.P. Whitfield
Report to Scottish Natural Heritage
March 2009
Natural Research Ltd, Banchory, UK.

2
SUMMARY
1. Collision risk models (CRMs) are potentially useful, albeit crude, tools in predicting the
potential avian collision mortality rates which rotating turbine blades at operational wind
farms may incur. The ‘Band’ CRM (Band et al. (2007) has probably received the most
utility in practice and therefore, attention, concerning potential deficiencies.
2. The most obvious barrier to the Band CRM in realising its potential to produce realistic
mortality predictions is that it assumes that birds do not avoid collision, whereas it is
apparent that avoidance rates are very high at operational wind farms. Deriving
estimates of avoidance rates has thus become an urgent research field.
3. The present study calculated estimates of avoidance rates for the golden eagle Aquila
chrysaetos under the Band CRM using results from monitoring studies at four USA wind
farms, attempting to account for the many biases which are inherent in avoidance rate
calculations.
4. Avoidance rate estimates for golden eagles varied between 98.64 % and 99.89 %
depending on site and uncertainty associated with observed mortality rates before and
after adjustment for potential biases. An overall ‘worst case’ estimate weighted by the
scale of study was 99.33 % and the mean unweighted ‘worst case’ (lowest) avoidance
rate for the four wind farms was 99.19 %. A precautionary value of 99.0 % is therefore
recommended for use in predictive assessments of wind farm proposals. Other
recommendations include the need for further research which avoids the biases inherent
in many existing studies of wind farm effects on birds.
5. The estimated avoidance rates, and the means of their derivation, documented by the
present study, are contrasted with those calculated for golden eagle by Fernley (2008),
which are higher. Several discrepancies are identified which would lead to elevated
estimates of avoidance rates by Fernley (2008), such as not accounting for some eagle
deaths or relatively high inactivity of turbines at some sites, or using inflated measures of
eagle activity.

3
1. INTRODUCTION
As a means of generating ‘renewable’ energy, wind farms represent a potential
contributor to resolving the widely acknowledged problem of the impacts of
anthropogenic increases in ‘greenhouse gases’ through burning of fossil fuels on climate
change. Wind farms are not ‘environmentally-neutral’, however, and in particular their
potential impacts on birds through fatality from collision with rotating turbine blades has
been frequently cited as an adverse impact (Percival 2000, Langston & Pullan 2003,
Whitfield & Coupar 2008).
The scale and pace of potential climate change and its impacts has engendered a rapid
advancement of the wind energy industry against which research on its effects on birds
has struggled to keep pace (Whitfield & Coupar 2008). With regards to the potentially
detrimental effects of collision fatality, the collision risk model (CRM) described by Band
et al. (2007) offers a crude mechanism for predicting potential avian mortality rates
which proposed wind farms may create (Chamberlain et al. 2006, Madders & Whitfield
2006). Modelling collision risk under the Band CRM is a two-stage process (Band et al.
2007). Stage 1 estimates the number of birds that fly (‘transits’) through the rotor swept
disc. Stage 2 predicts the proportion of these birds that will be hit by a rotor blade.
Combining both stages produces an estimate of collision fatality in the absence of any
avoiding action. The primary problem with the Band CRM is that fundamentally it does
not assume that birds will avoid collision with turbine blades (Chamberlain et al. 2006,
Madders & Whitfield 2006, Band et al. 2007). In practice the avoidance rate appears to
be very high but suffers from a shortage of empirical demonstration (Chamberlain et al.
2006, Madders & Whitfield 2006).
Consequently, attention on the Band CRM has focussed on deriving measures of
avoidance rates, which can be calculated, for some species, from a few existing post-
operational wind farm studies (Whitfield & Madders 2006a, Fernley et al. 2007). While
this ignores other challenges to the model, such as its potentially flawed assumption that
risk of collision is positively related to the activity of birds in the vicinity of activity turbines
(Whitfield & Madders 2006a, Fernley et al. 2007, de Lucas et al. 2008) the question of
avoidance rate estimation appears to require the most immediate answer. Originally, in
the absence of any empirical data, Band et al. (2007) suggested an avoidance rate of 95

4
%, but increasingly this is being shown to be overly conservative (Whitfield & Madders
2006a, Fernley et al. 2007, Whitfield 2007).
With currently available data at operational wind farms, one method for estimating
avoidance rate is the difference between predicted fatality and observed fatality
(avoidance rate = 1 – (observed deaths/predicted deaths assuming no avoidance)
(Madders & Whitfield 2006, Whitfield et al. 2006a, Fernley et al. 2007). Care must be
taken in deriving estimates of both observed and predicted deaths, because both are
prone to bias (Gauthreaux 1995, Chamberlain et al. 2006, Madders & Whitfield 2006,
Smallwood 2007) and these biases can consequently affect estimates of avoidance
rates.
The objective of the present study was to derive estimates of avoidance rates in golden
eagles Aquila chrysaetos under the ‘Band’ CRM (Band et al. 2007) from available data
presented by studies of operational wind farms in USA, and thereby to provide a
recommendation for an appropriate avoidance rate to be used for golden eagles in the
Band CRM, based on the best available evidence. A recent report by Fernley (2008) has
also estimated avoidance rates for golden eagles, and so the results of the present study
are also contrasted with those of Fernley (2008) in Annex 1.
2. METHODS
2.1 Collision modelling: approach and required parameters
Derivation of an avoidance rate estimate essentially followed the same method as
described by Band et al. (2007) in deriving an estimate of predicted collision rate, with
one exception. Instead of using an assumed avoidance rate to correct a predicted ‘no
avoidance’ fatality estimate, as in Band et al. (2007), an observed fatality estimate after
avoidance (i.e. as calculated from studies at operational wind farms) was used to derive
the avoidance rate which was necessary as a correction of the ‘no avoidance’ fatality
estimate resulting from Stages 1 and 2 of the calculations. In other words:
Avoidance rate = (1 – a), where

5
a = N observed collisions (with avoidance) / N predicted collisions (no avoidance)
While there are alternative methods for deriving N predicted collisions (no avoidance)
(Fernley et al. 2007), the present study followed the process described by Band et al.
(2007) for clarity and ease for the reader to follow the steps in calculations (see also
Whitfield & Madders 2006a). Under Stage 1 of this process, the rate of transits through
the rotors is calculated, and under Stage 2 the proportion of these transits which result in
collision is calculated. Combining the two stages gives N predicted collisions (no
avoidance). The parameters required under Stage 1 are shown in Table 1. The following
section describes how values for these parameters and for N observed collisions (with
avoidance) were calculated for the wind farms in the study.
2.2 Study sites and source data
Estimation of avoidance rates initially considered data from five wind farms: Altamont
Pass (e.g. Thelander et al. 2003, Smallwood & Thelander 2004), Tehachapi Pass
(Anderson et al. 2004, Erickson et al. 2002), San Gorgonio (Anderson et al. 2005,
Erickson et al. 2002), Foote Creek Rim (Johnson et al. 2000a, Erickson et al. 2002,
Young et al. 2003a, b) and Buffalo Ridge (Johnson et al. 2000b). Buffalo Ridge data
(Johnson et al. 2000b) have not been included in the present analyses because the level
of golden eagle activity here was low and the number of turbines searched was relatively
low, even though frequent searches were conducted over four years (and the majority of
turbine vicinities were searched for an additional 19 months: Osborn et al. 2000). This
may have predisposed analysis to produce an estimated 100 % avoidance rate and,
indeed, no eagle carcasses were found during more than five and half years of searches
(Johnson et al. 2000b, Osborn et al. 2000). This result has dubious utility, therefore, but
it is worth bearing in mind.
Altamont Pass Wind Resource Area (WRA)
Altamont WRA is the largest terrestrial wind farm in the world and was one of the first to
be constructed, involving a mixture of 5400 types of ‘operational’ turbines in 1998
(Smallwood & Thelander 2008) declining to 4489 by 2005 (Altamont Pass Avian
Monitoring Team 2008), sited in the rolling grasslands of central California. Thanks

6
largely to its notoriety through the number of birds it kills it has been the subject of
numerous research efforts, some of the most recent being presented by, for example,
Thelander et al. (2003) and Smallwood & Thelander (2004, 2008). Smallwood &
Thelander (2004: Table 1-1) document the numerous different turbine models in
operation at the time of their work and taking these values, not weighted according to
frequency, gives a ‘typical’ three-bladed turbine of 21.9 m rotor diameter, 25.5 m hub
(nacelle) height and rotation period of 1 s.
To calculate the amount of time that eagles spent at risk of collision, the results from 30
min observation periods, provided by Smallwood & Thelander (2004) for 300 m radius
observation areas, were employed as an initial step: 120.6 h of observation (Smallwood
& Thelander 2004: section 8.3.1) which recorded 35 min of eagle flight (Smallwood &
Thelander 2004: Table 8-3). In collision modelling it is necessary to estimate the
proportion of flights at rotor swept height (RSH) (Table 1). Smallwood & Thelander
(2004: Fig. 8-13) present data on golden eagle flight heights and note that 56 % of flights
occurred at the RSHs of turbines at Altamont, but this value refers to the full range of
turbine types. For the ‘typical’ turbine, the value is approximately 36 %.
Due to the turbines being ‘old’ models they were inoperative for a relatively large
proportion of the time (Smallwood & Thelander 2004: Table 1-1). Inoperative turbine
blades are highly unlikely to kill a golden eagle through collision, and so this needs to be
factored in to collision modelling. Two estimates of the proportion of time that turbines
were operative can be derived from Smallwood et al. (2003). The first, based on monthly
rates of operation gave 0.49. The second, based on wind-related operation and average
wind speed at the site (Smallwood & Thelander 2004), gave 0.58. It was assumed,
therefore that turbines were operative for 0.55 of the time. It was also assumed that this
also accounted for times when golden eagles may be inactive due to diurnal and
weather-related effects.
According to Smallwood & Thelander (2008), golden eagle mortality across the Altamont
WRA during their studies, accounting for several potential biases (but not all), was 67
per annum (80 % CL = 25 – 109). This analysis attempted to address criticisms of
Smallwood & Thelander‘s (2004) estimates (e.g. Weisskopf 2005).

7
Tehachapi Pass WRA
Tehachapi Pass WRA in southern California consisted of about 3300 turbines in 1998,
being similar to Altamont and San Gorgonio WRAs in comprising a mixture of several
different turbine models of ‘early’ design. The ‘typical’ three-blade turbine had a rotor
diameter of 19.2 m and a hub (nacelle) height of 24.7 m (weighted means from
Anderson et al. 2004: Table 2). Studies at the site are described by Anderson et al.
(2004) and Erickson et al. (2002).
Carcass searches and bird utilisation surveys were conducted at 201 plots sampling 637
turbines over 1.5 y 1996 – 1998 (Anderson et al. 2004) and an additional 1.5 y starting in
1995 (Erickson et al. 2002) i.e. 3 y in total. Bird use surveys were two consecutive 5 min
‘circular point counts’ (Reynolds et al. 1980) observation surveys recording birds to a
radius of 200 m, for a total of 276.5 h. Golden eagle activity at Tehachapi Pass was
relatively low (Anderson et al. 2004); typically slightly lower than Buffalo Ridge (Erickson
et al. 2002: Table 11) with three seen. To derive an estimate of the amount of time that
eagles were seen in flight it was assumed, with an average flight speed of 15 m/s
(Provan & Whitfield 2007) and a 400 m diameter survey plot that each observation of an
eagle lasted 400*(Pi/4) / 15 = 20.94 s (Fernley et al. 2006). With three sightings, there
was thus an estimated total of 1.05 min of eagle flights observed.
Anderson et al. (2004: Table 9) only present data on the flight heights for all raptors, with
40.4 % in the band 10 – 35 m (typical RSH = 15 – 34 m). Reference to Altamont data
(Smallwood & Thelander 2004) where raptor flight heights were presented by species
and, after attempting to account for the different raptor communities between sites, gave
an estimate of approximately 33 % of flights at RSH for golden eagles at Tehachapi. As
the turbines at Tehachapi are similar in type and age to those at Altamont, it was
assumed that they were operative for 55 % of the time, as described in the previous
section.
Carcass searches were three months apart. Anderson et al. (2004) do not note any finds
of dead golden eagles during 1.5 y in their report (Appendix B) but amongst several
unidentified remains a ‘large raptor-sized sternum’ was noted. Erickson et al. (2002),
however, document (P. 25) that one golden eagle fatality was found in 3 y. The longer

8
study period (Erickson et al. 2002) should be preferred because collisions are typically
rare events and a longer study period therefore gives a better estimation of rates
(Smallwood & Thelander 2004). This gives 0.33 dead eagles per year before any
adjustments for carcass detection biases.
Trials to assess the rate of carcass removal (e.g. by scavengers) and the efficiency of
observers to detect carcasses used chickens to represent ‘large birds’ (such as eagles).
These established that removal of carcasses by scavengers was relatively quick, with 96
% disappearing within 8 d and the mean time to removal being less than 3 d (Anderson
et al. 2004). Observers detected 81 – 84 % of ‘large’ carcasses (Anderson et al. 2004).
Smallwood (2007) has suggested, at least for sites dominated by grassland, that
searchers may be less able to find surrogate species, such as chickens as used in the
Tehachapi trials, than native species. Counteracting this bias, however, is that, as
Smallwood (2007) also points out, when observers know that they are being tested for
their efficiency (as at Tehachapi) then they are liable to find more birds than during
searches for collision victims because their effort increases. Brush land (more difficult to
search than grassland) also occurs at the botanically diverse and complex Tehachapi
Pass WRA (Anderson et al. 2004). In view of these conflicting tendencies the observer
search efficiencies were taken at face value, i.e. as recorded.
The disparity between inter-search interval and carcass persistence meant that methods
for calculating the number of collision victims, correcting for search biases, were not
employed (Anderson et al. 2004). Smallwood (2007) gives an equation (1) which allows
estimation of ‘adjusted’ fatality rates by allowing for the inter-search interval, searcher
efficiency and the mean time for carcass removal. Taking into account the Tehachapi
results of the scavenging and searcher bias trials by using equation (1) of Smallwood
(2007) gives an estimated 4.25 eagles killed per annum at the sampled turbines. The
problem with this estimate is that Smallwood (2007) has shown that the carcasses used
in the Tehachapi trials, chickens, are scavenged far more rapidly than the native species
for which they are supposed to be surrogates. Using Smallwood’s (2007) Appendix for
predicted disappearance rate of large raptors with the search interval at Tehachapi (88
% after 90 d) and applying this to equation (2) which Smallwood (2007) also presents,
gives an estimated 0.46 eagles killed per annum.
9
Unfortunately this estimate too may not be problem-free, for two reasons. First, the rate
of disappearance of chicken carcasses in Tehachapi trials appeared to be particularly
rapid which may suggest that results on the persistence of large raptor corpses
elsewhere are too conservative relative to Tehachapi (e.g. scavenging rates per se at
Tehachapi may be relatively high due to the community of scavengers). Secondly, the
data used by Smallwood (2007) to derive predictions of persistence of large raptor
corpses is necessarily constrained by sample size of sites. The predictive curve for large
raptor corpse persistence (Smallwood 2007: Fig. 3) clearly has large (non-plotted)
residuals implying a low degree of confidence: there is also uncertainty in whether the
data used by Smallwood (2007) to derive this predictive curve are independent-by-site.
Taking these two points into consideration may imply that, at Tehachapi, large raptor
corpses would not remain for as long as suggested by Smallwood’s (2007) laudable
attempts to construct a way forward through all the possible biases connected with
collision fatality estimation. Consequently, a further mortality estimate for Tehachapi
assumed that 0.67 eagles died per annum i.e. twice that of the unadjusted estimate but
considerably lower than the rate given by Smallwood’s (2007) equation (1). This value
represented a reasonable compromise to resolve the problems with other mortality
estimates, although there is still a degree of uncertainty.
San Gorgonio WRA
San Gorgonio WRA in southern California is a large wind farm (c. 3000 operating
turbines in 1998) constructed in the early 1980s containing a mixture of ‘old’ turbine
models, similar to Tehachapi and Altamont WRAs. The vegetation is a mixture of brush
land and semi-desert, resembling Tehachapi more than the rolling grassland of
Altamont, although it does include areas of standing water which are not found at the
other two large Californian WRAs (Anderson et al. 2005). The ‘typical’ three-blade
turbine had a rotor diameter of 17.6 m and a hub (nacelle) height of 25.5 m (weighted
means from Anderson et al. 2005: Table 2). Studies were conducted over 26 months in
two periods between March 1997 and August 2000 (Anderson et al. 2005).
Carcass searches and bird utilisation surveys sampled 423 turbines using the same
methods as employed at Tehachapi. A total of 27,675 min of observation recorded 14
golden eagles within 200 m radius observation points. As for Tehachapi, it was

10
necessary to derive an estimate of the amount of time that eagles were seen in flight. By
the same method as used for Tehachapi, this gave an estimated 4.89 min of eagle flight
observed. Anderson et al. (2005: Table 9) only present flight heights in height bands for
all raptors, and so the same method as used for Tehachapi was employed to estimate
that approximately 33 % of golden eagle flights were at ‘typical’ RSH. As the turbines
San Gorgonio are similar in type and age to those at Altamont, it was assumed that they
were operative for 55 % of the time, as described in the section for Altamont.
The study recorded one golden eagle killed by collision giving an unadjusted mortality
rate of 0.46 per annum at 423 turbines. Detection of chicken carcasses by observers
was 55 – 84 %, dependent on habitat, with a mean 71 % detectability (Anderson et al.
2005). For the reasons described under the Tehachapi section, this estimate was taken
at face value. Chicken carcasses disappeared rapidly in the scavenger trials, with 90 %
removed by day 8 and mean time to removal of 3.92 d.
As for Tehachapi, several ‘adjusted’ mortality estimates can be derived from the San
Gorgonio data, using the same arguments. Using equations (1) and (2) of Smallwood
(2007) gave 14.88 and 0.74 dead eagles per annum, respectively; assuming the study of
Anderson et al. (2005) only found half the eagles which were killed (i.e. two were killed,
not one) gave 0.92 casualties per annum.
Foote Creek Rim
Foote Creek Rim wind farm consists of 133 turbines built in phases between 1997 and
2000 on a grassland plateau in Carbon County, Wyoming. The avian studies were
conducted over several years, as new phases became operational, but included 105
turbines, primarily three-bladed Mitsubishi 600 types which have a rotor diameter of 42
m and a hub height of 40 m (Johnson et al. 2000a, Erickson et al. 2002, Young et al.
2003a, b).
Bird utilisation observations at Foote Creek Rim were based on 800 m radius circular
point counts at six locations conducted for 40 min twice per day every 1 – 2 weeks over
more than 3.5 y, during which all raptors were recorded. Instant sampling was also
conducted at the beginning of each observation session and at 10 min intervals

11
thereafter when all raptors visible were recorded (Johnson et al. 2000a). This allowed
estimation of the proportion of time when golden eagles were seen (Johnson et al.
2000a: Appendix E; 0.053) which was corrected by the proportion of observations that
involved flying birds (Johnson et al. 2000a: Appendix H; 0.927).
Johnson et al. (2000a: Tables 11 & 12) divided their observations by three features of
the wind farm and its environs: off rim, rim edge and rim. Golden eagle activity was less
off rim, which was a basis for the study’s recommendation that turbines should also be
located off rim (Johnson et al. 2000a). It was therefore appropriate to estimate eagle
activity at RSH in the area where there was a risk of collision i.e. where the turbines
were placed, off rim. This was achieved using data presented by Johnson et al. (2000a:
Tables 11 & 12) to derive correction factors for the proportions of observation plots,
eagle activity and flights at RSH which were off rim. These corrections were 0.62, 0.49
and 0.32 respectively. To account for turbine shutdown and maintenance and that
eagles do not fly in all conditions it was assumed that eagles were only at risk of collision
for 10 of the 12 h of daylight available on average per day per annum.
Carcass search protocols involved at least one search per 28 d at 69 turbines over two
years and at half these turbines for a further year (Young et al. 2003a). An additional 36
turbines were searched every 28 d for a year (Young et al. 2003b). One golden eagle
was found dead (Young et al. 2003b) giving the estimate of one casualty per 200
turbines per year (Erickson et al. 2002). For the main 69 turbines studied this produced
0.345 deaths per year as an unadjusted estimate.
Adult female mallards Anas platyrhynchos were used in searcher efficiency trials to
represent large bird casualties such as eagles, and 92 % were detected. Mallards were
also used in scavenger trials and the mean duration of stay was 29 d, with 57 %
remaining after 28 d (Young et al. 2003a, b). Application of Smallwood’s (2007) equation
(1) gives an adjusted mortality estimate of 0.567 deaths per annum at 69 turbines. Given
the problem in using some surrogate species in scavenger trials, Smallwood’s (2007)
equation (2) and Appendix (large raptors, 28 d search interval) was also used to derive a
second adjusted mortality estimate of 0.403 deaths per annum at 69 turbines.
2.3 Collision modelling: estimation of avoidance rates

12
The steps in estimating N predicted collisions without avoidance (Stage 1 of Band et al.
2007) and the parameter values for the four wind farms included in analysis are shown
in Table 1. The values used in estimation of Stage 2 (the probability of collision for every
transit through rotors) were derived according to Band et al. (2007) with turbine metrics
taken from each wind farm’s ‘typical’ turbine, from manufacturer’s websites or from the
assumption that rotation period ≈ 0.1*radius (Fernley et al. 2007). The recommendation
of Provan & Whitfield (2007) on golden eagle biometrics was not followed because the
present study involved the smaller canadensis subspecies (Watson 1997): body length
and wingspan were taken as 0.77 m and 2.0 m respectively. A flight speed of 15 m/s
was assumed (Provan & Whitfield 2007) and that flight was ‘gliding’. Estimated collision
probabilities for a transit through rotor blades are shown in Table 1.
Combining Stages 1 and 2 gave N predicted collisions (without avoidance). Values used
for N observed collisions (with avoidance) were as described under the section ‘Study
sites and source data’.
3. RESULTS
An example of the calculations and output, for mean mortality rate at Altamont
(Smallwood & Thelander 2008), is shown in Fig. 1. The estimated avoidance rates for
both Tehachapi and San Gorgonio when using equation (1) of Smallwood (2007), and
which also used scavenging rates from trials using chickens (Anderson et al. 2004,
2005), were very low, at 74.35 % and 83.25 % respectively (Table 2). Chicken carcasses
appear to be scavenged far quicker than any other ‘native’ species and so their use will
artificially inflate estimated collision mortality (Smallwood 2007) and, hence, lower
estimated avoidance rates. As chicken carcasses are clearly not a representative
surrogate for large raptors such as golden eagles (Smallwood 2007), and the search
interval was long at Tehachapi and San Gorgonio, these estimates of avoidance rates
should probably be ignored.
More realistic estimates for avoidance rates under the Band et al. (2007) collision risk
model varied between 98.64 % and 99.89 %, depending on site and the value of N

13
observed collisions (with avoidance) (Table 2). Combining values across the four wind
farms for estimates of N predicted collisions (without avoidance) (Table 1) and for all
‘worst case’ (i.e. lowest values) N observed collisions (after avoidance) gave 16,536 and
111, respectively. This produced an estimated ‘lowest’ avoidance rate, weighted
according to the scale of study of the respective wind farms, of 99.33 %. The mean
unweighted ‘worst case’ (lowest) avoidance rate for the four wind farms was 99.19 %.
4. DISCUSSION
The present study suggests that a 99.0% collision avoidance rate for the golden eagle is
a precautionary estimate, under the CRM of Band et al. (2007). This rate is not
transferable to other CRMs, as noted by Madders & Whitfield (2006), since other CRMs
may involve different assumptions, but the calculations in Table 1 should allow
appropriate rates to be estimated. This rate is similar to that of several other raptor
species (Whitfield & Madders 2006a, b) but lower than estimates for geese (Fernley et
al. 2007) and waders (shorebirds) (Whitfield 2007). This finding is consistent with the
observation made by several authors that raptors appear to be more vulnerable to
collision with rotating turbine blades than many other bird groups (e.g. Erickson et al.
2002, Young et al. 2003b). Although the small number of study sites should temper
conclusions, what is perhaps more surprising is that the estimated avoidance rate for
Altamont Pass WRA, a site notorious for the rate at which it kills golden eagles, was not
the lowest.
Some precaution should probably be exercised when using the estimated avoidance
rate in predictive studies or EIAs because of the form of data on raptor use collected at
USA sites and their relevance to the type of data collected during an assessment of a
proposed wind farm site (i.e. during the typical application of the CRM when avoidance
rates are usually required in practice). During the assessment process information is
gathered on the level of flight activity in a proposed wind farm site (Stage 1: Band et al.
2007) and after application of a collision probability (Stage 2) and an ‘avoidance rate’, a
predicted mortality rate for the proposed scheme results (Band et al. 2007). While
termed an ‘avoidance rate’, however, in this context it is probably more properly
considered as a correction factor which should incorporate avoidance and any
displacement, according to the definition of these terms by Band et al. (2007). Band et

14
al. (2007) note the distinction between ‘displacement’ and ‘avoidance’, the former being
a reduction in flight activity within a wind farm as a result of bird(s) staying away from the
environs of the turbines, and the latter being the evasion of the rotor swept area of the
wind farm’s constituent turbines. Although termed differently, the processes are similar,
not entirely mutually exclusive, and differ mainly by spatial scale: displacement is
avoidance at a higher spatial scale than ‘true’ avoidance, but both involve the alteration
of flight path relative to wind turbines. The USA studies, by taking observations of flight
activity at operational wind farms close to turbines, provide measures closer to true
avoidance (since any displacement effect, however slight, has already occurred and so
is not incorporated). Thus the ‘avoidance’ rates derived from such observations may be
too high when applied to a situation (as in a wind farm assessment, when no turbines
are present) when both displacement and avoidance may result. Although there was no
evidence of displacement at Foote Creek Rim (Johnson et al. 2000a) it was not studied
at the Californian WRAs.
There are other caveats which should be borne in mind when using the estimated
avoidance rate in predictive studies or EIAs. Several involve the nature of the sites from
which the estimate has originated. First, the turbines in the study sites are different from
the majority of types used in contemporary construction. While there is little evidence
from the limited existing research of turbine type per se affecting collision rates
(Smallwood & Thelander 2004, de Lucas et al. 2008) this research did not include large
modern types which differ by scale (hub height, rotor blade length, rotation speed) and in
spacing. Blade tip speed is greater in large turbines, but birds still, at least theoretically,
have more time to pass safely through the rotor swept volume, even at the outer limit of
the rotor swept area. On the other hand, larger turbines probably generate greater
turbulence and this may mean birds may be less able to fly away successfully from a
blade. Larger turbines are further apart. This could mean that birds have more space
and more capacity for surviving slight errors in flight direction, but it might increase risk
because there is a reduced ‘wind wall’ effect and so birds try to fly between larger
turbines more often, rather than just avoid a string of several turbines.
A second consideration is an effect of weather, in that the climate of California and
Wyoming is different to, say, Scotland. Weather, notably wind speed, can influence
collision risk and low wind speed may be more problematic than high wind speed
15
(Barrios & Rodriguez 2004, de Lucas et al. 2008) because birds are less able to use
wind energy in evading blades. Topographic features which generate high wind energy
may be especially attractive to raptors (McLeod et al. 2002), and so turbines placed on
such features may be especially prone to kill birds (Hoover & Morrison 2005, de Lucas et
al. unpubl. data). Strikes may not be influenced too much by poor visibility. Despite
research on ‘motion smear’ and painting blades to make them more obvious, there is
little empirical support that blade visibility is influential (e.g. Young et al. 2003b).
Observations of collisions in southern Spain suggest birds are aware of rotor blades
when they collide and are usually hit at the outer limits of the rotors (L. Barrios pers.
comm.) and they do not appear to die more often during conditions of poor visibility
(Barrios & Rodríguez 2004). There are several studies indicating that during fog birds
take flight actions which compensate for the reduced visibility (e.g. don’t fly or fly close to
the ground: Moyle & Heppner 1998, Richardson 2000, Piersma et al. 2002), so in foggy
conditions birds may actually be at less risk of collision.
Predicting the rates at which birds collide with rotating wind turbine blades is difficult
because there is uncertainty in many of the parameter values which are required to
produce robust calculations, and empirical measures of collision rates are rare both by
study-number and by frequency within-study (Whitfield & Coupar 2008), making
objective support for predictive models difficult. Avoidance of collision has been stressed
as a major influence on uncertainty in the predictions of CRMs (Chamberlain et al. 2006,
Madders & Whitfield 2006, Whitfield et al. 2006a, b, Band et al. 2007, Fernley et al.
2007). The absence of robust avoidance estimates for CRMs generates acute
uncertainty in the value of CRMs which attempt to predict estimates of collision mortality,
especially when other deficiencies may be pertinent to CRM assumptions (Madders &
Whitfield 2006, Smallwood 2006, de Lucas et al. 2008). The absence of robust
avoidance rate estimates has led to a call for the abandonment of CRMs until avoidance
rates can be calculated (Chamberlain et al. 2006). Avoidance rates have now been
estimated for several species and it is apparent that typically they are extremely high
with evidence coming not only from quantitative attempts to estimate rates (Whitfield &
Madders 2006a, b, Fernley et al. 2007, Whitfield 2007, present study) but from other
observations (Desholm & Kahlert 2005, Everaert & Steinen 2007). These studies show
that Band et al.’s (2007) original proposal of 95 % as a generic avoidance rate, made in
the absence of any empirical measures, is too low.

16
The difficulty in deriving reliable mortality estimates for collision victims has been
stressed as an obstacle to deriving reliable avoidance rates (Chamberlain et al. 2005,
2006). There are several potential biases in typical methods used to search for collision
victims around turbines (Gauthreaux 1995) but one which has remained resistant to
study to-date is crippling bias, in which mortality is underestimated because some birds
which are fatally injured by turbine blades may die away from areas searched for
casualties (Gauthreaux 1995, Smallwood 2007). In the past, studies monitoring avian
collision casualties seldom attempted to correct for the other main biases in search
protocols, searcher efficiency and removal of carcasses (e.g. by scavengers), but more
recently attempts have been made (Whitfield & Coupar 2008). If these biases are not
accounted for, then mortality can be underestimated (and avoidance rates inflated).
Smallwood (2007) has highlighted complexity in the issue of carcass search biases, and
noted that trials to estimate raptor carcass removal rates, through choice of surrogate
species, may bias mortality estimates low or, high (despite the objectives of such trials).
Tests of scavenger removal rates may also use so many carcasses (often many more
than apparently resulting from collision) that scavengers are ‘swamped’ (Smallwood
2007) or attracted to the wind farm area (Madders & Whitfield 2006). There are also
often several problems with searcher efficiency trials and perhaps the most severe of
these is when trials are conducted with the searchers’ knowledge that they are being
tested. The present study tried to account for these difficulties in search protocols, but as
Smallwood (2007) recommends, far more research is needed on search biases using
carcasses of the species which are at risk of collision and with more attention on
searcher efficiency trials simulating ‘field conditions’.
Whitfield & Coupar (2008) note that that another difficulty in gathering ‘reliable’ collision
mortality data is that they can require many birds to be killed over, potentially, many
years – features that EIAs should be trying to prevent. Hence, results will often involve
‘unreliable’ data and/or more ‘reliable’ data but from a small number of sites where the
assessment process has failed, raising the further difficulty of their representativeness. There is high spatial variation in collision mortality and high temporal variation because
collisions are fundamentally rare events (e.g. Smallwood & Thelander 2004). This
potentially generates wide margins of ‘error’ in mortality estimates and is an intrinsic
feature of collision mortality. Even at the best-studied wind farm, Altamont, confidence

17
limits around the mean mortality estimates of raptors were wide (Smallwood & Thelander
2008), although for golden eagles the mean estimate derived from carcass searches
was similar to that derived from radio tracking (Hunt 2002)
Attention on the problems facing research on wind farm effects on birds, and predicting
such effects, has tended to surround deriving reliable mortality estimates, although
observational influences on deriving reliable measures of bird use may be just as
problematic (Madders & Whitfield 2006, Smallwood 2006). Potential biases may be
introduced by observer skills or unrealistic assumptions that an observer can record at
360o during circular point counts, especially if distracted by the need to document any
birds seen (Madders & Whitfield 2006), and decrease in detectability with distance from
observer in several species (Madders & Whitfield 2006, Smallwood 2006) or increase in
detectability in other species (Madders & Whitfield 2006). Resolving these difficulties
should receive as much attention as those surrounding mortality estimates if predicting
wind farm effects is to be improved.
Given the many sources of potential variation in the parameters used by the present
study, its approach of (in most cases) employing mean estimates can be criticised
statistically because it effectively ignores, while implicitly compounding, several sources
of variation. An alternative approach, that is more valid statistically (and so potentially
‘better’), would have been to perform Monte Carlo simulations incorporating variance in
parameter estimates and hence giving confidence limits (CLs: e.g. 95 % CLs) to the
avoidance rate estimate. Undoubtedly, this approach would have generated extremely
wide 95 % CLs in the avoidance estimate, with the upper at 100 % avoidance and the
lower substantially less than 99 % avoidance. It would also have given a false sense of
‘confidence’ in the results because, as noted above, many sources of error (as described
in the preceding paragraph) cannot be accounted for by any method because the
relevant data rarely exist.
Altman & Royston (2000) have pointed out that the objective of modelling is to produce a
model that works satisfactorily in a situation (e.g. at another site) not involving the data
from which it was derived, and that a model may be statistically valid but not valuable
because it may not be ‘clinically’ valid. How valuable or ‘clinically’ valid would a model
derived by the more statistically valid approach be in the present case? Even if we took

18
such a model for a site where it was derived, the CLs would produce results that would
be patently wrong (not ‘true’). Under a 100 % avoidance rate (the likely upper CL) no
birds should die, but we know that birds did die, and avoidance rates of, for example, 95
% or 96 % would predict numbers of deaths substantially (likely, inconceivably) higher
than those observed (even with the apparent uncertainty in some parameter estimates).
So the ‘true’ value would probably not have a 95 % chance of lying between the values
the statistical model was indicating. Application to other sites would encompass the
estimates of observed deaths, because the CLs would be so wide, but this could not be
described as satisfactory, so this modelling method, or at least the derivation of CLs, is
arguably not valuable.
The modelling approach adopted by the present study has probably produced a more
satisfactory output, in that an avoidance rate estimate derived at one site, when applied
to other sites encompassed by the study, would predict mortality estimates that would
not be radically different to observed. An approximation of the likely compounded error
can be gleaned by simply examining the effect of varying the avoidance estimate on the
mortality estimate (which is free of ‘compound’ errors). Nevertheless, we should expect
that avoidance rates will differ between sites (since they demonstrably vary within sites).
Finally, it should be borne in mind that CRMs are crude and should not be ‘over-
interpreted’ (Madders & Whitfield 2006, Band et al. 2007). This is not only because of
the difficulties surrounding avoidance rates and the metrics necessary for their
derivation, but also because the fundamental assumption of CRMs, that collision
mortality increases with flight activity, is not necessarily borne out by empirical data
(Whitfield & Madders 2006a, Fernley et al. 2007, de Lucas et al. 2008). At a crude level
the logic of this assumption is difficult to fault in that, all else being equal, a wind farm
with very high bird activity seems bound to lead to more collisions than a wind farm with
very low bird activity. This logic seems not to hold, however, at the levels of bird activity
documented by most post-construction studies. This may be because at least to date,
whether by design or accident, construction of wind farms in areas of high bird activity is
exceptional (or research and/or publication of monitoring studies at these sites are
exceptional) (Whitfield & Coupar 2008) and restricted to ‘problem sites’ such as Altamont
Pass and Smøla in Norway (BirdLife International 2006). Of course, construction of wind
farms in areas where bird mortality could be severe should be avoided, and CRMs can

19
assist in this process. But focussing on CRMs and their predictions tends to ignore
research showing that influences on mortality other than activity levels per se may be
equally important (Smallwood & Thelander 2004, Hoover & Morrison 2005, Whitfield &
Madders 2006a, de Lucas et al. 2008) and this may lead to errors in predicting effects of
wind farms and, hence, planning their locations.
Acknowledgements
Many thanks are due to Mike Madders for discussion on issues concerning wind farm
impacts, and to John Fernley for forwarding a copy of his 2008 report. Comments from
Malcolm Ogilvie and Bob Furness improved an earlier version of the report.
5. REFERENCES
Altamont Pass Avian Monitoring Team. 2008. Bird fatality study at Altamont Pass Wind
Resource Area October 2005 to September 2007. Report prepared for the
Alameda County Scientific Review Committee, Altamont Pass WRA. [Available
from www.altamontsrc.org]
Altman, D.G. & Royston, P. 2000. What do we mean by validating a prognostic model?
Statistics in Medicine 19, 453-473.
Anderson, R., Neumann, N., Tom, J., Erickson, W., Strickland, M., Bourassa, M., Bay, K.
& Sernka, K. 2004. Avian Monitoring and Risk Assessment at Tehachapi Pass
Wind Resource Area. National Renewable Energy Laboratory, Golden, Colorado.
[Available from www.nrel.gov]
Anderson, R., Tom, J., Neumann, N., Erickson, W., Strickland, M., Bourassa, M., Bay, K.
& Sernka, K. 2005. Avian Monitoring and Risk Assessment at San Gorgonio
Wind Resource Area. National Renewable Energy Laboratory, Golden, Colorado.
[Available from www.nrel.gov]
Band, W., Madders, M., & Whitfield, D.P. 2007. Developing field and analytical methods to
assess avian collision risk at wind farms. In: de Lucas, M., Janss, G.F.E. & Ferrer,

20
M. (eds.) Birds and Wind Farms: Risk Assessment and Mitigation, pp. 259-275.
Quercus, Madrid.
Barrios, L. & Rodríguez, A. 2004. Behavioural and environmental correlates of soaring-
bird mortality at on-shore wind turbines. Journal of Applied Ecology 41, 72-81.
BirdLife International. 2006. Wind farm on the Smøla archipelago (Norway). Update
report by the NGOs. Report from BirdLife International to the Standing
Committee of the Bern Convention, Strasbourg.
Chamberlain, D., Freeman, S., Rehfisch, M., Fox, T. & Desholm, M. 2005. Appraisal of
Scottish Natural Heritage’s Wind Farm Collision Risk Model and its Application.
BTO Research Report 401. British Trust for Ornithology, Thetford, Norfolk.
Chamberlain, D.E., Rehfisch, M.R., Fox, A.D., Desholm, M. & Anthony, S.J. 2006. The
effect of avoidance rates on bird mortality predictions made by wind turbine
collision risk models. Ibis 148 (Suppl. 1), 198-202.
de Lucas, M., Janss, G.F.E., Whitfield, D.P. & Ferrer, M. 2008. Collision fatality of
raptors in wind farms does not depend on raptor abundance. Journal of Applied
Ecology 45, 1695-1704.
Desholm, M. & Kahlert, J. 2005. Avian collision risk at an offshore wind farm. Biology
Letters doi:10.1098/rsbl.2005.0336
Erickson, W., Johnson, G., Young, D., Strickland, D., Good, R., Bourassa, M., Bay, K. &
Sernka, K. 2002. Synthesis and comparison of baseline avian and bat use, raptor
nesting and mortality information from proposed and existing wind developments.
Final report by WEST Inc. prepared for Bonneville Power Administration,
Portland, Oregon. WEST Inc., Cheyenne, Wyoming, USA. [Available from
www.west-inc.com/wind_reports.php]
Everaert, J. & Steinen, E.W.M. 2007. Impact of wind turbines on birds in Zeebrugge
(Belgium). Biodiversity & Conservation 16, 3345-3359.
Fernley, J. 2008. Birds, wind farms and collision modelling: a study of golden eagles.
Unpublished Report, West Coast Energy Developments Ltd, Mold.
Fernley, J., Lowther, S. & Whitfield, D.P. 2007. A Review of Goose Collisions at
Operating Wind Farms and Estimation of the Goose Avoidance Rate.

21
Unpublished Report, West Coast Energy Developments Ltd, Mold. [Available
from www.johnfernley.350.com]
Gauthreaux, S.A. 1995. Standardized assessment and monitoring protocols. In:
Proceedings of National Avian-Wind Power Planning Meeting, Denver, Colorado,
20-21 July 1994. Report DE95004090. RESOLVE Inc., Washington, DC, and
LGL, Ltd., King City, Ontario, pp. 53-59. [Available from
www.nationalwind.org/pubs]
Hoover, S.L. & Morrison, M.L. 2005. Behaviour of red-tailed hawks in a wind turbine
development. Journal of Wildlife Management 69, 150-159.
Hunt, W.G. 2002. Golden eagles in a perilous landscape: predicting the effects of
mitigation for wind turbine blade-strike mortality. Consultant report to California
Energy Commission under contract P500-02-043F, Public Interest Energy
Research. California Energy Commission, Sacramento, USA.
Johnson, G.D., Young, D.P., Erickson, W.P., Clayton E. Derby, C.E., M. Dale Strickland,
M.D. & Good, R.E. 2000a. Wildlife monitoring studies SeaWest windpower
project, Carbon County, Wyoming 1995-1999. Final report by WEST Inc.
prepared for SeaWest Energy Corporation, San Diego, California & Bureau of
Land Management, Rawlins District Office, Rawlins, Wyoming. [Available from
www.west-inc.com/wind_reports.php]
Johnson, G.D., Erickson, W.P., Strickland, M.D., Shepherd, M.F. & Shepherd, D.A.
2000b. Avian Monitoring Studies at the Buffalo Ridge Wind Resource Area,
Minnesota: Results of a 4-year study. Technical report by WEST Inc. prepared
for Northern States Power Co., Minneapolis, MN. [Available from www.west-
inc.com/wind_reports.php]
Langston, R.H.W. & Pullan, J.D. 2003. Windfarms and birds: an analysis of the effects of
windfarms on birds, and guidance on environmental assessment criteria and site
selection issues. Report by Birdlife International on behalf of the Bern
Convention. RSPB, Sandy.
McLeod, D.R.A., Whitfield, D.P., Fielding, A.H., Haworth, P.F. & McGrady, M.J. 2002.
Predicting home range use by golden eagles Aquila chrysaetos in western
Scotland. Avian Science 2, 183-198.

22
Madders M. & Whitfield D.P. 2006. Upland raptors and the assessment of wind farm
impacts. Ibis 148 (Suppl. 1), 43-56.
Moyle, R.G. & Heppner, F.H. 1998. Flight without horizon references in European
starlings. Auk 115, 771-774.
Osborn R.G., Higgins K.F., Usgaard R.E., Dieter C.D. & Neiger R.G. 2000. Bird mortality
associated with wind turbines at the Buffalo Ridge Wind Resource Area.
American Midland Naturalist 143, 41-52.
Percival, S.M. 2000. Birds and wind turbines in Britain. British Wildlife 12, 8-15.
Piersma, T., Spaans, B. & Dekinga, A. 2002. Are shorebirds sometimes forced to roost
on water in thick fog? Wader Study Group Bulletin 97, 42-44.
Provan, S. & Whitfield, D.P. 2007. Avian flight speeds and biometrics for use in collision
risk modelling. Report from Natural Research to Scottish Natural Heritage.
Natural Research Ltd, Banchory.
Reynolds, R.T., Scott, J.M. & Nussbaum, R.A. 1980. A variable circular‐plot method for
estimating bird numbers. Condor 82, 309–313.
Richardson, W.J. 2000. Bird migration and wind turbines: migration timing, flight
behavior, and collision risk. In: Proceedings of National Avian – Wind Power
Planning Meeting III, San Diego, California, May 1998, pp. 132-140. Prepared for
the Avian Subcommittee of the National Wind Coordinating Committee by LGL
Ltd., King City, Ontario.
Smallwood K.S. 2006. Biological effects of repowering a portion of the Altamont Pass
WRA: the Diablo Winds Energy Project. Report prepared for the Alameda County
Scientific Review Committee, Altamont Pass WRA. [Available from
www.altamontsrc.org]
Smallwood, K.S. 2007. Estimating wind turbine-caused bird mortality. Journal of Wildlife
Management 71, 2781-2791.
Smallwood, K.S. & Thelander, C.G. 2004. Developing methods to reduce bird mortality
in the Altamont Pass Wind Resource Area. Final Report by BioResource
Consultants to the California Energy Commission, Public Interest Energy
Research-Environmental Area, Contract No. 500-01-019. [Available from
www.energy.ca.gov/pier/final_project_reports/500-04-052.html]

23
Smallwood, K.S. & Thelander, C. 2008. Bird mortality in the Altamont Pass Wind
Resource Area, California. Journal of Wildlife Management 75, 215-223.
Smallwood, K.S., Thelander, C. & Spiegel, L. 2003. Raptor mortality at the Altamont
Pass Wind Resource Area. Presentation to NWCC, 17 November 2003,
Washington D.C. [Available from www.nationalwind.org/events/wildlife/2003-
2/presentations/Smallwood.pdf]
Thelander, C. G., Smallwood, K.S. & Rugge, L. 2003. Bird risk behaviors and fatalities at
the Altamont Pass Wind Resource Area. Period of Performance: March 1998 -
December 2000. National Renewable Energy Laboratory, Colorado. [Available
from www.nrel.gov/publications]
Watson, J. 1997. The Golden Eagle. Poyser, London.
Weisskopf, C.P. 2005. Numerical accuracy in the 2004 PIER report. Report from Pilz &
Co. LLC. [Available from www.altamontsrc.org]
West Inc. 2006. Diablo Winds wildlife monitoring progress report. Report prepared for
the Alameda County Scientific Review Committee, Altamont Pass WRA.
[Available from www.altamontsrc.org]
Whitfield, D.P. 2007. The effects of wind farms on shorebirds (waders: Charadrii),
especially with regard to wintering golden plovers. Report from Natural Research
to Your Energy. Natural Research Ltd, Banchory.
Whitfield, D.P. & Madders, M. 2006a. A review of the impacts of wind farms on hen
harriers Circus cyaneus and an estimation of collision avoidance rates. Natural
Research Information Note 1 (revised). Natural Research Ltd, Banchory.
Whitfield, D.P. & Madders, M. 2006b. Deriving collision avoidance rates for red kites
Milvus milvus. Natural Research Information Note 3. Natural Research Ltd,
Banchory.
Whitfield, D.P. & Coupar, A. 2008. Effects of terrestrial wind farms on birds and upland
habitats. In: Galbraith, C.A. & Baxter, J.M. (eds). Energy and the Natural
Heritage, pp. 205-220. The Stationery Office, Edinburgh.
Whitfield, D.P & Band, W. In preparation. Estimates of collision avoidance rates at
operational wind farms in the USA.

24
Young, D.P., Erickson, W.P., Good, R.E., Strickland, M.D. & Johnson, G.D. 2003a.
Avian and bat mortality associated with the initial phase of the Foote Creek Rim
windpower project, Carbon County, Wyoming. November 1998 – June 2002.
Final report by WEST Inc. prepared for Pacificorp Inc., Portland, Oregon &
SeaWest Windpower Inc., San Diego, California. [Available from www.west-
inc.com/wind_reports.php]
Young, D.P., Erickson, W.P., Strickland, M.D., Good, R.E. & Sernka, K.J. 2003b.
Comparison of avian responses to UV-light-reflective paint on wind turbines.
Subcontract report July 1999 – December 2000. National Renewable Energy
Laboratory, Colorado. [Available from www.nrel.gov/publications]

25
Table 1. Steps, parameters, and parameter values used in the calculation of Stage 1 output (number of transits through rotor blades)
and Stage 2 (collision probability) in the Band collision risk model (Band et al. 2007) to derive estimates of collision avoidance rates
for golden eagle. Plot area is the study area under observation at any one time (not the total area of the study site). All estimates of
values for each stage are not shown to improve readability, but estimates at key stages are illustrated as are the calculations (under
‘Units & calculations’) used to reach derivative steps. A = Altamont Pass WRA, T = Tehachapi Pass WRA, SG = San Gorgonio WRA,
FCR = Foote Creek Rim; see text for details of sites and methods to extract parameter values for each wind farm.
Wind farm Step Parameter Units & calculations
A T SG FCR
[1] Plot area ha 28.3 12.6 12.6 124.7
[2] Observation time min 7236 16590 27675
[3] Time bird spent in flight min 35 1.05 4.89
[4] Proportion of flights at rotor height 0.36 0.33 0.33 0.32
[5] Proportion of observation time bird flights were at rotor height ([3]/[2])*[4] 0.016a
[6] Probability of rotor height flights per ha [5]/[1]
[7] Flight risk areab ha 4241 500.3 332.2 54.2
[8] Proportion of time birds flew at rotor height within flight risk area [7]/[6]
[9] Potential bird occupancy in days per annum d 365 365 365 365
[10] Potential flight hours per dayc hr 6.6 6.6 6.6 10
[11] Potential total occupancy hr/y = [9]*[10]
[12] Bird occupancy at rotor swept heights in risk area per annum sec = ([11]*[6])*3600
[13] Flight risk volume m3 = ([7]*10000)*[15]
[14] Number of turbinesd 5400 637 423 69

26
[15] Rotor diameter m 21.9 19.2 17.6 42
[16] Rotor depth m 1 1 1 1.5
[17] Bird length m 0.77 0.77 0.77 0.77
[18] Volume swept by rotor blades ([16]+[17])*Pi([15]/2)2*[14]
[19] Bird occupancy of rotor swept volume [12]*([18]/[13])
[20] Flight speed m/sec 15 15 15 15
[21] Time taken for transit through rotors sec = ([16]+[17])/[20]
[22] Number of transits through rotors [19]/[21]
[23] BAND collision (From Stage 2 calculation) % of transits 21.6 23.6 25.2 11.7
[24] Collisions per annum (no avoidance) for N turbines in step [14] 16075 48.8 88.9 323.4
Notes: a Uses instant sampling of proportion of observations when eagles seen corrected by proportion of these observations when birds were flying,
rather than steps [2] and [3]. b Taken simply as the area given by a 50 m radius circle around each of the given number of turbines used as the basis for observed mortality
estimates (see step [14] and text). The area chosen here is inconsequential on calculations, provided the same value is used in the next step. c At this step (or the previous step – it does not matter where it is incorporated so far as later steps are concerned) the proportion of time during
which birds are at risk of collision needs to be accounted for. Two factors are pertinent here: the first is that turbines are not operational at all
times, due to wind speed effects or that turbines break down and require maintenance to restore operation; the second is that diurnal raptors
probably do not fly in all conditions for all daylight hours due to weather conditions and diurnal constraints. d It is important that the estimated mortality rate after avoidance refers to the same number of turbines as given here; the number used depends
on how source studies presented or derived mortality rates, either being the whole wind farm (e.g. Altamont) or the sample searched for carcasses
(e.g. Tehachapi).

27
Table 2. Estimated avoidance rates (%) for golden eagles according to wind farm and
the mortality estimate used in calculations (= N observed collisions after avoidance). A =
Altamont Pass WRA, T = Tehachapi Pass WRA, SG = San Gorgonio WRA, FCR =
Foote Creek Rim. Equation (1) of Smallwood (2007) was used, along with observed
results of scavenger trials, to produce mortality estimates ‘adjusted by observed
scavenger trials’. Equation (2) and the Appendix (large raptors) of Smallwood (2007)
was used to produce mortality estimates ‘adjusted by expected carcass persistence’,
assuming observed scavenger trials did not use representative species.
Mortality estimate Wind farm
A T SG FCR
Mean adjusted 99.58 - - -
Upper 80 % CL adjusted 99.32 - - -
Lower 80 % CL adjusted 99.84 - - -
Unadjusted for biases - 99.32 99.48 99.89
Adjusted by observed scavenger trials - 74.35 83.25 99.82
Adjusted by expected carcass persistence - 99.06 99.17 99.88
Adjusted by doubling observed rate - 98.64 98.96 -

28
Figure legends
Fig. 1. An example of the calculations in MS Excel used to derive an estimated
avoidance rate, for golden eagles at Altamont Pass WRA, using mean mortality rate
(Smallwood & Thelander 2008).
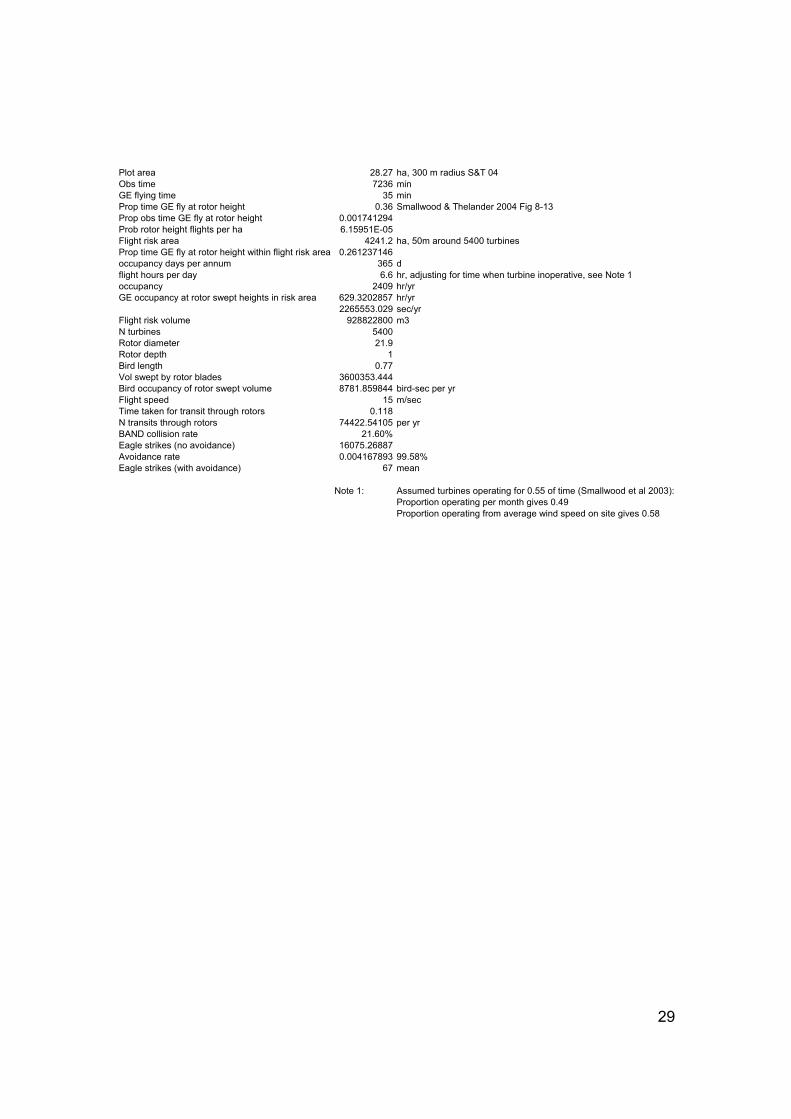
29
Plot area 28.27 ha, 300 m radius S&T 04Obs time 7236 minGE flying time 35 minProp time GE fly at rotor height 0.36 Smallwood & Thelander 2004 Fig 8-13Prop obs time GE fly at rotor height 0.001741294Prob rotor height flights per ha 6.15951E-05Flight risk area 4241.2 ha, 50m around 5400 turbinesProp time GE fly at rotor height within flight risk area 0.261237146occupancy days per annum 365 dflight hours per day 6.6 hr, adjusting for time when turbine inoperative, see Note 1occupancy 2409 hr/yrGE occupancy at rotor swept heights in risk area 629.3202857 hr/yr
2265553.029 sec/yrFlight risk volume 928822800 m3N turbines 5400Rotor diameter 21.9Rotor depth 1Bird length 0.77Vol swept by rotor blades 3600353.444Bird occupancy of rotor swept volume 8781.859844 bird-sec per yrFlight speed 15 m/secTime taken for transit through rotors 0.118N transits through rotors 74422.54105 per yrBAND collision rate 21.60%Eagle strikes (no avoidance) 16075.26887Avoidance rate 0.004167893 99.58%Eagle strikes (with avoidance) 67 mean
Note 1: Assumed turbines operating for 0.55 of time (Smallwood et al 2003):Proportion operating per month gives 0.49Proportion operating from average wind speed on site gives 0.58

30
Annex 1
Discussion of the differences in avoidance rates derived by the present study and those presented by Fernley (2008) Fernley (2008) estimated avoidance rates of 99.95 %, 100 %, 99.99 % and 100 % for
Altamont, Tehachapi, San Gorgonio and Foote Creek Rim, respectively. The results
from the present study produced lower estimates of avoidance rates than those
presented by Fernley (2008; hereafter termed F2008) even though there was substantial
overlap in the choice of wind farms in the studies. It is therefore worth discussing the
possible reasons for these differences.
Data from other sites
F2008 also included data from the site known as Diablo Winds (West Inc. 2006,
Smallwood 2006). These data were not used in the present analyses because this site
can not be considered as independent from Altamont Pass. The site is part of Altamont
Pass and has had old-style turbines replaced by a more modern type, but several wind
farms have a mixture of different types or different-dated operational phases and/or
sections and for none of these can the differences be considered as generating
independent data. Results for Diablo Winds, therefore, can not be considered as
independent.
The present study did not include data from Buffalo Ridge (Johnson et al. 2000b), for the
reasons given in the main text, although here the estimated avoidance rate was 100 %.
Buffalo Ridge data were also not included in the F2008 study, because (P. 4) “the level
of activity is so low that the corpse survey result, no Golden Eagle corpses were found,
has little significance”. As noted in the main text of the present report, it is the
combination of low eagle activity and the number of turbine-year searches which renders
results from Buffalo Ridge potentially dubious, not eagle activity level per se.
Interestingly, F2008 did not exclude Tehachapi Pass data from analysis, even though on
the activity level criterion (F2008, P.4; apparently why Buffalo Ridge was excluded) it
should perhaps have done so, given that golden eagle activity at the two sites is
comparatively and similarly low (Erickson et al. 2002, Table 11).

31
Records of eagle deaths
Some of the differences behind the study’s estimates are obvious, and one of these is
use of mortality estimates. For Tehachapi and Foote Creek Rim, F2008 assumed no
eagles had been killed, apparently not accounting for records of deaths at these two
sites documented by Erickson et al. (2002) and Young et al. (2003b). F2008 used a
mortality rate for Altamont representing a compromise between several available, but not
that given by Smallwood & Thelander (2008), used by the present study, which
attempted to account for previous estimates’ failings and has been published in a peer-
reviewed journal. The estimate used by F2008 was lower than that used by the present
study (which also included effects of uncertainty in the mean estimate). Lower mortality
estimates used by F2008 will increase the estimated avoidance rates.
Non-operation of turbines
Another obvious difference between studies is that F2008 assumed non-operation of
turbines and/or no eagle activity for 2 h of the day at all wind farms. The present study
made this assumption only for the ‘modern’ wind farm at Foote Creek Rim, but for the
‘old’ wind farms at the other three sites estimated that turbines did not operate for 5.4 h
of the day. This was based on detailed results presented for Altamont (see main text for
references) and the assumption that the similar turbines at the other Californian sites
would have a similar rate of non-operation. It is not obvious why F2008 did not make this
correction as F2008 refers to Table 1-1 of Smallwood & Thelander (2004) where it is
presented that turbines had relatively low rates of operation, although further exploration
of the considerable datasets presented by the Altamont studies is required to obtain the
most likely estimate of non-operation. When turbines at the Californian sites apparently
did not present a risk of collision for nearly half the time, if this is not accounted for then
it will elevate the estimated ability of birds to avoid collision.
Calculation of collision probability
Another difference which applied to all estimates was that F2008 used a simplified
approximation method to estimate the Stage 2 collision probability, whereas the present
32
study used the method as presented by Band et al. (2007). The calculation used by
F2008 tends to produce higher estimates of avoidance rates than that given by Band et
al. (2007). The present study used Band et al. (2007) because, the method used by
F2008 is an approximation and while more complicated and requiring more data on
turbine blade specifications than the F2008 method (Fernley et al. 2007), it is more
frequently used and has been independently audited (Chamberlain et al. 2005).
Number of turbines used in calculations
Other differences between studies appear to be restricted to specific steps in
calculations for particular sites. A potential error in the calculations of F2008 for San
Gorgonio is that they assumed that the unadjusted mortality rate (0.5 deaths per year)
applied to the whole wind farm (c. 3,000 turbines) but this mortality rate referred only to
the number of turbines which were searched for victims (423; Anderson et al. 2005).
While the single death recorded was an ‘incidental’ find, it was apparently found within
the search area. F2008’s application of the observed unadjusted mortality rate to a
larger number of turbines than was appropriate will elevate the avoidance rate estimate.
Eagle activity at Altamont
Another potential error in F2008 calculations involves Altamont and the estimate of eagle
activity. Unfortunately, despite considerable field efforts, the reporting of results of the
bird use surveys in Thelander et al. (2003) and Smallwood & Thelander (2004) suffers
from lack of clarity, and can be very confusing without efforts to discern how the records
were collected, how they have been reported, and how they can be used as metric
values for collision risk modelling and avoidance rate derivation. Thelander et al. (2003)
report that their observations were recorded to 300 m from observation points (i.e. 28.3
ha, P.13) but that their 20 study plots were 297.5 ha (P. 12 & Table 2) or, once records
were assigned to different distances (up to 300 m from turbines) were 139 ha (2780/20 =
139 ha: P. 17).
It is apparent from Smallwood (2006), however, that fundamentally the survey plot used
was a 300 m radius circle from the observer (circular point count: Reynolds et al. 1980),
since Smallwood (2006) criticises the use of larger distances and that this basic method

33
was used to generate species-specific exploitation functions and flight-time estimates
over a wider area, according to three distances from turbines (as reported, for example
by Thelander et al. 2003) across the 20 study plots (presumably 139 ha, rather than
297.5 ha, despite what is presented in Table 2 of Thelander et al. 2003). On the other
hand, this is difficult to reconcile with Thelander et al. (2003) stating that (P. 12): “within
each study plot, a location was selected from which behavioral observations took place.
The observation point was a fixed location used for all behavioral data collection…”. In
other words, Thelander et al. (2003) strongly infer that each of 20 study plots had a
single fixed observation point, but this is inconsistent with the description of each plot as
either 297.5 ha or 139 ha if each (single per plot) observation point was a 300 m radius
circle (28.3 ha).
It seems most likely, from material presented later than Thelander et al. (2003), that
there were actually several fixed observation points (300 m radius) per study plot (297.5
ha) and that these were used to generate survey areas (139 ha) around turbines
buffered up to 300 m (e.g. Smallwood & Thelander 2004, Fig. 8-2). Confusion over
which parameter values for golden eagle flight activity should be used in deriving
avoidance rate estimates is easy, nevertheless. Hence, in the present study, the
straightforward descriptions of results from 30 min observation periods, provided by
Smallwood & Thelander (2004) for 300 m radius observation areas, were employed:
120.6 h of observation (Smallwood & Thelander 2004: section 8.3.1) which recorded 35
min of eagle flight (Smallwood & Thelander 2004: Table 8-3).
F2008 seems to have applied the basic observation plot size (300 m radius), which is
correct, but then used the results presented by Thelander et al. (2003) for those
generated for the ‘wider’ study plots, which is not appropriate. F2008 (P. 8) confirms that
the survey plot used in calculations was a 300 m radius circle (i.e. 28.3 ha) but then uses
a result, presented in Thelander et al. (2003: Table 7) of the mean flying time for golden
eagles of 3.12 min, which with a flight speed1 of 13 m/s gives an estimated average flight
length of 2,434 m. As noted by Fernley et al. (2007), however, a reasonable
approximation of the average flight length of a bird across a circle of a given diameter D
1 The present study assumed a flight speed of 15 m/s for golden eagle, following the review of Provan & Whitfield (2007); the difference in the two studies’ assumptions will only make a minor contribution to differences in final results.

34
is given by: D * (Pi/4), which in this instance gives 471 m. This is much lower (< 20 %)
than the estimate of flight length used by F2008. Since eagles at Altamont do not appear
to engage disproportionately in circular flight behaviours such as soaring upwards which
would retain flight activity within a constrained area, but appear to glide or fly through
observation plots relatively frequently (Smallwood & Thelander 2004), then the mean
estimate of flight length used by F2008 appears to be seriously excessive. This
supposition is confirmed if Table 11 of Thelander et al. (2003) is consulted where a
higher ‘mean flying time’ (3.75 min) is presented for an area ≤ 50 m from a turbine.
Using the same calculations employed by F2008 and Fernley et al. (2007), this would
respectively give an ‘observed’ flight length of 2,925 m against an ‘expected’ flight length
of 79 m. Clearly, this difference is even more difficult to reconcile with eagle behaviour
than the calculations for a 300 m radius plot.
What is apparent, therefore, is that the results for ‘mean flying time’ presented by
Thelander et al. (2003) and as used by F2008 are derivatives for a wider study area and
not referable to the basic 300 m radius observation plot. Thus, by using the value of
‘eagle flight minutes’ presented by Thelander et al. (2003) for a wider study area and
applying it to a much smaller plot, F2008 has markedly overestimated the eagle flight
activity around the turbines at Altamont. This will generate inflated estimates of
avoidance rates.
F2008 and Whitfield & Band (in prep.)
F2008 refers to an earlier study, Whitfield & Band (in prep.; hereafter termed W&B),
which had also estimated avoidance rates in golden eagles at five wind farms, and in
several other raptor species. Unfortunately, the W&B note had been circulated in a
preliminary form drafted several years ago and the present report represents the
continuing process of updating and revising these original estimates, for a number of
raptors and non-raptors; a process begun by Whitfield & Madders (2006a, b) and
Whitfield (2007). Appropriately, F2008 has criticised W&B as it presented no
calculations, but this was because it was a draft note in preparation which was not
intended for circulation. In the present study these calculations have been reviewed and
updated, for golden eagles, and contrasted against the values found by F2008 in this
Annex.
35
It is apparent (F2008: section 3.4) that the estimates presented by W&B are lower then
those given by the present study, except for Foote Creek Rim. The reasons for these
differences primarily relate to the difficulties in determining the appropriate eagle activity
levels at Altamont and that W&B had used Altamont as a basis for assessing activity
levels at Tehachapi and San Gorgonio, using Erickson et al (2002). Subsequent to the
drafting of W&B much more information has come to light, notably Anderson et al. (2004,
2005), clarification of Altamont studies’ methods and results (e.g. Smallwood &
Thelander 2008, Smallwood 2006), and the timely review of Smallwood (2007). Thus,
while the present study criticises F2008 for its approach in some areas, it also agrees
with F2008 in many aspects by criticising W&B implicitly.