Embed Size (px)
Citation preview
March 16, 2005
Vermelding onderdeel organisatie
1
Coincidence-summing based detectorcalibration
Nuclear data for Activation Analysis
Menno BLAAUW
Faculty of Applied Sciences - Reactor Institute Delft
The magic of absolute efficiencies without certified sources

March 16, 2005 2
Overview
• Basics of coincidence summing
• How to determine efficiency curves in the presence ofcoincidence summing
• How to determine a source activity from scratch
• Applicability with Ge detectors
• Two advanced topics / applied examples
• Do absolute peak areas exist?
• The voluminous effect and the third curve
March 16, 2005 3
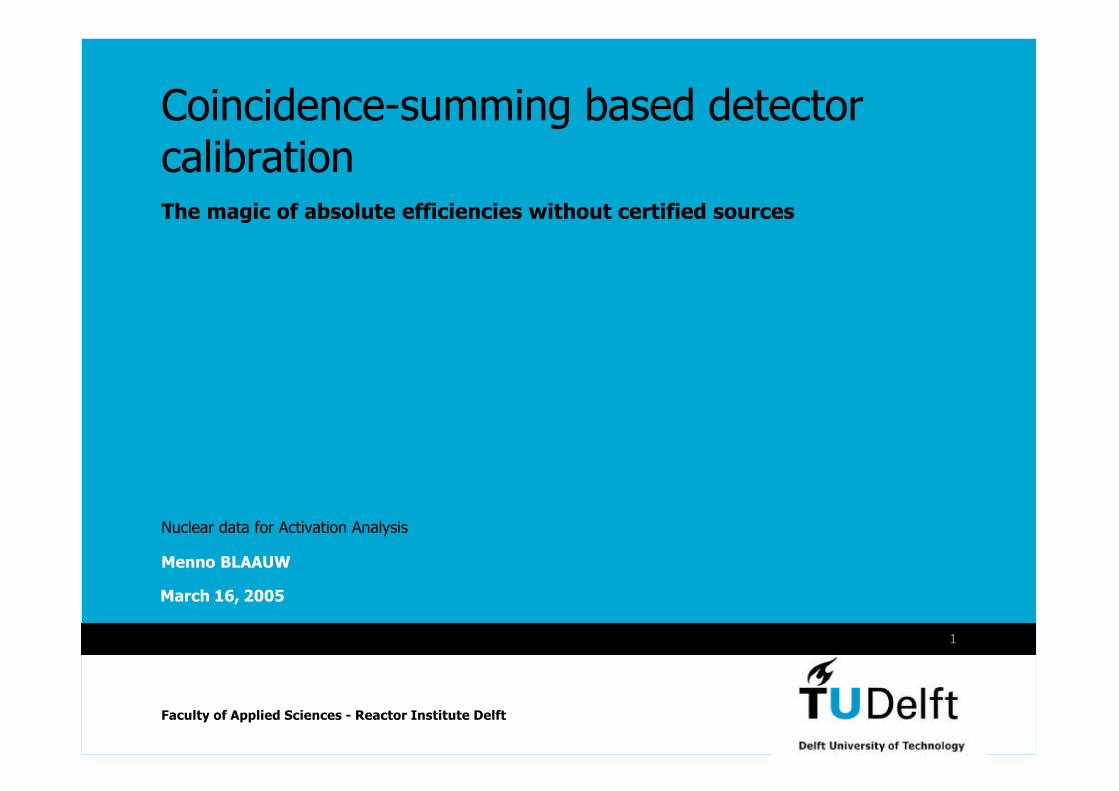
A simple decay scheme
March 16, 2005 4
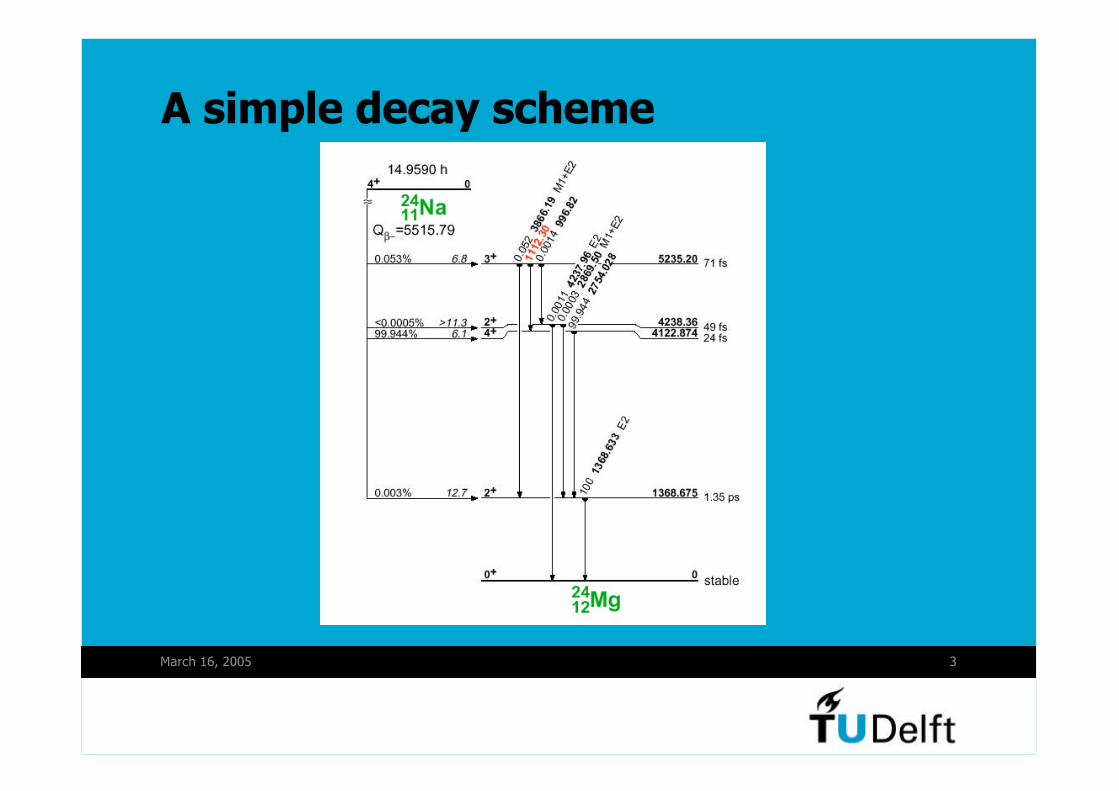
Coincidence equations
( )1368 1368 ,27541
tA Nε ε= −
( )2754 2754 ,13681 tA Nε ε= −
1368 2754 1368 2754A Nε ε+ =
1
1 1
(1 )M
i
i
M N M
E i tj
i jitinerarieswhere E E
P ε ε
=
−
= ==
⎧ ⎫⎪ ⎪= −⎨ ⎬⎪ ⎪⎩ ⎭∑
∑ ∏ ∏
the general equation

March 16, 2005 5
How to calibrate in the presence ofcoincidence summing - method 1
• Measure the peak-to-total ratio curve separately.
• Count a calibrated, multi-gamma-ray source.
• Disregard the sum peaks.
• Each “normal” peak corresponds to a full-energy peakefficiency, so
• the number of questions is equal to the number ofunknowns, so
• the full-energy peak efficiencies can be solved.
D.S. Andreev, K.I. Erokhina, V.S. Zvonov, I.Kh.Lemberg, Bull. Acad. Sci. USSR Phys.Ser. 37 (1973) 41-43M. De Bruin, P.J.M. Korthoven, Radiochem.Radioanal. Letters 19 (1974) 153-156T.M. Semkow, G. Mehmood, P.P. Parekh, M. Virgil, Nucl.Instr.Meth. in Phys.Res. A290 (1990) 437-444
March 16, 2005 6
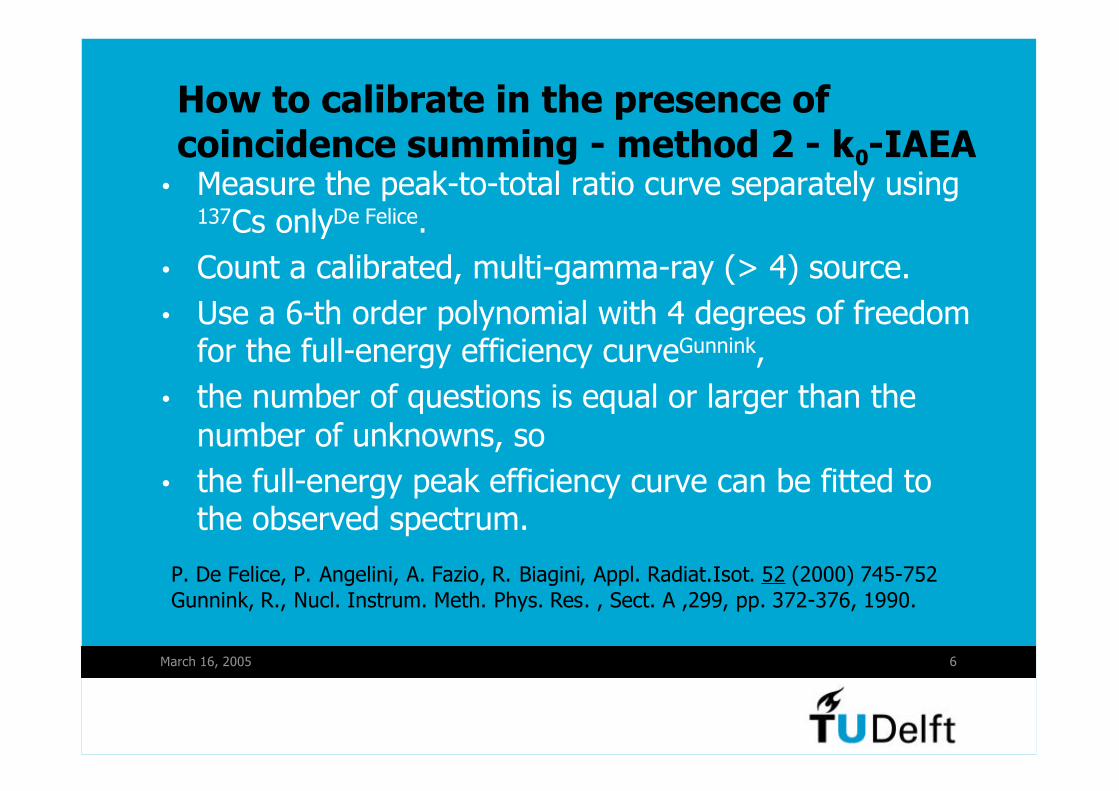
• Measure the peak-to-total ratio curve separately using137Cs onlyDe Felice.
• Count a calibrated, multi-gamma-ray (> 4) source.
• Use a 6-th order polynomial with 4 degrees of freedomfor the full-energy efficiency curveGunnink,
• the number of questions is equal or larger than the
number of unknowns, so
• the full-energy peak efficiency curve can be fitted tothe observed spectrum.
P. De Felice, P. Angelini, A. Fazio, R. Biagini, Appl. Radiat.Isot. 52 (2000) 745-752
Gunnink, R., Nucl. Instrum. Meth. Phys. Res. , Sect. A ,299, pp. 372-376, 1990.
How to calibrate in the presence of
coincidence summing - method 2 - k0-IAEA

March 16, 2005 7
How to determine a source activityfrom scratch• We have N atoms decaying during our measurement,
each emitting two photons simultaneously, with equal100 % yields and energies E1 and E2
• We have a detector with energy resolution that detectsthese with efficiencies ε1 and ε2.
• We will then see three peaks in the spectrum,corresponding to E1, E2 and E1+E2, with net areas A1,A2, and A1+2
• We can write and derive:
March 16, 2005 8
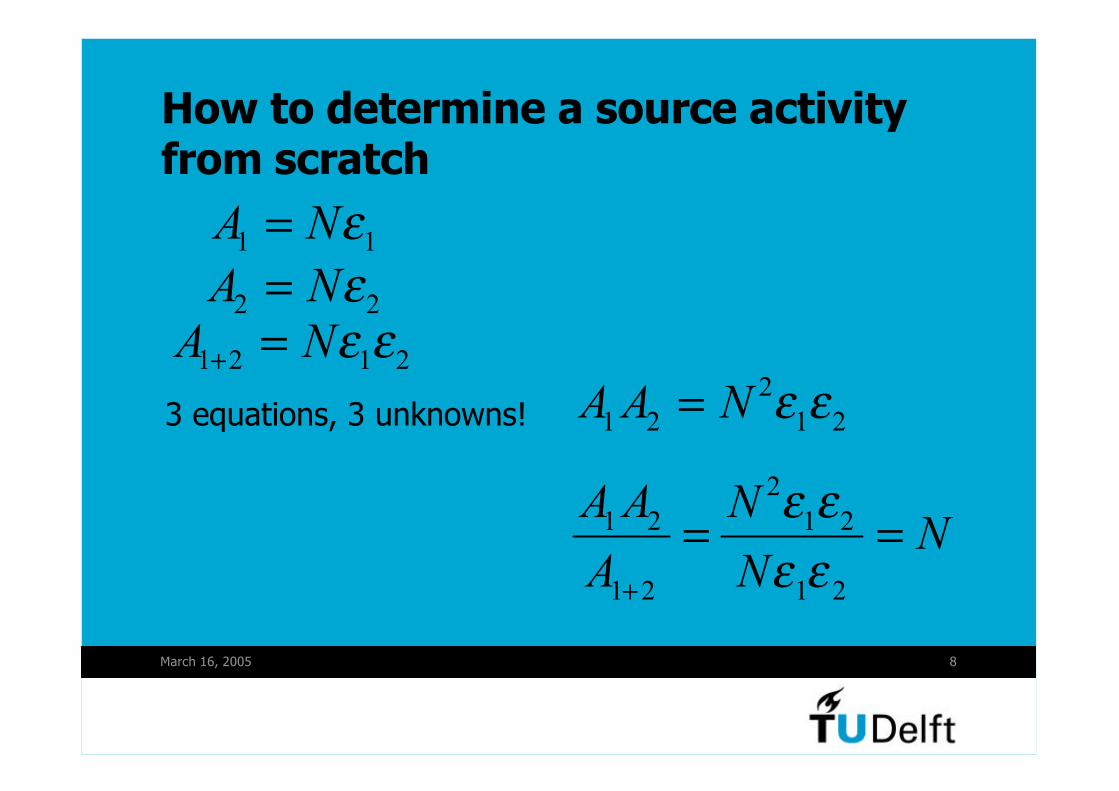
How to determine a source activityfrom scratch
1 1A Nε=2 2A Nε=
1 2 1 2A Nε ε+ =2
1 2 1 2A A N ε ε=
2
1 2 1 2
1 2 1 2
A A NN
A N
ε εε ε+
= =
3 equations, 3 unknowns!
March 16, 2005 9
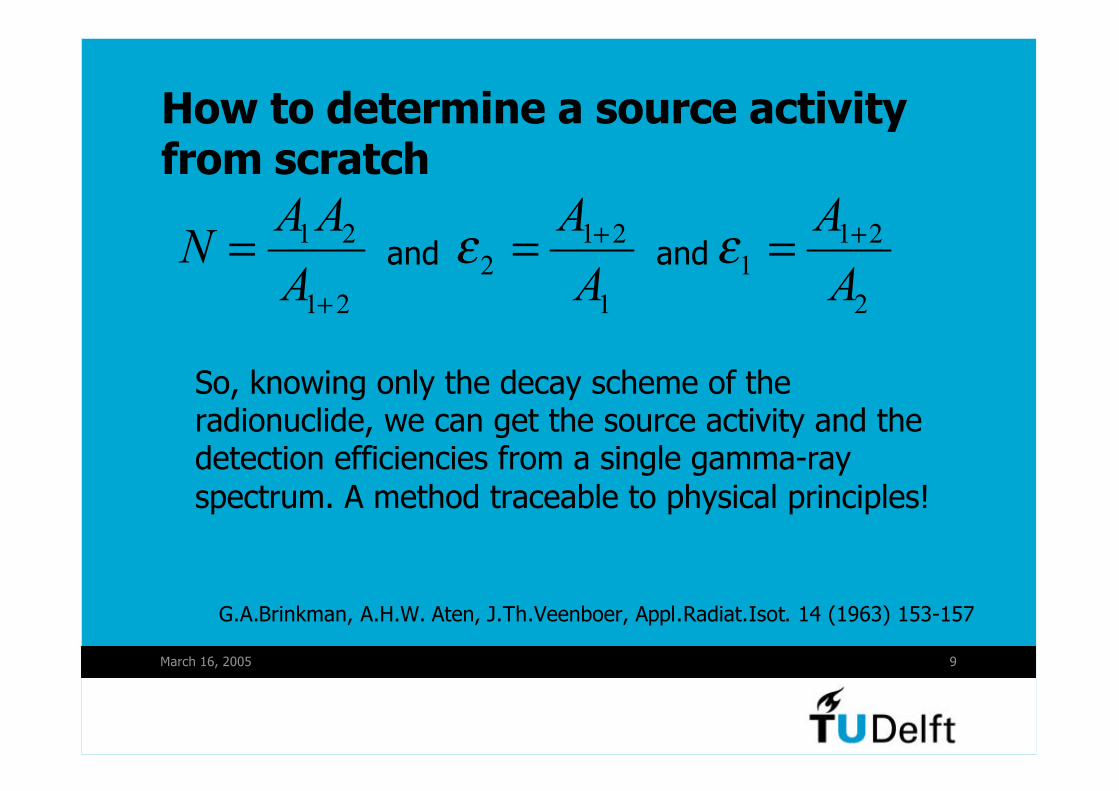
How to determine a source activityfrom scratch
1 2
1 2
A AN
A +
= 1 2
2
1
A
Aε += 1 2
1
2
A
Aε +=and
So, knowing only the decay scheme of theradionuclide, we can get the source activity and thedetection efficiencies from a single gamma-ray
spectrum. A method traceable to physical principles!
and
G.A.Brinkman, A.H.W. Aten, J.Th.Veenboer, Appl.Radiat.Isot. 14 (1963) 153-157
March 16, 2005 10
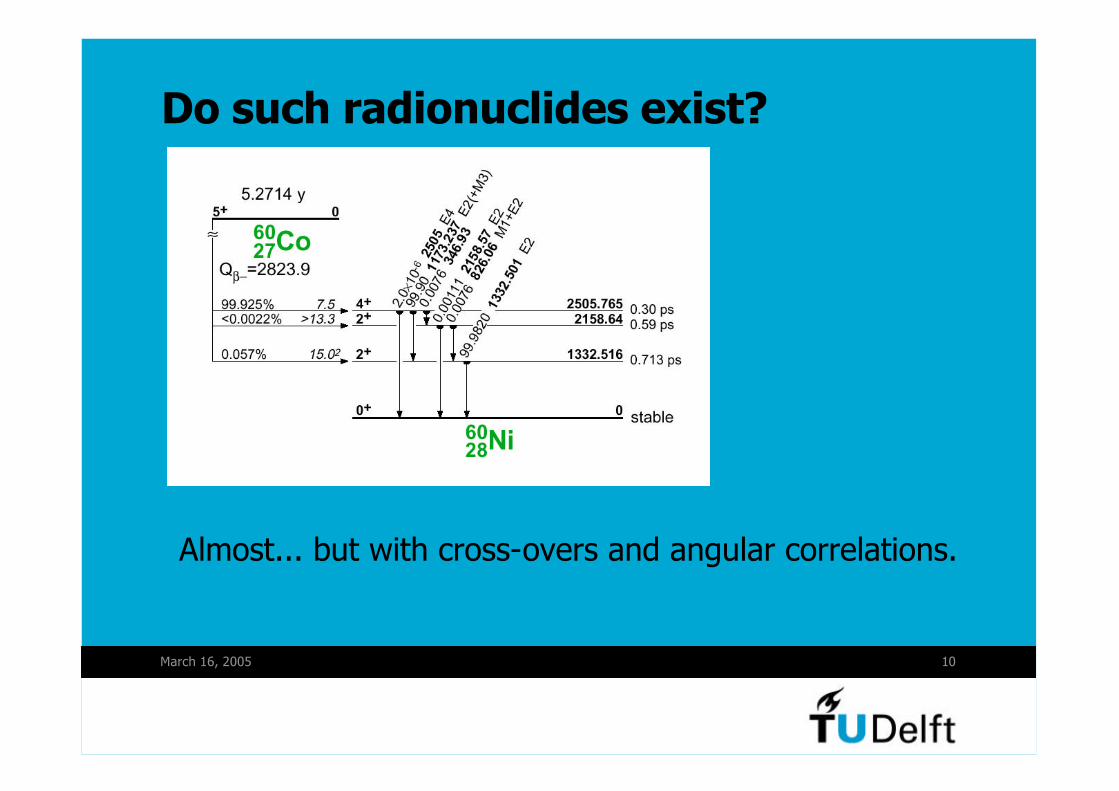
Do such radionuclides exist?
Almost... but with cross-overs and angular correlations.

March 16, 2005 11
Do such detectors exist for gamma-rays?
No, definitely not forhigher energies!
March 16, 2005 12
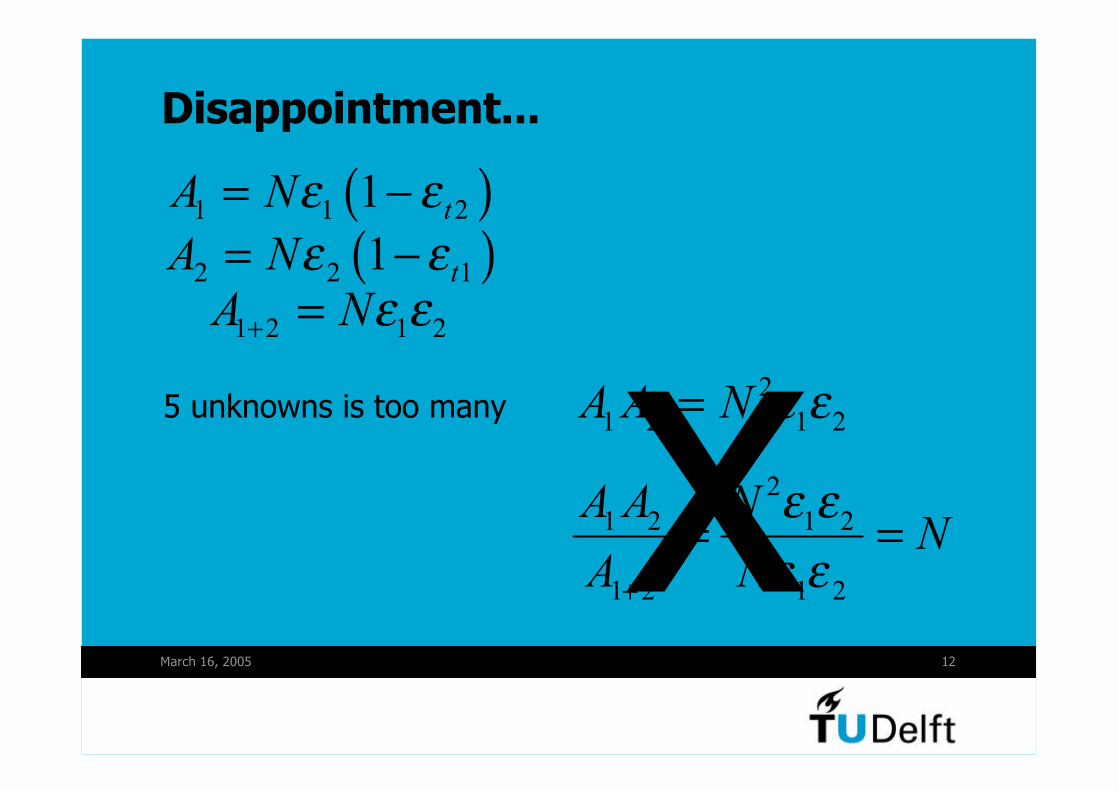
Disappointment...
( )1 1 21 tA Nε ε= −( )2 2 11 tA Nε ε= −
1 2 1 2A Nε ε+ =2
1 2 1 2A A N ε ε=
2
1 2 1 2
1 2 1 2
A A NN
A N
ε εε ε+
= =x5 unknowns is too many

March 16, 2005 13
How to determine source activity andboth efficiency curves from scratch• The number of equations is the number of single-
photon peaks T plus the number of sum peaks, that is
...1 2
T T T
N
⎛ ⎞ ⎛ ⎞ ⎛ ⎞+ +⎜ ⎟ ⎜ ⎟ ⎜ ⎟
⎝ ⎠ ⎝ ⎠ ⎝ ⎠
• If all efficiencies and source activity are unknown, thenumber of unknowns is
1 2T+• So at T >= 3, the number of equations >= number of
unknowns

March 16, 2005 14
More disappointment and solutions
• Triple sum peaks are very hard to detect indeed, notto mention higher-order ones...
• So we take a closer look at the unknowns:
• We can parametrize the efficiency curve with Gunnink’spolynomial (4 unknowns)
• We parametrize the p/t curve with a 2nd order polynomial ona log-log scale
• With the source activity, that is 7 unknowns total
• At T=4, using only simple sum peaks, we’re there with4+6 peaks
• So do we have candidate radionuclides?

March 16, 2005 15
Requirements for candidate nuclides
• Energies covering the whole energy-range of interest
• Many transitions without cross-overs
• Medium-complexity decay scheme (for computationalspeed)
• Medium half-life (not too much waste, not too muchhaste, reasonable count rates to avoid random
summing)

March 16, 2005 16
Suitable nuclide #1: 82Br
March 16, 2005 17
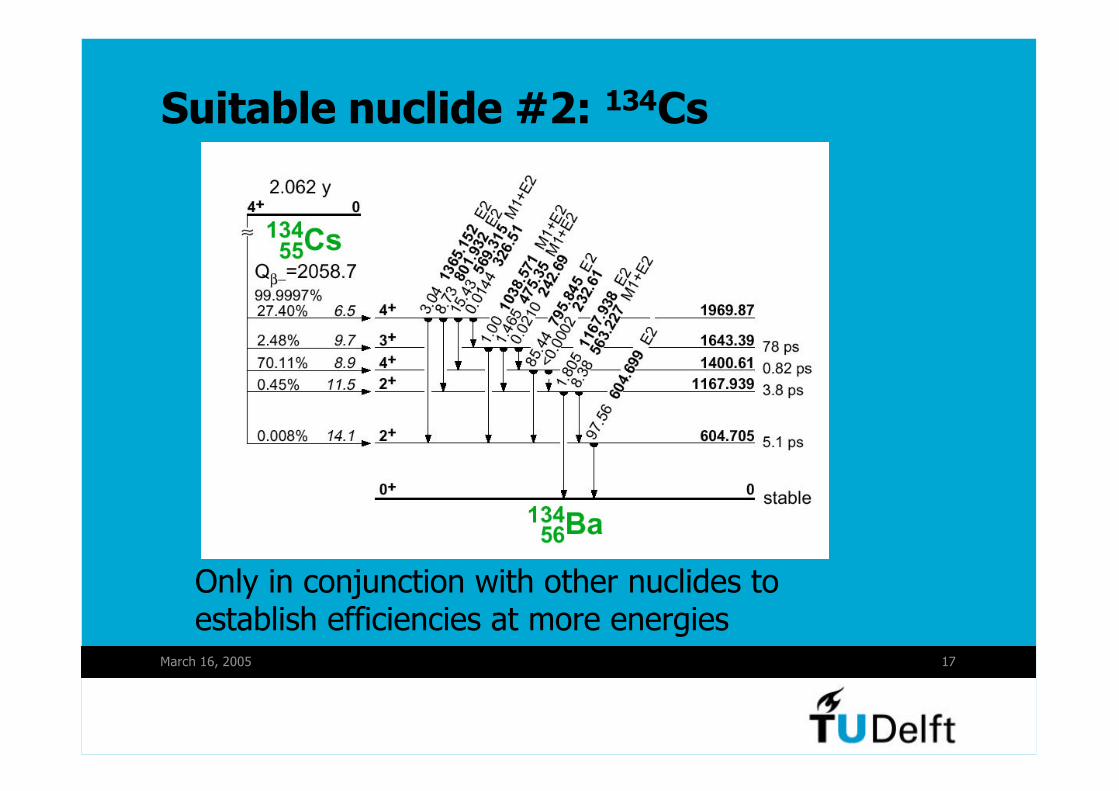
Suitable nuclide #2: 134Cs
Only in conjunction with other nuclides toestablish efficiencies at more energies
March 16, 2005 18
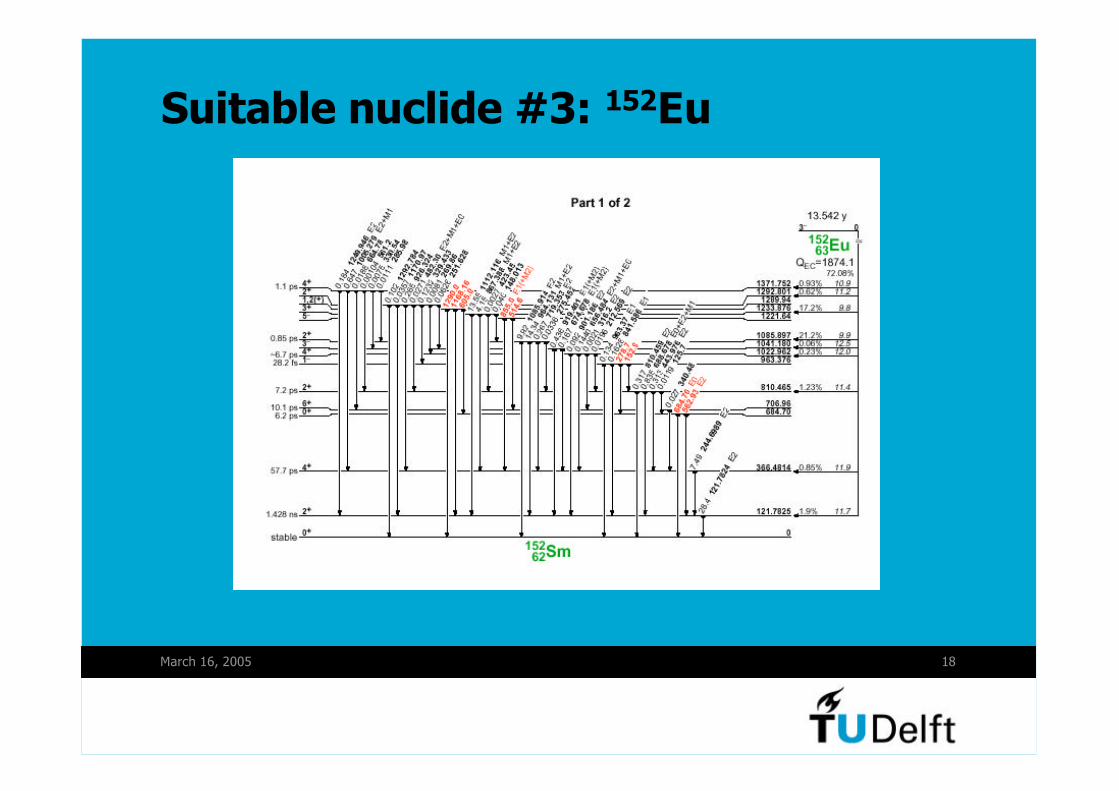
Suitable nuclide #3: 152Eu
March 16, 2005 19
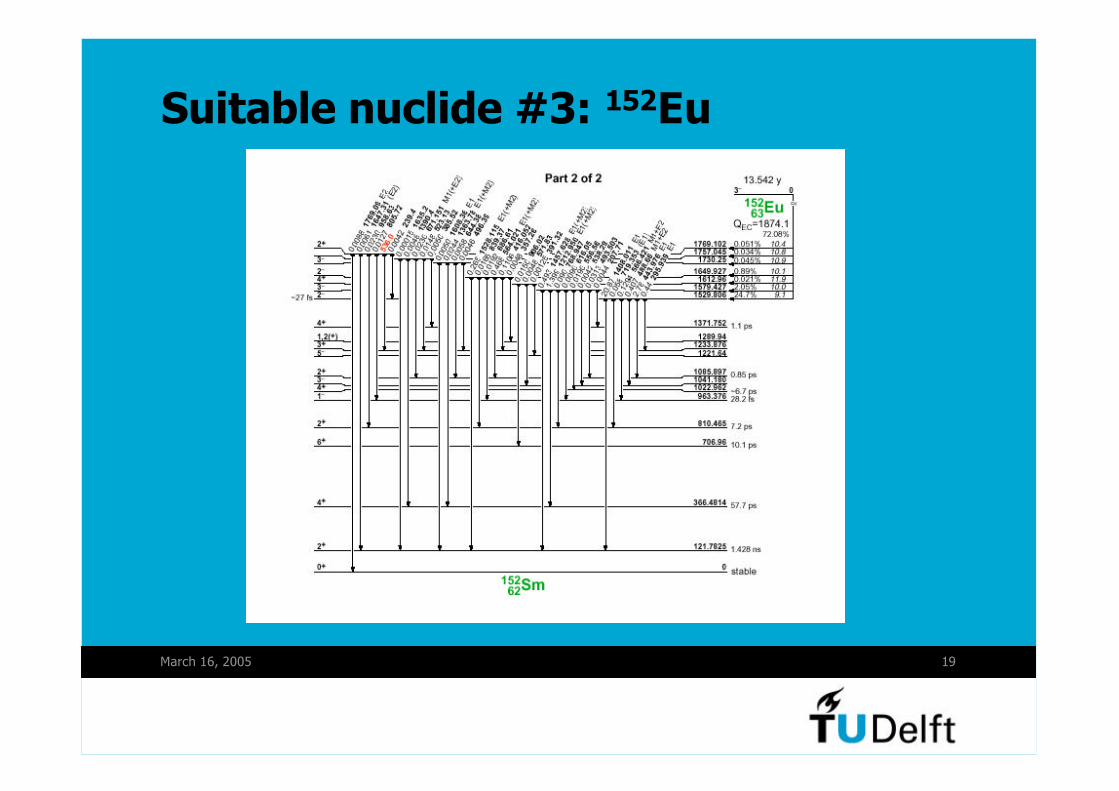
Suitable nuclide #3: 152Eu

March 16, 2005 20
152Eu pros and cons
• Hard to get in pure form, that is without 154Eu.
• Complex decay scheme, but modern computers arefast
• Very nice coverage of low energies, from the X-raysaround 40 keV up to 1408 keV. Higher energies
missing.
March 16, 2005 21
The idea in a nutshell
• If we have a source containing suitable radionuclides,we can determine the source activity, full-energy peakefficiency curve and peak-to-total curve all at once.
• This was demonstrated for the first time in 1993
M.Blaauw, “The Use of Sources Emitting Coincident γ-Rays for Determination of
Absolute Efficiency Curves of Highly Efficient Ge Detectors”, Nucl.Instr.Meth. A332
(1993) 493-500
• The source activity is usually not determined veryprecisely due to strong covariances. With extremecounting statistics, better than 1 % precision in source
activity is achievable.

March 16, 2005 22
A more stable method
• If we have a calibrated source containing suitableradionuclides, we can determine the full-energy peakefficiency curve and peak-to-total curve all at once.
• This was demonstrated for the first time in 1998
M. Blaauw, “Calibration of the Well-Type Germanium Gamma-Ray Detector
Employing Two Gamma-ray Spectra”, Nucl.Instr.Meth, A419 (1998) 146-153
• the strong covariances and instability disappeared,
• and since we have more equations than unknowns wecan do even more...
The Influence of Peak Area Determination Biasin Quantitative Gamma-ray Spectrometry
in the Presence of True Coincidence Summing
or
There can be only one...
M. Blaauw, S.J. Gelsema

Overview of the first advanced topic
• Theory (no bias)
• Theory (bias)
• Experiment I: verification of 1 program• Results I
• Experiment II: indirect verification of others
• Results II
• Conclusions / Implications
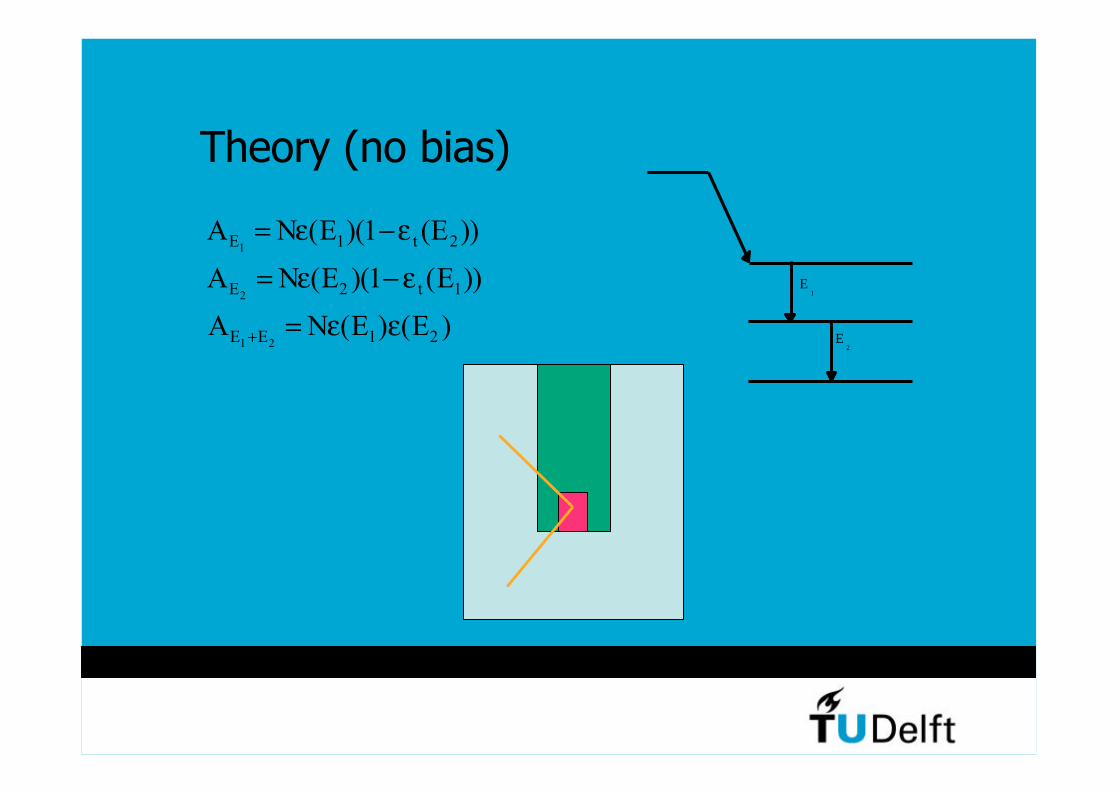
Theory (no bias)
E1
E2
A N E EE t1 1 21= −ε ε( )( ( ))
A N E EE t2 2 11= −ε ε( )( ( ))
A N E EE E1 2 1 2+ = ε ε( ) ( )
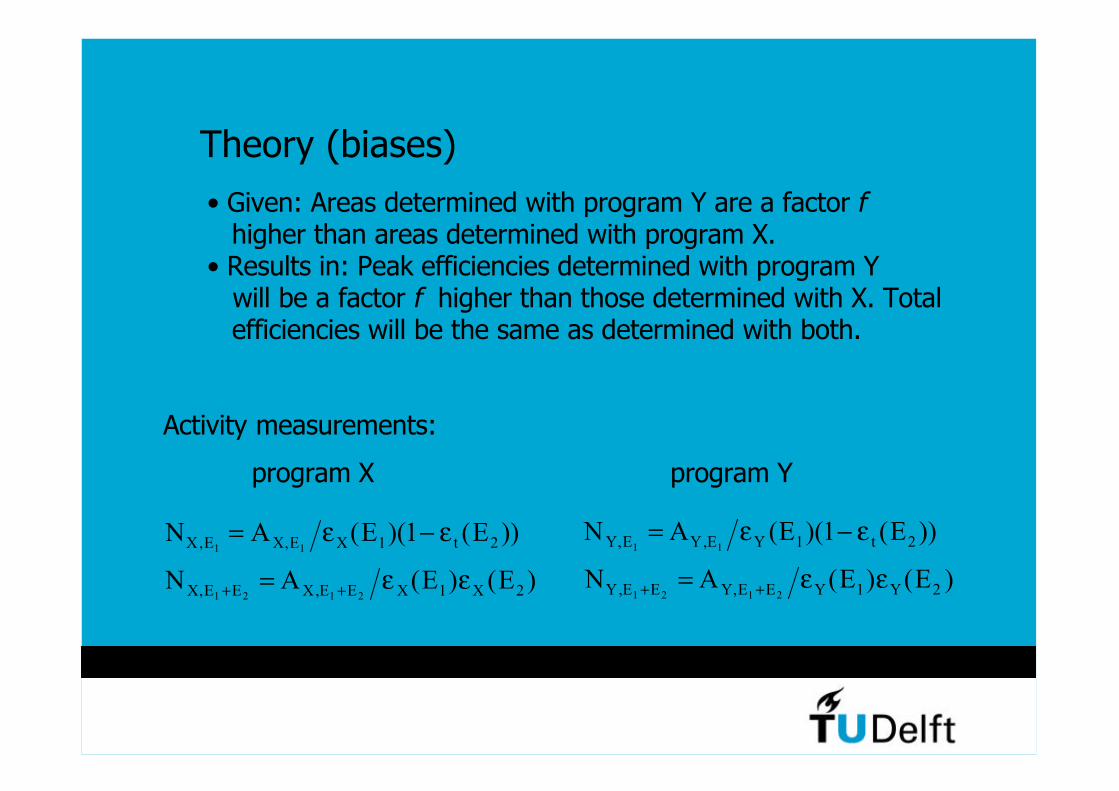
Theory (biases)
N A E EX E X E X t, , ( )( ( ))1 1 1 21= −ε ε
N A E EX E E X E E X X, , ( ) ( )1 2 1 2 1 2+ += ε ε
program X program Y
• Given: Areas determined with program Y are a factor f higher than areas determined with program X.• Results in: Peak efficiencies determined with program Y will be a factor f higher than those determined with X. Total efficiencies will be the same as determined with both.
N A E EY E Y E Y t, , ( )( ( ))1 1 1 21= −ε ε
N A E EY E E Y E E Y Y, , ( ) ( )1 2 1 2 1 2+ += ε ε
Activity measurements:

For the ordinary peak, we get
N A E E
f A f E E
N
Y E Y E Y t
X E X t
X E
, ,
,
,
( )( ( ))
( )( ( ))
1 1
1
1
1 2
1 2
1
1
= −
= −
=
ε ε
ε ε
So far, so good: The results is identical for both programs. Butfor the sum peak we get
N A E E
fA f E f E
N f
Y E E Y E E Y Y
X E E X X
X E E
, ,
,
,
( ) ( )
( ) ( )
1 2 1 2
1 2
1 2
1 2
1 2
+ +
+
+
=
=
=
ε ε
ε ε
Discrepancy! Can we tell which program is right? Yes, thatmust be the program for which !N NE E E1 2 1+ =
Experimental I
• 82Br source with known activity (determined in calibrated, coincidence-free counting geometry) measured close to end cap of Ge(Li) coaxial detector.• Peak areas determined with in-house software. This software was “calibrated” for peak areas using a clean 137Cs peak without continuum and comparison of fit- and integration results.• Peak areas multiplied with bias factors ranging from 0.5 to 2.0.• Fit of peak efficiency and peak-to-total curve to measured peak areas attempted. Result: cr
2 indicating internal consistency of peak areas and corresponding activities.

Results
P eak a rea multiplica tion fac tor
0.5 1.0 1.5 2.0
qu
alit
yo
ffitX
r2
1
10
100
σχ
f
rd
df=
⎛⎝⎜
⎞⎠⎟
−2 2
2
12
With fit of parabola to minimum and , we get theoptimum factor f = 1.009 +/- 0.006.
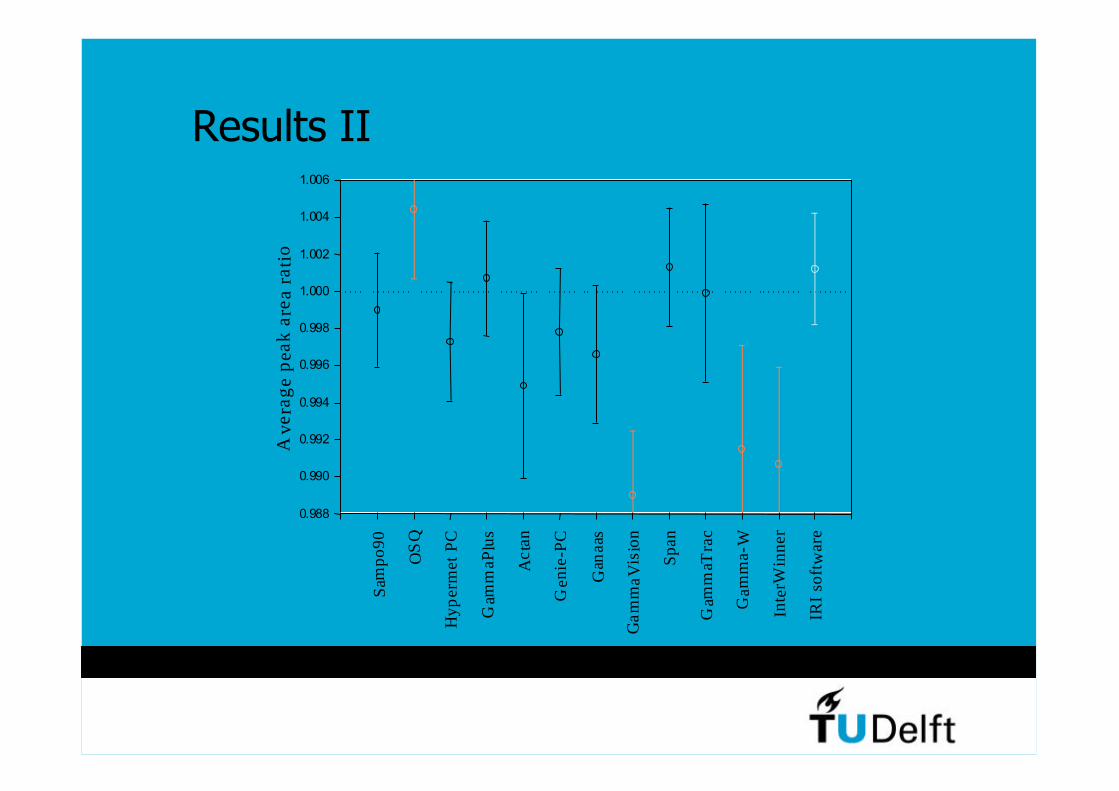
Experimental II
• The “straight” 1995 IAEA test spectrum was analyzed with the in-house IRI software.• The resulting areas were compared with the reference areas: The weighted average of the peak area ratios was computed.• The resulting peak area ratio of 1.001 +/- 0.003 was compared to those obtained from the other programs tested in the 1995 IAEA intercomparison.
Sam
po90
OSQ
Hyp
erm
etPC
Gam
maP
lus
Ac t
an
Gen
ie-P
C
Gan
aas
Gam
maV
isio
n
Span
Gam
maT
rac
Gam
ma-
W
Int e
rWin
ner
IRIs
oft w
are
Ave
rag e
p eak
a re a
ratio
0.988
0.990
0.992
0.994
0.996
0.998
1.000
1.002
1.004
1.006
Results II
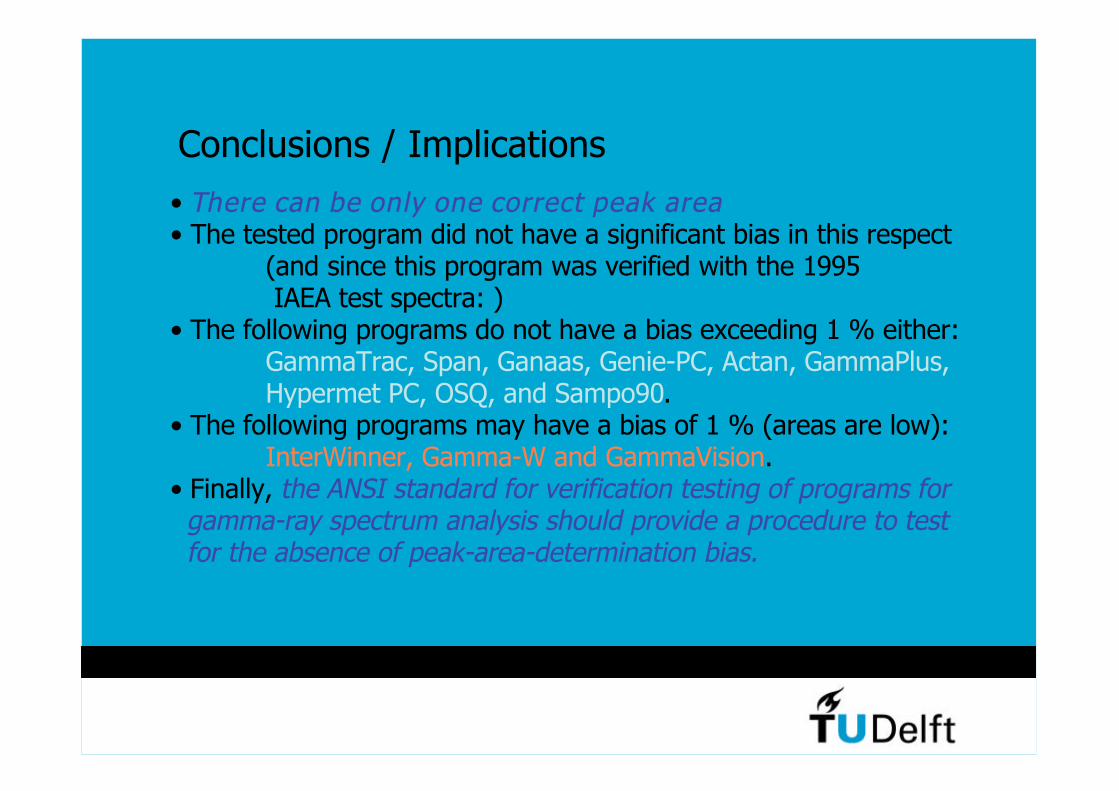
Conclusions / Implications
• There can be only one correct peak area• The tested program did not have a significant bias in this respect
(and since this program was verified with the 1995 IAEA test spectra: )
• The following programs do not have a bias exceeding 1 % either:GammaTrac, Span, Ganaas, Genie-PC, Actan, GammaPlus,Hypermet PC, OSQ, and Sampo90.
• The following programs may have a bias of 1 % (areas are low):InterWinner, Gamma-W and GammaVision.
• Finally, the ANSI standard for verification testing of programs for gamma-ray spectrum analysis should provide a procedure to test for the absence of peak-area-determination bias.

March 16, 2005 33
and more...
Cascade Summing inGamma-Ray Spectrometry inMarinelli-Beaker Geometries:The Third Efficiency Curve
• Menno Blaauw, Sjoerd J. Gelsema

March 16, 2005 34
Overview of the second advanced topic
• The voluminous effect problem
• The solution
• The experiment
• Conclusions
March 16, 2005 35
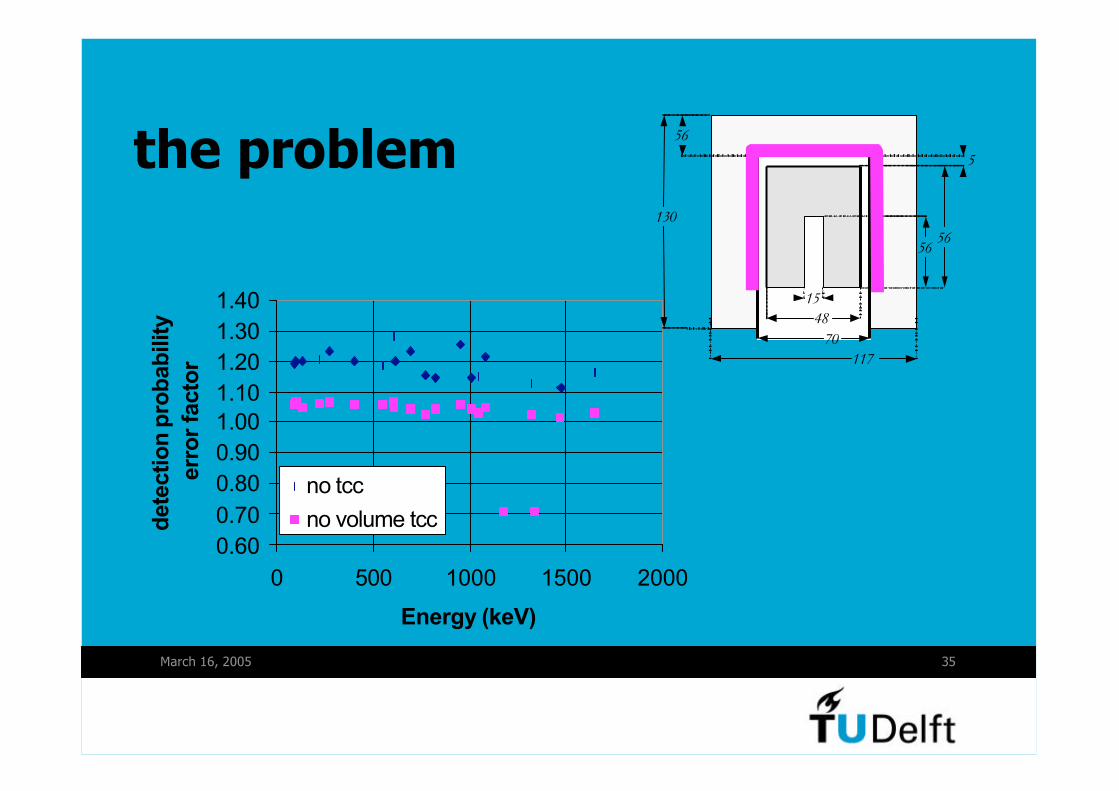
the problem
0.60
0.70
0.80
0.90
1.00
1.10
1.20
1.30
1.40
0 500 1000 1500 2000
Energy (keV)
dete
cti
on
pro
bab
ilit
y
err
or
facto
r
no tcc
no volume tcc
5
15
48
70
117
5656
130
56

March 16, 2005 36
the solution
1 1
(1 )M N M
i tj
i j
P ε ε−
= =
= −∏ ∏ the general equation
212121σσεεεε r+= the voluminous correction to the
product of the averages
222 εε=l definition of the sqr-to-lin ratio “l”
⎟⎠⎞⎜⎝
⎛ −−+= 111 2
2
2
12121llrεεεε the voluminous correction again
221121εεεε ll= approx. the voluminous correction
NNNlll εεεεεε ......
221121= the approximation generalized
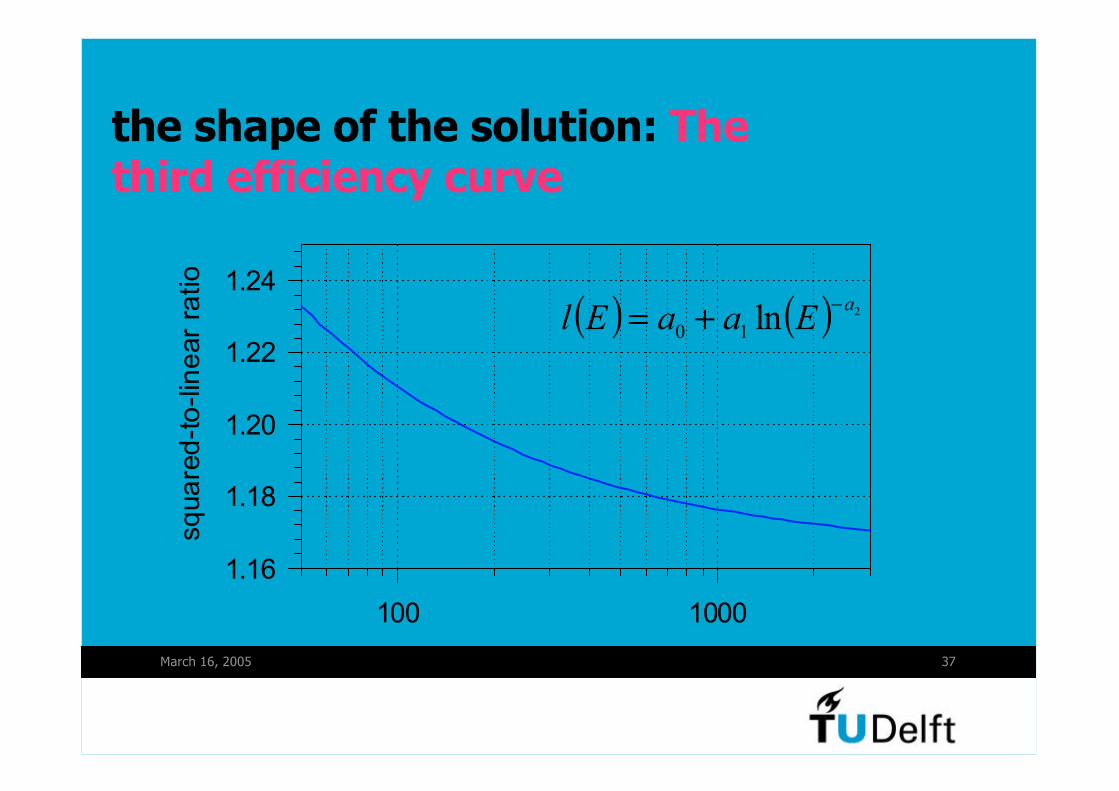
March 16, 2005 37Photon energy (keV)
100 1000
sq
ua
red
-to
-lin
ear
ratio
1.16
1.18
1.20
1.22
1.24
the shape of the solution: Thethird efficiency curve
( ) ( ) 2ln10
aEaaEl
−+=

March 16, 2005 38
5
15
48
70
117
3856
130
56
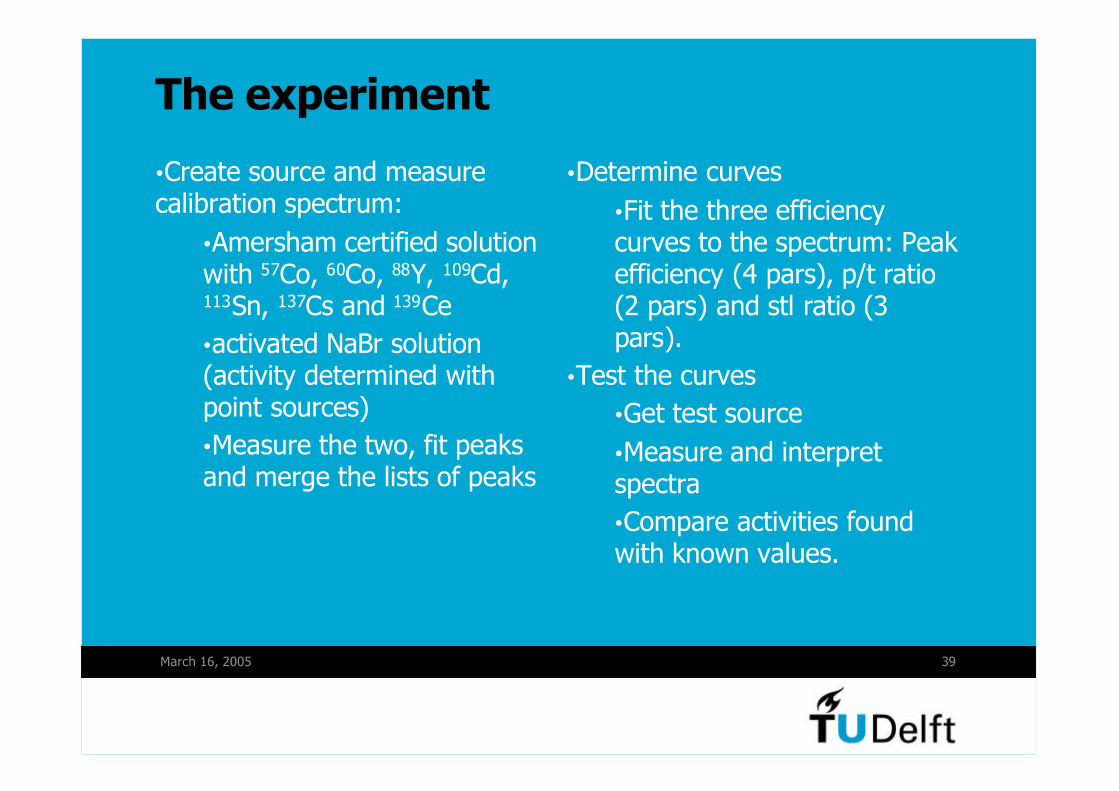
The experiment
March 16, 2005 39
The experiment
•Create source and measurecalibration spectrum:
•Amersham certified solutionwith 57Co, 60Co, 88Y, 109Cd,113Sn, 137Cs and 139Ce
•activated NaBr solution(activity determined withpoint sources)
•Measure the two, fit peaksand merge the lists of peaks
•Determine curves
•Fit the three efficiencycurves to the spectrum: Peakefficiency (4 pars), p/t ratio(2 pars) and stl ratio (3pars).
•Test the curves
•Get test source
•Measure and interpretspectra
•Compare activities foundwith known values.

March 16, 2005 40
Fit results
full-
en
erg
yp
ea
keff
icie
ncy
0.001
0.010
pe
ak
-to
-tota
lra
tio
0.080.09
0.20
0.30
0.40
0.10
Photon energy (keV)
100 1000
sq
uare
d-t
o-l
ine
ar
rati
o
1.16
1.18
1.20
1.22
1.24
Χr2 = 2.2 at 31 d.f.
Photon energy (keV)
0 500 1000 1500 2000 2500 3000
rep
rod
uced
over
mea
sure
dra
tio
0.85
0.90
0.95
1.00
1.05
1.10
1.15
Photon energy (keV)
0 500 1000 1500 2000 2500 3000
z-sc
ore
s
-5
-4
-3
-2
-1
0
1
2
3
4
Amersham source24Na, 82Br source82Br sum peaks
March 16, 2005 41
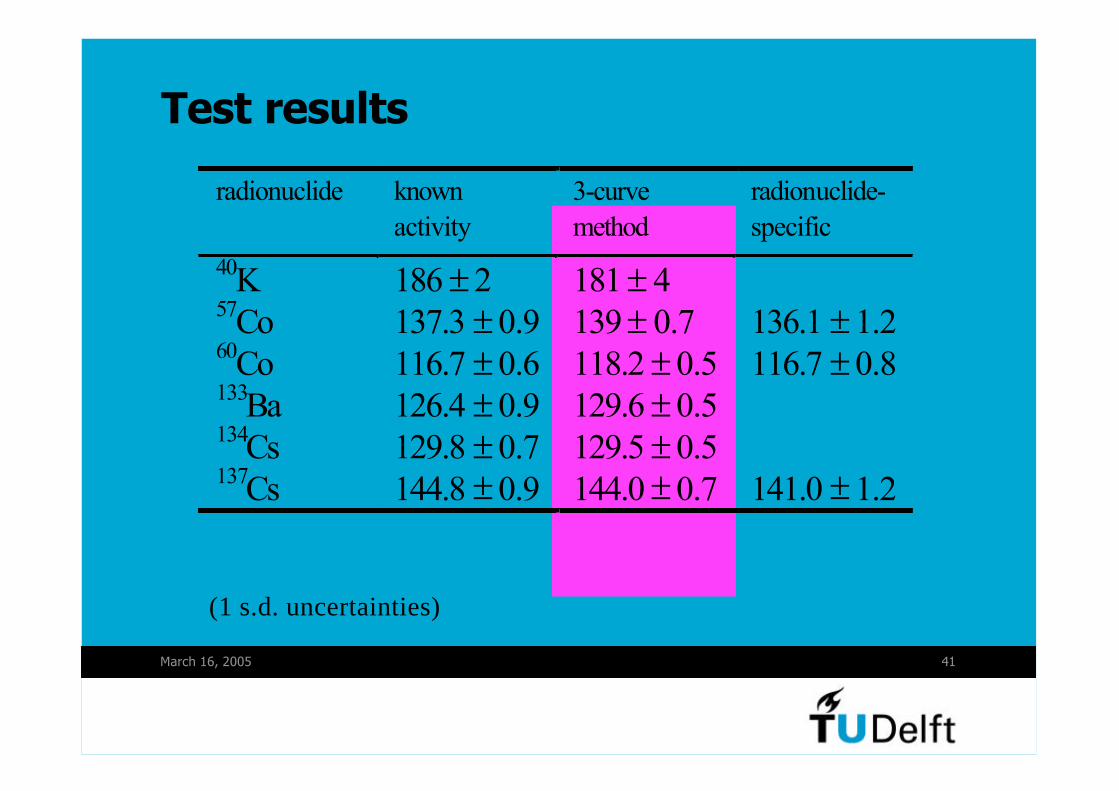
radionuclide known
activity
3-curve
method
radionuclide-
specific
40K 186 ± 2 181 ± 4
57Co 137.3 ± 0.9 139 ± 0.7 136.1 ± 1.2
60Co 116.7 ± 0.6 118.2 ± 0.5 116.7 ± 0.8
133Ba 126.4 ± 0.9 129.6 ± 0.5
134Cs 129.8 ± 0.7 129.5 ± 0.5
137Cs 144.8 ± 0.9 144.0 ± 0.7 141.0 ± 1.2
Test results
(1 s.d. uncertainties)

March 16, 2005 42
Conclusions
☺ The third efficiency curve accounts for voluminous-source effects in cascade summing corrections
☺ The method has an accurucy of 1% or better, is muchless laborious, and therefore can compete with
radionuclide-specific calibration
� As yet, the third curve must be determined in thesame geometry as the samples, but there is hope.
March 16, 2005 43
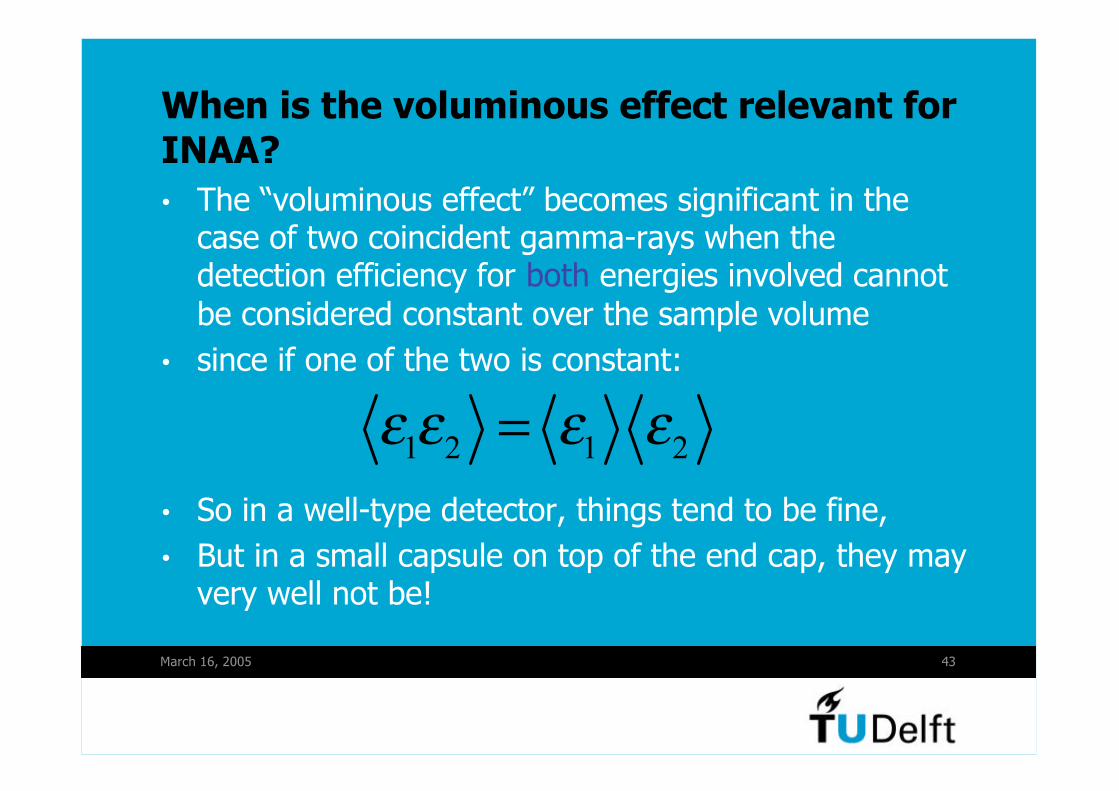
When is the voluminous effect relevant for
INAA?
• The “voluminous effect” becomes significant in thecase of two coincident gamma-rays when thedetection efficiency for both energies involved cannot
be considered constant over the sample volume
• since if one of the two is constant:
1 2 1 2ε ε ε ε=• So in a well-type detector, things tend to be fine,
• But in a small capsule on top of the end cap, they mayvery well not be!
March 16, 2005 44
Conclusions
• It is possible to use point sources emitting coincidentgamma-rays to determine efficiency curves, even closeto the detector
• but
• It is wise to stay away from the end cap of the
detector when measuring sizeable samples.
• and
• knowing the decay schemes, coincidence methodsprovide the tools to measure absolute activities andestablish what “true” peak areas are
• and to verify decay schemes if the activity is known