Embed Size (px)
Citation preview
GAMMA-GAMMA COINCIDENCE OVERLAP COINCIDENCEMETHOD FOR MEASURING GAMMA-GAMMA COINCIDENCE OF22NA
RADIATION SAFETYThe radioactive sources used in this experiment are only a few microcuries in strength, andthey are all sealed, so they actually pose no significant health hazard. However we willfollow good safety procedure. Horseplay involving the sources is forbidden. While thesources are not dangerous, like any radioactive source they should be treated with respect andproperly handled. Only the instructor is to handle the sources, and he/she will wash handsafter handling the sources. When any source is not in use, it is to be stored behind leadshielding. In the event of any accident which results in spilled radioactivity, do not attempt toclean it up your self. The staff here at Building is specially trained for this and even they callsomeone else even more trained.
PURPOSETwo annihilation quanta are radiated from a 22Na source in coincidence with each other foreach radiation event that will be measured in this experiment. The purpose of the experimentwill be to verify that these quanta emanate from the source with an angular separation of180°.
INTRODUCTIONSodium-22 is an excellent source for a simple gamma-gamma coincidence experiment. Thedecay scheme for this isotope is shown in Fig. 13.1. From the decay scheme it can be seenthat 99.95% of the time the 22Na decay occurs by positron emission and electron capturethrough the 1.274 MeV state of 22Ne. Ninety percent of these decay events occur withpositron emission, which then annihilate and produce a pair of 0.511- MeV gamma rays thatcan be seen in the gamma spectrum. Figure 13.2 shows a typical gamma spectrum for 22Nathat was obtained with a NaI(Tl) detector. The 0.511-MeV peak will usually be quite a bitmore intense than the 1.274- MeV peak, primarily because of the detector efficiencydifferences at the two energy levels and the annihilation process. The 22Na source is usuallycovered with a thin absorber such as a thin (-1/16-in.) piece of metal or plastic. Positronsfrom the source will lose energy in the absorber and will be annihilated in the absorber. TheNaI(Tl) detectors will see an approximate point source of radiation. When the positrons areannihilated, two 0.511-MeV gammas will leave the source with an angular separation of180°. Experimentally the pair of gamma rays are detected and measured with one detectorthat is fixed and another detector that can rotate about the source.
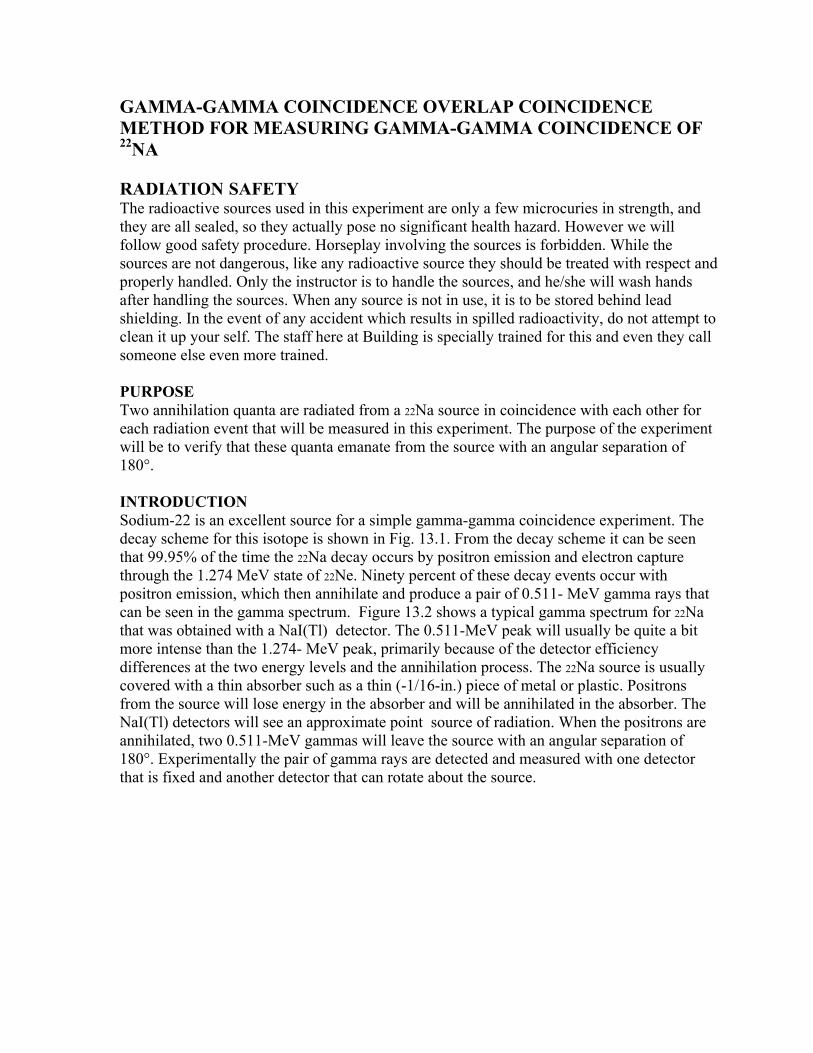
EQUIPMENT NEEDEDo Two Canberra NaI(TI) Crystal,
Phototube Assemblyo Photomultiplier Tube Base
(Preamplifier Model 2007P)o High Voltage Power Supplyo Two Amplifiero Two Timing Single-Channel Analyzer
(SCA)o Universal Coincidence Counter (or
Scaler)o NIM Bin and Power Supplyo Oscilloscopeo Na source
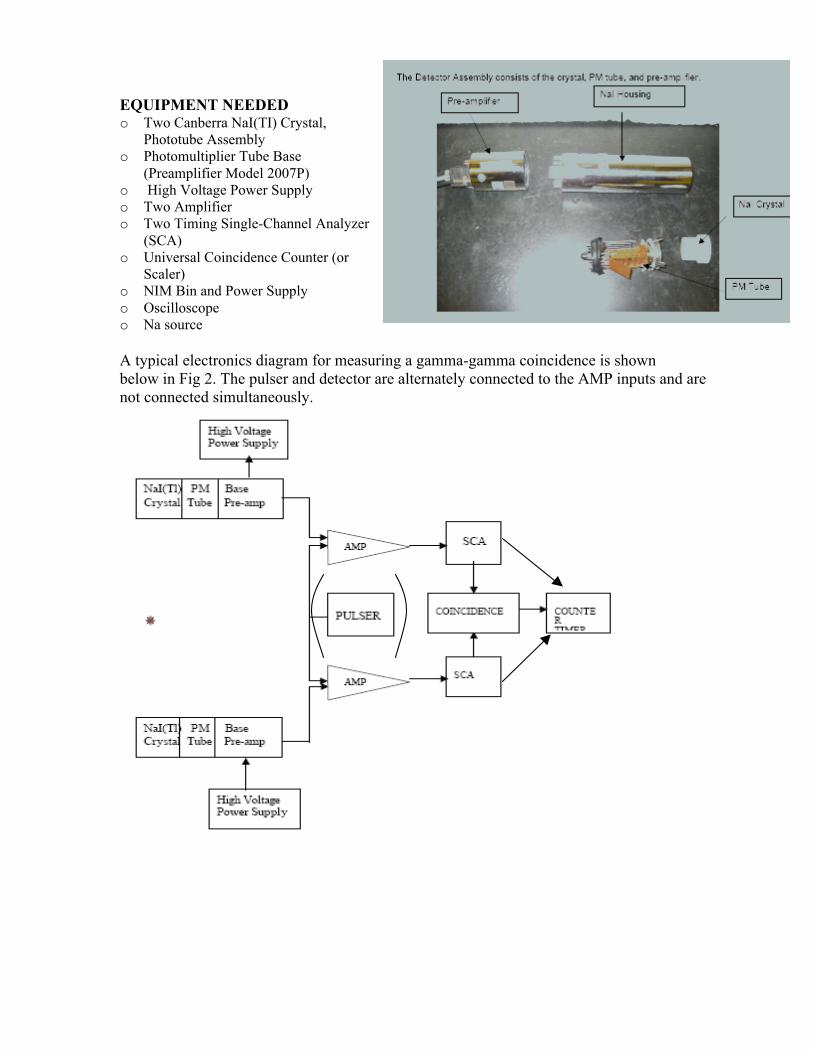
A typical electronics diagram for measuring a gamma-gamma coincidence is shownbelow in Fig 2. The pulser and detector are alternately connected to the AMP inputs and arenot connected simultaneously.
PROCEDURE
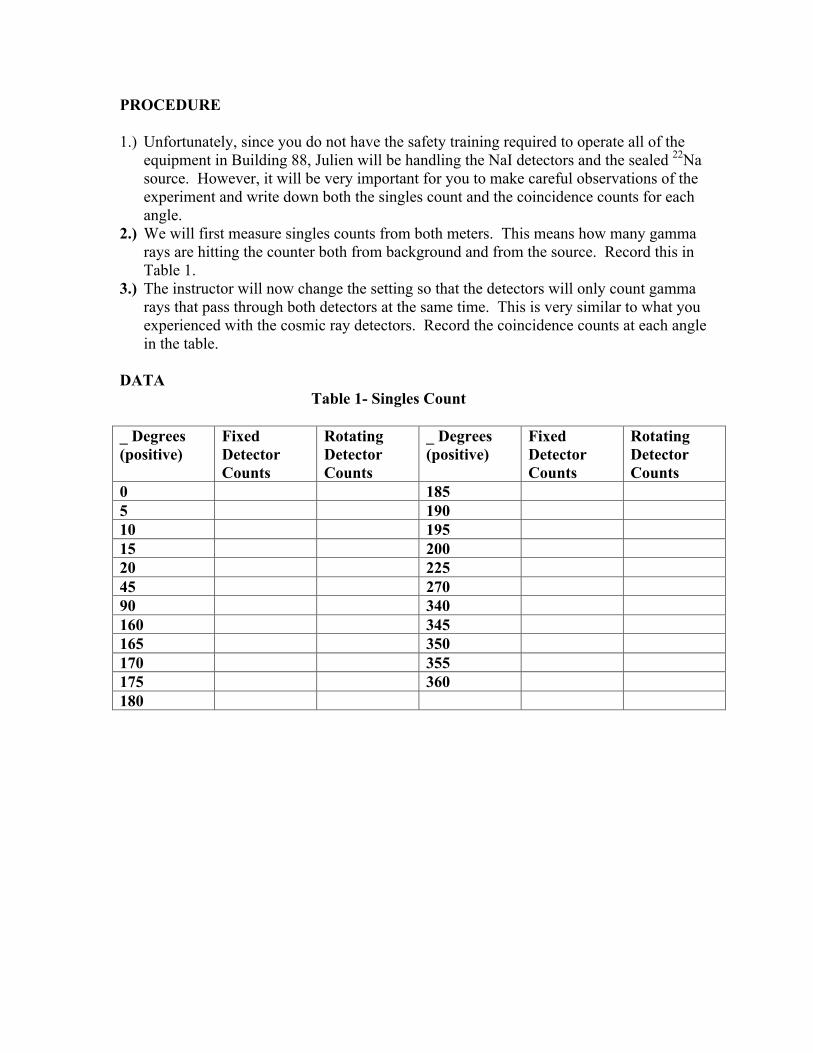
1.) Unfortunately, since you do not have the safety training required to operate all of theequipment in Building 88, Julien will be handling the NaI detectors and the sealed 22Nasource. However, it will be very important for you to make careful observations of theexperiment and write down both the singles count and the coincidence counts for eachangle.
2.) We will first measure singles counts from both meters. This means how many gammarays are hitting the counter both from background and from the source. Record this inTable 1.
3.) The instructor will now change the setting so that the detectors will only count gammarays that pass through both detectors at the same time. This is very similar to what youexperienced with the cosmic ray detectors. Record the coincidence counts at each anglein the table.
DATATable 1- Singles Count
_ Degrees(positive)
FixedDetectorCounts
RotatingDetectorCounts
_ Degrees(positive)
FixedDetectorCounts
RotatingDetectorCounts
0 1855 19010 19515 20020 22545 27090 340160 345165 350170 355175 360180
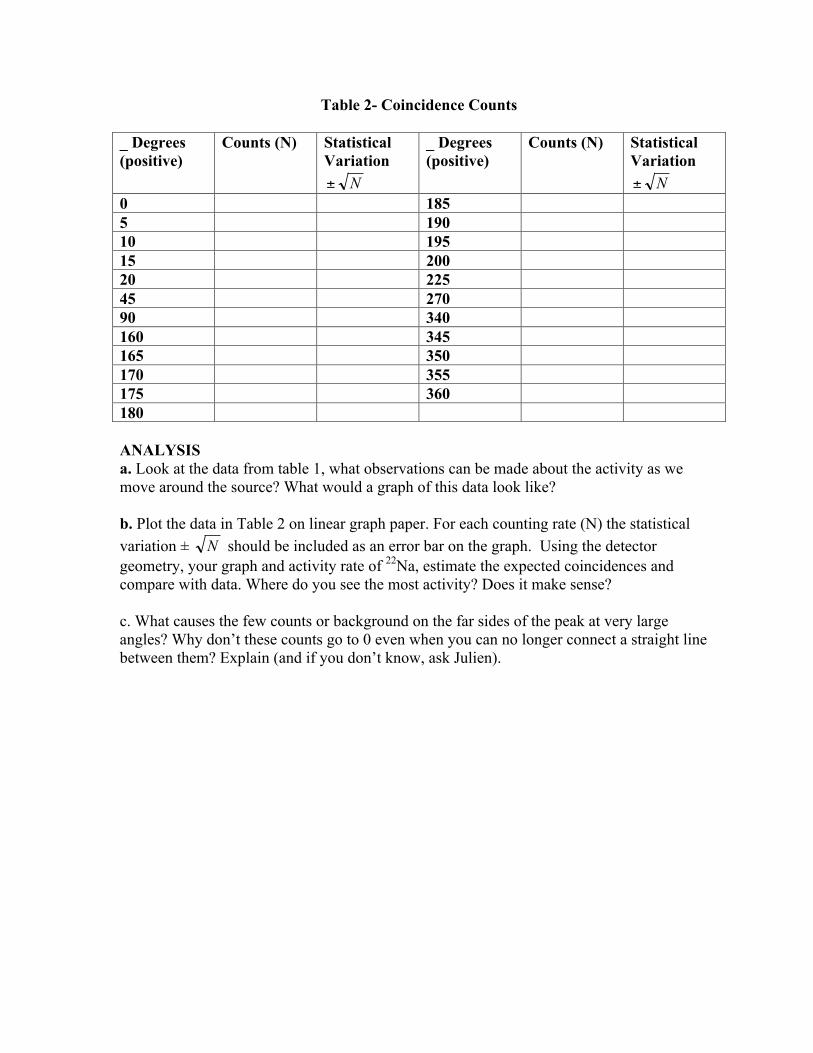
Table 2- Coincidence Counts
_ Degrees(positive)
Counts (N) StatisticalVariation
N±
_ Degrees(positive)
Counts (N) StatisticalVariation
N±0 1855 19010 19515 20020 22545 27090 340160 345165 350170 355175 360180
ANALYSISa. Look at the data from table 1, what observations can be made about the activity as wemove around the source? What would a graph of this data look like?
b. Plot the data in Table 2 on linear graph paper. For each counting rate (N) the statisticalvariation ± N should be included as an error bar on the graph. Using the detectorgeometry, your graph and activity rate of 22Na, estimate the expected coincidences andcompare with data. Where do you see the most activity? Does it make sense?
c. What causes the few counts or background on the far sides of the peak at very largeangles? Why don’t these counts go to 0 even when you can no longer connect a straight linebetween them? Explain (and if you don’t know, ask Julien).

INSTRUCTOR NOTES
REFERENCESP. Quittner, Gamma Spectroscopy, Halsted Press. (1972).
H. L. Andrews, Radiation Biophysics, Prentice-Hall, Englewood Cliffs, NJ (1974).
V. Arena, Ionizing Radiation and Life, The C. V. Mosby Co., St. Louis, MO (1971).
W. Mann and S. Garfinkel, Radioactivity and Its Measurement, Van Nostrand-Reinhold, NY(1966).
C. M. i ederer, J. M. Hollander, and 1. Perlman, Table of Isotopes, 6th ed., Wiley, NY(1967).
C. E. Crouthamel, Applied Gamma-Ray Spectrometry,Pergamon, NY (1960).
A. C. Melissinos, Experiments in Modern Physics, Academic, New York, NY (1966).
BACKGROUND Positron Sources
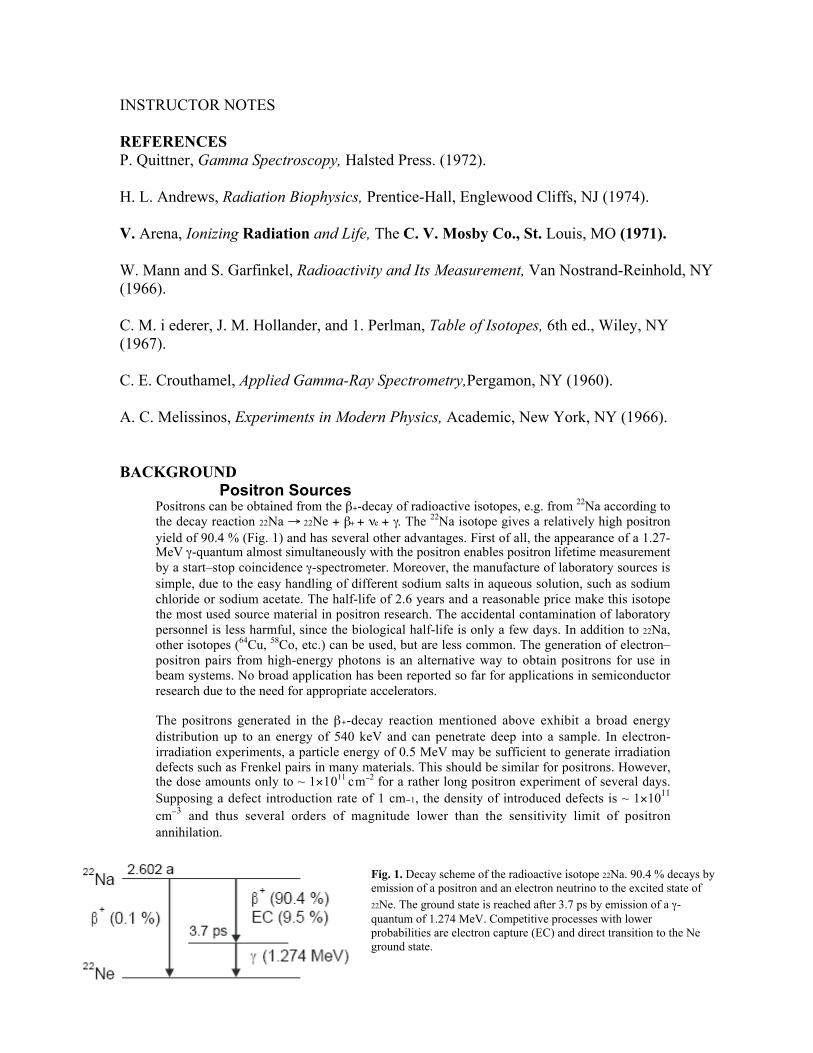
Positrons can be obtained from the β+-decay of radioactive isotopes, e.g. from 22Na according tothe decay reaction 22Na → 22Ne + β+ + νe + γ. The 22Na isotope gives a relatively high positronyield of 90.4 % (Fig. 1) and has several other advantages. First of all, the appearance of a 1.27-MeV γ-quantum almost simultaneously with the positron enables positron lifetime measurementby a start–stop coincidence γ-spectrometer. Moreover, the manufacture of laboratory sources issimple, due to the easy handling of different sodium salts in aqueous solution, such as sodiumchloride or sodium acetate. The half-life of 2.6 years and a reasonable price make this isotopethe most used source material in positron research. The accidental contamination of laboratorypersonnel is less harmful, since the biological half-life is only a few days. In addition to 22Na,other isotopes (64Cu, 58Co, etc.) can be used, but are less common. The generation of electron–positron pairs from high-energy photons is an alternative way to obtain positrons for use inbeam systems. No broad application has been reported so far for applications in semiconductorresearch due to the need for appropriate accelerators.
The positrons generated in the β+-decay reaction mentioned above exhibit a broad energydistribution up to an energy of 540 keV and can penetrate deep into a sample. In electron-irradiation experiments, a particle energy of 0.5 MeV may be sufficient to generate irradiationdefects such as Frenkel pairs in many materials. This should be similar for positrons. However,the dose amounts only to ~ 1×10¹¹
cm−2 for a rather long positron experiment of several days.
Supposing a defect introduction rate of 1 cm−1, the density of introduced defects is ~ 1×10¹¹
cm−3 and thus several orders of magnitude lower than the sensitivity limit of positron
annihilation.
Fig. 1. Decay scheme of the radioactive isotope 22Na. 90.4 % decays byemission of a positron and an electron neutrino to the excited state of22Ne. The ground state is reached after 3.7 ps by emission of a γ-quantum of 1.274 MeV. Competitive processes with lowerprobabilities are electron capture (EC) and direct transition to the Neground state.

(from http://www.positronannihilation.net/techniques/Positron%20Sources.pdf
GAMMA RAYS AND ANNIHILATION
“Gamma rays are also produced in the important process of pair annihilation, inwhich an electron and its antiparticle, a positron, vanish and two photons are created.The photons are emitted in opposite directions and must each carry 511 keV ofenergy—the rest mass energy (see relativistic mass) of the electron and positron.
DETECTION OF GAMMA RAYS (OVERVIEW OF TECHNOLOGY)
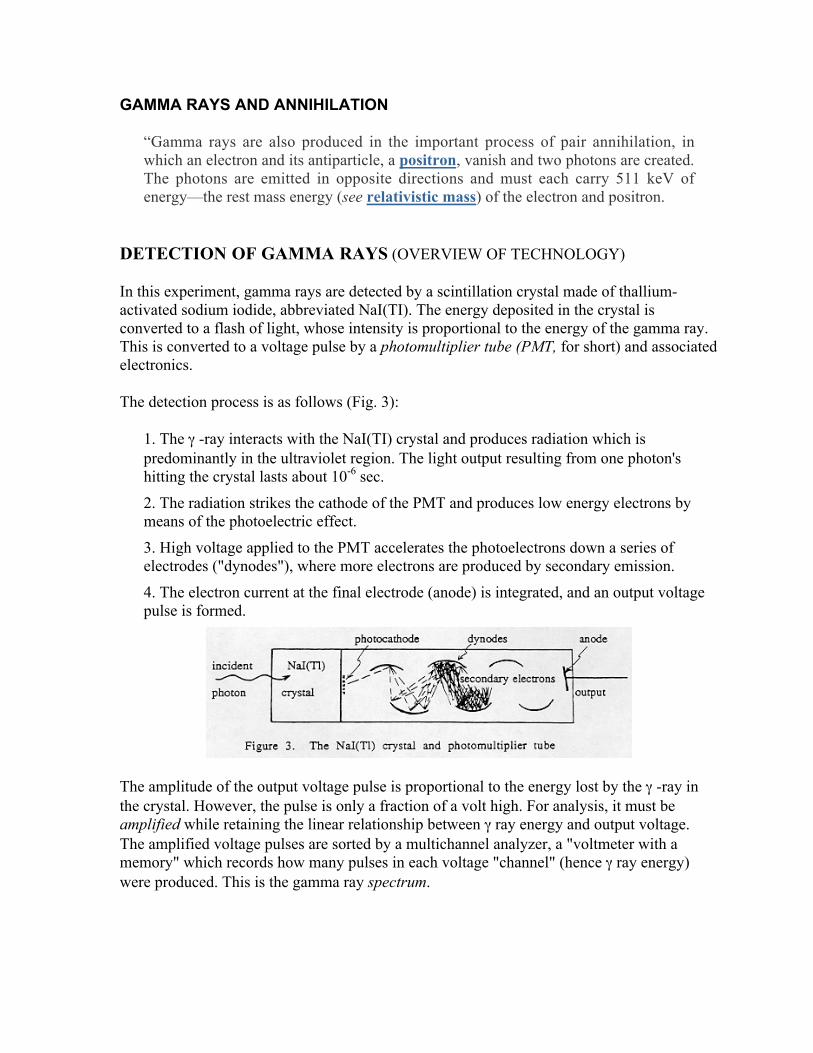
In this experiment, gamma rays are detected by a scintillation crystal made of thallium-activated sodium iodide, abbreviated NaI(TI). The energy deposited in the crystal isconverted to a flash of light, whose intensity is proportional to the energy of the gamma ray.This is converted to a voltage pulse by a photomultiplier tube (PMT, for short) and associatedelectronics.
The detection process is as follows (Fig. 3):
1. The γ -ray interacts with the NaI(TI) crystal and produces radiation which ispredominantly in the ultraviolet region. The light output resulting from one photon'shitting the crystal lasts about 10-6 sec.
2. The radiation strikes the cathode of the PMT and produces low energy electrons bymeans of the photoelectric effect.
3. High voltage applied to the PMT accelerates the photoelectrons down a series ofelectrodes ("dynodes"), where more electrons are produced by secondary emission.
4. The electron current at the final electrode (anode) is integrated, and an output voltagepulse is formed.
The amplitude of the output voltage pulse is proportional to the energy lost by the γ -ray inthe crystal. However, the pulse is only a fraction of a volt high. For analysis, it must beamplified while retaining the linear relationship between γ ray energy and output voltage.The amplified voltage pulses are sorted by a multichannel analyzer, a "voltmeter with amemory" which records how many pulses in each voltage "channel" (hence γ ray energy)were produced. This is the gamma ray spectrum.
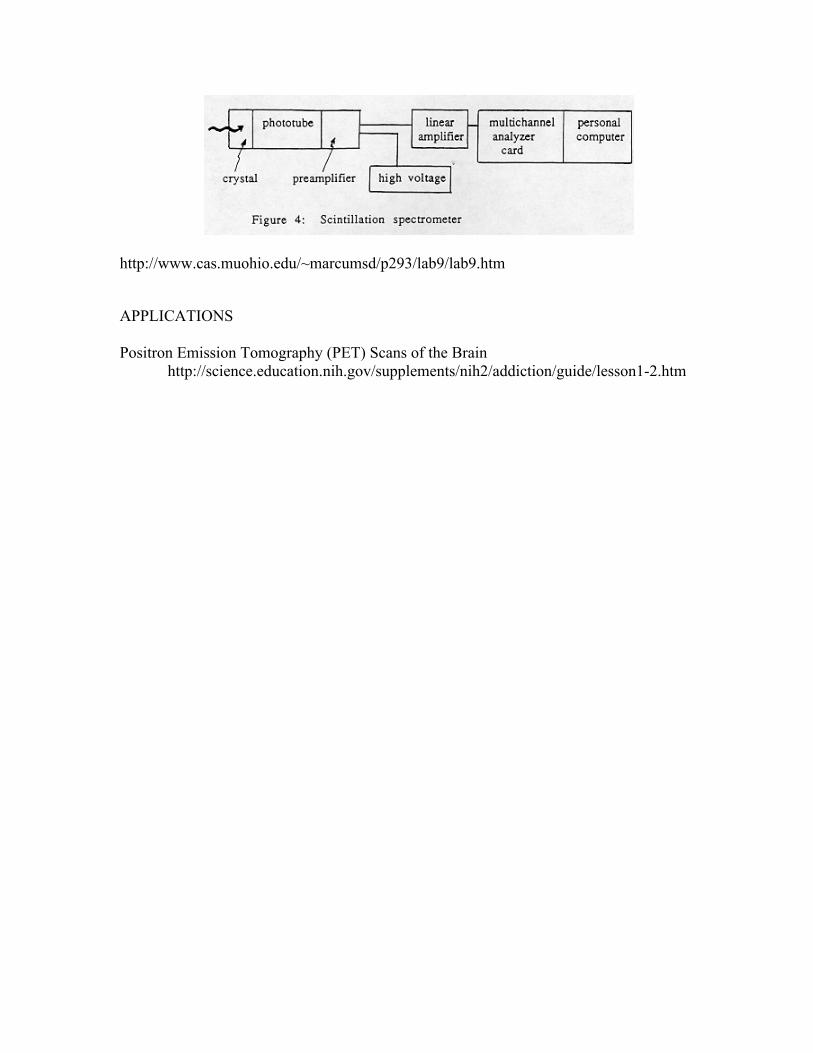
http://www.cas.muohio.edu/~marcumsd/p293/lab9/lab9.htm
APPLICATIONS
Positron Emission Tomography (PET) Scans of the Brainhttp://science.education.nih.gov/supplements/nih2/addiction/guide/lesson1-2.htm