Embed Size (px)
Citation preview

ESPECTROMETRÍA GAMMAESPECTROMETRÍA GAMMA
J.L. Gutierrez-Villanueva ([email protected])J.L. Gutierrez-Villanueva ([email protected])
Departamento de Ciencias Médicas y QuirúrgicasDepartamento de Ciencias Médicas y Quirúrgicas
GRUPO RADÓNGRUPO RADÓN
Universidad de CantabriaUniversidad de Cantabria
Santander, SPAINSantander, SPAIN
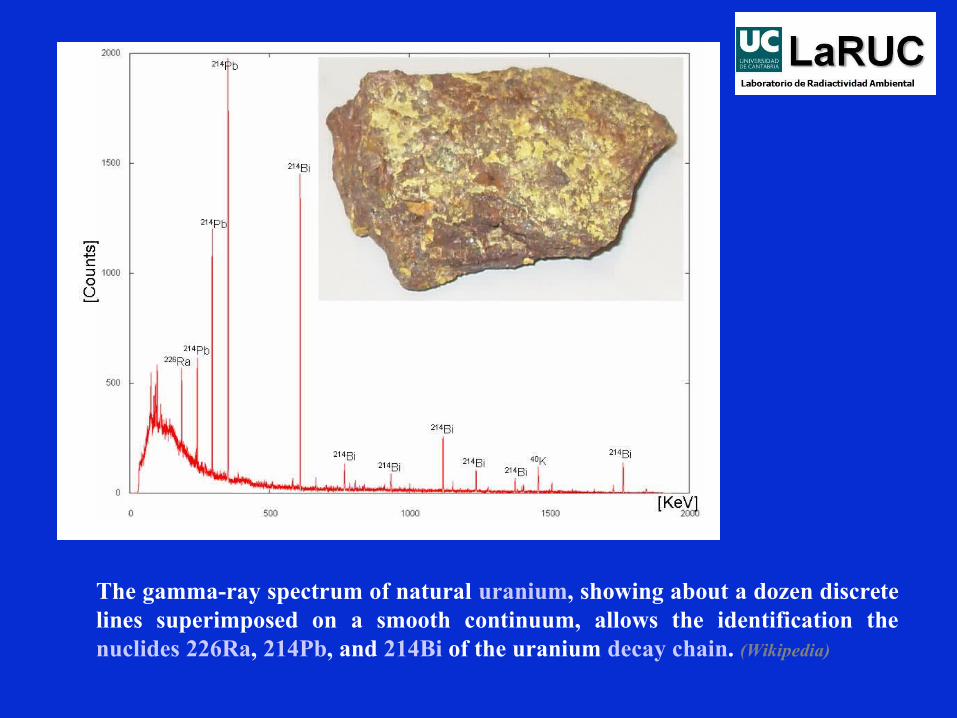
The gamma-ray spectrum of natural uranium, showing about a dozen discrete lines superimposed on a smooth continuum, allows the identification the nuclides 226Ra, 214Pb, and 214Bi of the uranium decay chain. (Wikipedia)
1. Introduction
2. Interaction of radiation with matter
3. Detection system
4. Examples: steel factories and natural radioactivity
5. Practical activity
6. Activity: “One minute paper”
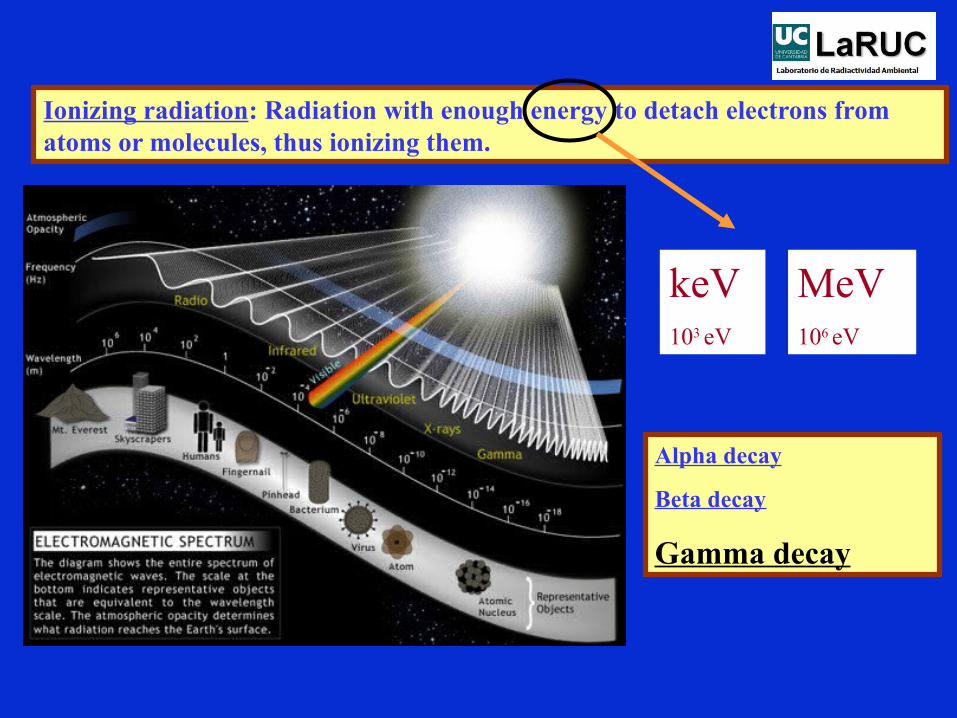
Ionizing radiation: Radiation with enough energy to detach electrons from atoms or molecules, thus ionizing them.
keV103 eV
MeV106 eV
Alpha decay
Beta decay
Gamma decay
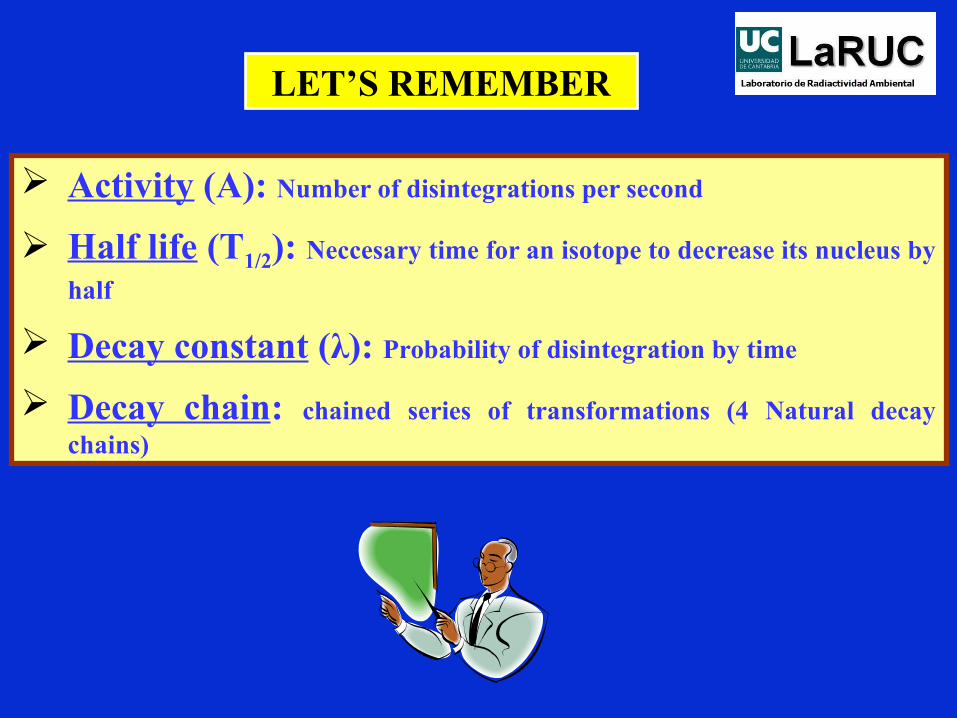
LET’S REMEMBER
Activity (A): Number of disintegrations per second
Half life (T1/2): Neccesary time for an isotope to decrease its nucleus by
half
Decay constant (λ): Probability of disintegration by time
Decay chain: chained series of transformations (4 Natural decay chains)
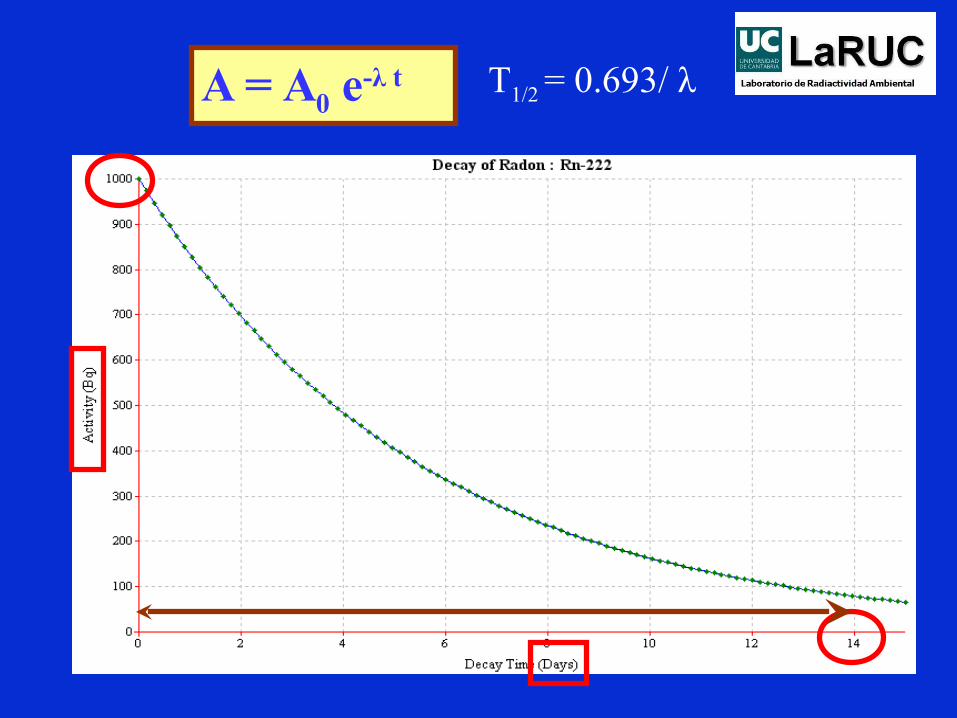
T1/2 = 0.693/ λA = A0 e-λ t
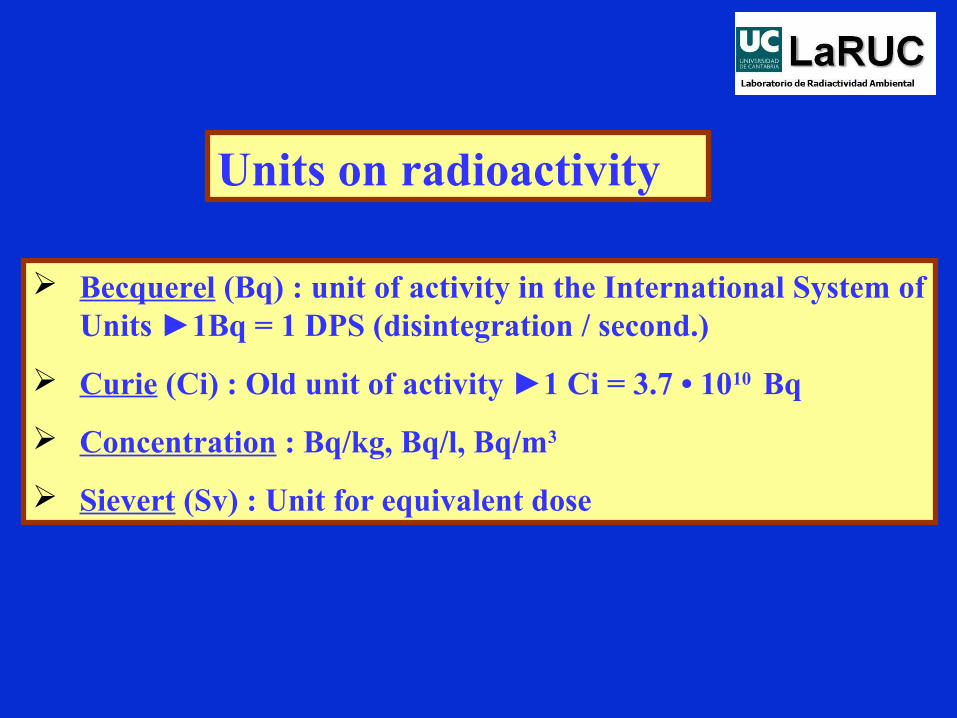
Units on radioactivity
Becquerel (Bq) : unit of activity in the International System of Units ►1Bq = 1 DPS (disintegration / second.)
Curie (Ci) : Old unit of activity ►1 Ci = 3.7 • 1010 Bq
Concentration : Bq/kg, Bq/l, Bq/m3
Sievert (Sv) : Unit for equivalent dose

Gammna decay: Photon’s emission by a nucleus when reaching steady state of energy.
Gamma line is the fingerprint of a radionuclide
One radionuclide can have several gamma lines with different probabilities and different energies
X Rays Gamma Rays (with different energies)
Gamma rays = Nucleus
X Rays = Atomic crust
Interaction of radiation (photon) with matter (detection’s material)

1. Introduction
2. Interaction of radiation with matter
3. Detection system
4. Examples: steel factories and natural radioactivity
5. Practical activity
6. Activity: “One minute paper”

INTERACTION OF RADIATION WITH MATTER

• Charged particles, for example, alpha and beta particles, produce a signal within a detector by ionization and excitation of the detector material directly.
• Gamma photons are uncharged and consequently cannot do this
• Gamma-ray detection depends upon other types of interaction which transfer the gamma-ray energy to electrons within the detector material
• Excited electrons charge and lose their energy by ionization and excitation of the atoms of the detector medium, giving rise to many electron–hole pairs
• The absorption coefficient for gamma radiation in gases is low and all practical gamma ray detectors depend upon interaction with a solid
• The electron–hole pairs can be collected and presented as an electrical signal.
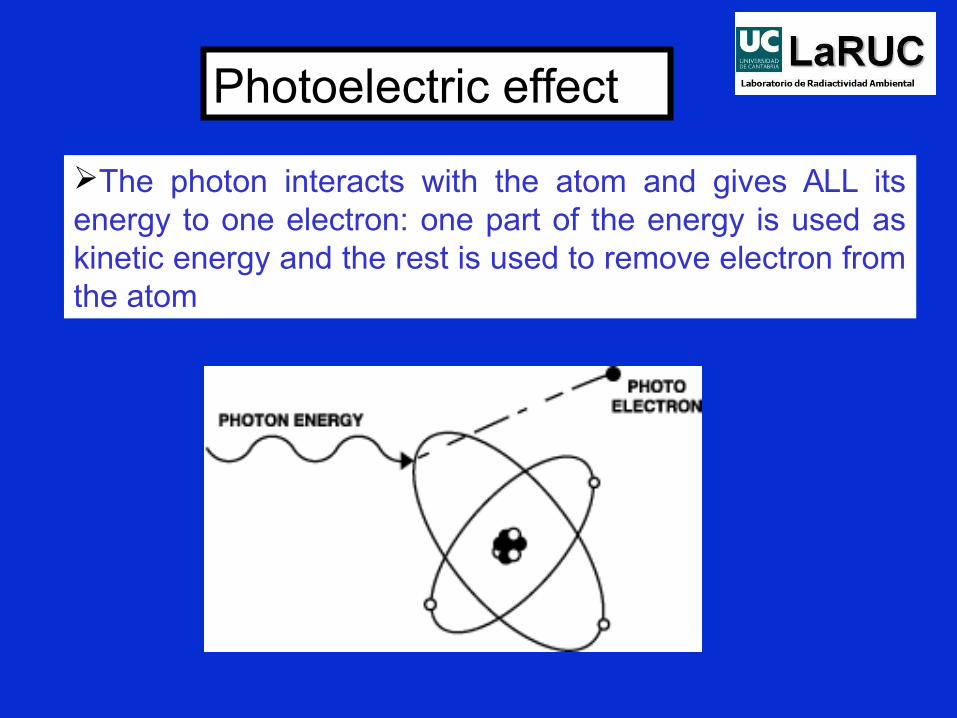
Photoelectric effect
The photon interacts with the atom and gives ALL its energy to one electron: one part of the energy is used as kinetic energy and the rest is used to remove electron from the atom
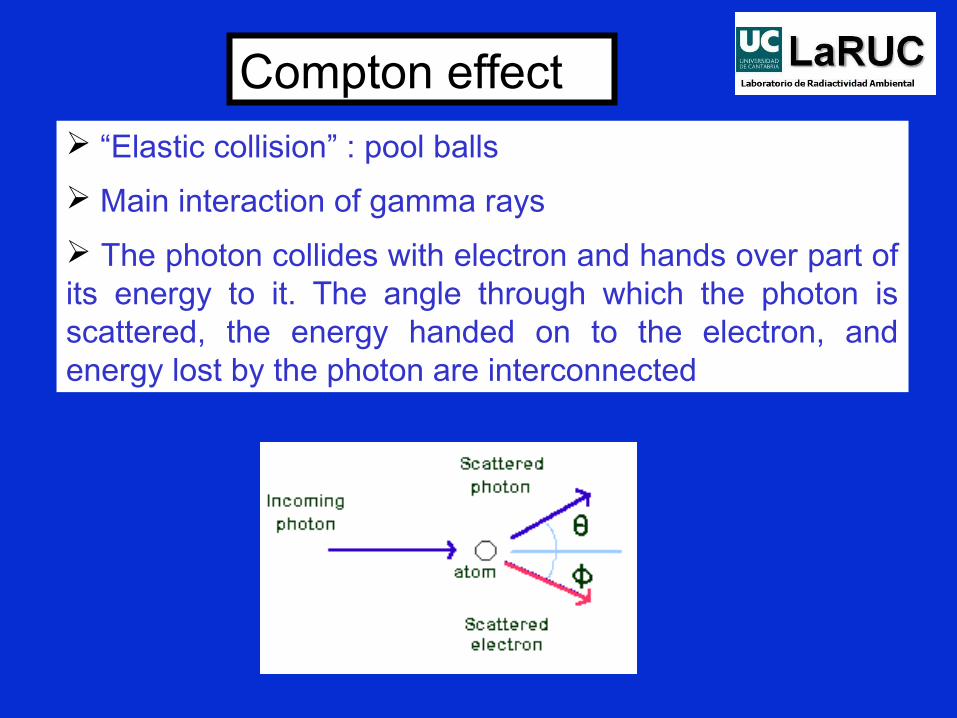
Compton effect “Elastic collision” : pool balls
Main interaction of gamma rays
The photon collides with electron and hands over part of its energy to it. The angle through which the photon is scattered, the energy handed on to the electron, and energy lost by the photon are interconnected
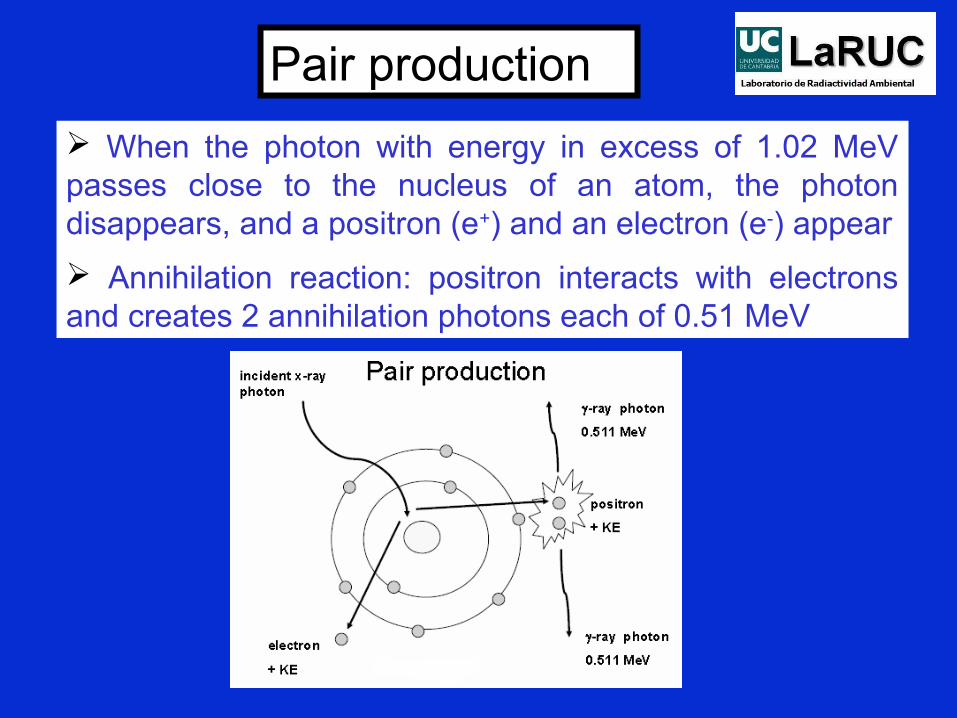
Pair production
When the photon with energy in excess of 1.02 MeV passes close to the nucleus of an atom, the photon disappears, and a positron (e+) and an electron (e-) appear
Annihilation reaction: positron interacts with electrons and creates 2 annihilation photons each of 0.51 MeV

Photoelectric interactions are dominant at low energy
Pair production at high energy
Compton scattering being most important in the mid-energy range
In practice, evidence of pair production is only seen within a gamma-ray spectrum when the energy is rather more than 1022 keV

Counts to appear in the spectrum above the full energy peak (apart from the natural background): due to random summing(sometimes referred to as pile-up), determined by the statistical probability of two gamma-rays being detected at the same time and therefore on the sample count rate
The most troublesome photoelectric interactions will be those with the shielding, usually lead. There is a significant possibility that this fluorescent X-ray may escape the shielding and that it will be detected by the detector. The result will be a number of X-ray peaks in the gamma spectrum in the region 70–85 keV: problems for low energy measurements (solve with Cd and Cu)
The normal geometric arrangement of source–detector shielding means that most gamma-rays are scattered through a large angle by the shielding: backscattering (difficult to solve)
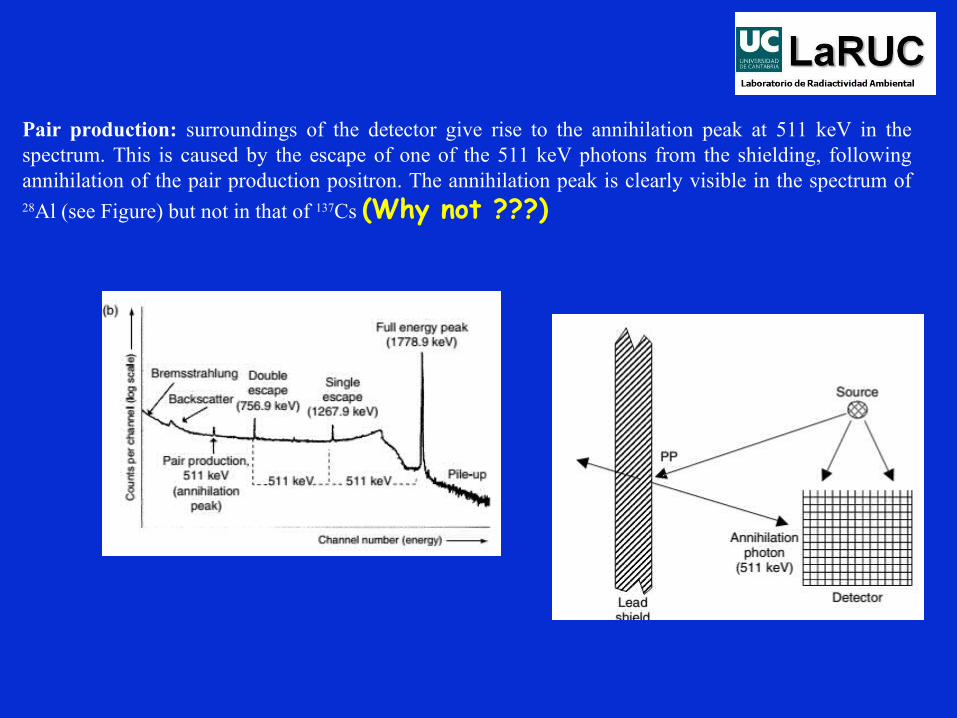
Pair production: surroundings of the detector give rise to the annihilation peak at 511 keV in the spectrum. This is caused by the escape of one of the 511 keV photons from the shielding, following annihilation of the pair production positron. The annihilation peak is clearly visible in the spectrum of 28Al (see Figure) but not in that of 137Cs (Why not ???)
1. Introduction
2. Interaction of radiation with matter
3. Detection system
4. Examples: steel factories and natural radioactivity
5. Practical activity
6. Activity: “One minute paper”
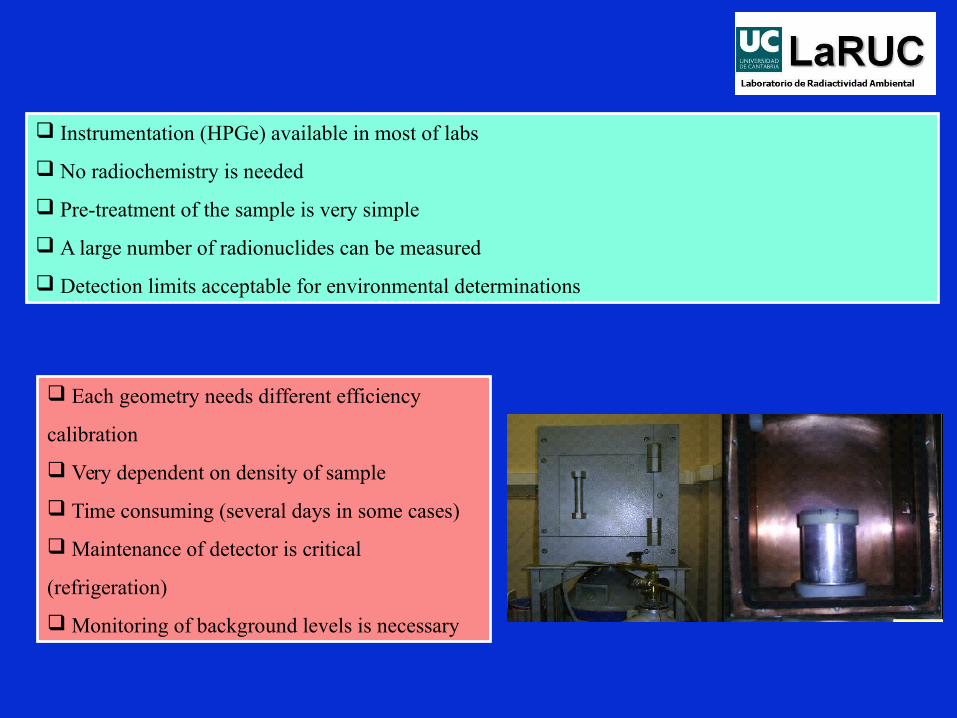
Instrumentation (HPGe) available in most of labs
No radiochemistry is needed
Pre-treatment of the sample is very simple
A large number of radionuclides can be measured
Detection limits acceptable for environmental determinations
Each geometry needs different efficiency
calibration
Very dependent on density of sample
Time consuming (several days in some cases)
Maintenance of detector is critical
(refrigeration)
Monitoring of background levels is necessary
PRACTICAL POINTS
• Gamma spectrometry using germanium detectors is the best technique for identifying and quantifying radionuclides. This is due to the very sharply defined and characteristic energies of gamma-rays which are produced by the great majority of radionuclides.
• There are a small number of ‘pure beta emitters’, which do not emit gamma radiation. These cannot be identified by gamma spectrometry (3H, 14C, 90Sr).
• X-ray energies will tell you the element present, but not which isotope.
• Decay schemes give vital information on whether gammas are in ‘cascade’. This has great significance in true coincidence summing.

DETECTION SYSTEM
PROPERTIES OF AN IDEAL DETECTOR FOR GAMMA SPECTROMETRY.
• output proportional to gamma-ray energy;• good efficiency, i.e. high absorption coefficient, highZ;• easy mechanism for collecting the detector signal;• good energy resolution;• good stability over time, temperature and operating
parameters;• reasonable cost;• reasonable size
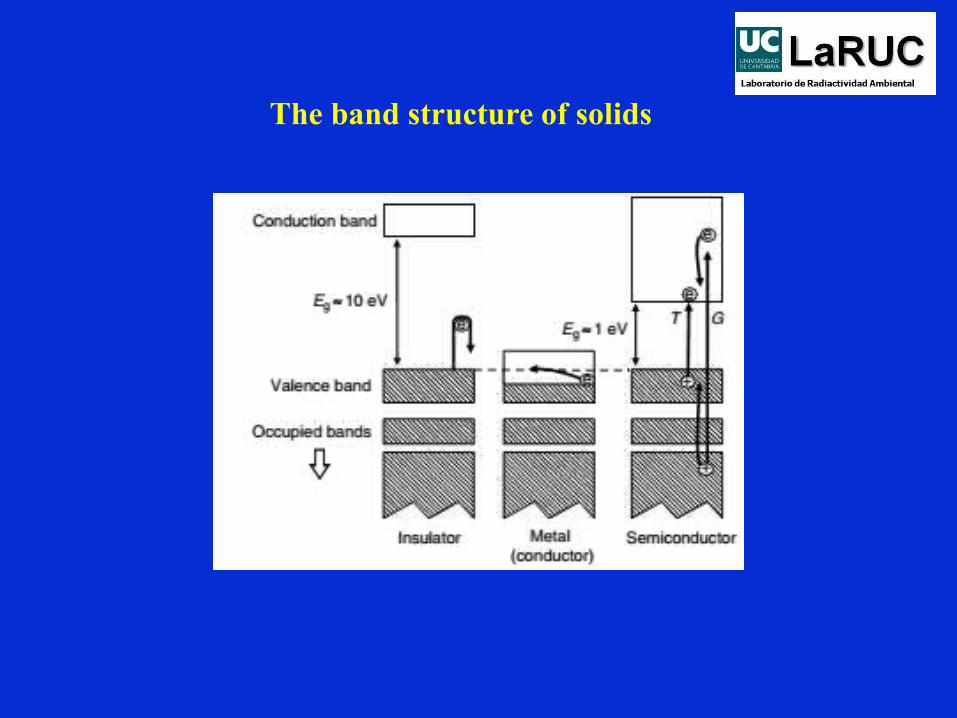
The band structure of solids
Creation of charge carriers by gamma radiation
The interaction of a gamma-ray with the semiconductor material will produce primary electrons with energies considerably greater than thermal energies
Electric field, carriers will migrate up (electrons) or down (holes) the field gradient.
The number of electron–hole pairs produced, n, will be related directly to the gamma-ray energy absorbed
One important component of the detector resolution is a function of n Avoid trapping centers which can make difficult mobility of carriers: the
detector material must be available, at reasonable cost, with a high purity and as near perfect as possible crystalline state
Suitable semiconductors for gamma-ray detectors
• have as large an absorption coefficient as possible (i.e. high atomic number);
• provide as many electron–hole pairs as possible per unit energy;
• allow good electron and hole mobility;• be available in high purity as near perfect single
crystals;• be available in reasonable amounts at reasonable
cost.
HPGe type p and n
A semiconductor material containing equal numbers of electrons and holes is described as an intrinsic semiconductor.
acceptor impurities when distributed throughout the semiconductor material give rise to extra energy states just above the valence band, called acceptor states. Germanium with this type of impurity would be called p-type germanium (‘p’ for positive acceptor impurities)
The impurity atom is a donor atom sitting in a donor site, it will introduce donor states just below the conduction band. Germanium with such impurities is n-type germanium (‘n’ for negative donor impurities).
The p-type material has an excess of holes and the n-type an excess of electrons.


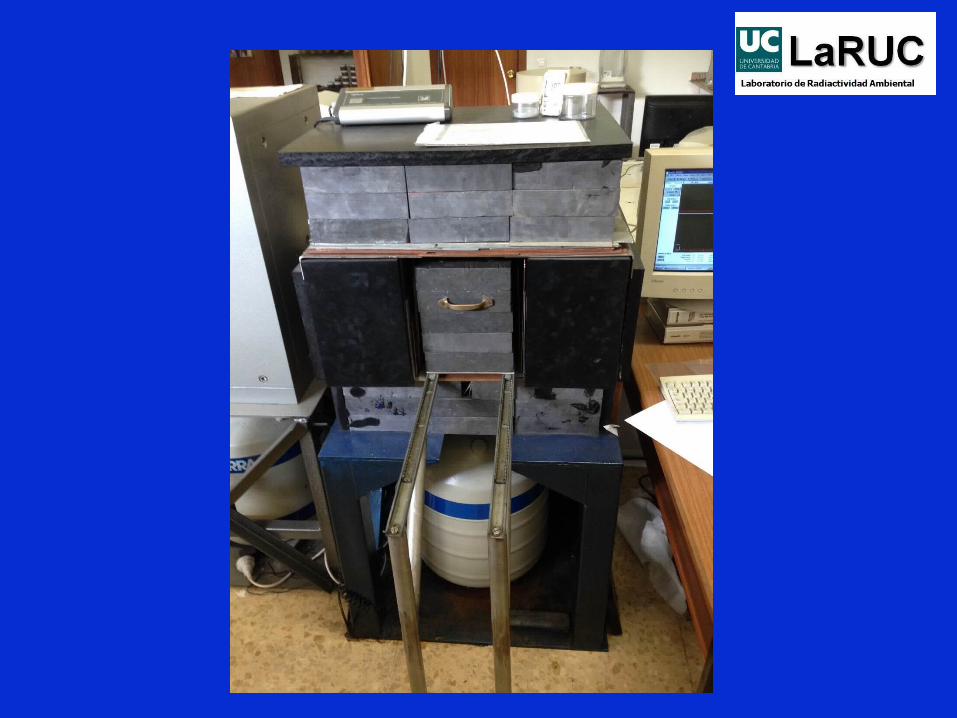
GERMANIUM DETECTORS ARE OPERATED AT LOW TEMPERATURE IN ORDER TO REDUCE ELECTRONIC NOISE AND THEREBY ACHIEVE AS HIGH A RESOLUTION AS POSSIBLE
The most common means of providing a suitably low temperature is cooling with liquid nitrogen (boiling point 77 K).

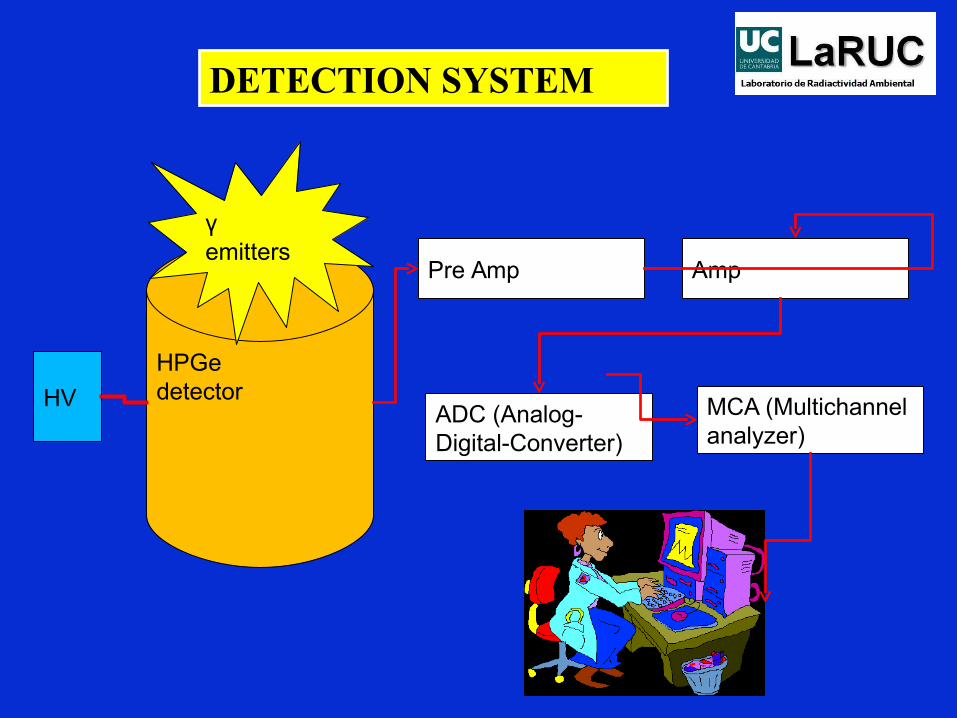
DETECTION SYSTEM
HPGe detectorHV
γ emitters
Pre Amp Amp
ADC (Analog-Digital-Converter)
MCA (Multichannel analyzer)

El detector genera una señal proporcional a la energía emitida por la fuente.
El equipo acumula en cada canal el número de emisiones de una determinada energía.
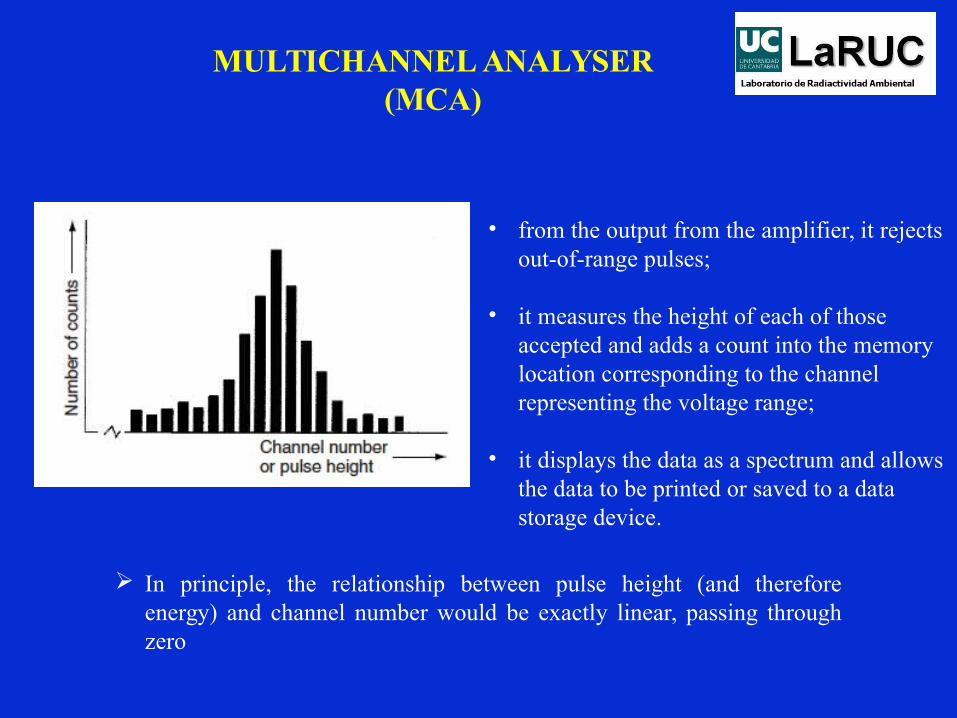
MULTICHANNEL ANALYSER(MCA)
• from the output from the amplifier, it rejects out-of-range pulses;
• it measures the height of each of those accepted and adds a count into the memory location corresponding to the channel representing the voltage range;
• it displays the data as a spectrum and allows the data to be printed or saved to a data storage device.
In principle, the relationship between pulse height (and therefore energy) and channel number would be exactly linear, passing through zero
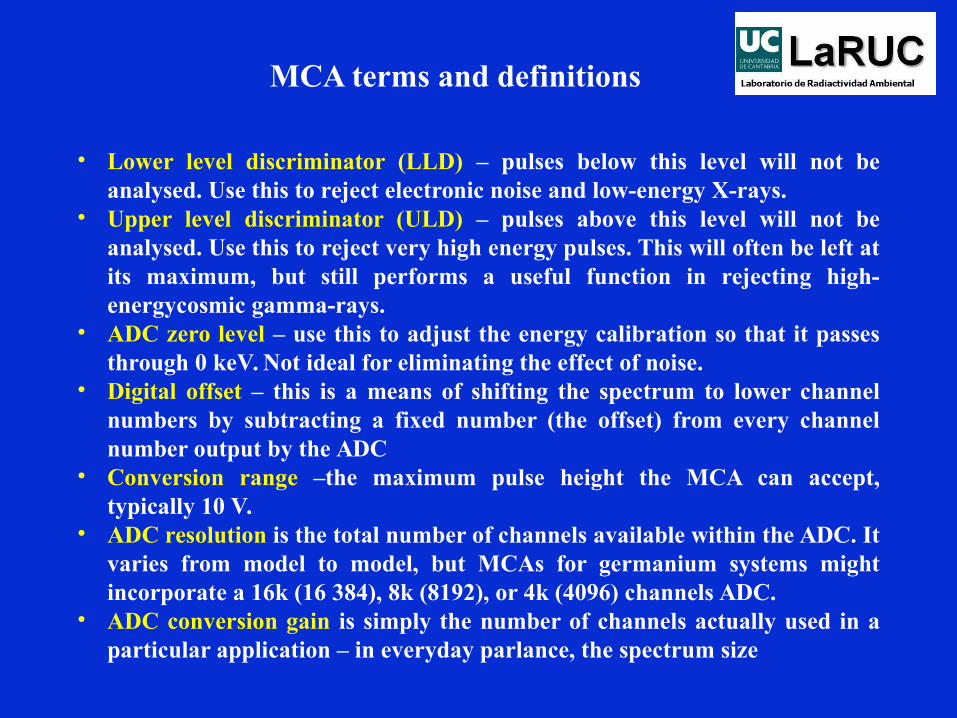
• Lower level discriminator (LLD) – pulses below this level will not be analysed. Use this to reject electronic noise and low-energy X-rays.
• Upper level discriminator (ULD) – pulses above this level will not be analysed. Use this to reject very high energy pulses. This will often be left at its maximum, but still performs a useful function in rejecting high-energycosmic gamma-rays.
• ADC zero level – use this to adjust the energy calibration so that it passes through 0 keV. Not ideal for eliminating the effect of noise.
• Digital offset – this is a means of shifting the spectrum to lower channel numbers by subtracting a fixed number (the offset) from every channel number output by the ADC
• Conversion range –the maximum pulse height the MCA can accept, typically 10 V.
• ADC resolution is the total number of channels available within the ADC. It varies from model to model, but MCAs for germanium systems might incorporate a 16k (16 384), 8k (8192), or 4k (4096) channels ADC.
• ADC conversion gain is simply the number of channels actually used in a particular application – in everyday parlance, the spectrum size
MCA terms and definitions
PROCESO DE MEDIDA: GEOMETRÍAS, PATRONES Y CALIBRACIONES

• El patrón debe tener la misma geometría que la muestra a medir, la fuente radiactiva debe estar distribuida uniformemente en el patrón
• La posición de la muestra frente al detector deber ser fija, se precisan centradores.
• El programa determina la presencia de isótopos en función de la posición que ocupan en la pantalla del analizador (Energía), los desplazamientos del espectro, debidos a variaciones térmicas, pueden falsear los resultados. Es preciso realizar verificaciones periódicas.

Fuente de calibración
• Densidad similar a la muestra a medir (prensado de viruta de plomo).
• El patrón radiactivo debe estar distribuido uniformemente en todo el volumen. De ésta forma la autoabsorción será similar al caso de las muestras medidas en el laboratorio.
• Se mantiene la geometría mediante un centrador

EJEMPLOS DE GEOMETRÍAS
Marinelli

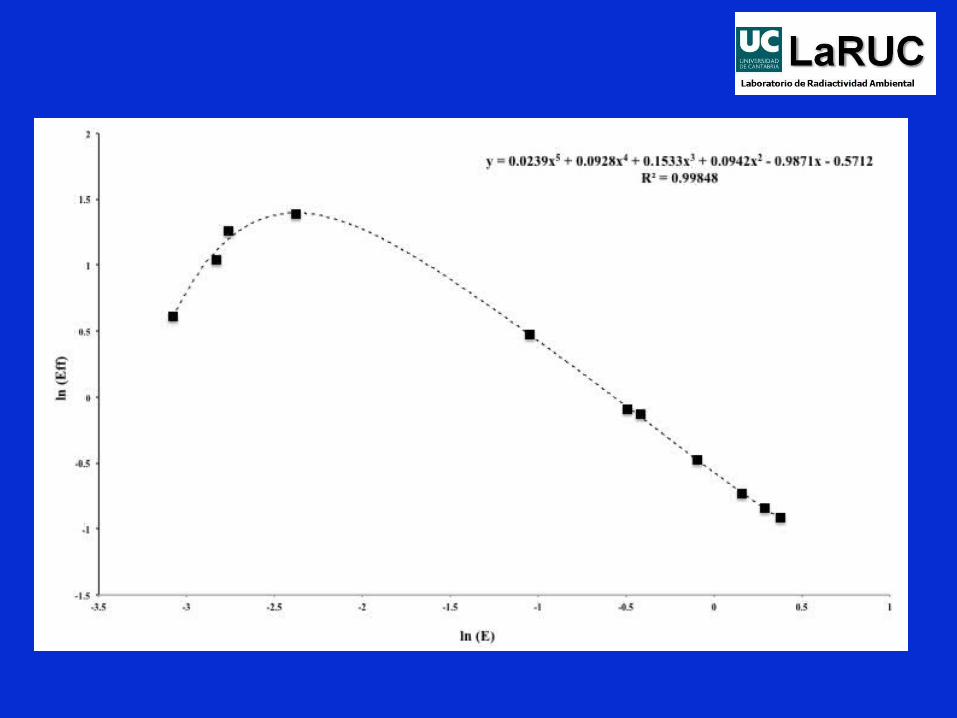
• La respuesta del detector no es lineal frente a la energía.• Es preciso realizar una calibración Eficiencia/Energía
Efic
ienc
ia
Energía
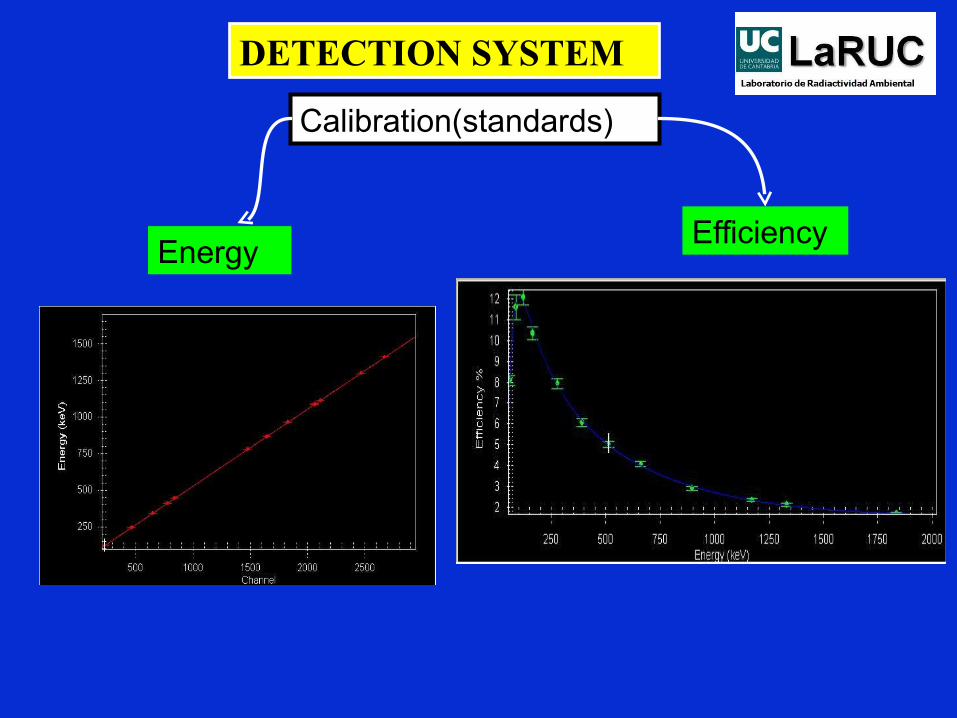
DETECTION SYSTEM
Calibration(standards)
EnergyEfficiency

Energy calibration
The object of energy calibration is to derive a relationship between peak position in the spectrum and the corresponding gamma-ray energy
Energy calibration is accomplished by measuring the spectrum of a source emitting gamma-rays of precisely known energy and comparing the measured peak position with energy. It matters not whether the source contains a single nuclide or several nuclides: 152Eu source for routine energy calibration
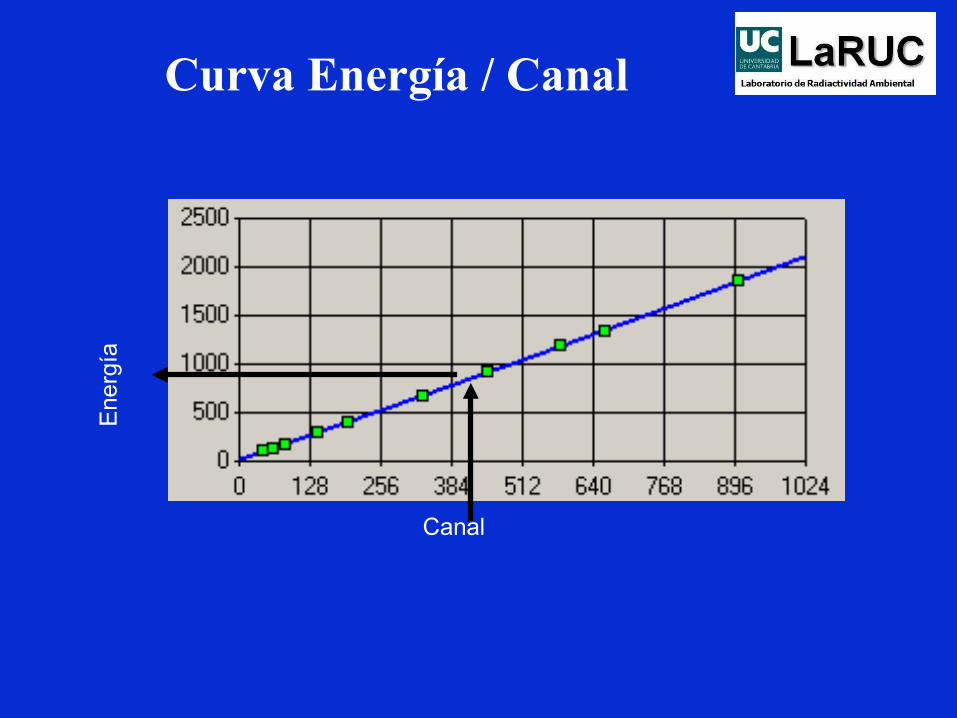
Curva Energía / Canal
Canal
Ene
rgía
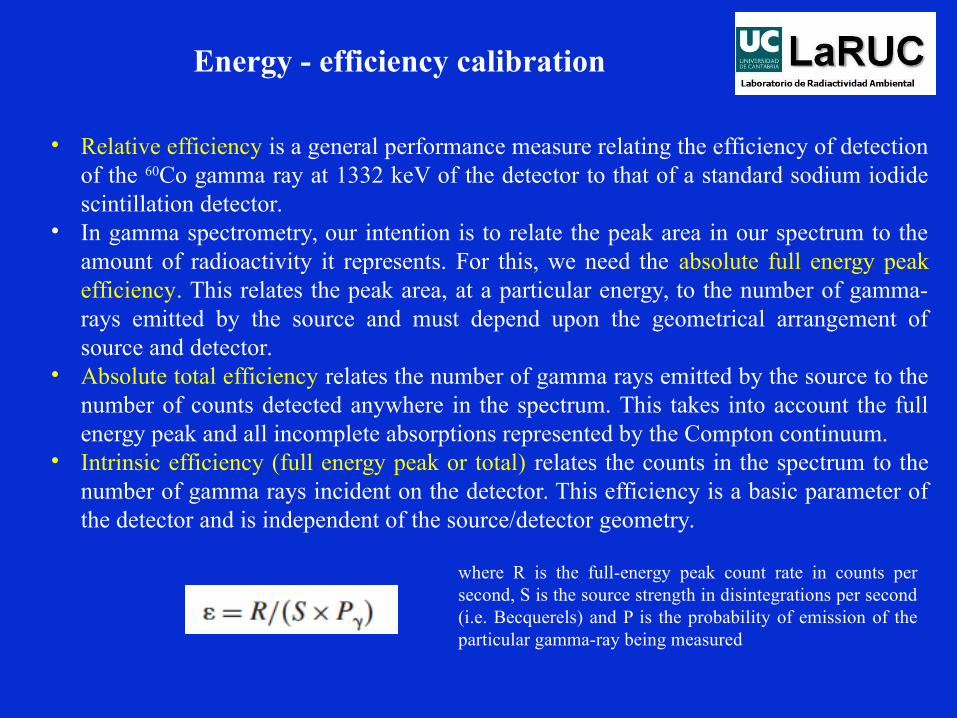
Energy - efficiency calibration
• Relative efficiency is a general performance measure relating the efficiency of detection of the 60Co gamma ray at 1332 keV of the detector to that of a standard sodium iodide scintillation detector.
• In gamma spectrometry, our intention is to relate the peak area in our spectrum to the amount of radioactivity it represents. For this, we need the absolute full energy peak efficiency. This relates the peak area, at a particular energy, to the number of gamma-rays emitted by the source and must depend upon the geometrical arrangement of source and detector.
• Absolute total efficiency relates the number of gamma rays emitted by the source to the number of counts detected anywhere in the spectrum. This takes into account the full energy peak and all incomplete absorptions represented by the Compton continuum.
• Intrinsic efficiency (full energy peak or total) relates the counts in the spectrum to the number of gamma rays incident on the detector. This efficiency is a basic parameter of the detector and is independent of the source/detector geometry.
where R is the full-energy peak count rate in counts per second, S is the source strength in disintegrations per second (i.e. Becquerels) and P is the probability of emission of the particular gamma-ray being measured

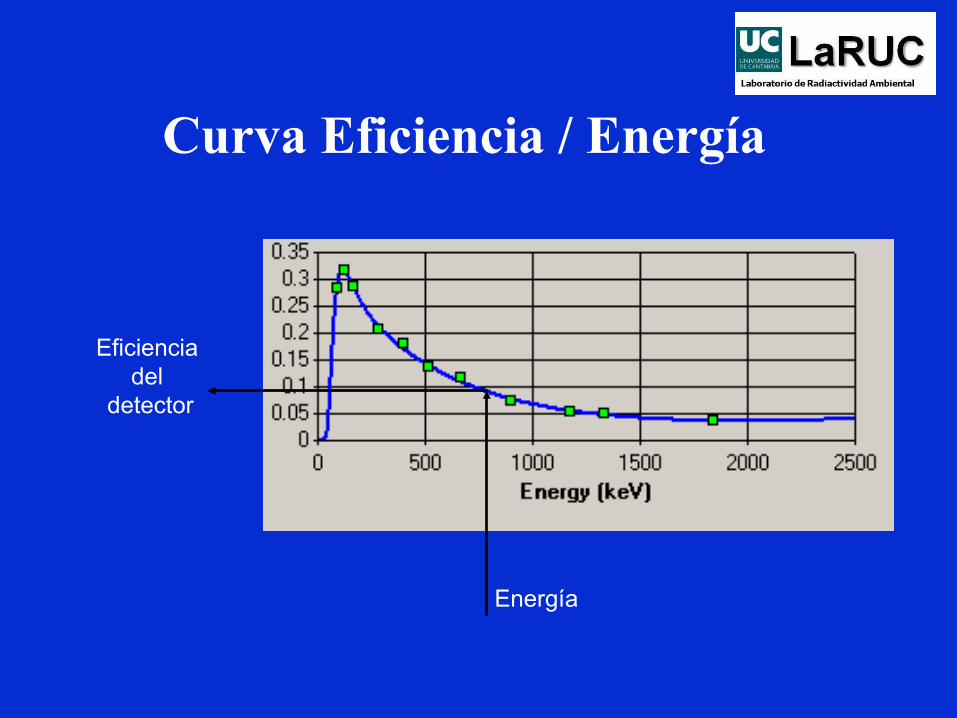
Curva Eficiencia / Energía
Energía
Eficiencia del
detector
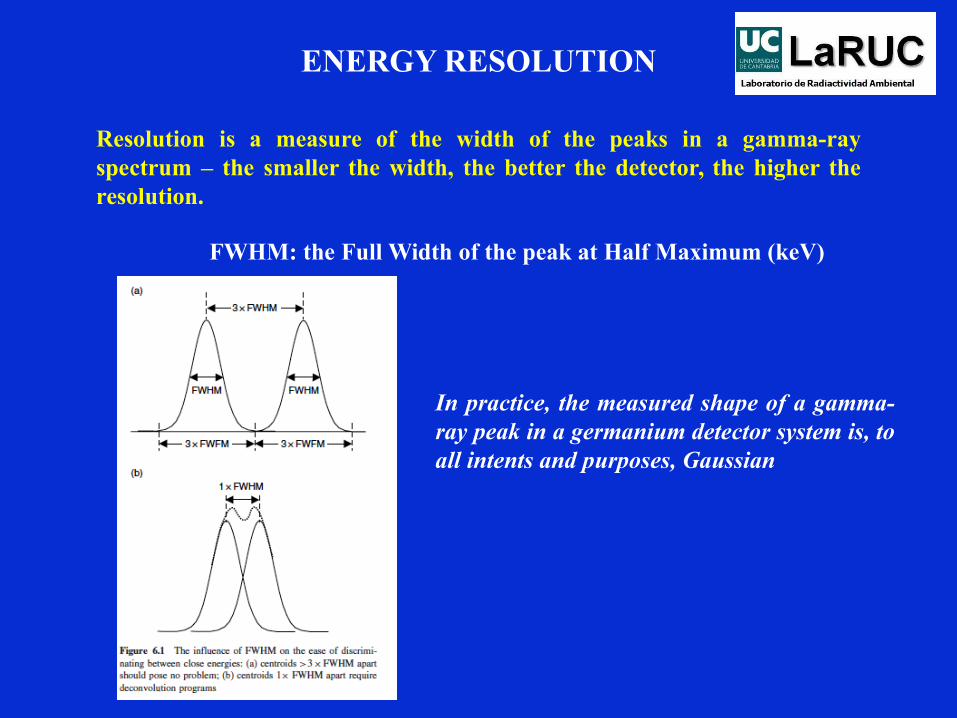
ENERGY RESOLUTION
Resolution is a measure of the width of the peaks in a gamma-ray spectrum – the smaller the width, the better the detector, the higher the resolution.
FWHM: the Full Width of the peak at Half Maximum (keV)
In practice, the measured shape of a gamma-ray peak in a germanium detector system is, to all intents and purposes, Gaussian
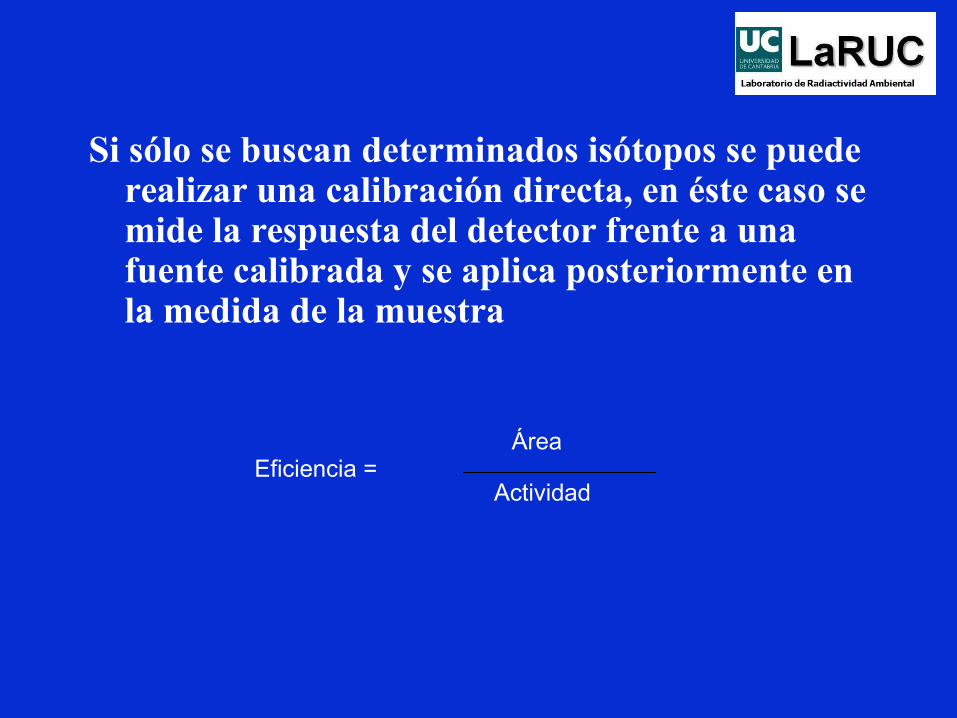
Si sólo se buscan determinados isótopos se puede realizar una calibración directa, en éste caso se mide la respuesta del detector frente a una fuente calibrada y se aplica posteriormente en la medida de la muestra
Eficiencia =Área
Actividad
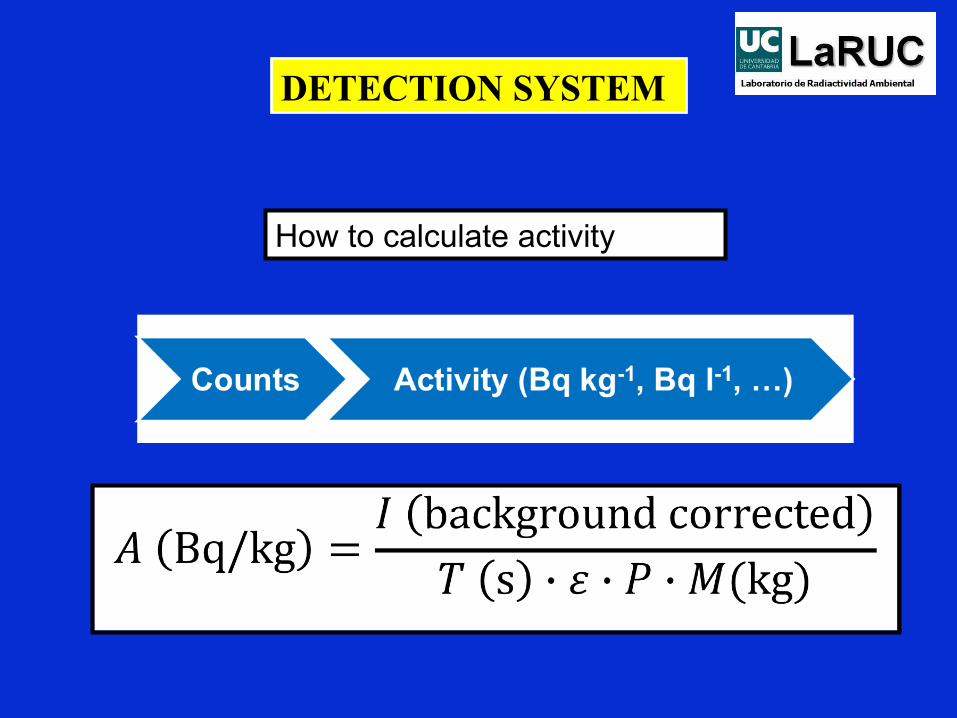
DETECTION SYSTEM
How to calculate activity

Let’s remember some statistics …
The binomial distribution
In principle, the statistics of radioactive decay are binomial in nature. If we were to toss a handful of coins onto a table and then examine the arrangement, we would find coins in one of two dispositions – heads up or tails up. Similarly, if we could prepare a radioactive source and, during a particular period of time, monitor each individual atom we would see that each has only one of two possible fates – to decay or not decay
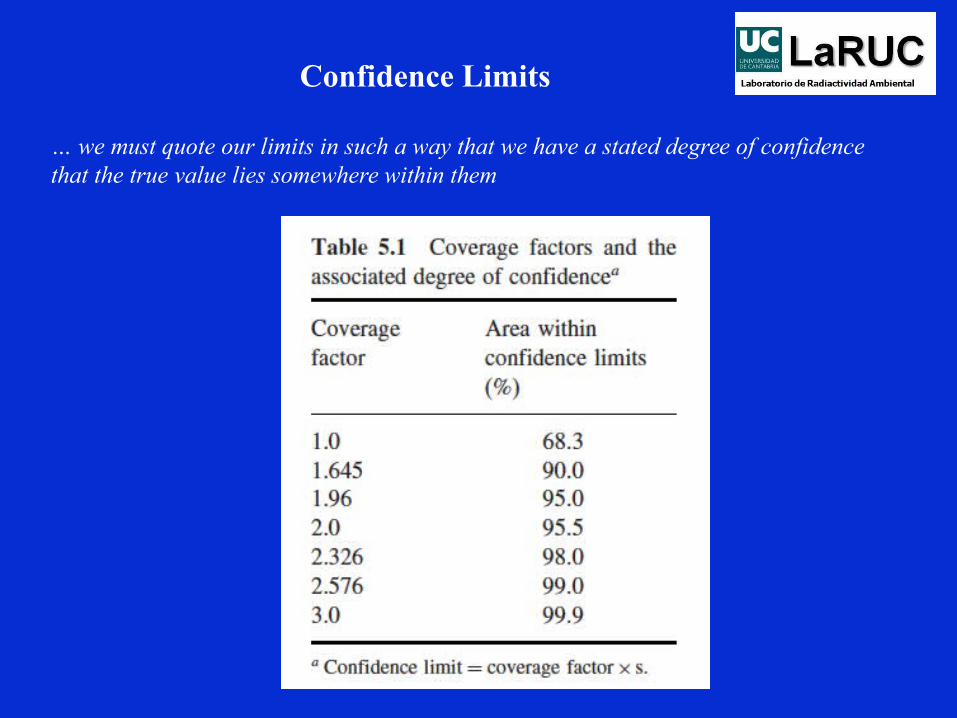
Confidence Limits
… we must quote our limits in such a way that we have a stated degree of confidence that the true value lies somewhere within them
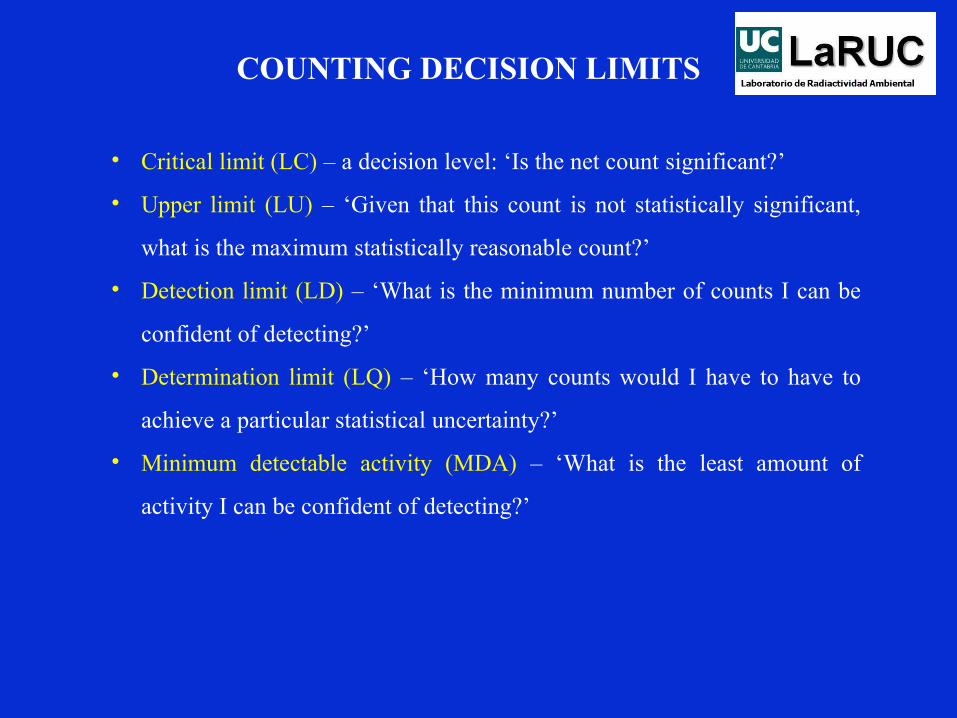
COUNTING DECISION LIMITS
• Critical limit (LC) – a decision level: ‘Is the net count significant?’
• Upper limit (LU) – ‘Given that this count is not statistically significant,
what is the maximum statistically reasonable count?’
• Detection limit (LD) – ‘What is the minimum number of counts I can be
confident of detecting?’
• Determination limit (LQ) – ‘How many counts would I have to have to
achieve a particular statistical uncertainty?’
• Minimum detectable activity (MDA) – ‘What is the least amount of
activity I can be confident of detecting?’
1. Introduction
2. Interaction of radiation with matter
3. Detection system
4. Examples: steel factories and natural
radioactivity
5. Practical activity
6. Activity: “One minute paper”
EJEMPLO: ACERÍAS
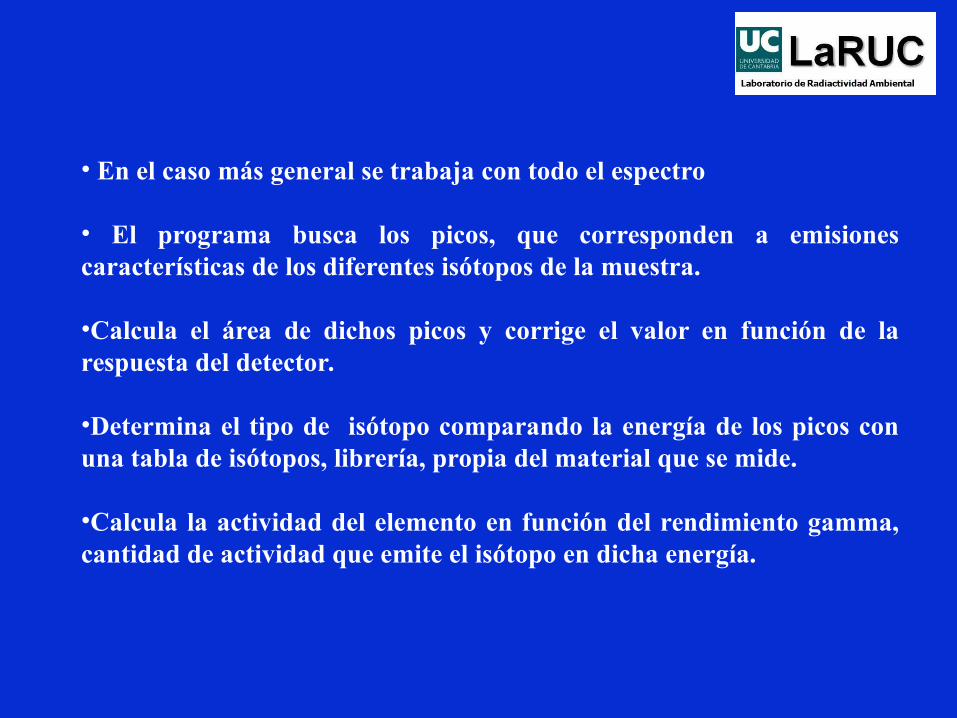
• En el caso más general se trabaja con todo el espectro
• El programa busca los picos, que corresponden a emisiones características de los diferentes isótopos de la muestra. •Calcula el área de dichos picos y corrige el valor en función de la respuesta del detector. •Determina el tipo de isótopo comparando la energía de los picos con una tabla de isótopos, librería, propia del material que se mide. •Calcula la actividad del elemento en función del rendimiento gamma, cantidad de actividad que emite el isótopo en dicha energía.
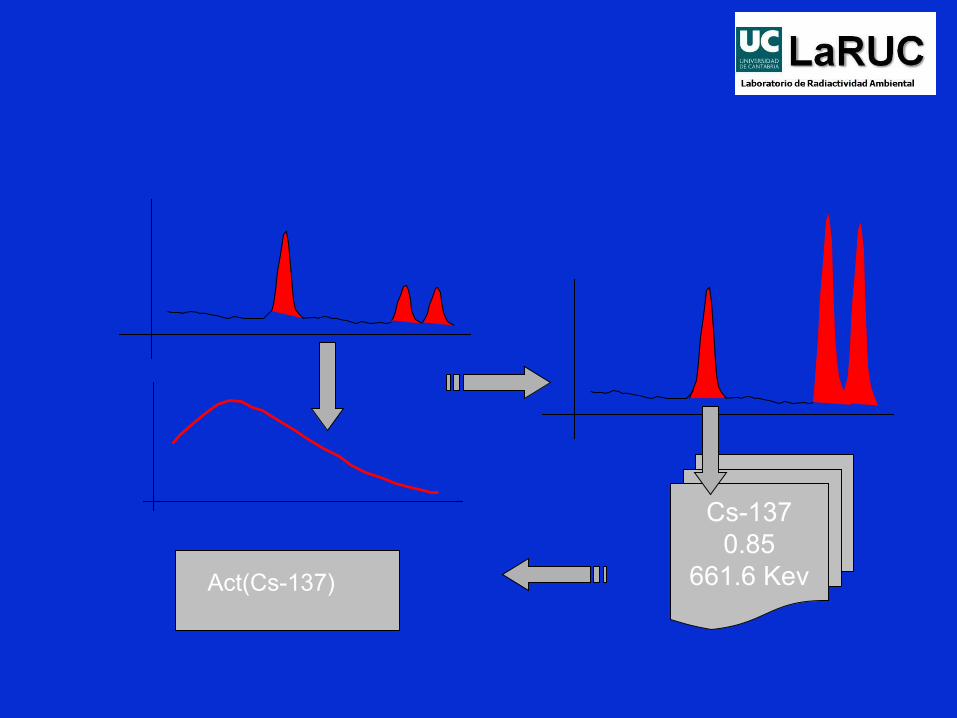
Cs-1370.85
661.6 KevAct(Cs-137)
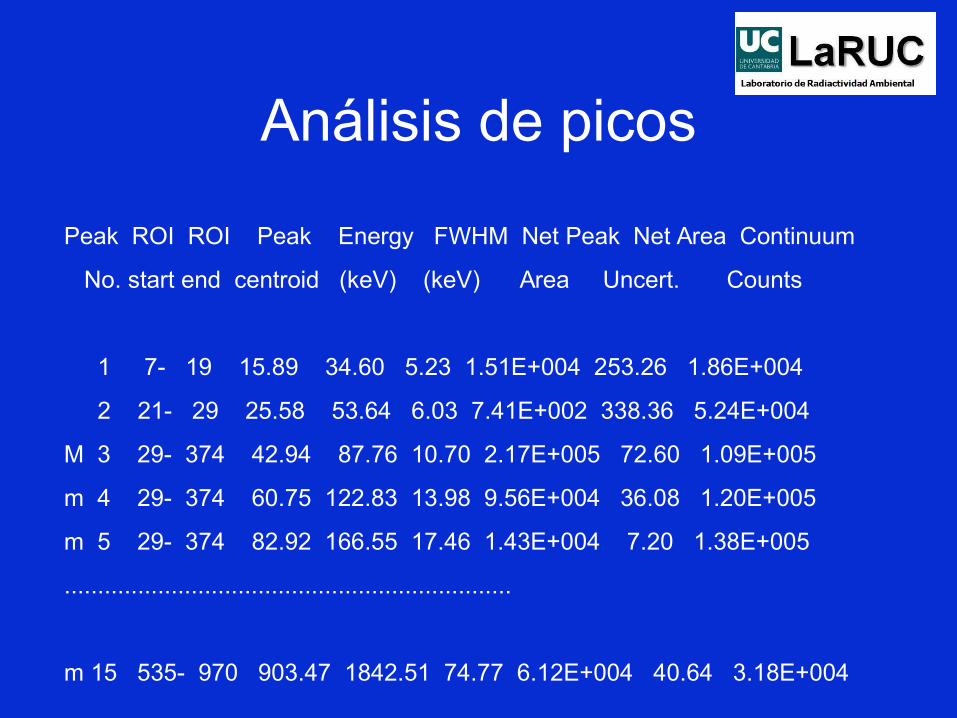
Análisis de picos
Peak ROI ROI Peak Energy FWHM Net Peak Net Area Continuum
No. start end centroid (keV) (keV) Area Uncert. Counts
1 7- 19 15.89 34.60 5.23 1.51E+004 253.26 1.86E+004
2 21- 29 25.58 53.64 6.03 7.41E+002 338.36 5.24E+004
M 3 29- 374 42.94 87.76 10.70 2.17E+005 72.60 1.09E+005
m 4 29- 374 60.75 122.83 13.98 9.56E+004 36.08 1.20E+005
m 5 29- 374 82.92 166.55 17.46 1.43E+004 7.20 1.38E+005
...................................................................
m 15 535- 970 903.47 1842.51 74.77 6.12E+004 40.64 3.18E+004
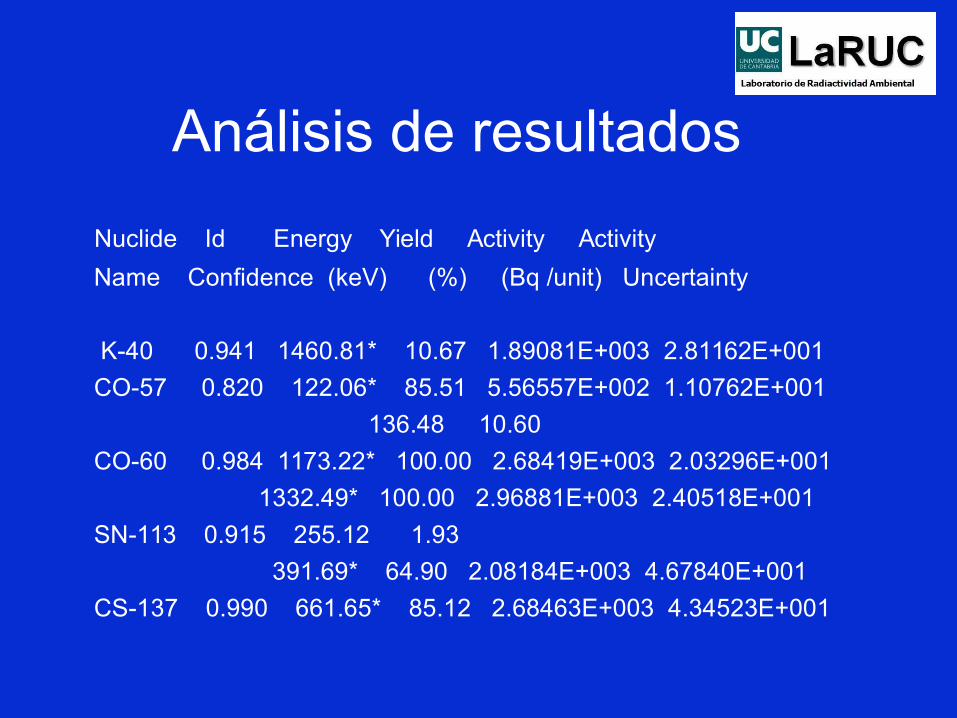
Análisis de resultados
Nuclide Id Energy Yield Activity Activity
Name Confidence (keV) (%) (Bq /unit) Uncertainty
K-40 0.941 1460.81* 10.67 1.89081E+003 2.81162E+001
CO-57 0.820 122.06* 85.51 5.56557E+002 1.10762E+001
136.48 10.60
CO-60 0.984 1173.22* 100.00 2.68419E+003 2.03296E+001
1332.49* 100.00 2.96881E+003 2.40518E+001
SN-113 0.915 255.12 1.93
391.69* 64.90 2.08184E+003 4.67840E+001
CS-137 0.990 661.65* 85.12 2.68463E+003 4.34523E+001
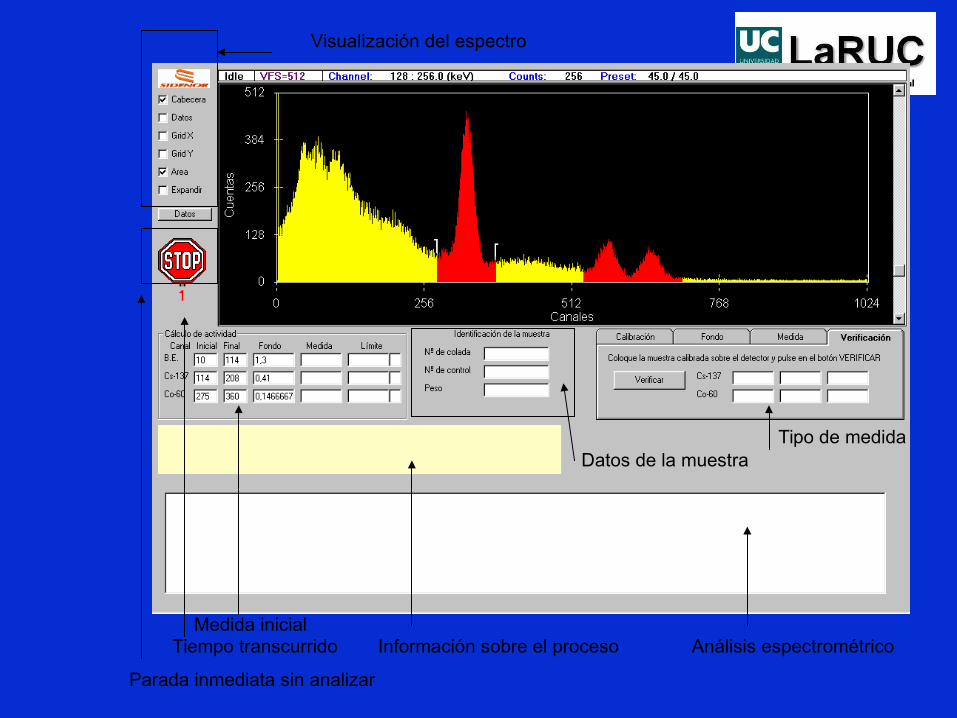
Datos de la muestraTipo de medida
Visualización del espectro
Parada inmediata sin analizar
Información sobre el proceso Análisis espectrométricoMedida inicial
Tiempo transcurrido

Verificación
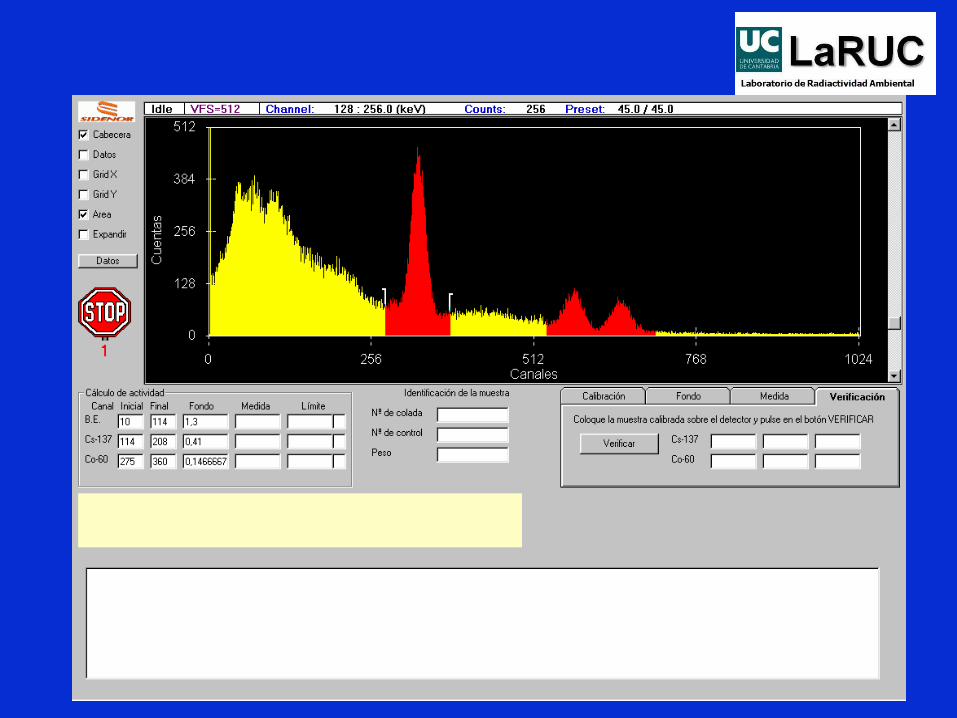
El programa presenta en diferente color las zonas donde deben aparecer los picos de referencia. Si no aparecen en las bandas de color rojo es necesario recalibrar el espectro
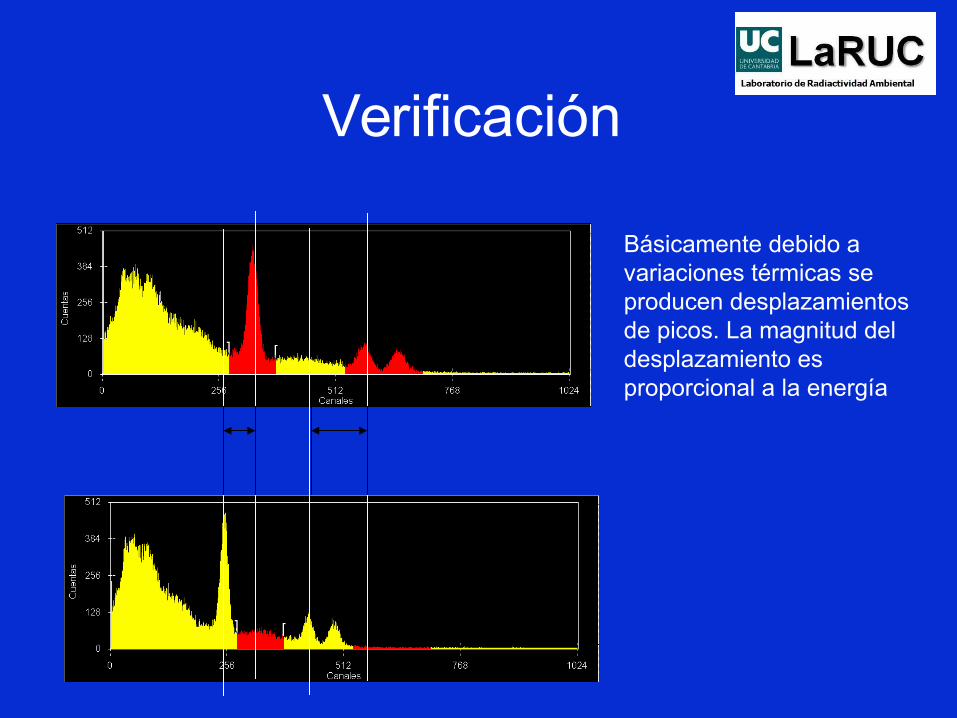
Verificación
Básicamente debido a variaciones térmicas se producen desplazamientos de picos. La magnitud del desplazamiento es proporcional a la energía
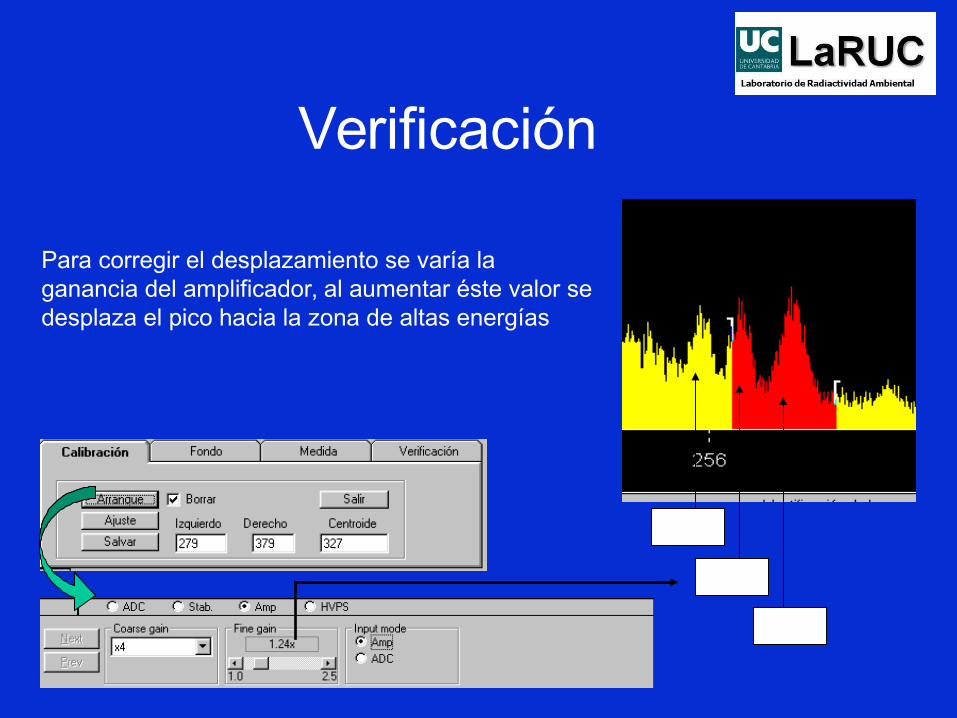
Verificación
1,2
1,4
1,6
Para corregir el desplazamiento se varía la ganancia del amplificador, al aumentar éste valor se desplaza el pico hacia la zona de altas energías
Medida de fondo
Se emplea como valor de referencia para la primera fase de medida.
Se realiza de la misma forma que una medida normal.
El tiempo debe ser mayor que en empleado en una medida de muestras.
Proceso de medida
•Comparación con el fondo
• Medida específica de fondo
• Análisis por espectrometría
• Calibración, una por cada tipo de fuente
• Edición de librerías en función de los isótopos a determinar
• Verificación del sistema, la periodicidad dependerá de las condiciones ambientales del laboratorio.

Análisis inicial
Bajas Energías Cs-137 Co-60
Comparación con el fondo
Determina si el área en las zonas marcadas supera al fondo del equipo en un número determinado de desviaciones estándar.
Si se cumple ésta premisa se realiza una medida por espectrometría.

Medida por espectrometría
• Trabaja con librerías de isótopos específicas que pueden ser modificadas si se precisa.• Necesita una curva de calibración de eficiencias que cubra el rango de medida.• Puede identificar y cuantificar isótopos diferentes de los empleados en la calibración.• Se puede definir la ventana de identificación de cada isótopo para evitar que se asigne la medida a un emisor con una energía próxima al especificado. Calcula límites de detección.

Medida específica de Cs-137
Detector tipo Geigeró plástico
Junta de dilatación
Medida enContinuo
Salida digitalo analógica 0-20 mA
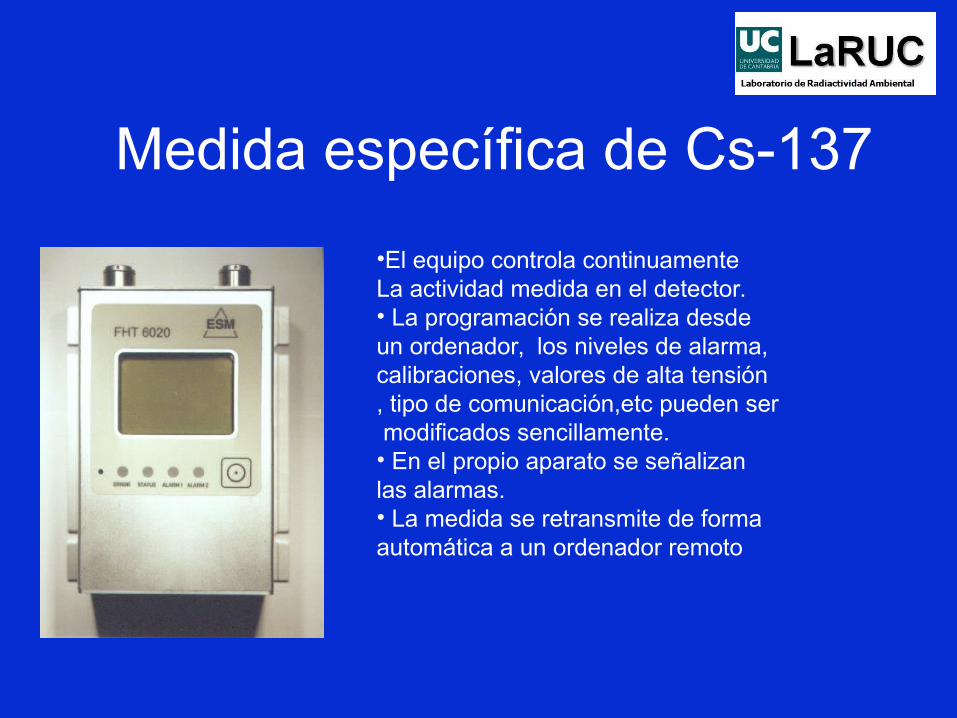
Medida específica de Cs-137
•El equipo controla continuamente La actividad medida en el detector.• La programación se realiza desdeun ordenador, los niveles de alarma,calibraciones, valores de alta tensión, tipo de comunicación,etc pueden ser modificados sencillamente.• En el propio aparato se señalizan las alarmas.• La medida se retransmite de formaautomática a un ordenador remoto

Medida específica de Cs-137
Se puede programar una monitorización continua desde un ordenador para que controle todos los equipos y los nivelesespecíficos de alarma de cada uno de ellos
EJEMPLO: NATURALES
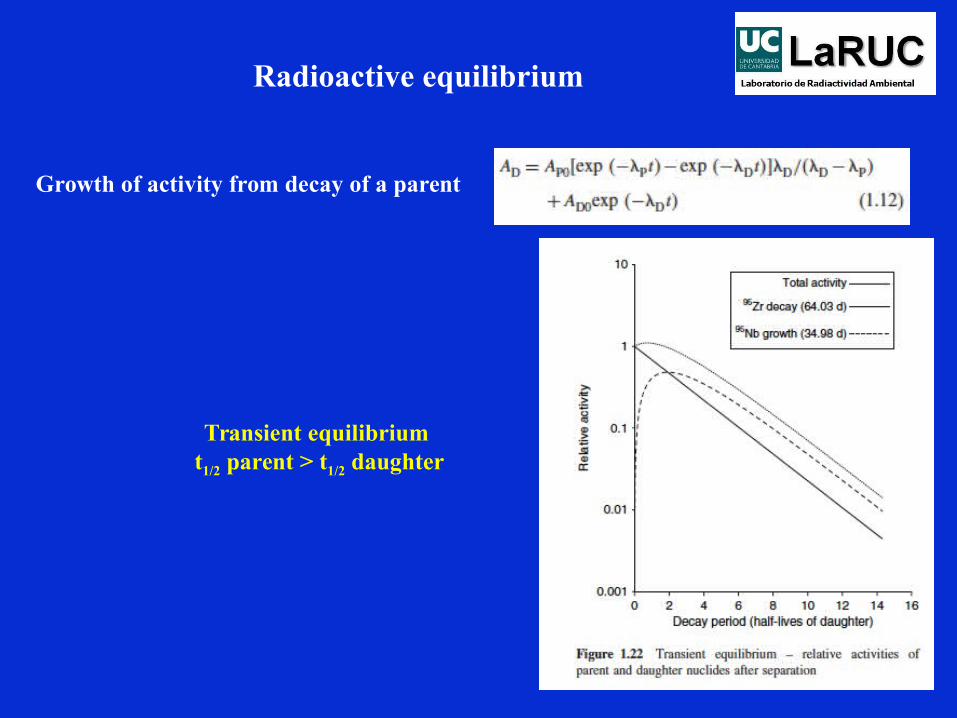
Radioactive equilibrium
Growth of activity from decay of a parent
Transient equilibrium t1/2 parent > t1/2 daughter
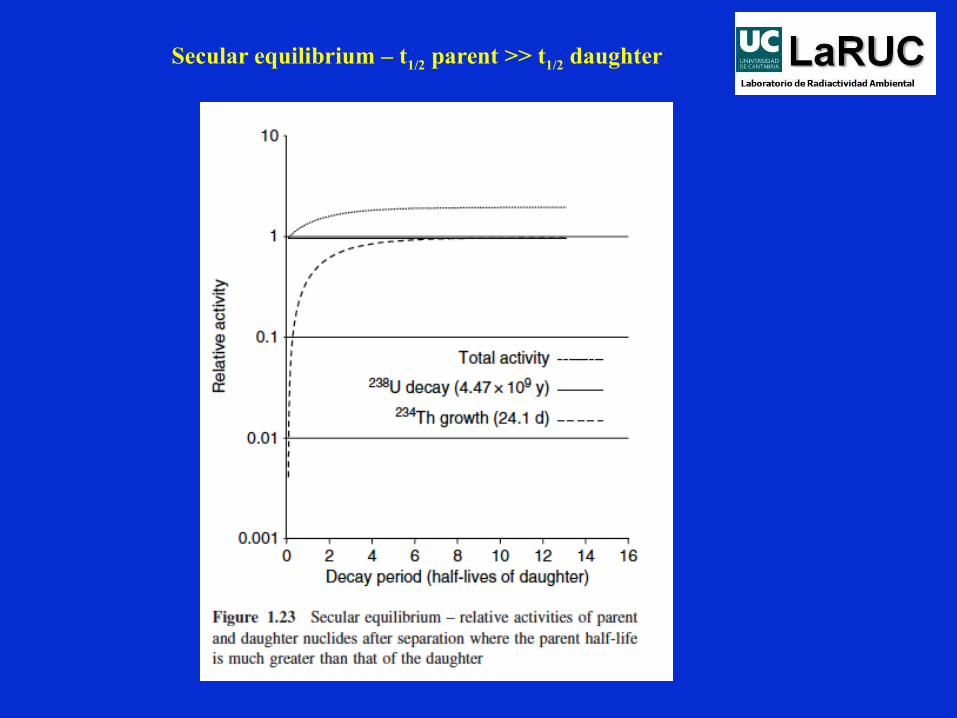
Secular equilibrium – t1/2 parent >> t1/2 daughter
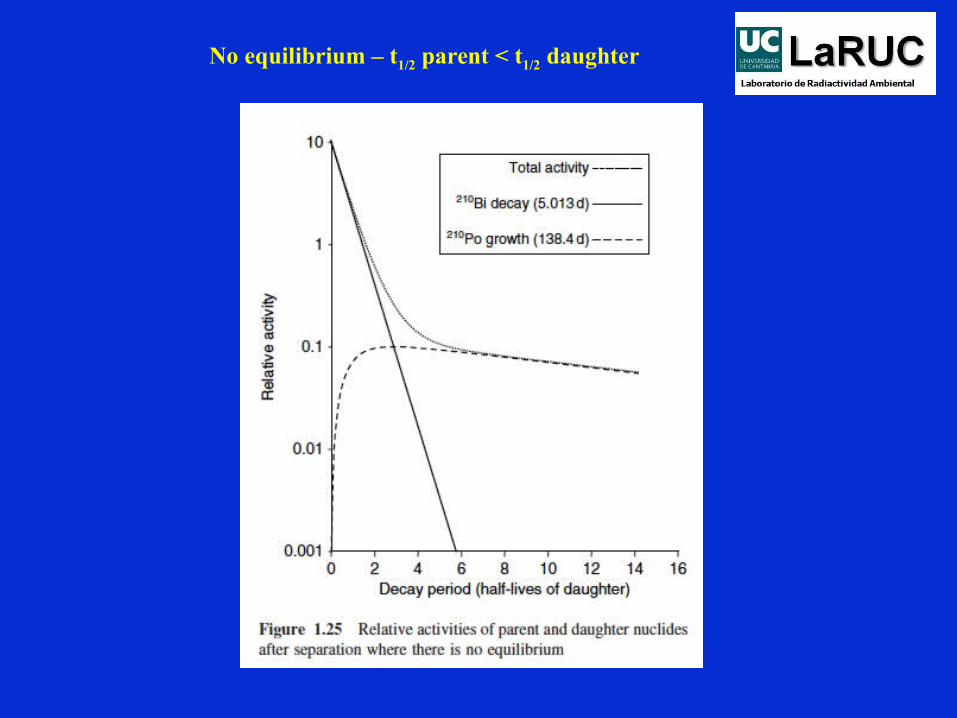
No equilibrium – t1/2 parent < t1/2 daughter


http://www.unscear.org/ (United Nations Scientific Committee on the Effects of Atomic Radiation)
http://www.nndc.bnl.gov/chart/ (Chart of nuclides)
http://www.epa.gov/radon/pubs/citguide.html (A Citizen's Guide to Radon, EPA)
Knoll, G. F. (1989). Radiation Detection and Measurement, 2nd Edn, John Wiley & Sons, Inc., New York, NY, USA.
Currie, L.A. (1968). Limits for qualitative detection and quantitative determination, Anal. Chem., 40, 586–593.
Currie, L.A. (2004). Detection and quantification limits: basic concepts, international harmonization and outstanding (‘lowlevel’) issues, Appl. Radiat. Isotopes, 61, 145–149.
Practical Gamma-ray Spectrometry – 2nd Edition Gordon R. Gilmore © 2008 John Wiley & Sons, Ltd. ISBN: 978-0-470-86196-7

1. Introduction
2. Interaction of radiation with matter
3. Detection system
4. Examples: steel factories and natural radioactivity
5. Practical activity
6. Activity: “One minute paper”


1. Introduction
2. Basic concepts
3. Radon Gas and Natural Radiation: risk assessment
4. Doses
5. Summary: Some key messages
6. Activity: “One minute paper”