Embed Size (px)
Citation preview
1
COMMENTS OF THE STAFF OF THE CALIFORNIAPUBLIC UTILITIES COMMISSION
ON THE 2016-2017 TRANSMISSION PLANNING PROCESS DRAFT STUDY PLANFOLLOWING THE FEBRUARY 29, 2016 STAKEHOLDER MEETING
* * * * * * *
March 15, 2016
Introduction
The Staff of the California Public Utilities Commission (“CPUC Staff”) appreciates this
opportunity to provide comments on the draft 2016-17 Transmission Planning Process (“TPP”)
Study Plan (“Draft Study Plan”) posted February 22 and discussed at the February 29
stakeholder meeting.
Our comments address the following topics.
1) If the 2016-2017 TPP encounters situations where transmission projects foreseeablycould require follow-on measures to achieve initial objectives, the CAISO shouldconsider and discuss the reasons and implications.
2) The CAISO should clearly document key differences in assumptions among the variedreliability and LCR study cases, should describe which key assumptions drive modeledviolations in particular cases, and also should explain how multiple cases individuallyand jointly contribute to findings of need for transmission investment.
3) The method for allocating customer (behind-the-meter, or BTM) PV to buses should beclearly described and the resulting allocations should be reported.
4) Methodologies used by PTOs to create bus-level load forecasts should be explained ingreater detail.
5) The CAISO should be prepared to run reliability sensitivity cases with higher levels ofAAEE than included in the 2015 IEPR load forecast.
6) The CAISO should assess need for new and previously approved reliability driventransmission upgrades in light of continued decline in load forecasts and growth ofcustomer generation, and should explain how customer generation in Community ChoiceAggregator (CCA) areas will be considered.
7) The CAISO and transmission developers should ensure that planned in-service dates forapproved projects are consistent with realistic timelines particularly for permitting andsiting – including the permitting timeline estimates provided in Appendix A.
2
8) The CAISO should assess, discuss with stakeholders and model as warranted - - the valueof reactive controls at various categories of resources in helping manage overvoltageissues such as those driving approval of reactive controls at six PG&E substations in thedraft 2015-2016 Transmission Plan.
9) The CAISO should clarify the methodology for modeling preferred resources inreliability assessment and also LCR studies.
10) In assessing preferred characteristics for “slow response” local capacity resources theCAISO should describe what types of resources are considered slow versus fast response,and how, quantitatively, total reliability and LCR needs can be met by combinations ofthese two categories of resources.
11) The CAISO should report the planning status of transmission projects falling within theplanning horizon that support a state infrastructure project (such as the High Speed Railproject), and should begin more detailed studies when required by those projects’timelines.
12) CPUC staff reiterate our comments on the draft 2015-2016 Transmission Planappreciating CAISO’s initial informational 50% RPS study and looking forward tocontinuing studies, and we also look forward to future insights regarding out-of-staterenewable resources identified as one area of focus in the Draft Study Plan.
13) CPUC Staff look forward to further assessments of frequency response issues particularlyunder high renewables futures, and with fine-tuning of modeled response from existingproviders as emphasized in the Draft Study Plan.
14) The CAISO should explain how required frequency response capabilities will be modeledin both economic and operational flexibility studies.
15) CPUC staff look forward to additional detail and vetting for the CAISO’s approach toassessing the potential for economically driven retirement of generation.
1. If the 2016-2017 TPP Encounters Situations Where Transmission ProjectsForeseeably Could Require Follow-On Measures to Achieve Initial Objectives, theCAISO Should Consider and Discuss the Reasons and Implications.
As CPUC Staff commented regarding the draft 2015-2016 Transmission Plan,
transmission planning can experience the “whack-a-mole” effect, where new infrastructure
planned at one location to address a problem can be followed in short order by problems that
consequently pop up (like moles) elsewhere. The Mesa loop-in project was cited as a current
example. CPUC Staff asked that the CAISO provide deeper insight into these situations. Now,
3
the CAISO is requested to provide such deeper insight in the 2016-2017 TPP cycle, such as
regarding the following.
a. Whether need for follow-on measures is reasonably apparent anddeserving of inclusion in the original assessment.
b. Whether need for follow-on measures could reasonably arise (or hasarisen) from changed information and forecasts, and when it isappropriate to proactively examine (e.g., via sensitivities) alternativeconditions that might produce such needs.
c. Whether need for follow-on measures could result (or has resulted) fromdifferences among or changes within modeling methods (supportingdifferent conclusions), and how the impacts of such changes or differencescan be anticipated or managed.
2. The CAISO Should Clearly Document Key Differences in Assumptions Among theVaried Reliability and LCR Study Cases, Should Describe Which Key AssumptionsDrive Modeled Violations in Particular Cases, and Also Should Explain HowMultiple Cases Individually and Jointly Contribute to Findings of Need forTransmission Investment.
CPUC Staff made this request in commenting on the draft 2015-2016 Transmission Plan.
Besides being valuable generally, the requested information is helpful to the CPUC in
administering permitting and siting processes. In those processes, it is important to accurately
identify project goals. CPUC Staff requests that the CAISO provide such deeper explanation and
insights in the final 2016-2017 TPP Study Plan and in the 2016-2017 Transmission Plan.
Construction of reliability assessment and Local Capacity Requirements (LCR) study
cases that are appropriately informative, stressful and at the same time reasonable appears to be
becoming more challenging. This may reflect increasing penetration of resources that are
variable and only partly predictable, as well as of distributed and behind-the-meter resources
having varied operating characteristics and locations plus limited or uncertain visibility and
responsiveness from a grid operation perspective. All of this makes it especially important that
the CAISO clearly document, explain and differentiate the load and resource assumptions across
various reliability assessment and LCR study cases, as well as how those cases individually and
jointly drive conclusions regarding reliability risks and needed solutions.

4
For example, the CAISO indicates on page 11 of Draft Study Plan that reliability
assessment base cases will use CEC peak and energy forecasts from the 2015 IEPR1 without
reflecting potential impact of increased PV penetration in pushing net peak load later into the
day. The same page then states that “these and other forecasting uncertainties will be taken into
account in the sensitivity studies identified in section 4.11.2 as needed.” This illustrates the
growing complexities of designing and interpreting reliability assessment and LCR studies, and
underscores the need to specifically document, explain and differentiate the load and resource
assumptions used for the different reliability assessment and LCR study cases.
Beyond clearly documenting, explaining and differentiating key generation and loadassumptions in different cases, the CAISO should clearly identify
which key assumptions drive significant modeled reliability problems orviolations in particular cases,
which reliability problems identified in the various reliability assessment and LCRstudy cases drive conclusions regarding needed transmission investments or otherreliability solutions, and
how the different cases and their results are interpreted both individually andjointly to arrive at conclusions.
This will help all parties understand and assess how evolving conditions, in both the real
world and in modeling, especially regarding variable, distributed and behind-the-meter
generation, are impacting determination of reliability needs.
Some specific types (this is not an exhaustive list) of information and insight that are
valuable and are requested include the following.
a. The resource output levels modeled for each reliability assessment and LCR studycase should be clearly and completely identified. Tables 4.7-1 through 4.7-4 ofthe Draft Study Plan show output levels to be assumed for different kinds of
1 Page 11 of the Draft Study Plan cites the CEC’s Revised Electricity Demand Forecast, (Volume 1, page 37, January2016) as stating that this effect of BTM PV pushing the peak load hour later into the day has “not beenincorporated into the demand forecast through CED 2015…”, but is expected to be incorporated into demandforecasts for the 2017 IEPR
5
renewable generation (e.g., 25% NQC for solar, during peak hours, for the PG&Earea), for different types of study cases. Tables 4.11-1 and 4.11-2 list the differentreliability assessment base and sensitivity cases (off-peak with maximum PVoutput, etc.) to be run for different load areas, for different time horizons (e.g.,2026). The final Study Plan and also the ultimate 2016-2017 Transmission Planshould show explicitly, completely and in a readily understandable manner, whatoutput levels were assumed for each generation type (including fossil and hydrowhere relevant) for each reliability study case.2 Corresponding and similarlyformatted (comparable) information should be provided for LCR study cases,since LCR studies are playing a complementary role in identifying reliabilityproblems and solutions.
CPUC staff note that storage and its potential future reliability and economic3
roles are increasingly factoring into electric system planning studies and theiruncertainties. We also note that CAISO’s documentation and interpretation ofreliability assessment and LCR studies have apparently not to date provideddetailed insights into how electric storage is being modeled in these differentstudy cases. Going forward and starting with the 2016-2017 TPP Study Plan andTransmission Plan, the CAISO should document and explain storage operationalassumptions used in reliability assessment and LCR studies, analogous to the waythat the CAISO documents and explains, or is requested in these comments todocument and explain, corresponding assumptions for other kinds of resources.We understand that modeling of storage is a growing challenge and will likelyevolve. However, we look forward to seeing that evolution more explicitlydocumented in future studies and reports, including how modeling of storage is orshould in the future be influenced by system interconnection level (transmissionlevel, distribution level, customer/BTM level) and by storage durations (e.g., 2hours, 4 hours, 6 hours, longer durations).
b. What each reliability study and LCR study case represents, in terms of specificreal world operational hours (thus, conditions) should be clearly identified. Foreach reliability assessment and LCR study case, the operational time period(s)such as hours of the day, weekday vs holiday/weekend, and months/season beingrepresented by the generation and load levels for that case should be clearlyidentified, such as via a separate table or via footnotes to other tables that liststudy cases and assumed generator output levels (see topic 2-a. above). If aparticular case represents a composite or generalization across a range of hours orconditions, or if the load and generation levels assumed for a particular case arenot typically coincident, then this should be clearly explained.
2 If this is shown via separate tables for (1) cases run and (2) generator output levels assumed for different kinds ofcases, then the “kinds of cases” shown in table (2) should clearly map onto the “cases run” in table (1).3 One economic (and also reliability) role of storage would be to help manage potential renewable generationdriven over-generation including its costs.

6
A specific situation where CPUC Staff request clarification regarding what hoursand conditions certain cases represent is the following. CAISO staff’s response atthe February 18 stakeholder meeting indicated that for certain study cases BTMPV output would be modeled for the specific hour (or set of hours?) representedby that study case whereas front-of-meter solar (and wind?) generator outputwould be modeled at a certain percentile level achieved over a wider range ofhours. While helpful and appreciated, this information requires furtherclarification. Does it refer only to LCR studies, to on-peak reliability studies, or toother (which?) studies? Is the BTM PV output assumed for the hour or set ofhours represented by such a study case based on 8760-hour PV output profiles, oron some other (which?) information? (How) is this different than the derivation ofoutput levels in different cases, for utility scale and other front-of-meter wind andsolar resources?
c. Specifically for the reliability assessment case “summer peak with no BTM PV”the CAISO should explain what load and resource output levels were used, andthe rationale. What hour(s) of the day does this case represent in each load area?Is it meant to represent an hour in which there would normally be BTM PV outputbut there is complete cloud cover for all BTM PV in an area, simultaneously? Incontrast, how will front-of-the-meter PV be modeled for this case, and what is therationale? Is there a similar LCR study case also having high loads and no orextremely low BTM PV output, and if so, how and why does it differ from the“summer peak with no BTM PV” reliability assessment sensitivity case?
d. Page 15 of the Draft Study Plan states “In 2016-2017 TPP base cases, the PVcomponent of self-generation will be modeled as discrete element”[sic] andCPUC Staff requests that that CAISO clarify what this means for each kind ofstudy case (e.g., reliability assessment versus LCR, on-peak versus other).
o The CAISO should clarify if modeling BTM PV as a “discrete element”means allocating aggregate BTM PV amounts among different individualbuses in each service area using PTO allocation methodologies discussedin CPUC Staff comment topic 3 below. If it means something more ordifferent, the CAISO should explain.
o In reliability assessment and LCR study cases, is BTM PV modeled assupply, discretely at each bus, or in some other manner? How (using whatprofiles, or via some other manner) is BTM PV removed from the basicload forecast at each bus, and then added back as discrete supply (orotherwise)? We understand that three output “data points” for BTM PVamounts in the aggregate and at any bus may be: zero, the on-peak MWBTM PV impact given for each area in the 2015 IEPR load forecasts, andnameplate MW levels identified on page 16 of the Draft Study Plan ascoming from a CEC-provided spreadsheet. The CAISO should explain ifthe different BTM PV output levels assumed for the different reliabilityassessment and LCR study cases are derived based on the above threeoutput levels, or if any (which?) study cases incorporate BTM PV output
7
levels based on 8760-hour or other multi-hour profiles, and what is thesource of the profiles. This explanation should also clarify the statementon page 16 of the Draft Study Plan that “Output of the self-generation PVwill be selected based on the time of day of the study using the end-useload and PV shapes for the day selected.”
o Are the output profiles4 modeled for BTM PV the same across all of thedifferent buses among which the BTM PV is distributed5 within any givenstudy area (e.g., SCE metro or Los Angeles Basin)? In other words, doBTM PV at the different buses all have the same output level as a fractionof their nameplate capacity, for each hour studied? How is thisrationalized as a reasonable representation of output levels that likely donot fluctuate in unison across all buses? The CAISO is requested toprovide similar clarification regarding diversity or uniformity of outputprofiles modeled for front-of-meter wind and solar resources, includingthe number of different profiles modeled.
3. The Method for Allocating Customer (BTM) PV to Buses Should be ClearlyDescribed and the Resulting Allocations Should be Reported.
Slide 10 of the February 18 presentation on the Reliability Assessment indicates that
modeled BTM PV locations “will be identified based on location of existing behind-the-meter
PV and information from PTO on future growth.” Given the growing importance of BTM PV in
reliability and other studies, the CAISO and PTOs should describe in more detail how and based
on what information BTM PV locations will be modeled, and what key uncertainties and
assumptions this involves. Discussion at the February 18 meeting indicated that Distribution
Resource Plans recently submitted by PTOs to the CPUC may play a role in establishing these
locational assumptions, and this should be explained more fully.
Additionally, understanding (e.g., via maps or tables) where the BTM PV are actually
being placed on buses or groups of buses for the 2016-2017 TPP would be very useful for
4 “Output profiles” refers to the time series (e.g., hourly) of modeled output levels for a given unit or increment ofPV capacity, which may be stated as a time-varying fraction of the nameplate capacity for that PV unit orincrement.
5 This refers to BTM PV amounts allocated among the different buses in an area, using methodologies discussed inCPUC Staff comment topic 3 below.
8
understanding reliability and LCR study assumptions and results, as well as for understanding
implications for future planning needs and methods.
4. Methodologies Used by PTOs to Create Bus-level Load Forecasts Should beExplained in Greater Detail.
Pages 11-14 of the draft Study Program describe at a high level how the PTOs convert
2015 IEPR load forecasts into bus-specific load forecasts. More detail should be provided,
including whether the methodology for allocating aggregate forecast load to buses only applies
to peak loads (including 1-in-2, 1-in-5, 1-in-10, weather-adjusted), and whether the 8760-hour
load shapes for the different buses are then calculated based on a single 8760-hour load shape for
an entire load area, allocated to buses in the same proportions as peak loads - - or whether some
other method is used. Also, it should be clarified if peak loads modeled for different buses are
coincident peak loads, so that a situation cannot occur, for example, in which bus X has a
modeled peak load occurring at a different hour than the modeled (coincident) peak load for the
overall load area (such as SDG&E).
Additionally, it should be clarified if and how the loads allocated to buses using the
PTOs’ methodologies represent loads without accounting for either AAEE or BTM PV, such that
both AAEE and BTM PV are added (to each bus for each hour) separately, according to
whatever bus allocations and 8760-hour or other shapes are attributed to the AAEE and to the
BTM PV.
5. The CAISO Should be Prepared to Run Reliability Sensitivity Cases with HigherLevels of AAEE than Included in the 2015 IEPR Load Forecast.
Senate Bill 350 calls for doubling of AAEE by 2030. SB 350 and its planning
implications were not known in time to inform the CEC’s development of the 2015 IEPR load
forecast. However, if an appropriate planning scenario reflecting a higher AAEE goal is
developed it would be valuable for this scenario to be analyzed as a sensitivity case(s) in the
2016-2017 TPP. Thus CPUC Staff request that the CAISO be prepared to run such a case(s),
should it be developed in a timely manner.
9
6. The CAISO Should Assess Need for New and Previously Approved ReliabilityDriven Transmission Upgrades in Light of Continued Decline in Load Forecastsand Growth of Customer Generation, and Should Explain How CustomerGeneration in Community Choice Aggregator (CCA) Areas will be Considered.
CPUC Staff appreciated CAISO’s effort in the last TPP cycle to assess previously
approved transmission projects, resulting in cancellation of 13 projects that are no longer needed
apparently due largely to declining load forecasts. As we stated in comments on the draft 2015-
2016 Transmission Plan, the CAISO should continue such assessment for all load areas. Results
should be reported in the 2016-2017 Transmission Plan. Load forecasts continue to decline and
distributed (including behind-the-meter) resources continue to grow.
As one example, the CAISO should evaluate the continued need for the Vaca-
Dixon/Lakeville reconductoring project, and should indicate the year (if any) in which absence
of this upgrade produces modeled reliability violations. If modeling does produce violations, the
final reporting of this study and its conclusions should clearly describe whether continued
operation (past assumed retirement dates) of Pittsburg generators, or other (which?) measures,
were modeled as mitigations. We note that status of PG&E’s application to the CPUC regarding
this project is currently uncertain.
Finally, CPUC Staff note that resource developments and planning by Community
Choice Aggregators (CCAs) can impact reliability needs in some areas, including the North
Bay/North Coast area affected by the above mentioned reconductoring project. It is unclear to
what extent this information is reflected in the IEPR load forecasts and in the CAISO’s studies.
Any clarification here would be valuable. In particular, CPUC Staff have received information
regarding Marin Clean Energy6 and Sonoma Clean Power,7 indicating that load served by
6 Marin Clean Energy began providing power in 2010. Greg Brehm, Director of Power Resources, expects theamount of load served by demand-side resources to increase from roughly 38 MW to 130 MW in the next 10 years.Marin Clean Energy’s demand-side resources estimates include about 30 MW of behind-the-meter (customer-owned) solar and include the following pending wholesale energy projects: 10.5 MW from their Solar One project,additional Feed-in Tariff projects, 1 MW from the Buck Institute solar project, and 2 MW from the College of Marinand Tesla storage project. (Marin Clean Energy communication to CPUC staff, September 2015)
7 Sonoma Clean Power, which began providing power in 2014, currently serves roughly 100 MW of load fromdemand-side resources. Geof Syphers, Chief Executive Officer, expects to more than double that amount in the

10
behind-the-meter resources in these two areas exceeds 100 MW and could roughly double in 10
years, while slightly smaller but significant amounts of local distributed wholesale renewables
are being contracted or planned.
7. The CAISO and Transmission Developers Should Ensure That Planned In-ServiceDates for Approved Projects Are Consistent with Realistic Timelines Particularlyfor Permitting and Siting - - Including the Permitting Timeline Estimates Providedin Appendix A.
CPUC Staff comments on the draft 2015-2016 Transmission Plan emphasized this point,
citing as an example a project for which the planned in-service date may be unachievable given a
realistic timeline. CPUC Staff have reviewed the status of several major transmission projects
recently approved by the CAISO that are now before the CPUC for permitting. Updated
information relevant to the timelines for those projects are listed in Appendix A,8 and these
timelines should be considered by the CAISO and project developers.
next 10 years. The output from demand-side resources in Sonoma Clean Power’s service area consists of roughly85 MW from behind-the-meter (customer-owned) solar and an additional 15 MW from behind-the-meter windpower, combined heat and power, and fuel cells. Sonoma Clean Power has signed contracts to build 14 MW ofadditional local wholesale solar and intends to add more local wholesale capacity of about 80 MW over the next 10years from a mix of resources. An estimated 50 MW of additional customer-owned solar and wind is expected overthe next 10 years. Sonoma Clean Power is beta-testing a customer demand response tool today, and they intend tohave roughly 10 MW of dispatchable demand-response within 10 years. They are planning to exceed the batterystorage mandate, meaning that at least 4 MW of peak demand would be met by storage within 4 years. SonomaClean Power obtains wholesale geothermal baseload energy from the Calpine Geysers facility in Sonoma Countywith current output about 650 MW, but with potential for future increases. (Sonoma Clean Power communicationto CPUC staff, September 2015)
8 The current CPUC permitting applications all require development of an environmental document as aprecursor to the Commission’s full consideration of a proposed decision on the permit application itself. Noted inAppendix A are the currently available CPUC Expected Draft and Final EIR timelines, which are subject to changebased on a variety of factors, including the timeline of the Draft EIR, the extensiveness of the comments on theDraft EIR, and the responsiveness of the Project Applicant to requests for information in support of thedevelopment of the environmental document. In cases where the Draft or Final document has already beenreleased, the item is noted in Appendix A as “issued”. If the document is not yet released, it is listed as “expected”with the current timeline for issuance provided.

11
8. The CAISO Should Assess, Discuss with Stakeholders and Model as Warranted - -the Value of Reactive Controls at Various Categories of Resources in HelpingManage Overvoltage Issues Such as Those Driving Approval of Reactive Controlsat Six PG&E Substations in the Draft 2015-2016 Transmission Plan.
In identifying need for investment in reactive controls at six PG&E substations, the
CAISO cited growing overvoltage issues in both modeling and real-world monitoring. In
discussion at the February 18 stakeholder meeting, the CAISO cited as a significant cause the
changing generation mix including growth of renewable generation. The CAISO should explain
which generators or types and locations of generators are responsible, and whether these issues
would be detected or addressed in transmission or distribution-level interconnection studies.
CPUC Staff also previously asked whether periodic investment in reactive controls on
the transmission system is the best or only solution. We repeat and expand that request. We ask
the CAISO to consider and model the ability of reactive controls at distributed and customer
resources to significantly contribute to mitigating this problem. CPUC Staff note that CAISO has
a market reform initiative in place to require reactive controls on asynchronous generators, and
that one of many thrusts of the CPUC’s Rule 21 (distribution level interconnection) reforms is
achieving reactive control capabilities at distribution-level resources. Periodic investment in
centralized transmission level reactive controls may be the most cost-effective solution or part of
that solution, but there should be a proactive assessment of the mix of potential solutions.
9. The CAISO Should Clarify the Methodology for Modeling Preferred Resources inReliability and Also LCR Studies.
CPUC Staff understand that at least for the Los Angeles Basin and San Diego areas, the
CAISO will initially model (in reliability assessment base cases) most preferred resources
offline. Then, if this results in identified reliability problems, the CAISO will add preferred
resources up to specific limits, at the most effective locations, to test ability of those resources to
mitigate the reliability problems. Here, we use the term preferred resources broadly to include
energy efficiency, demand response, storage, and local distributed renewable generation.

12
Below, we request clarification regarding (1) what preferred resources will be included in
the reliability assessment base cases, and (2) what will be the upper limits on amounts of
preferred resources subsequently modeled to test ability to mitigate problems. These
clarifications should be included as specifically as possible in the final Study Plan, with full
clarification in the 2016-2017 Transmission Plan. Further, CPUC Staff request that the same
information regarding modeling of preferred resources, as elaborated below, also be provided for
LCR studies.
First, the amounts and types of preferred resources included in reliability assessment base
cases should be explicitly defined. CPUC Staff understand the bottom of page 26 and top of page
27 of the Draft Study Plan as indicating that energy efficiency, demand response (“DR”) and
behind-the-meter (“BTM”) generation - - as “embedded in the CEC load forecast” will be
included in base cases. CPUC Staff assume and request confirmation that this means that BTM
generation amounts specified in the load forecast, even if ultimately modeled as supply, will be
included in reliability base cases. The CAISO should clarify if the statement that modeling BTM
PV as “a discrete element” as described on page 15 of the Draft Study Plan means that BTM PV
will be modeled as supply allocated to individual buses and if not, what it does mean. CPUC
Staff also request clarification regarding what types and amounts (by location) of DR are being
included in the base cases, and specifically whether this means only that certain amounts of DR
are assumed to already be reflected be in the load forecast (based on the above-cited statement
from page 27 of the Draft Study Plan) thus not needing to be modeled explicitly, or whether it
means something else and if so, what it means.
The next paragraph on page 27 of the Draft Study Plan states that “assessments will be
initially performed using preferred resources other than DR to identify reliability concerns
…and if reliability concerns are identified….. additional rounds of assessment will be performed
using potentially available demand response and energy storage…” Page 28 states that “The DR
capacity amounts [having been described in preceding table and text] will be modeled offline in
the initial reliability study cases….” and later states that “These storage capacity amounts [1404
MW shown in Table 4.8-3] will not be included in the initial reliability analysis.” On the other
hand, slide 17 of the Reliability Assessment presentation on February 29 states that energy
storage amounts [apparently referring to amounts in Draft Study Plan Table 4.8-3] are “not

13
included in starting cases (no location data available), unless [emphasis added] already
procured by LSEs as part of the LTPP process.”
All of the above leaves ambiguity regarding what preferred resources are included in base
cases. CPUC Staff’s interpretation, which CAISO is requested to confirm or correct, is that:
No DR amounts not already embedded in the load forecast (if any) will be included inbase cases. Otherwise, preferred resources falling within CPUC Track 1 and 4authorizations will be included in bases cases only if (1) they have already been procuredwith CPUC approval, and (2) the locations of such procured preferred resources are welldefined. CPUC Staff request clarification of what types and amounts of preferredresources procured pursuant to Track 1 & 4 authorizations, beyond storage amountsdescribed on pages 30 and 31 of the Draft Study Plan, thus qualify for inclusion inreliability assessment base cases.
Second, CPUC Staff request clarification of what will be the upper limits on total
amounts of preferred resources that may be added as potential mitigation measures, where initial
modeling has identified reliability problems. Our understanding, which the CAISO is requested
to confirm or correct, is that the following limits apply.
a. Local Additional Achievable Energy Efficiency (AAEE) will be added up to bus-specific amounts consistent with the aggregate LSE amounts in the low AAEEforecast in the 2015 IEPR.
b. Local EE procured via Track 1 & 4 authorizations will be considered additive to(i.e., will increase) the AAEE modeling limit given by a. above.
c. Local DR amounts assumed to meet a 30-minute total response time9 (for N-1-1contingencies) will be added as specified in Table 4.8-1 of the Draft Study Plan,and there will also be a separate sensitivity case(s) in which the SCE amounts inTable 4.8-1 are replaced by amounts provided by SCE. The DR procured underTrack 1 & 4 authorizations such as indicated in Table 4.7-7 of the Draft StudyPlan is additive to the above amounts, as an upper limit on total amounts addedfor mitigation tests.
d. Local renewable resources procured through Track 1 & 4 authorizations will beadded for mitigation, and are assumed to be additive to any local distributedrenewables included in the TPP base case RPS portfolio.
9 This refers to a 30-minute overall response time based on NERC Standard TOP-004-02 as noted, for example, onpages 27 and 51 of the Draft Study Plan.
14
e. Local storage procured via the CPUC storage mandate (or in the case of SCE,exceeding the mandate) will be added if not already included in the base cases.
CPUC staff assume and request confirmation or correction that upper limits on aggregate
preferred resource additions for mitigation modeling in the Los Angeles Basin and San Diego
areas will be set at the maximum of (i) the Track 1 & 4 maximum authorizations and (ii)
amounts actually procured. We request clarification as to how maximum preferred resource
additions above amounts already procured in these areas will be allocated among the different
types of preferred resources, for modeling purposes.
The CAISO is also requested to describe
a. how the specific aspects of preferred resource modeling for reliability studies asdiscussed above are treated for LCR studies, clearly indicating the similarities anddifferences (reiterating a request stated above);
b. which kinds of preferred resources described above, and which kinds of otherresources, are considered to be “fast response” (e.g., within 30 minutes totalresponse time) for reliability study and LCR purposes;
c. how, including types and MW limits, preferred resources will be modeled andassessed for ability to mitigate reliability problems in other areas besides thesouth coastal load centers, noting that page 26 of the Draft Study Plan states thatin previous planning cycles, CAISO “…made further progress in integratingpreferred resources into its reliability analysis focusing on other areas wherereliability issues were identified.”
10. In Assessing Preferred Characteristics for “Slow Response” Local CapacityResources the CAISO Should Describe What Types of Resources are ConsideredSlow Versus Fast Response, and How, Quantitatively, Total Reliability and LCRNeeds Can be Met by Combinations of These Two Categories of Resources.
In summarizing its planned special study “to identify the characteristics of the ‘slower’
response [resources] that are to be considered for local capacity resources” the CAISO notes on
page 51 of the Draft Study Plan that slow response resources unable to respond within 30
minutes of an initial contingency may if having certain [to be identified] characteristics provide
local capacity value by being able to be dispatched or “positioned” in advance of an actual
contingency. The CAISO also states that “The number of dispatches in the latter [slow response,
15
pre-positioning] case is anticipated to be orders of magnitude higher than the former [fast post-
contingency response ]. This appears to CPUC Staff to offer the possibility of slow-response
resources making a substantial contribution to meeting overall local capacity and local reliability
requirements particularly under certain important scenarios and, as the CAISO indicated in the
February 18 meeting, perhaps more so in certain parts of the grid than in others.
Thus, CPUC Staff request that the CAISO identify (starting with the final Study Plan to
the extent possible) what kinds of resources are categorized as slow versus fast response. Beyond
this, it will be important to learn (and we look forward to learning) what relative and absolute
amounts of fast versus slow response resources, or perhaps even amounts of different types of
fast versus slow response resources, are needed in combination to meet reliability and local
capacity requirements in different load areas, and certainly in the Los Angeles Basin and San
Diego areas.
11. The CAISO Should Report the Planning Status of Transmission Projects FallingWithin the Planning Horizon that Support a State Infrastructure Project (Such asthe High Speed Rail Project), and Should Begin More Detailed Studies WhenRequired by Those Projects’ Timelines.
In comments on the Draft Study Plan for the 2015-2016 TPP, PG&E requested a large
load interconnection sensitivity study be performed on the Greater Fresno area during the
summer peak period, significantly driven by planned interconnection of the California High
Speed Rail Project (HSR). The CPUC supports this request for the 2016-2017 TPP, as the 2025
initial operating date for the San Jose - North of Bakersfield segment of the HSR project falls
within the CAISO’s planning horizon. The CPUC believes it is important for stakeholders to be
able to track the status and progress of transmission projects for which objectives significantly
involve electrical support of a state infrastructure project.
Furthermore, the CPUC suggests that, when studies are conducted for each transmission
project of this type, the CAISO indicate the extent to which the cost, electrical configuration and
approximate geographic location of the transmission project are affected by the needs of the state
infrastructure project.

16
12. CPUC Staff Reiterate Our Comments on the Draft 2015-2016 Transmission PlanAppreciating the CAISO’s Initial Informational 50% RPS Study and LookingForward to Continuing Studies, and We Also Look Forward to Future InsightsRegarding Out-of-state Renewable Resources as an Identified Area of Focus in theDraft Study Plan.
CPUC Staff appreciate the CAISO’s initial informational study of implications and
feasibility of pursuing the legislatively established 50% renewable energy goal. We look
forward to future refinements of both CAISO studies and the CPUC’s planning tools informed
by those studies. This includes further insights regarding the following.
Benefits (e.g., reliability, reduced curtailments, perhaps even limited RAdeliverability) of different levels of transmission upgrades well below upgrademagnitudes needed for full capacity deliverability.
How conditions at the distribution level such as expansion of distributed energyresources and various kinds of controls and services for/from such resources - -impact feasibility and costs for pursuing a 50% RPS in different ways.
The important but still uncertain role of ability to export surplus renewablegeneration - - in affecting feasibility and costs for pursuing a 50% RPS indifferent ways.
The extent to which potential problems revealed in power flow studies do or donot resolve themselves via reasonable fine tuning of assumptions regardinghow/where future renewable resource additions will be deployed.
We look forward to further exploration of options and implications for pursuing out-of-
state renewable energy as indicated in the Draft Study Plan. We expect that resulting insights
will partly fall under the topics identified above, along with additional insights such as regarding
source and delivery options for out-of-state renewables, and perhaps how westwide
developments and uncertainties may impact these options.
13. CPUC Staff Look Forward to Further Assessments of Frequency Response IssuesParticularly Under High Renewables Futures, and with Fine-Tuning of ModeledResponse From Existing Providers as Emphasized in the Draft Study Plan.
For future frequency response studies in 2016 CPUC Staff request that the CAISO:

17
provide context relative to other studies (such as 50% RPS studies and 2016-2017TPP study cases) by describing in sufficient detail both CAISO area and westwiderenewables portfolios and dispatch levels assumed for frequency response studies;
provide greater quantitative insight into how commitment of resources to meetfrequency response needs interacts with flexible reserves commitment to manageload/wind/solar variations and uncertainties, including the extent to whichflexible reserves versus frequency response needs are fully additive, overlapping,or somewhere in-between;
assess the potential (and modeling requirements) for additional sources of primaryfrequency response not modeled in recent studies especially looking out 10-15years with high renewables penetration, such as storage, demand response, otherpreferred resources, and frequency response obligation contracts with other BAs;and
complementary to the CAISO’s stated intent to focus on understanding thediscrepancy between modeled versus historically experienced frequencyresponsiveness from conventional providers - - assess and clarify the extent towhich current assumed (conventional) frequency response providers could andshould be expected or incentivized to provide greater frequency responsiveness,and the extent to which this impacts differences between modeled versusobserved system frequency responsiveness.
14. The CAISO Should Explain How Required Frequency Response Capabilities willbe Modeled in Both Economic and Operational Flexibility Studies.
In production simulation studies, the CAISO formerly modeled regional minimum
generation constraints as proxies for a mixture of more complicated reliability requirements not
inherently captured in direct current (DC) flow production simulations. Subsequently the CAISO
has transitioned to instead modeling commitment constraints as production simulation proxies
for frequency response capability requirements. CPUC Staff comments on the draft 2015-2016
Transmission Plan requested that the CAISO describe how this frequency response capability
modeling was conducted in production simulations for 2015-2016 TPP economic studies.
The CAISO should describe to the extent possible now, and if necessary more fully when
possible, what production simulation methodology or constraints will be used to model (serve as
proxies for) frequency response capability requirements, in 2016-2017 TPP studies. This should
include description of requirements or constraints regarding commitment and/or headroom levels
for different specific kinds of generation. Also, the CAISO should clarify if different
18
methodologies may be used (and may of necessity have to be used) for GridView simulations
such as for TPP economic studies, versus for PLEXOS simulations such as for operational
flexibility studies.
Besides being important in the context of the CAISO’s own planning processes, methods
of modeling production simulation operational constraints as proxies for frequency response
capability requirements will be important when the CAISO’s modeling studies are presented and
discussed in the CPUC’s Long Term Procurement Plan (LTPP) proceeding. In the recent cycle of
that proceeding parties have already expressed strong interest in understanding and discussing
the rationale and implications of production simulation constraints as proxies for reliability
needs. Thus, information requested here regarding modeling of frequency response-based
constraints the 2016-2017 TPP should supplement and/or update characterization of such
modeling constraints as described in the Assumptions and Scenarios documentation for the new
cycle of CPUC’s Long Term Procurement Plan proceeding.
15. CPUC Staff Look Forward to Additional Detail and Vetting for the CAISO’sApproach to Assessing the Potential for Economically Driven Retirement ofGeneration.
Dramatic evolution of electricity resource mixes and markets can produce economic
pressures on some resources, including resources having important reliability roles. The
CAISO’s planned assessment of potential for economically driven retirements thus confronts an
important topic which is already on many minds and agendas. However, constructing a credible
and robust methodology for such an assessment is challenging and potentially controversial, and
the CAISO should carefully describe and vet this methodology before proceeding to conclusions.
This should include consideration of revenue implications of increased needs for various reserve
and ancillary services, combined with new patterns of generator operation.
Contacts:
Keith White [email protected]

19
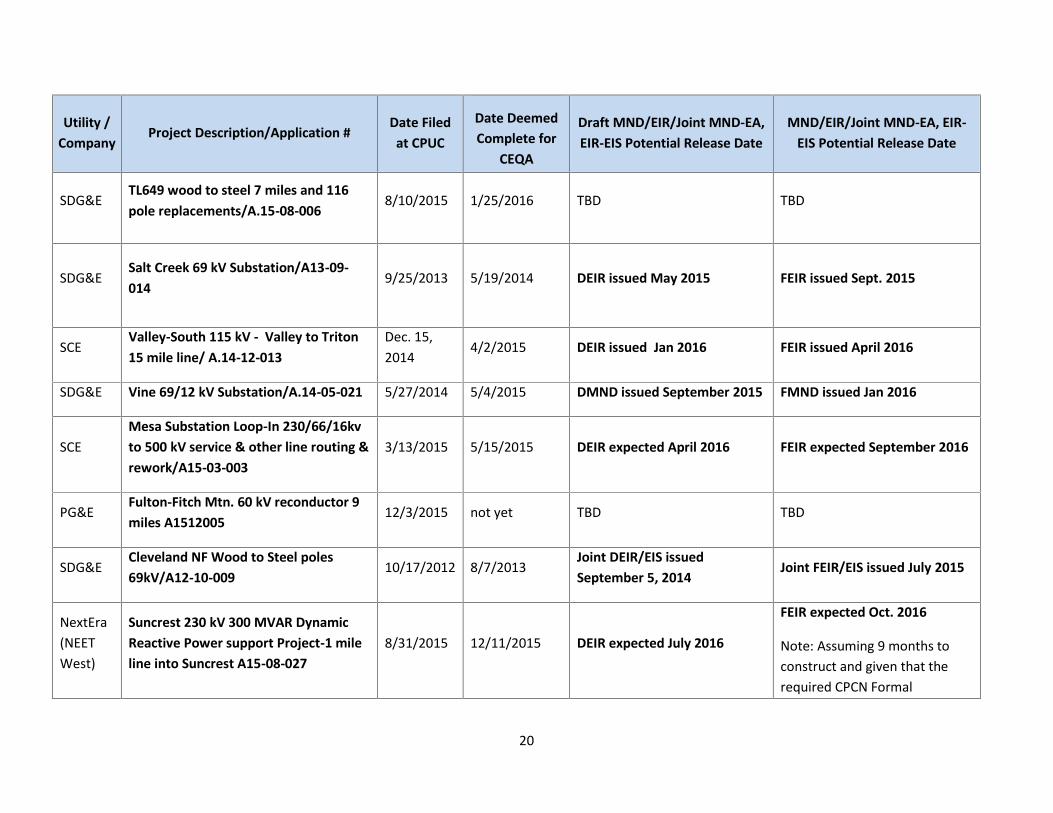
Appendix A.CPUC Staff Comments on the CAISO’s Draft Study Plan for the 2016-2017 TPP
Timelines for Selected Projects Approved by CAISO and Under CPUC Application and CEQA Review
Utility /Company
Project Description/Application #Date Filedat CPUC
Date DeemedComplete for
CEQAAdequacy
Draft MND/EIR/Joint MND-EA,EIR-EIS Potential Release Date
MND/EIR/Joint MND-EA, EIR-EIS Potential Release Date
SDG&ESouth Orange County Reliability Project& Capistrano Sub. Upgrades & new 230kV line/A12-05-020
5/18/2012 1/7/2013DEIR issued Feb 23, 2015;Recirculation August 10, 2015
Expected April 2016
PG&ESanger 115 kV substation expansion-reconfigure incoming power linespartial demo of substation A.15-09-012
9/30/2015 1/26/2016 DMND issued May 2016 Expected July 2016
SCEWest of Devers 220 kv Upgrades/A13-10-020
10/25/2013 9/11/2014Joint Draft EIR/EIS issuedAugust 7, 2015
FEIR issued 12/11/2015 - FEISexpected early/mid 2016
SDG&ESycamore-Penasquitos 230 kv line/A14-04-011
4/7/2014 7/24/2014 DEIR issued Sept.2015 FEIR issued Mar. 7, 2016
SCECircle City Substation 66kv & MiraLoma Jefferson 66kV line A15-12-007
12/4/2015 1/4/2016 TBD TBD
20
Utility /Company
Project Description/Application #Date Filedat CPUC
Date DeemedComplete for
CEQAAdequacy
Draft MND/EIR/Joint MND-EA,EIR-EIS Potential Release Date
MND/EIR/Joint MND-EA, EIR-EIS Potential Release Date
SDG&ETL649 wood to steel 7 miles and 116pole replacements/A.15-08-006
8/10/2015 1/25/2016 TBD TBD
SDG&ESalt Creek 69 kV Substation/A13-09-014
9/25/2013 5/19/2014 DEIR issued May 2015 FEIR issued Sept. 2015
SCEValley-South 115 kV - Valley to Triton15 mile line/ A.14-12-013
Dec. 15,2014
4/2/2015 DEIR issued Jan 2016 FEIR issued April 2016
SDG&E Vine 69/12 kV Substation/A.14-05-021 5/27/2014 5/4/2015 DMND issued September 2015 FMND issued Jan 2016
SCEMesa Substation Loop-In 230/66/16kvto 500 kV service & other line routing &rework/A15-03-003
3/13/2015 5/15/2015 DEIR expected April 2016 FEIR expected September 2016
PG&EFulton-Fitch Mtn. 60 kV reconductor 9miles A1512005
12/3/2015 not yet TBD TBD
SDG&ECleveland NF Wood to Steel poles69kV/A12-10-009
10/17/2012 8/7/2013Joint DEIR/EIS issuedSeptember 5, 2014
Joint FEIR/EIS issued July 2015
NextEra(NEETWest)
Suncrest 230 kV 300 MVAR DynamicReactive Power support Project-1 mileline into Suncrest A15-08-027
8/31/2015 12/11/2015 DEIR expected July 2016
FEIR expected Oct. 2016
Note: Assuming 9 months toconstruct and given that therequired CPCN Formal

21
Utility /Company
Project Description/Application #Date Filedat CPUC
Date DeemedComplete for
CEQAAdequacy
Draft MND/EIR/Joint MND-EA,EIR-EIS Potential Release Date
MND/EIR/Joint MND-EA, EIR-EIS Potential Release Date
Proceeding at the CPUC will becomplex, CAISO’s expected June2017 operational date is likelyto be delayed by about a year ifthe project is approved forconstruction.
SCEMoorpark-Newbury 66 kV line-A.13-10-021
10/28/2013 11/27/2013 DEIR issued June 2015 FEIR issued Nov. 2015
SCE Alberhill System/A09-09-022 9/30/20095/26/2011 Amended PEA
A joint project (Alberhill,Fogarty, Valley-Ivyglencomponents) DEIR/SEIRexpected Mar. 2016
FEIR expected July 2016
SCERiverside Transmission ReliabilityProject/A15-04-013
4/15/2015 not yet Subsequent EIR TBD TBD