Embed Size (px)
Citation preview

1
Renewables Portfolio Standard (RPS)
8th Annual Forum of the California Biomass Collaborative Judith Iklé
Program Manager, Energy Division, CPUCApril 5, 2011 UC Davis
Implementing one of the most ambitious renewable energy standards in the countryImplementing one of the most ambitious renewable energy standards in the country
California Public Utilities Commission Programs supporting energy from Biomass

2
California Public Utilities Commission•
The CPUC regulates investor owned telecommunications, electric, natural gas, water, railroad, rail transit, and passenger transportation companies, in addition to authorizing video franchises.
•
CPUC mission: to ensure safe and reliable services at just and reasonable rates, with a commitment to environmental enhancement and a healthy California economy.
•
Five Governor-appointed Commissioners

3
California’s Preferred Resources
“Loading Order” of Energy Resources:
•
Energy efficiency
•
Demand response
•
Distributed generation
•
Renewable generation
•
Cleanest available fossil resources

4
Overview of 20% Renewable Portfolio Standard (RPS) Program
•
Retail energy sellers* must procure 20% renewable energy by 2010 (SB 107, 2006)
–
All RPS-obligated retail sellers must procure an incremental 1% of retail sales per year until 2010
–
20% obligation continues post-2010
•
RPS procurement compliance is measured in terms of energy delivered tracked through renewable energy credits (RECs) generated, not signed contracts
•
20% Bioenergy Goal in 2006 Executive Order •
State Legislature passed a 33% by 2020 RPS bill SBx1 2 awaiting Governor Brown’s signature.
* retail sellers include investor-owned utilities (IOUs), energy service providers (ESPs), and community choice aggregators (CCAs)

5
Status of RPS Procurement•
CPUC has approved 184 contracts for over 16,000 MW of new and existing eligible renewable energy capacity
•
IOUs achieved 18% in 2010 with actual generation–
IOUs are forecasted to achieve 20% RPS in 2012
•
Recent RPS solicitations have been robust–
Increased participation from experienced developers, but smaller percentage of bids from bioenergy projects
–
2009 RPS solicitation resulted in 100,000 GWh of bids–
Shortlisted 2009 bids would meet 1/2 of 33% target
New Bioenergy Capacity
Year 2003 2004 2005 2006 2007 2008 2009 2010 2011 Total
Biomass 9.5 25.9 20.8 56.2
Biogas 10.5 6.3 6.8 1.87 1.48 26.95
Geothermal 17 50 67
Wind 22.8 60 51.3 75 85 330.9 253.5 583 288.8 1750.3
Small Hydro 4.5 0.4 0.8 4.8 10.5
Solar PV 12 25 43 11.22 91.22
Total 33.3 66.3 51.3 75 113.3 352.8 357.07 653.08 300.02 2002.17

RPS Bioenergy Contracts UpdateIn 2010:
–
2 (6.2 MW) biogas contracts were approved for existing facilities.
–
2 (114 MW) biomass contracts were approved. Mt Poso and DTE/Next Era are both conversions of existing coal facilities.
–
1 (25 MW) existing biomass contract was approved. (Woodland)
–
1 (11 MW) re-started biomass facility began operation. (Blue Lake)
–
1 (1 MW) new biogas facility began operation. (Santa Maria II, a Feed In Tariff (FIT) contract)

8
Procurement Options for Biomass
•
Renewable Portfolio Standard (RPS) Solicitations•
Qualifying Facilities (QF)
•
Renewable Auction Mechanism Standard Contracts•
Bilateral Power Purchase Agreements (PPA)
•
Feed-In Tariff (FIT) –
2 options–
PU Code §
399.20
–
AB 1613 (Blakeslee, 2007)•
Additional distributed generation program:–
Net Energy Metering Tariff: Customer credited for onsite generation up to their annual onsite load
Based on utility expenditure forecasts, the large IOUs will spend over a billion dollars on bioenergy generation in the next three years.
Based on utility expenditure forecasts, the large IOUs will spend over a billion dollars on bioenergy generation in the next three years.

0.00
1,000,000.00
2,000,000.00
3,000,000.00
4,000,000.00
5,000,000.00
6,000,000.00
7,000,000.00
2006 2007 2008 2009 2010 2011 2012 2013 2014 2015 2016 2017 2018 2019 2020
MWh
Large IOU Bioenergy Generation
Bioenergy MWh MWh 100% Re‐contracting
Bioenergy Generation Contributes to California’s Long Term Energy Procurement Strategy:
IOUs projected to spend at least $3 B on bioenergy by 2020
Bioenergy Generation Contributes to California’s Long Term Energy Procurement Strategy:
IOUs projected to spend at least $3 B on bioenergy by 2020

10
Procurement Options by SizeFacility
Capacity (MW)
Utility Contract
under RPS Solicitation
Utility Contract as a QF
Utility Contract
under Bilateral
Negotiation
Renewable Auction
Mechanism
Utility Feed-
In
Tariff
NEM Tariff
SGIP
0– 1.5 No Yes No Yes Yes
(under
PU Code §
399.20
AB 1613)
Yes Yes
1.5–20 Yes Yes Yes Yes Yes (under
AB 1613 only)
No Up to 5MW
≥
20 Yes Yes Yes No No No No

11
RPS Standard Solicitation Process
CPUC approves RPS procurement
plans
IOUs hold annual
solicitation
IOU rank bids pursuant to
“least-cost, best- fit” methodology
• Independent evaluator oversees solicitation, bid evaluation, and negotiations• Bilateral contracts (negotiated outside of a competitive solicitation) are also eligible
IOUs negotiate bids, execute
contracts
Once the IOU executes contract, must submit to the CPUC for approval

12
Qualifying Facility Program
•
Public Utilities Regulatory Policy Act (PURPA) of 1978 established QFs and outlined their payment according to the avoided cost of power.
•
QF is defined as non-utility generator with less than 80 MW capacity that utilizes cogeneration and/or renewable fuels (for bioenergy, ≥
95%
biomass).•
There are currently 48 bioenergy QFs representing 656 MW.–
22 biomass and 26 biogas

13
Renewable Auction Mechanism
•
On December 16, 2010, the Commission approved the Renewable Auction Mechanism (RAM) for small renewable generators up to 20 MW –
RAM establishes an interim 1,000 MW procurement target over two years and requires the IOUs to hold two auctions per year
•
Key Program Design Elements:–
Standard Contract -
simple, non-negotiable contract–
Project Viability -
seller must meet minimum criteria to participate in the auction
–
Market-Based Pricing -
bids are selected on price, starting with the lowest price bid until the auction capacity cap is reached

14
Bilateral Power Purchase Agreements•
Renewable energy purchased at a negotiated price from facilities of all sizes.
•
Opportunity for generators who might otherwise not participate in the standard RPS solicitation.
•
Generation can fulfill a Load-Serving Entity’s RPS requirement.
•
Requires CPUC Approval by Resolution

15
Feed-in Tariffs (Scenario 1: AB 1969)
•
Contract Term Length: Long-term contract (10, 15, or 20-yr)•
Project size limit: 3.0 MW (expanded from 1.5 MW under SB 32 (Negrete McLeod,
2009))•
Price: Fixed price is determined by
Market Price Referent (MPR), as adjusted by time of delivery and season
•
Program size: 750 MW (statewide) (expanded from 500 MW under SB 32 (Negrete McLeod, 2009)
•
Tariffs transfer Renewable Energy Credits (RECs) from generator to utility
•
Two options under tariff (depending on customer’s choice):–
Full sale of production –
Excess sales (after onsite usage)•
CPUC is currently implementing SB 32

16
Feed-in Tariffs (Scenario 2: AB 1613)•
Applies to all Combined Heat and Power (CHP) up to 20 MW•
Fixed or variable price to be determined by
the CPUC. CPUC can require IOUs to purchase excess electricity.
•
Price schedule extends to a maximum of 10 years •
CHP systems must be sized to the customer’s thermal load•
There is no requirement that CHP systems be sized to the customer’s electric load. Thus, oversized systems (from an electric perspective) are permitted.
•
A 20 MW maximum size limit applies•
Only new CHP systems (installed after January 1, 2008) are eligible. (Sec. 2841). However, per AB1613, the CPUC is considering whether repowered CHP will be eligible.
•
A NOx standard of 0.07 pounds per MWh applies, with a credit to CHP customer-generators that are 60% efficient or better of 1 MWh per 3.4 MMBtu of waste heat recovered.

17
Net Energy Metering for Bioenergy•
Onsite generation provides customer with credit for net monthly power production at the generation portion of their rate
•
Eligible Technologies: Wind, Solar, Biogas-fired generators, and fuel cells
•
Program Guidelines–
Statewide cap 50 MW–
Facility capacity cap: 1 MW•
As pilot, 3 generating facilities statewide may be from 1 to 10 MW

18
Self-Generation Incentive Program (SGIP) for Bioenergy
•
Incentive Program to offset the upfront capital costs for bioenergy facilities
•
Eligible Technologies: wind turbines, fuel cells, and corresponding energy storage systems –
Historically biogas fueled Combined Heat and Power (CHP), internal combustion engines, small turbines, and fuel cells
–
Beginning 1/1/2010 –
CPUC is authorized to include other clean DG technologies
•
Incentive Limitations–
Systems ranging from 30 kW to 5 MW may apply for incentives
–
Incentives are paid for the first 3 MW, per D.08-04-049, in a stepped decline
–
A 20% adder for using a California supplier (PU Code 379.6(g)) is calculated on the non-renewable incentive rate of $2.50 per watt –
so a renewable fuel cell produced in-state would qualify for $4.50 + 20% ($2.50) = $5.00/Watt

19
1,702 MW of new capacity online since 2003*
100 151 226 33
9
692
1,04
9
51
75
113
353
653
66
357
0
200
400
600
800
1000
1200
1400
1600
1800
2003 2004 2005 2006 2007 2008 2009 2010
Capa
city (M
W)
Cumulative Capacity Added in Prior Years Capacity Added In Current YearSource: California Public Utilities Commission, 4th Quarter 2010
33
1702
Number of Projects MW GWh/y
In-State 7 172 351
Out-of-State 4 218 672Total 11 390 1023
Percentage In-State 64% 44% 34%
New 2010 capacity, by region
* More projects –
over 1,000 MW –
have come online since 2003 under short-term contracts, but Energy Division generally does not credit the RPS program with incenting the development of these projects.

Percentage of RPS Generation by Technology
0%
10%
20%
30%
40%
50%
60%
70%
80%
90%
100%
2005 2010 2015 2020
Perc
enta
ge o
f RPS
Gen
erat
ion
wind solar small hydro geothermal biogas biomass
Source: California Public Utilities Commission, 4th Quarter 2009
22.5 TWh 32.8 TWh 65.7 TWh 70.5 TWh

20%19% 19%
17%
15%
21%20% 19%
18%
16%
0%
5%
10%
15%
20%
25%
2006 2007 2008 2009 2010
Historical Bioenergy Percentages
All CPUC Jurisdictional Entities IOUs

14% 14%
13%
11%9% 9%
7%6%
6%
4%
15% 15%
14%
12% 11% 12%11% 12% 12% 12%
0%
2%
4%
6%
8%
10%
12%
14%
16%
18%
2011 2012 2013 2014 2015 2016 2017 2018 2019 2020
Large IOU Bioenergy Forecast
Bioenergy Percentage Bioenergy Percentage 100% Re‐contracting

23
More Information
•
See RPS Webpage at: http://www.cpuc.ca.gov/PUC/energy/Renewables/
•
Judith Iklé, Program Manager, Energy Division, California Public Utilities [email protected]

Backup Information

25
0
10,000
20,000
30,000
40,000
50,000
60,000
70,000
80,000
2003 2004 2005 2006 2007 2008 2009 2010 2011 2012 2013 2014 2015 2016 2017 2018 2019 2020
Online or Viability > 90% Viability > 80% to 90%Viabil ity > 70% to 80% Viability > 50% to 70%IOU Historical RPS Target Forecasted RES Target based on LTPP "Base Case" Load
Source: Cal i fornia Publ ic Uti l i ties Commiss ion, 4th Quarter 2010
2020 33% Renewable Electricity Standard Target
2010 20% RPS Mandate
IOU RPS Forecast with Executed Contracts
2020 33% Renewable Electricity Standard Target
2010 20% RPS Mandate

26
2009 RPS Procurement by Fuel Type
0%
2%
4%
6%
8%
10%
12%
14%
16%
18%
Large Investor-Owned Utilities Electric Service Providers Multi-Jurisdictional Utilities
% o
f Ren
ewab
le P
rocu
rem
ent
Geothermal Wind Small hydro Solar Biogas Biomass
Note - The small utilities did not procure any RPS-eligible generation in 2009.

27
Fuel mix shifting towards solar
0
20
40
60
80
100
2003 2004 2005 2006 2007 2008 2009
Solicitation Year
Ener
gy (T
Wh)
/ ye
ar
Wind Solar Small Hydro Geothermal Biogas Biomass
Source: California Public Utilities Commission, 1st Quarter 2010
2727
•
Bids to IOUs are increasingly weighted towards solar•
Solar thermal leading until recently, as PV costs have dropped
•
Some solar thermal project developers shifting technology to solar PV
Bids in IOU Solicitations 2003-2009, by Fuel Type
28
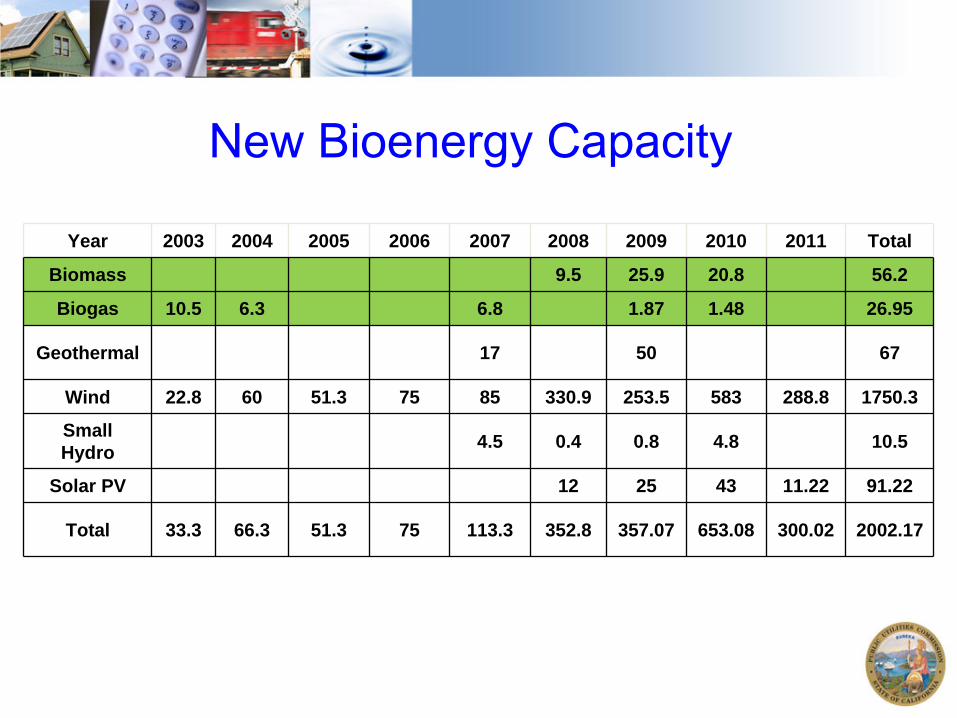
RPS Compliance Rules•
Annual Procurement Targets (APT): 20% of retail sales starting in 2010–
Prior to 2010, retail sellers had to increase renewable procurement by 1% each year
•
Flexible compliance–
Unlimited banking: A REC can be banked indefinitely
–
Borrowing: If facing a shortfall, an entity can delay RPS compliance for 3 years if entity demonstrates one of the allowable reasons
•
Non-compliance Penalty: 5 cents per kWh, up to $25 million per year

29
Renewable Energy Credits•
RECs
= the renewable attributes of 1 MWh
of renewable
energy and are used to demonstrate RPS compliance •
The Energy Commission tracks RECs
through the Western
Renewable Energy Generation Information System (WREGIS) to verify compliance and prevent double counting
•
IOUs can purchase “bundled”
contracts (RECs
+ energy) or “REC-only”
contracts (only RECs)
•
Through the 2013 compliance year, IOUs and ESPs
can satisfy up to 25% of RPS targets with REC-only contracts
•
IOUs can spend no more than $50/REC through 2013•
RECs
can not be used to comply with greenhouse gas
emissions reduction programs

30
REC Trading Rules•
No limits on market participation
•
IOUs can pay no more than $50/REC through 2013 for REC-only transactions. All transactions subject to reasonableness review by CPUC.
•
RECs
can be traded in the market for up to 3 years before an RPS-obligated entity commits it to RPS compliance
•
Once committed, an RPS-obligated entity can use for compliance in that year or in any future year
•
Large IOUs and ESPs
can use REC-only contracts for up to 25% of annual RPS target, no limits for others

31
Cost Containment
•
CPUC established a methodology to determine the market price of electricity
•
MPR represents the cost of building and operating a combined cycle gas turbine power plant (CCGT)
under
a long-term contract•
Each IOU can expend a certain amount of money on above-MPR contracts (cost limitation)
•
If the cost limitation is exhausted, IOUs can limit RPS procurement to renewable energy resources that can be procured at or below the MPR
Law limits the total costs of renewable energy above market prices for fossil energy

CPUC Adopts Market Price Referent
•
Calculated annually for RPS Solicitations
•
Calculates levelized
all-in market price deemed per se reasonable, i.e. recoverable through rates
•
Feed-In tariff program adopts MPR values for pricing
Adopted 2009 MPRs* -
$/kWh
Online Date 10-Year 15-Year 20-Year
2010 0.08448 0.09066 0.09674
2011 0.08843 0.09465 0.10098
2012 0.09208 0.09852 0.10507
*Adopted 12/17/2009 in Resolution E-4298.