Embed Size (px)
Citation preview
CONNECTING CALIFORNIA
California Public Utilities Commission
Telecommunication Division
Broadband Report Update
September 20, 2006
2
TABLE OF CONTENTS
I. INTRODUCTION.............................................................................................................. 3 II. BROADBAND MARKET................................................................................................ 3
II.A. Connection Speeds ..................................................................................................... 5 II.B. Deployed Technologies .............................................................................................. 6
III. EMERGING TECHNOLOGIES..................................................................................... 8 III.A. EV-DO Wireless Broadband..................................................................................... 8 III.B. Broadband through Gas Lines................................................................................... 8
IV. MUNICIPAL WIRELESS NETWORKS ....................................................................... 8 IV.A. Cerritos, CA– The First “Citywide” WiFi ................................................................ 8 IV.B. Folsom, CA – Pioneering WiMAX........................................................................... 9 IV. C. San Francisco “Tech Connect” ............................................................................. 10 IV. D. Silicon Valley Wireless Network ......................................................................... 10
V. COMMUNITY-BASED BROADBAND PROJECTS................................................... 11 V.A. Rural Technology and Information Project: ........................................................... 11 V. B. Little Tokyo Service Center: .................................................................................. 13 V.C. Tribal Digital Village: ............................................................................................. 15
VI. STATE BROADBAND INITIATIVES........................................................................ 18 VI.A. ConnectKentucky (www.connectkentucky.org):.................................................... 18 VI.B. e-NC (www.e-nc.org): ............................................................................................ 19 VI.C. Michigan Broadband Development Authority (www.broadbandauthority.org):.... 20 VI.C. Illinois ..................................................................................................................... 20
VII. STATE MAPPING PROJECTS .................................................................................. 21 VII.A. Kentucky................................................................................................................ 21 VII.B. Vermont ................................................................................................................. 22 VII.C. Wyoming ............................................................................................................... 23
VIII. CALIFORNIA BROADBAND DEPLOYMENT MAPS .......................................... 24 VIII.A. Broadband Deployment in California .................................................................. 24 VIII.B. Broadband Service Providers in California by Zip Codes .................................. 24 MAP I................................................................................................................................ 25 MAP II .............................................................................................................................. 26
3
I. INTRODUCTION The following is an update of the California Public Utilities Commission (CPUC) May 2005 report entitled, Broadband Deployment in California.1 Telecommunications Division staff has prepared this update for presentation at the September 20, 2006 meeting of the California Emerging Technologies Fund (CETF) Board of Directors meeting.2 This report examines December 31, 2005 Federal Communications Commission (FCC) data on broadband subscribership in California and the nation.3 It explores new technologies that potentially will increase deployment and connection growth in California. This report additionally highlights a number of California specific broadband case studies, including Municipal WiFi projects; discusses how community and non-profit groups are addressing Digital Divide and access issues; and describes how cooperatives in other states are addressing deployment and access issues within their respective states.
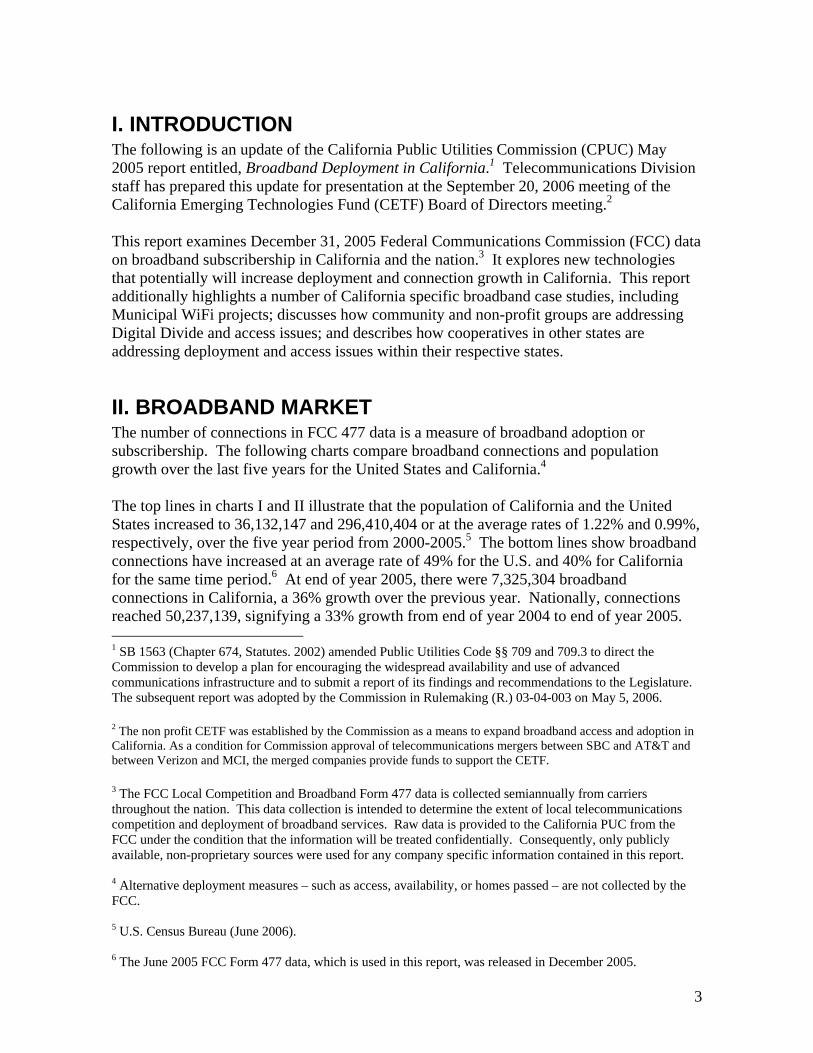
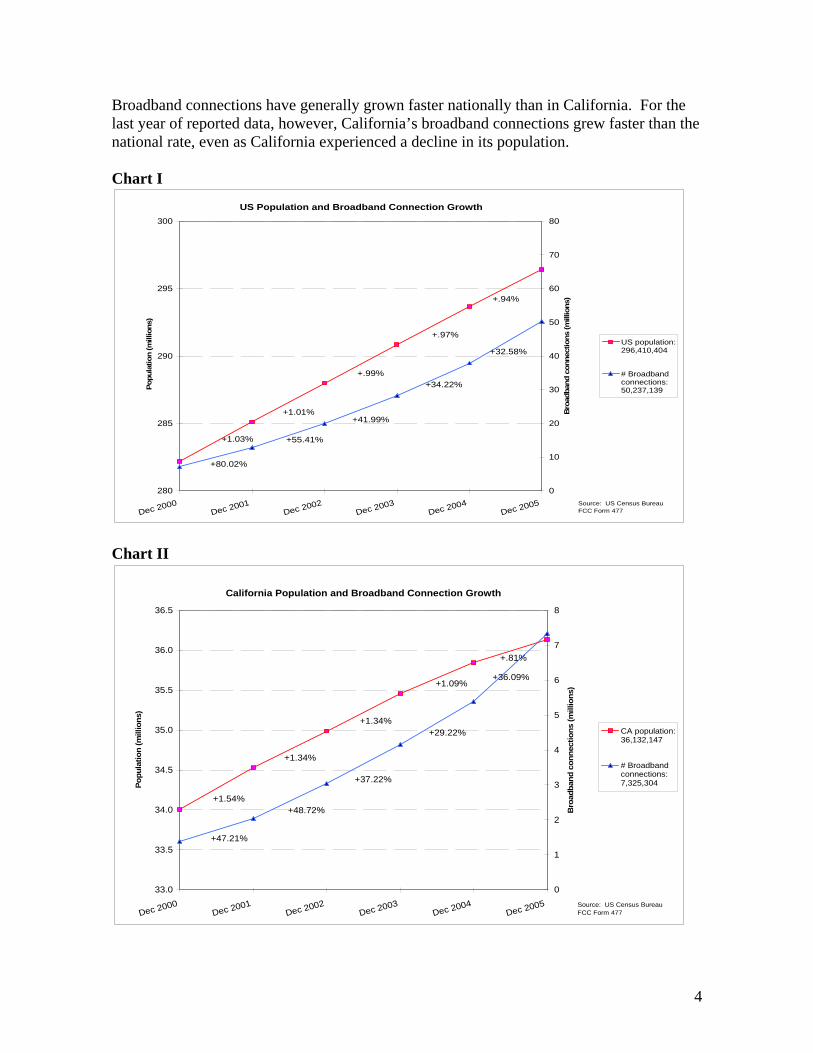
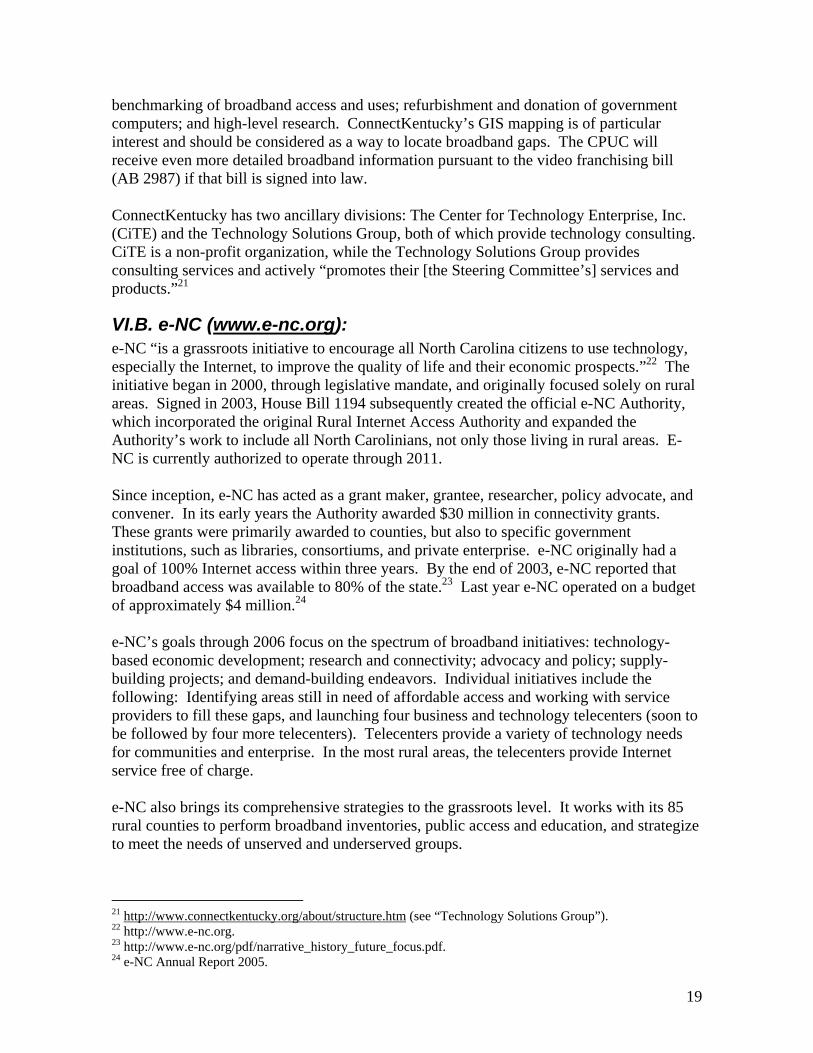
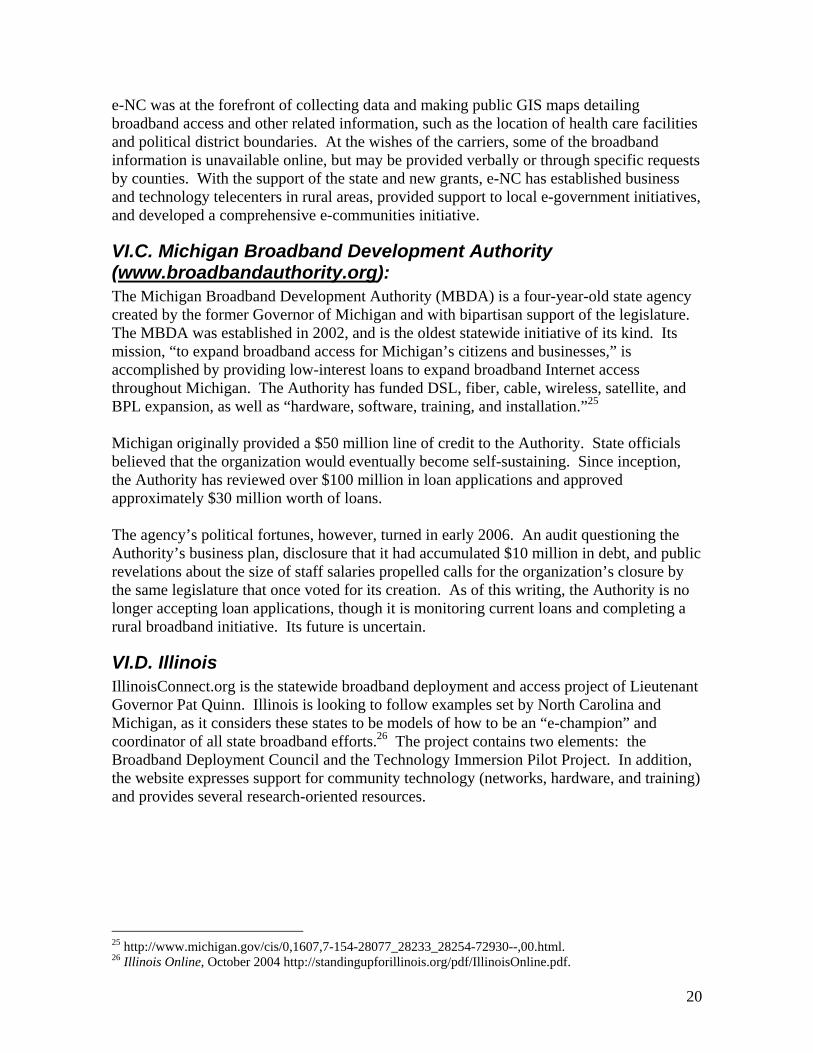
II. BROADBAND MARKET The number of connections in FCC 477 data is a measure of broadband adoption or subscribership. The following charts compare broadband connections and population growth over the last five years for the United States and California.4 The top lines in charts I and II illustrate that the population of California and the United States increased to 36,132,147 and 296,410,404 or at the average rates of 1.22% and 0.99%, respectively, over the five year period from 2000-2005.5 The bottom lines show broadband connections have increased at an average rate of 49% for the U.S. and 40% for California for the same time period.6 At end of year 2005, there were 7,325,304 broadband connections in California, a 36% growth over the previous year. Nationally, connections reached 50,237,139, signifying a 33% growth from end of year 2004 to end of year 2005. 1 SB 1563 (Chapter 674, Statutes. 2002) amended Public Utilities Code §§ 709 and 709.3 to direct the Commission to develop a plan for encouraging the widespread availability and use of advanced communications infrastructure and to submit a report of its findings and recommendations to the Legislature. The subsequent report was adopted by the Commission in Rulemaking (R.) 03-04-003 on May 5, 2006.
2 The non profit CETF was established by the Commission as a means to expand broadband access and adoption in California. As a condition for Commission approval of telecommunications mergers between SBC and AT&T and between Verizon and MCI, the merged companies provide funds to support the CETF.
3 The FCC Local Competition and Broadband Form 477 data is collected semiannually from carriers throughout the nation. This data collection is intended to determine the extent of local telecommunications competition and deployment of broadband services. Raw data is provided to the California PUC from the FCC under the condition that the information will be treated confidentially. Consequently, only publicly available, non-proprietary sources were used for any company specific information contained in this report. 4 Alternative deployment measures – such as access, availability, or homes passed – are not collected by the FCC. 5 U.S. Census Bureau (June 2006). 6 The June 2005 FCC Form 477 data, which is used in this report, was released in December 2005.
4
Broadband connections have generally grown faster nationally than in California. For the last year of reported data, however, California’s broadband connections grew faster than the national rate, even as California experienced a decline in its population. Chart I
US Population and Broadband Connection Growth
+.94%
+1.03%
+1.01%
+.99%
+.97%
+32.58%
+34.22%
+41.99%
+55.41%
+80.02%
280
285
290
295
300
Dec 2000Dec 2001
Dec 2002Dec 2003
Dec 2004Dec 2005
Popu
latio
n (m
illio
ns)
0
10
20
30
40
50
60
70
80
Bro
adba
nd c
onne
ctio
ns (m
illio
ns)
US population:296,410,404
# Broadbandconnections:50,237,139
Source: US Census BureauFCC Form 477
Chart II
California Population and Broadband Connection Growth
+1.09%
+1.34%
+1.34%
+1.54%
+.81%
+47.21%
+48.72%
+37.22%
+29.22%
+36.09%
33.0
33.5
34.0
34.5
35.0
35.5
36.0
36.5
Dec 2000Dec 2001
Dec 2002Dec 2003
Dec 2004Dec 2005
Popu
latio
n (m
illio
ns)
0
1
2
3
4
5
6
7
8
Bro
adba
nd c
onne
ctio
ns (m
illio
ns)
CA population:36,132,147
# Broadbandconnections:7,325,304
Source: US Census BureauFCC Form 477
5
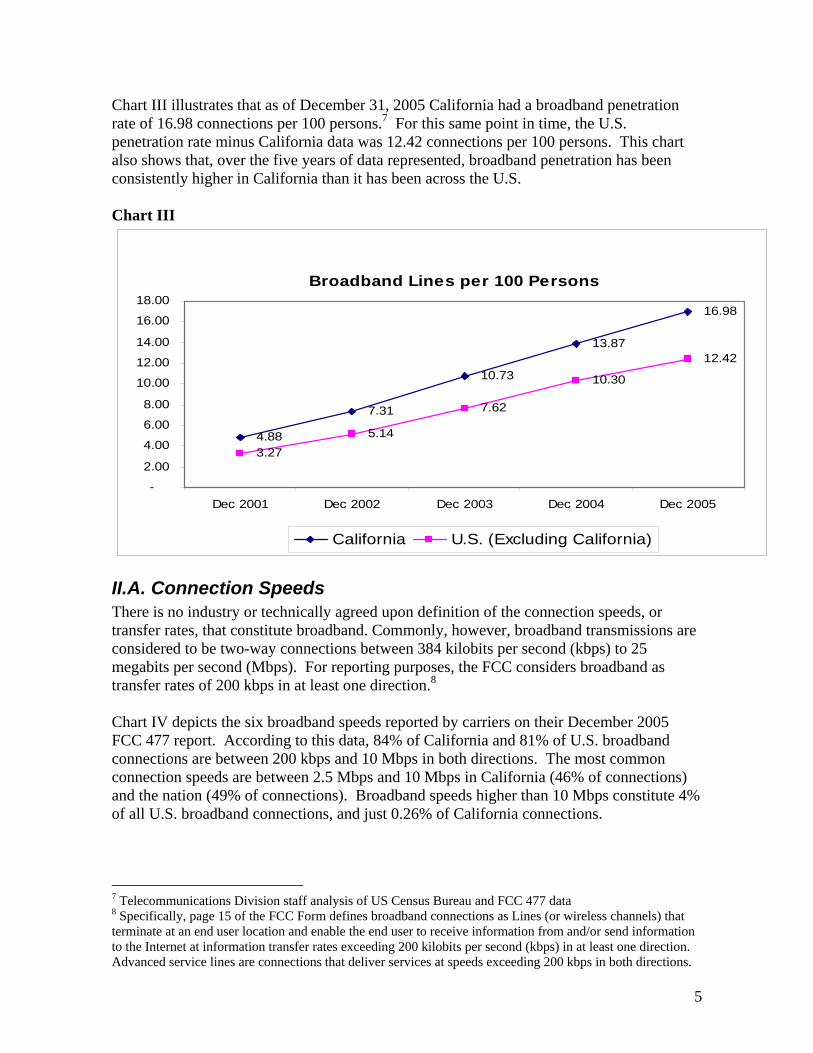
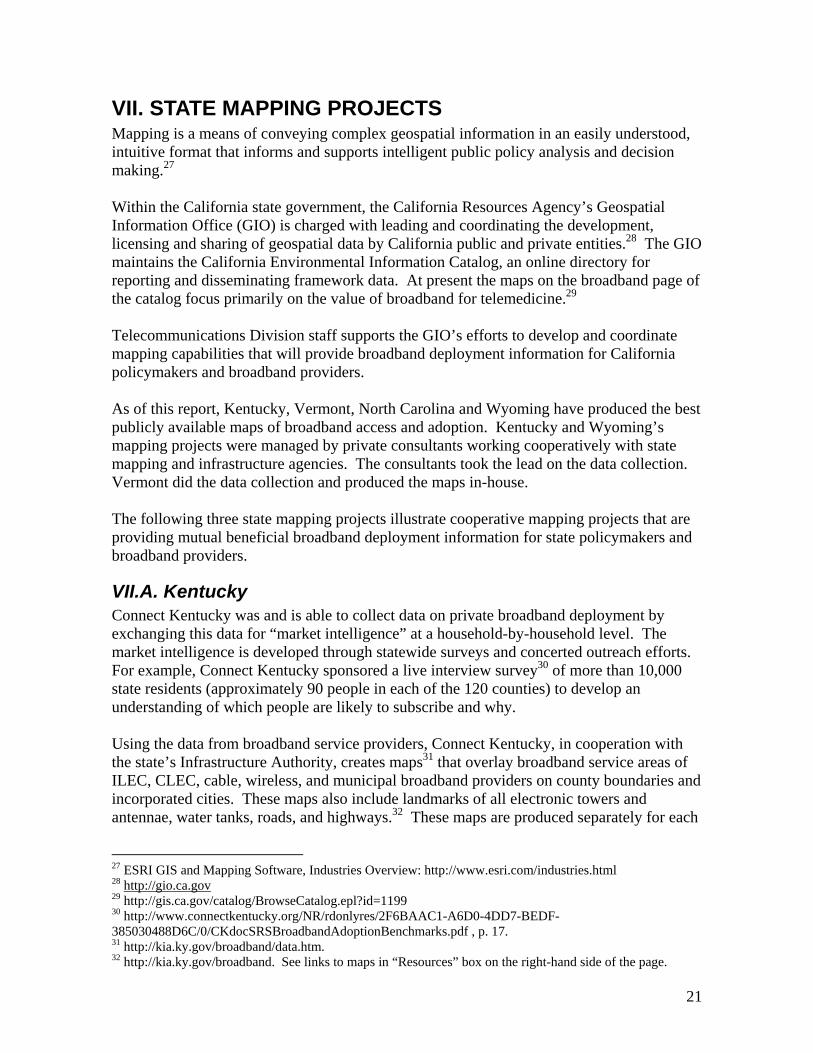
Chart III illustrates that as of December 31, 2005 California had a broadband penetration rate of 16.98 connections per 100 persons.7 For this same point in time, the U.S. penetration rate minus California data was 12.42 connections per 100 persons. This chart also shows that, over the five years of data represented, broadband penetration has been consistently higher in California than it has been across the U.S. Chart III
Broadband Lines per 100 Persons
4.88
7.31
10.73
13.87
16.98
3.275.14
7.62
10.30
12.42
-
2.00
4.00
6.00
8.00
10.00
12.00
14.00
16.00
18.00
Dec 2001 Dec 2002 Dec 2003 Dec 2004 Dec 2005
California U.S. (Excluding California)
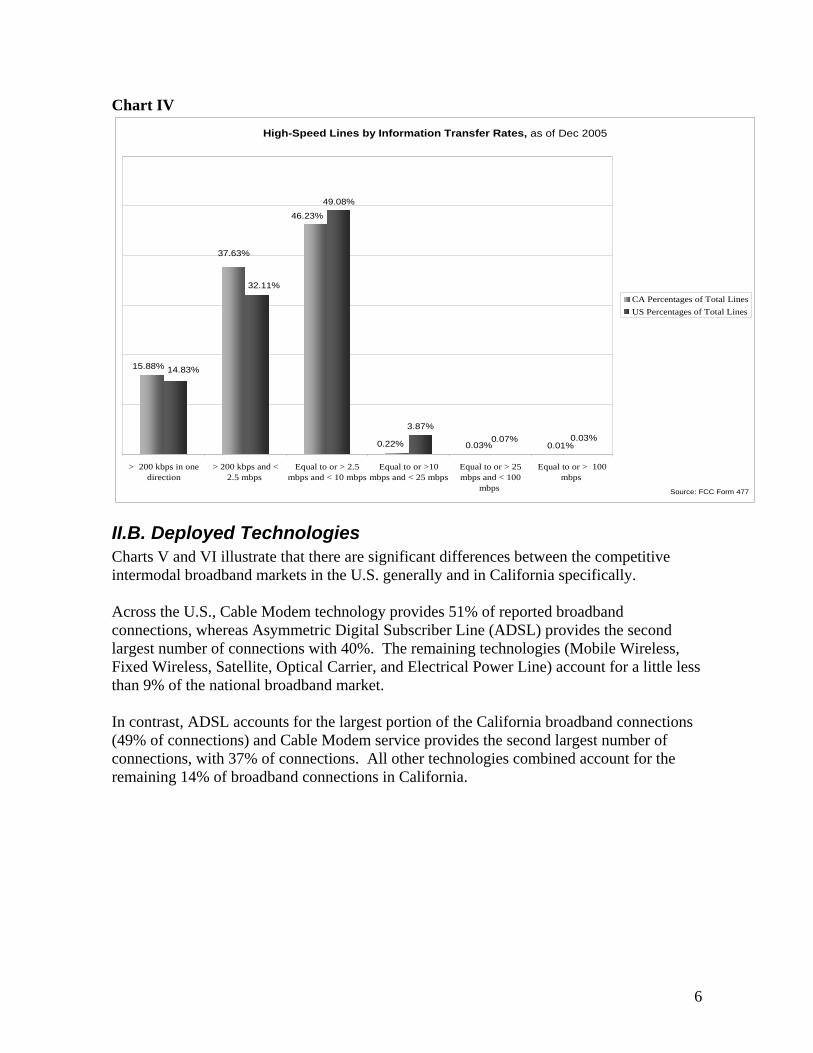
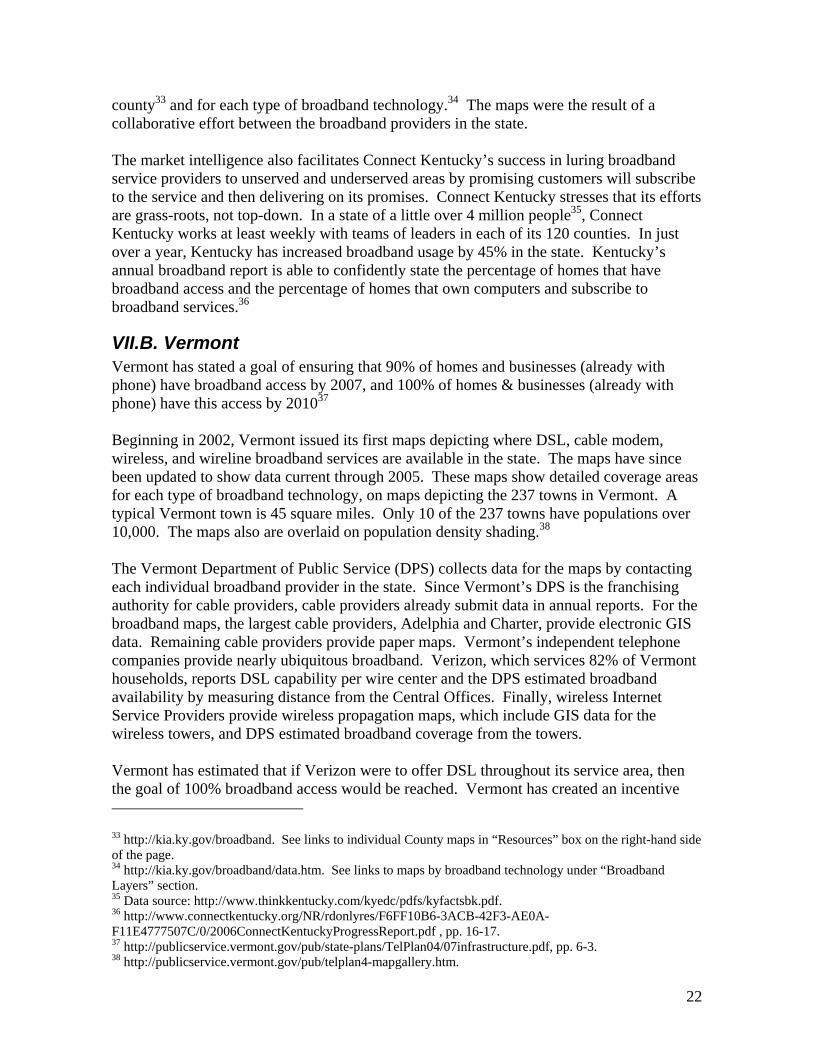
II.A. Connection Speeds There is no industry or technically agreed upon definition of the connection speeds, or transfer rates, that constitute broadband. Commonly, however, broadband transmissions are considered to be two-way connections between 384 kilobits per second (kbps) to 25 megabits per second (Mbps). For reporting purposes, the FCC considers broadband as transfer rates of 200 kbps in at least one direction.8 Chart IV depicts the six broadband speeds reported by carriers on their December 2005 FCC 477 report. According to this data, 84% of California and 81% of U.S. broadband connections are between 200 kbps and 10 Mbps in both directions. The most common connection speeds are between 2.5 Mbps and 10 Mbps in California (46% of connections) and the nation (49% of connections). Broadband speeds higher than 10 Mbps constitute 4% of all U.S. broadband connections, and just 0.26% of California connections.
7 Telecommunications Division staff analysis of US Census Bureau and FCC 477 data 8 Specifically, page 15 of the FCC Form defines broadband connections as Lines (or wireless channels) that terminate at an end user location and enable the end user to receive information from and/or send information to the Internet at information transfer rates exceeding 200 kilobits per second (kbps) in at least one direction. Advanced service lines are connections that deliver services at speeds exceeding 200 kbps in both directions.
6
Chart IV
High-Speed Lines by Information Transfer Rates, as of Dec 2005
0.03% 0.01%
49.08%
3.87%
15.88%
37.63%
46.23%
0.22%
14.83%
32.11%
0.03%0.07%
> 200 kbps in onedirection
> 200 kbps and <2.5 mbps
Equal to or > 2.5mbps and < 10 mbps
Equal to or >10mbps and < 25 mbps
Equal to or > 25mbps and < 100
mbps
Equal to or > 100mbps
CA Percentages of Total LinesUS Percentages of Total Lines
Source: FCC Form 477
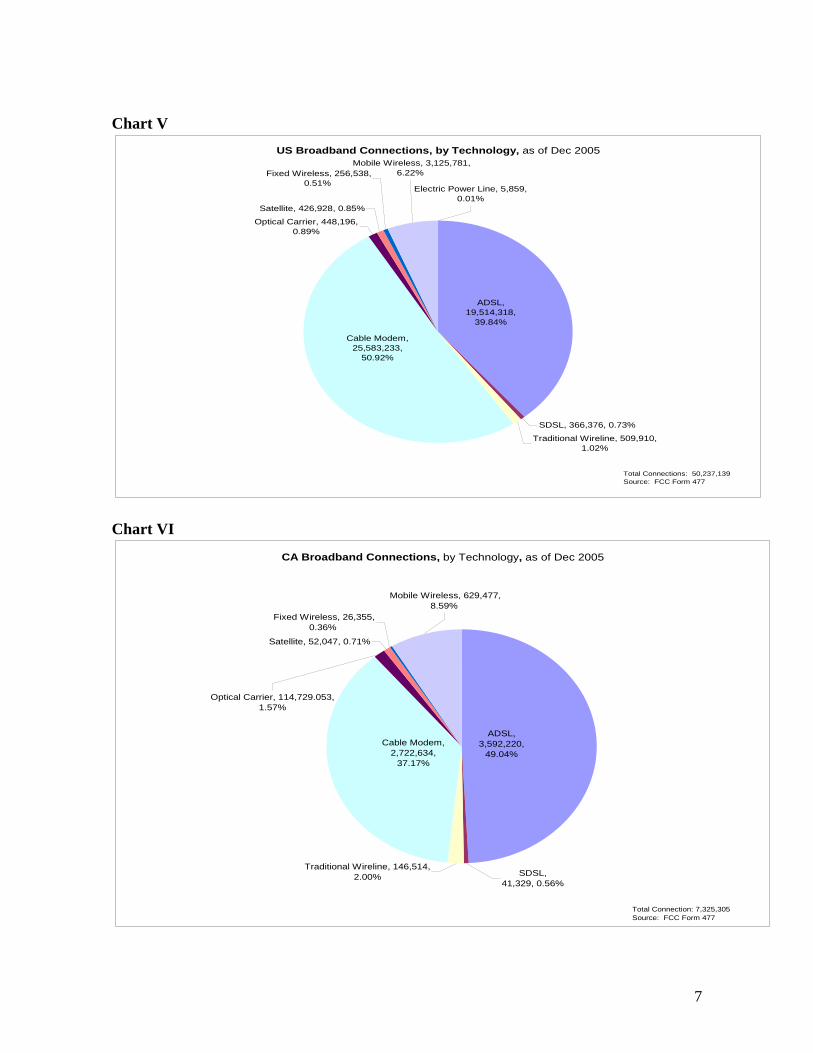
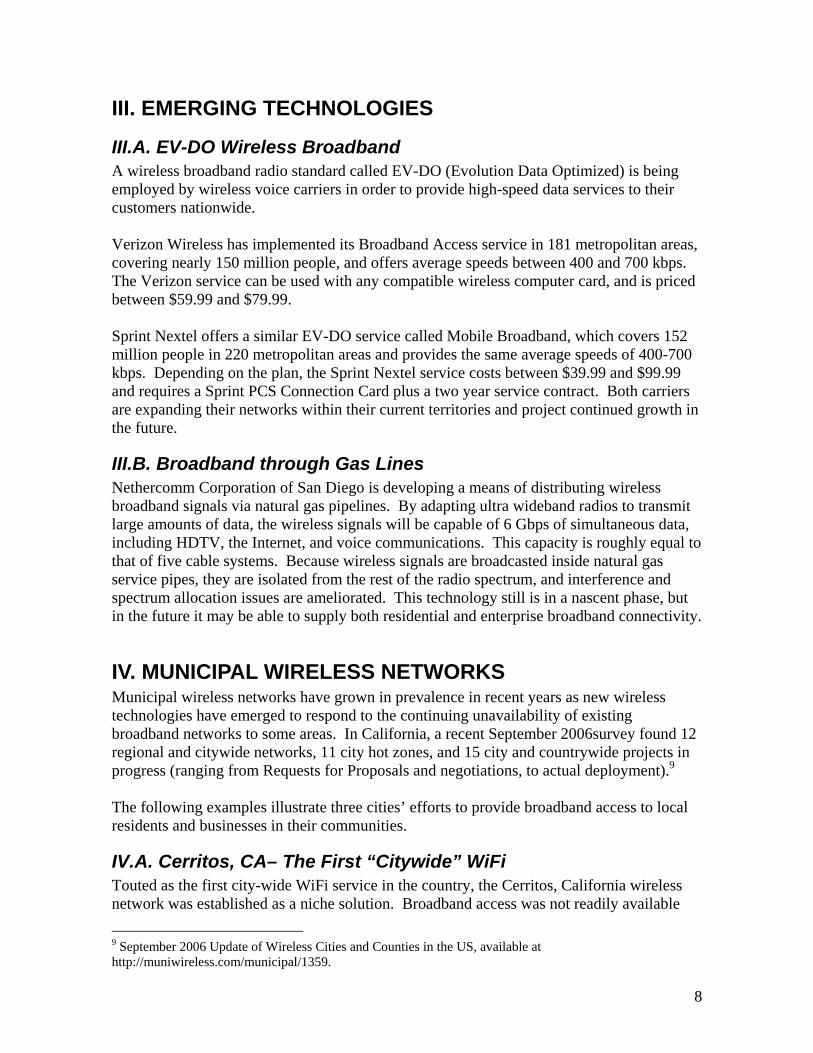
II.B. Deployed Technologies Charts V and VI illustrate that there are significant differences between the competitive intermodal broadband markets in the U.S. generally and in California specifically. Across the U.S., Cable Modem technology provides 51% of reported broadband connections, whereas Asymmetric Digital Subscriber Line (ADSL) provides the second largest number of connections with 40%. The remaining technologies (Mobile Wireless, Fixed Wireless, Satellite, Optical Carrier, and Electrical Power Line) account for a little less than 9% of the national broadband market. In contrast, ADSL accounts for the largest portion of the California broadband connections (49% of connections) and Cable Modem service provides the second largest number of connections, with 37% of connections. All other technologies combined account for the remaining 14% of broadband connections in California.
7
Chart V
US Broadband Connections, by Technology, as of Dec 2005
SDSL, 366,376, 0.73%
Traditional Wireline, 509,910, 1.02%
Optical Carrier, 448,196, 0.89%
Satellite, 426,928, 0.85%
Electric Power Line, 5,859, 0.01%
Fixed Wireless, 256,538, 0.51%
Mobile Wireless, 3,125,781, 6.22%
Cable Modem, 25,583,233,
50.92%
ADSL, 19,514,318,
39.84%
Total Connections: 50,237,139Source: FCC Form 477
Chart VI
CA Broadband Connections, by Technology, as of Dec 2005
Satellite, 52,047, 0.71%
Fixed Wireless, 26,355, 0.36%
SDSL, 41,329, 0.56%
Traditional Wireline, 146,514, 2.00%
Optical Carrier, 114,729.053, 1.57%
Mobile Wireless, 629,477, 8.59%
Cable Modem, 2,722,634,
37.17%
ADSL, 3,592,220,
49.04%
Total Connection: 7,325,305Source: FCC Form 477
8
III. EMERGING TECHNOLOGIES
III.A. EV-DO Wireless Broadband A wireless broadband radio standard called EV-DO (Evolution Data Optimized) is being employed by wireless voice carriers in order to provide high-speed data services to their customers nationwide. Verizon Wireless has implemented its Broadband Access service in 181 metropolitan areas, covering nearly 150 million people, and offers average speeds between 400 and 700 kbps. The Verizon service can be used with any compatible wireless computer card, and is priced between $59.99 and $79.99. Sprint Nextel offers a similar EV-DO service called Mobile Broadband, which covers 152 million people in 220 metropolitan areas and provides the same average speeds of 400-700 kbps. Depending on the plan, the Sprint Nextel service costs between $39.99 and $99.99 and requires a Sprint PCS Connection Card plus a two year service contract. Both carriers are expanding their networks within their current territories and project continued growth in the future.
III.B. Broadband through Gas Lines Nethercomm Corporation of San Diego is developing a means of distributing wireless broadband signals via natural gas pipelines. By adapting ultra wideband radios to transmit large amounts of data, the wireless signals will be capable of 6 Gbps of simultaneous data, including HDTV, the Internet, and voice communications. This capacity is roughly equal to that of five cable systems. Because wireless signals are broadcasted inside natural gas service pipes, they are isolated from the rest of the radio spectrum, and interference and spectrum allocation issues are ameliorated. This technology still is in a nascent phase, but in the future it may be able to supply both residential and enterprise broadband connectivity.
IV. MUNICIPAL WIRELESS NETWORKS Municipal wireless networks have grown in prevalence in recent years as new wireless technologies have emerged to respond to the continuing unavailability of existing broadband networks to some areas. In California, a recent September 2006survey found 12 regional and citywide networks, 11 city hot zones, and 15 city and countrywide projects in progress (ranging from Requests for Proposals and negotiations, to actual deployment).9 The following examples illustrate three cities’ efforts to provide broadband access to local residents and businesses in their communities.
IV.A. Cerritos, CA– The First “Citywide” WiFi Touted as the first city-wide WiFi service in the country, the Cerritos, California wireless network was established as a niche solution. Broadband access was not readily available
9 September 2006 Update of Wireless Cities and Counties in the US, available at http://muniwireless.com/municipal/1359.
9
throughout the community. Verizon only offered limited DSL access, and the city did not have a local cable franchise. In March 2004, Airmesh Networks launched its WiFi service to provide ubiquitous wireless Internet access, consisting of three types of subscription plans: mobile, residential, and business uses, in addition to a specified number of subscriptions for the city government. The WiFi network has been impeded, however, by conflicts with Southern California Edison. The placement of equipment in residential neighborhoods has been a subject of dispute. Moreover, both DSL and cable broadband have since become available in the city, while the WiFi network has remained limited in scope and geographic coverage. The availability of competing technologies and rights-of-way (ROW) conflicts are important to this case as they affect both the demand for and ability to supply wireless broadband service. For Cerritos, the end result is that intermodal competition encouraged citywide broadband access, which is more important than the specific technology that is ultimately deployed.
IV.B. Folsom, CA – Pioneering WiMAX The city of Folsom, California is pursuing a different approach to providing wireless broadband to its residents and businesses. The twenty-two square-mile city has DSL and cable broadband available, but Folsom is planning a wireless network based on WiMAX, a technology with far greater range (up to 30 miles) than regular WiFi networks (roughly 300 feet). WiMAX-enabled equipment could then be used to create smaller WiFi nodes, and WiMAX wireless cards for laptop and desktop computers should be available in 2007. This wireless network is not meant to compete with existing broadband services, and instead is being designed to demonstrate the feasibility of the technology. Intel Corp., a major developer and proponent of WiMAX technology, maintains a 7,000-person plant in Folsom, financed the original feasibility study,10 and will be donating the necessary equipment for a pilot WiMAX network. Through this support, Intel has helped alleviate part of the financial burden of the city, although Folsom still will be responsible for operating and maintaining the network. At the time of this report, the network is still in the planning stages, as the city determines the logistics for equipment locations. The pilot project is estimated to initiate service in early 2007. It will be valuable to follow the progress of this project in order to evaluate the WiMax technology, as well as the model of having a private entity (Intel) so involved in the process. For cities that cannot completely fund wireless networks on their own, the backing and support from a private partner can play a vital and stabilizing role in the development of a project. In the future, Folsom may be able to enhance its competitiveness with other cities, as well as providing a test bed for new technologies.
10 Tellus Venture Associates. “Feasibility Study: Deployment of a Wireless Network in Folsom,” November 8, 2005, available at http://www.tellusventure.com/FolsomStudy.pdf.
10
IV.C. San Francisco “Tech Connect” San Francisco has spearheaded efforts to establish a ubiquitous, free wireless network as part of a larger TechConnect program, designed to increase digital inclusion in San Francisco. Still in the planning stages, a partnership between Earthlink and Google received the winning bid. This partnership is intended to produce the following items:
• Free wireless access (up to 300 kbps) available citywide • Affordable residential rates of ~$20/month (1 Mbps upstream and downstream) • A 6-10 month rollout • “Highly competitive” rates offered for City use • License of the San Francisco TechConnect brand “to Earthlink, Google and service
providers for use in marketing services enabled by the network”11 The City of San Francisco also has formed a task force that will advise the City’s Department of Telecommunications and Information Service (DTIS) on how to increase digital inclusion, particularly through increased access to hardware, training, and relevant content. While this project is still in its nascent phases, it should provide a valuable alternative for broadband access within San Francisco. DSL and cable broadband are not available to all households. In addition, the basic, cost-free wireless network will facilitate access both in terms of cost and location. With Earthlink and Google covering the upfront and ongoing costs of installing and operating the network, the financial risk to the city appears minimal. Issues to be mindful of as the project is launched include how Tech Connect handles training for the public; solutions for those who do not own or cannot afford to own computers; and the development of relevant public content.
IV.D. Silicon Valley Wireless Network12 On a larger scale, development of a regional wireless network is underway in Silicon Valley, called the Silicon Valley Wireless Network (Network). When completed, the wireless broadband network will provide tiered service across San Mateo and Santa Clara counties, an area that includes 42 municipalities, almost 1,500 square miles, and 2.4 million people. The free, basic 1 mbps service will be ubiquitous, is designed predominantly for outdoor use, and will be supported through advertising. Customers also will be able to purchase equipment in order to use the service indoors. In September 2006, the local authorities chose Silicon Valley Metro Connect – a collaboration of IBM, Cisco Systems, Azulstar Networks, and the non-profit organization Seakay – as the vendor for the Network, pending final contract negotiations. More than 30,000 access points will be needed to blanket the region with coverage. Construction could begin as early as January 2007 and will begin with the first municipal agencies granting the necessary ROW authorizations and other approvals. 11 Earthlink/Google RFP Response, Public Version, pp. 13-15, available at http://www.sfgov.org/site/uploadedfiles/dtis/tech_connect/EarthLink_SanFrancisco_RFP_2005-19_PUBLIC.pdf. 12 All background information provided by Wireless Silicon Valley (www.jointventure.org).
11
A potential issue looming over the Silicon Valley Wireless Network project is whether the vendor will be able to negotiate successful agreements with cities, which include those where free wireless service currently exists (such as Mountain View, San Jose, Santa Clara, Sunnyvale, and Cupertino). Also wireline broadband access already exists in these areas. Thus as the project nears implementation, it will be important to analyze the effect, if any, that the Network has on subscribership to existing technologies, such as ADSL and cable broadband. The Network should provide an interesting project to watch because of the potential implications for local competition and the innovative uses of technology (e.g., for public safety) that such a huge network can provide.
V. COMMUNITY-BASED BROADBAND PROJECTS
V.A. Rural Technology and Information Project: Rural Technology and Information Project from Basic Technology to Social Networking13 Project Location: Watsonville, CA Project Dates: 2000-Current Partnerships: Association of Mexican American Educators (AMAE), Pajaro Valley (Current Lead Agency), Latino Issues Forum (Original Lead Agency), Pajaro Valley Unified School District (PVUSD), City of Watsonville. Place-based partnerships: Alianza Charter School (learning site), Marinovich Community Center (learning site). Advisory Board Representation: PVUSD Healthy Start , Alianza Elementary Charter School, Early Academic Outreach Program UCSC, Watsonville City Councilmember, PVUSD Superintendent’s Office. Original Funders: Washington Mutual Foundation, Wells Fargo Foundation, Community Technology Foundation of California, AT&T,14 SBC. Project Overview: The large immigrant population in Watsonville struggles with poverty and isolation. Though the area is just an hour south of Silicon Valley, this small rural city did not have a Community Technology Center in 1999. In that year, the Latino Issues Forum (LIF)
13 All information on this project was provided by Ana Montes, Director of Technology and Consumer Education, Latino Issues Forum during telephone interviews with staff on 9/12/06. (Notes on this discussion are on file with Commission). Additional background information was provided by Rural Technology and Information Project (unpublished manuscript, on file with Latino Issues Forum). 14 Grants were provided prior to the 2005 merger of SBC and ATT, hence they are noted separately.
12
implemented a program similar to a successful technology education project that it had launched three years earlier in San Francisco. Technology offered the hope of providing better jobs and increased wages; connections with family in California and in other countries; increased social capital within Watsonville; and educational opportunities for children and parents. For families to use technology effectively, however, they had to develop a fluency that is impossible to gain without providing multiple technology access points. The Rural Technology and Information Project (R-TIP) focused its initial efforts on the families at one school, creating a “total learning environment” at home, at school, and within the community. The project provided Alianza Charter School and Marinovich Community Center with hardware (refurbished and new) and staff training (provided by staff from UC Santa Cruz). Families – including parents, children, and sometimes even grandparents – attended twelve hours of basic computer and technology training sessions at Alianza Charter School and the Marinovich Community Center. These lessons were taught in both English and Spanish and included topics such as the Windows OS, Microsoft Word, and Internet and Email use. In addition, R-TIP provided significant training in the use of a community website. The community website was designed to foster increased civic engagement by participants and strengthen community ties among the families, school, and community center.15 Once participants completed the classes, the El Pajaro Unified School District provided each family with a computer, printer, modem, and Internet access. Families were loaned this equipment free of charge for a full school year. Teachers at the charter school utilized their training to incorporate more technology into the classroom, and the community center continued to offer additional training and workshops to families during the year. In 2003, three years after the project had been implemented, LIF turned leadership of the project over to a primary local partner, the Association of Mexican American Educators, Pajaro Valley. LIF is a San Francisco based non-profit organization, but was able to enter the Watsonville community and incubate a successful, sustainable community program. It achieved this success primarily due to two factors: (1) the exacting amount of planning it completed prior to enrolling the first family and (2) local partners who were deeply invested in the project. LIF was able to secure most funding before any work in Watsonville began, because its funders knew that the organization would engage in a large deal of pre-planning before implementing the project. In particular, LIF devoted a significant amount of time to developing its relationship with local partners. First, local community and government leaders were interviewed to determine which groups should be approached to join the project. Next, LIF held a community meeting to discuss LIF’s and the community’s vision. After all had agreed to the project’s activities and purpose, the participants developed a shared vision, details of the three-year commitment, and formal MOUs.
15 Today the former and current participants still use the website, and much of the content is produced locally by participants in Marinovich’s creative writing classes.
13
Project Challenges: Many non-profit organizations in rural areas (e.g., the local parks and recreation department or the health department) rely on government funding. These funding sources tend to have more bureaucratic structures and politics surrounding them, and the flexibility that sometimes exists in foundation grants is more difficult to achieve. LIF discovered that government funding constraints could pose difficulties, particularly in the start-up phase when each group was defining its role. Foundations often request applicants to incorporate a new project element each time a program applies for funding. This request can lead to sponsorship of new and innovative programs, but has caused difficulties for the R-TIP program. As it grows and adds new elements, it still focuses primarily on providing basic technology training and access. Lessons Learned: Funding projects before they have solidified their partners is possible as long as the founding organization has developed clear criteria for the project and partners; is utilizing general methods that have proven successful; and demonstrates the need for funding before selecting partners. Both equipment (including funding or in-kind donations) and cash grants are vital for a community technology program’s funding. While training is important, reliable equipment is necessary to ensure related economic development and community building benefits. The multi-dimensional model LIF used proved to be even more successful in the rural setting than it was in the urban setting. LIF attributed some of this success to the dearth of existing resources and the combined individual and organizational commitment that stakeholders had to the community.
V.B. Little Tokyo Service Center: Little Tokyo Service Center (LTSC): From Technology Training to Technology Access16 Project Location: Los Angeles, CA Project Dates: DISKovery Community Technology Center: 1999-present LTSC Broadband Project: 2003-Present Current Funders: SBC, Southern California Edison, Community Technology Foundation of California, California Consumer Protection Foundation, Los Angeles Community Redevelopment
16 All information provided by Davis Park, Director of Community Technology Programs, Little Tokyo Service Center during telephone interviews with staff on 8/4/06 and 9/12/06.
14
Agency, California Department of Education, English Literacy and Civic Education Program (EL Civics). Corporate In-Kind Supporters: Tropos Networks, Trango Broadband Major Partners: Belmont High School, All Peoples Christian Center, Visual Communications, UCLA Extension, Central High School, Los Angeles Department of Water and Power. Project Description: In 1999, the Little Tokyo Service Center (LTSC), a Community Development Corporation located in Los Angeles’ Little Tokyo Neighborhood, opened the DISKovery Center, a community technology center offering classes in English and Japanese. The center has grown incrementally. Initially it only offered training and access in computers and the Internet. As community needs were further identified, the program grew. Today, LTSC provides training on a number of different technology topics, from basic computer operation to digital video production. It operates a mobile learning facility, manages a newly created computer adoption program, and has begun work to expand affordable broadband access community-wide.17 LTSC’s project to expand affordable broadband access began in 2003 through a partnership with the Los Angeles Department of Water and Power (DWP). DWP has developed an extensive fiber optic network throughout Los Angeles, and the partnership resulted, in a point-to-point wireless network (with symmetric speeds of 5 Mbps) between LTSC and three non-profit organizations located in Little Tokyo. LTSC’s data center, also made possible through this partnership, currently hosts over a dozen websites and several hundred email accounts. While LTSC did not receive cash from DWP, it received an in-kind donation of hardware and a fiber optic connection. After the initial planning and investments, however, LTSC was no longer sure that its primary focus should be on providing broadband access to local organizations. First, LTSC did not have the capacity to become a low-cost Internet Service Provider. Second, smaller organizations did not need the amount of broadband capacity LTSC was offering them. With these two pieces of information, LTSC redirected the project’s focus to address broader community development needs. LTSC conducted community surveys and found there was a need for WiFi Internet services. As a result of these surveys, the project is now developing a wireless mesh network that is aimed at residents and tourists; features a community portal; and supports a public safety system. While the wireless network is primarily an economic development tool, the portal will create a variety of community-building opportunities for current and future neighborhood residents. With approximately 2,000 market rate housing units likely to bring a flood of 17 Since it began, the DISKovery Center has trained over 2,000 youth, seniors, families, and adults. Through its recently developed computer refurbishment and adoption program, DISKovery has distributed 40 free computers to low-income households in Little Tokyo and Los Angeles.
15
new residents into Little Tokyo, LTSC believes the portal can preserve and promote the local community’s cultural and historical significance. The portal, when completed, will provide a space both for existing residents to describe their neighborhood’s rich cultural history, and for new residents to easily learn about their new home. LTSC plans to use content created at the DISKovery center and provide additional training at DISKovery for community residents. Challenges: Developing dynamic community content is resource intensive. The need for a great deal of resources is particularly evident in areas where residents lack personal technology resources and often need both training and access before creating content. LTSC is looking at creative ways to fund ongoing community content. The organization currently is assessing whether it should pursue a self-sustaining business model; a mixed model relying on grants and income; or a traditional grant funded model. Volunteers compose a vital part of LTSC’s community technology projects. Over the last seven years, however, LTSC has learned that even the most committed volunteers cannot be mistaken for staff, which are paid to be consistently available. Though finding funding for skilled employees who understand both technology and people is difficult, LTSC has learned to make this activity a priority. Lessons Learned: While years of work in the community technology field has made LTSC technologically savvy, this project is LTSC’s first attempt at creating a ubiquitous community wireless network and portal. To help LTSC, the local community redevelopment agency is providing LTSC the support of two consulting agencies that have wireless networking and portal expertise. A characteristic of a successful organization is the recognition that knowledge is needed, but that expertise may best reside outside the organization. When the need can be substantiated, supporting an organization’s request for consulting often results in a better project. LTSC views each project through the lens of its community development mission. Though its activities have expanded since the DISKovery Center opened, LTSC’s continued focus on community development ensures that each project and project’s focus – from service provider for local non-profits to wireless network and portal developer – is a means to addressing the same goal: meeting the community development needs of Little Tokyo. LTSC shows that projects are often more successful and less costly when participating organizations develop strong partnerships and leverage existing resources. For example, DWP’s interest in using its fiber for community development purposes has been critical to the success of this project.
V.C. Tribal Digital Village: Project Location: 18 Tribal Communities in San Diego County
16
Project Dates: 2001- Present Partnerships: AIR (American Indian Recruitment), All Tribes American Indian Charter School, Arc-Tech, Barona Museum & Cultural Center, Blue Moon Consulting, California Community College Satellite Network (CCCSAT), California Polytechnic University, San Luis Obispo, California State Librarian, California State University, San Marcos, Co-Dharma, Cultural Conservancy – Storyscape, Deloitte Consulting, Educational System Planning, Educational Technology Consultants, Fetterman and Associates, The Grove Consultants International, Indian Health Clinic, iVentures, JB Computers, Lone Eagle Consulting, Oceanside Small Business Development Center, Palomar College - American Indian Studies Department, MRRDesign, Robert Freeman Jr. Associates – Vision Poster Artist, Qualcomm, San Diego State University, Tamsco, Televideo of San Diego, Triadigm Technologies, University of California, San Diego - Ethnic Studies, University of California, San Diego – HPWREN, University of California, San Diego - Instructional WWW, Development Center, Valley Center School District, and Warner Springs School District Funders: 2001-2004: Hewlett-Packard, TANF 2004-Present: E-Rate, Ford Foundation, PIRC, (Individual Tribes also apply for grants) Description of Project: In 2001 Hewlett-Packard awarded the Southern California Tribal Chairman’s Association a $5 million Digital Village grant to develop a wireless network throughout Southern California tribal lands. Today, the network connects 18 tribal communities, which are located hundreds of miles apart and separated by mountainous terrain. Within these communities, approximately 50 tribal government and community buildings are connected to the network. The Digital Village projects represented a change in grant making for HP, which previously had been making smaller, shorter-term grants. HP first awarded a Digital Village Grant to East Palo Alto, and then began soliciting other applications. HP received about 200 applications, and of the six finalists, only Tribal Digital Village (TDV) represented a rural area. TDV also provided some assurance that it could meet HP’s audacious goals: Working with UCSD’s High Performance Wireless Research and Education Network (HPWREN), three tribes had already developed a small scale wireless network, and were using the technology to provide distance learning across the tribes.18 In its nearly six years, the TDV project has created more than just a physical network, it has facilitated civic engagement, economic development, educational access, and cultural preservation. Staff created a private portal to host governmental, cultural, and educational information. Using multimedia equipment, youth and adults are creating digital histories
18 Grimm, Ernie. Native Bytes. SanDiegoReader.Com (3 Jan. 2002), available at: http://www.sdreader.com/php/cityshow.php?id=719.
17
and preserving native languages. Residents of remotely located reservations, which today still lack reliable phone service, are now able to benefit from distance education programs. In addition, the TDV project helped promote the launch of two technology-based businesses. TDV staff hopes that these businesses will provide the underpinnings for a for-profit arm of the organization, which will produce earnings that will help sustain the non-profit activities. TDV currently is expanding, upgrading equipment, and developing a pilot wireless mesh network. Project Challenges: Much of TDV’s original hardware was purchased at the same time, at the beginning of the HP grant. Consequently all the equipment needs replacement at approximately the same time. The need for hardware replacement places a huge funding strain on the organization, because TDV is unable to cycle equipment out at various times, and instead must find funding to replace everything at once. Moreover, the wireless network is dependent upon FCC unlicensed spectrum, which affords staff no primacy rights within the radio spectrum. Usage of unlicensed spectrum makes the wireless network subject to interference by other users. Unpredictable weather in the deserts and mountains of San Diego County, combined with the size of the network, results in more environmental harm on the line-of-site nodes (which usually maintain a speed of 45 Mpbs) than in many wireless networks. While it planned for some challenges, TDV has only been able to secure funding for two staff members that can devote their time to providing the required daily maintenance. In some instances, lack of additional staffing has required TDV to place less emphasis on other technical issues, like website content, so that it can maintain the physical wireless network. Lessons Learned: TDV used tribal nation members to staff this project. While the technical staff had some networking knowledge, no one had before created a network this sophisticated. Using and training local staff is an important economic development tool, but funders should consider providing tools to ensure that local staff has access to the knowledge that it needs. In this case, the grant provided a mentor from UCSD, who was a networking expert, to provide technical assistance. While supplying a mentor is not the same as supplying full-time staff, the mentor’s advice nonetheless proved invaluable to the project. HP was able to provide more than just funding in the initial years of the TDV project. Staff members noted that they learned a lot from HP about quality of service and strong customer relations. From the onset, TDV believed strongly that providing inferior customer service simply because the Internet access was free to tribes and individuals was unacceptable. HP was able to provide models for staff so that it could better learn how to provide commercially comparable customer service. These models were an important piece of HP’s support, even though they had no funding component. Other funders might consider additional types of non-financial support that they can provide to entrepreneurial grantees.
18
VI. STATE BROADBAND INITIATIVES States can stimulate broadband access and adoption by creating incentives for providers (supply-side) or by creating incentives for users (demand-side). Several major reports in the last four years have categorized and ranked a variety of broadband initiatives launched by individual states.19 The discussion below covers some of the highest profile state initiatives. In 2003 TechNet lauded Michigan’s efforts to offer supply and demand side programs. Kentucky, while ranked by TechNet in the middle of the states, was nevertheless highlighted and continues to be profiled for its progress, most recently in the Consumer Union’s July 2006 report as a model state for broadband development. States profiled here – Kentucky, Michigan, North Carolina, and Illinois, – vary in their demographic and geographic profile, as well as their level of broadband access and adoption. The similarity among these states is their coordinated, analytic approach to statewide broadband initiatives. These states know the extent of broadband access and adoption at the household level, and track changes at least annually. Integral to this tracking is detailed mapping and inventories, most often supplied directly by the universe of broadband providers. These states also have publicly articulated goals about how much broadband access and usage they expect to achieve and when. They implement the strategies they define and demonstrate the effectiveness of large-scale, public-private efforts aimed at specifically increasing broadband deployment and access.
VI.A. ConnectKentucky (www.connectkentucky.org): A 501(c)(3) not-for-profit organization, ConnectKentucky was created, under the leadership of Governor Ernie Fletcher in 2004, to develop and implement Kentucky’s broadband initiative. The organization’s mission is to “support technology-based economic development” and expand broadband access to all Kentuckians by 2007. ConnectKentucky operates on an annual budget ranging from $1.5 - $2.2 million and has a staff of 30 people partnering with private broadband service providers as well as local leaders in each county. ConnectKentucky utilizes an innovative model to sustain its steering committee. Steering committee members pay an annual fee of $20,000, and in return these members contribute to the policy direction of the organization, receive marketing exposure, and are provided with government lobbying support.20 ConnectKentucky is well on its way to meeting its goal of 100% broadband access to all Kentucky households by 2007. It has increased broadband availability in the state by 45% since the spring of 2004. The organization’s activities include GIS mapping of broadband access (including carriers, most cable companies, municipal wireless projects, and other wireless projects); community
19 TechNet, The State Broadband Index: An Assessment of State Policies Impacting Broadband Deployment and Demand, 2003, p. 24; Alliance for Public Technology (APT) – Comprehensive Survey of State Broadband Programs Released at Alliance for Public Technology Policy Forum, Gaps in Deployment Underscore the Need for a National Broadband Policy, 2004; Broadband Deployment in California, California Public Utilities Commission, May 5, 2005, Appendix B. 20 http://www.connectkentucky.org/partnership/become.htm.
19
benchmarking of broadband access and uses; refurbishment and donation of government computers; and high-level research. ConnectKentucky’s GIS mapping is of particular interest and should be considered as a way to locate broadband gaps. The CPUC will receive even more detailed broadband information pursuant to the video franchising bill (AB 2987) if that bill is signed into law. ConnectKentucky has two ancillary divisions: The Center for Technology Enterprise, Inc. (CiTE) and the Technology Solutions Group, both of which provide technology consulting. CiTE is a non-profit organization, while the Technology Solutions Group provides consulting services and actively “promotes their [the Steering Committee’s] services and products.”21
VI.B. e-NC (www.e-nc.org): e-NC “is a grassroots initiative to encourage all North Carolina citizens to use technology, especially the Internet, to improve the quality of life and their economic prospects.”22 The initiative began in 2000, through legislative mandate, and originally focused solely on rural areas. Signed in 2003, House Bill 1194 subsequently created the official e-NC Authority, which incorporated the original Rural Internet Access Authority and expanded the Authority’s work to include all North Carolinians, not only those living in rural areas. E-NC is currently authorized to operate through 2011. Since inception, e-NC has acted as a grant maker, grantee, researcher, policy advocate, and convener. In its early years the Authority awarded $30 million in connectivity grants. These grants were primarily awarded to counties, but also to specific government institutions, such as libraries, consortiums, and private enterprise. e-NC originally had a goal of 100% Internet access within three years. By the end of 2003, e-NC reported that broadband access was available to 80% of the state.23 Last year e-NC operated on a budget of approximately $4 million.24 e-NC’s goals through 2006 focus on the spectrum of broadband initiatives: technology- based economic development; research and connectivity; advocacy and policy; supply- building projects; and demand-building endeavors. Individual initiatives include the following: Identifying areas still in need of affordable access and working with service providers to fill these gaps, and launching four business and technology telecenters (soon to be followed by four more telecenters). Telecenters provide a variety of technology needs for communities and enterprise. In the most rural areas, the telecenters provide Internet service free of charge. e-NC also brings its comprehensive strategies to the grassroots level. It works with its 85 rural counties to perform broadband inventories, public access and education, and strategize to meet the needs of unserved and underserved groups.
21 http://www.connectkentucky.org/about/structure.htm (see “Technology Solutions Group”). 22 http://www.e-nc.org. 23 http://www.e-nc.org/pdf/narrative_history_future_focus.pdf. 24 e-NC Annual Report 2005.
20
e-NC was at the forefront of collecting data and making public GIS maps detailing broadband access and other related information, such as the location of health care facilities and political district boundaries. At the wishes of the carriers, some of the broadband information is unavailable online, but may be provided verbally or through specific requests by counties. With the support of the state and new grants, e-NC has established business and technology telecenters in rural areas, provided support to local e-government initiatives, and developed a comprehensive e-communities initiative.
VI.C. Michigan Broadband Development Authority (www.broadbandauthority.org): The Michigan Broadband Development Authority (MBDA) is a four-year-old state agency created by the former Governor of Michigan and with bipartisan support of the legislature. The MBDA was established in 2002, and is the oldest statewide initiative of its kind. Its mission, “to expand broadband access for Michigan’s citizens and businesses,” is accomplished by providing low-interest loans to expand broadband Internet access throughout Michigan. The Authority has funded DSL, fiber, cable, wireless, satellite, and BPL expansion, as well as “hardware, software, training, and installation.”25 Michigan originally provided a $50 million line of credit to the Authority. State officials believed that the organization would eventually become self-sustaining. Since inception, the Authority has reviewed over $100 million in loan applications and approved approximately $30 million worth of loans. The agency’s political fortunes, however, turned in early 2006. An audit questioning the Authority’s business plan, disclosure that it had accumulated $10 million in debt, and public revelations about the size of staff salaries propelled calls for the organization’s closure by the same legislature that once voted for its creation. As of this writing, the Authority is no longer accepting loan applications, though it is monitoring current loans and completing a rural broadband initiative. Its future is uncertain.
VI.D. Illinois IllinoisConnect.org is the statewide broadband deployment and access project of Lieutenant Governor Pat Quinn. Illinois is looking to follow examples set by North Carolina and Michigan, as it considers these states to be models of how to be an “e-champion” and coordinator of all state broadband efforts.26 The project contains two elements: the Broadband Deployment Council and the Technology Immersion Pilot Project. In addition, the website expresses support for community technology (networks, hardware, and training) and provides several research-oriented resources.
25 http://www.michigan.gov/cis/0,1607,7-154-28077_28233_28254-72930--,00.html. 26 Illinois Online, October 2004 http://standingupforillinois.org/pdf/IllinoisOnline.pdf.
21
VII. STATE MAPPING PROJECTS Mapping is a means of conveying complex geospatial information in an easily understood, intuitive format that informs and supports intelligent public policy analysis and decision making.27 Within the California state government, the California Resources Agency’s Geospatial Information Office (GIO) is charged with leading and coordinating the development, licensing and sharing of geospatial data by California public and private entities.28 The GIO maintains the California Environmental Information Catalog, an online directory for reporting and disseminating framework data. At present the maps on the broadband page of the catalog focus primarily on the value of broadband for telemedicine.29 Telecommunications Division staff supports the GIO’s efforts to develop and coordinate mapping capabilities that will provide broadband deployment information for California policymakers and broadband providers. As of this report, Kentucky, Vermont, North Carolina and Wyoming have produced the best publicly available maps of broadband access and adoption. Kentucky and Wyoming’s mapping projects were managed by private consultants working cooperatively with state mapping and infrastructure agencies. The consultants took the lead on the data collection. Vermont did the data collection and produced the maps in-house. The following three state mapping projects illustrate cooperative mapping projects that are providing mutual beneficial broadband deployment information for state policymakers and broadband providers.
VII.A. Kentucky Connect Kentucky was and is able to collect data on private broadband deployment by exchanging this data for “market intelligence” at a household-by-household level. The market intelligence is developed through statewide surveys and concerted outreach efforts. For example, Connect Kentucky sponsored a live interview survey30 of more than 10,000 state residents (approximately 90 people in each of the 120 counties) to develop an understanding of which people are likely to subscribe and why. Using the data from broadband service providers, Connect Kentucky, in cooperation with the state’s Infrastructure Authority, creates maps31 that overlay broadband service areas of ILEC, CLEC, cable, wireless, and municipal broadband providers on county boundaries and incorporated cities. These maps also include landmarks of all electronic towers and antennae, water tanks, roads, and highways.32 These maps are produced separately for each
27 ESRI GIS and Mapping Software, Industries Overview: http://www.esri.com/industries.html 28 http://gio.ca.gov 29 http://gis.ca.gov/catalog/BrowseCatalog.epl?id=1199 30 http://www.connectkentucky.org/NR/rdonlyres/2F6BAAC1-A6D0-4DD7-BEDF-385030488D6C/0/CKdocSRSBroadbandAdoptionBenchmarks.pdf , p. 17. 31 http://kia.ky.gov/broadband/data.htm. 32 http://kia.ky.gov/broadband. See links to maps in “Resources” box on the right-hand side of the page.
22
county33 and for each type of broadband technology.34 The maps were the result of a collaborative effort between the broadband providers in the state. The market intelligence also facilitates Connect Kentucky’s success in luring broadband service providers to unserved and underserved areas by promising customers will subscribe to the service and then delivering on its promises. Connect Kentucky stresses that its efforts are grass-roots, not top-down. In a state of a little over 4 million people35, Connect Kentucky works at least weekly with teams of leaders in each of its 120 counties. In just over a year, Kentucky has increased broadband usage by 45% in the state. Kentucky’s annual broadband report is able to confidently state the percentage of homes that have broadband access and the percentage of homes that own computers and subscribe to broadband services.36
VII.B. Vermont Vermont has stated a goal of ensuring that 90% of homes and businesses (already with phone) have broadband access by 2007, and 100% of homes & businesses (already with phone) have this access by 201037 Beginning in 2002, Vermont issued its first maps depicting where DSL, cable modem, wireless, and wireline broadband services are available in the state. The maps have since been updated to show data current through 2005. These maps show detailed coverage areas for each type of broadband technology, on maps depicting the 237 towns in Vermont. A typical Vermont town is 45 square miles. Only 10 of the 237 towns have populations over 10,000. The maps also are overlaid on population density shading.38 The Vermont Department of Public Service (DPS) collects data for the maps by contacting each individual broadband provider in the state. Since Vermont’s DPS is the franchising authority for cable providers, cable providers already submit data in annual reports. For the broadband maps, the largest cable providers, Adelphia and Charter, provide electronic GIS data. Remaining cable providers provide paper maps. Vermont’s independent telephone companies provide nearly ubiquitous broadband. Verizon, which services 82% of Vermont households, reports DSL capability per wire center and the DPS estimated broadband availability by measuring distance from the Central Offices. Finally, wireless Internet Service Providers provide wireless propagation maps, which include GIS data for the wireless towers, and DPS estimated broadband coverage from the towers. Vermont has estimated that if Verizon were to offer DSL throughout its service area, then the goal of 100% broadband access would be reached. Vermont has created an incentive 33 http://kia.ky.gov/broadband. See links to individual County maps in “Resources” box on the right-hand side of the page. 34 http://kia.ky.gov/broadband/data.htm. See links to maps by broadband technology under “Broadband Layers” section. 35 Data source: http://www.thinkkentucky.com/kyedc/pdfs/kyfactsbk.pdf. 36 http://www.connectkentucky.org/NR/rdonlyres/F6FF10B6-3ACB-42F3-AE0A-F11E4777507C/0/2006ConnectKentuckyProgressReport.pdf , pp. 16-17. 37 http://publicservice.vermont.gov/pub/state-plans/TelPlan04/07infrastructure.pdf, pp. 6-3. 38 http://publicservice.vermont.gov/pub/telplan4-mapgallery.htm.
23
regulation plan for Verizon that encourages it to offer broadband service to 80% of its access lines by 2010, as compared to 56% of its lines today.39 Vermont also has established a Broadband Council that monitors broadband deployment projects at the municipal, regional, and state levels.
VII.C. Wyoming Wyoming’s broadband initiatives are guided by the Wyoming Telecommunications Council, established in 1989. The stated goal of the Council is to achieve universal broadband access in the state. To this end, the Council is focusing on mapping and supply-side analysis to “fill in the gaps” where no broadband facilities are currently deployed.40 The Council partnered with CostQuest Associates to collect data on current facilities deployment, describe the areas lacking access, and estimate the least-cost technology to bring broadband to the area. The Council also worked with 30-40 broadband service providers, serving Wyoming’s serving 23 counties and over 40 towns. The data collection phase of the mapping project was the most time consuming. Surveys sent to the carriers requested node locations, Dslams locations, and tower locations. Providers did not disclose actual customer locations. Although requested digitally, most providers responded with hard copies and CostQuest digitized the data. The mapping of the service provider data was an interactive process, with providers correcting versions of the maps as the maps were produced. The maps were overlaid with road data from the public safety agencies and transportation agencies. Wire center boundaries were supplied by the state Public Utilities Commission. Wyoming’s use of the data and maps emphasizes supply side strategies. The broadband data was overlaid on census block tracts with households randomized throughout the census block. CostQuest identified areas currently unserved by broadband but likely candidates for deployment, termed “low-hanging fruit.” CostQuest then analyzed the cost of various technologies to serve the particularities of the region, including DSL, cable modem, fixed wireless, and satellite service. CostQuest estimated the lowest cost technology to be fixed wireless broadband service, at a cost of $1,000 per customer for service installation. CostQuest is currently in the third phase of the project, and is updating the data and making it publicly available via website. Complete information is scheduled to be available at the beginning of 2007.
39 http://www.state.vt.us/psb/orders/2006/files/6959_7142pressrelease.pdf. 40 See http://cio.state.wy.us/telecom/Annual_Rpts/2005-Annual%20Report.pdf.
24
VIII. CALIFORNIA BROADBAND DEPLOYMENT MAPS41
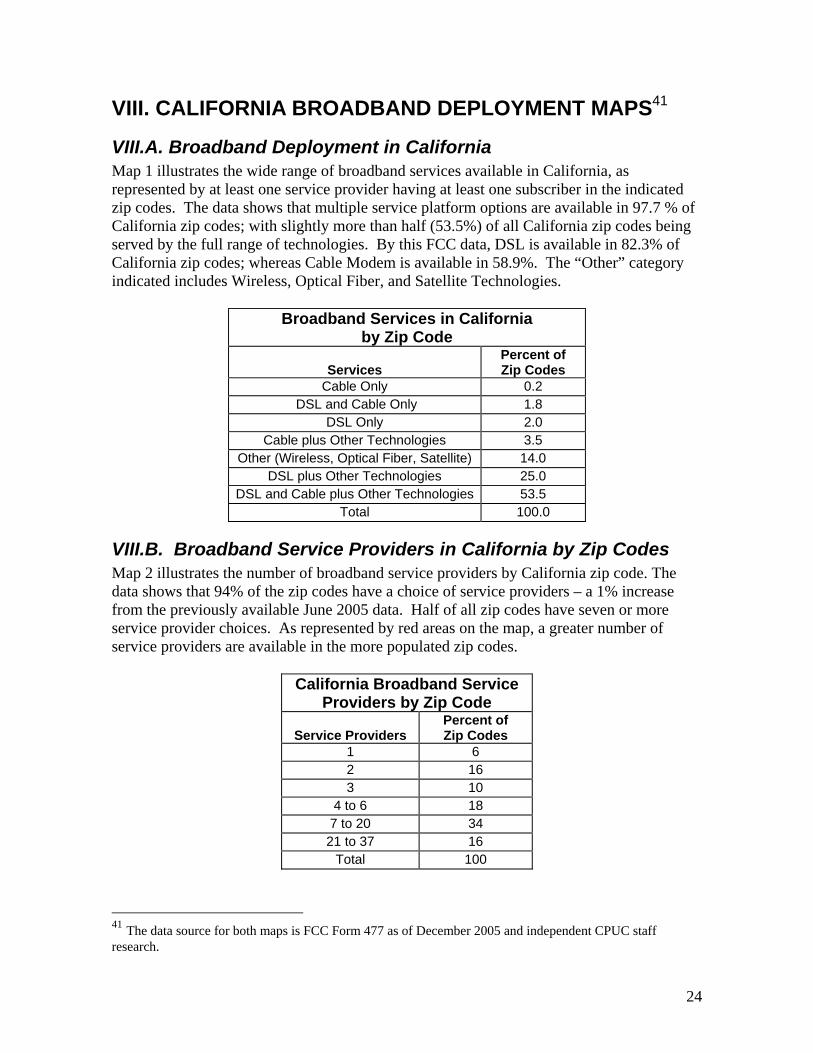
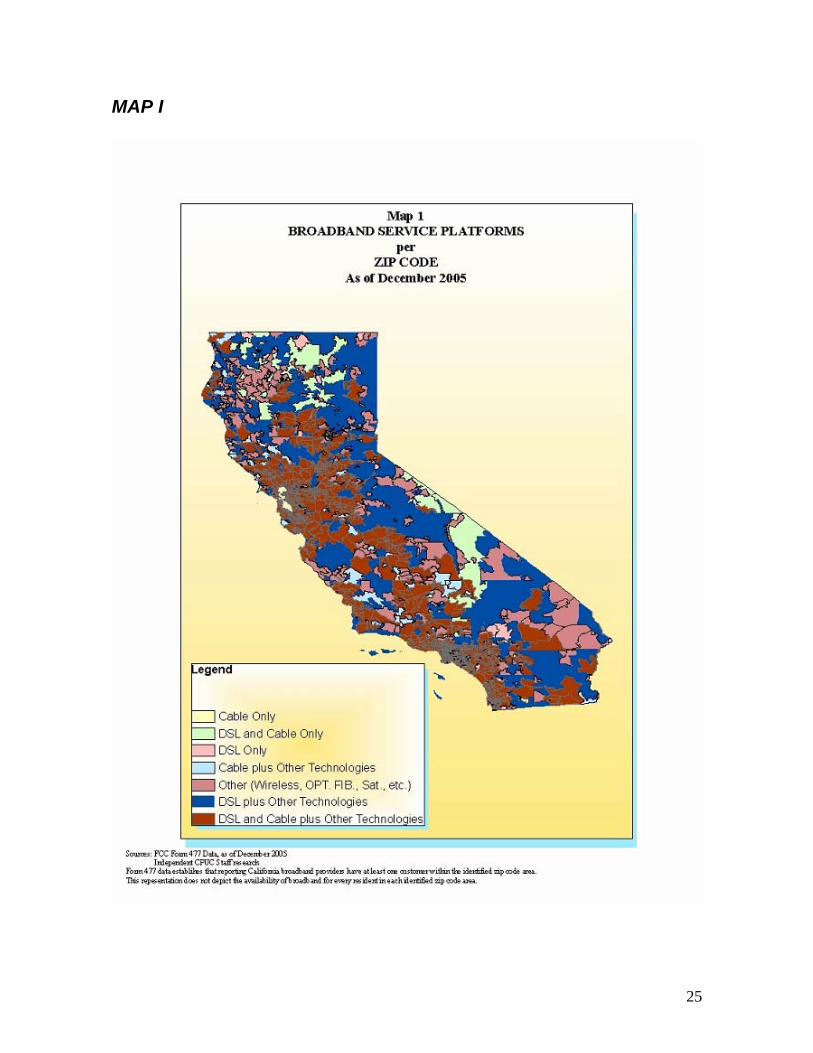
VIII.A. Broadband Deployment in California Map 1 illustrates the wide range of broadband services available in California, as represented by at least one service provider having at least one subscriber in the indicated zip codes. The data shows that multiple service platform options are available in 97.7 % of California zip codes; with slightly more than half (53.5%) of all California zip codes being served by the full range of technologies. By this FCC data, DSL is available in 82.3% of California zip codes; whereas Cable Modem is available in 58.9%. The “Other” category indicated includes Wireless, Optical Fiber, and Satellite Technologies.
Broadband Services in California by Zip Code
Services
Percent of Zip Codes
Cable Only 0.2 DSL and Cable Only 1.8
DSL Only 2.0 Cable plus Other Technologies 3.5
Other (Wireless, Optical Fiber, Satellite) 14.0 DSL plus Other Technologies 25.0
DSL and Cable plus Other Technologies 53.5 Total 100.0
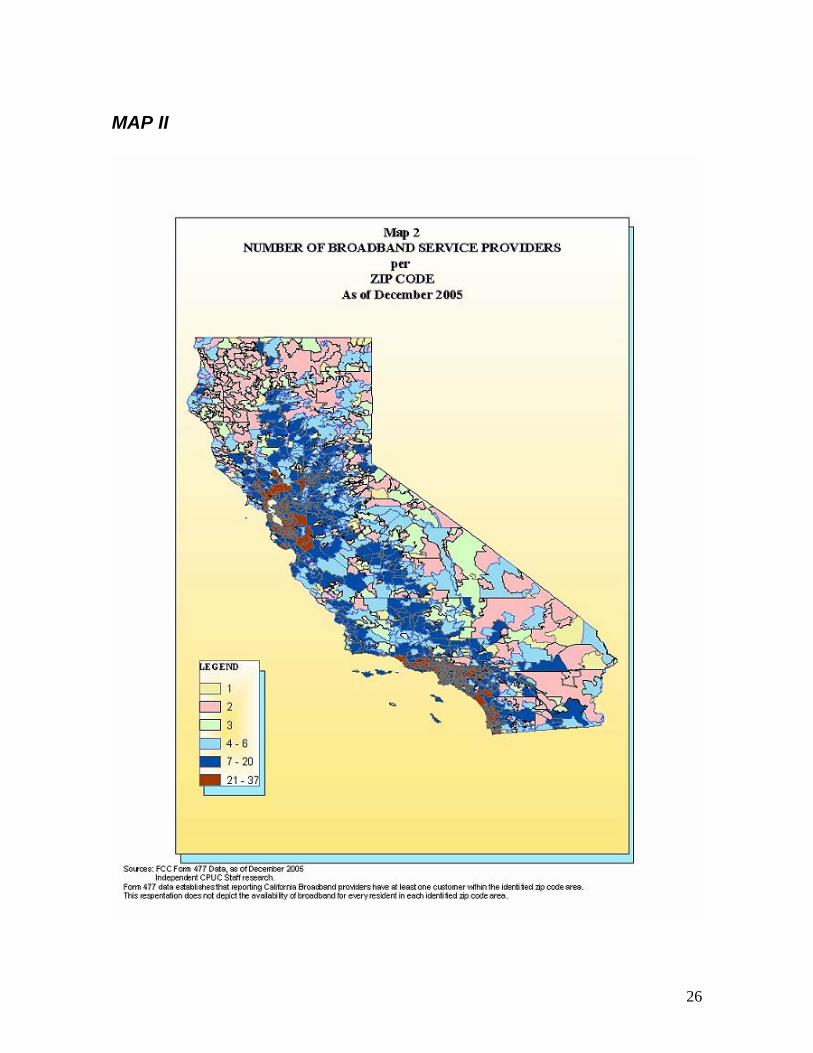
VIII.B. Broadband Service Providers in California by Zip Codes Map 2 illustrates the number of broadband service providers by California zip code. The data shows that 94% of the zip codes have a choice of service providers – a 1% increase from the previously available June 2005 data. Half of all zip codes have seven or more service provider choices. As represented by red areas on the map, a greater number of service providers are available in the more populated zip codes.
California Broadband Service Providers by Zip Code
Service Providers
Percent of Zip Codes
1 6 2 16 3 10
4 to 6 18 7 to 20 34 21 to 37 16
Total 100
41 The data source for both maps is FCC Form 477 as of December 2005 and independent CPUC staff research.
25
MAP I
26
MAP II