Embed Size (px)
Citation preview
Climate Resilient and Sustainable Transportation: Strategic Economic
and Financial Management challenges and opportunities with
FAST Act
Webinar Moderator: Silvana V Croope, Ph.D.
Climate Change, Resilience and Sustainability Strategist Delaware Department of Transportation
2016
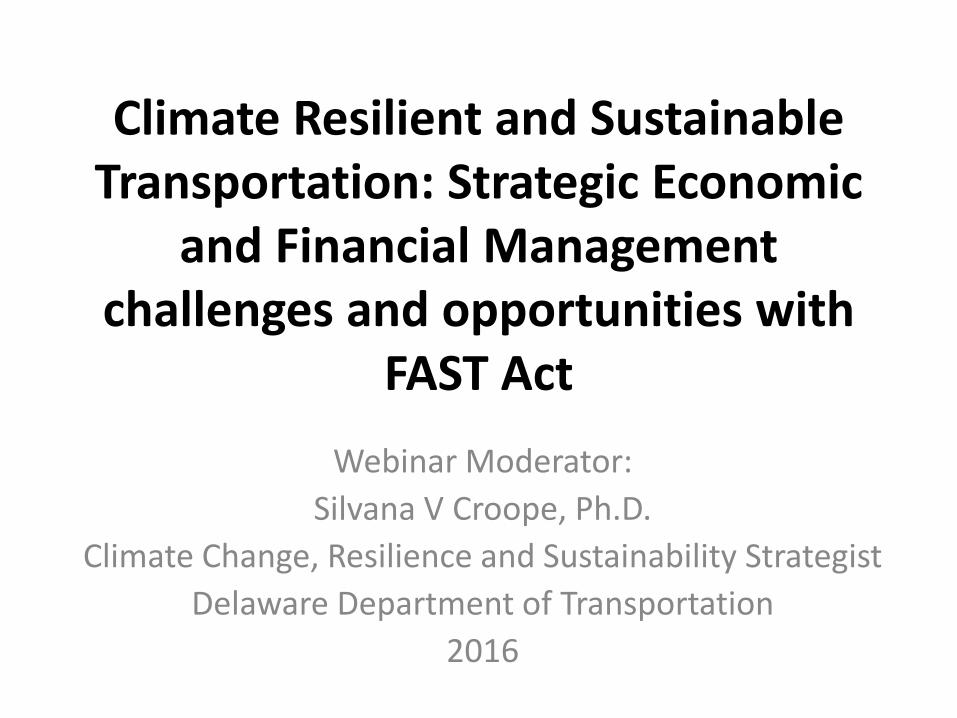
Summary
• Disasters tolls on investment and development on DOT’s planned construction and maintenance projects, amid aging assets and constrained budgets
• FAST Act sets a program for 5 years and emphasizes resilience to sea-level-rise and extreme events
• DOTs must consider complete cycles of management for both economic and financial areas of State and federally sponsorship
• Need for Enterprise Resilience Management
Speakers • Christine Baglin – Principal at PPC, a DC-based management and IT consulting firm with a decision
support and data analytics practice supporting resiliency and information security;. For TRB, she has served as an expert panel member and Principal Investigator of studies on topics relating to extreme weather and climate change response. Past Director of the Office of Policy Analysis at the Department of the Interior. She also served as Counsel to the U.S. Senate’s Government Affairs Committee
• Rajib Mallick - Ralph White Family Distinguished Professor Associate Head and Graduate Program Coordinator Civil and Environmental Engineering Department - Worcester Polytechnic Institute (WPI). conducted numerous research projects for the Federal Highway Administration (FHWA), state departments of transportation (DOT) and Federal Aviation Administration (FAA) and consulting work in the area of both highway and airport pavements. Rajib has close to 150 publications, including a textbook, and a US patent.
• Emmanuel Liban - Executive Officer, Environmental Compliance and Sustainability Program Management – LA Metro; Council Member of the US Environmental Protection Agency’s National Advisory Council on Environmental Policy and Technology, Los Angeles County Beach Commissioner and Commissioner in the City of Los Angeles Board of Transportation Commissioners
• Robert Paddon - Executive Vice President, Strategic Planning and Public Affairs ; Past Chair of Board of Directors of the Canadian Urban Transit Association; Chair of the Strategic Management Committee of the Transportation Research Board, National Academy of Sciences (Washington, D.C.)
Internal Use Only
Building the Evidence Base for Climate Resiliency Presented as part of the TRB Webinar, “Climate Resilient and Sustainable Transportation: Strategic Economic and Financial Management” Chris Baglin, PPC
September 2016
Internal Use Only
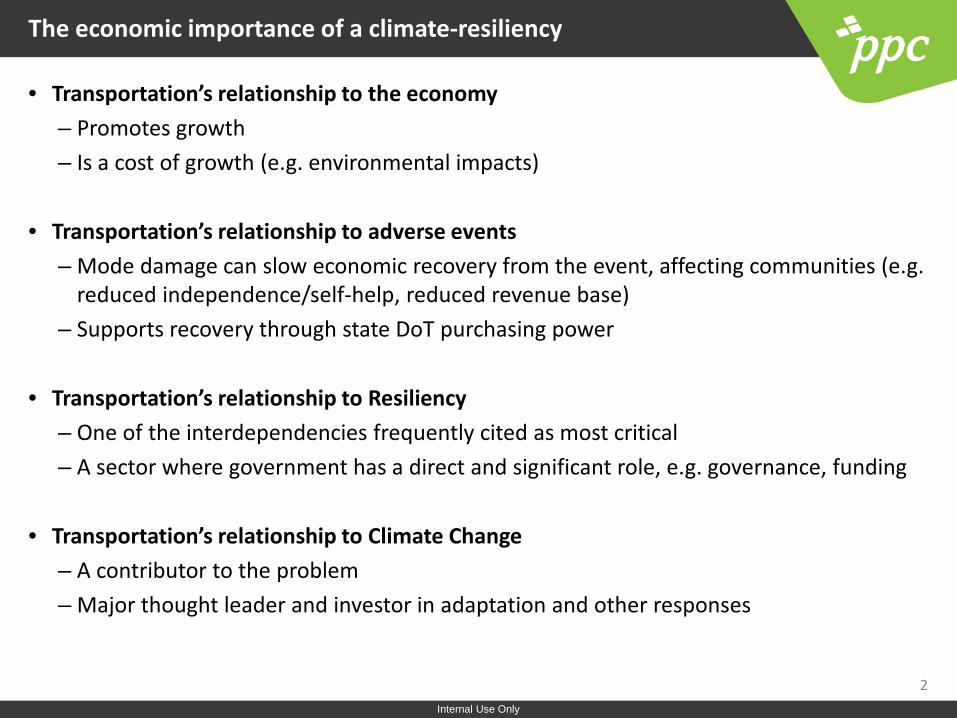
The economic importance of a climate-resiliency
• Transportation’s relationship to the economy – Promotes growth – Is a cost of growth (e.g. environmental impacts)
• Transportation’s relationship to adverse events
– Mode damage can slow economic recovery from the event, affecting communities (e.g. reduced independence/self-help, reduced revenue base)
– Supports recovery through state DoT purchasing power
• Transportation’s relationship to Resiliency – One of the interdependencies frequently cited as most critical – A sector where government has a direct and significant role, e.g. governance, funding
• Transportation’s relationship to Climate Change
– A contributor to the problem – Major thought leader and investor in adaptation and other responses
2
Internal Use Only
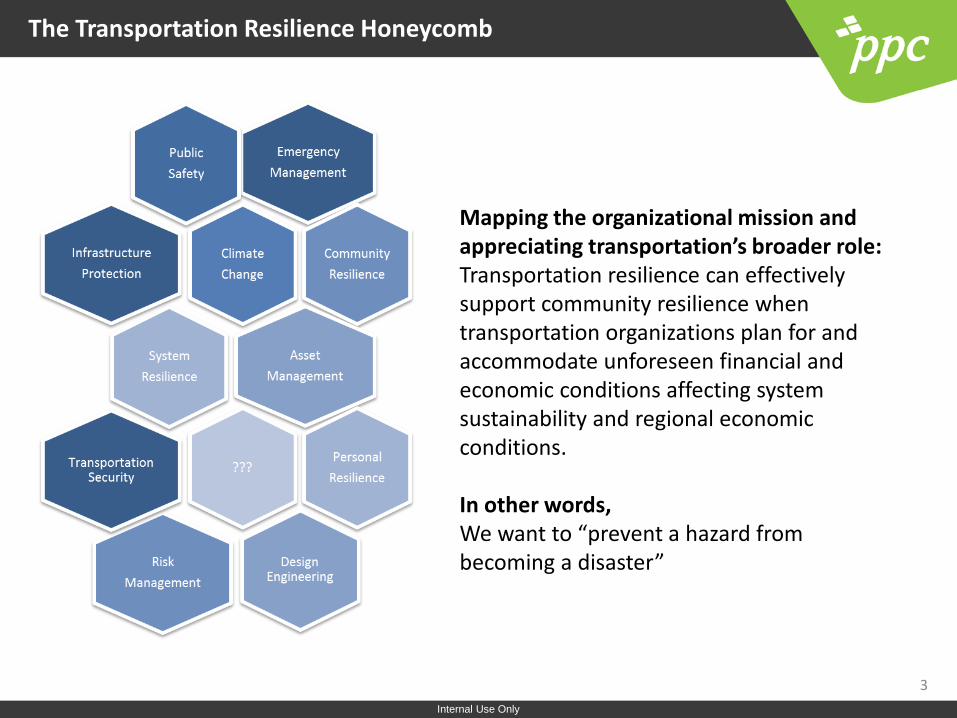
The Transportation Resilience Honeycomb
3
Mapping the organizational mission and appreciating transportation’s broader role: Transportation resilience can effectively support community resilience when transportation organizations plan for and accommodate unforeseen financial and economic conditions affecting system sustainability and regional economic conditions. In other words, We want to “prevent a hazard from becoming a disaster”
Internal Use Only
4
Internal Use Only
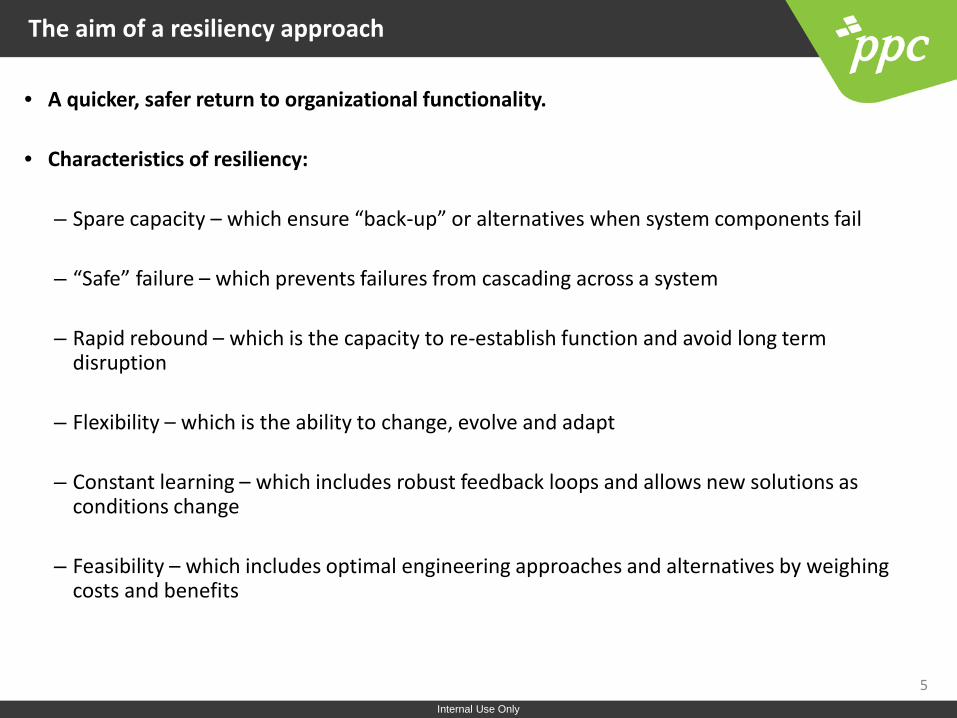
The aim of a resiliency approach
5
• A quicker, safer return to organizational functionality.
• Characteristics of resiliency:
– Spare capacity – which ensure “back-up” or alternatives when system components fail – “Safe” failure – which prevents failures from cascading across a system
– Rapid rebound – which is the capacity to re-establish function and avoid long term
disruption – Flexibility – which is the ability to change, evolve and adapt
– Constant learning – which includes robust feedback loops and allows new solutions as
conditions change – Feasibility – which includes optimal engineering approaches and alternatives by weighing
costs and benefits
Internal Use Only
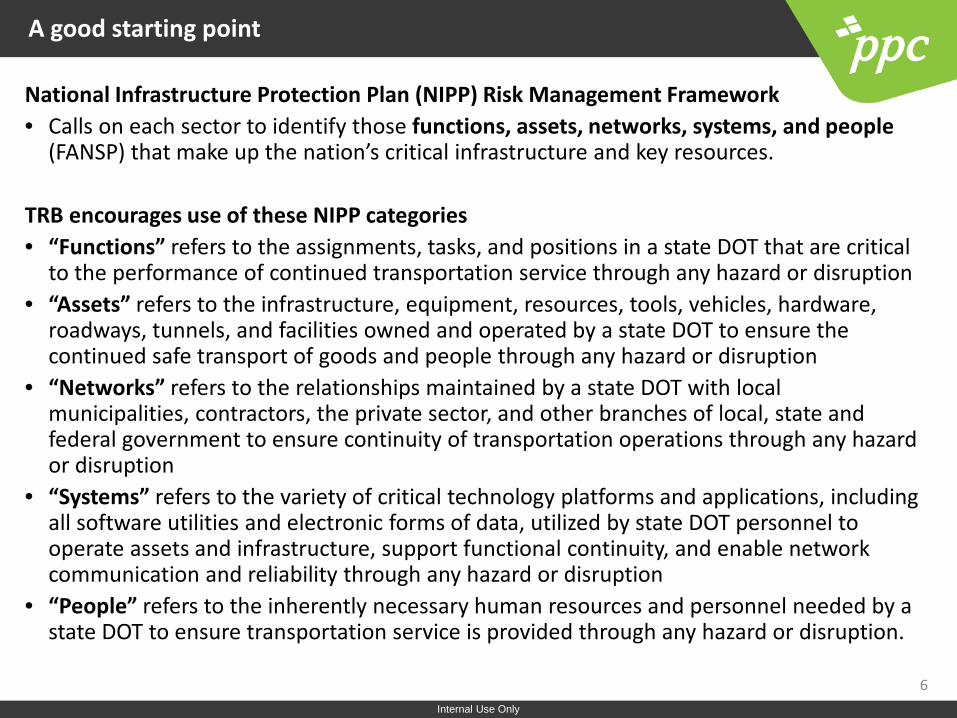
A good starting point
National Infrastructure Protection Plan (NIPP) Risk Management Framework • Calls on each sector to identify those functions, assets, networks, systems, and people
(FANSP) that make up the nation’s critical infrastructure and key resources. TRB encourages use of these NIPP categories • “Functions” refers to the assignments, tasks, and positions in a state DOT that are critical
to the performance of continued transportation service through any hazard or disruption • “Assets” refers to the infrastructure, equipment, resources, tools, vehicles, hardware,
roadways, tunnels, and facilities owned and operated by a state DOT to ensure the continued safe transport of goods and people through any hazard or disruption
• “Networks” refers to the relationships maintained by a state DOT with local municipalities, contractors, the private sector, and other branches of local, state and federal government to ensure continuity of transportation operations through any hazard or disruption
• “Systems” refers to the variety of critical technology platforms and applications, including all software utilities and electronic forms of data, utilized by state DOT personnel to operate assets and infrastructure, support functional continuity, and enable network communication and reliability through any hazard or disruption
• “People” refers to the inherently necessary human resources and personnel needed by a state DOT to ensure transportation service is provided through any hazard or disruption.
6
Internal Use Only
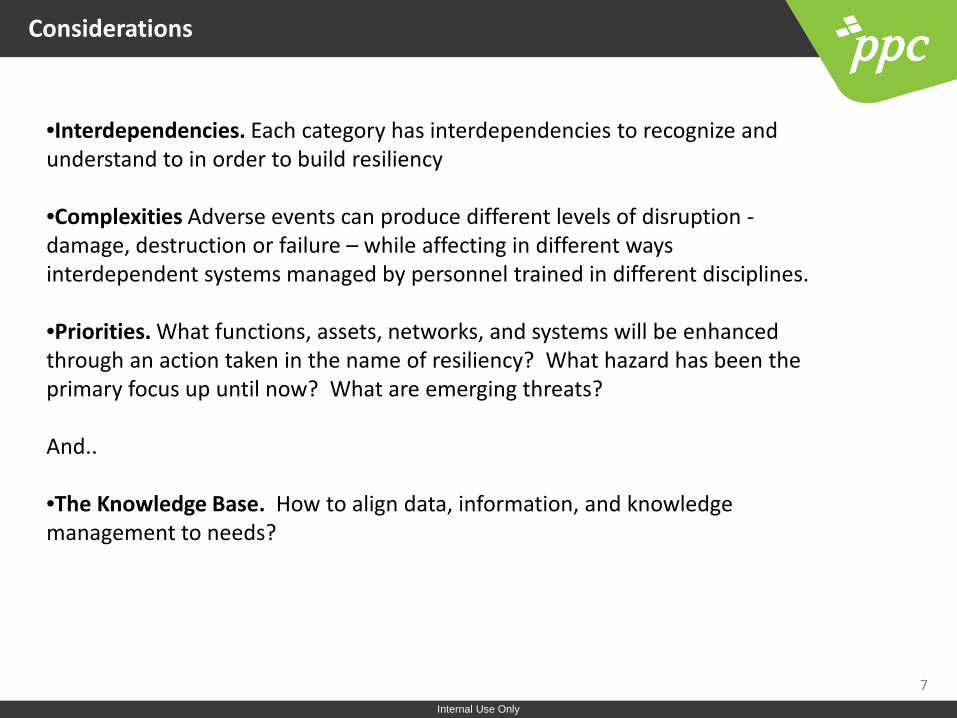
Considerations
7
•Interdependencies. Each category has interdependencies to recognize and understand to in order to build resiliency
•Complexities Adverse events can produce different levels of disruption - damage, destruction or failure – while affecting in different ways interdependent systems managed by personnel trained in different disciplines.
•Priorities. What functions, assets, networks, and systems will be enhanced through an action taken in the name of resiliency? What hazard has been the primary focus up until now? What are emerging threats?
And..
•The Knowledge Base. How to align data, information, and knowledge management to needs?
Internal Use Only
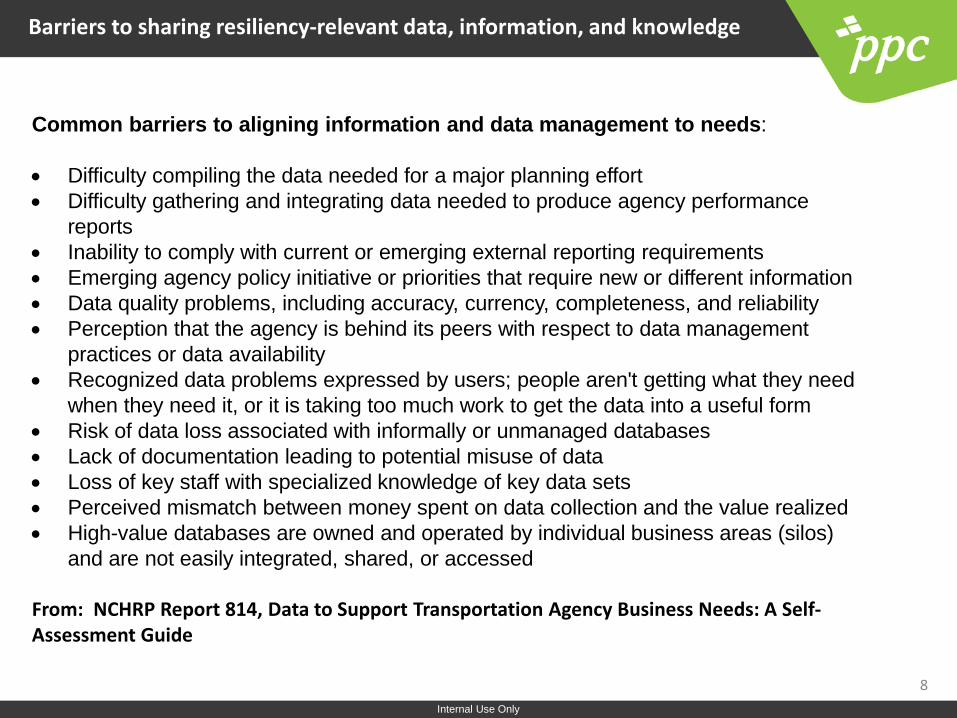
Barriers to sharing resiliency-relevant data, information, and knowledge
8
Common barriers to aligning information and data management to needs: • Difficulty compiling the data needed for a major planning effort • Difficulty gathering and integrating data needed to produce agency performance
reports • Inability to comply with current or emerging external reporting requirements • Emerging agency policy initiative or priorities that require new or different information • Data quality problems, including accuracy, currency, completeness, and reliability • Perception that the agency is behind its peers with respect to data management
practices or data availability • Recognized data problems expressed by users; people aren't getting what they need
when they need it, or it is taking too much work to get the data into a useful form • Risk of data loss associated with informally or unmanaged databases • Lack of documentation leading to potential misuse of data • Loss of key staff with specialized knowledge of key data sets • Perceived mismatch between money spent on data collection and the value realized • High-value databases are owned and operated by individual business areas (silos)
and are not easily integrated, shared, or accessed From: NCHRP Report 814, Data to Support Transportation Agency Business Needs: A Self-Assessment Guide
Internal Use Only
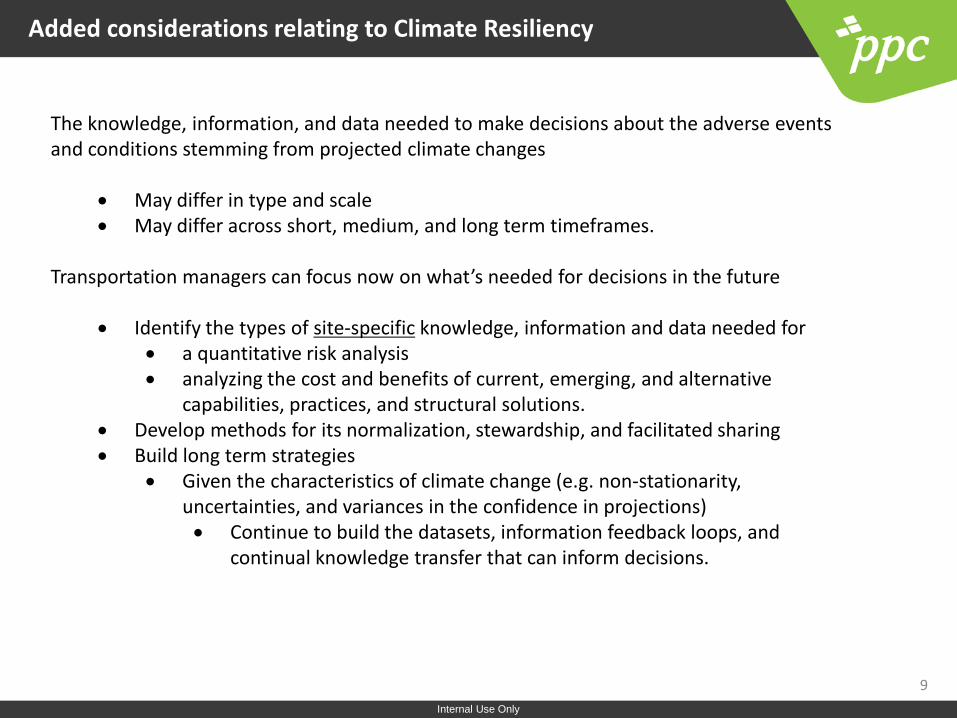
Added considerations relating to Climate Resiliency
9
The knowledge, information, and data needed to make decisions about the adverse events and conditions stemming from projected climate changes
• May differ in type and scale • May differ across short, medium, and long term timeframes.
Transportation managers can focus now on what’s needed for decisions in the future
• Identify the types of site-specific knowledge, information and data needed for • a quantitative risk analysis • analyzing the cost and benefits of current, emerging, and alternative
capabilities, practices, and structural solutions. • Develop methods for its normalization, stewardship, and facilitated sharing • Build long term strategies
• Given the characteristics of climate change (e.g. non-stationarity, uncertainties, and variances in the confidence in projections) • Continue to build the datasets, information feedback loops, and
continual knowledge transfer that can inform decisions.
Internal Use Only
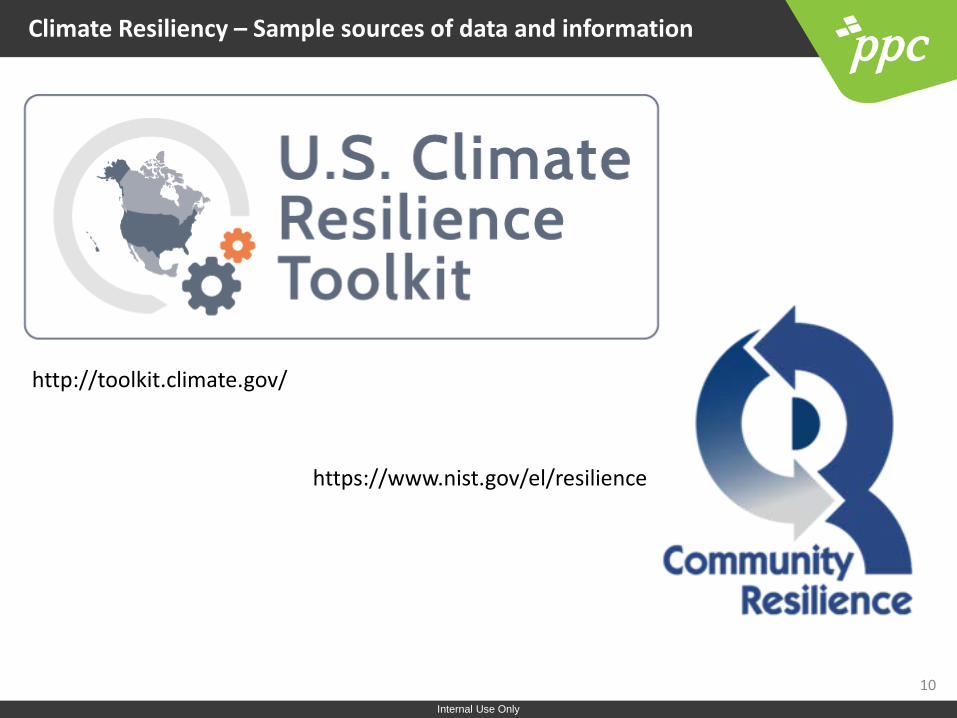
Climate Resiliency – Sample sources of data and information
10
http://toolkit.climate.gov/
https://www.nist.gov/el/resilience
Internal Use Only
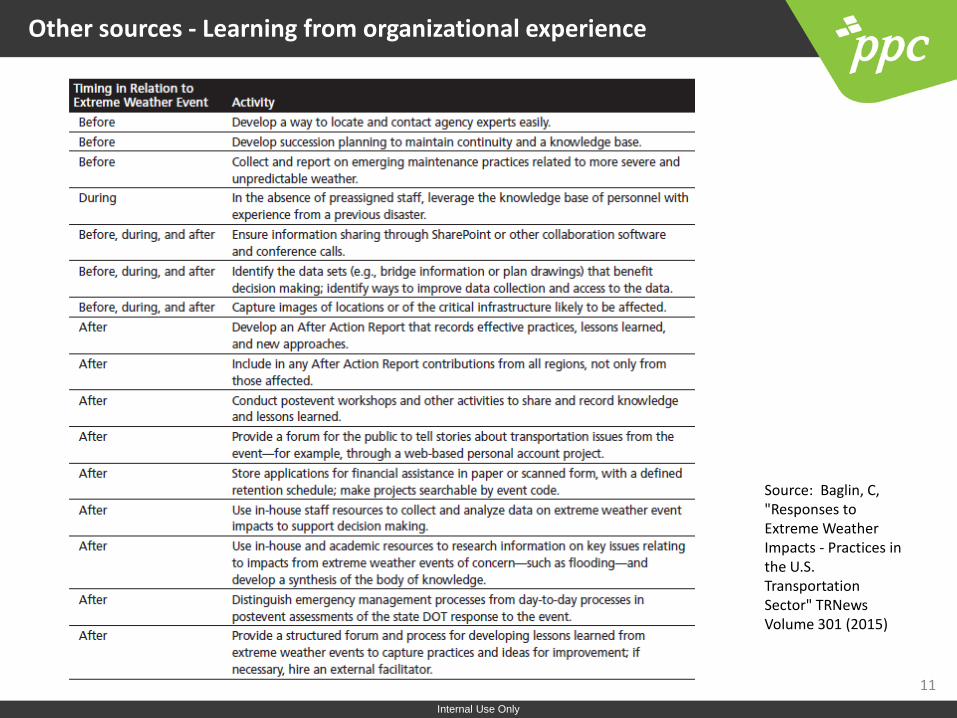
Other sources - Learning from organizational experience
11
Source: Baglin, C, "Responses to Extreme Weather Impacts - Practices in the U.S. Transportation Sector" TRNews Volume 301 (2015)
Internal Use Only
Applying these considerations to climate risks
• Determine relevant hazards. – Understand current, emerging, and future hazards to see where to position and
leverage limited human, time, and monetary resources. – With respect to future hazards, expert knowledge, information from models, and
observational data can support understanding of threats, but some these sources may not be accessible or created yet. • Focus on likely indicators of change: An indicator of a climate change-induced
hazard may be findable in publicly available remote sensing/earth observation data and products. Utilizing such information could support the identification, analysis, and management of climate change risk through tracking of indicators over time.
• Assess vulnerabilities: – Transportation system vulnerabilities are inventoried and assessed to help identify
where to focus resources, i.e. where they are most needed. – Critical inputs include the past performance of a system, such as a key asset or
operational functions. • Information may not be aggregated for the hazard in question, resulting in ad hoc,
disruptive data calls – Several TRB tools provide lists of potentially vulnerable areas for multiple modes to
assist such assessments, and as such can supply the start of a framework for a data, information and knowledge strategy
12
Internal Use Only
Applying these considerations to climate risks
• Analyze risks: – Decision makers require a common way to look at the variety of risks that may arise
from identified hazards and vulnerabilities. – Traditionally, risk is equal to the magnitude of the harm multiplied by the frequency of
its occurrence. Two points illustrate the role of a data strategy in progressing risk analysis to a more sophisticated state: • An indicator of potential harm may be exceedance of a threshold, such as the
amount of rain within a certain timeframe . Where measurements (quantitative data) are not available, organizations may have to rely on the professional judgment of maintenance staff, e.g. their conclusory opinions, which constitute qualitative data which has not been normalized or validated outside the organization
• More fundamentally, the named threshold may or may not be suitable to the local conditions (e.g. additional margins of safety were built into an asset when the threshold assumes a lower margin of safety).
13
Internal Use Only
Applying these considerations to climate risks
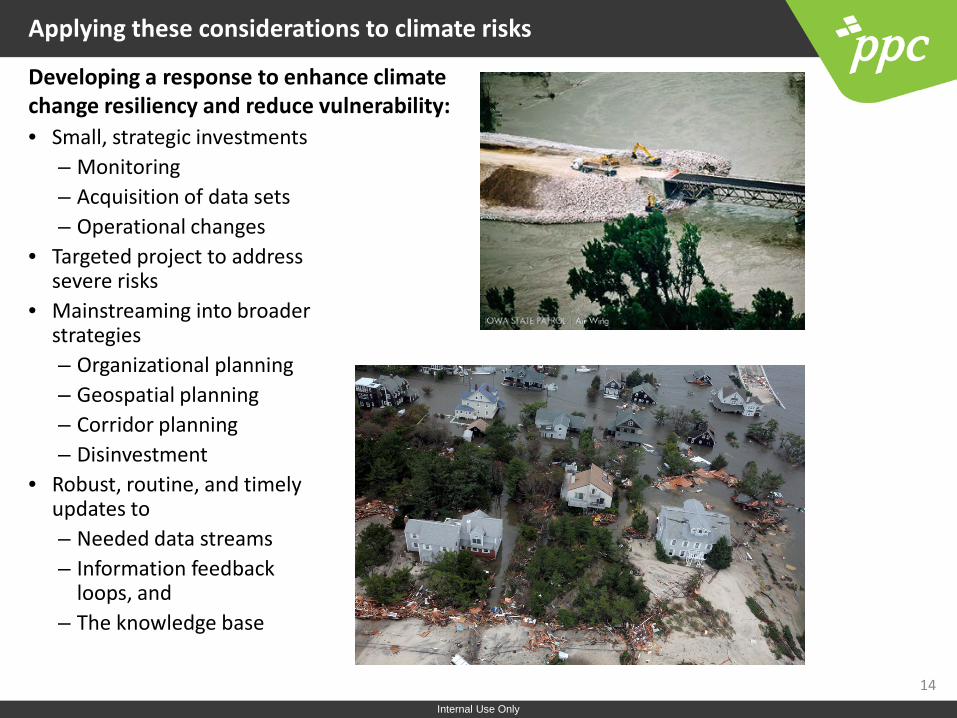
• Small, strategic investments – Monitoring – Acquisition of data sets – Operational changes
• Targeted project to address severe risks
• Mainstreaming into broader strategies – Organizational planning – Geospatial planning – Corridor planning – Disinvestment
• Robust, routine, and timely updates to – Needed data streams – Information feedback
loops, and – The knowledge base
14
Developing a response to enhance climate change resiliency and reduce vulnerability:
Internal Use Only
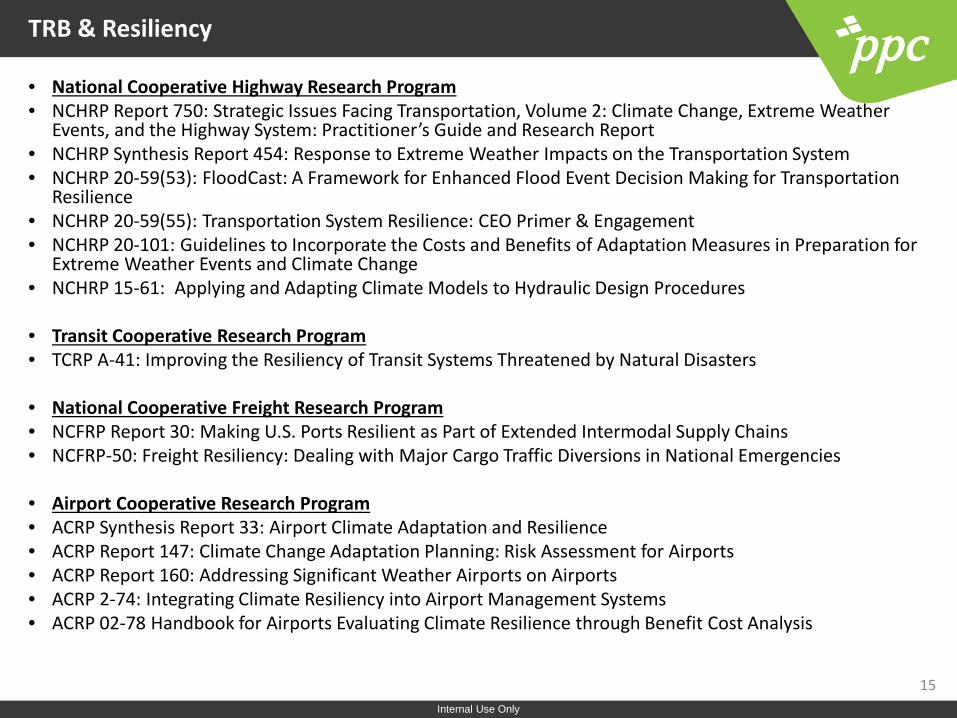
TRB & Resiliency
• National Cooperative Highway Research Program • NCHRP Report 750: Strategic Issues Facing Transportation, Volume 2: Climate Change, Extreme Weather
Events, and the Highway System: Practitioner’s Guide and Research Report • NCHRP Synthesis Report 454: Response to Extreme Weather Impacts on the Transportation System • NCHRP 20-59(53): FloodCast: A Framework for Enhanced Flood Event Decision Making for Transportation
Resilience • NCHRP 20-59(55): Transportation System Resilience: CEO Primer & Engagement • NCHRP 20-101: Guidelines to Incorporate the Costs and Benefits of Adaptation Measures in Preparation for
Extreme Weather Events and Climate Change • NCHRP 15-61: Applying and Adapting Climate Models to Hydraulic Design Procedures
• Transit Cooperative Research Program • TCRP A-41: Improving the Resiliency of Transit Systems Threatened by Natural Disasters
• National Cooperative Freight Research Program • NCFRP Report 30: Making U.S. Ports Resilient as Part of Extended Intermodal Supply Chains • NCFRP-50: Freight Resiliency: Dealing with Major Cargo Traffic Diversions in National Emergencies
• Airport Cooperative Research Program • ACRP Synthesis Report 33: Airport Climate Adaptation and Resilience • ACRP Report 147: Climate Change Adaptation Planning: Risk Assessment for Airports • ACRP Report 160: Addressing Significant Weather Airports on Airports • ACRP 2-74: Integrating Climate Resiliency into Airport Management Systems • ACRP 02-78 Handbook for Airports Evaluating Climate Resilience through Benefit Cost Analysis
15

Internal Use Only
Thank you!
16
Chris Baglin Principal, PPC
703.748.7547 (p) 571.271.1115 (c) [email protected]
Understanding the Impact of Flooding on Roadways - A Simulation Based Approach
Rajib B. Mallick ([email protected])
Professor
Civil and Environmental Engineering
Worcester Polytechnic Institute (WPI)
Massachusetts, USA
1
Acknowledgements
• Silvana Croope (Delaware DOT)
• Federal Highway Administration (FHWA)
• Jo S. Daniel, University of New Hampshire
• Jennifer M. Jacobs, University of New Hampshire
• Michael J. Radzicki, Worcester Polytechnic Institute (WPI)
• Karim Chichakly (ISEE Systems)
• Transportation Research Board (TRB)
2
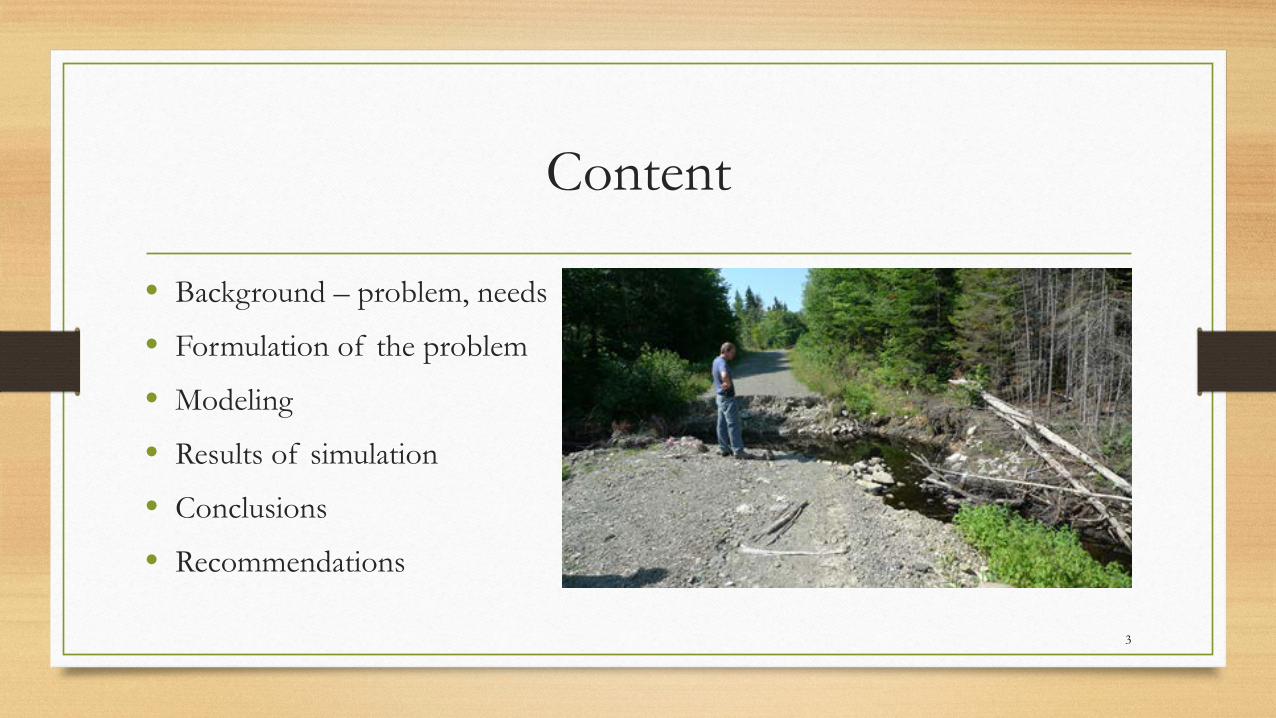
Content
• Background – problem, needs
• Formulation of the problem
• Modeling
• Results of simulation
• Conclusions
• Recommendations
3
Background
• Flooding can weaken roadways • Weakened roadways
• Can deteriorate faster and develop premature problems under traffic
• Need a significant amount of resources and time for repair or rehabilitation
• Can be a hazard that can lead to death, or damage of vehicles
• Can prevent timely evacuation of citizens if needed during an extreme weather event
• Signs of weakness may not be visible on the surface
4
Background
• Needs • A knowledge of the damage potential of the pavement
• Can help identify vulnerable sections
• Allow precautions/corrective actions to prevent/minimize damage
• Can help in making decisions to utilize specific sections for flood related emergency/evacuation traffic
• A knowledge of the condition of the pavement after flooding • Can help in making decisions regarding opening or closing of roads to traffic after flooding
• Can help in planning for allocating resources for post-flooding investigative actions
• Can help agencies develop methods for building more resilient roads in the future
5
Formulation of the problem
6
Mallick et al, Development of a methodology and a tool for the assessment of vulnerability of roadways to flood-induced damage. Journal of Flood Risk Management. doi: 10.1111/jfr3.12135, 2015.
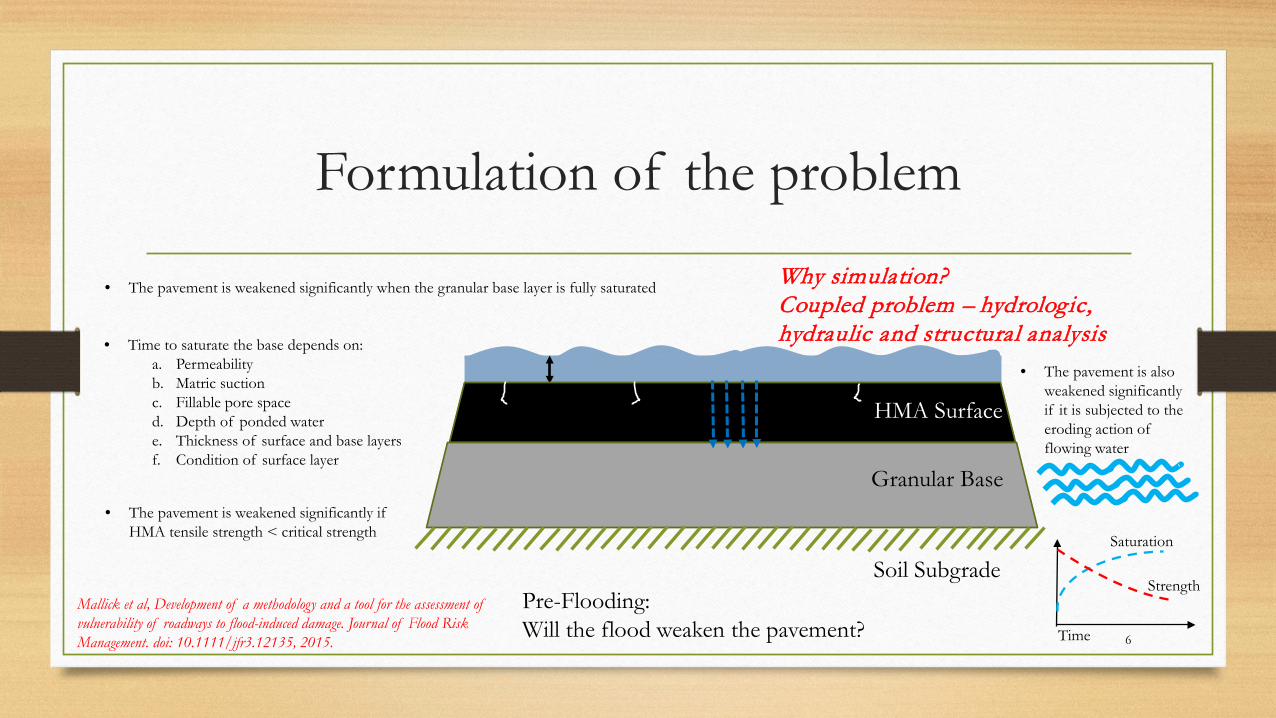
• The pavement is weakened significantly when the granular base layer is fully saturated
• The pavement is weakened significantly if HMA tensile strength < critical strength
• The pavement is also weakened significantly if it is subjected to the eroding action of flowing water
Pre-Flooding: Will the flood weaken the pavement?
Why simulation? Coupled problem – hydrologic, hydraulic and structural analysis • Time to saturate the base depends on:
a. Permeability b. Matric suction c. Fillable pore space d. Depth of ponded water e. Thickness of surface and base layers f. Condition of surface layer
Time
Saturation
Strength
HMA Surface
Granular Base
Soil Subgrade
Formulation of the problem
7
Granular Base
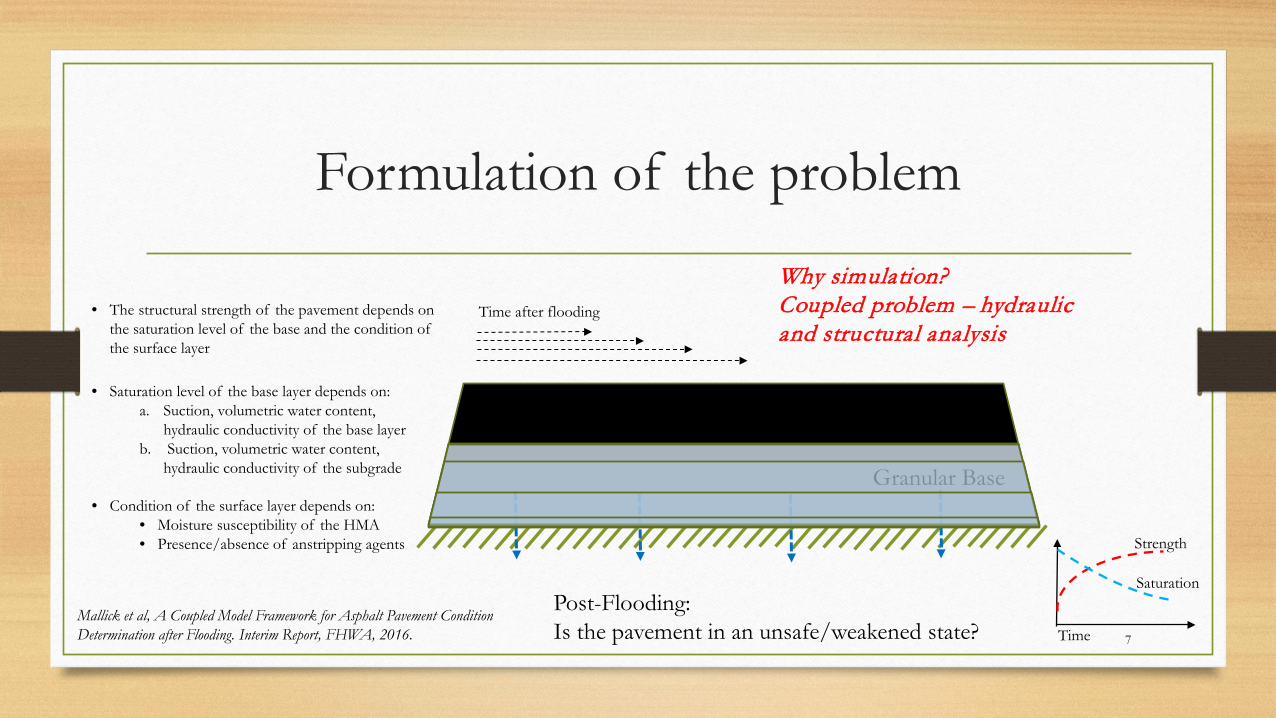
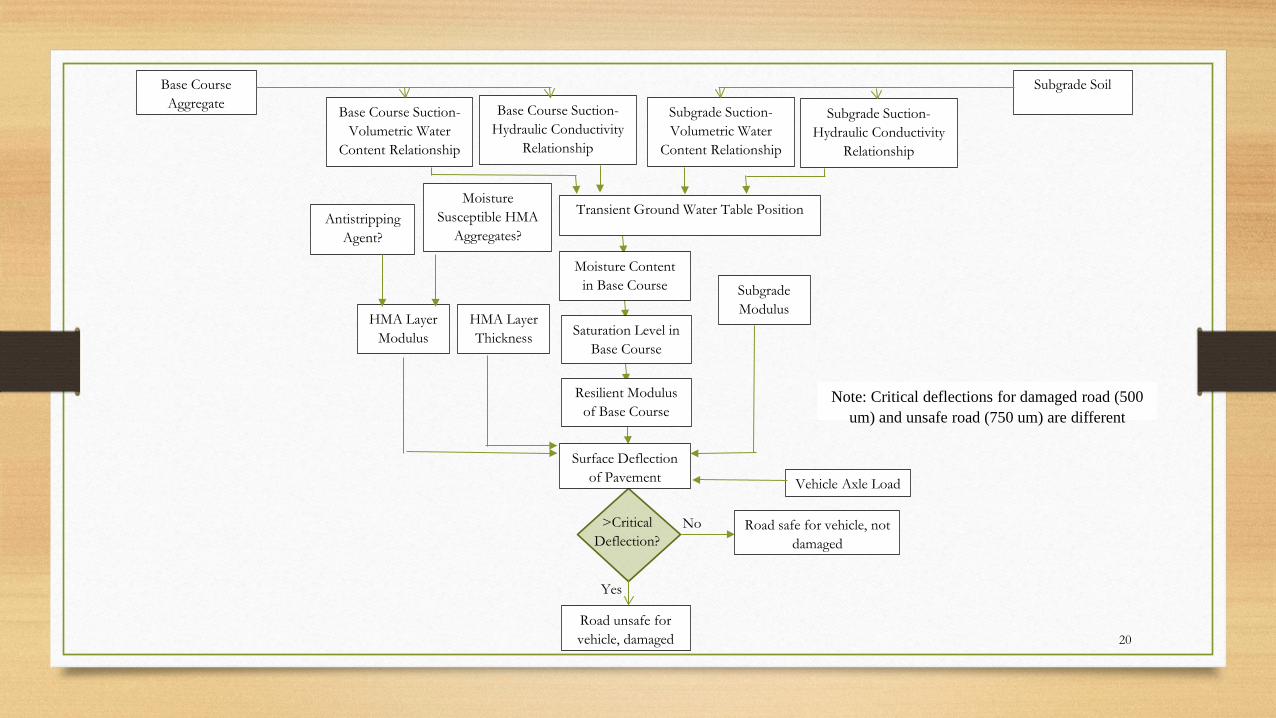
Post-Flooding: Is the pavement in an unsafe/weakened state?
• The structural strength of the pavement depends on the saturation level of the base and the condition of the surface layer
• Condition of the surface layer depends on: • Moisture susceptibility of the HMA • Presence/absence of anstripping agents
Mallick et al, A Coupled Model Framework for Asphalt Pavement Condition Determination after Flooding. Interim Report, FHWA, 2016.
Why simulation? Coupled problem – hydraulic and structural analysis
• Saturation level of the base layer depends on: a. Suction, volumetric water content,
hydraulic conductivity of the base layer b. Suction, volumetric water content,
hydraulic conductivity of the subgrade
Time after flooding
Time
Saturation
Strength
Pre-Flooding
Will the flood weaken the pavement?
8
9
Critical time period considering saturation and weakening of granular base layer or erosion due to flowing water
Gradation
Saturation moisture content
Permeability
Erodibility
Existing moisture content prior to flooding
Density
Porosity
Proximity to stream
Stream flow velocity
Depth of Ponded Water
Maximum density
Matric suction
Thickness
Fillable pore space
Optimum moisture content
Rainfall Evaporation
Thickness
Critical Time Period considering Flow through HMA and failure in HMA
Mean Annual Air Temperature
Age Asphalt Type Initial Viscosity
Initial Voids
Effective Permeability
Retained Tensile Strength at Construction
Loss of Retained Tensile Strength over Inundation Time
Critical Retained Tensile Strength
Cracking Potential
Voids Asphalt Viscosity PMS Data
Retained Tensile Strength
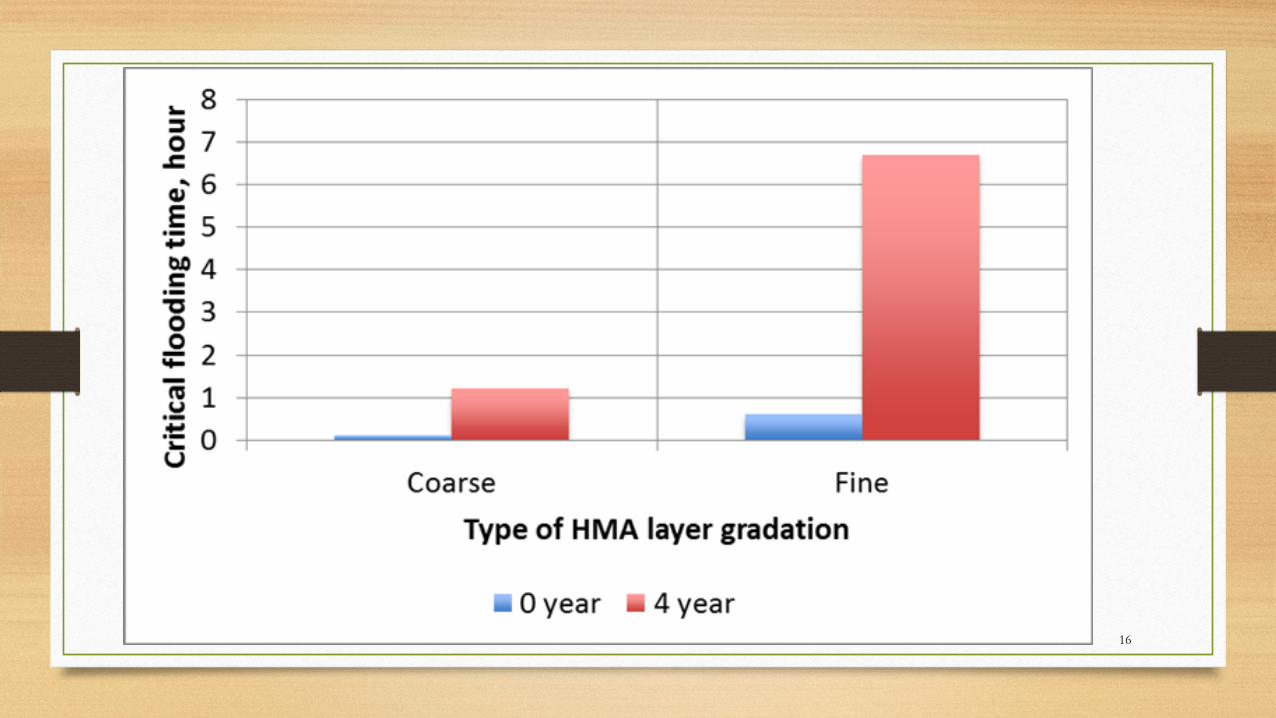
Coarse or Fine Graded?
Depth of Ponded Water on Pavement
Time to flow through HMA surface
Granular Base Layer HMA Surface Layer
≤Time of
flooding?
≤ Time of
flooding?
No No Pavement NOT weakened
Yes Pavement weakened
Yes
10
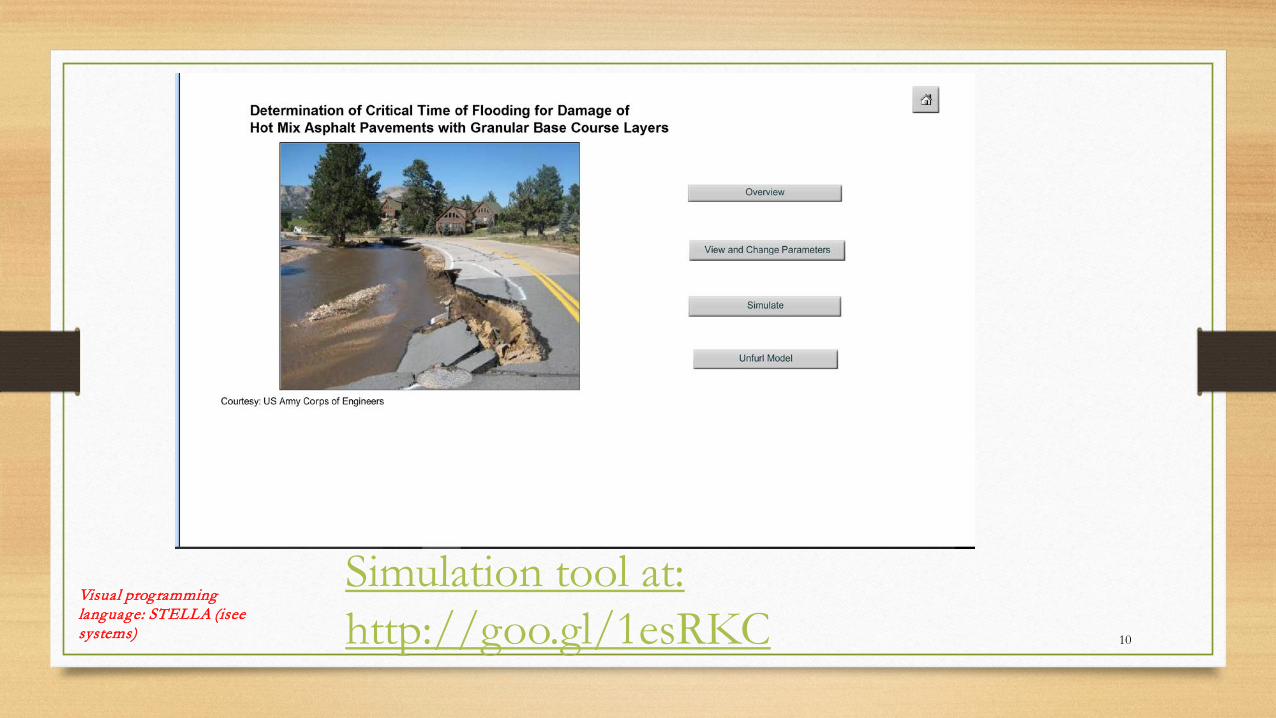
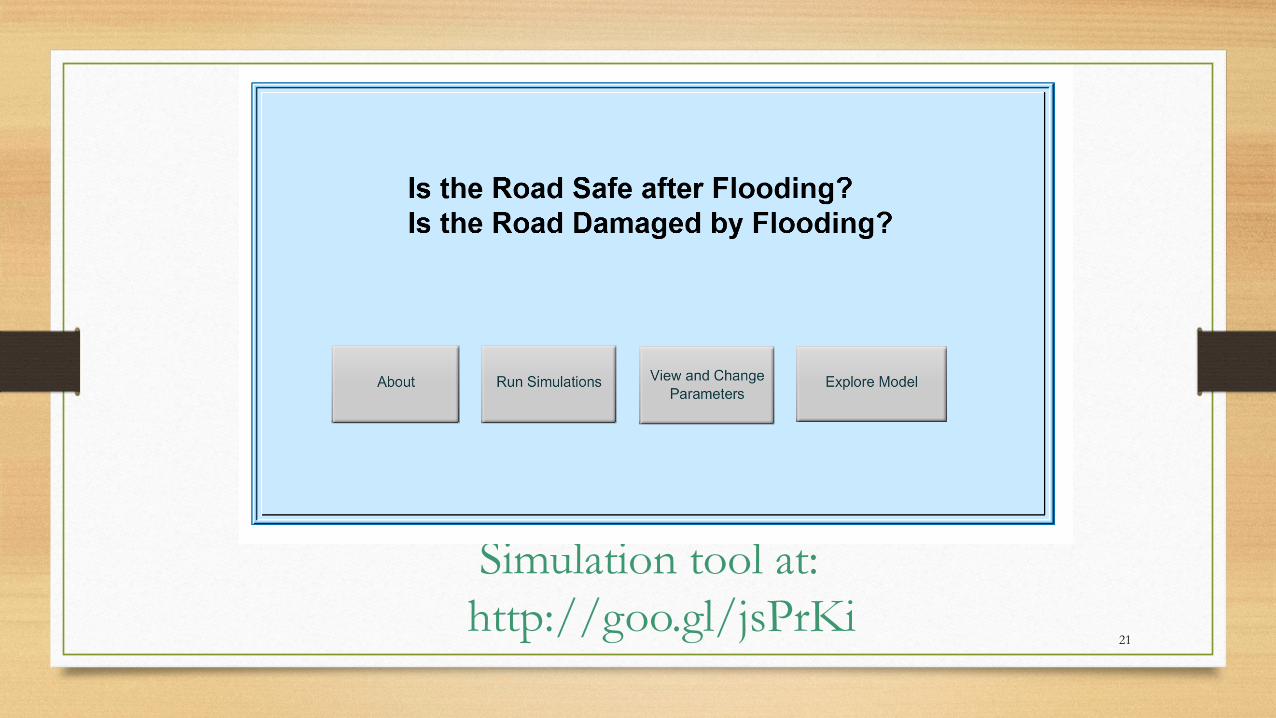
Simulation tool at: http://goo.gl/1esRKC
Visual programming language: STELLA (isee systems)

11
Change Parameter page
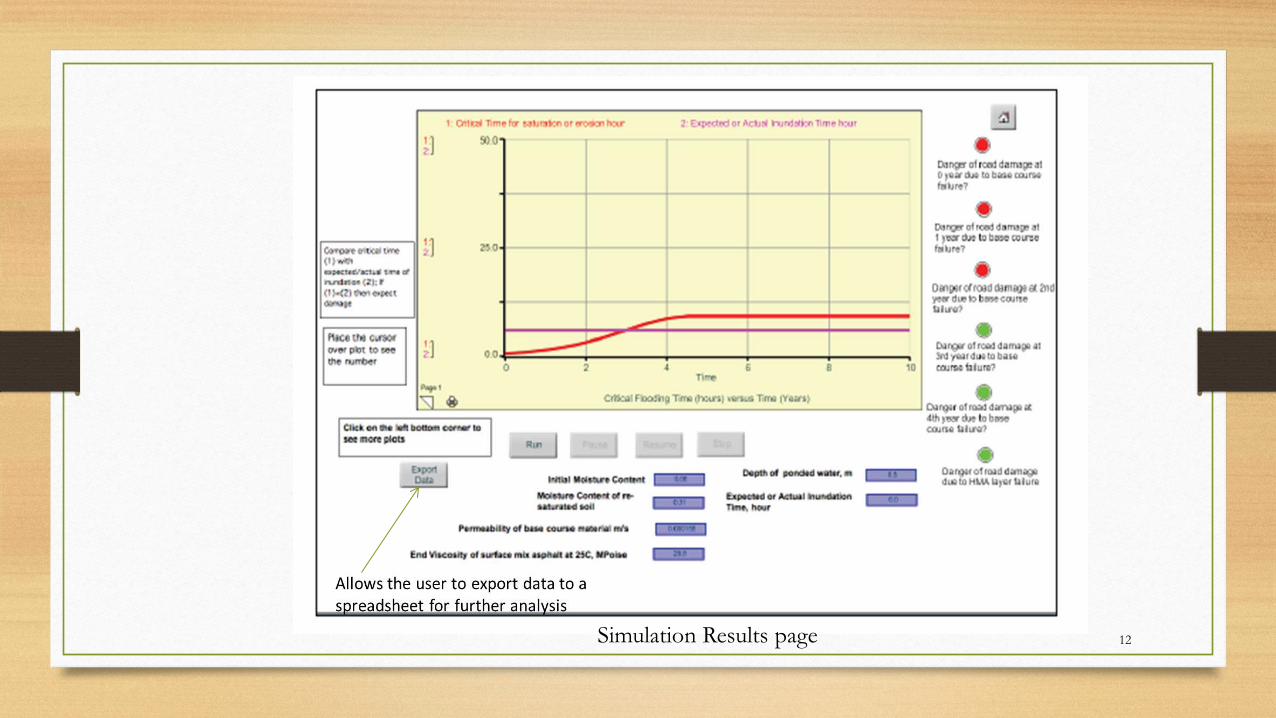
12 Simulation Results page

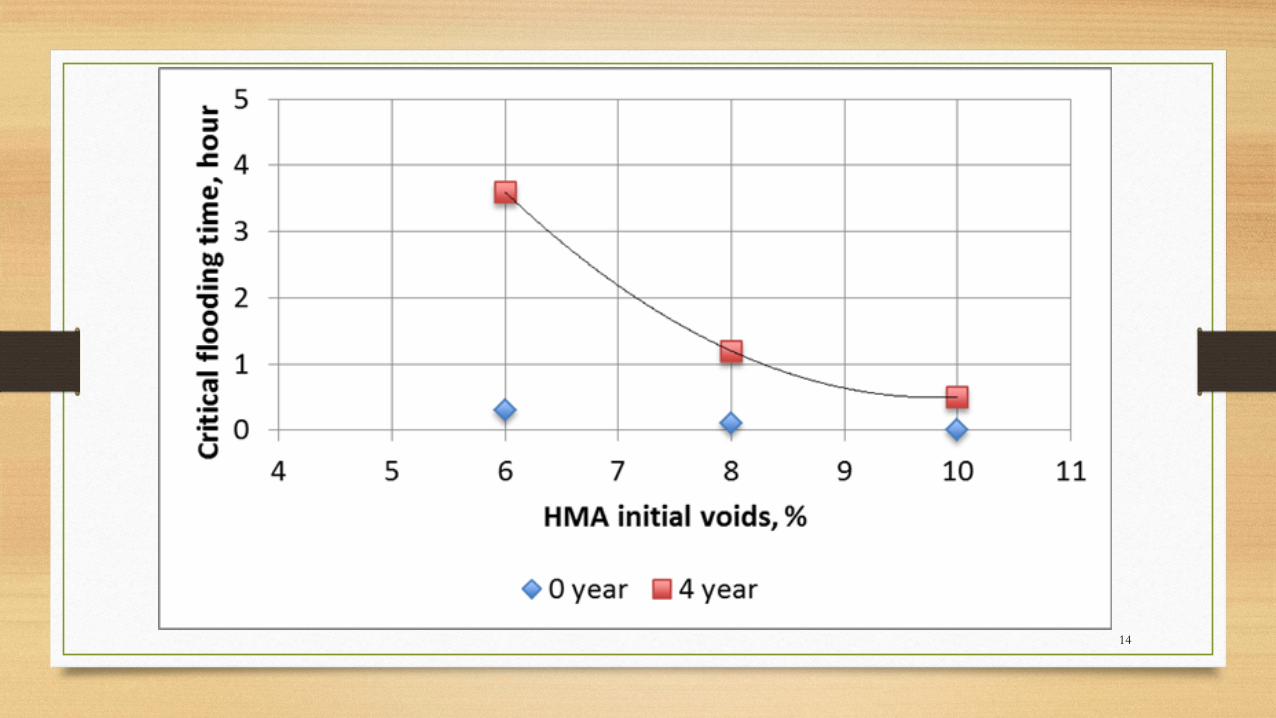
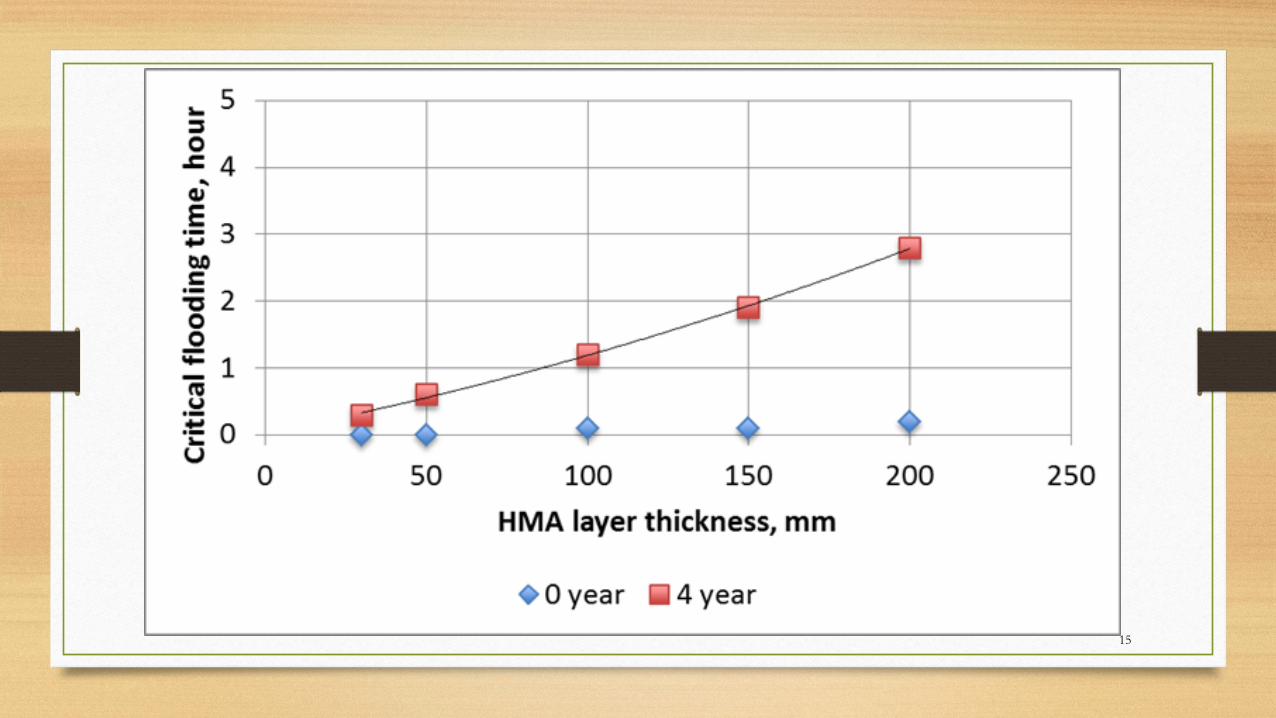
Results of Simulation Effect of Controllable Parameters
13
14
15
16
17
18
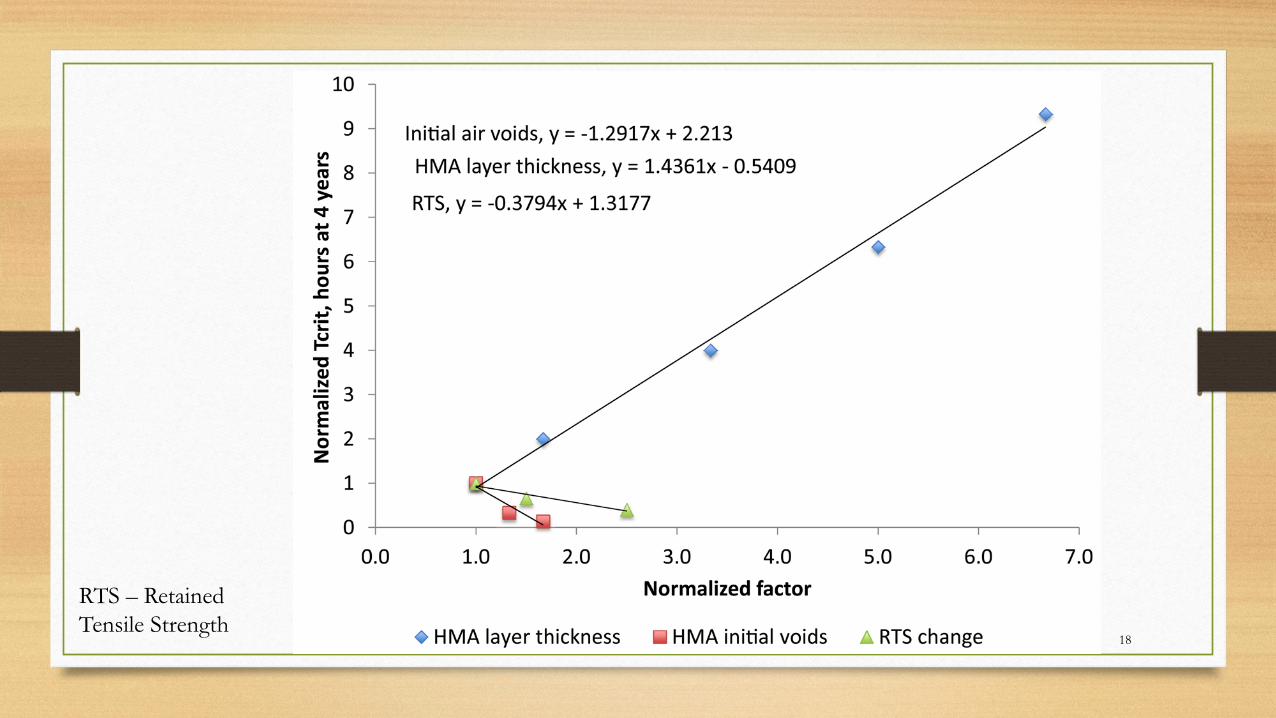
RTS – Retained Tensile Strength
Post-Flooding Is the pavement in an unsafe/weakened state?
19
20
No
Yes
Base Course Aggregate
Subgrade Soil
Base Course Suction-Volumetric Water
Content Relationship
Base Course Suction-Hydraulic Conductivity
Relationship
Subgrade Suction-Volumetric Water
Content Relationship
Subgrade Suction-Hydraulic Conductivity
Relationship
Transient Ground Water Table Position
Moisture Content in Base Course
Saturation Level in Base Course
Resilient Modulus of Base Course
Surface Deflection of Pavement
HMA Layer Thickness
HMA Layer Modulus
Subgrade Modulus
Vehicle Axle Load
>Critical Deflection?
Road unsafe for vehicle, damaged
Road safe for vehicle, not damaged
Moisture Susceptible HMA
Aggregates? Antistripping
Agent?
Note: Critical deflections for damaged road (500 um) and unsafe road (750 um) are different
21
Simulation tool at: http://goo.gl/jsPrKi
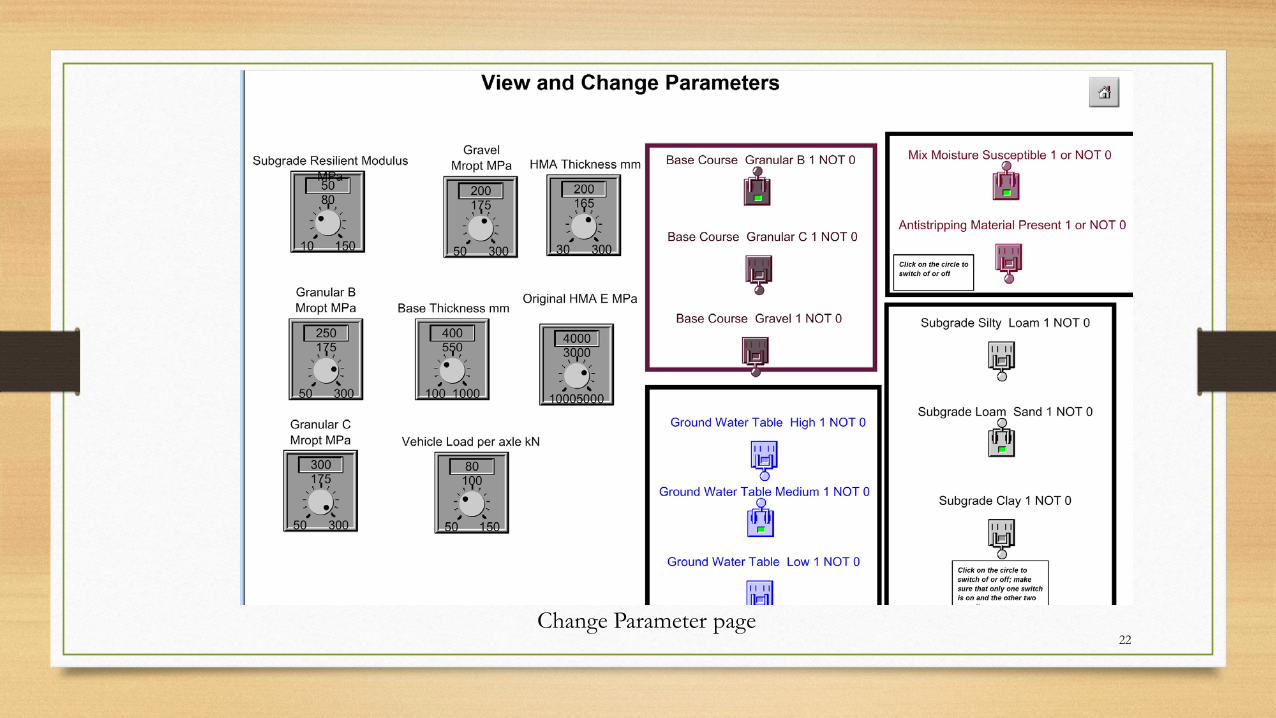
22 Change Parameter page
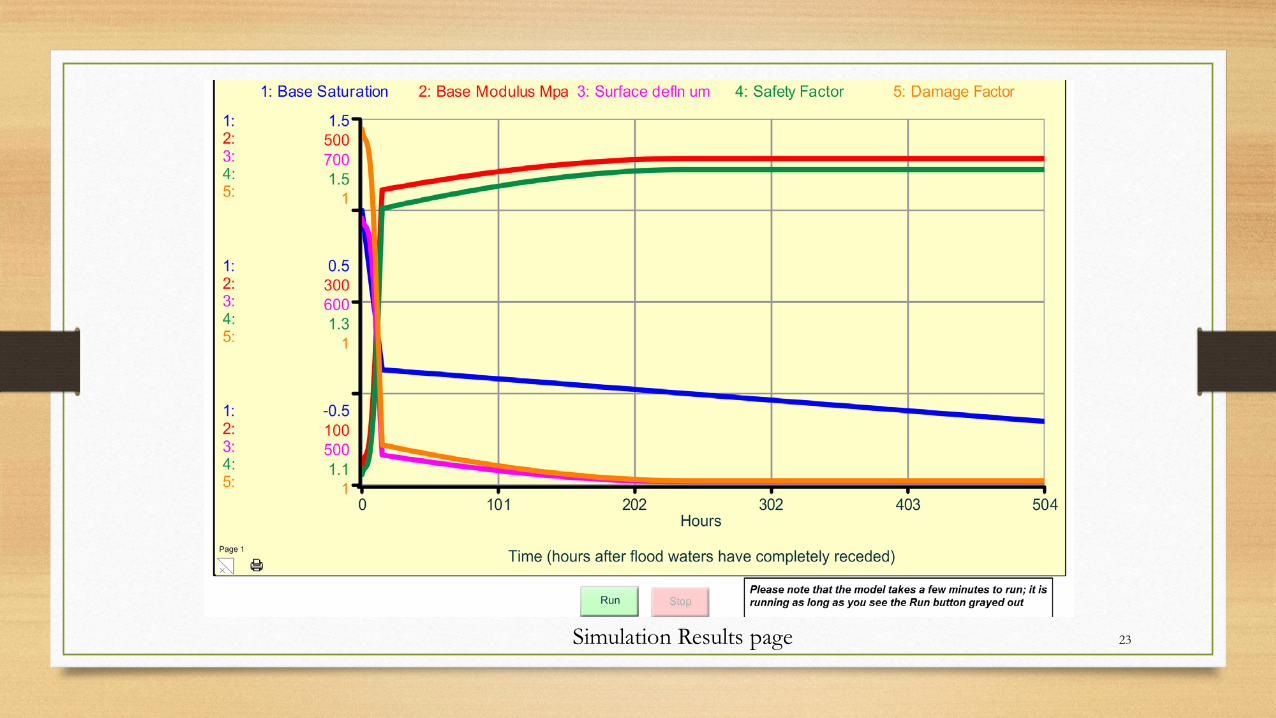
23 Simulation Results page

Results of Simulation Effect of Controllable Parameters
24
25
26
27
28
29
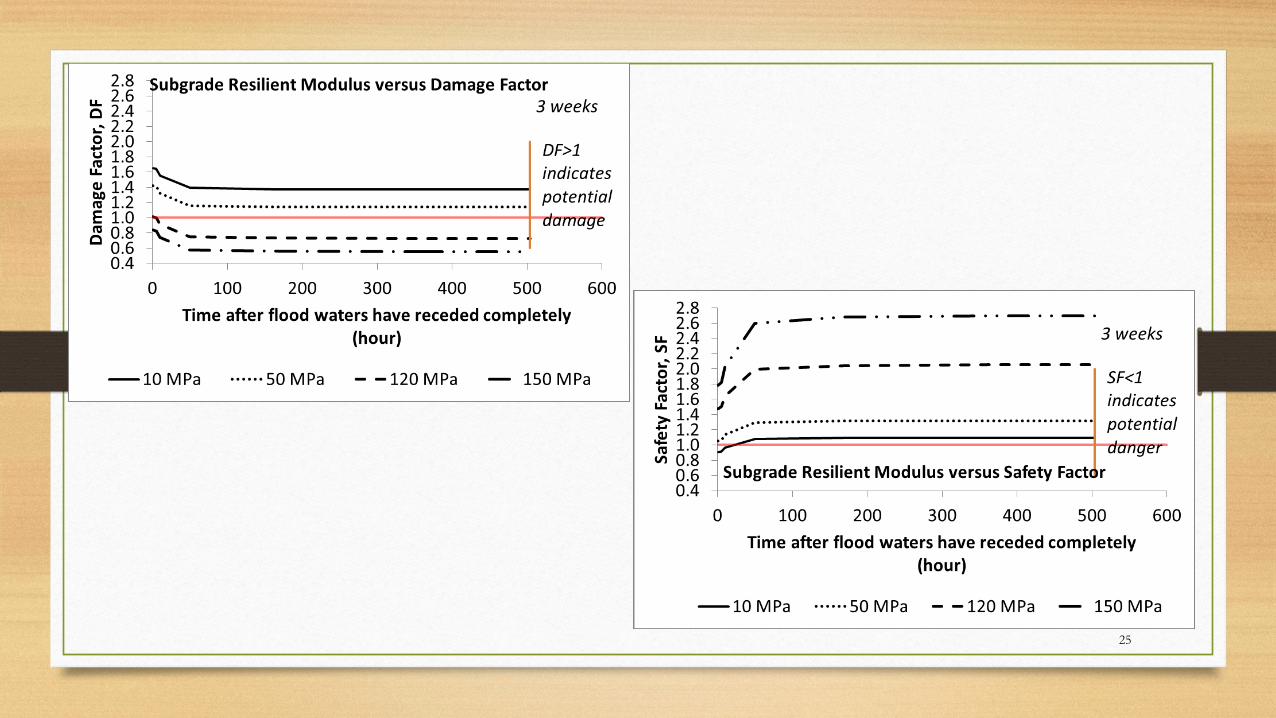
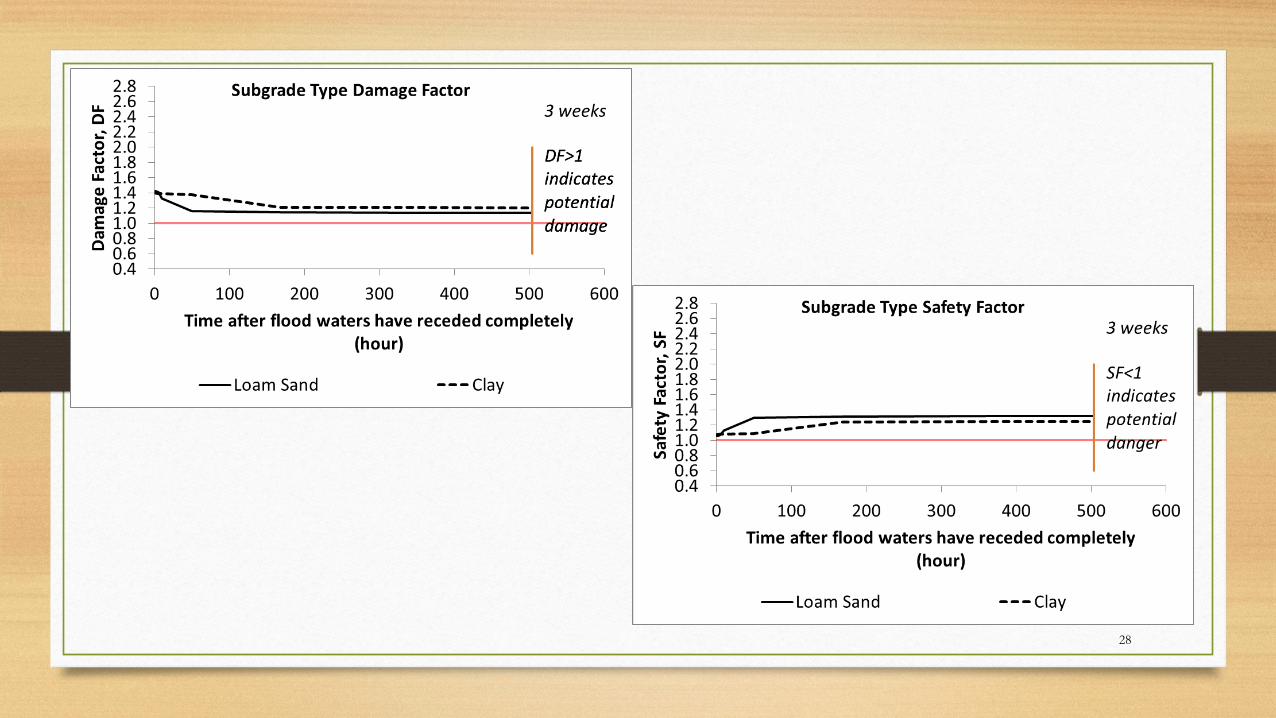
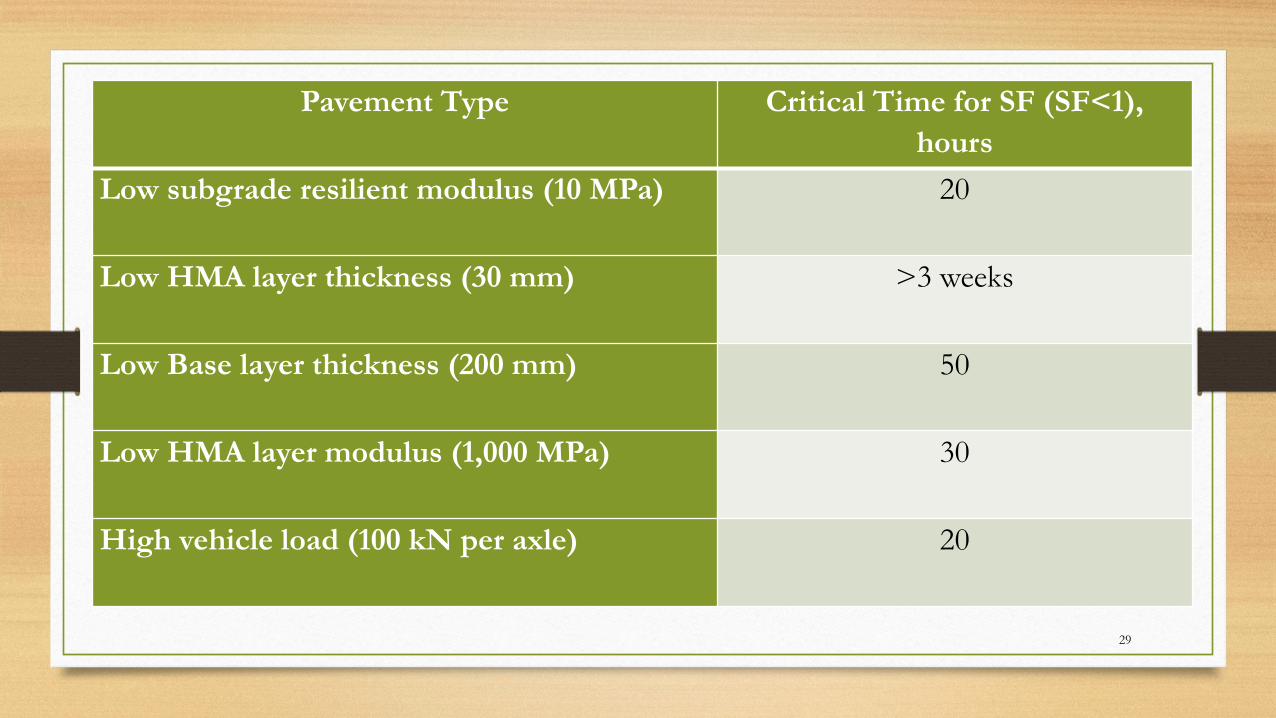
Pavement Type Critical Time for SF (SF<1), hours
Low subgrade resilient modulus (10 MPa) 20
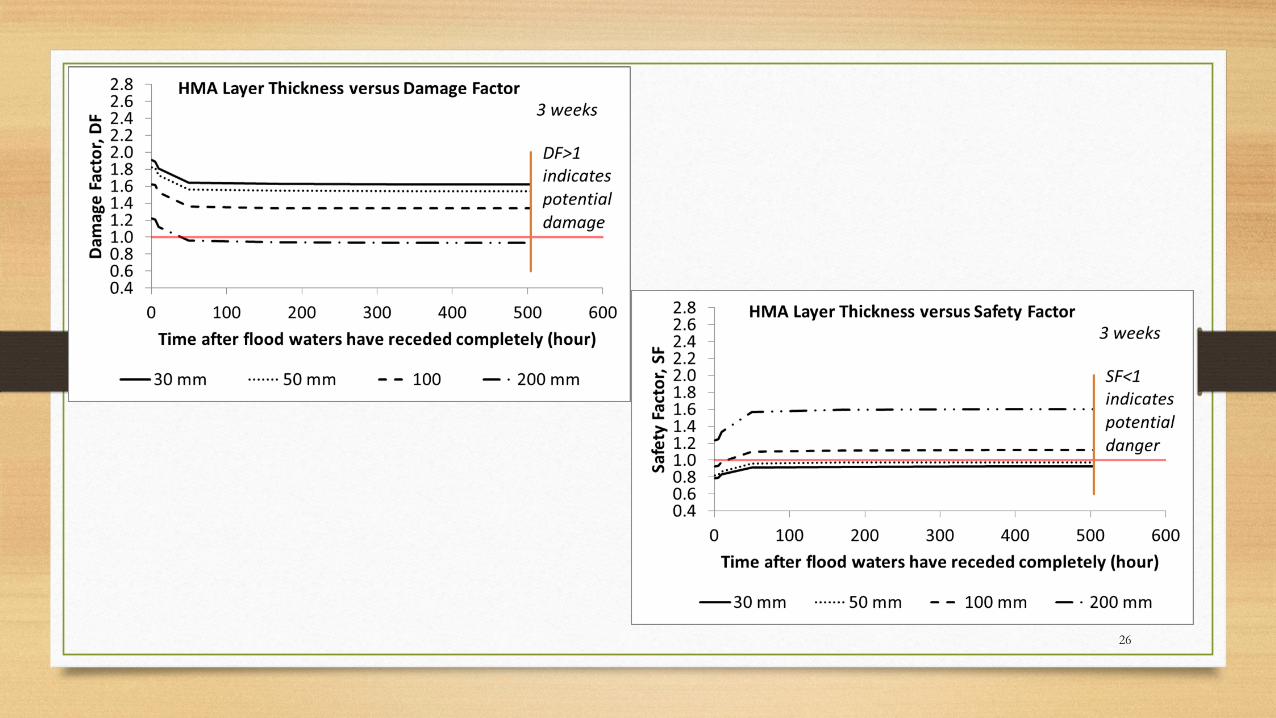
Low HMA layer thickness (30 mm) >3 weeks
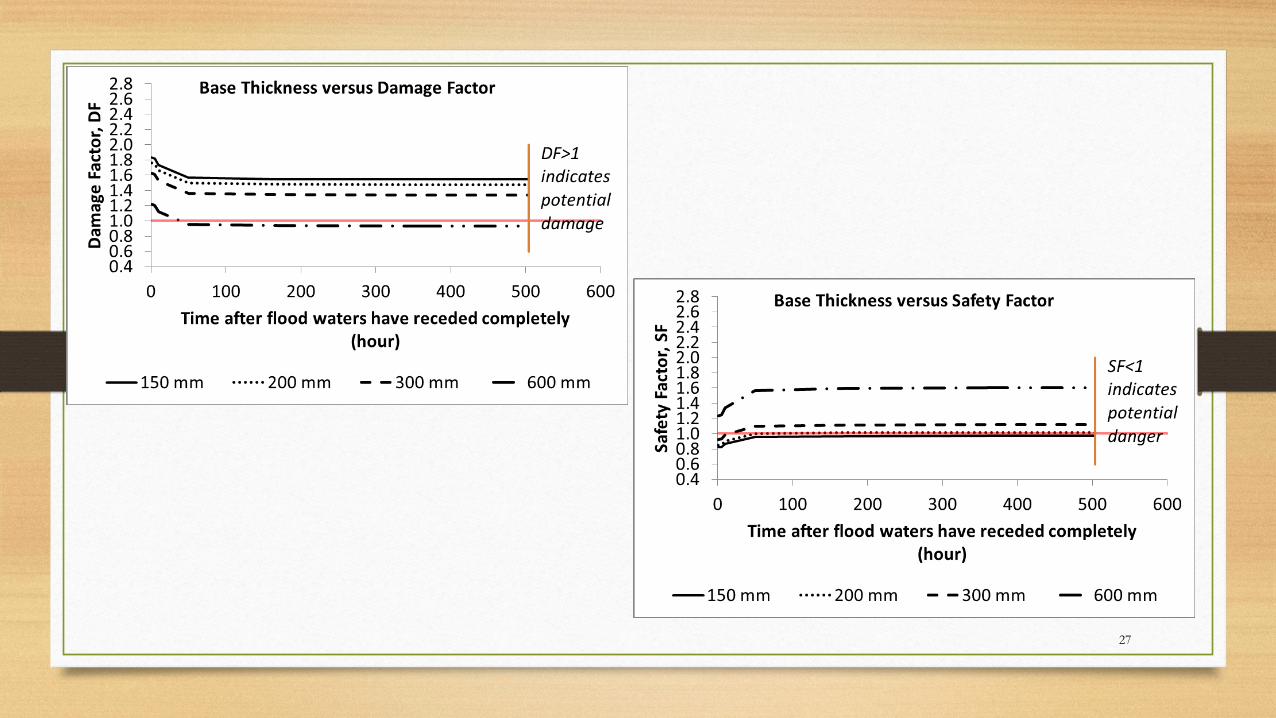
Low Base layer thickness (200 mm) 50
Low HMA layer modulus (1,000 MPa) 30
High vehicle load (100 kN per axle) 20

Conclusions
• Simulation based approach can help us • Understand the effect of multiple factors and their interactions
• Evaluate the time-dependent effect of factors
• Understand the implications of using alternative materials, methods or systems
• Promote strategic thinking by allowing scenario and “what-if ” analysis
• To reach informed consensus among different stakeholders
30
Recommendations
• Reduce the permeability of the surface layer
• Provide a thicker surface layer to protect the underlying granular base course
• Use appropriate materials to prevent cracking of the surface layer
• Seal cracks on a regular basis, especially prior to flooding seasons
• Protect embankments from erosion near flowing streams
31
Recommendations
• Use and continuously improve the simulation tool • Incorporate other realistic conditions such as edge drains
• Use state/location specific soils and pavement conditions to update the model
• Conduct pre- and post-flooding tests on pavements
• Utilize in-place data to improve the model
32
For the model and details, please contact [email protected]

Thank you!
33
Rethinking Adaptation and Resiliency (In A Rapidly Expanding System)
Dr. Cris B. Liban, P.E. Los Angeles County Metropolitan Transportation Authority
September 8, 2016
2
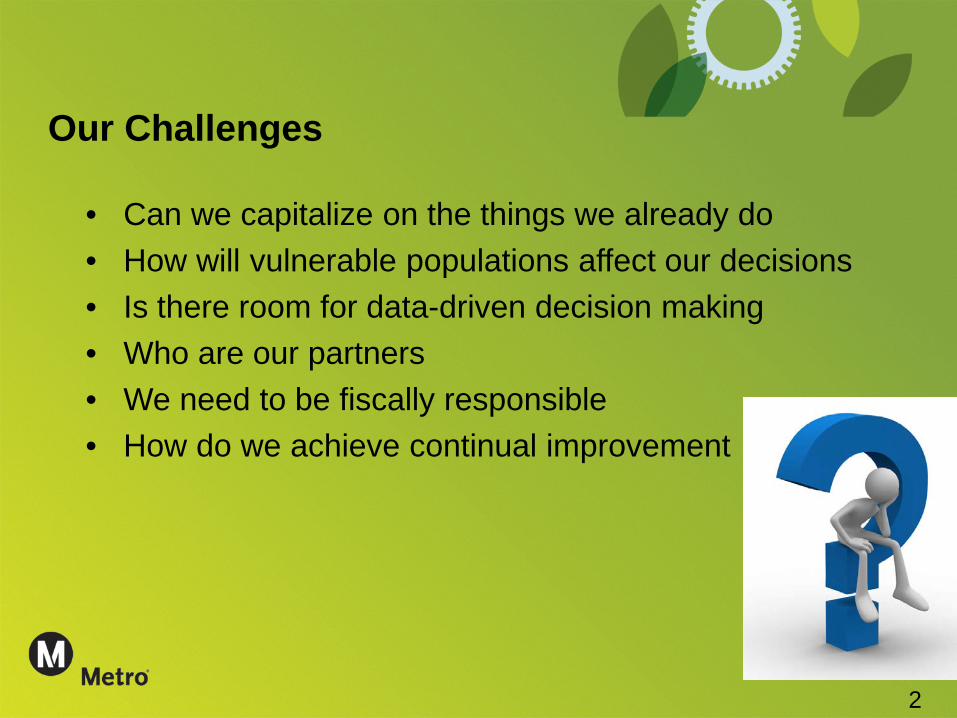
Our Challenges
• Can we capitalize on the things we already do • How will vulnerable populations affect our decisions • Is there room for data-driven decision making • Who are our partners • We need to be fiscally responsible • How do we achieve continual improvement
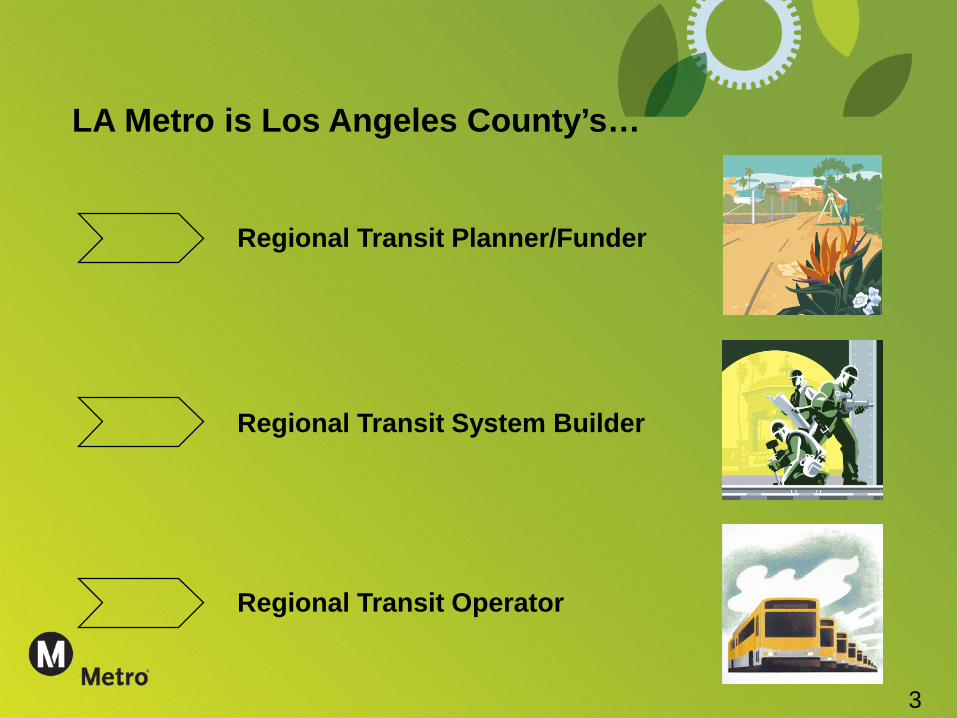
LA Metro is Los Angeles County’s…
Regional Transit Planner/Funder
Regional Transit System Builder
Regional Transit Operator
3
4
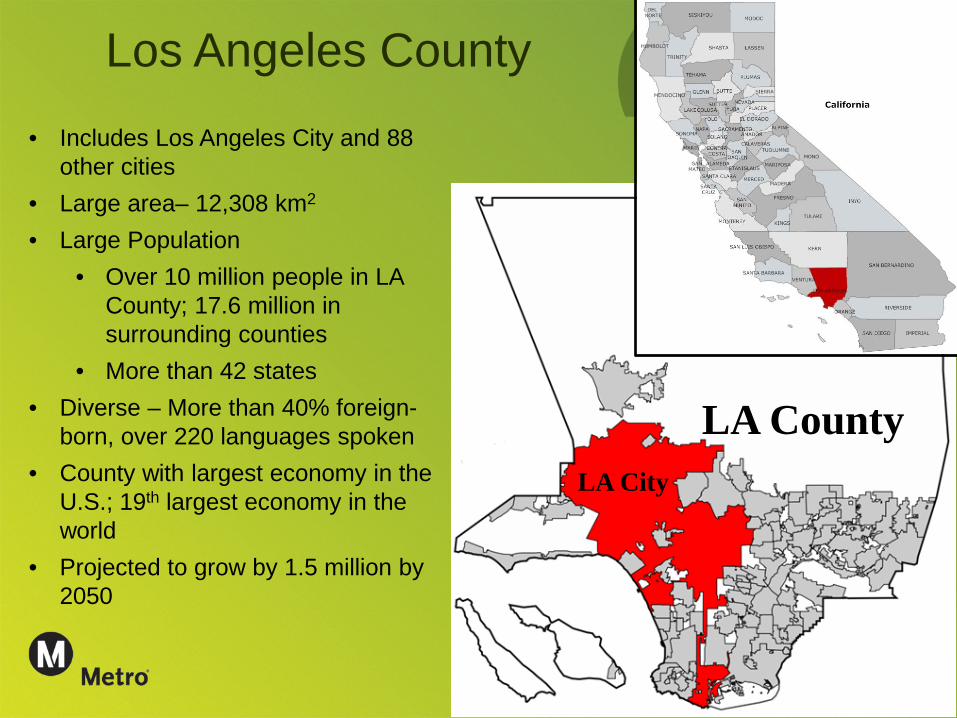
Los Angeles County • Includes Los Angeles City and 88
other cities • Large area– 12,308 km2
• Large Population • Over 10 million people in LA
County; 17.6 million in surrounding counties
• More than 42 states • Diverse – More than 40% foreign-
born, over 220 languages spoken • County with largest economy in the
U.S.; 19th largest economy in the world
• Projected to grow by 1.5 million by 2050
LA City
LA County
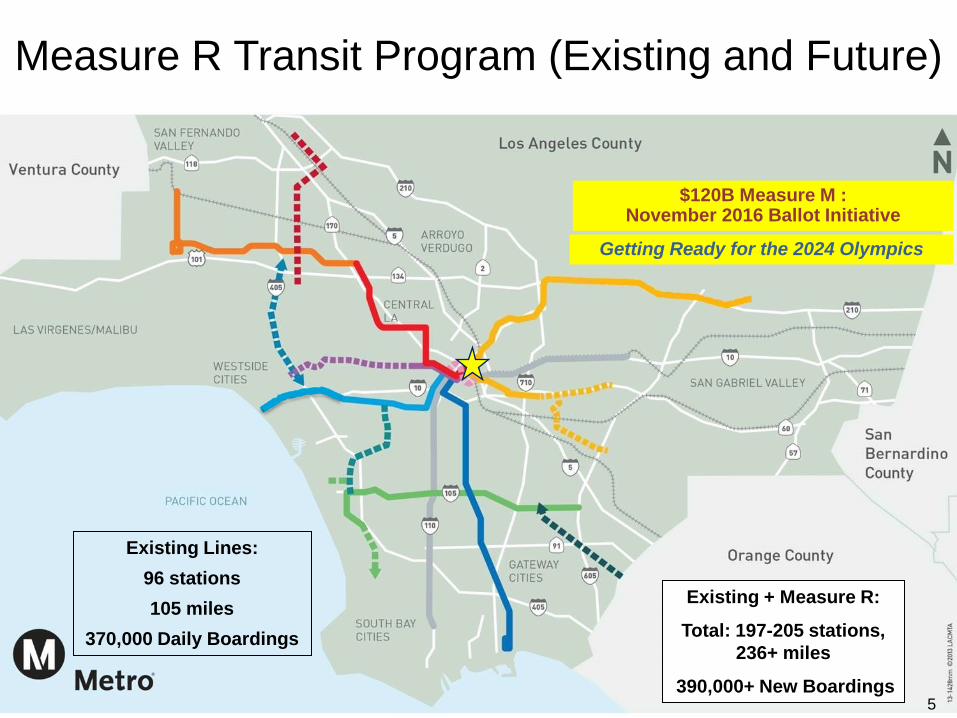
Transit Program (Existing and Future)
Existing + Measure R:
Total: 197-205 stations, 236+ miles
390,000+ New Boardings
Existing Lines: 96 stations 105 miles
370,000 Daily Boardings
5
Measure R Transit Program (Existing and Future)
$120B Measure M : November 2016 Ballot Initiative
Getting Ready for the 2024 Olympics
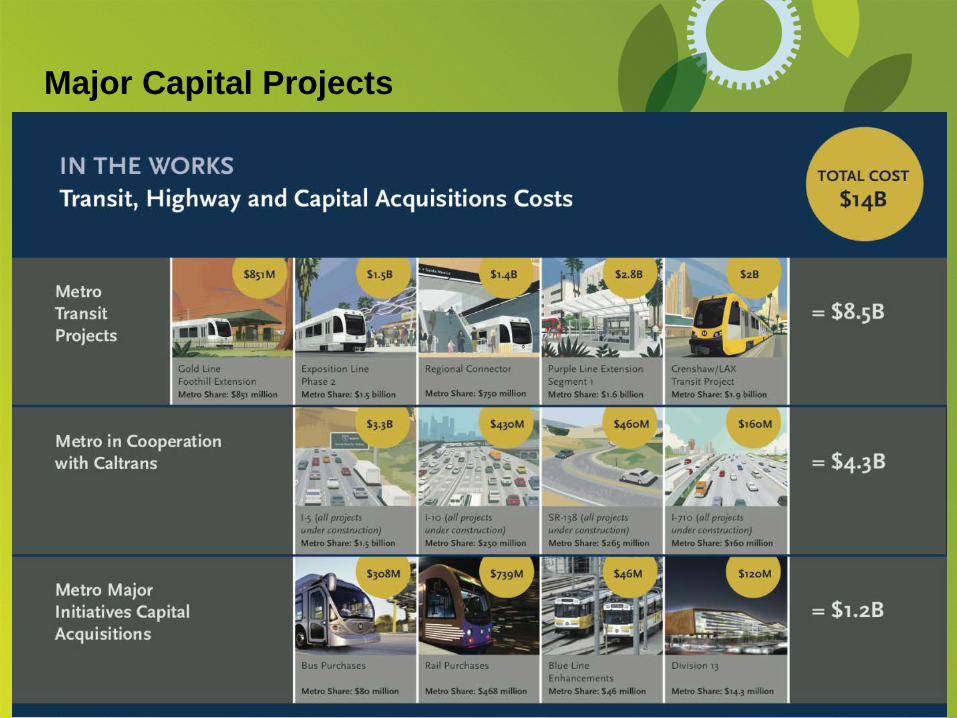
Major Capital Projects
6
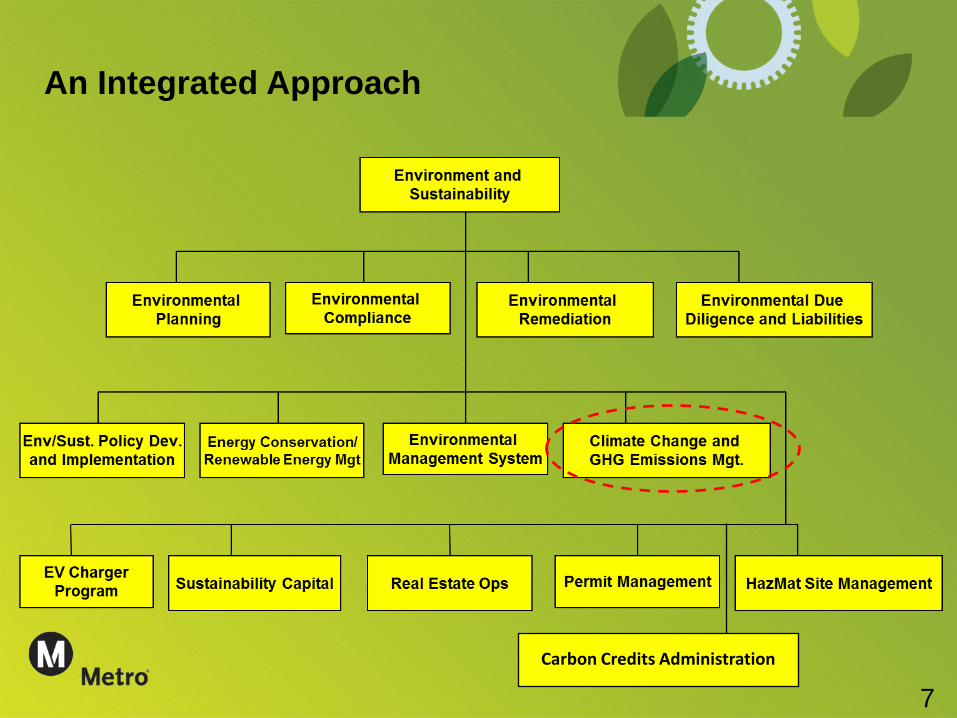
An Integrated Approach
7 Carbon Credits Administration
8
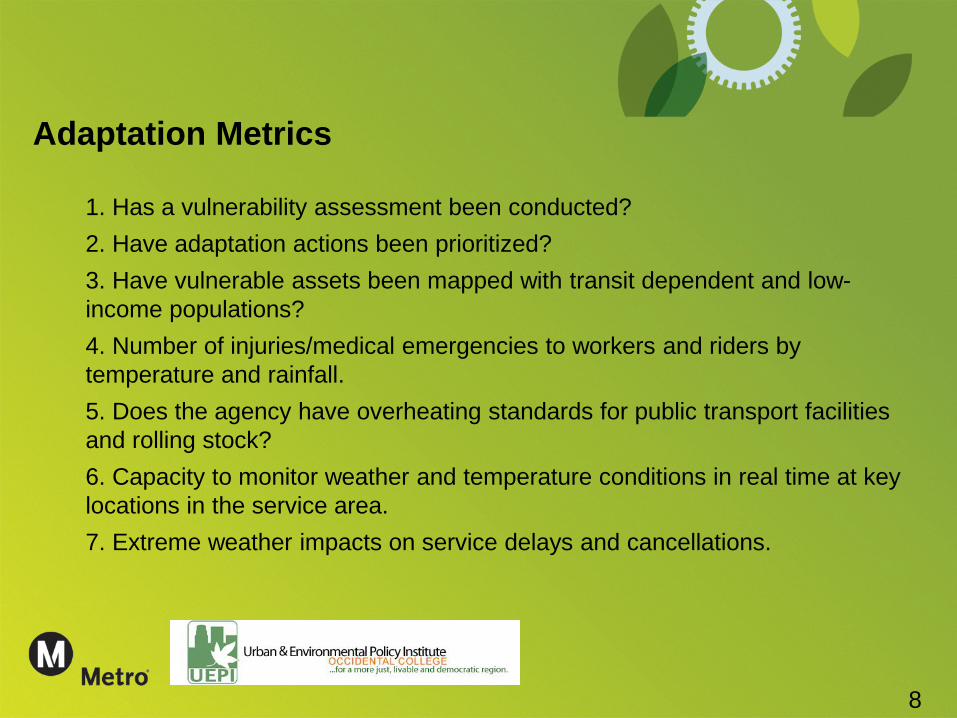
1. Has a vulnerability assessment been conducted? 2. Have adaptation actions been prioritized? 3. Have vulnerable assets been mapped with transit dependent and low-income populations? 4. Number of injuries/medical emergencies to workers and riders by temperature and rainfall. 5. Does the agency have overheating standards for public transport facilities and rolling stock? 6. Capacity to monitor weather and temperature conditions in real time at key locations in the service area. 7. Extreme weather impacts on service delays and cancellations.
Adaptation Metrics
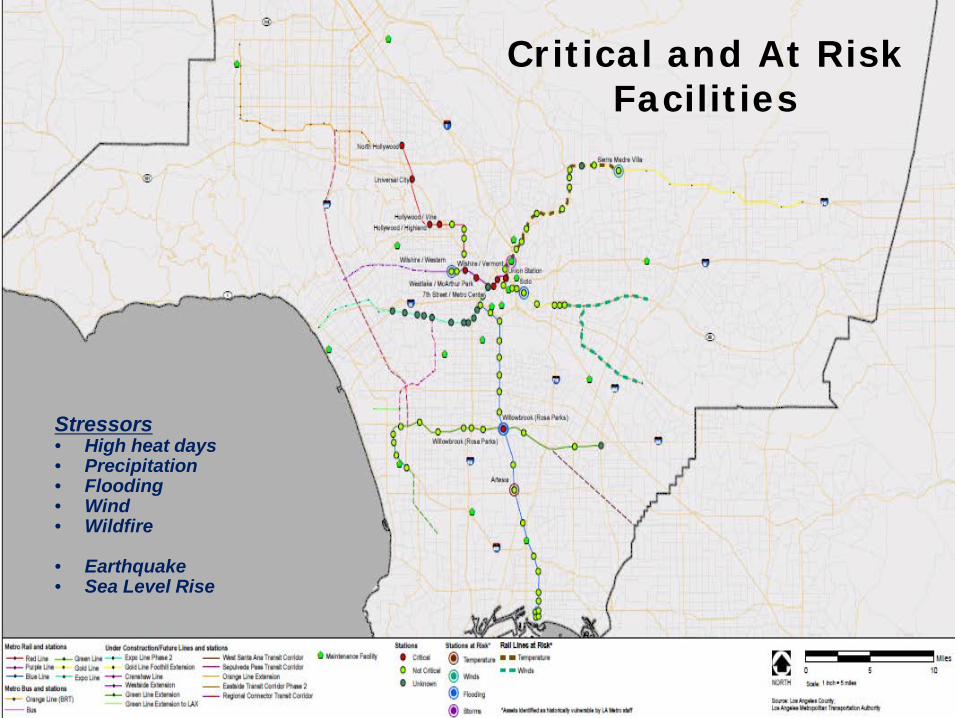
Critical and At Risk Facilities
Stressors • High heat days • Precipitation • Flooding • Wind • Wildfire
• Earthquake • Sea Level Rise
10
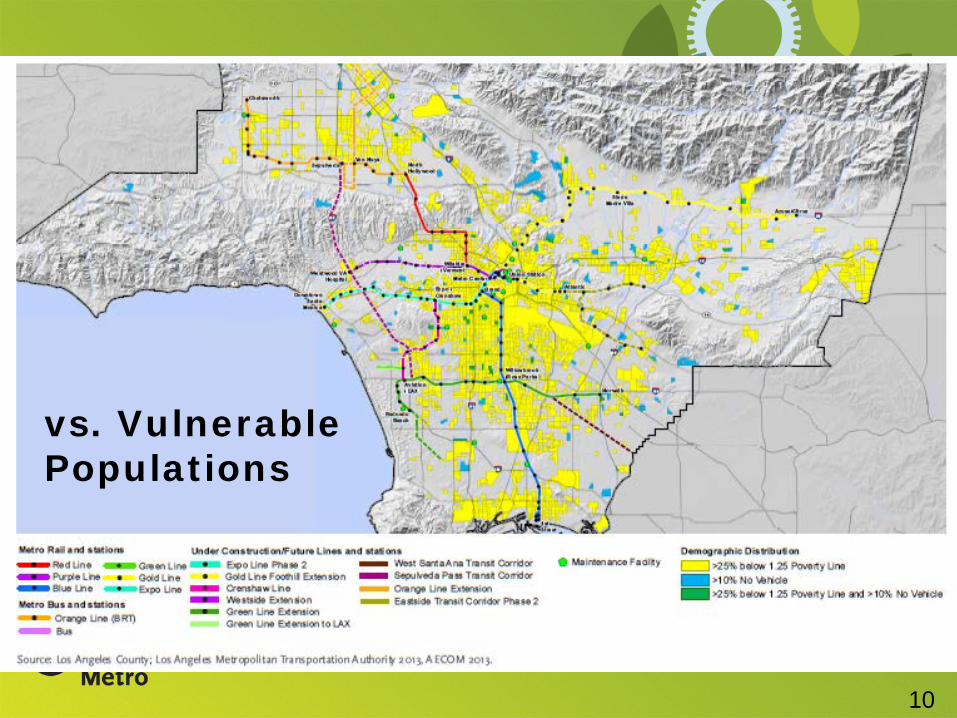
vs. Vulnerable Populations
11
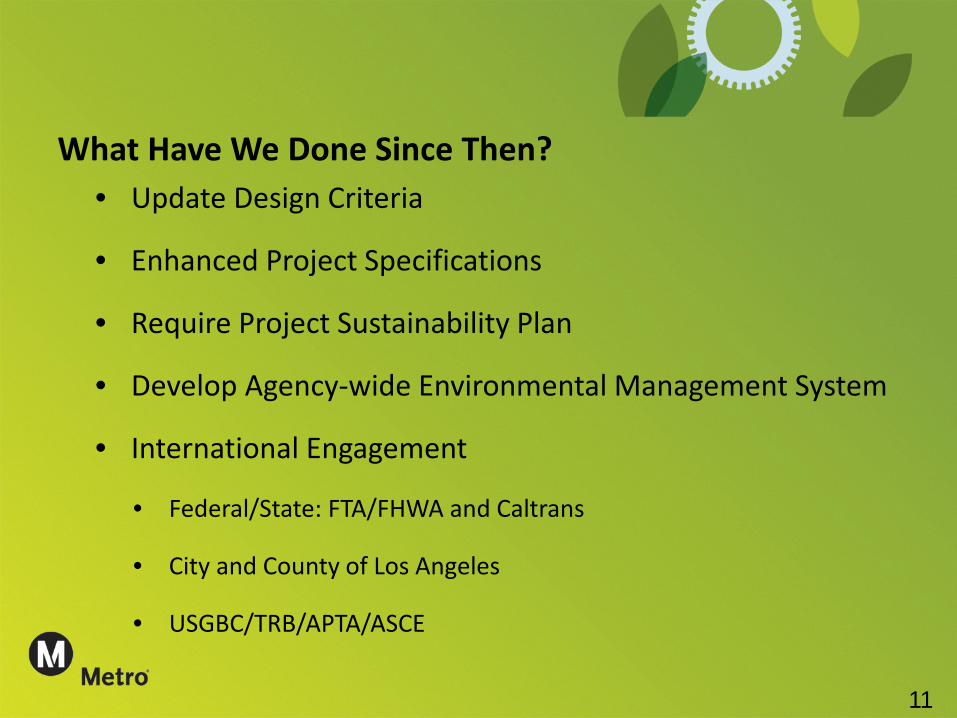
What Have We Done Since Then? • Update Design Criteria
• Enhanced Project Specifications
• Require Project Sustainability Plan
• Develop Agency-wide Environmental Management System
• International Engagement
• Federal/State: FTA/FHWA and Caltrans
• City and County of Los Angeles
• USGBC/TRB/APTA/ASCE
12
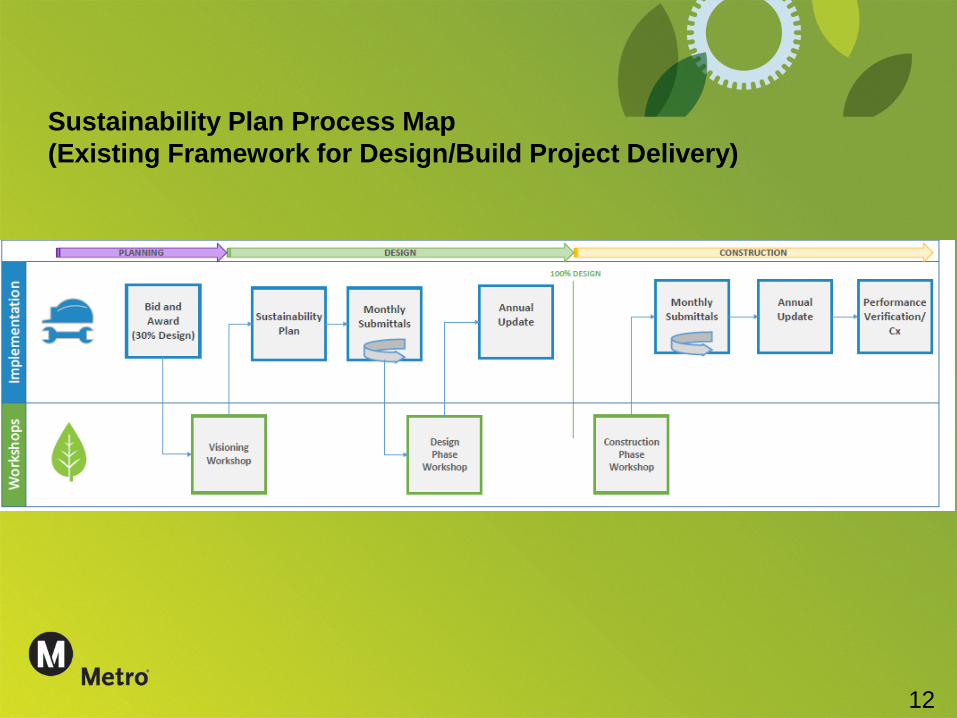
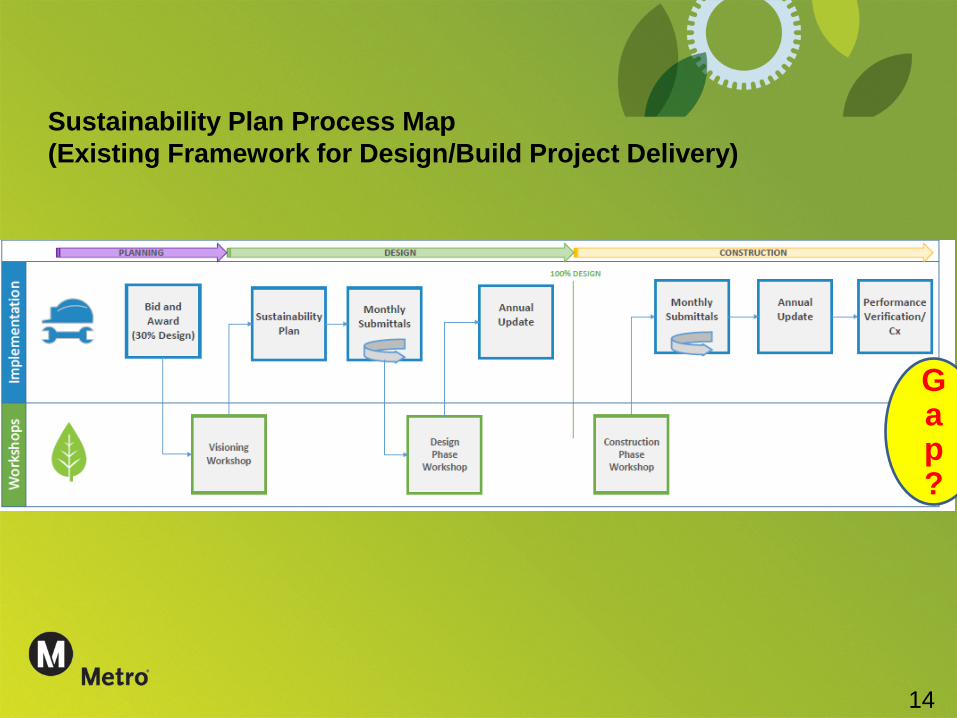
Sustainability Plan Process Map (Existing Framework for Design/Build Project Delivery)
13
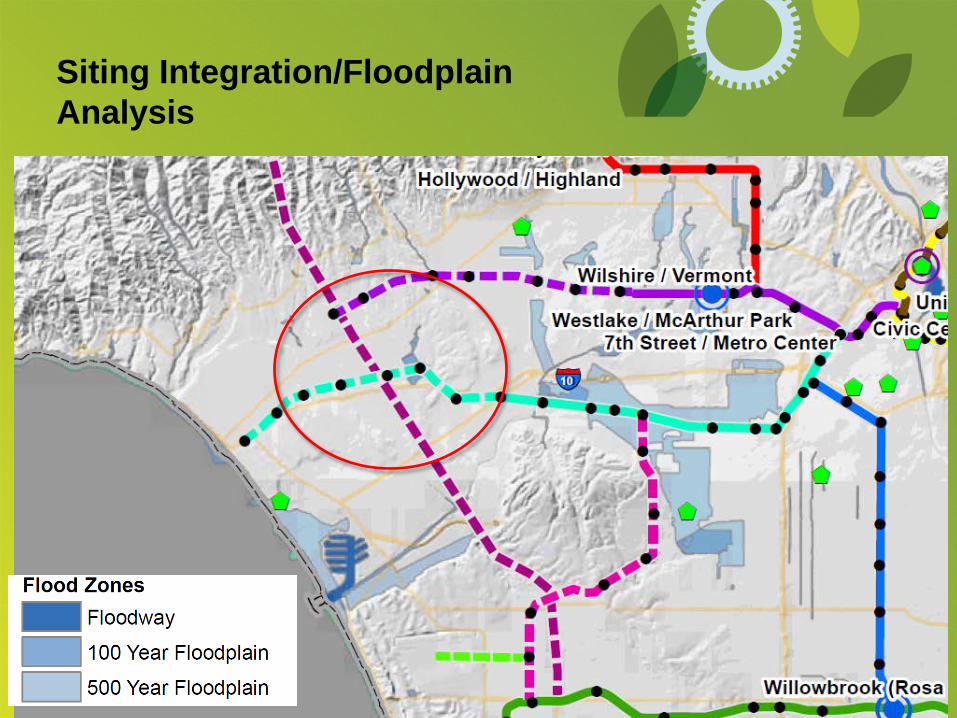
Siting Integration/Floodplain Analysis
14
Sustainability Plan Process Map (Existing Framework for Design/Build Project Delivery)
Gap?
15
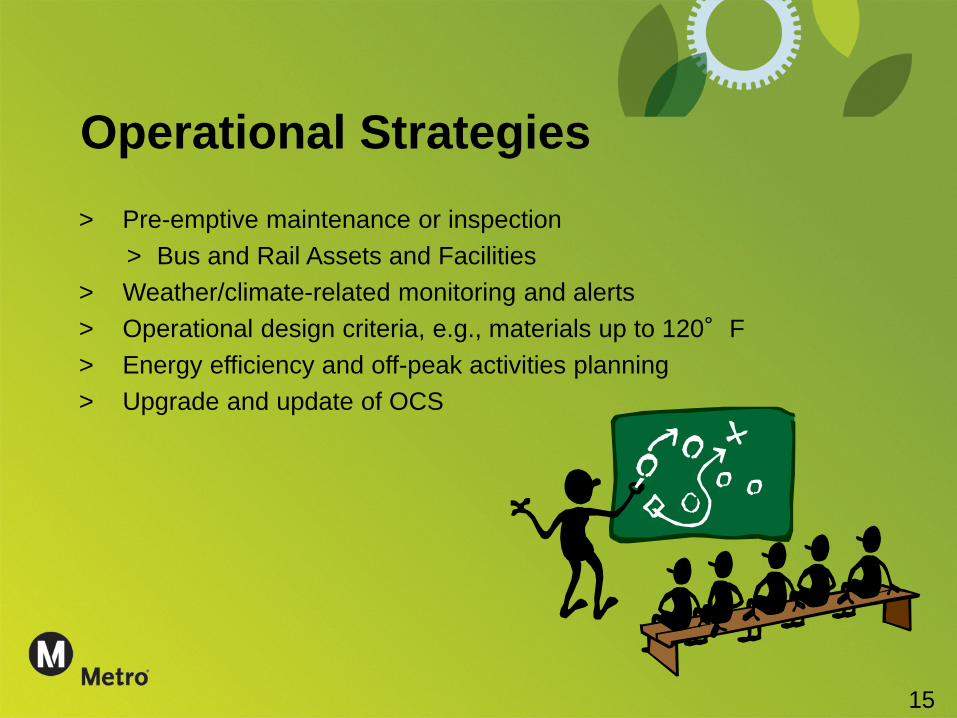
Operational Strategies > Pre-emptive maintenance or inspection
> Bus and Rail Assets and Facilities > Weather/climate-related monitoring and alerts > Operational design criteria, e.g., materials up to 120°F > Energy efficiency and off-peak activities planning > Upgrade and update of OCS
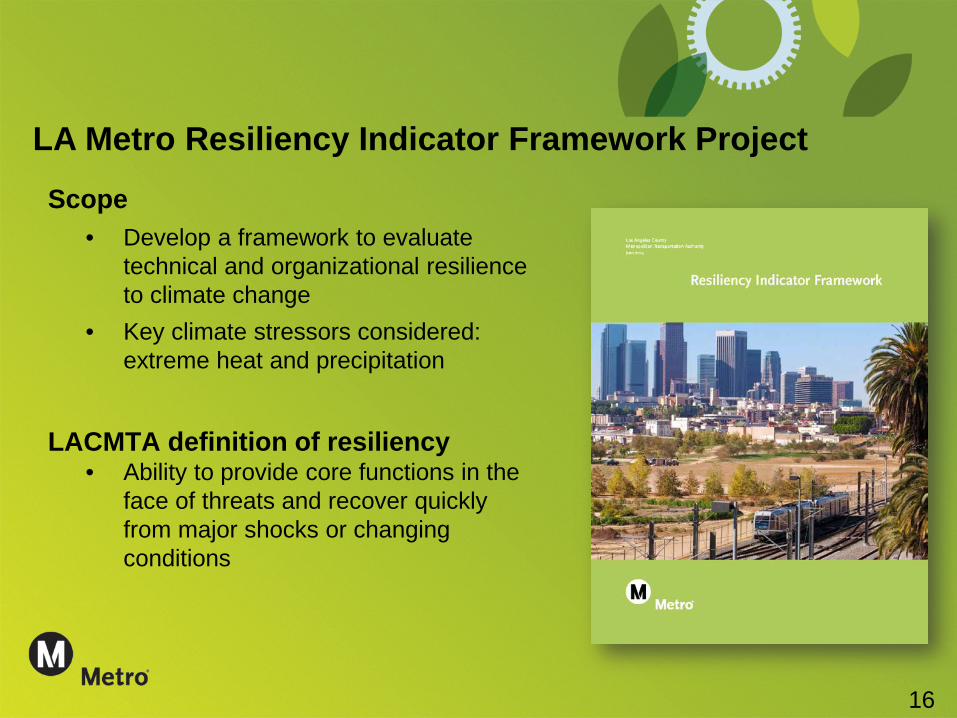
LA Metro Resiliency Indicator Framework Project
16
Scope • Develop a framework to evaluate
technical and organizational resilience to climate change
• Key climate stressors considered: extreme heat and precipitation
LACMTA definition of resiliency
• Ability to provide core functions in the face of threats and recover quickly from major shocks or changing conditions
17
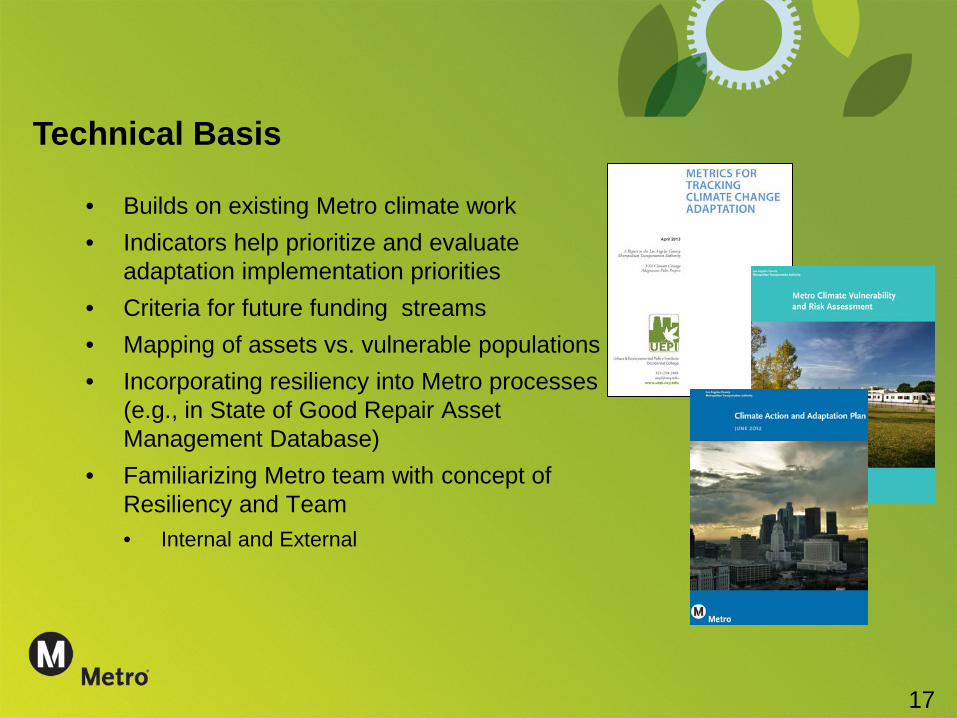
• Builds on existing Metro climate work • Indicators help prioritize and evaluate
adaptation implementation priorities • Criteria for future funding streams • Mapping of assets vs. vulnerable populations • Incorporating resiliency into Metro processes
(e.g., in State of Good Repair Asset Management Database)
• Familiarizing Metro team with concept of Resiliency and Team • Internal and External
Technical Basis
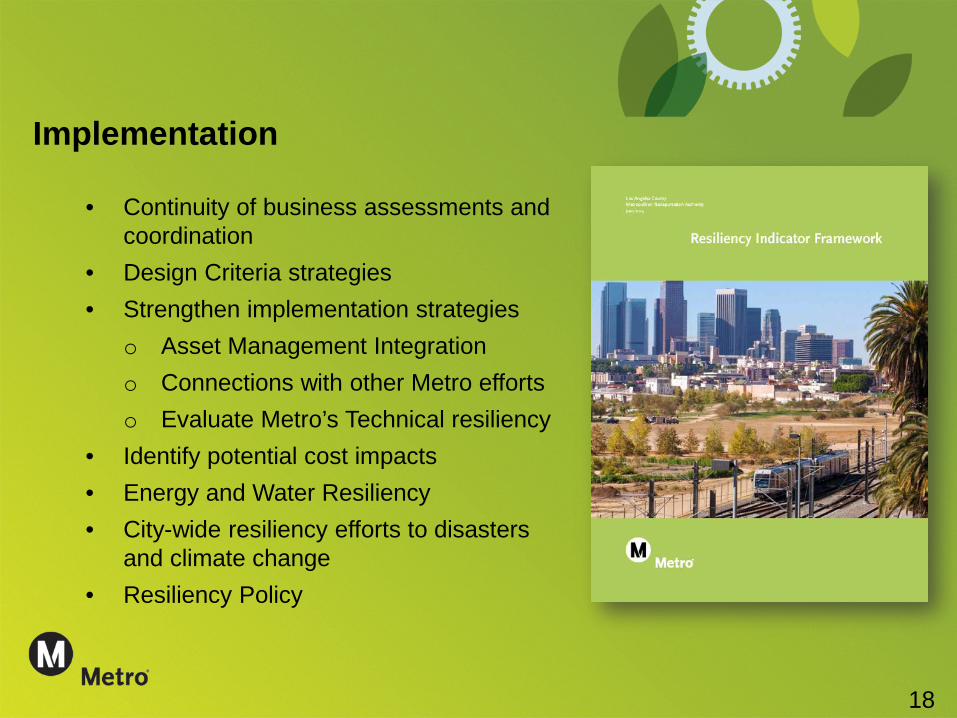
18
• Continuity of business assessments and
coordination • Design Criteria strategies • Strengthen implementation strategies
o Asset Management Integration o Connections with other Metro efforts o Evaluate Metro’s Technical resiliency
• Identify potential cost impacts • Energy and Water Resiliency • City-wide resiliency efforts to disasters
and climate change • Resiliency Policy
Implementation
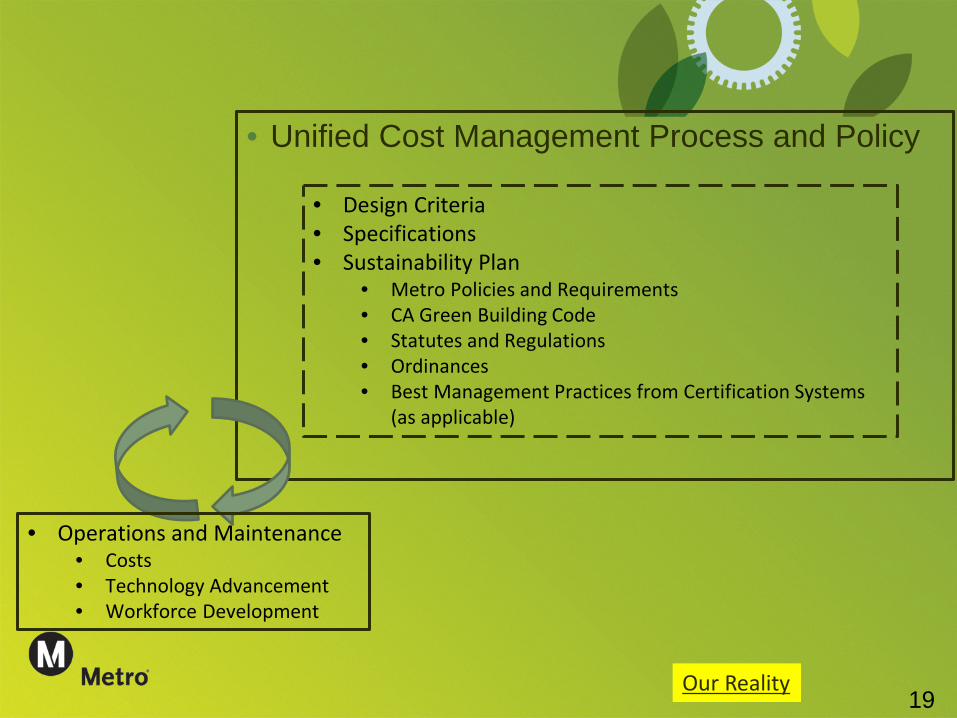
19
• Unified Cost Management Process and Policy
• Design Criteria • Specifications • Sustainability Plan
• Metro Policies and Requirements • CA Green Building Code • Statutes and Regulations • Ordinances • Best Management Practices from Certification Systems
(as applicable)
• Operations and Maintenance • Costs • Technology Advancement • Workforce Development
Our Reality
20
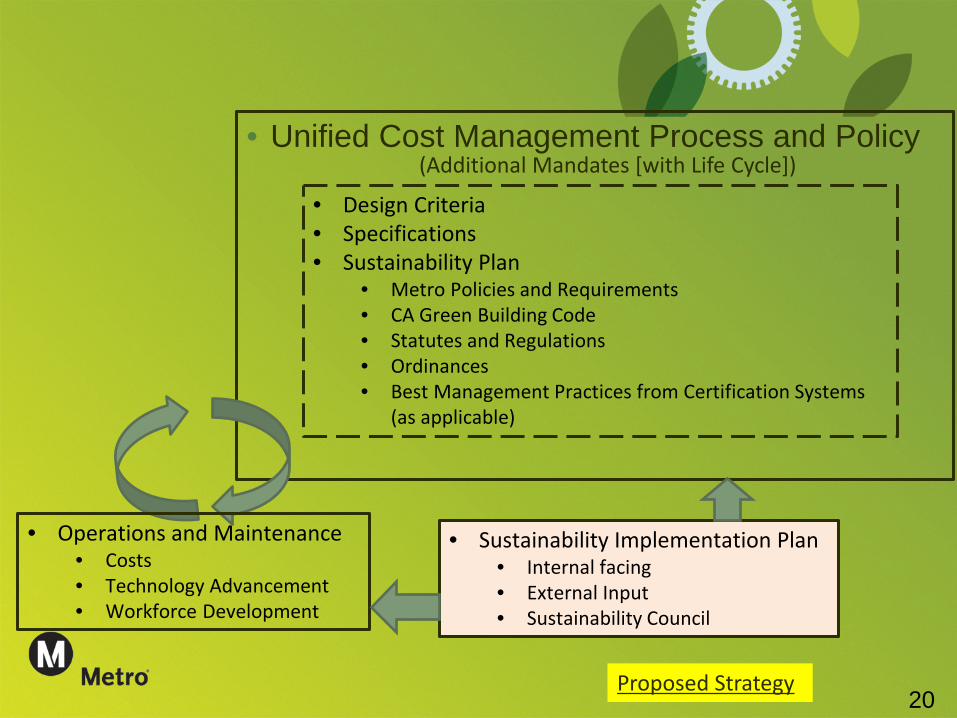
• Unified Cost Management Process and Policy
• Design Criteria • Specifications • Sustainability Plan
• Metro Policies and Requirements • CA Green Building Code • Statutes and Regulations • Ordinances • Best Management Practices from Certification Systems
(as applicable)
• Operations and Maintenance • Costs • Technology Advancement • Workforce Development
• Sustainability Implementation Plan • Internal facing • External Input • Sustainability Council
Proposed Strategy
(Additional Mandates [with Life Cycle])
21
- Blended Return on Investment for all of the sustainability investments already made
- Life cycle costing and/or total cost of ownership method to determine the benefits of implementing new projects
- Winter 2017
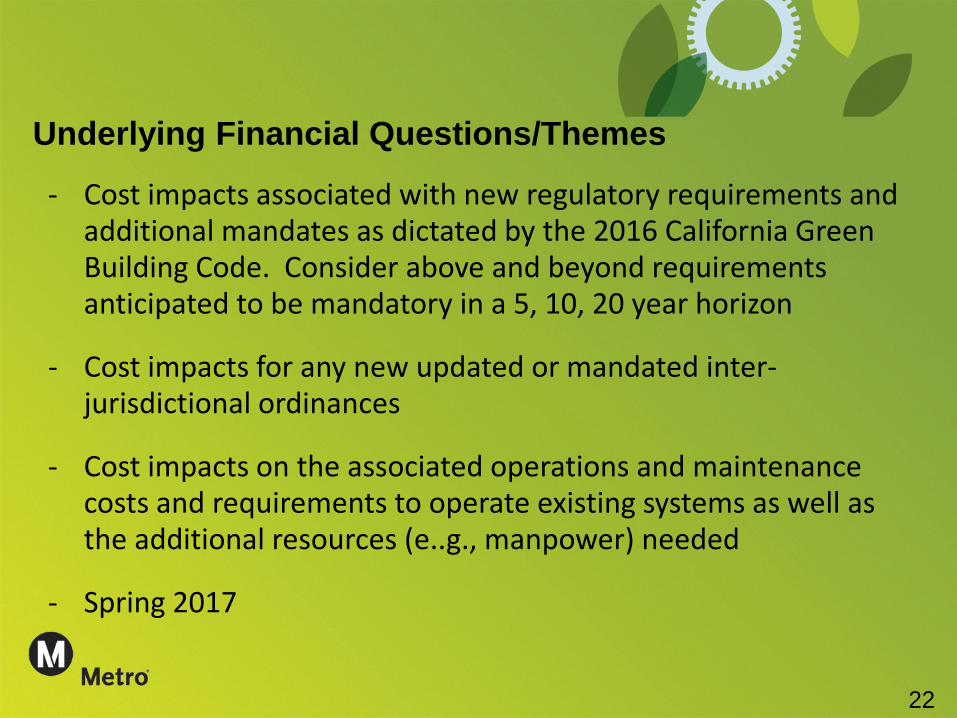
Underlying Financial Questions/Themes
22
- Cost impacts associated with new regulatory requirements and additional mandates as dictated by the 2016 California Green Building Code. Consider above and beyond requirements anticipated to be mandatory in a 5, 10, 20 year horizon
- Cost impacts for any new updated or mandated inter-jurisdictional ordinances
- Cost impacts on the associated operations and maintenance costs and requirements to operate existing systems as well as the additional resources (e..g., manpower) needed
- Spring 2017
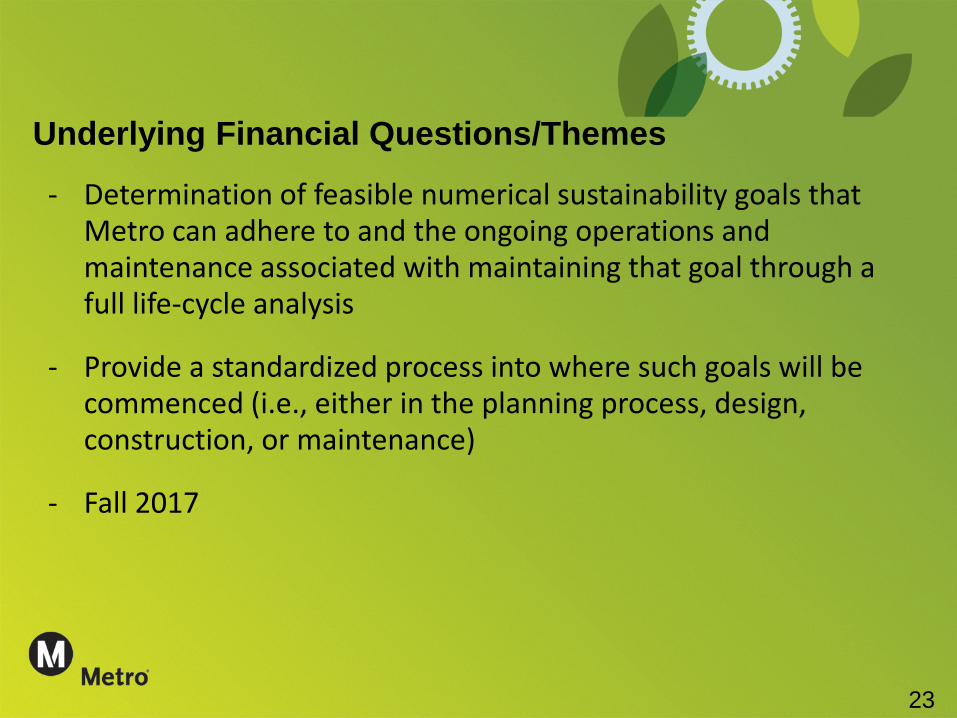
Underlying Financial Questions/Themes
23
- Determination of feasible numerical sustainability goals that Metro can adhere to and the ongoing operations and maintenance associated with maintaining that goal through a full life-cycle analysis
- Provide a standardized process into where such goals will be commenced (i.e., either in the planning process, design, construction, or maintenance)
- Fall 2017
Underlying Financial Questions/Themes
24
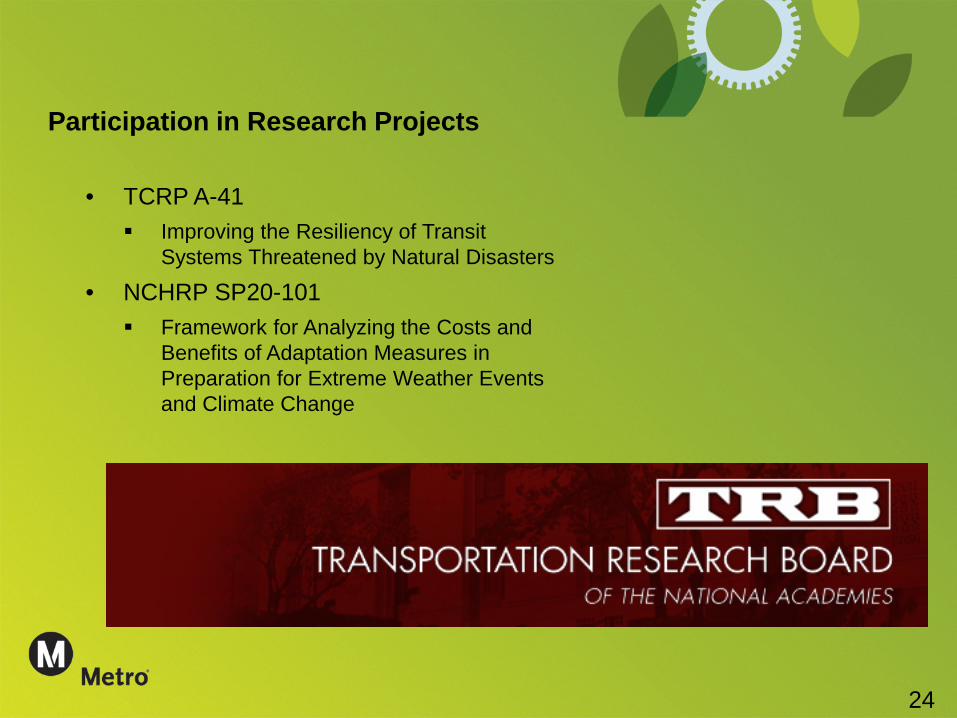
Participation in Research Projects
• TCRP A-41 Improving the Resiliency of Transit
Systems Threatened by Natural Disasters
• NCHRP SP20-101 Framework for Analyzing the Costs and
Benefits of Adaptation Measures in Preparation for Extreme Weather Events and Climate Change
25
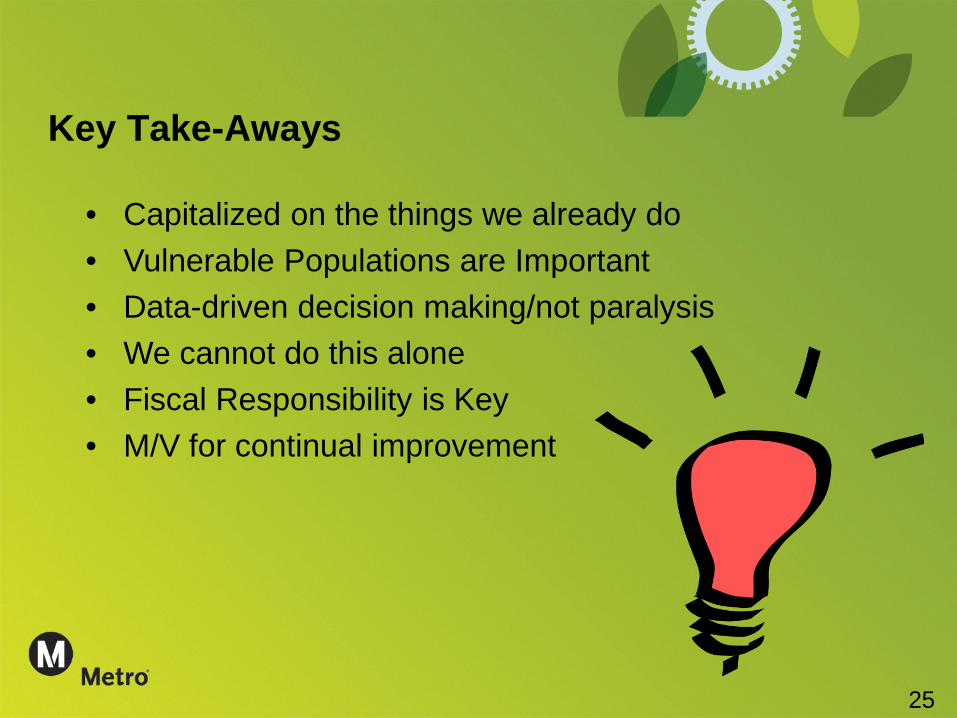
Key Take-Aways
• Capitalized on the things we already do • Vulnerable Populations are Important • Data-driven decision making/not paralysis • We cannot do this alone • Fiscal Responsibility is Key • M/V for continual improvement
Questions/Discussion
Cris B. Liban, D.Env., P.E. p: 213/922-2471 c: 213/792-5777 e/m: [email protected]
www.metro.net/ecsd 213/922-1100
26
Strategic Management Challenges for Climate Resilient and Sustainable Transportation
Robert Paddon
TRANSPORTATION RESEARCH BOARD

“Rare Harmony as China and U.S. Commit to Climate Deal”
September 3, 2016
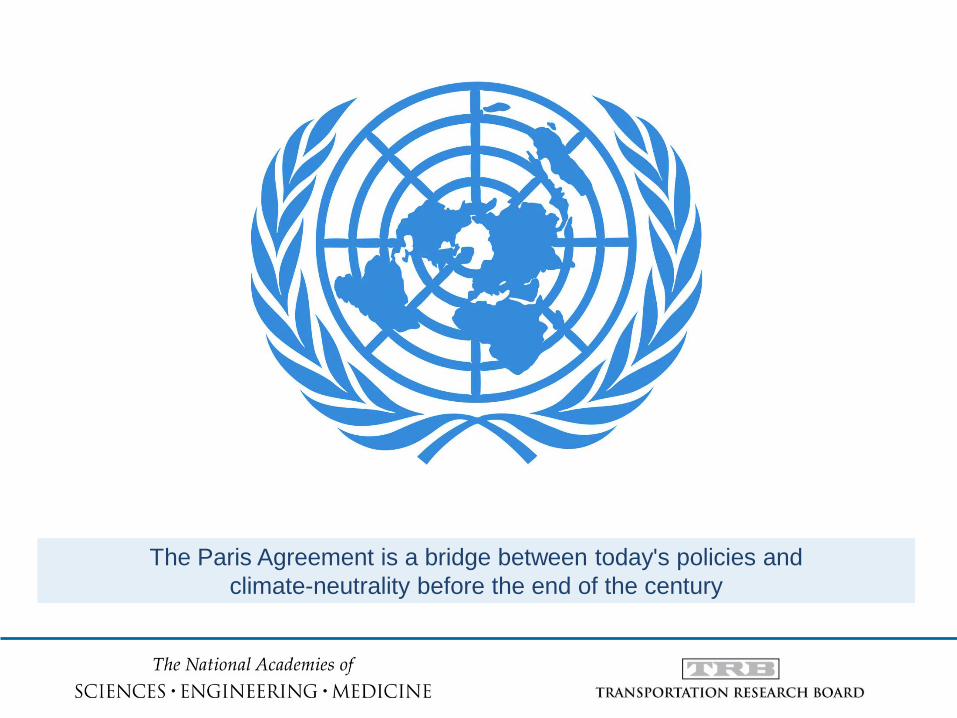
The Paris Agreement is a bridge between today's policies and climate-neutrality before the end of the century
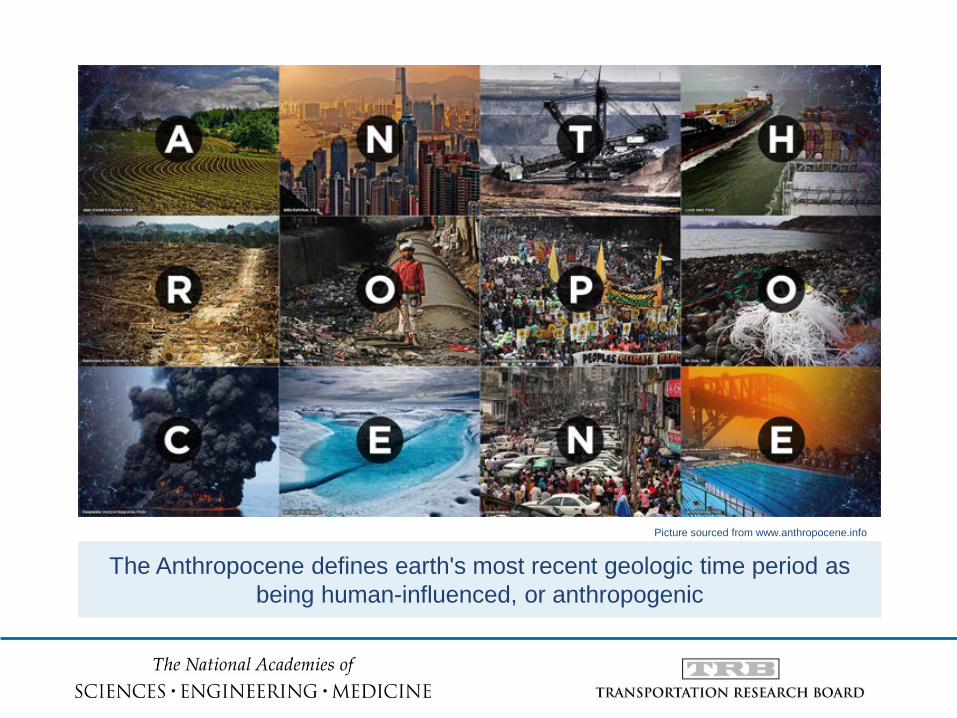
The Anthropocene defines earth's most recent geologic time period as being human-influenced, or anthropogenic
Picture sourced from www.anthropocene.info
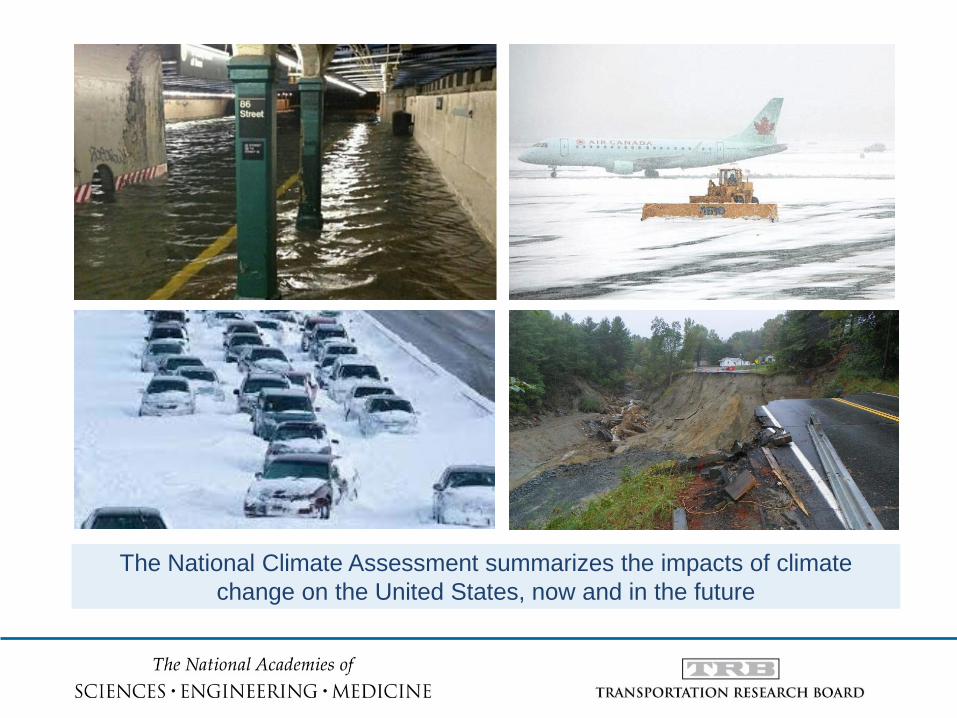
The National Climate Assessment summarizes the impacts of climate change on the United States, now and in the future
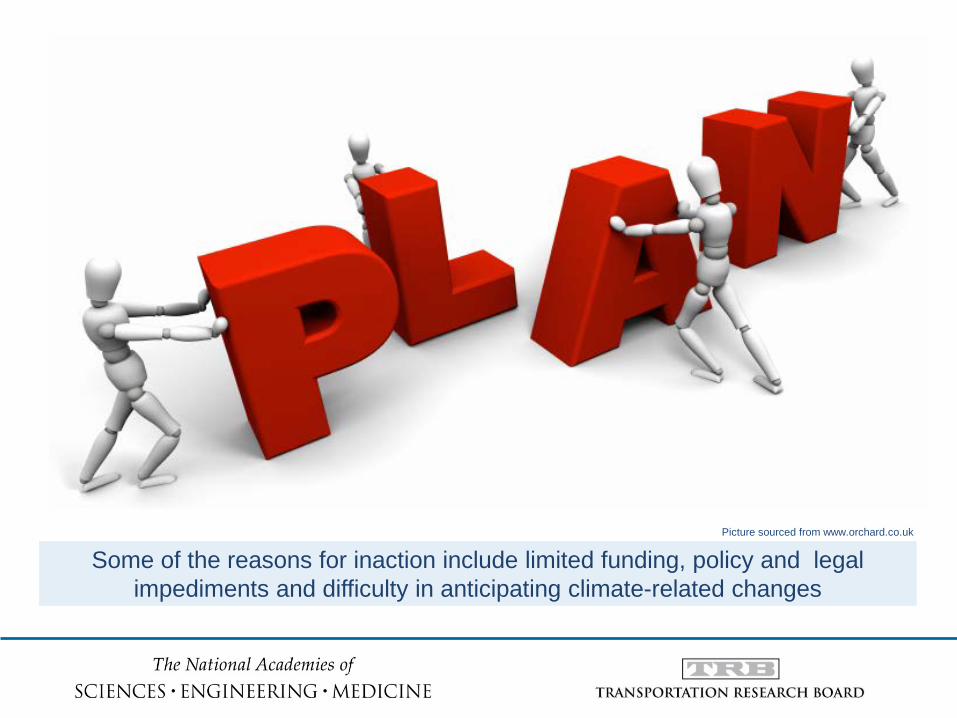
Some of the reasons for inaction include limited funding, policy and legal impediments and difficulty in anticipating climate-related changes
Picture sourced from www.orchard.co.uk
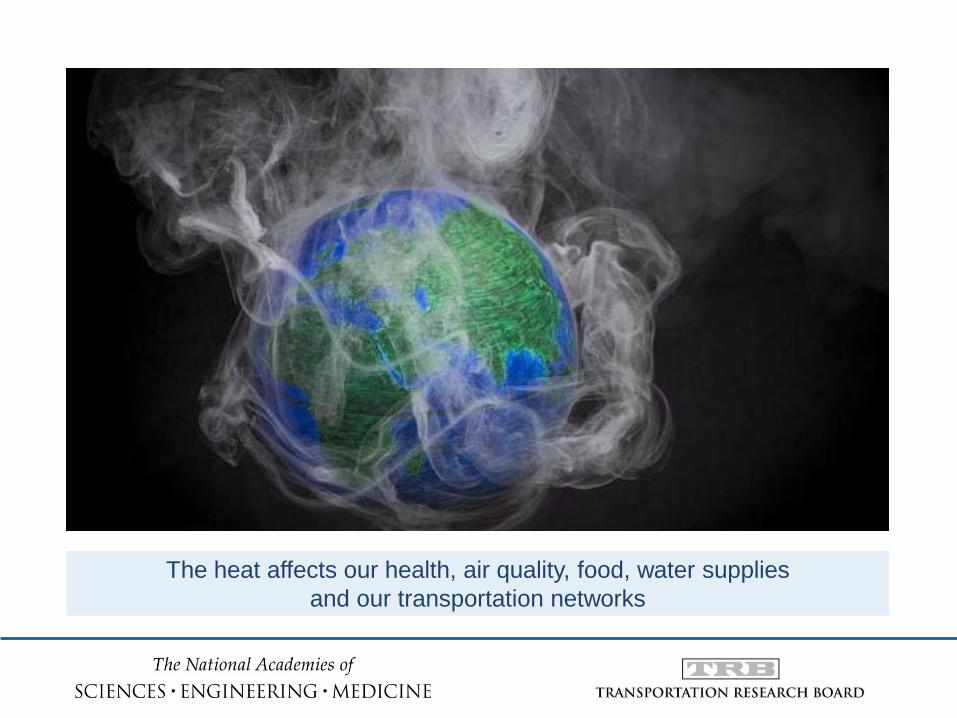
The heat affects our health, air quality, food, water supplies and our transportation networks
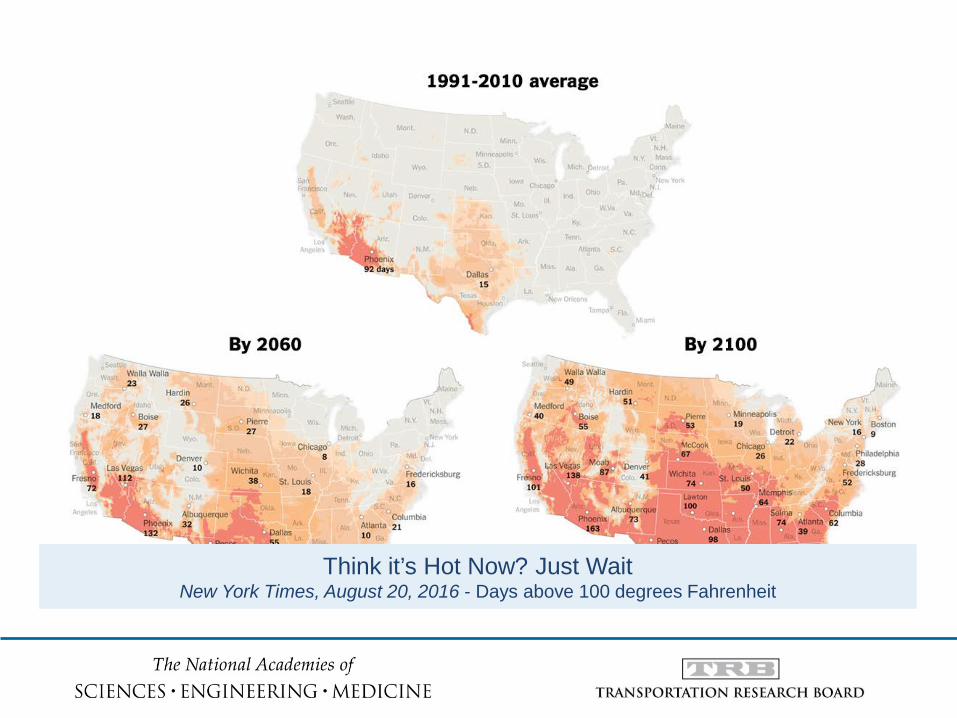
Think it’s Hot Now? Just Wait New York Times, August 20, 2016 - Days above 100 degrees Fahrenheit
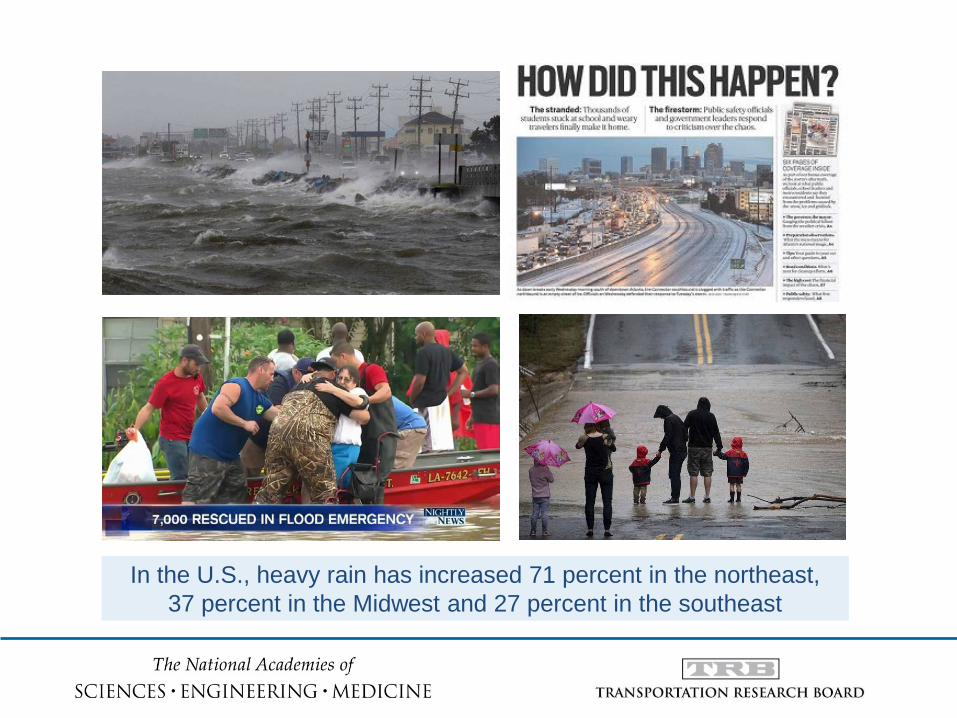
In the U.S., heavy rain has increased 71 percent in the northeast, 37 percent in the Midwest and 27 percent in the southeast
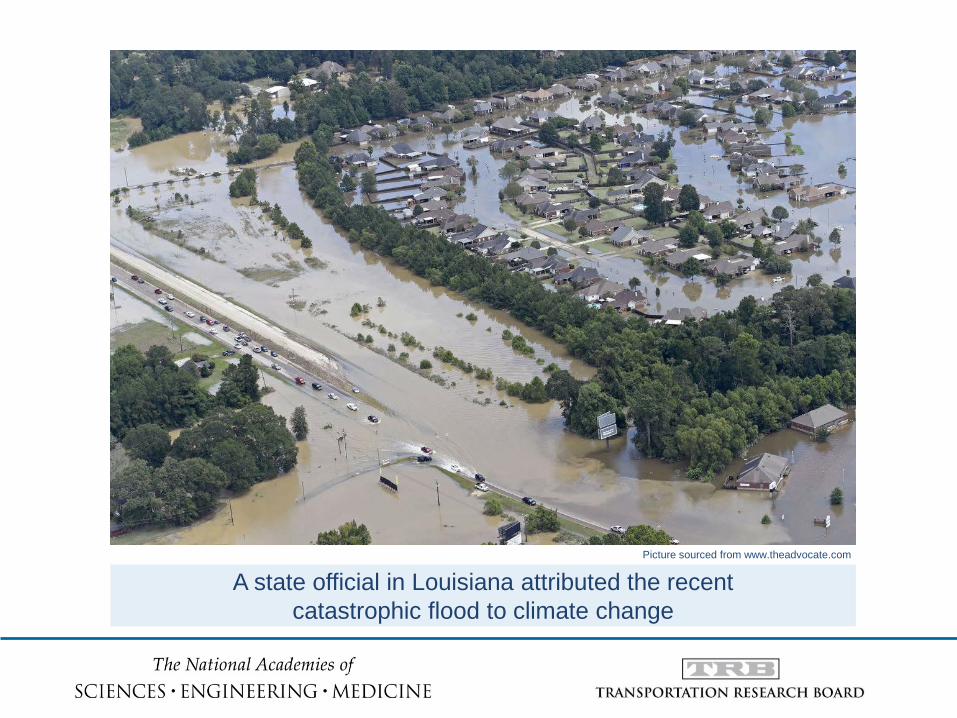
A state official in Louisiana attributed the recent catastrophic flood to climate change
Picture sourced from www.theadvocate.com
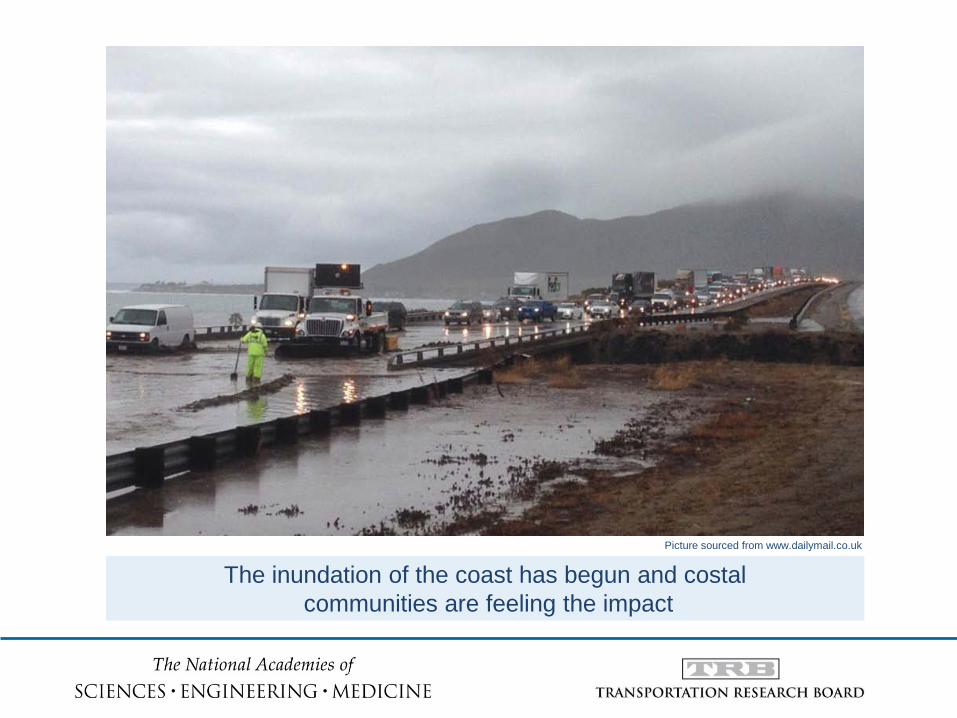
The inundation of the coast has begun and costal communities are feeling the impact
Picture sourced from www.dailymail.co.uk
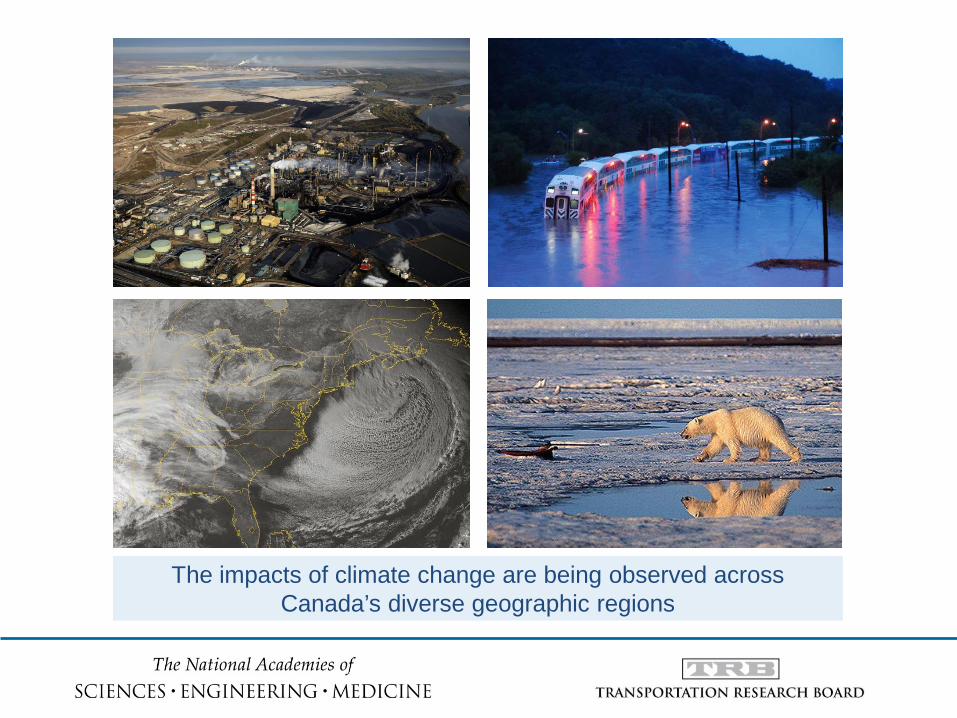
The impacts of climate change are being observed across Canada’s diverse geographic regions
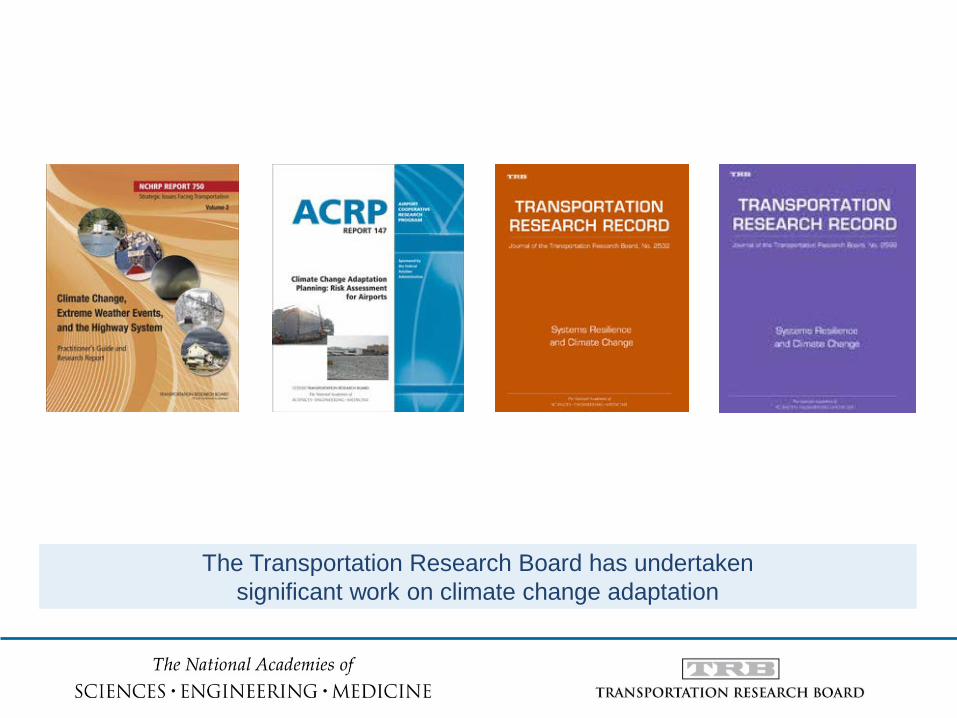
The Transportation Research Board has undertaken significant work on climate change adaptation
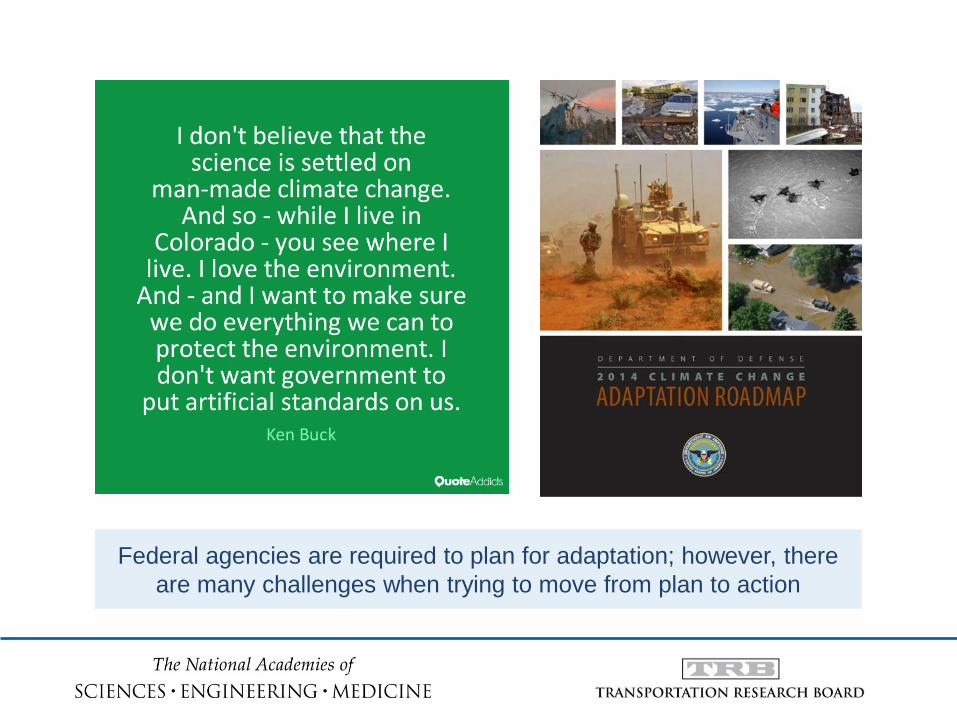
Federal agencies are required to plan for adaptation; however, there are many challenges when trying to move from plan to action
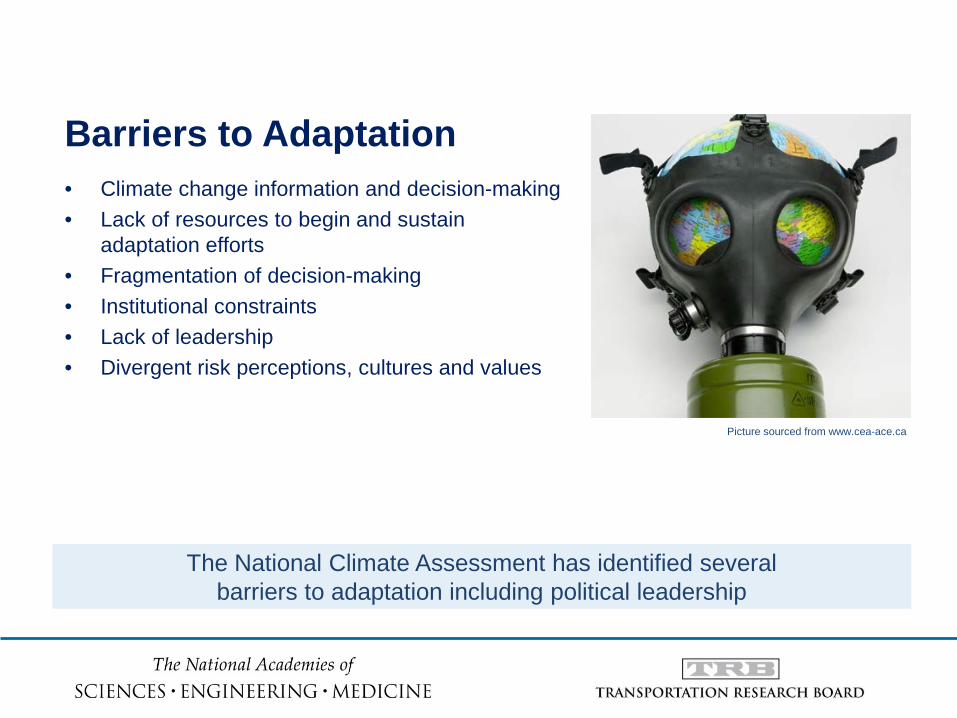
Barriers to Adaptation
• Climate change information and decision-making • Lack of resources to begin and sustain
adaptation efforts • Fragmentation of decision-making • Institutional constraints • Lack of leadership • Divergent risk perceptions, cultures and values
The National Climate Assessment has identified several barriers to adaptation including political leadership
Picture sourced from www.cea-ace.ca
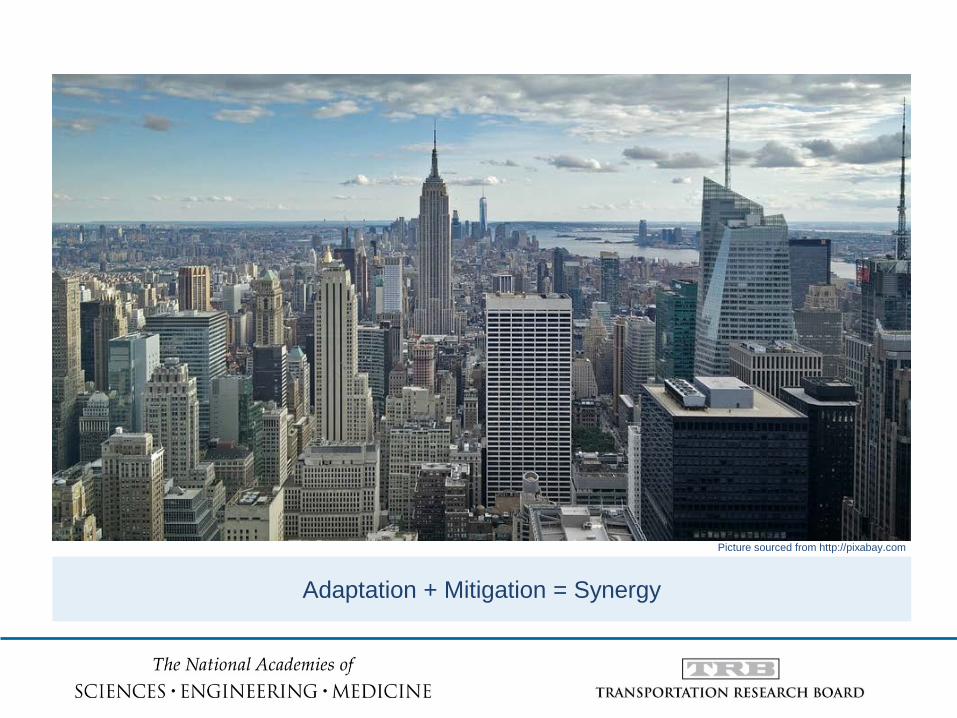
Adaptation + Mitigation = Synergy
Picture sourced from http://pixabay.com