Embed Size (px)
Citation preview
APA-OK State Planning Conference 2014
October 2-3
Norman, OK
Cynthia Hoyle, FAICP
Alta Planning + Design1

A system’s ability to accommodate variable and unexpected conditions without catastrophic failure
“the capacity to absorb shocks gracefully” (Foster, 1993)
Security refers to freedom from danger or fear
Resilience can be evaluated at various levels
*Adapted from: Evaluating Transportation Resilience: Evaluating The Transportation
System’s Ability To Accommodate Diverse, Variable and Unexpected Demands With Minimal Risk, TDM Encyclopedia, Victoria Transport Policy Institute, April 2014
2

“Resilience is the ability to prepare and plan for, absorb, recover from, and more successfully adapt to adverse events.”
—National Research Council (NRC), Disaster
Resilience: A National Imperative, 2012
3
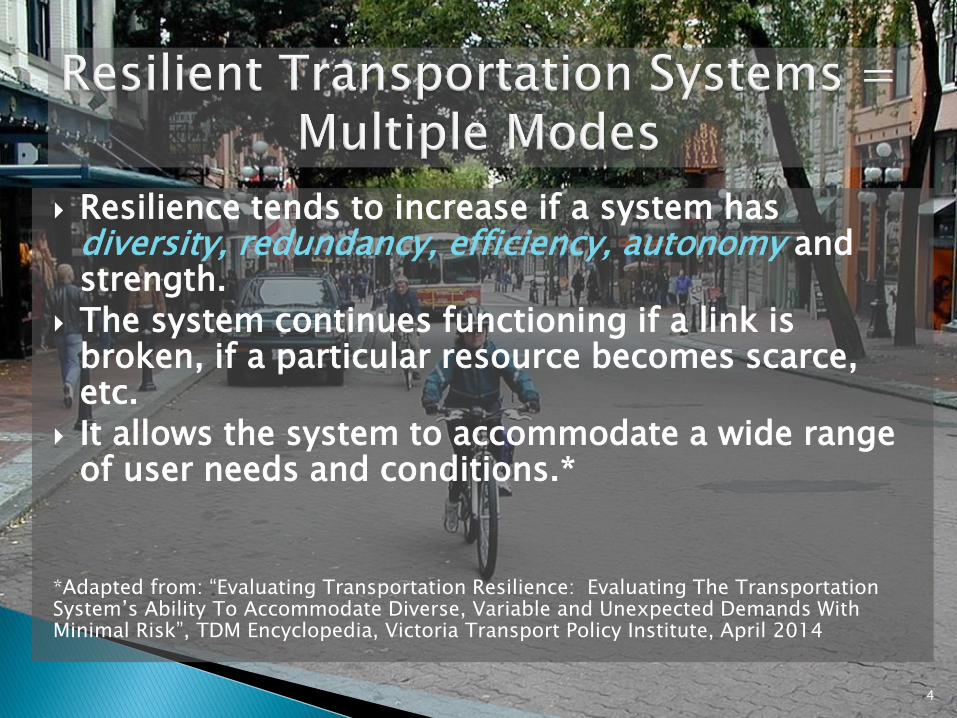
Resilience tends to increase if a system has diversity, redundancy, efficiency, autonomy and strength.
The system continues functioning if a link is broken, if a particular resource becomes scarce, etc.
It allows the system to accommodate a wide range of user needs and conditions.*
*Adapted from: “Evaluating Transportation Resilience: Evaluating The Transportation System’s Ability To Accommodate Diverse, Variable and Unexpected Demands With Minimal Risk”, TDM Encyclopedia, Victoria Transport Policy Institute, April 2014
4
Safely and efficiently accommodate unusual conditions including:
◦ Construction projects
◦ Emergencies
◦ Special events and gatherings
◦ Major equipment failures
◦ Disasters
◦ Scarcity/interruption of resources such as fuel/energy
5
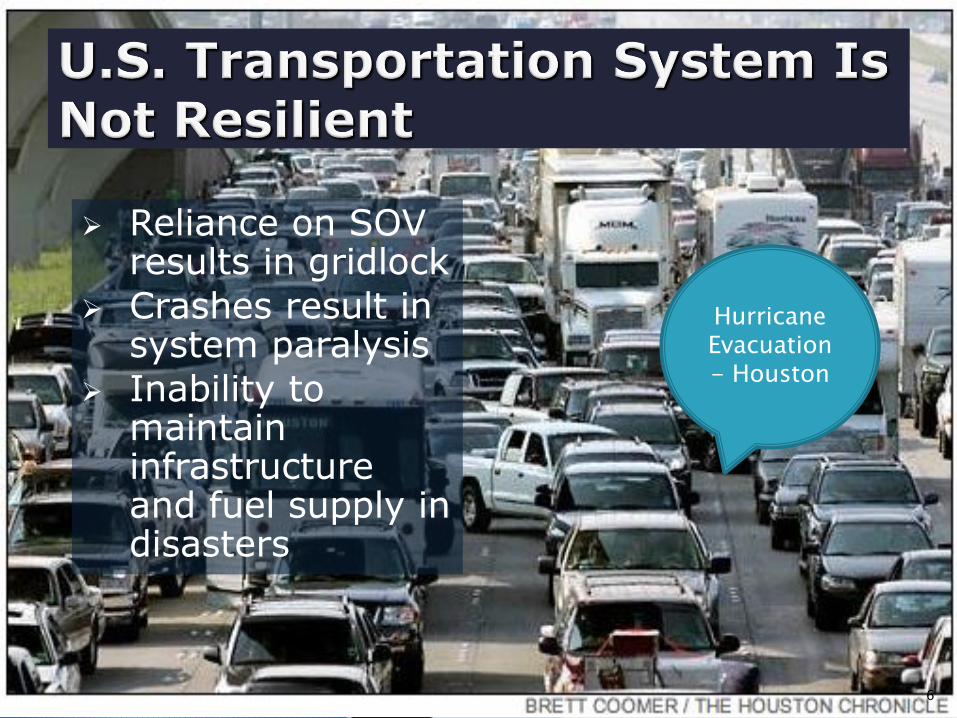
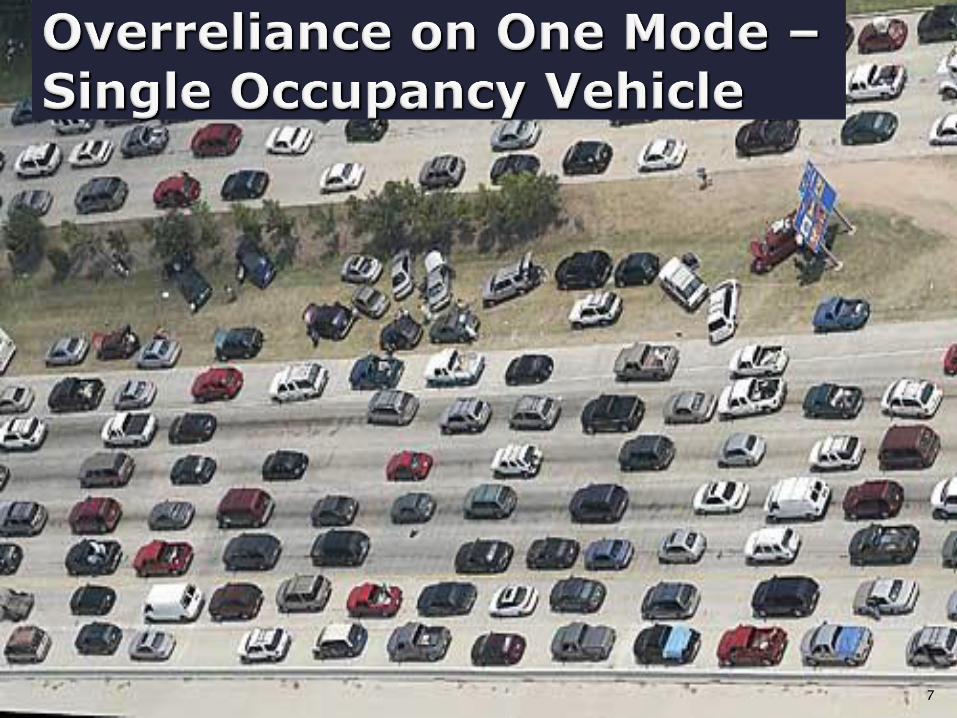
Reliance on SOV results in gridlock
Crashes result in system paralysis
Inability to maintain infrastructure and fuel supply in disasters
Hurricane Evacuation - Houston
6
7
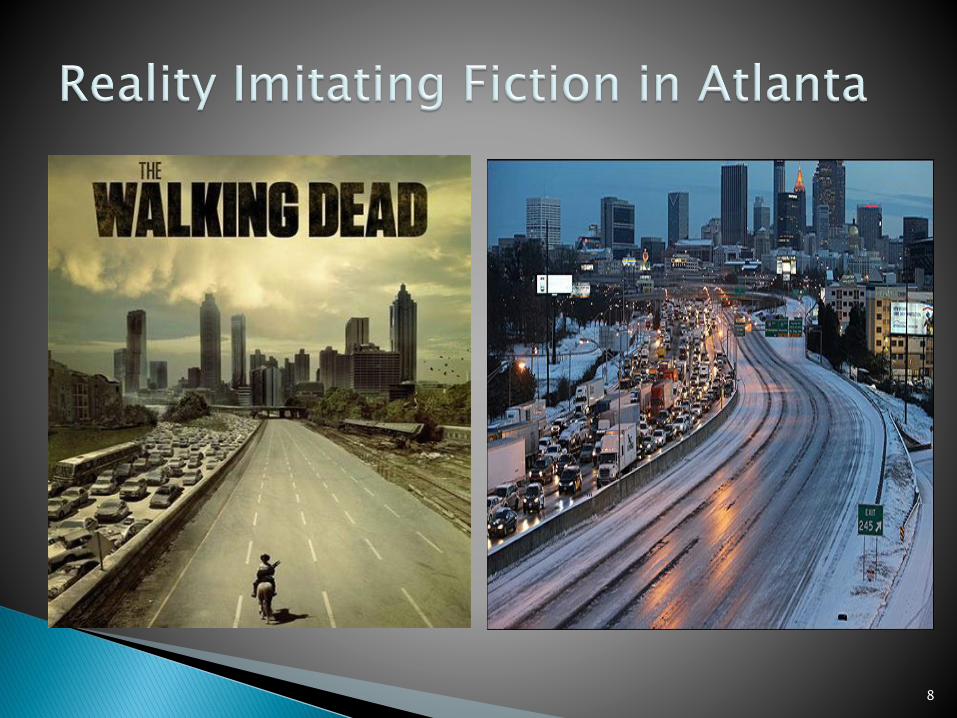
8
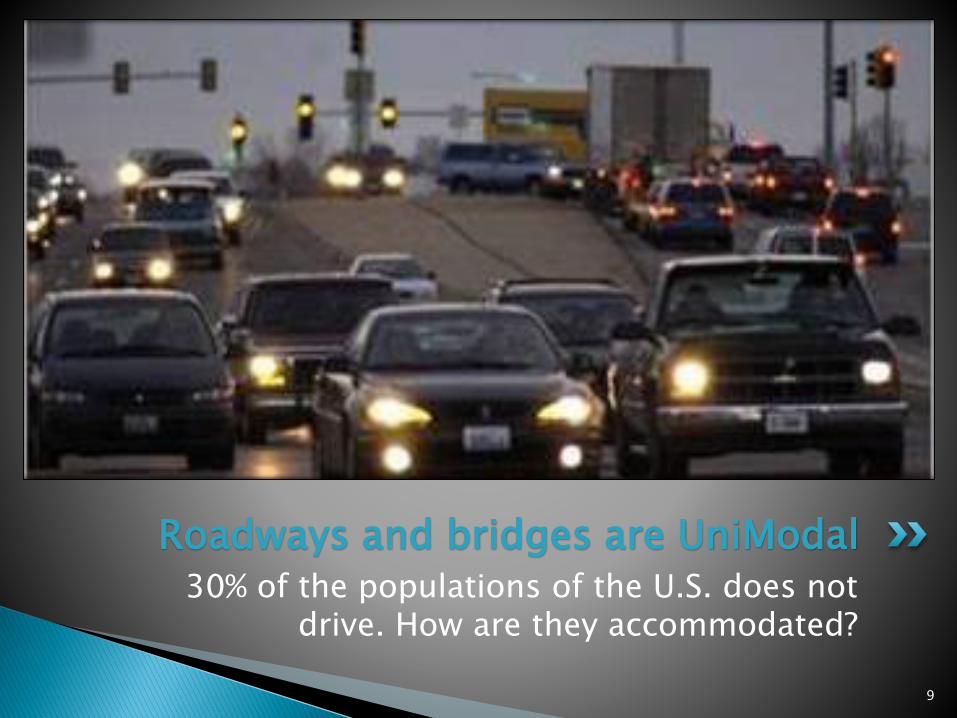
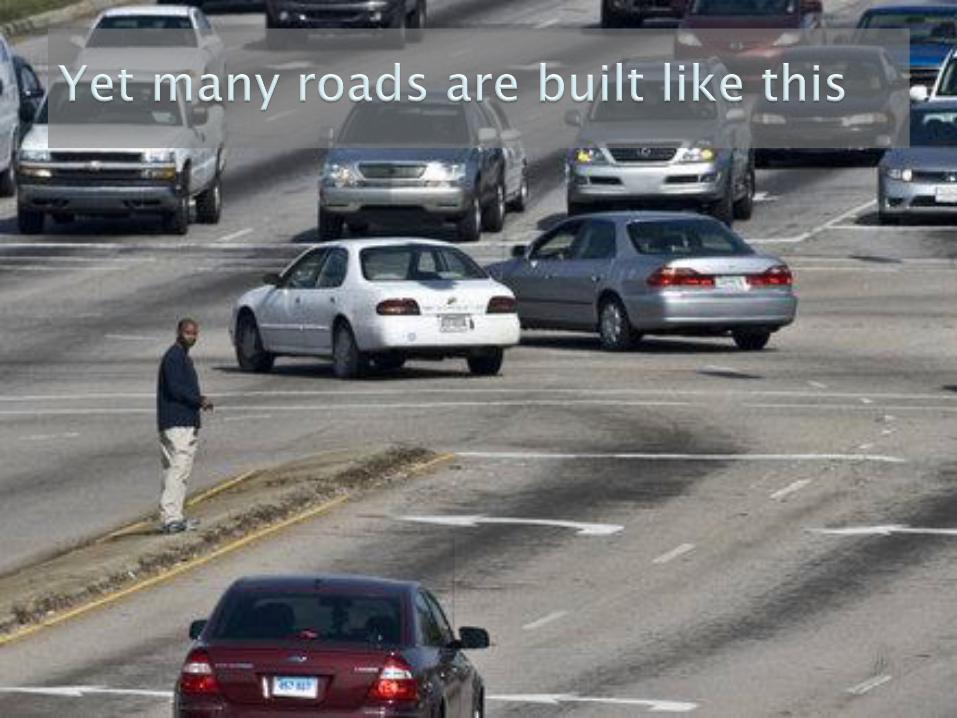
30% of the populations of the U.S. does not drive. How are they accommodated?
Roadways and bridges are UniModal
9

Post Katrina traffic was paralyzed by closure of bridge/main artery through town
Residents rated bicycle & pedestrian infrastructure as high priority
New bridge is multimodal
Asked for adoption of complete streets policy
10
Post-Sandy traffic was shut down in tunnels/bridges
Importance of transit became clear
Bicycles provided mobility
“…demonstrated the remarkable ingenuity that New Yorkers brought to the challenge of getting to work, relying on flexible modes like walking and biking…”
11
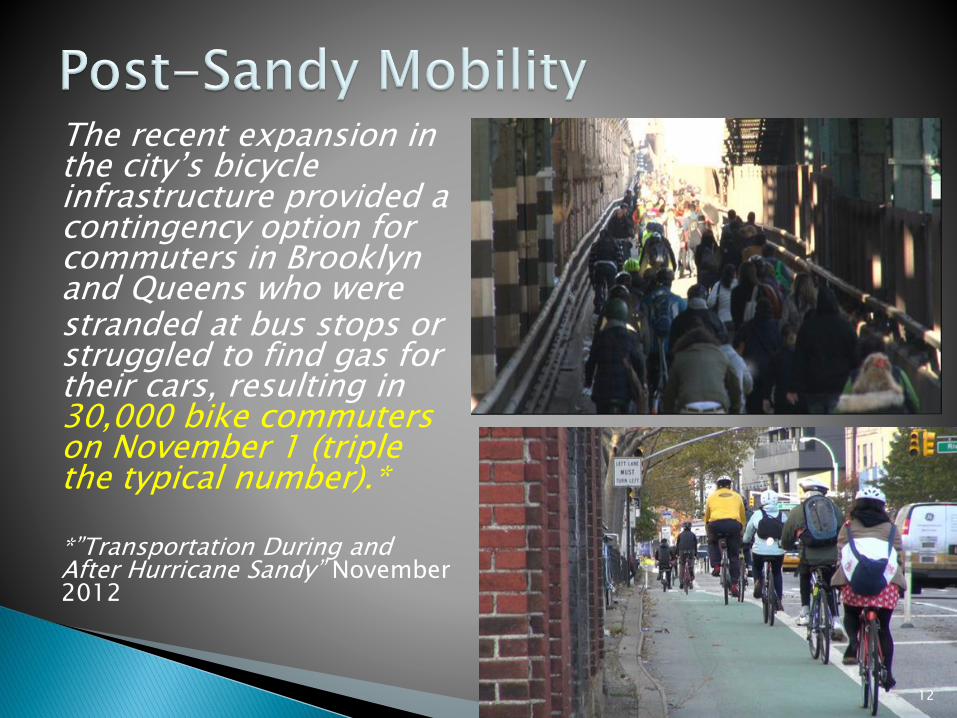
The recent expansion in the city’s bicycle infrastructure provided a contingency option for commuters in Brooklyn and Queens who were stranded at bus stops or struggled to find gas for their cars, resulting in 30,000 bike commuters on November 1 (triple the typical number).*
*”Transportation During and After Hurricane Sandy” November 2012
12
Three days before the storm hit—the MTA published a press release alerting the public about a possible transit shutdown
Moved buses and trains to higher ground
Deployed crews to clear debris from all pumps and drains in subways, tunnels, and bridges
Cleared drains and covered vents days before the storm hit, and shut the system down completely the day before
Gear was put in place, and the city had crews ready to begin dewatering efforts immediately after the storm surges subsided.
13

“In spots beset by unreliable cell service after the storm, cyclists delivered messages by bike, Ho said. Time’s Up runs bicycle-powered generators where people still without power can charge phones and laptops.”
www.nycitynewsservice.com/2012/12/big-roll-for-bikes-in-sandy-relief/14
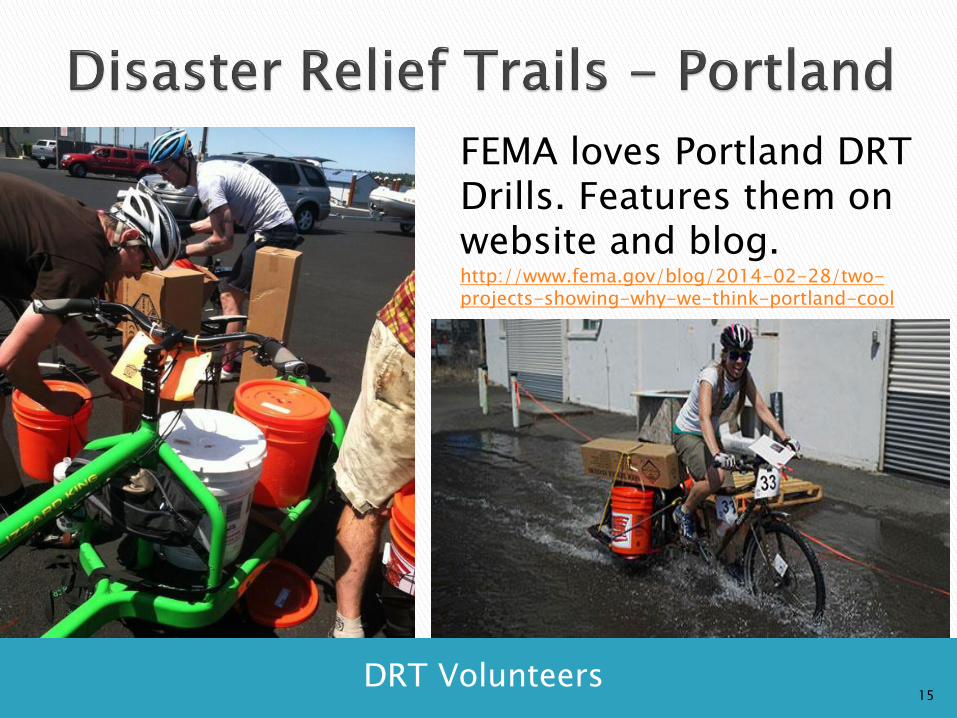
DRT Volunteers
FEMA loves Portland DRT Drills. Features them on website and blog.http://www.fema.gov/blog/2014-02-28/two-projects-showing-why-we-think-portland-cool
15
16

17
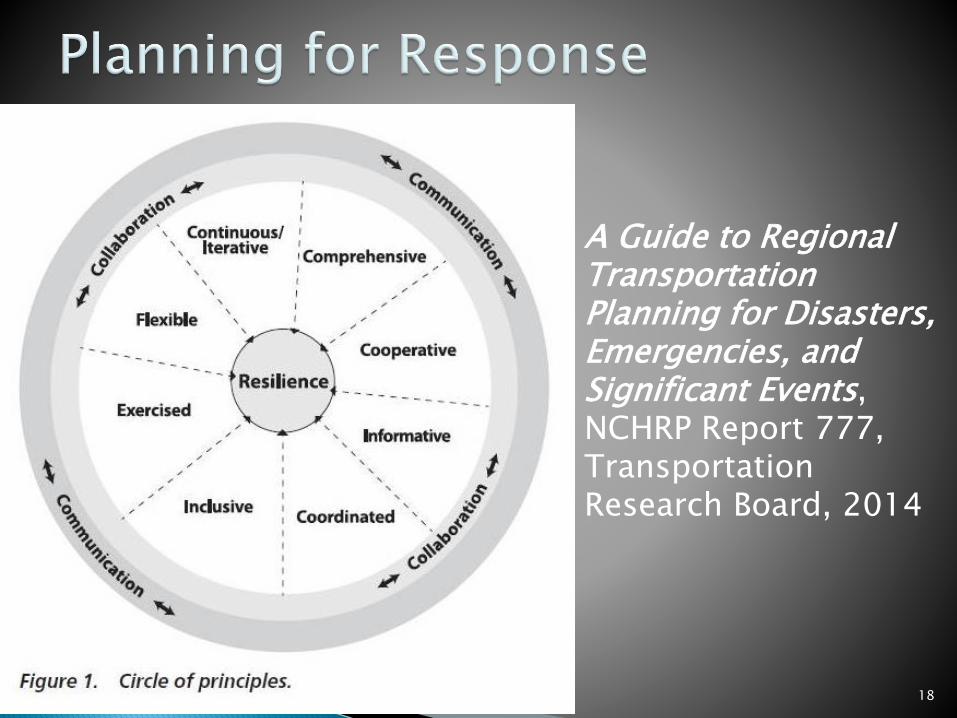
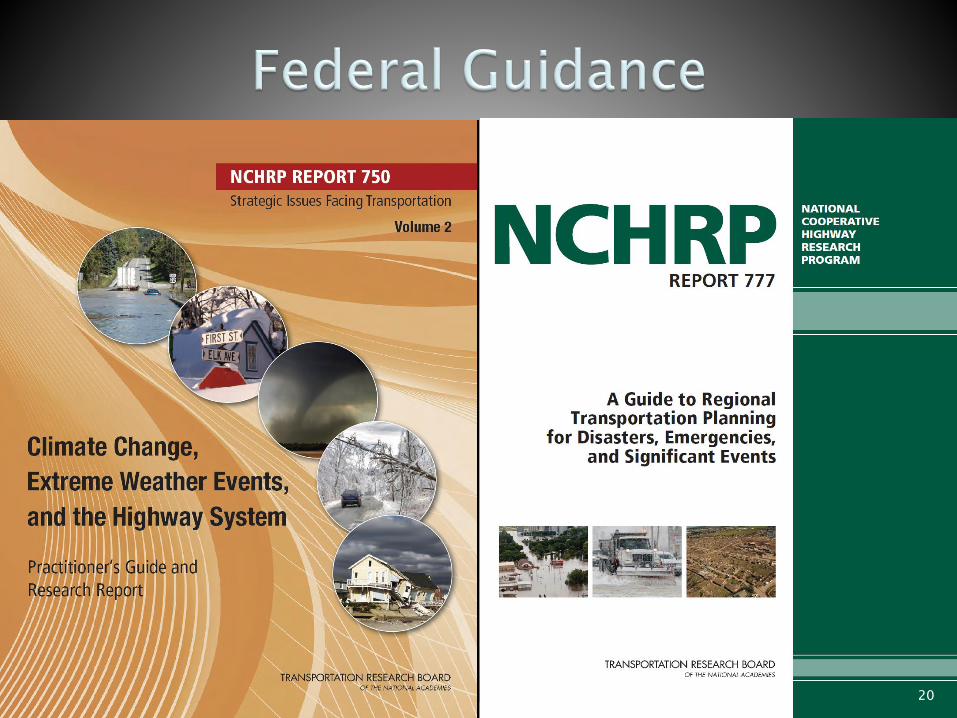
A Guide to RegionalTransportation Planning for Disasters, Emergencies, and Significant Events, NCHRP Report 777, Transportation Research Board, 2014
18
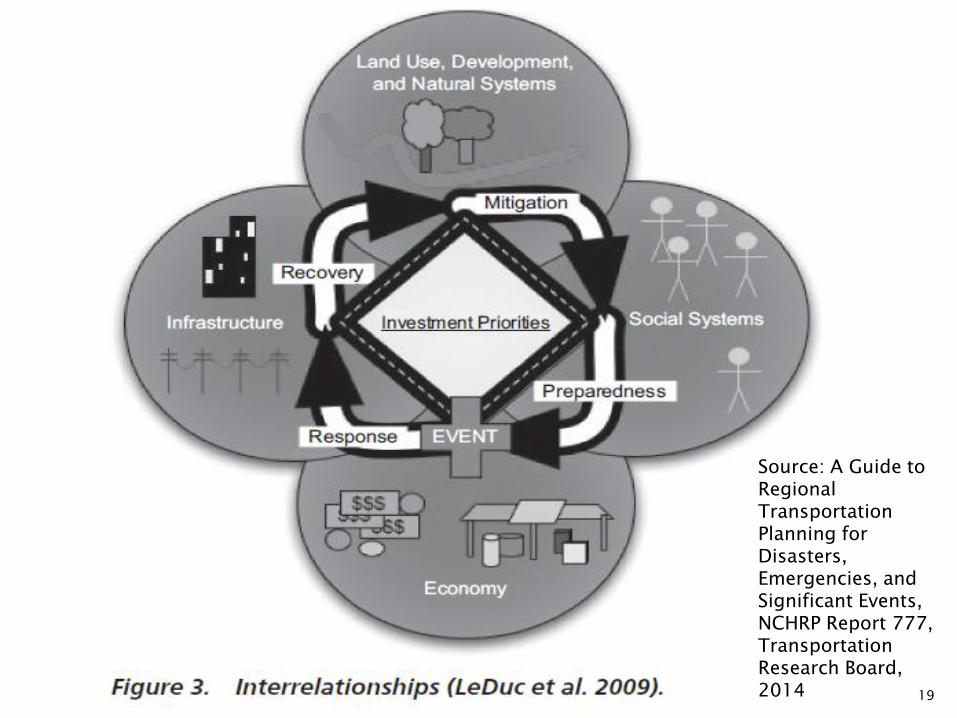
Source: A Guide to RegionalTransportation Planning for Disasters, Emergencies, and Significant Events, NCHRP Report 777, Transportation Research Board, 2014 19
20
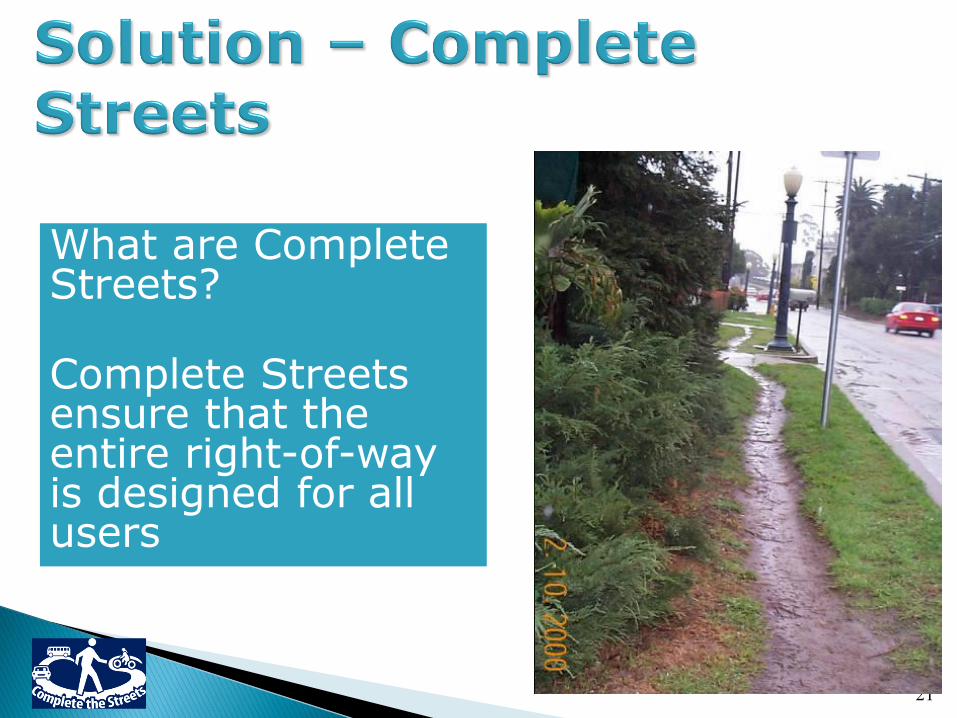
What are Complete Streets?
Complete Streets ensure that the entire right-of-way is designed for all users
21
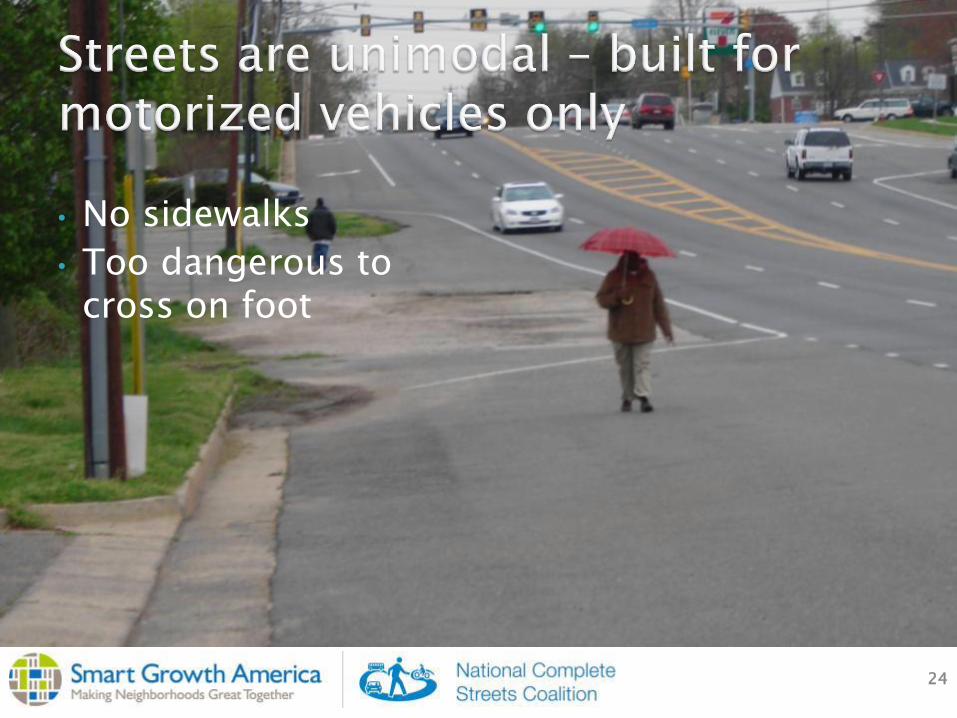
22
24
• No sidewalks
• Too dangerous to cross on foot
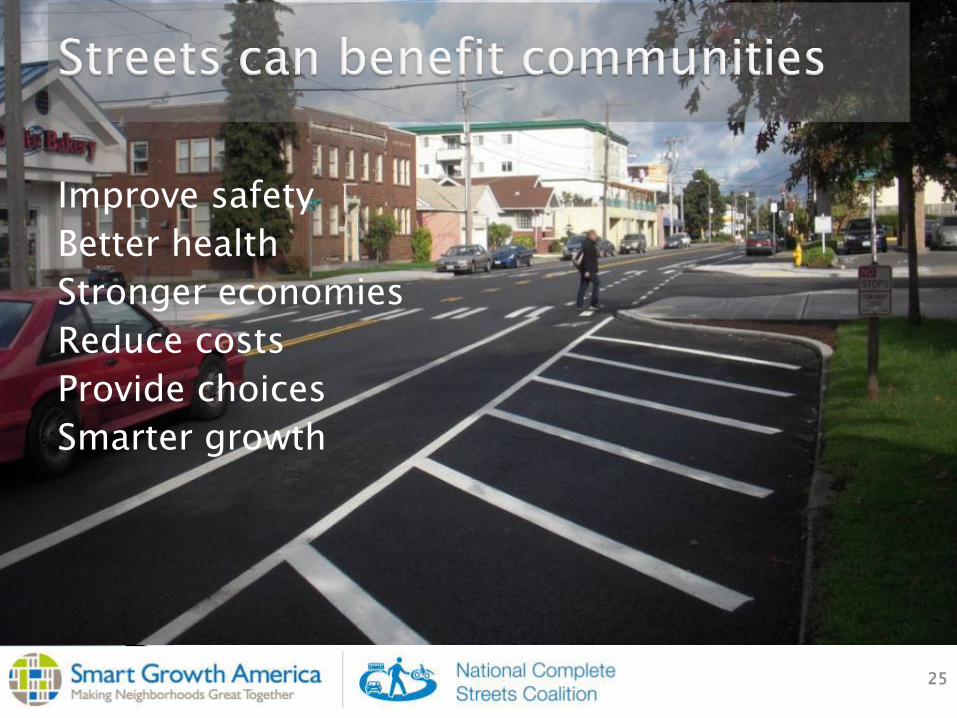
Improve safety
Better health
Stronger economies
Reduce costs
Provide choices
Smarter growth
25
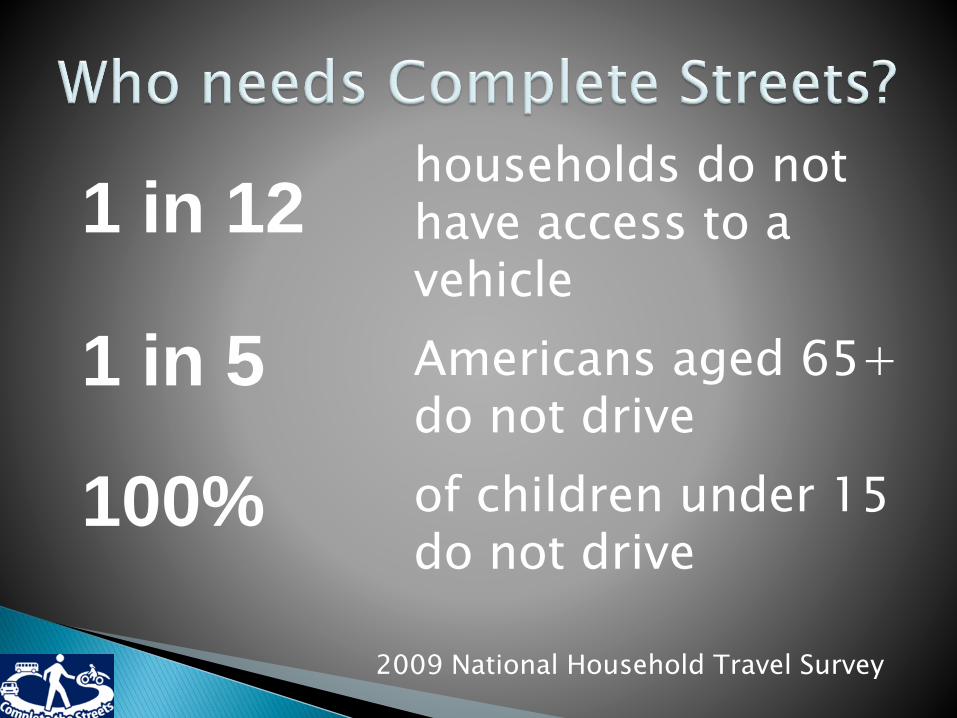
households do not have access to a vehicle
Americans aged 65+ do not drive
of children under 15 do not drive
1 in 12
1 in 5
100%
2009 National Household Travel Survey
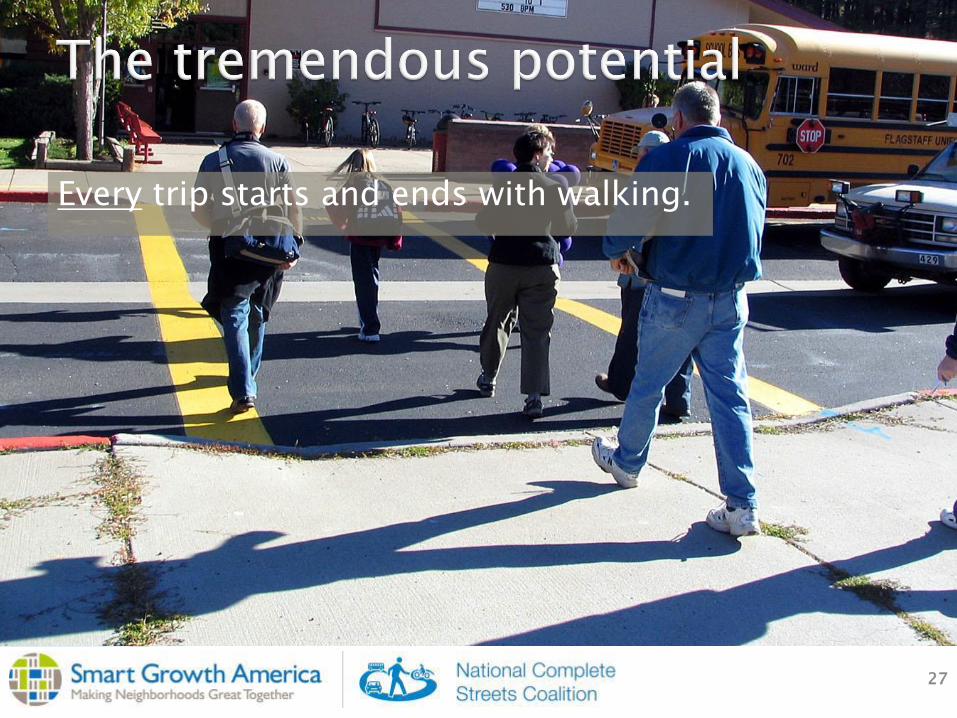
27
Every trip starts and ends with walking.

28
Millennials are driving less and looking for other transportation options.
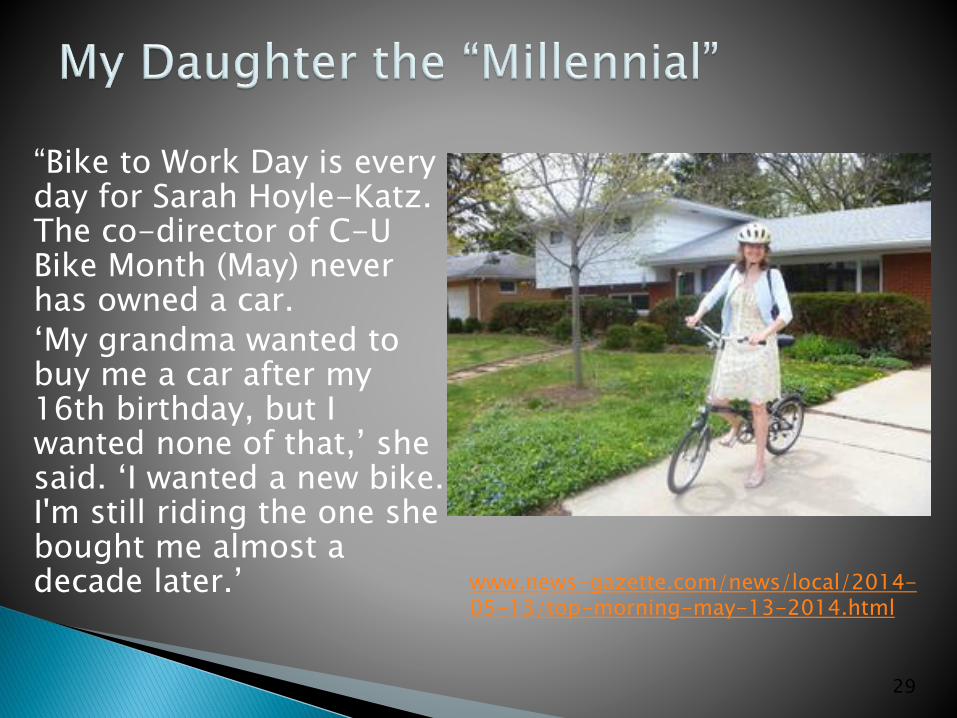
“Bike to Work Day is every day for Sarah Hoyle-Katz. The co-director of C-U Bike Month (May) never has owned a car.
‘My grandma wanted to buy me a car after my 16th birthday, but I wanted none of that,’ she said. ‘I wanted a new bike. I'm still riding the one she bought me almost a decade later.’
29
www.news-gazette.com/news/local/2014-05-13/top-morning-may-13-2014.html

30
• Legacy of interstate highway system – engineering triumph post-WWII
• Road-building best left to experts
• Reduce congestion through roadway expansion
• Each mode considered separate entity – roadway not seen as one entity
• Funding – gas tax $ going
• Functional classification system mandated by federal level
• Level of Service calculations
• System designed for road building
• Roadway designs based on highway standards (overbuilt = speeding

31
Rethinking The Role of
Urban Streets

32
A “complete street” accommodates many uses and
provides for all purposes of a street:
Mobility (all modes)
Access to destinations
Thriving businesses
Portland, OR

33
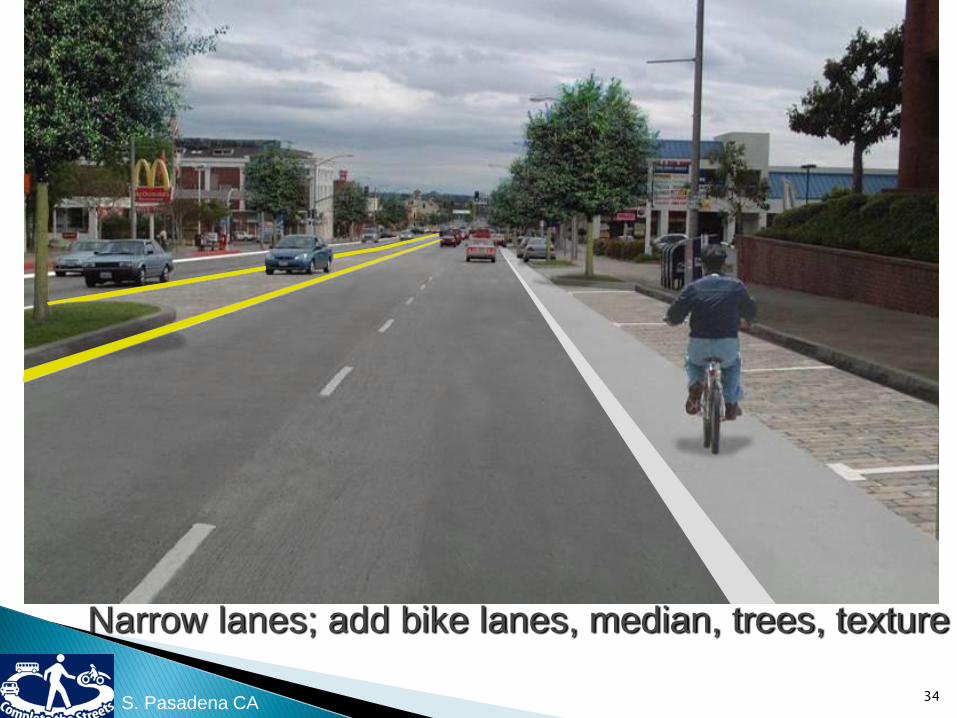
Transforming a street
S. Pasadena CA
34
Narrow lanes; add bike lanes, median, trees, texture
S. Pasadena CA
32
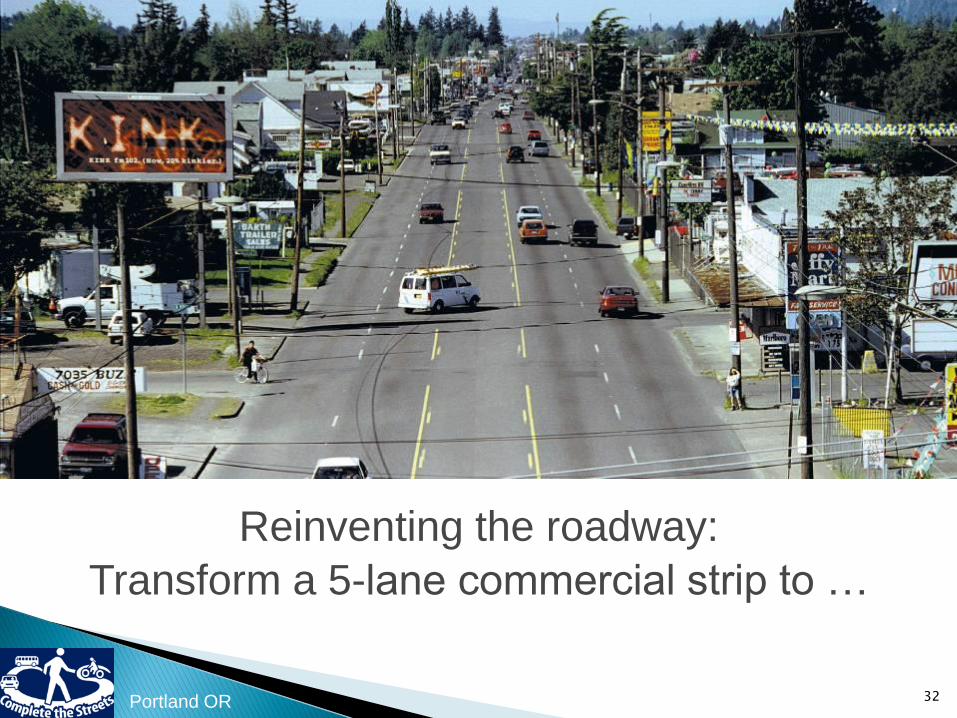
Reinventing the roadway:
Transform a 5-lane commercial strip to …
Portland OR
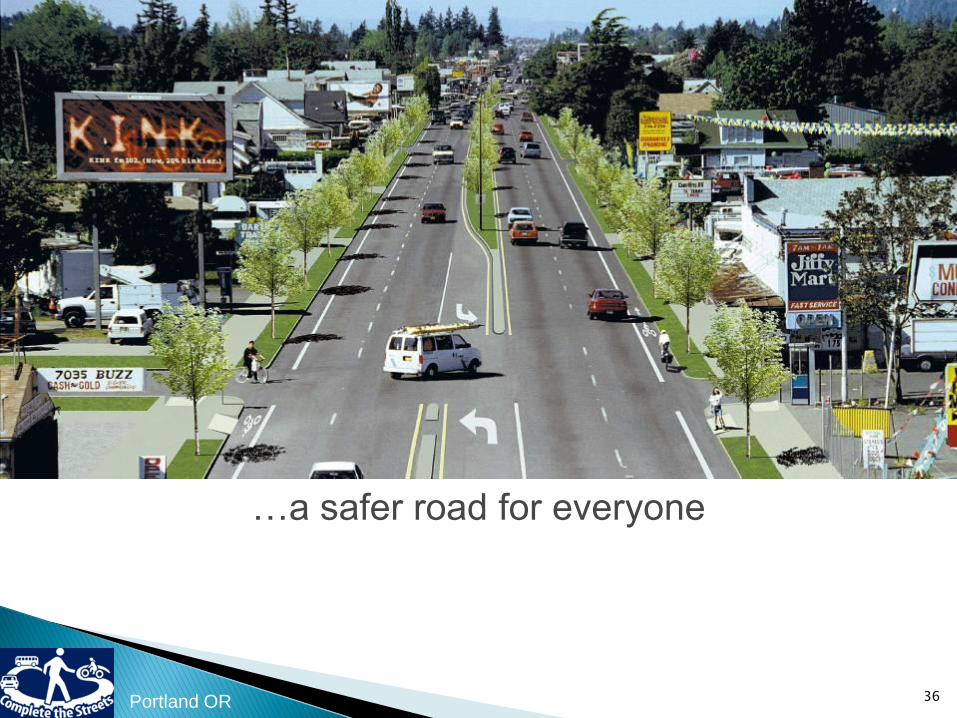
36
…a safer road for everyone
Portland OR
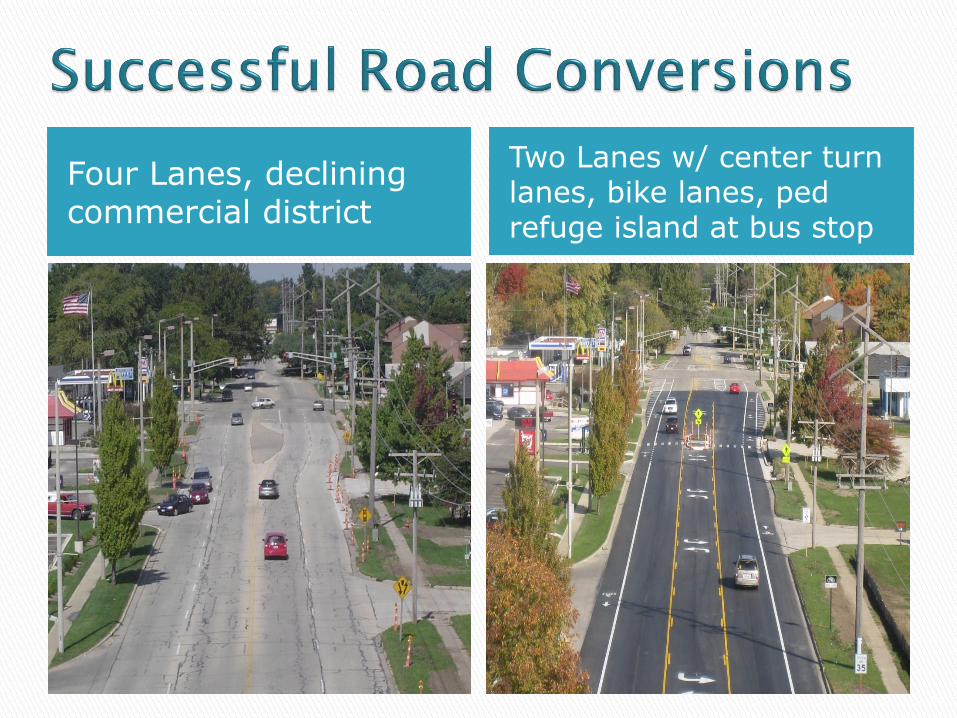
Four Lanes, declining commercial district
Two Lanes w/ center turn lanes, bike lanes, ped refuge island at bus stop
37

38
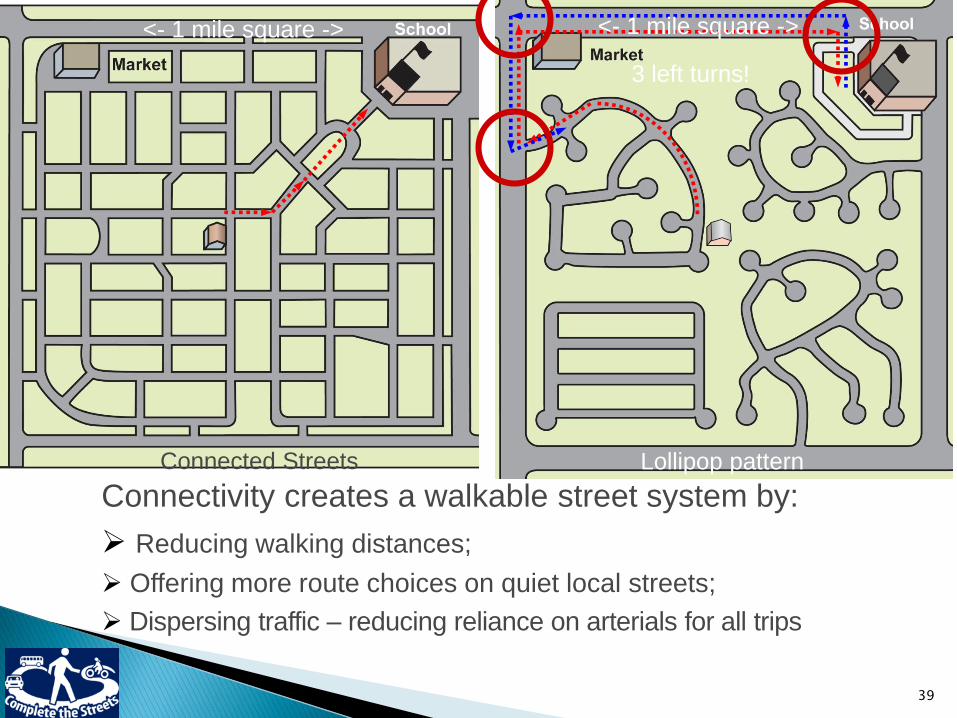
Connectivity creates a walkable street system by:
Reducing walking distances;
Offering more route choices on quiet local streets;
Dispersing traffic – reducing reliance on arterials for all trips
Connected Streets Lollipop pattern
<- 1 mile square -> <- 1 mile square ->
3 left turns!
39
Using resources and space more efficiently and effectively.
40
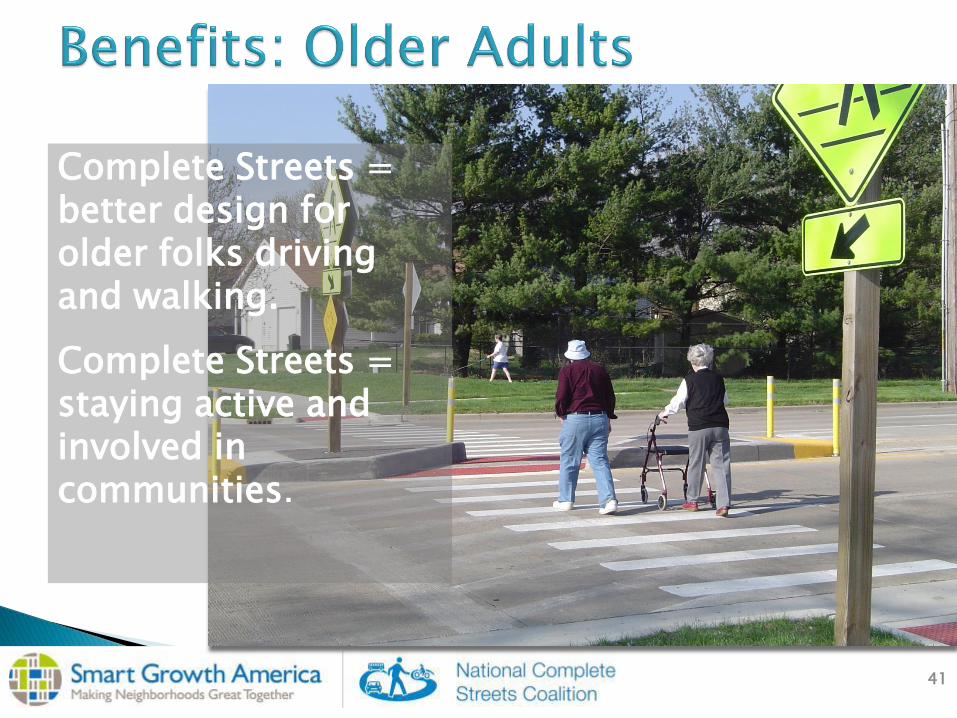
Complete Streets = better design for older folks driving and walking.
Complete Streets = staying active and involved in communities.
41
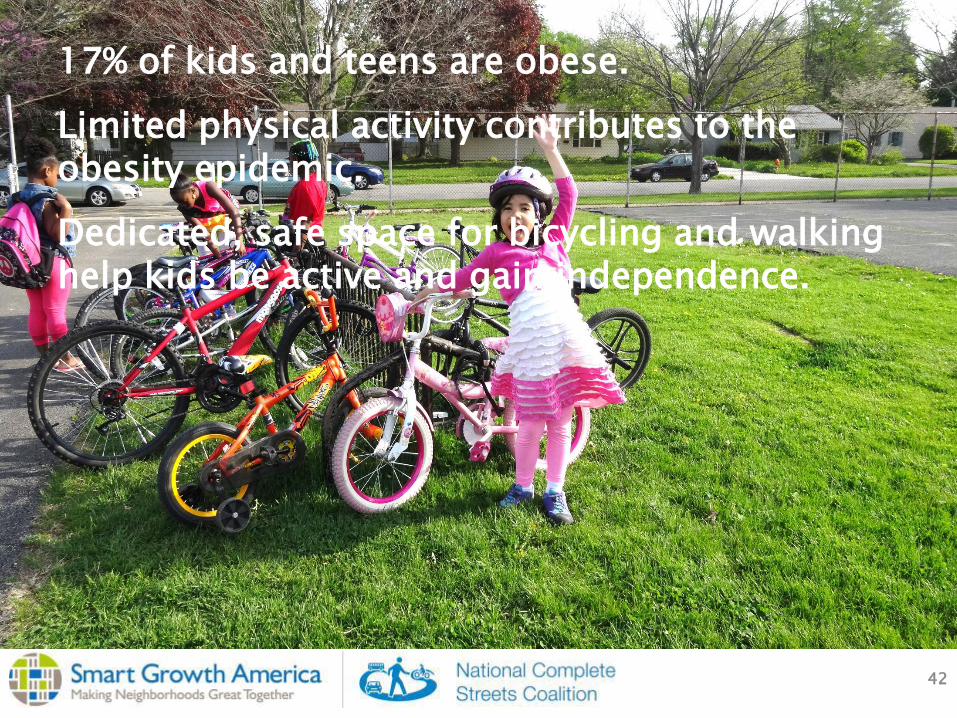
17% of kids and teens are obese.
Limited physical activity contributes to the obesity epidemic.
Dedicated, safe space for bicycling and walking help kids be active and gain independence.
42

43
States with the lowest levels of biking and walking have, on average, the highest rates of obesity, diabetes, and high blood pressure.
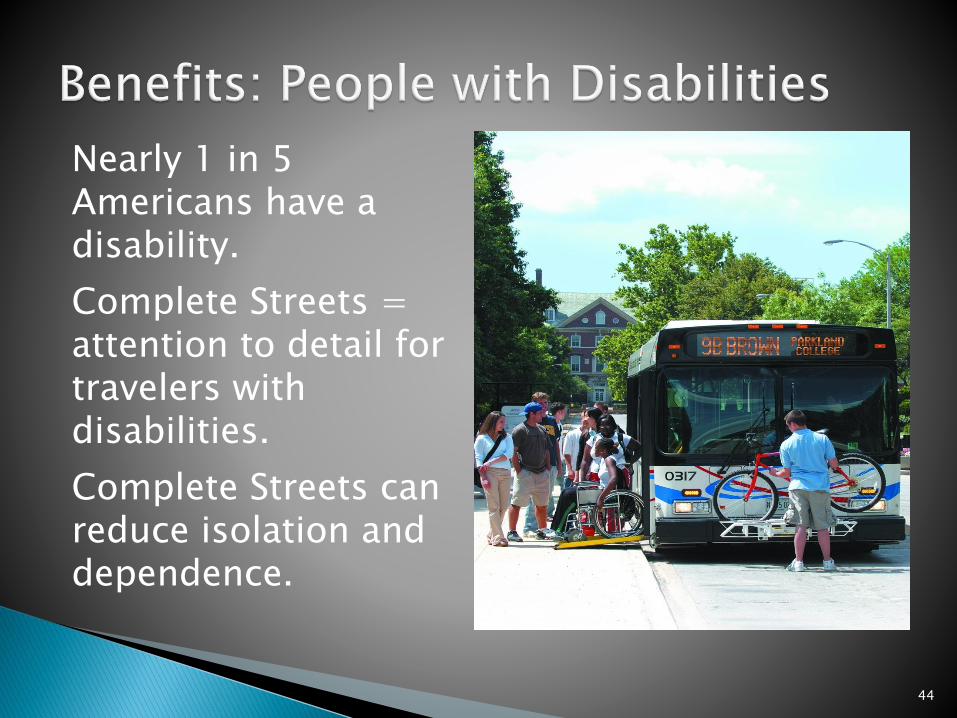
Nearly 1 in 5 Americans have a disability.
Complete Streets = attention to detail for travelers with disabilities.
Complete Streets can reduce isolation and dependence.
44

There were 32,885 traffic fatalities in the U.S. in 2010. Of these fatalities:
National Highway Traffic Safety Administration: Fatality Analysis Reporting System 2010
23,303 were people in cars
4,280 were people walking
618 were people on bicycles
45
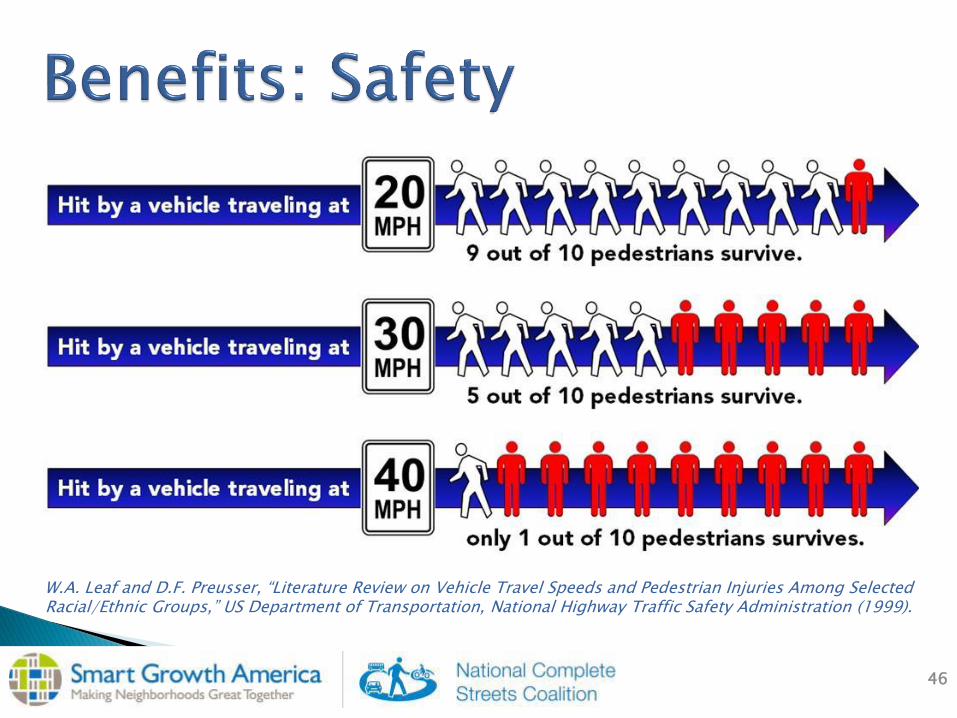
Slowing traffic improves safety for people walking
W.A. Leaf and D.F. Preusser, “Literature Review on Vehicle Travel Speeds and Pedestrian Injuries Among Selected Racial/Ethnic Groups,” US Department of Transportation, National Highway Traffic Safety Administration (1999).
46
Reduction in road construction, repair and maintenance costs
Reduction in health care costs due to increased physical activity and reduced respiratory and cardiac disease
Reduction in fuel, repair and maintenance cost to users
Reduction of costs due to increased road safety
Reduction in external costs due to traffic congestion
47
Reduction of costs due to air pollution
Reduction of costs due to water pollution
The positive economic impact of bicycle tourism
The positive economic impact of bicycle sales and manufacturing
Increased property values along greenways and trails
Increased productivity and a reduction of sick days and injuries at the workplace
Increased retail sales in pedestrian friendly areas
48
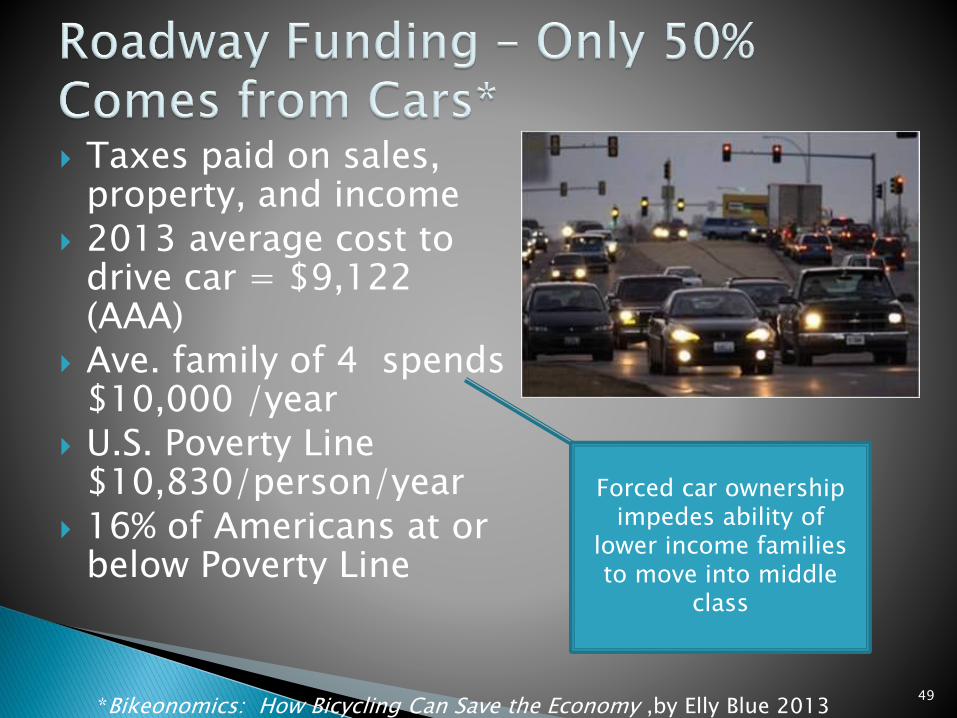
Taxes paid on sales, property, and income
2013 average cost to drive car = $9,122 (AAA)
Ave. family of 4 spends $10,000 /year
U.S. Poverty Line $10,830/person/year
16% of Americans at or below Poverty Line
*Bikeonomics: How Bicycling Can Save the Economy ,by Elly Blue 2013
Forced car ownership impedes ability of
lower income families to move into middle
class
49

Source: Litman, “Evaluating Active Transport Benefits and Costs: Guide to Valuing Walking and Cycling Improvements and Encouragement Programs”
50

51
52
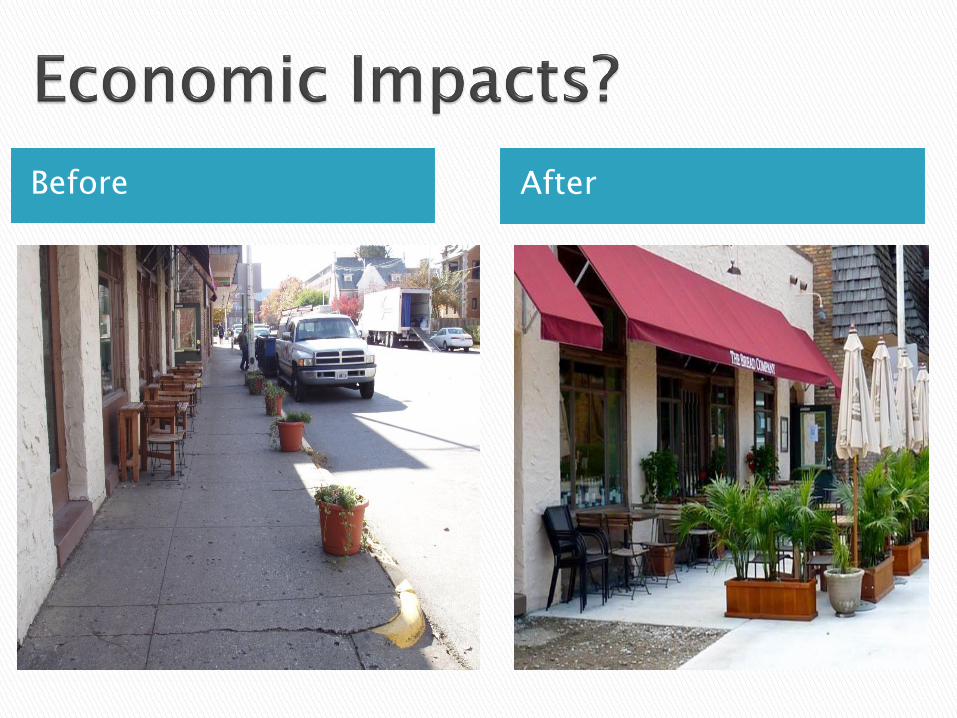
Before After
53
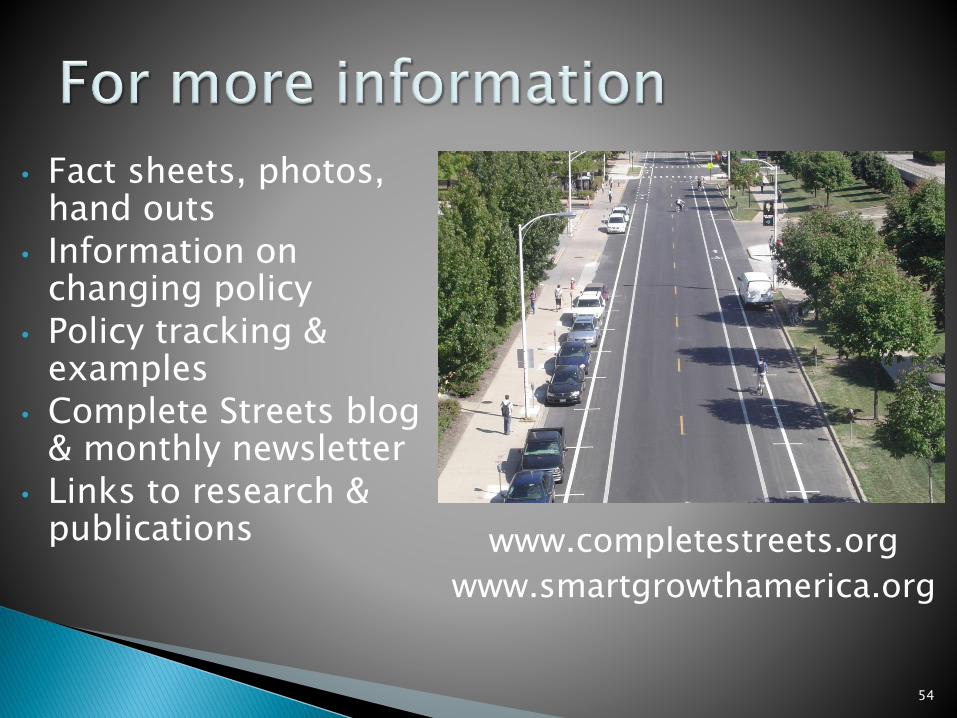
54
• Fact sheets, photos, hand outs
• Information on changing policy
• Policy tracking & examples
• Complete Streets blog & monthly newsletter
• Links to research & publications www.completestreets.org
www.smartgrowthamerica.org