Embed Size (px)
Citation preview

CLC ServerEnd User
USER MANUAL

Manual forCLC Server 10.0.1Windows, macOS and Linux
March 8, 2018
This software is for research purposes only.
QIAGEN AarhusSilkeborgvej 2PrismetDK-8000 Aarhus CDenmark
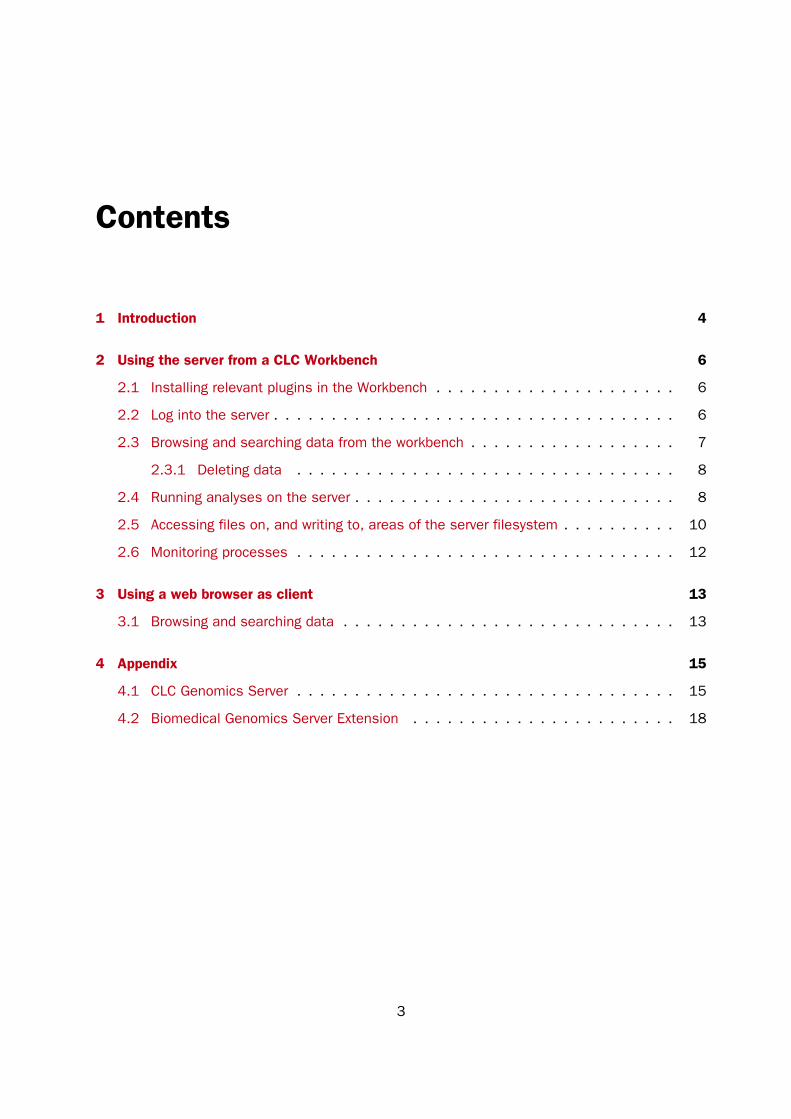
Contents
1 Introduction 4
2 Using the server from a CLC Workbench 6
2.1 Installing relevant plugins in the Workbench . . . . . . . . . . . . . . . . . . . . . 6
2.2 Log into the server . . . . . . . . . . . . . . . . . . . . . . . . . . . . . . . . . . . 6
2.3 Browsing and searching data from the workbench . . . . . . . . . . . . . . . . . . 7
2.3.1 Deleting data . . . . . . . . . . . . . . . . . . . . . . . . . . . . . . . . . 8
2.4 Running analyses on the server . . . . . . . . . . . . . . . . . . . . . . . . . . . . 8
2.5 Accessing files on, and writing to, areas of the server filesystem . . . . . . . . . . 10
2.6 Monitoring processes . . . . . . . . . . . . . . . . . . . . . . . . . . . . . . . . . 12
3 Using a web browser as client 13
3.1 Browsing and searching data . . . . . . . . . . . . . . . . . . . . . . . . . . . . . 13
4 Appendix 15
4.1 CLC Genomics Server . . . . . . . . . . . . . . . . . . . . . . . . . . . . . . . . . 15
4.2 Biomedical Genomics Server Extension . . . . . . . . . . . . . . . . . . . . . . . 18
3
Chapter 1
Introduction
Welcome to CLC Server 10.0.1, a central element of the CLC product line enterprise solutions.
The latest version of the user manual can also be found in pdf format at http://www.qiagenbioinformatics.com/support/manuals/.
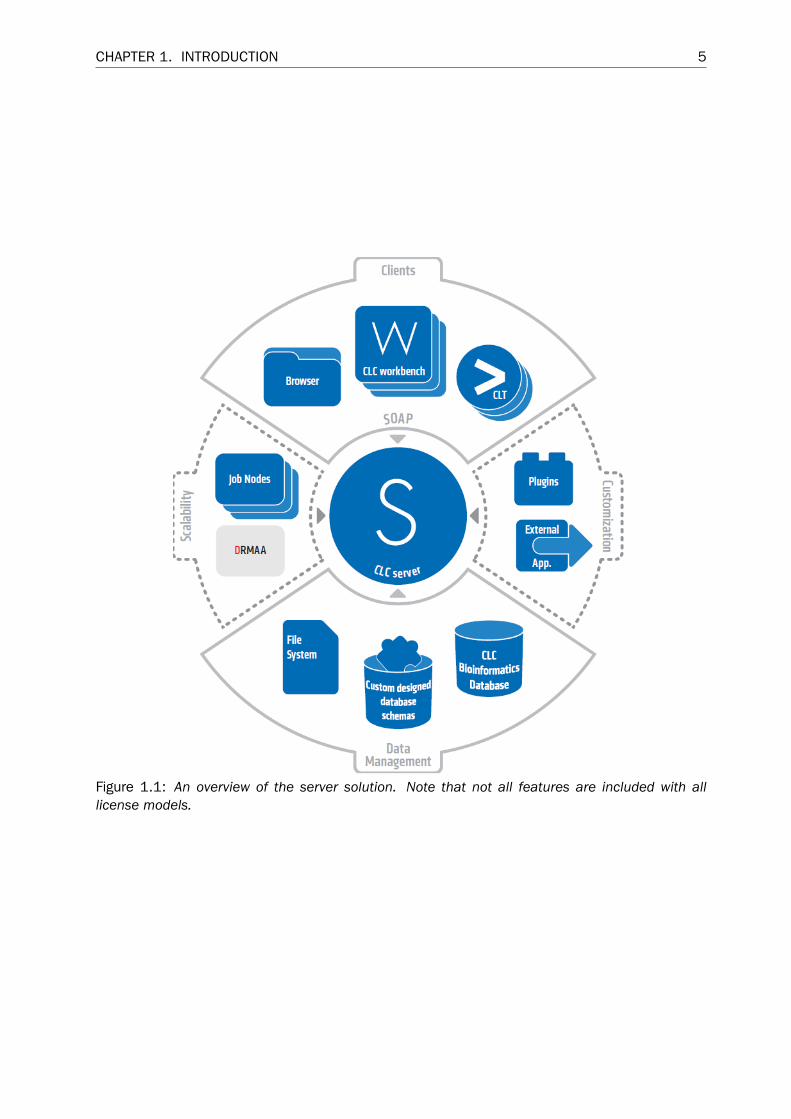
You can get an overview of the server solution in figure 1.1. The software depicted here is forresearch purposes only.
Using a server means that data can be stored centrally and analyses run on a central machinerather than a personal computer. Please see section 4.1 and section 4.2 for a listing of toolsshipped with CLC Servers.
After logging into the CLC Server from a Workbench, data on the server will be listed in theWorkbench navigation area and analyses can be started as usual. The key difference is thatwhen you are logged into a CLC Server from a Workbench, you will be get the choice of where torun the analysis: on the Workbench or on the CLC Server.
This manual describes how to use a CLC Server as a Workbench user. For information aboutadministrating the server, please see the Administrator Manual.
4
CHAPTER 1. INTRODUCTION 5
Figure 1.1: An overview of the server solution. Note that not all features are included with alllicense models.
Chapter 2
Using the server from a CLC Workbench
2.1 Installing relevant plugins in the WorkbenchTo access the CLC Server from a CLC Workbench, the CLC Workbench Client Plugin must beinstalled in the Workbench. This will allow you to log into the CLC Server, access data from CLCServer file and data locations and submit analyses to your CLC Server.
Plugins are installed in a Workbench using the Plugins Manager1, which can be accessed via themenu in the Workbench
Help | Plugins... ( )
or via the Plugins ( ) button on the Toolbar.
From within the Plugins manager, choose the Download Plugins tab and click on the relevantplugin or module. Then click on the button labeled Download and Install.
If you are working on a system not connected to the internet, then you can also install the pluginor module by downloading the cpa file from the plugins page of our website:
http://www.qiagenbioinformatics.com/plugins/
Then start up the Plugin manager within the Workbench, and click on the button at the bottom ofthe Plugin manager labeled Install from File.
You need to restart the Workbench before the plugin is ready for use.
2.2 Log into the serverOnce the plugin is installed, log into the server:
File | CLC Server Login ( )
That will bring up a login dialog as shown in figure 2.1).
The first time you log into the server, you have to expand the dialog by clicking Advanced. Thatwill allow you to enter the host and port for the server as shown in figure 2.2).
1In order to install plugins on many systems, the Workbench must be run in administrator mode. On Windows Vistaand Windows 7, you can do this by right-clicking the program shortcut and choosing "Run as Administrator".
6

CHAPTER 2. USING THE SERVER FROM A CLC WORKBENCH 7
Figure 2.1: Expand the login dialog by clicking Advanced.
Figure 2.2: Specifying host and port.
In addition you can choose to save user name and password and automatically log into the serverwhen the Workbench starts.
Note that you need to get the login information from your server administrator.
When you press Login, the Workbench connects to the server. You will see a progress bar in thelogin dialog. If the login is successful, the dialog will disappear, and you will be able to use theserver as described below.
2.3 Browsing and searching data from the workbenchOnce you are logged in, the data locations on the server are shown in the Navigation Area(Figure 2.3).
Once logged in, the server data locations can be used in the same way as local data locations.We refer to the user manual of the Workbench for information about using the Navigation Area(click the location and press F1 on the keyboard to get context help).
You may also wish to have a look at the search chapter, Searching your data, in the workbenchuser manual (press F1 and look for Searching your data).
It is possible to have both local and server locations added at the same time. This means thatyou can work on e.g. temporary sequences located on your own computer and then when youhave more complete results, you can drag the elements to a folder in the server location.

CHAPTER 2. USING THE SERVER FROM A CLC WORKBENCH 8
Figure 2.3: Three server locations on the server appears in the Navigation Area (marked with bluedots). The remaining five local folders are file locations in the Workbench that are independent ofthe server.
Note that when logged in a CLC Server with a Biomedical Genomics Server Extension, you willhave in your Navigation Area two folders called CLC_References. The blue dot indicates which ofthese repositories is installed on the server.
2.3.1 Deleting data
When you delete data located on the server, it will be placed in the Recycle bin ( ) in the sameway as when you delete data located on the Workbench. The data in the recycle bin can only beaccessed by you and the server administrator.
Please note that the server administrator might have configured the recycle bin to be automaticallyemptied at regular intervals.
2.4 Running analyses on the serverThe tools available on the different types of CLC Server are listed in section 4.1 and section 4.2.
For more information on the tools, please see the manual for the workbench at http://www.qiagenbioinformatics.com/support/manuals/ or click the Help button in thedialogs that are shown when you run the tools.
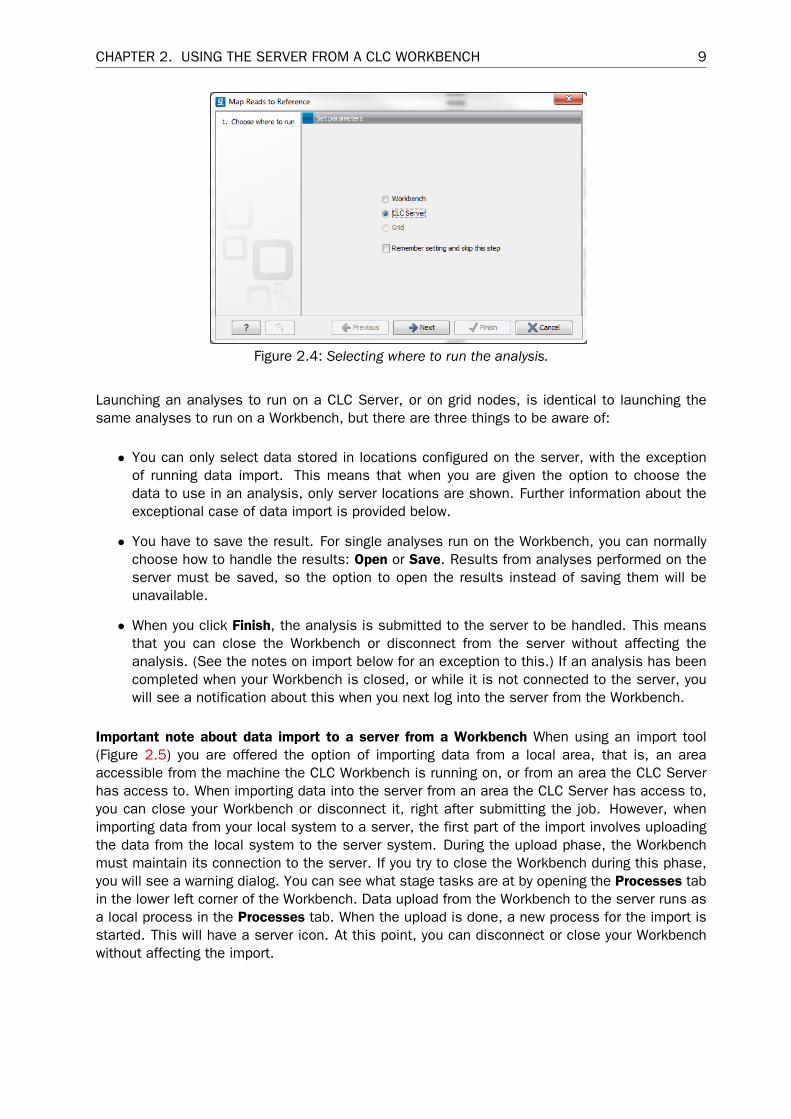
When you run the analyses you will be faced with an initial dialog asking you where you wish theanalysis to be run:
• Workbench. Run the analysis on the computer the CLC Workbench is running on.
• Server. Run the analysis using the CLC Server. For job node setups, analyses will be runon the job nodes.
• Grid. Submit the job to the CLC Server such that the job is then sent to be run on gridnodes.
An example of such a dialog is shown in figure 2.4.
You can check the Remember setting and skip this step option if you wish to always use theselected option when submitting analyses. If you change your mind later on and want to switch,click Previous in the dialog when you start up an analysis. You will then be taken back to thedialog where you can choose where the analysis should be run.
CHAPTER 2. USING THE SERVER FROM A CLC WORKBENCH 9
Figure 2.4: Selecting where to run the analysis.
Launching an analyses to run on a CLC Server, or on grid nodes, is identical to launching thesame analyses to run on a Workbench, but there are three things to be aware of:
• You can only select data stored in locations configured on the server, with the exceptionof running data import. This means that when you are given the option to choose thedata to use in an analysis, only server locations are shown. Further information about theexceptional case of data import is provided below.
• You have to save the result. For single analyses run on the Workbench, you can normallychoose how to handle the results: Open or Save. Results from analyses performed on theserver must be saved, so the option to open the results instead of saving them will beunavailable.
• When you click Finish, the analysis is submitted to the server to be handled. This meansthat you can close the Workbench or disconnect from the server without affecting theanalysis. (See the notes on import below for an exception to this.) If an analysis has beencompleted when your Workbench is closed, or while it is not connected to the server, youwill see a notification about this when you next log into the server from the Workbench.
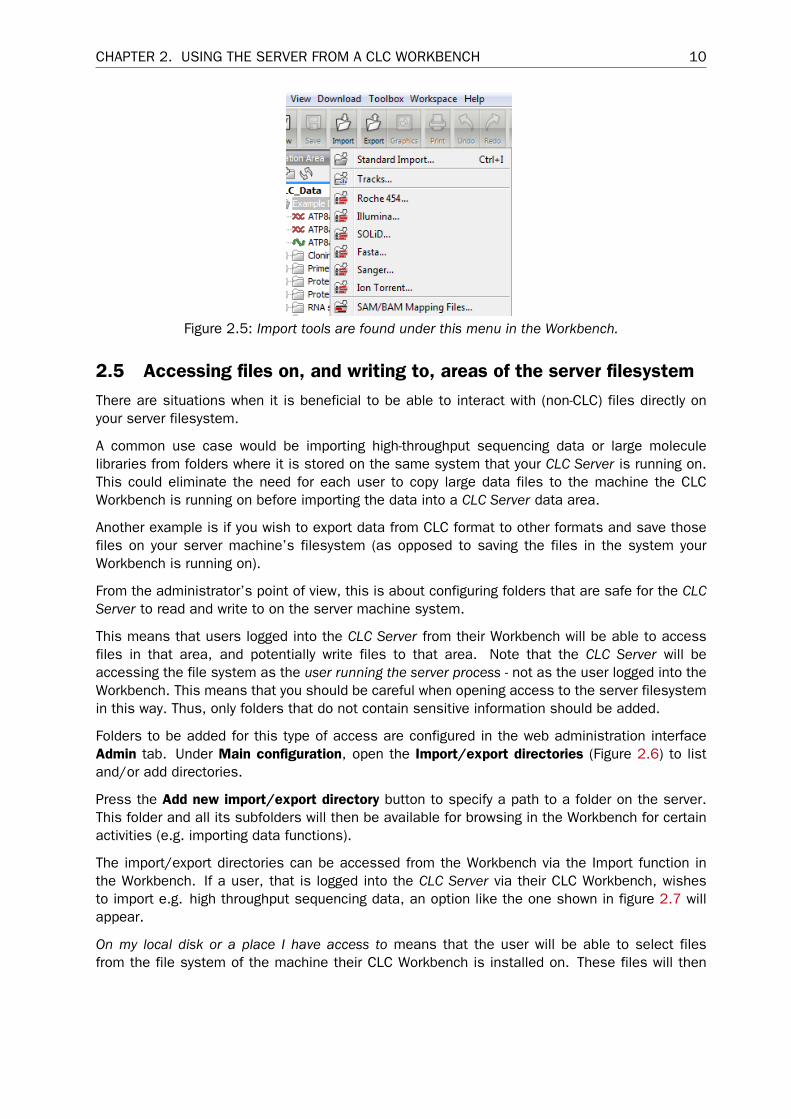
Important note about data import to a server from a Workbench When using an import tool(Figure 2.5) you are offered the option of importing data from a local area, that is, an areaaccessible from the machine the CLC Workbench is running on, or from an area the CLC Serverhas access to. When importing data into the server from an area the CLC Server has access to,you can close your Workbench or disconnect it, right after submitting the job. However, whenimporting data from your local system to a server, the first part of the import involves uploadingthe data from the local system to the server system. During the upload phase, the Workbenchmust maintain its connection to the server. If you try to close the Workbench during this phase,you will see a warning dialog. You can see what stage tasks are at by opening the Processes tabin the lower left corner of the Workbench. Data upload from the Workbench to the server runs asa local process in the Processes tab. When the upload is done, a new process for the import isstarted. This will have a server icon. At this point, you can disconnect or close your Workbenchwithout affecting the import.
CHAPTER 2. USING THE SERVER FROM A CLC WORKBENCH 10
Figure 2.5: Import tools are found under this menu in the Workbench.
2.5 Accessing files on, and writing to, areas of the server filesystemThere are situations when it is beneficial to be able to interact with (non-CLC) files directly onyour server filesystem.
A common use case would be importing high-throughput sequencing data or large moleculelibraries from folders where it is stored on the same system that your CLC Server is running on.This could eliminate the need for each user to copy large data files to the machine the CLCWorkbench is running on before importing the data into a CLC Server data area.
Another example is if you wish to export data from CLC format to other formats and save thosefiles on your server machine’s filesystem (as opposed to saving the files in the system yourWorkbench is running on).
From the administrator’s point of view, this is about configuring folders that are safe for the CLCServer to read and write to on the server machine system.
This means that users logged into the CLC Server from their Workbench will be able to accessfiles in that area, and potentially write files to that area. Note that the CLC Server will beaccessing the file system as the user running the server process - not as the user logged into theWorkbench. This means that you should be careful when opening access to the server filesystemin this way. Thus, only folders that do not contain sensitive information should be added.
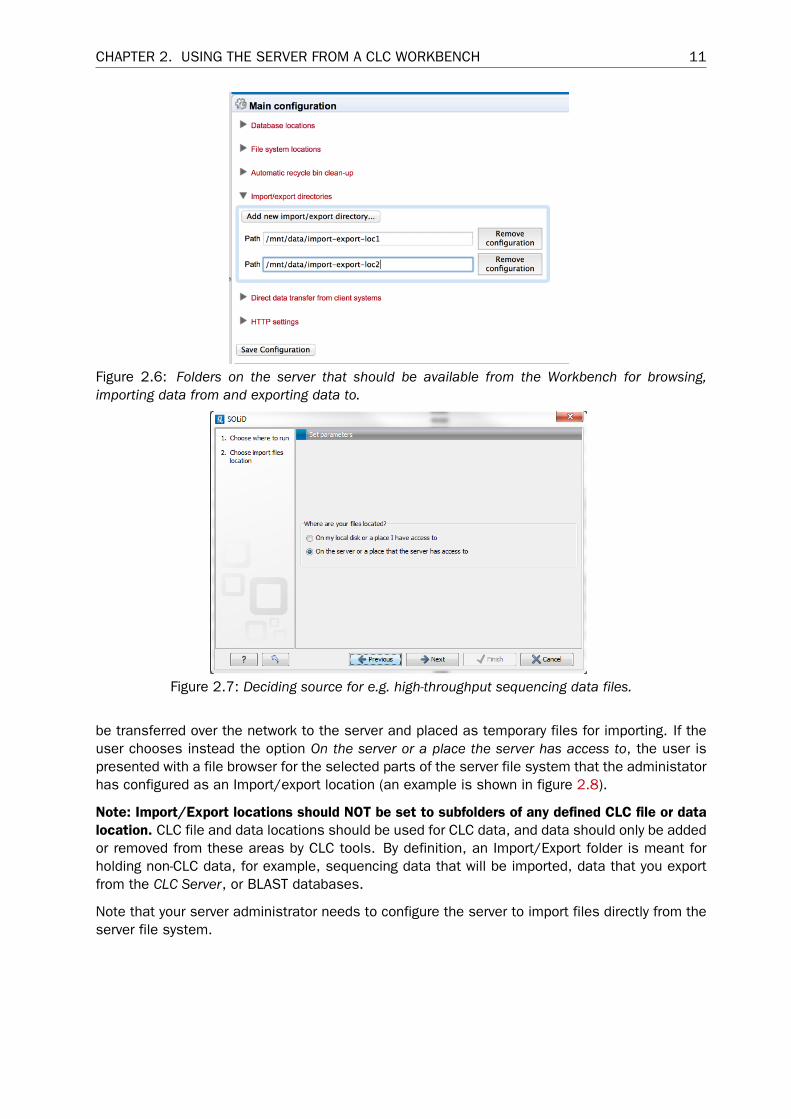
Folders to be added for this type of access are configured in the web administration interfaceAdmin tab. Under Main configuration, open the Import/export directories (Figure 2.6) to listand/or add directories.
Press the Add new import/export directory button to specify a path to a folder on the server.This folder and all its subfolders will then be available for browsing in the Workbench for certainactivities (e.g. importing data functions).
The import/export directories can be accessed from the Workbench via the Import function inthe Workbench. If a user, that is logged into the CLC Server via their CLC Workbench, wishesto import e.g. high throughput sequencing data, an option like the one shown in figure 2.7 willappear.
On my local disk or a place I have access to means that the user will be able to select filesfrom the file system of the machine their CLC Workbench is installed on. These files will then
CHAPTER 2. USING THE SERVER FROM A CLC WORKBENCH 11
Figure 2.6: Folders on the server that should be available from the Workbench for browsing,importing data from and exporting data to.
Figure 2.7: Deciding source for e.g. high-throughput sequencing data files.
be transferred over the network to the server and placed as temporary files for importing. If theuser chooses instead the option On the server or a place the server has access to, the user ispresented with a file browser for the selected parts of the server file system that the administatorhas configured as an Import/export location (an example is shown in figure 2.8).
Note: Import/Export locations should NOT be set to subfolders of any defined CLC file or datalocation. CLC file and data locations should be used for CLC data, and data should only be addedor removed from these areas by CLC tools. By definition, an Import/Export folder is meant forholding non-CLC data, for example, sequencing data that will be imported, data that you exportfrom the CLC Server, or BLAST databases.
Note that your server administrator needs to configure the server to import files directly from theserver file system.

CHAPTER 2. USING THE SERVER FROM A CLC WORKBENCH 12
Figure 2.8: Selecting files on server file system.
2.6 Monitoring processesYou can monitor processes running on the server or the local Workbench by opening theProcesses tab at the bottom left of the Workbench. This tab is next to the Toolbox tab. A list ofsubmitted and running processes (see figure 2.9) will be visible there.
Figure 2.9: Monitoring processes.
Processes running on the server will have a server icon ( ) whereas processes running locallyhave icons specific to the analysis being run, for example ( ) and ( ). In the image, you canalso see that two of the server processes are queued.
Server processes that are queued or running will reappear in the Workbench processes tab ifyou restart the Workbench (and log into the server). Server processes that are finished whenyou close the Workbench will not be shown again in the processes tab when you restart yourWorkbench.

Chapter 3
Using a web browser as client
Besides using the CLC Workbench as a client, you also have access to the server from the webinterface. The web interface gives you access to browsing and searching data.
Simply type the address of the server into your browser, followed by the port number, and youwill see a login dialog similar to what is shown in figure 3.1 (you will need to get information fromyour server administrator about the server address).
Figure 3.1: The web interface of the server.
3.1 Browsing and searching dataTo the left, you will see the data locations connected to the server. You can browse the folderhierarchy of the data location. When you click an element in the tree, the following options areavailable:
13

CHAPTER 3. USING A WEB BROWSER AS CLIENT 14
• Click the Element Info ( ) tab to see the properties of this element. Note that you canedit the information in this view.
• Click the History ( ) tab to see the history of this element.

Chapter 4
Appendix
4.1 CLC Genomics ServerThe CLC Genomics Server is shipped with the following tools and analyses that can all be startedfrom CLC Genomics Workbench and CLC Server Command Line Tools:
• Import
• Export
• Download Reference Genome Data
• Search for Reads in SRA
• Classical Sequence Analysis
– Create Alignment (Alignments and Trees)
– K-mer Based Tree Construction (Alignments and Trees)
– Create Tree (Alignments and Trees)
– Model Testing (Alignments and Trees)
– Maximum Likelihood Phylogeny (Alignments and Trees)
– Extract Annotations (General Sequence Analysis)
– Extract Sequences (General Sequence Analysis)
– Motif Search (General Sequence Analysis)
– Translate to Protein (Nucleotide Analysis)
– Convert DNA to RNA (Nucleotide Analysis)
– Convert RNA to DNA (Nucleotide Analysis)
– Reverse Complement Sequence (Nucleotide Analysis)
– Reverse Sequence (Nucleotide Analysis)
– Find Open Reading Frames (Nucleotide Analysis)
– Download Pfam Database (Protein Analysis)
– Pfam Domain Search (Protein Analysis)
15
CHAPTER 4. APPENDIX 16
• Molecular Biology Tools
– Assemble Sequences (Sequencing Data Analysis)
– Assemble Sequences to Reference (Sequencing Data Analysis)
– Secondary Peak Calling (Sequencing Data Analysis)
– Find Binding Sites and Create Fragments (Primers and Probes)
– Add attB Sites (Cloning and Restriction Sites - Gateway Cloning)
– Create Entry clone (BP) (Cloning and Restriction Sites - Gateway Cloning)
– Create Expression clone (LR) (Cloning and Restriction Sites - Gateway Cloning)
• BLAST
– BLAST
– BLAST at NCBI
– Download BLAST Databases
– Create BLAST Database
• NGS Core Tools
– Sample Reads
– Create Sequencing QC Report
– Merge Overlapping Pairs
– Trim Reads
– Demultiplex Reads
– Map Reads to Reference
– Local Realignment
– Create Detailed Mapping Report
– Merge Read Mappings
– Extract Consensus Sequence
• Track Tools
– Convert to Tracks
– Convert from Tracks
– Merge Annotation Tracks
– Annotate with Overlap Information (Annotate and Filter)
– Extract Reads Based on Overlap (Annotate and Filter)
– Filter Annotations on Name (Annotate and Filter)
– Filter Based on Overlap (Annotate and Filter)
– Create GC Content Graph Tracks (Graphs)
– Create Mapping Graph Tracks (Graphs)
– Identify Graph Threshold Areas(Graphs)
• Resequencing Analysis
CHAPTER 4. APPENDIX 17
– Create Statistics for Target Regions
– Identify Known Mutations from Sample Mappings
– InDels and Structural Variants
– Coverage Analysis
– Basic Variant Detection (Variant Detectors)
– Fixed Ploidy Variant Detection (Variant Detectors)
– Low Frequency Variant Detection (Variant Detectors)
– Annotate from Known Variants (Annotate and Filter Variants)
– Filter against Known Variants (Annotate and Filter Variants)
– Identify Candidate Variants
– Annotate with Exon Numbers (Annotate and Filter Variants)
– Annotate with Flanking Sequences (Annotate and Filter Variants)
– Filter Marginal Variant Calls (Annotate and Filter Variants)
– Filter Reference Variants (Annotate and Filter Variants)
– Compare Sample Variant Tracks (Compare Variants)
– Compare Variants within Group (Compare Variants)
– Fisher Exact Test (Compare Variants)
– Trio Analysis (Compare Variants)
– Filter against Control Reads (Compare Variants)
– GO Enrichment Analysis (Functional Consequences)
– Amino Acid Changes (Functional Consequences)
– Annotate with Conservation Score (Functional Consequences)
– Predict Splice Site Effect (Functional Consequences)
– Link Variants to 3D Protein Structure (Functional Consequences)
– Download 3D Protein Structure Database (Functional Consequences)
• RNA-Seq Analysis
– RNA-Seq Analysis (RNA-Seq Analysis)
– PCA for RNA-Seq
– Differential Expression for RNA-Seq
– Create Heat Map for RNA-Seq
– Create Expression Browser
– Create Venn Diagram for RNA-Seq
– Gene Set Test
– Generate combined RNA-Seq Report
• Microarray and Small RNA Analysis
– Create Track from Experiment
– Extract and Count (Small RNA Analysis)
CHAPTER 4. APPENDIX 18
– Annotate and Merge Counts (Small RNA Analysis)
– Create Box Plot (Quality Control)
– Hierarchical Clustering of Samples (Quality Control)
– Principal Component Analysis (Quality Control)
– Empirical Analysis of DGE (Statistical Analysis)
– Proportion-based Statistical Analysis (Statistical Analysis)
– Gaussian Statistical Analysis (Statistical Analysis)
– Create MA Plot (General Plots)
– Create Scatter Plot (General Plots)
– Histogram (General Plots)
• Epigenomics Analysis
– Transcription Factor ChIP-Seq
– Annotate with Nearby Gene Information
• De Novo Sequencing
– De Novo Assembly
– Map Reads to Contigs
The functionality of the CLC Genomics Server can be extended by installation of Server plugins. Theavailable plugins can be found at http://www.qiagenbioinformatics.com/plugins/.
Latest improvements
CLC Genomics Server is under constant development and improvement. A detailed list thatincludes a description of new features, improvements, bugfixes, and changes for the currentversion of CLC Genomics Server can be found at:
http://www.qiagenbioinformatics.com/products/clc-genomics-server/latest-improvements/current-line/.
4.2 Biomedical Genomics Server ExtensionA CLC Genomics Server with the Biomedical Genomics Server Extension is shipped with the toolsand analyses listed below. These can all be started from the Biomedical Genomics Workbench orby using the CLC Server Command Line Tools.
• Import
• Export
• Download Reference Genome Data
• Search for Reads in SRA
• Genome Browser

CHAPTER 4. APPENDIX 19
– Create GC Content Graph (Graphs)
– Create Mapping Graph (Graphs)
– Identify Graph Threshold Area (Graphs)
• Quality Control
– QC for Sequencing Reads
– QC for Target Sequencing
– QC for Read Mapping
• Preparing Raw Data
– Merge Overlapping Pairs
– Trim Reads
– Demultiplex reads
• Resequencing Analysis
– Identify Known Mutations from Sample Mappings
– Extract Reads Based on Overlap
– Map Reads to Reference
– Local Realignment
– Merge Read Mappings
– Copy Number Variant Detection
– Remove Duplicate Mapped Reads
– Indels and Structural Variants
– Whole Genome Coverage Analysis
– Basic Variant Detection (Variant Detectors)
– Fixed Ploidy Variant Detection (Variant Detectors)
– Low Frequency Variant Detection (Variant Detectors)
• Add Information to Variants
– Add Information from Variant Databases
– Add Conservation Scores
– Add Exon Number
– Add Flanking Sequence
– Add Fold Changes
– Add information about Amino Acids Changes
– Add Information from Genomic Regions
– Add Information from Overlapping Genes
– Link Variants to 3D Protein Structure
– Download 3D Protein Structure Database
– Add Information from 1000 Genomes Project (From Databases)

CHAPTER 4. APPENDIX 20
– Add Information from COSMIC (From Databases)
– Add Information from Clinvar (From Databases)
– Add Information from Common dbSNP (From Databases)
– Add Information from Hapmap (From Databases)
– Add Information from dbSNP (From Databases)
• Remove Variants
– Remove Variants Found in External Databases
– Remove Variants Not Found in External Databases
– Remove False Positive
– Remove Germline Variants
– Remove Reference Variants
– Remove Variants Inside Genome Regions
– Remove Variants Outside Genome Regions
– Remove Variants Outside Targeted Regions
– Remove Variants Found in 1000 Genomes Project (From Databases)
– Remove Variants Found in Common dbSNP (From Databases)
– Remove Variants Found in Hapmap (From Databases)
• Add Information to Genes
– Add Information from Overlapping Variants
• Compare Samples
– Compare Shared Variants Within a Group of Samples
– Identify Enriched Variants in Case vs Control Group
– Trio Analysis
• Identify Candidate Variants
– Identify Candidate Variants
– Remove Information from Variants
– Identify Variants with Effect on Splicing
• Identify Candidate Genes
– Identify Differentially Expressed Gene Groups and Pathways
– Identify Highly Mutated Gene Groups and Pathways
– Identify Mutated Genes
– Select Genes by Name
• RNA-Seq Analysis
– RNA-Seq Analysis (RNA-Seq Analysis)
– PCA for RNA-Seq
CHAPTER 4. APPENDIX 21
– Differential Expression for RNA-Seq
– Create Heat Map for RNA-Seq
– Create Expression Browser
– Create Venn Diagram for RNA-Seq
– Gene Set Test
– Generate combined RNA-Seq Report
• Microarray and Small RNA Analysis
– Create Track from Experiment
– Extract and Count (Small RNA Analysis)
– Annotate and Merge Counts (Small RNA Analysis)
– Create Box Plot (Quality Control)
– Hierarchical Clustering of Samples (Quality Control)
– Principal Component Analysis (Quality Control)
– Empirical Analysis of DGE (Statistical Analysis)
– Proportion-based Statistical Analysis (Statistical Analysis)
– Gaussian Statistical Analysis (Statistical Analysis)
– Create MA Plot (General Plots)
– Create Scatter Plot (General Plots)
– Histogram (General Plots)
• Helper Tools
– Extract Sequences
– Filter Based on Overlap
• Cloning and Restriction Sites
– Add attB Sites (Gateway Cloning)
– Create Entry clone (BP) (Gateway Cloning)
– Create Expression clone (LR) (Gateway Cloning)
• Sanger Sequencing
– Assemble Sequences (Sequencing Data Analysis)
– Assemble Sequences to Reference (Sequencing Data Analysis)
– Secondary Peak Calling (Sequencing Data Analysis)
– Find Binding Sites and Create Fragments (Primers and Probes)
• Epigenomics Analysis
– Transcription Factor ChIP-Seq
– Annotate with Nearby Gene Information
The functionality of the CLC Server can be extended by installation of Server plugins. The availableplugins can be found at http://www.qiagenbioinformatics.com/plugins/.