Embed Size (px)
Citation preview
ETHNICITY DISTRIBUTION: LAKE COUNTY, CLC STUDENTS, CLC FACULTY & STAFF
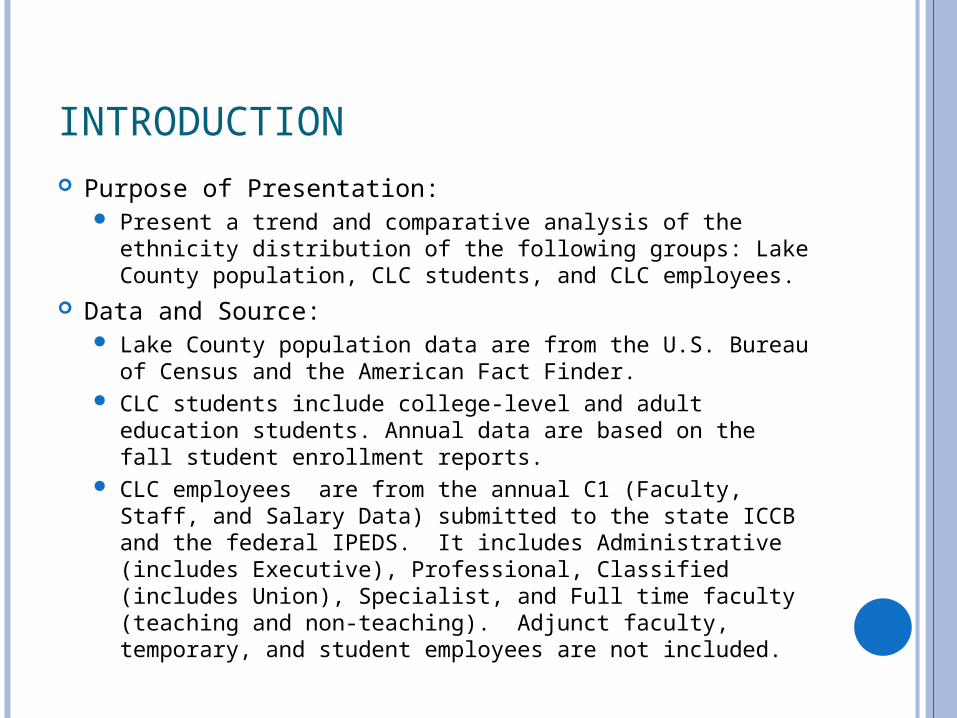
INTRODUCTION Purpose of Presentation:
Present a trend and comparative analysis of the ethnicity distribution of the following groups: Lake County population, CLC students, and CLC employees.
Data and Source: Lake County population data are from the U.S. Bureau of
Census and the American Fact Finder. CLC students include college-level and adult education
students. Annual data are based on the fall student enrollment reports.
CLC employees are from the annual C1 (Faculty, Staff, and Salary Data) submitted to the state ICCB and the federal IPEDS. It includes Administrative (includes Executive), Professional, Classified (includes Union), Specialist, and Full time faculty (teaching and non-teaching). Adjunct faculty, temporary, and student employees are not included.
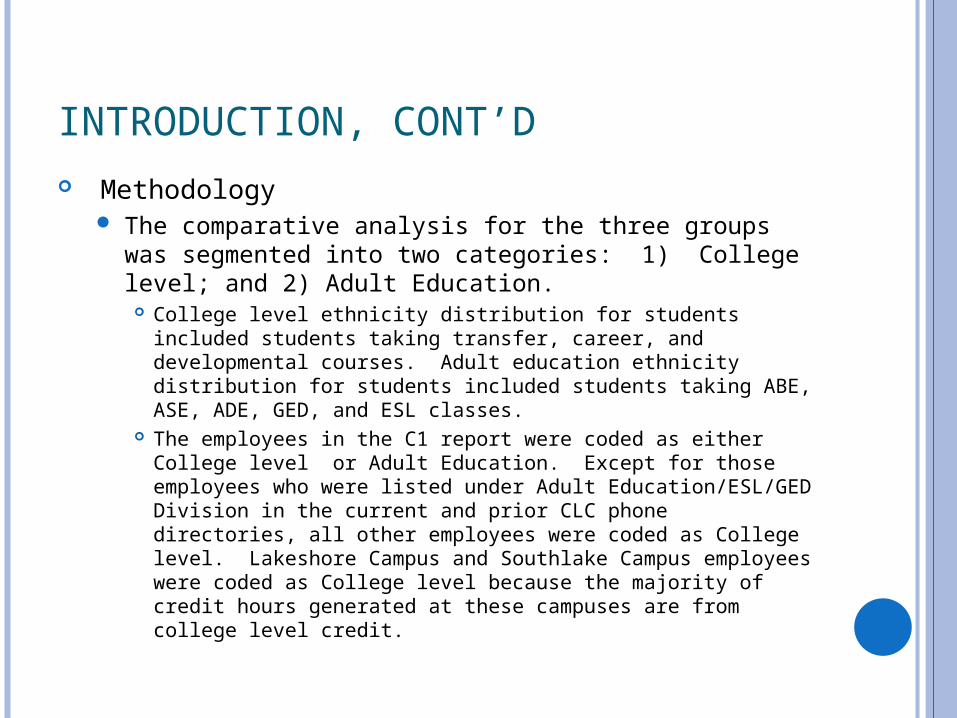
INTRODUCTION, CONT’D Methodology
The comparative analysis for the three groups was segmented into two categories: 1) College level; and 2) Adult Education.
College level ethnicity distribution for students included students taking transfer, career, and developmental courses. Adult education ethnicity distribution for students included students taking ABE, ASE, ADE, GED, and ESL classes.
The employees in the C1 report were coded as either College level or Adult Education. Except for those employees who were listed under Adult Education/ESL/GED Division in the current and prior CLC phone directories, all other employees were coded as College level. Lakeshore Campus and Southlake Campus employees were coded as College level because the majority of credit hours generated at these campuses are from college level credit.
HISPANICS: COLLEGE LEVEL
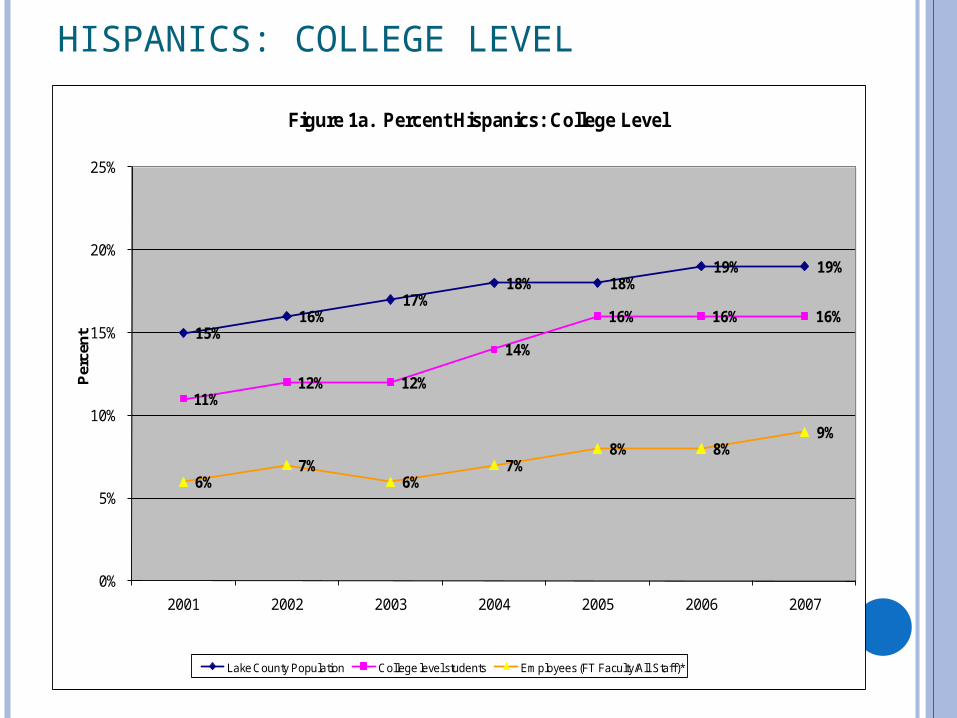
15%16%
17%18% 18%
19% 19%
11%12% 12%
14%
16% 16% 16%
6%7%
6%7%
8% 8%9%
0%
5%
10%
15%
20%
25%
2001 2002 2003 2004 2005 2006 2007
Per
cen
t
Figure 1a. Percent Hispanics: College Level
Lake County Population College level students Employees (FT Faculty/All Staff)*
HISPANICS: ADULT EDUCATION
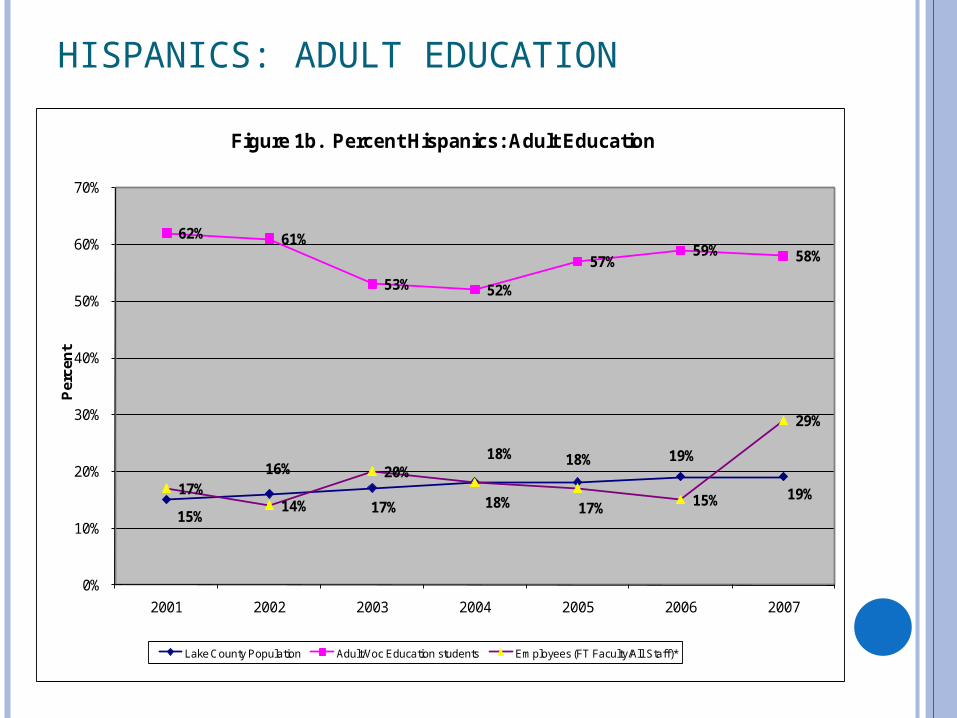
15%
16%
17% 18%
18% 19%
19%
62% 61%
53% 52%
57%59% 58%
17%14%
20%18%
17% 15%
29%
0%
10%
20%
30%
40%
50%
60%
70%
2001 2002 2003 2004 2005 2006 2007
Per
cen
t
Figure 1b. Percent Hispanics: Adult Education
Lake County Population Adult/Voc Education students Employees (FT Faculty/All Staff)*
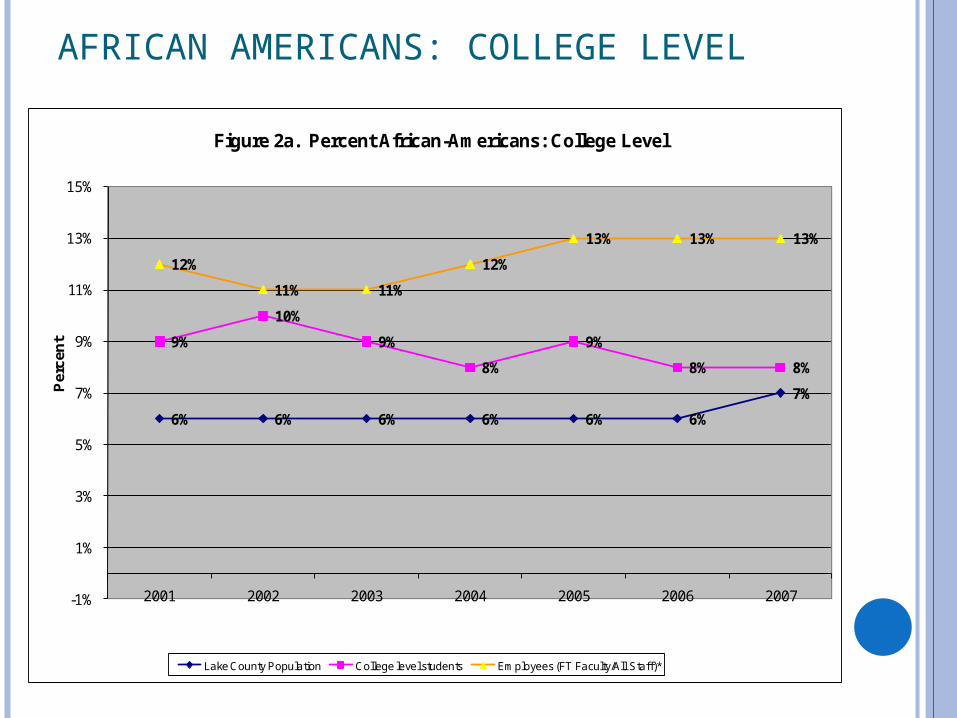
AFRICAN AMERICANS: COLLEGE LEVEL
6% 6% 6% 6% 6% 6%
7%
9%
10%
9%
8%
9%
8% 8%
12%
11% 11%
12%
13% 13% 13%
-1%
1%
3%
5%
7%
9%
11%
13%
15%
2001 2002 2003 2004 2005 2006 2007
Per
cen
t
Figure 2a. Percent African-Americans: College Level
Lake County Population College level students Employees (FT Faculty/All Staff)*
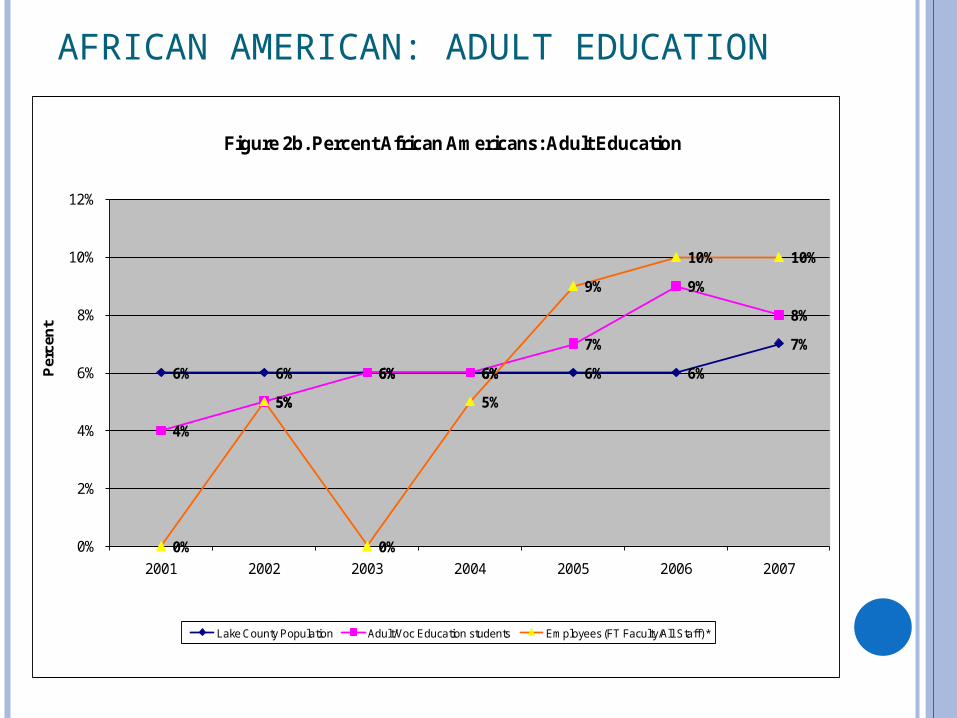
AFRICAN AMERICAN: ADULT EDUCATION
6% 6% 6% 6% 6% 6%
7%
4%
5%
6% 6%
7%
9%
8%
0%
5%
0%
5%
9%
10% 10%
0%
2%
4%
6%
8%
10%
12%
2001 2002 2003 2004 2005 2006 2007
Per
cen
t
Figure 2b. Percent African Americans: Adult Education
Lake County Population Adult/Voc Education students Employees (FT Faculty/All Staff) *
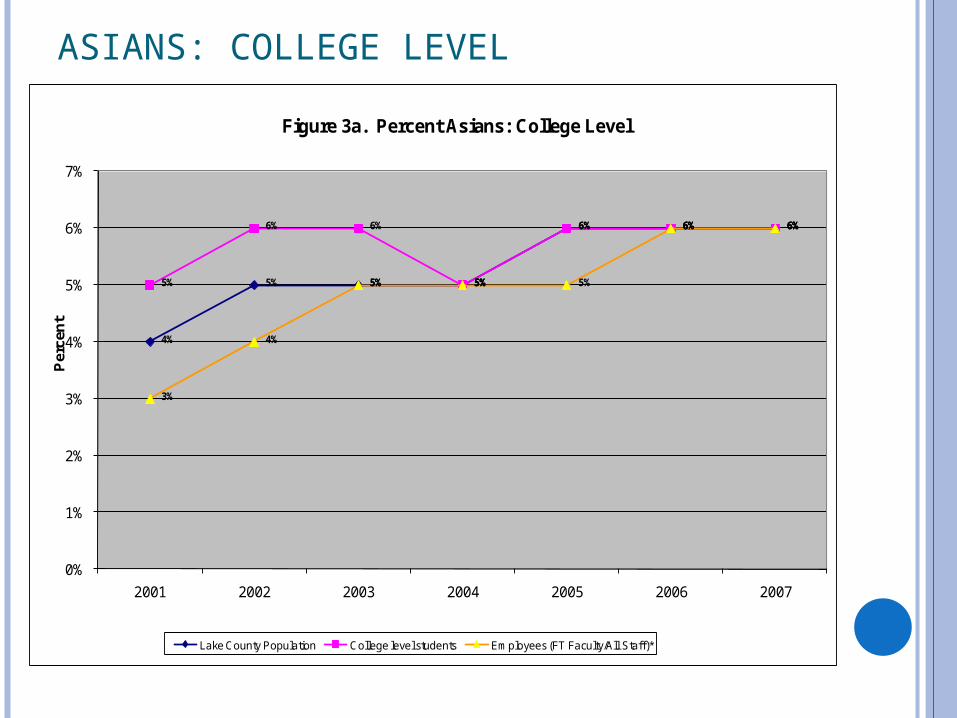
ASIANS: COLLEGE LEVEL
4%
5% 5% 5%
6% 6% 6%
5%
6% 6%
5%
6% 6% 6%
3%
4%
5% 5% 5%
6% 6%
0%
1%
2%
3%
4%
5%
6%
7%
2001 2002 2003 2004 2005 2006 2007
Per
cen
t
Figure 3a. Percent Asians: College Level
Lake County Population College level students Employees (FT Faculty/All Staff)*
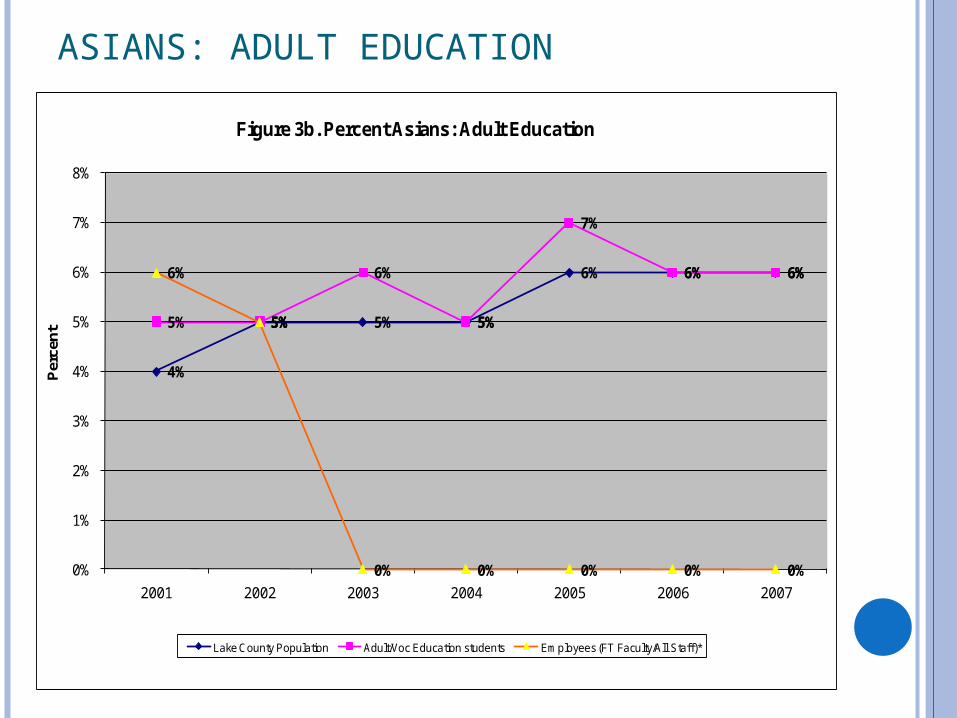
ASIANS: ADULT EDUCATION
4%
5% 5% 5%
6% 6% 6%
5% 5%
6%
5%
7%
6% 6%6%
5%
0% 0% 0% 0% 0%0%
1%
2%
3%
4%
5%
6%
7%
8%
2001 2002 2003 2004 2005 2006 2007
Per
cen
t
Figure 3b. Percent Asians: Adult Education
Lake County Population Adult/Voc Education students Employees (FT Faculty/All Staff)*
WHITES: COLLEGE LEVEL
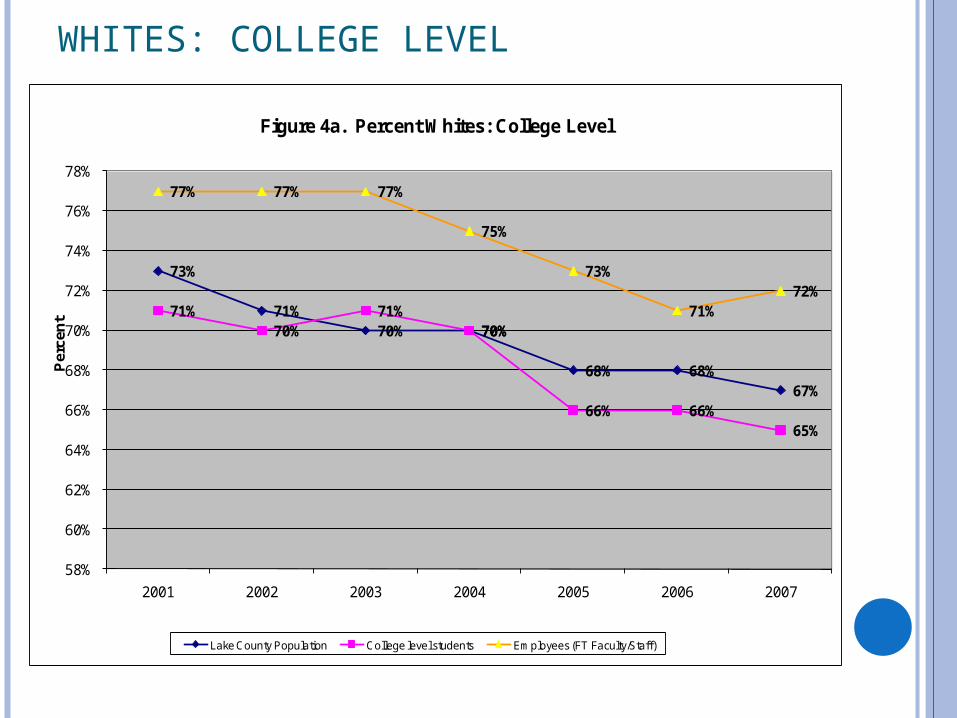
73%
71%70% 70%
68% 68%67%
71%70%
71%70%
66% 66%65%
77% 77% 77%
75%
73%
71%72%
58%
60%
62%
64%
66%
68%
70%
72%
74%
76%
78%
2001 2002 2003 2004 2005 2006 2007
Per
cen
t
Figure 4a. Percent Whites: College Level
Lake County Population College level students Employees (FT Faculty/Staff)
WHITES: ADULT EDUCATION
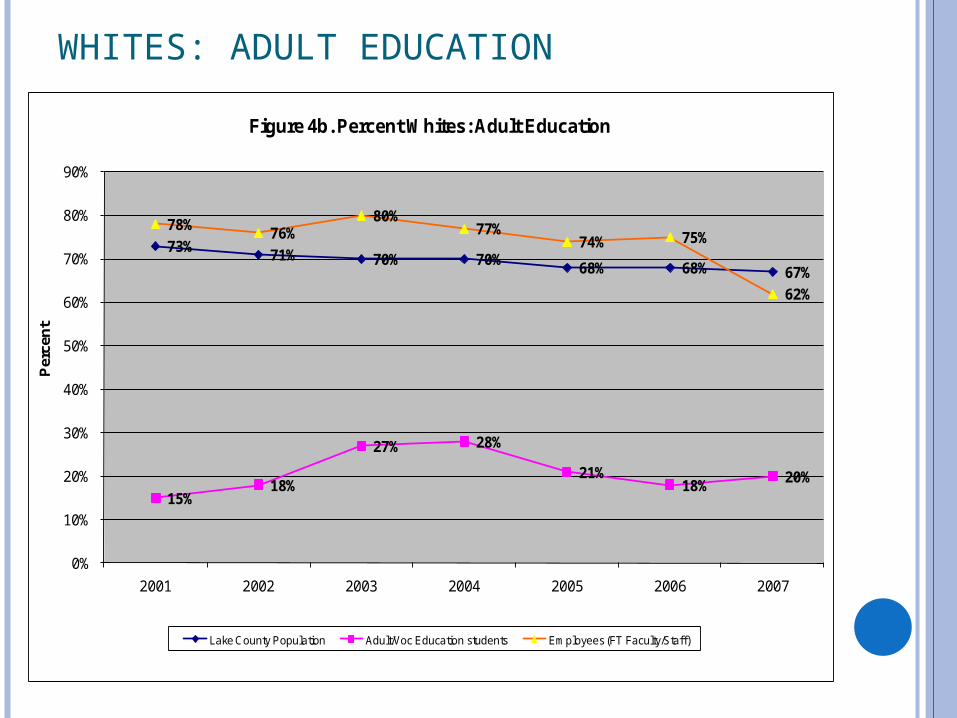
73%71% 70% 70%
68% 68% 67%
15%18%
27% 28%
21%18%
20%
78%76%
80%77%
74% 75%
62%
0%
10%
20%
30%
40%
50%
60%
70%
80%
90%
2001 2002 2003 2004 2005 2006 2007
Per
cen
t
Figure 4b. Percent Whites: Adult Education
Lake County Population Adult/Voc Education students Employees (FT Faculty/Staff)
ALL MINORITIES: COLLEGE LEVEL
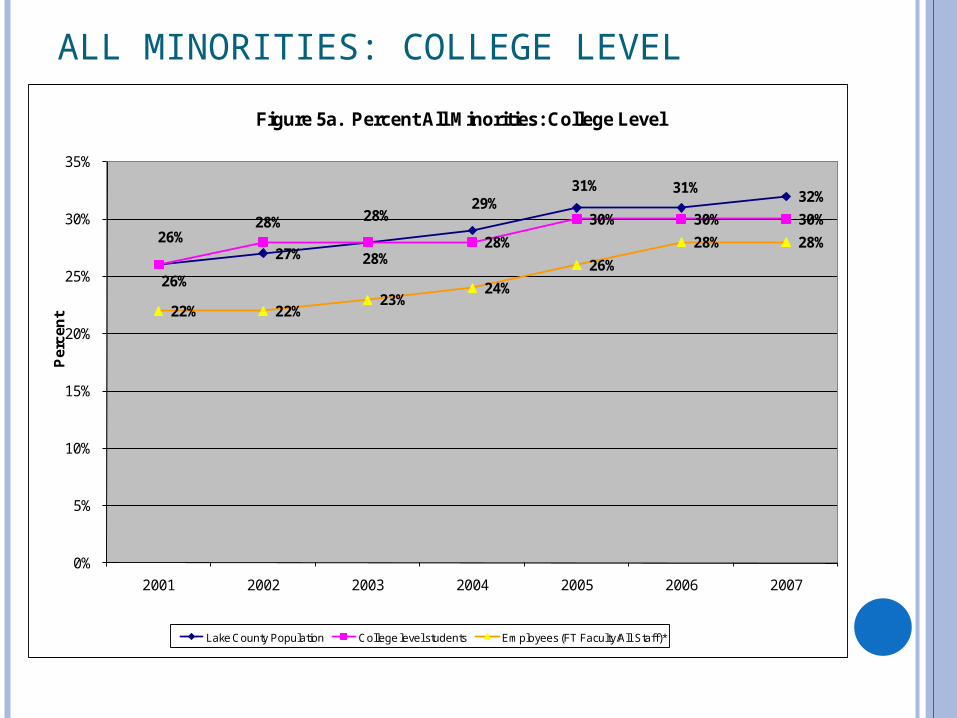
26%
27% 28%
29%31% 31%
32%
26%28% 28%
28%
30% 30% 30%
22% 22%23%
24%
26%
28% 28%
0%
5%
10%
15%
20%
25%
30%
35%
2001 2002 2003 2004 2005 2006 2007
Per
cen
t
Figure 5a. Percent All Minorities: College Level
Lake County Population College level students Employees (FT Faculty/All Staff)*
ALL MINORITIES: ADULT EDUCATION
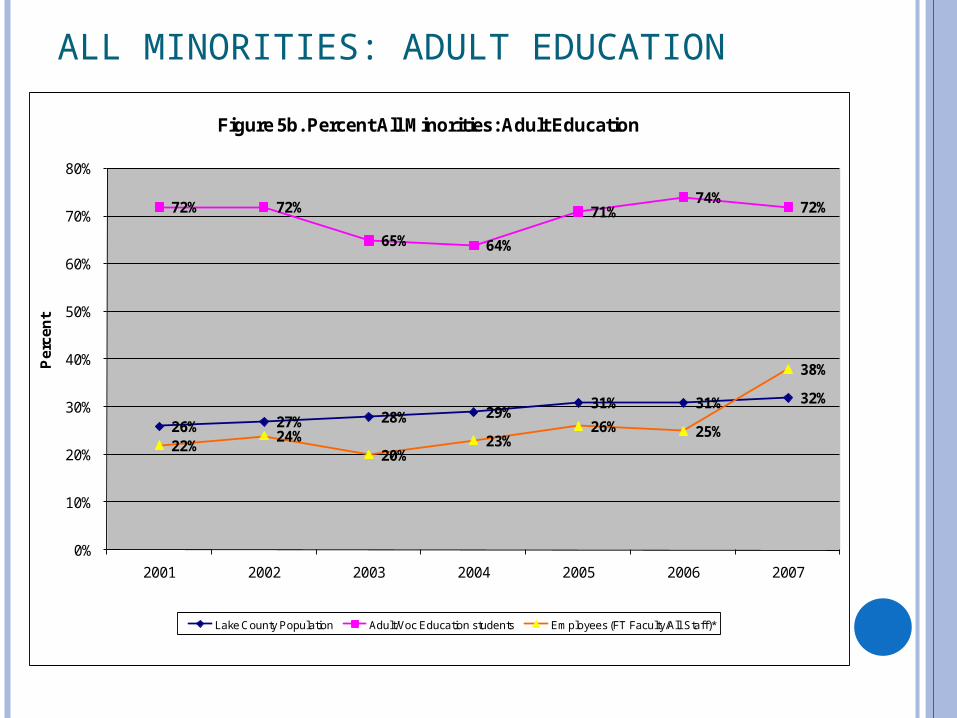
26% 27% 28% 29%31% 31% 32%
72% 72%
65% 64%
71%74%
72%
22%24%
20%23%
26% 25%
38%
0%
10%
20%
30%
40%
50%
60%
70%
80%
2001 2002 2003 2004 2005 2006 2007
Per
cen
t
Figure 5b. Percent All Minorities: Adult Education
Lake County Population Adult/Voc Education students Employees (FT Faculty/All Staff)*
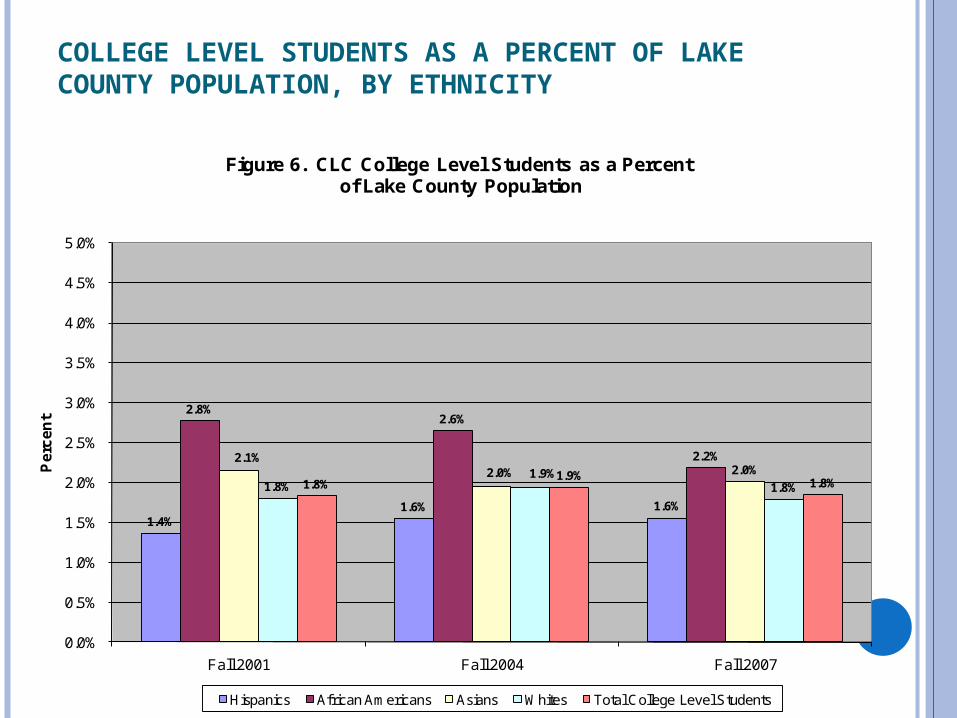
COLLEGE LEVEL STUDENTS AS A PERCENT OF LAKE COUNTY POPULATION, BY ETHNICITY
1.4%1.6% 1.6%
2.8%2.6%
2.2%2.1%2.0% 2.0%
1.8%1.9%
1.8%1.8%1.9%
1.8%
0.0%
0.5%
1.0%
1.5%
2.0%
2.5%
3.0%
3.5%
4.0%
4.5%
5.0%
Fall 2001 Fall 2004 Fall 2007
Pe
rce
nt
Figure 6. CLC College Level Students as a Percentof Lake County Population
Hispanics African Americans Asians Whites Total College Level Students
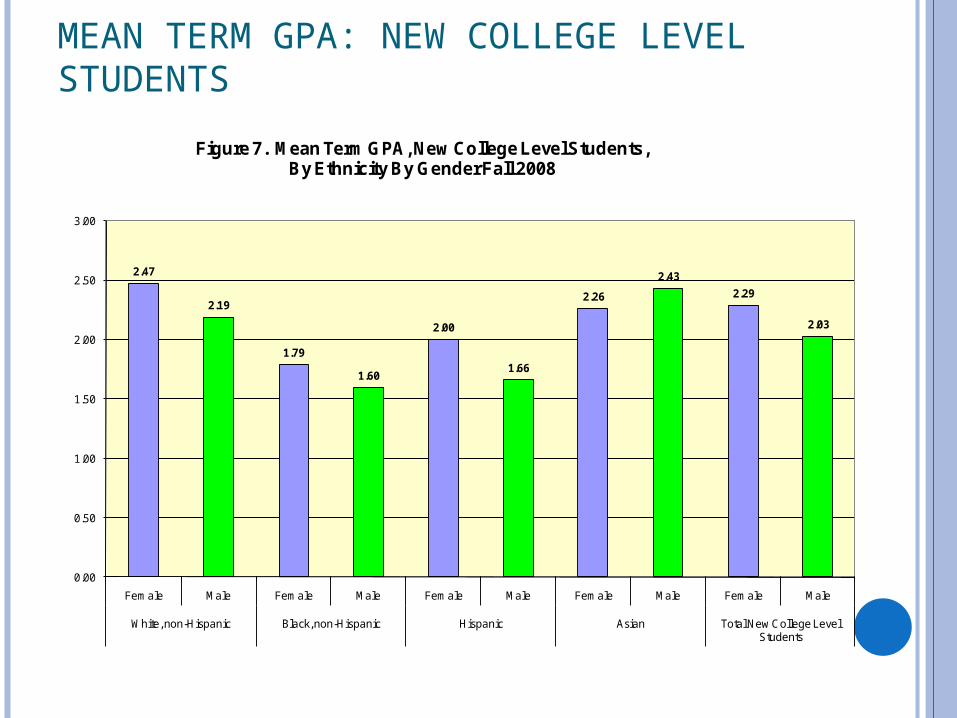
MEAN TERM GPA: NEW COLLEGE LEVEL STUDENTS
2.47
2.19
1.79
1.60
2.00
1.66
2.26
2.43
2.29
2.03
0.00
0.50
1.00
1.50
2.00
2.50
3.00
Female Male Female Male Female Male Female Male Female Male
White, non-Hispanic Black, non-Hispanic Hispanic Asian Total New College Level Students
Figure 7. Mean Term GPA, New College Level Students,By Ethnicity By Gender Fall 2008
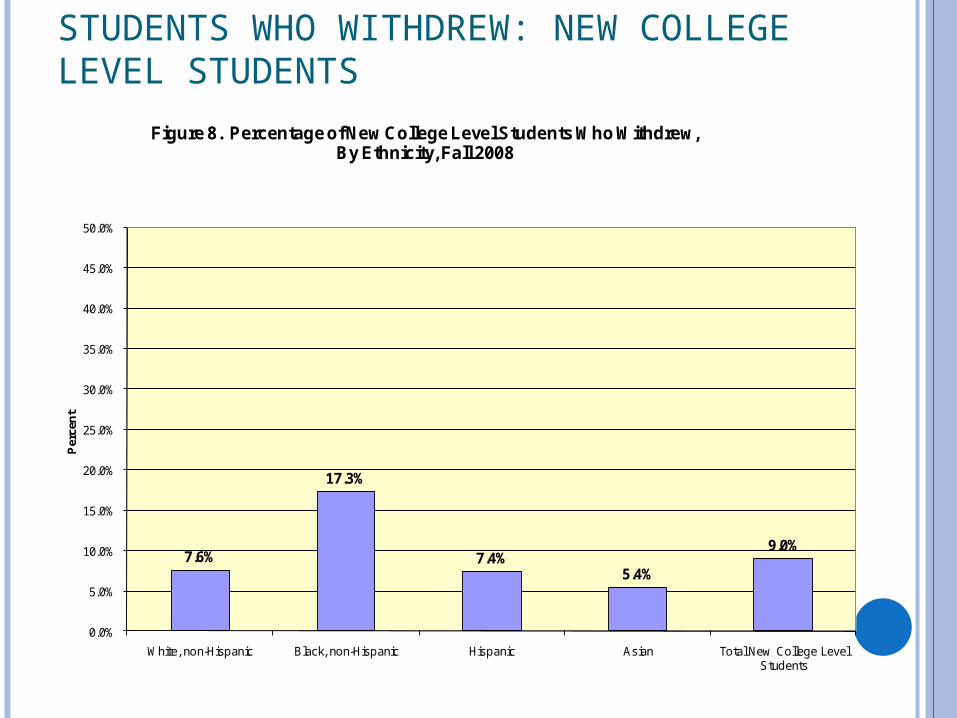
STUDENTS WHO WITHDREW: NEW COLLEGE LEVEL STUDENTS
7.6%
17.3%
7.4%5.4%
9.0%
0.0%
5.0%
10.0%
15.0%
20.0%
25.0%
30.0%
35.0%
40.0%
45.0%
50.0%
White, non-Hispanic Black, non-Hispanic Hispanic Asian Total New College Level Students
Per
cen
t
Figure 8. Percentage of New College Level Students Who Withdrew, By Ethnicity, Fall 2008
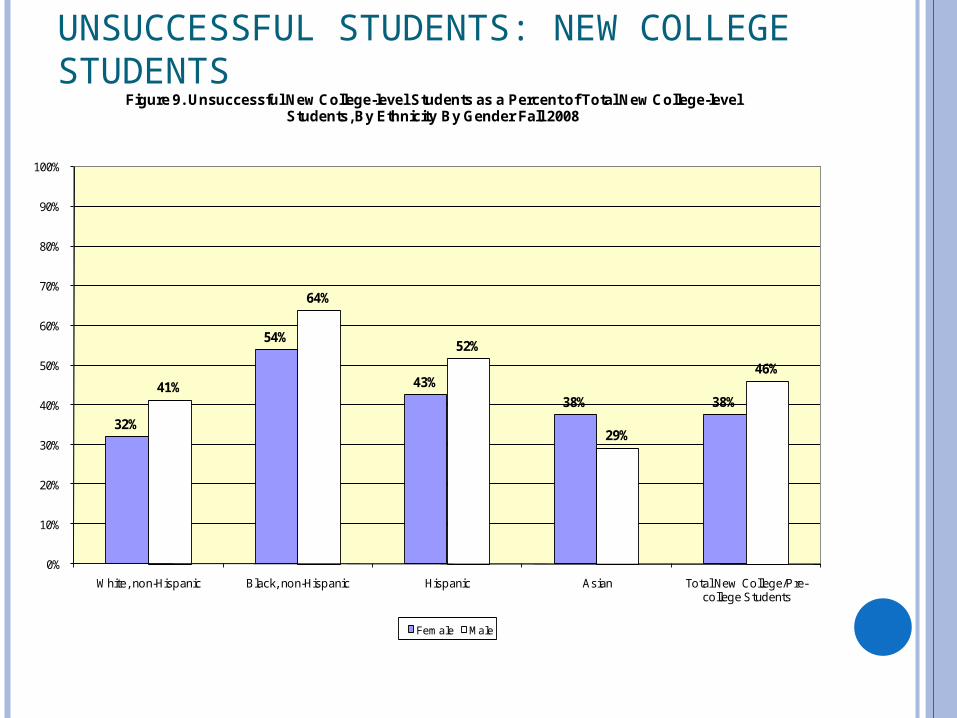
UNSUCCESSFUL STUDENTS: NEW COLLEGE STUDENTS
32%
54%
43%
38% 38%41%
64%
52%
29%
46%
0%
10%
20%
30%
40%
50%
60%
70%
80%
90%
100%
White, non-Hispanic Black, non-Hispanic Hispanic Asian Total New College/Pre-college Students
Figure 9. Unsuccessful New College-level Students as a Percent of Total New College-level Students, By Ethnicity By Gender Fall 2008
Female Male