Embed Size (px)
Citation preview
Classifying wetlands and assessing their functions:
Using the NC Wetlands Assessment Method (NC WAM) to
analyze wetland mitigation sites in the coastal plain region.
Emily R. Burton
Environmental Studies Graduate Student
University of North Carolina, Wilmington
May 5, 2008
2
Table of Contents
Acknowledgements……………………………………………………………………….....3
Executive Summary………………………………………………………………….…......4
Section I: Geography…………………………………………………………………..…....5
Section II: Land Use…………………………………………………………………….......5
Section III: Wetlands and Their Importance……………………………………….…......6
Section IV: Regulatory Protections………………………………………………….….....7
Section V: Mitigation Banking……………………………………………………………..8
Section VI: The North Carolina Department of Transportation…………….……...…...9
Section VII: In-Lieu Fee Process……………………………………………………..…..10
Section VIII: Functional Assessment………………………………………………..……11
Section IX: NC Wetland Assessment Method………………………………………..…...11
Section X: Site Selection for NC WAM Evaluation…………………………………. ….13
Section XI: Restoration of Mitigation Sites…………………………………………..…..14
Section XII: Methodology……………………………………………………………….…15
Section XIII: Results……………………………………………………………………….16
Section XIV: Discussion……………………………………………………………………20
Section XV: Conclusions…………………………………………………………………...21
References…………………………………………………………………………………...25
List of Figures
Figure 1. North Carolina Inner and Outer Coastal Plain
List of Tables
Table 1. Functional Results of Wetland Mitigation Sites
Table 2. Results of Wetland Functions for Individual Assessment Sites
Appendices
A. Abbreviations
B. Dichotomous Key to General North Carolina Wetland Types
C. NC WAM Field Assessment Form
D. NC WAM Wetland Rating Sheet
E. Mitigation Site Descriptions and Photos
3
Acknowledgements:
I would like to extend my appreciation to the following people who have provided valuable
comments and insights during the course of this study: Sandy Smith of EcoScience
Corporation/BPS&J, John Dorney of NCDWQ-DENR, Tammy Hill Environmental Specialist,
NCDENR-DWQ, Rick Savage, Technology Support Analyst, NCDENR-DWQ, Randy Griffin of
NCDOT, Dave Lekson of the Washington Regulatory Field Office, and Mickey Sugg of the
Wilmington Regulatory Field Office.
I am especially grateful for the time, effort and patience of Scott McLendon, Deputy Chief of the
USACE Wilmington District (and my chosen project advisor), who accompanied me in the field and
spent long hours providing feedback on this paper. Thank you.
4
Executive Summary:
Wetlands are vitally important ecological systems, especially within North Carolina’s coastal plain.
For over one hundred years, thousands of acres of wetlands have been lost throughout this region by
means of ditching and draining practices for agricultural purposes without any regulatory restraints.
As developmental pressures rose and watershed functions declined, there became an alarmingly high
need to restore and preserve the State’s remaining wetlands. In 1989, President George Bush Sr.
spearheaded the national “No Net-Loss of Wetlands” campaign, which ignited future litigation that
required compensatory wetland mitigation plans with permitted impacts.
Today, the U.S. Army Corps of Engineers (Corps) tracks the national acreage of permitted wetland
fill and mitigation required. From 1993 to 2000, approximately 23,500 acres of wetlands were filled
and 40,700 acres were restored or created in mitigation nationally (National Research Council,
2001). Despite the rapid growth of mitigation banks and their use during this time, questions remain
as to whether functional performance has matched expectations. Are restored wetlands functioning
as well as they should be? Has wetlands mitigation led to the conservation and “no net loss” of
wetlands?
In the state of North Carolina, a newly developed method of wetland classification and evaluation
has been developed, and will soon be adopted by NC state and federal agencies. The North Carolina
Wetlands Assessment Method (NC WAM) is a referenced-based, wetland functional assessment tool
that would be useful for mitigation planning and tracking functional replacement across the state.
The purpose of this study was to utilize NC WAM to evaluate twelve prior-converted mitigation
sites in the coastal plain to determine whether past methods of wetland mitigation have been
successful in restoring target or expected wetland functions.
Since there was no way to assess the lost functions of the impacted wetlands (permitted unavoidable
impacts that required compensatory mitigation), this study was unable to determine if functional
replacement through mitigation had actually occurred. Instead, it’s focus was to assess the
mitigation sites in a qualitative format for three main purposes: (1) to determine how well restored
wetlands were functioning, according to NC WAM, based on a reference wetland; (2) to determine if

5
there is a most favorable method of restoration by comparing each site’s mitigation plans with NC
WAM’s results; (3) and to see if NC WAM is an accurate and useful tool in validating success
criteria for mitigation sites.
I. Geography
The Coastal Plain of North Carolina is a very unique and important ecological region. It includes the
inner and outer coastal plain ecoregions, stretching from South Carolina to Virginia, and extending
inward almost to Raleigh. The inner coastal plain consists of irregular plains and broad interstream
divides, with the outer coastal plain having a low elevation (below 25 feet mean sea level) and flat
plains with numerous swamps, marshes and estuaries. This entire area encompasses approximately
25,000 square miles of land that drains into the Atlantic Ocean (Figure 1).
The region's numerous rivers, streams and wetlands are the lifeblood of the coastal plain, providing a
variety of functions to support a range of plant and animal species, while soaking up floodwaters and
feeding North Carolina's sounds and bays. The gentle-sloping plain is divided by many rivers,
including such navigable waterways as the Cape Fear, White Oak, Neuse, Tar, and Roanoke rivers.
Soils are mineral-based and rich in organics, often somewhat to very poorly drained, with the largest
of these areas located on interstream divides.
II. Land Use
The Coastal Plain once contained approximately 95% of the state’s 6 million acres of wetlands
(Wilson, 1962). In 1992, a study by Cashin et al. estimated that about 51% of the original wetlands
in North Carolina had been lost or altered in some way. It revealed that between 1950 – 1980,
approximately 42.2% of this loss was caused by agricultural activities. Landowners discovered that
the moist, nutrient-rich soils were ideal for growing leaf tobacco, peanuts, soybeans, and sweet
potatoes.
Typical practices for conversion of wetlands to agriculture consisted of extensive drainage and site
preparation. Wetland alteration involved the removal of all vegetation and debris from the soil
surface, then cutting parallel open drainage ditches from 24-48 inches deep at regular intervals
across the field. Land was often graded to produce a “crown” in the center of the fields between
6
adjacent drainage ditches so that rainwater would flow to the ditches, thereby preventing ponding on
the surface. Additionally, after years of intensive management with heavy farming equipment, a
thick layer of compacted soils known as a “plow-pan” was created about 8-10 inches below the
surface. As these shallow aquifers were drained, many of the aquatic functions that were formerly
present were eliminated.
According to the Natural Resources Conservation Service (NRCS), wetlands that were drained,
dredged, filled, leveled, or otherwise manipulated, including the removal of woody vegetation,
before December 23, 1985, are considered prior converted (PC) cropland. These sites must qualify
to make production of an agricultural commodity possible, and that (1) do not meet specific
hydrologic criteria (i.e. the land does not flood or pond for more than 14 days during the growing
season), (2) have had an agricultural commodity planted or produced at least once prior to December
23, 1985, and (3) have not since been abandoned (NRCS website). Such lands, as designated by the
NRCS, are exempt from wetland regulations administered by the Army Corps of Engineers under
Section 404 of the Clean Water Act, and often the presence of relic hydric soils may offer the only
historical baseline in determining where wetlands were once present (and thus can be an important
mechanism for mitigation planning).
III. Wetlands and their Importance
Jurisdictional wetlands, those subject to the permit requirements of Section 404 of the Clean Water
Act, are defined by the presence of three wetland parameters: hydrology, hydrophytic vegetation and
hydric soils (U.S. Army Corps of Engineers Wetland Delineation Manual, 1987). The prolonged
presence of water creates conditions that favor the growth of specially adapted plant (hydrophytes)
and promote the development of characteristic wetland (anaerobic) soils. The Corps defines
wetlands in the 1987 Delineation Manual as “those areas that are inundated or saturated by surface
or ground water at a frequency and duration sufficient to support, and that under normal
circumstances do support, a prevalence of vegetation typically adapted for life in saturated soils
conditions” (p. 9) For a site to meet the standards for the definition of a wetland, water must be
present within the upper 12 inches of the surface for at least 5% of the growing season (which is
7
typically March – November in North Carolina), and indicators of hydric soils as well as a 50% or
greater presence of wetland species must be present.
Only relatively recently have humans begun to understand the many ecological functions associated
with wetlands and their significance. They are a valuable natural resource that provides a vital link
between water and land and generally include swamps, marshes, bogs and floodplains. Wetlands
provide natural water quality improvement, flood storage, groundwater recharge, shoreline erosion
protection, and protect human health and safety by reducing flood and storm damage and preserving
water quality. They can receive, store and release water in various ways – physically through
ground water and surface water, as well as biologically through transpiration by vegetation – thereby
trapping and filtering nutrients, sediments and toxic pollutants from water that flows across them.
Wetlands also provide habitat for fish and wildlife, including many endangered and state listed
species, as well as opportunities for recreation and aesthetic appreciation.
IV. Regulatory Protections
The primary law conserving and protecting wetlands in the United States is the Clean Water Act
passed in 1972. Under Section 404, the Secretary of the Army has delegated authority to issue
permits for the discharge of dredged or fill material into wetlands and waters of the U.S. These
permits, administered by the Corps under the 404(b)(1) Guidelines, call for a sequencing approach to
(1) avoid filling wetland resources, (2) minimize adverse impacts to those wetlands that cannot be
avoided, and (3) provide compensatory mitigation to off-set unavoidable adverse impacts. Wetland
loss is compensated through means of on-site and off-site preservation, restoration, enhancement and
creation.
In 1989, President George H. W. Bush launched a “No Net Loss of Wetlands” campaign, pledging to
reduce the amount of wetlands impacted while restoring and creating new wetlands to compensate
for those lost. The Environmental Protection Agency (EPA) and Corps of Engineers were called
upon to employ a range of new policy instruments to slow and reverse wetlands conversion while
responding to development pressures.
8
Three options of mitigation were made available for a permittee to provide mitigation through the
regulatory process: mitigation banking, in-lieu fee (ILF), or on-site restoration, enhancement,
creation and/or preservation. Mitigation banking provides the means of purchasing wetland credits
from an approved wetland mitigation bank. The ILF process allows a permittee to provide funds to
an in-lieu-fee sponsor who is responsible for providing wetland mitigation under guidance. The
permittee process involves completing project-specific mitigation on-site of a project to compensate
for wetlands lost. In general, the regulatory agencies require a 2:1 ratio (acres of mitigation to
impacts) to help ensure that any temporal and spatial losses are accounted for.
V. Mitigation Banking
In the early 1990s, resource and regulatory agencies and state governments promoted a market-based
instrument known as wetlands mitigation banking. This process entails the development of a “bank”
of wetlands that have been created, restored, or preserved and that are then made available to
developers to “buy” into as credit for their proposed impacts. A mitigation bank is defined as “a site
where wetlands and/or other aquatic resources are restored, created, enhanced, or in exceptional
circumstances, preserved expressly for the purpose of providing compensatory mitigation in advance
of authorized impacts to similar resources” (Federal Guidance for the Establishment, Use and
Operation of Mitigation Banks, 1995, p.3).
The Corps Regulatory Division attempts to utilize a watershed-based approach when determining
compensatory mitigation requirements, thus the Geographic Service Area (GSA) of a bank is one of
the most important aspects in determining site selection approval. In North Carolina, the GSA has
generally been confined to the 8-digit USGS Hydrological Unit Code (HUC) within which the bank
property and the proposed project impacts are located, including any area outside the watershed
considered appropriate by the Corps or other permitting agency.
In order to develop a bank, a sponsor first must submit a prospectus describing the bank property to
the Corps and the Inter-agency Review Team (IRT) who will review the information to determine if
the bank site can successfully support the goals of the project. If agreed upon by the IRT, the
9
sponsor can begin detailed planning of the bank site including the methods of wetland (and/or
stream) restoration/enhancement. A critical component of this plan is the development of detailed
success criteria upon which the success of the bank will be evaluated. The IRT also negotiates the
details of objectives, ownership, operation, and enforcement before the proposed bank is submitted
for public notice and comment.
The Mitigation Banking Instrument (MBI) provides the legal framework around which the bank will
be operated and includes such items as the credit release schedule, Geographic Service Area,
preservation mechanism, etc. and allows the bank sponsor to assume responsibility for providing the
mitigation required from Department of the Army (Section 404) permits, as well as long-term
management and ecological success of the site.
Mitigation banking is typically implemented and functioning in advance of project impacts, thereby
reducing temporal loss of aquatic functions and uncertainty of whether the mitigation will be
successful in offsetting the project impacts. Its goal is to provide for greater selection of
hydrologically and ecologically favorable locations, thus increasing the opportunity for a well-
functioning, self-sustaining replacement (Federal Guidance for the Establishment, Use and
Operation of Mitigation Banks, 1995). It is believed that an increase in existence of mitigation
banks could contribute towards attainment of the goal of no net loss of the nation’s wetlands.
VI. The North Carolina Department of Transportation
In the early 1990s, the North Carolina Department of Transportation (NCDOT), with support of the
governor and state legislature, began an ambitious road-building initiative. As a result, NCDOT
became responsible for compensating for an increasing amount of wetland losses resulting from the
construction of many miles of new roads. During the mid-1990s, the NCDOT began to experience
increased project delays because they lacked the required mitigation at the time they needed
authorization to build. The few mitigation banks developed in North Carolina that did exist already
sold all or most of their credits to the NCDOT, thus leaving none available for the private
landowner. It became evident to state and federal agencies that methods for wetland mitigation
needed to expand and become more pro-active for highway projects.
10
VII. In-Lieu Fee Process
NC Wetland Restoration Program
In 1997, the NC Department of Environment and Natural Resources (DENR) established a state-
supported ILF Program known as the North Carolina Wetlands Restoration Program (NCWRP) to
off-set impacts caused by a boom in road building and demand for infrastructure. Its purpose was to
restore and replace wetland functions lost through historic conversion and through current and future
permitting activities, as well as increase ecological effectiveness of wetland compensatory mitigation
(NCWRP General Statutes Summary, 1997). It also emphasized the importance of mitigating within
the same river basin that impacts had or would occur.
Amongst other initiatives, the program allowed permittees to pay into the NCWRP Fund based on
the costs to restore or create the streams and wetlands, to include a restoration plan, long-term
monitoring, and maintenance of the restored wetland. Funds were distributed to state or federal
agencies, local governments, or private, non-profit conservation organizations, to acquire, develop,
manage and maintain the property in accordance with Corps requirements (NCWRP General
Statutes Summary, 1997). This program was an alternative to banking and allowed property
owners/developers and DOT to pay funds and thus transfer responsibility for wetland mitigation to
the NCWRP.
The NCWRP soon became an important component of mitigation in North Carolina by providing the
first method of developing a per-acre cost of wetland (and stream) restoration, as well as reporting
and documenting statewide wetland acreage losses and gains. Unfortunately, the NCDOT and
NCDENR mitigation programs functioned independently with different operating processes, a
situation that failed to meet the satisfaction of either federal and state regulatory agencies, or
environmental interest groups (EEP website). As a result, in 2003 a Memorandum of Agreement
was signed between the Corps, NCDOT, and NCDENR to provide a consistent and streamlined
approach to address compensatory mitigation requirements associated with Section 401 and 404
permits. This action established the Ecosystem Enhancement Program (EEP), a multi-agency

11
partnership that, combined with the existing wetlands restoration initiative, enabled the
implementation of large-scale watershed-based restoration efforts with a goal of providing
restoration in advance of wetland impacts. The EEP is currently managing previous NCWRP
mitigation sites as well as many of its own new sites, and as of August of 2004 it accepted the
transfer and responsibility of all of NCDOT’s off-site mitigation projects.
VIII. Functional Assessment
Wetland assessment procedures are tools that provide an objective way of evaluating and tracking
wetland function. Traditionally, state and federal agencies required wetland mitigation based on
acreage, evaluating success by focusing more on quantity rather than quality. Quantity has been
measured according to the structure of the mitigation site according to survival numbers and growth
rate of vegetation planted and monthly data displaying level of water tables to infer that wetland
functions were actually occurring. For mitigation success, the Corps requires on average a survival
rate of 260 planted trees per acre at the end of five years, and a the presence of water within the
upper 12 inches of the surface for at least 12.5% of the growing season. Quality has been a
measurement based on the regulator’s best professional judgment (BPJ), which often lends itself to
disagreements and inconsistencies. When EEP was developed, there was an expectation that
impacts and mitigation would be based more on functional assessment than the purely qualitative
BPJ approach that is currently employed. The Corps, Wilmington District and NCDENR realized
that they needed a new method of assessing wetland function to make better and more defensible
permit decisions.
IX. North Carolina Wetland Assessment Method
In response to a recognized need for a consistent, agency-approved method to assess wetland
functional quality, a team of experts gathered in 2003 to analyze approximately forty different
existing methodologies of wetland functional assessment to come up with an approach that would
answer many of their questions related to wetland function in North Carolina. In December of 2007,
the North Carolina Wetland Assessment Method (NC WAM) was developed by an inter-agency
12
team to provide a consistent tool to allow functional assessment information to support the
regulatory review process, including requirements for compensatory mitigation.
The purpose of NC WAM is “to provide the public and private sectors with an accurate, consistent,
rapid, observational, and scientifically-based field method to determine the level of function of
wetlands relative to reference condition for each general wetland type identified” (NC WAM Draft
User Manual, 2007, p.2). In North Carolina, wetlands have been grouped into 16 general wetland
types that are identified through the use of a dichotomous key. The Dichotomous Key to General
North Carolina Wetland Types was created to use specifically with NC WAM to identify the exact
community type being assessed (refer to Appendix B). The purpose for specifying general types is
to (1) provide a unified list of wetland types for North Carolina, (2) account for impacts by wetland
type, and (3) account for the inherent differences in function for each wetland type (NC WAM Draft
User Manual, 2007).
NC WAM determines the level of function of wetlands based on ratings of indicators of function
rather than their actual measurements. These ratings are generated based on an assessor’s evaluation
of 22 questions, or metrics, using observation, measurement, and best professional judgment (refer
to Appendix C). After the assessor completes the form, the selected descriptors are entered into a
computer program known as the NC WAM rating calculator, which converts the data into a
functional rating for each metric (refer to Appendix D). Metric descriptors are combined to provide
eleven sub-function ratings, which are then combined to provide three function ratings: Hydrology,
Water Quality and Habitat. These three ratings are then combined to yield an overall wetland rating.
Ratings are provided as “Low,” “Medium” and “High” relative only to those functions of the
reference wetland type.
Wetland Functions and Sub-functions
Functions vary amongst the 16 different wetland types, and the condition of a wetland can range
from having little apparent disturbance to being severely degraded. NC WAM considers chemical,
physical and biological functions and assesses the general performance for each wetland type. Three
wetland functional conditions are identified: hydrology, water quality and habitat, and each are
divided into sub-functions which are represented by on-site indicators and vary for each wetland
13
type. The hydrology function is determined by surface and sub-surface storage and retention, water
quality by particulate, soluble, pathogen, physical and pollution change (the last being a combination
of the first three), and habitat by physical structure, landscape patch structure, connectivity,
vegetation composition, and uniqueness. The water quality function is also rated by wetland
opportunity, which is determined by the ability (opportunity) of a wetland to perform a certain
function (see metric #7, Appendix C). The state of the surrounding watershed can increase the
wetland’s opportunity to provide function. For instance, proximity to disturbance areas within the
watershed and up to 5 miles from the assessment area may increase the functional rating.
The current method is now in its final review stages, and will soon be made available to state and
federal agencies involved in the regulatory review process. NC WAM is expected to be useful tool
for project planning, alternatives analysis, compliance/enforcement, mitigation planning and tracking
functional replacement. It is also expected that it may be modified for more specific applications,
such as mitigation success monitoring, as is relevant to this study (refer to suggestions for
modifications in the Conclusions Section in regard to mitigation monitoring).
X. Site Selection for NC WAM Evaluation
Twelve mitigation sites were selected for this study by means of identifying a geographical area, the
age of site development, and prior land use (site descriptions and photos found in Appendix E). The
geographical area of interest is the North Carolina Coastal Plain, which includes the outer and inner
plains to where they meet the Piedmont ecoregion (NC Ecoregion map, Figure 1). Emphasis was
placed on selecting older mitigation sites to determine how they have developed functionally over
time. Mitigation sites within this region that had completed their required monitoring phase and
were “closed out” or approved by regulatory agencies, were then identified (approximately 45 sites
total). The time period of when these sites began construction ranged from 1993 to 2002.
From this selection, a common thread that was used to narrow the focus of study was that the site
contained some portion of restoration of a prior-converted (PC) cropland. In the history of
mitigation, PC sites have been looked upon as having the most “bang for your buck” for conducting
wetland restoration, for they historically supported wetlands and were underlain with hydric soils, a
14
critical component of a successful restoration project. They also encompassed larger areas; one site
could have the potential to provide tens to hundreds of acres of wetland restoration credits with
minimal restoration design work and cost. Twelve mitigation sites in the Coastal Plain containing
partially or fully restored PC croplands were identified for the NC WAM evaluation, encompassing
a total of 2,176 acres (see Appendix E).
XI. Restoration of Mitigation Sites
Site restoration plans for each of the twelve selected mitigation sites in this study all involved fairly
similar methods for re-establishing hydrology and wetland vegetation. On all sites, drainage ditches
had been plugged and/or filled to re-establish surface and sub-surface hydrology, and some aspect of
site preparation prior to planting occurred. Depending on the severity of soil compaction that
resulted from agricultural activity, discing, deep ripping or surface scarification could have occurred.
Discing refers to a method of carrying a row of circular blades approximately 16-20 inches in
diameter behind a tractor to loosen up the AP horizon, allowing for aeration and filtration within the
soil. In the presence of thick plow pans below the AP horizon, deep ripping is necessary for
breaking up this hard compacted layer. This is similar method to discing, however the 24-26 inch
blades penetrate much deeper. Surface scarification may often be referred to as discing but generally
implies a more shallow “raking” of the surface. All three methods help to increase permeability
rates, surface roughness, hydrological retention and improve vegetation restoration efforts
(plantings).
In general, hydrophytic vegetation was planted shortly after the site was constructed. Trees species
were often selected by the type of wetland to be restored. This was often determined by a reference
area located nearby the restoration site. Hardwoods or pines were selected based on the desired
outcome of the site (e.g. Bottomland Hardwood forest or Pine Flat/Savanna). Saplings were planted
in rows that were often times prepared with bedding ploughs. Bedding, although not a
recommended activity by the Corps, is a procedure to help ensure survival of young planted
saplings, especially if the site becomes quickly inundated after ditch plugging/filling. The rows
created between beds, though, can often act as drainage ways for water or pool up for unnecessarily
long periods of time. A more acceptable method would call for vegetation planting first, allowing
15
trees to establish themselves for at least a year or two before reintroducing hydrology. This,
however, would require additional monitoring time that the permittee often cannot afford to waste.
Following the completion of site construction and planting, monitoring gauges (ground water
observation wells) were installed and sites were monitored for hydrology and vegetation success for
4-6 years, respectively. In several cases during this monitoring period, it was also deemed necessary
to perform vegetation remediation in the form of herbicide treatment and shearing (tree removal) to
eliminate competition from undesirable dominant and invasive species. Monitoring reports were
submitted to the Corps and resources agencies on an annual basis and often followed up with routine
site visits.
XII. Methodology
Background information on each site was obtained from NCDOT, the Corps and EEP. The majority
of mitigation sites (8 out of 12) are owned and operated by NCDOT for roadway projects
exclusively. The NCDOT website stores monitoring reports for all of their mitigation sites from
1995 to the present as public information. These reports provided information on site history and
progress, with monthly well data, vegetation planting maps and photo documentation of vegetation
growth. Site restoration proposals and plans were provided directly from the NCDOT office in
Raleigh.
The remaining four sites of this study are privately owned mitigation banks. These banks have gone
through the regulatory process of developing approved MBIs as required by the Corps. Information
on these sites is also public record, available on the Wilmington Regulatory Division’s website.
Project site proposals and plans were obtained from the Wilmington and the Washington Regulatory
field offices.
Extensive site research was conducted via ArcView/ArcMap Geographical Information Systems
(GIS) data during the months of January – February 2008. Site property boundaries, topography,
streams and roads were identified on 2005/2006 color aerial photos, 1998 near-infrared images were
downloaded to reveal accentuated texture and reflected energy from vegetation and to identify
16
historic structures and land uses, and combined elevation and hillshade data produced Light
Detecting and Rating (LIDAR) images enabling a clear two-dimensional view of the site.
Site assessment evaluations were conducted during the months of February – April, 2008. GIS
maps, mitigation site plans and NC WAM forms were brought to each assessment site, as well as the
necessary tools needed to complete the forms. Field tools included a soil auger, a hand-held Global
Position System (GPS) unit, a digital camera, a pocket rod, soil surveys, Munsell Soil Color Charts
and a compass. The NC WAM 2007 Draft Manual was also at hand and constantly referenced.
Assessment areas on each mitigation site were first identified with maps showing where hydrology
had been restored and wetland vegetation had been planted. Once located in the field, those
particular areas were walked and observed for changes in visible hydrology on the surface, survival
of trees and introduction of volunteer species, and changes in ground surface and topography. A
selected area that showed a favorable, homogenous representation of a particular wetland type was
identified using the Dichotomous Key to General North Carolina Wetland Types to identify the
exact community type. This was considered to be the Assessment Area (AA) and could encompass
tens to hundreds of acres. The final step was then to evaluate the area with NC WAM and properly
document it with field notes and digital photographs. The number of wetland community types
generally depended on the landscape positioning of each site, determining how many assessments
were conducted per mitigation site (2-5 on average).
After completing the NC WAM forms in the field, site information and selected answers to metrics
1-22 were entered into the NC WAM rating calculator for each assessment area (37 total). The
form’s answers are generated through the rating system in conjunction with the wetland community
type selected, and a Wetland Rating Sheet displays the results. Results were then observed and
assessed according to wetland community type and “Low,” “Medium” and “High” ratings of
hydrology, water quality and habitat.
XIII. Results
Eight of the sixteen North Carolina wetland community types were represented within the twelve
mitigation sites studied. A total of thirty-seven total assessments were completed, resulting in eleven
17
hardwood flats, nine non-riverine swamp forests, six riverine swamp forests, four bottomland
hardwood forests, four pine flats, one pine savanna, one floodplain pool and one non-tidal freshwater
marsh.
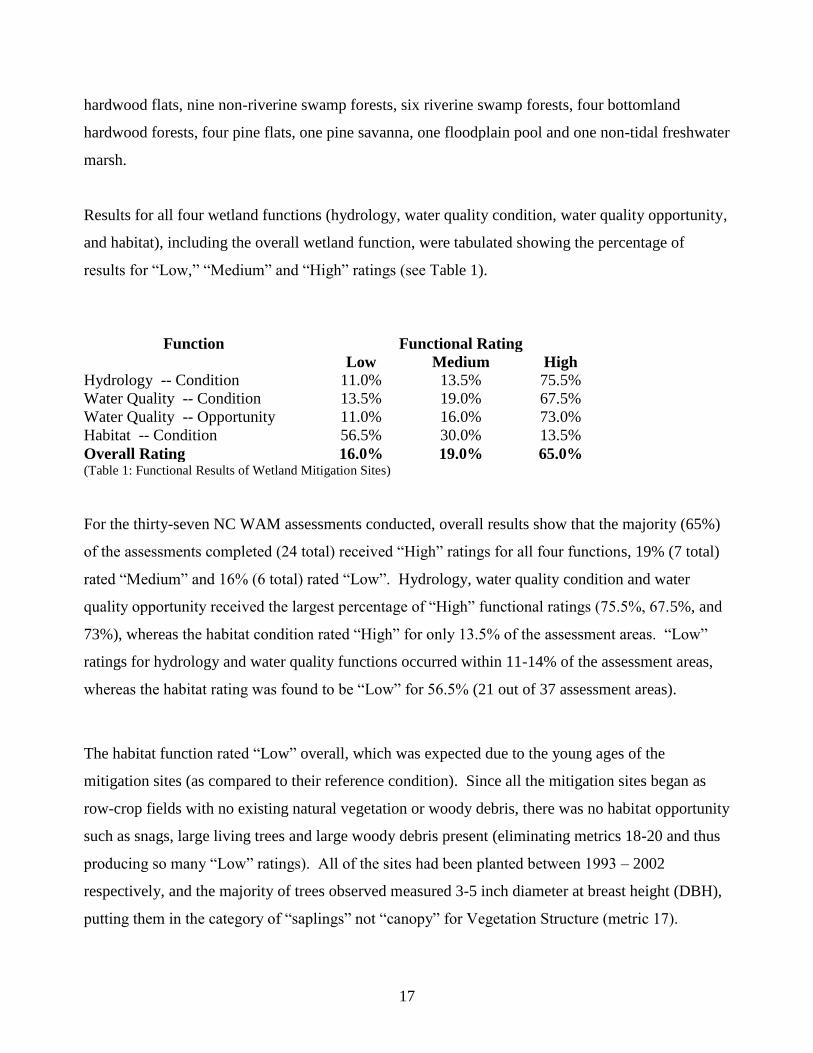
Results for all four wetland functions (hydrology, water quality condition, water quality opportunity,
and habitat), including the overall wetland function, were tabulated showing the percentage of
results for “Low,” “Medium” and “High” ratings (see Table 1).
Function Functional Rating
Low Medium High
Hydrology -- Condition 11.0% 13.5% 75.5%
Water Quality -- Condition 13.5% 19.0% 67.5%
Water Quality -- Opportunity 11.0% 16.0% 73.0%
Habitat -- Condition 56.5% 30.0% 13.5%
Overall Rating 16.0% 19.0% 65.0% (Table 1: Functional Results of Wetland Mitigation Sites)
For the thirty-seven NC WAM assessments conducted, overall results show that the majority (65%)
of the assessments completed (24 total) received “High” ratings for all four functions, 19% (7 total)
rated “Medium” and 16% (6 total) rated “Low”. Hydrology, water quality condition and water
quality opportunity received the largest percentage of “High” functional ratings (75.5%, 67.5%, and
73%), whereas the habitat condition rated “High” for only 13.5% of the assessment areas. “Low”
ratings for hydrology and water quality functions occurred within 11-14% of the assessment areas,
whereas the habitat rating was found to be “Low” for 56.5% (21 out of 37 assessment areas).
The habitat function rated “Low” overall, which was expected due to the young ages of the
mitigation sites (as compared to their reference condition). Since all the mitigation sites began as
row-crop fields with no existing natural vegetation or woody debris, there was no habitat opportunity
such as snags, large living trees and large woody debris present (eliminating metrics 18-20 and thus
producing so many “Low” ratings). All of the sites had been planted between 1993 – 2002
respectively, and the majority of trees observed measured 3-5 inch diameter at breast height (DBH),
putting them in the category of “saplings” not “canopy” for Vegetation Structure (metric 17).
18
Ratings dropped as it was indicated that canopy was “sparse or absent,” and that the majority of trees
were “less than 6-inches or absent” for Diameter Class Distribution (metric 19).
Three out of the five assessment areas that did rate “High” for habitat had an established canopy of
trees in which the majority of stems measured greater than 6-inches DBH, with a dense mid-
story/sapling layer. Thus, these sites received “High” ratings for Vegetative Structure (metric 17)
and Diameter Class Distribution (metric 19). It was noted on another site that large logs (relative to
others present in the landscape) were present, thereby increasing the rating for habitat via the Large
Woody Debris metric (no. 20).
Table 2 displays the ratings of all wetland functional conditions for each assessment area. Results
show that four out of the twelve mitigation sites in this study rated “High” overall for all assessment
areas evaluated: Scuppernong River Corridor, Dismal Swamp, Hidden Lake and the Gurley Tract.
These sites were observed to have well-established hydrology, effective water quality, and
reasonable habitat throughout the entire restored areas. Only one site, ABC, rated “Low” overall.
This site was a unique situation in which NC DOT had purchased the property and followed through
with its mitigation restoration plan with little input or approval from the Corps (refer to ABC site
description in Appendix E).
Three other sites that also received “Low” overall ratings, Bull Farms, Haws Run and Bear Creek-
Mill Branch, were all noted to have had either alterations due to beaver activity or lack of wetland
functions due to presence of stream channelization, man-made berms or soil compaction. These
stressors can have a negative effect on all three wetland functions (NC WAM Draft User Manual,
2007). Stream channelization can reduce both surface and sub-surface retention, reduce treatment
time for overbank flows and upland runoff, and degrade wildlife habitat. The presence of berms can
prevent overbank and overland flooding, alter surface and sub-surface water storage capacity,
decrease opportunity for the wetland to provide water quality, and degrade wildlife habitat. Soil
compaction, a result of intensive management, can reduce infiltration and subsurface storage
capacity.

19
Site Name/Assessment
Area (AA)
Wetland Community Type Hydrology
Cond.
Water Qual
Cond.
Habitat
Cond.
Overall
Rating
1. Scuppernong River
AA 1 Non-Riverine Swamp Forest High High Medium High
AA 2 Hardwood Flat Medium High High High
2. Bull Farms
AA 1 Floodplain Pool High High High High
AA 2 Bottomland Hardwood Forest High Low Low Low
AA 3 Riverine Swamp Forest Medium Low Low Low
AA 4 Bottomland Hardwood Forest High Medium Low Medium
AA 5 Riverine Swamp Forest High High Low High
3. Mildred Woods
AA 1 Pine Flat High High Medium High
AA 2 Hardwood Flat Medium High Low Medium
AA 3 Non-Riverine Swamp Forest High High Low High
AA 4 Non-Riverine Swamp Forest High High Low High
AA 5 Pine Flat Medium Medium High Medium
AA 6 Pine Flat High High Medium High
4. Dismal Swamp
AA 1 Riverine Swamp Forest High High High High
AA 2 Non-Riverine Swamp Forest High High Medium High
AA 3 Non-Riverine Swamp Forest High High Medium High
5. Hidden Lake
AA 1 (Woodward Tract) Hardwood Flat High High Low High
AA 2 (Morris Tract) Hardwood Flat High High Low High
6. Gurley Tract
AA 1 Hardwood Flat High High Medium High
AA 2 Bottomland hardwood Forest High High Medium High
7. Barra Farms (Phase I)
AA 1 Hardwood Flat High Medium Medium Medium
AA 2 Non-Riverine Swamp Forest High High Medium High
AA 3 Pine Flat Medium Medium Medium Medium
AA 4 Hardwood Flat High High Low High
8. Long Swamp
AA 1 Hardwood Flat High High Medium High
AA 2 Non-Riverine Swamp Forest High Medium Low Medium
9. Haws Run
AA 1 Riverine S. Forest (created) Low Medium Low Low
AA 2 Riverine Swamp Forest High High Low High
AA 3 Hardwood Flat High High Low High
AA 4 Pine Savanna High High Low High
10. Dowd Dairy
AA 1 Non-Riverine Swamp Forest High Medium Low Medium
AA 2 Non-Riverine Swamp Forest High High Low High
AA 3 Hardwood Flat High High Low High
11. ABC Site
AA 1 Bottomland Hardwood Forest Low Low Low Low
AA 2 Hardwood Flat Low Low Low Low
12. Bear Creek Mill Branch
Site
AA 1 Riverine Swamp Forest Low Low Low Low
AA 2 Non-Tidal Fresh Water Marsh High High High High
(Table 2: Results of Wetland Functions for Individual Assessment Sites)
20
XIV. Discussion
One challenge to this study was identifying the type of wetland community that was present within
an assessment area. Generally, mitigation plans describe the target community wetland type to be
achieved, however, site conditions that develop after ditches are plugged, beaver move in, storm
events occur, etc., sometimes lead to the development of community types that are different than
what was originally planned. Questions arose pertaining to whether the site should be keyed as the
type of wetland the restoration plan described (according to the species of trees planted and the
projected hydrological data), versus what was actually observed in the field. Several factors were
found to have influenced the development of the mitigation sites such as invasive species that had
dominated sites, (e.g. sweet gum, red maple or loblolly pine), and beaver activity in particular. It is
very difficult to predict post-restoration site conditions, since too much or too little water can
significantly affect the vegetation species composition.
NC WAM takes into account whether the site is “intensively managed” or “substantially modified”,
stating that:
Wetlands with modifications (man-made or natural) should generally be classified as
the original, naturally occurring type if this determination can be made. However, if
the full range of stable, existing wetland characteristics (vegetation, hydrology, and
soils) better resemble another wetland type because of long-established, permanent
alterations, it should be classified as this current, more appropriate type (Dichotomous
Key to General North Carolina Wetland Types).
It would be nearly impossible to determine the exact original wetland types that were present prior to
agricultural conversion, however, the majority of the restoration plans attempted to recreate what
was believed to exist historically by referring to nearby sites that were in a similar landscape
positions and had not been substantially altered. These reference sites were used to determine how
much hydrology would normally be present during the year and what type of vegetation would best
be supported by those conditions. With regards to each mitigation site, however, it was difficult to
say that it was undergoing “long established, permanent alterations” (referred to as on-going for 10
or more years in the NC WAM Draft User Manual) since they were all at such early stages of
development.
21
There is also debate as to how beaver activity could affect wetland ratings using NC WAM. The
Corps does not require perpetual beaver management for practical reasons, but it is evident from this
study that beaver have the potential to alter all three wetland conditions quite substantially by means
of (1) modifying the local plant community composition and structure through tree cutting and
flooding (vegetation mortality), (2) reducing energy dissipation by removal of vegetation, and (3)
changing local habitat for wildlife and aquatic species. For these reasons, the beaver could be
considered a natural stressor on the wetland community, depending upon whether the dam(s) are
long-established and alterations appear permanent. However, as it is well-known, beaver tend to
abandon their dams periodically, allowing them to become unstable until they breech, thus
eventually returning the wetland to its original state.
That said, wetland community type identification, being a crucial component to achieving results
with NC WAM, needs to be looked at consistently from site to site. Thus it was decided, for
purposes of consistency, to key out and identify wetlands as they currently exist, regardless of what
the original mitigation plan stated. It is understood that with time, as vegetation succession becomes
more established on these mitigation sites, a change of wetland type could result (as could with
natural modifications or disturbances due to beaver, hurricanes, droughts, blights, etc.).
XV. Conclusions
Wetland Functionality
From this study, the level of wetland functionality can be determined for each of the twelve restored
mitigation sites according to NC WAM’s results with regard to hydrology, water quality and habitat.
It can be concluded that the hydrology function rated “high” the most (75.5%) since this is often the
first function to be replaced after a site is constructed. Once drainage ditches are plugged and/or
backfilled, water will back up on a site very quickly. However, if ditches, berms, beaver or soil
compaction are present, then hydrology can be substantially altered.
Following hydrology, water quality would be the next function to improve, relative to inundation
duration and vegetation structure/buffer (as is noted for over 67% of the assessment areas evaluated
that received “High” ratings). This, however, can change quickly depending on (1) surrounding land
22
uses (opportunities) that clear-cut vegetation, increase impervious surfaces and introduce pollutants,
(2) heavy storm events, or (3) the introduction of beaver. It has been determined by NC WAM that
sites such as Bull Farms that have been impacted by beaver receive a lower water quality rating.
However, it is generally believed that increasing water storage capacity can actually improve water
quality.
As for habitat function, it is generally understood that this can take from decades to hundreds of
years to re-establish all the parameters necessary to support an ideal environment for local wildlife.
The oldest site in this study, Scuppernong River Corridor, is only fifteen years old, so it can be
assumed that it has not reached habitat functionality at a level that a reference site of the same
community type would. However, this site, as well as three others, received “High” ratings for
habitat, for the key reason that they provided ideal conditions for tree growth and resulted in the best
vegetation composition and structure. Conditions such as inundation duration and soil structure vary
according to wetland type, but if the proper species of trees are planted in the appropriate places,
they prove to do well. For instance, the presence of large, healthy planted bald cypress in several
assessment areas where standing water was present was a good indicator of when these conditions
are optimal.
Lack of Opportunity:
In several sites such as Long Swamp, Dismal Swamp and Dowd Dairy, stormwater from
surrounding developed and disturbed areas is directed away from the wetland (via ditches or storm
drains), thereby prohibiting the opportunity for the restored wetland to perform its functions. This
may have been considered during the development of the restoration plans, but determined not to be
feasible based on water encroachment issues on neighboring properties. In the case of the ABC and
Gurley sites, mitigation plans called for riverine wetland restoration. However the inverts of the
nearby stream channels were not raised to historical levels, so that the opportunity for flood events to
reach adjacent wetlands was very minimal (which was reflected in the rating results). Unless over-
bank flooding can be restored, wetlands will not be able to perform important ecological functions.
Restoration Methods:
23
The standard method of restoring prior-converted croplands (i.e. ditch plugging/filling, soil
discing/scarification and tree planting) appears to have resulted in a desirable outcome of hydrology
and water quality functional ratings according to NC WAM. To improve habitat functionality, the
introduction of coarse woody debris on a mitigation site (such as logging deck material) would
create additional habitat for wildlife. Doing so would increase this rating significantly, as it would
trigger the Large Woody Debris (no. 20) metric.
The ABC Mitigation Site rated “Low” overall and according to this study became a good example of
what not to do when constructing a wetland restoration site. Site construction techniques, such as
topsoil removal, B-horizon contouring and micro-relief treatment created an unnatural ground
surface that would not normally be found in an interstream divide. This unnecessary activity most
likely contributed to the further compaction of soils, causing a reduction in infiltration and
subsurface storage and decline in tree growth. Poor soil structure, no evidence of inundation, and
little to no opportunity to improve water quality were observed at this evaluation site. From this it
can be concluded that the statement “less is better” is the preferred method with regards to wetland
(and stream) restoration planning.
Wetland creation has also been an unfavorable method of mitigation by regulatory agencies, as was
evident at the north end of the Haw’s Run Mitigation Site where a 33-acre floodplain was created.
The top soil (O and A horizons) in this area was excavated, leaving compacted sandy clay soils
exposed at the surface, and the trees planted were not surviving well (less than 2 feet tall after 10
years of growth). Haws Run is an example of wetland creation in which results have been validated
by NC WAM: this assessment area received low ratings due to altered ground surface, substantially
altered sub-surface storage capacity and poor vegetation structure and composition.
NC WAM: A Validation for Success
NC WAM has taken a leap from assessing wetlands in a simple to broad context: performance
measures prior to NC WAM looked at one or more ecological functions related to minimum
standards of meeting hydrology or percent cover of hydrophytic vegetation, whereas the NC WAM
method examines a range of wetland functions covering a number of observable characteristics. It

24
has been concluded from the results of this study that NC WAM, is a valuable and accurate tool for
evaluating the success of mitigated wetlands, and it is suggested that it be used as an alternative
method to validate existing success criteria.
NC WAM can be an effective tool for assessing and perhaps tracking the functions of mitigation
sites throughout North Carolina. For potential enhancement areas, it is suggested that it be applied
to all identified wetland community types present on a potential mitigation site prior to restoration,
then again after the site has been restored to evaluate functional uplift. For potential restoration
areas, it is recommended that the site be evaluated prior to approval for determining restoration
goals. NC WAM could then be used again the year after vegetation planting, and the following
every 3-5 years as necessary, as part of the mitigation monitoring requirement. For true functional
replacement and determination of “no net loss”, “High” functional ratings should result for all three
parameters (hydrology, water quality and habitat).
Final Word:
Mitigation sites are dynamic living, growing and evolving ecosystems that are constantly subject to
change. If left in a state of preservation protected from human interference, these sites will be
subject only to nature’s influence, whether good or bad. It’s understood that this hands-off process,
although it may take decades, will eventually correct itself into a balanced and stable wetland
community, whatever type it may be. Regardless, it is still important, and highly recommended, to
continue evaluating these sites for research purposes to document and record their natural progress.
25
References
Published Documents:
Cashin, G.E., J.R. Dorney, and C.J. Richardson 1992. Wetland Alteration Trends on the North
Carolina Coastal Plain. Wetlands 12(2): 63-71.
Gwin, S.E., M.E. Kentula, and P.W. Shaffer 1999. Evaluating the Effects of Wetland Regulation
through Hydrogeomorphic Classification and Landscape Profiles. Wetlands 19(3): 477-489.
Lewis, R. R. III 1989. Wetland restoration/creation/enhancement terminology: Suggestions for
standardization. Wetland Creation and Restoration: The Status of the Science, Vol. II. EPA
600/3/89/038B. U.S. Environmental Protection Agency, Washington, D.C.
Land Management Group, Inc. 1997. Compensatory Mitigation Plan for the Haw’s Run Mitigation
Site. Job 96-351. Land Management Group Inc., Wilmington, North Carolina.
National Research Council 1992. Restoration of Aquatic Ecosystems: Science, Technology and
Public Policy. National Academy Press, Washington, D.C.
North Carolina Wetland Functional Assessment Team 2007. N.C. Wetland Assessment Method
(NC WAM) Draft User Manual. Draft Version 6.0.
Race, M. S. and M. S. Fonseca 1996. Fixing compensatory mitigation: What will it take? Ecological
Applications 6(1):94-101.
Rheinhardt, Richard D., and Mark M. Brinson 2000. CTE/NCDOT Report. An Evaluation of the
Effectiveness of Existing North Carolina Department of Transportation Wetland Mitigation Sites
(Phase I Report). East Carolina University Department of Biology. Greenville, NC.
Rheinhardt, Richard D., and Mark M. Brinson 2002. CTE/NCDOT Final Report (Phase II). An
Evaluation of North Carolina Department of Transportation Wetland Mitigation Sites: Selected Case
Studies. East Carolina University Department of Biology. Greenville, NC.
Salzman, James and J.B. Ruhl 2005. “No Net-Loss” – Instrument Choice in Wetlands Protection.
Duke Law School Science, Technology and Innovation Research Paper Series. Research Paper No.
1. Acquired from the Social Science Research Network at: http://ssrn.com/abstract=796771
Sutter, Lori A., et al., 1999. NC-CREWS: North Carolina Coastal Regional Evaluation of Wetland
Significance. A Report of the Strategic Plan for Improving Coastal Management in NC. Division of
Coastal Management, NC Department of Environment and Natural Resources, Raleigh, N.C.
USEPA, 2000. Principles for the Ecological Restoration of Aquatic Resources. EPA841-F-00-003.
Office of Water (4501F), United States Environmental Protection Agency, Washington, DC. 4 pp.
26
Wilson, K.A. 1962. North Carolina Wetlands: Their Distribution and Management. Published by the
North Carolina Wildlife Resources Commission. Raleigh, North Carolina.
Zedler, J. 1996. Ecological issues in wetland mitigation: An introduction to the forum. Ecological
Applications 6(1):33-37.
Online Documents:
Federal Guidance on the Use of In-Lieu-Fee Arrangements for Compensatory Mitigation under
Section 404 of the Clean Water Act and Section 10 of the Rivers and Harbors Act, October 20, 2000.
Acquired online at: http://www.saw.usace.army.mil/wetlands/Mitigation/in_lieu_fee.htm
Federal Guidance for the Establishment, Use and Operation of Mitigation Banks, 60 FR 228, pp.
58605-58614, dated November 28, 1995. Acquired online at:
http://www.saw.usace.army.mil/wetlands/Mitigation/in_lieu_fee.htm
Guidance for Rating the Values of Wetlands in North Carolina (4th
version). North Carolina
Department of Environment, Health, and Natural Resources Division of Environmental Management
Water Quality Section January, 1995. Acquired online at:
http://www.h2o.enr.state.nc.us/ncwetlands/documents/NCWetlandAssessment_v4
Memorandum of Agreement Between the Environmental Protection Agency and the Department of
the Army Concerning the Determination of Mitigation Under the Clean Water Act 404(b)(1)
Guidelines, February 6, 1990. Acquired online at:
http://www.saw.usace.army.mil/wetlands/Mitigation/in_lieu_fee.htm
Memorandum of Understanding Between the North Carolina Department of Environment and
Natural Resources and the United States Army Corps of Engineers, Wilmington District. November
4, 1998. Acquired online at: http://www.wetlands.com/fed/moafe90.htm
North Carolina Wetlands Restoration Program (WRP), 1997. General Statutes Summary, 143: 214.8
– 214.13. Pdf link available at: http://www.nceep.net/abouteep/wetlands.html
U.S. Army Corps of Engineers Wetland Delineation Manual, Environmental Laboratory 1987.
Acquired online at: http://el.erdc.usace.army.mil/wetlands/pdfs/wlman87.pdf
Websites:
Ecosystem Enhancement Program and Wetlands Restoration Program Information available online
at: http://www.nceep.net/abouteep/wetlands.html

27
Functions and Values of Wetlands in North Carolina. NCDENR, Division of Coastal Management.
Available online at: http://dcm2.enr.state.nc.us/wetlands/brochure.htm
Mitigation in the Wilmington District, USACE Regulatory Division. Available online at:
http://www.saw.usace.army.mil/wetlands/Mitigation/index.html
NCDOT Mitigation Monitoring Reports. Available online at:
http://www.ncdot.org/doh/preconstruct/pe/NEU/Monitoring/MonitoringReports.html

28
Figure 1. North Carolina Inner and Outer Coastal Plain Areas
29
Appendix A
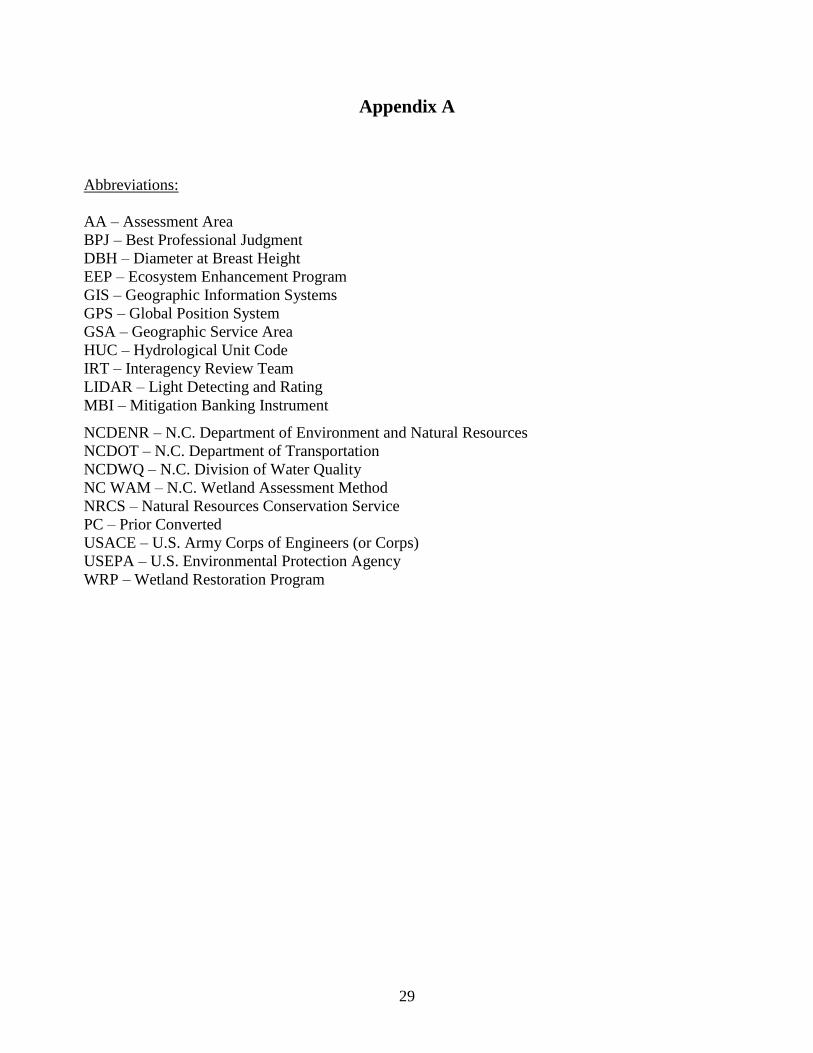
Abbreviations:
AA – Assessment Area
BPJ – Best Professional Judgment
DBH – Diameter at Breast Height
EEP – Ecosystem Enhancement Program
GIS – Geographic Information Systems
GPS – Global Position System
GSA – Geographic Service Area
HUC – Hydrological Unit Code
IRT – Interagency Review Team
LIDAR – Light Detecting and Rating
MBI – Mitigation Banking Instrument
NCDENR – N.C. Department of Environment and Natural Resources
NCDOT – N.C. Department of Transportation
NCDWQ – N.C. Division of Water Quality
NC WAM – N.C. Wetland Assessment Method
NRCS – Natural Resources Conservation Service
PC – Prior Converted
USACE – U.S. Army Corps of Engineers (or Corps)
USEPA – U.S. Environmental Protection Agency
WRP – Wetland Restoration Program

30
Appendix B
Dichotomous Key to General North Carolina Wetland Types

____________________________________________________________________________
____________________________________________________________________________ Draft User Manual (version 5.0) NC Wetland Assessment Method (NC WAM)
Dichotomous Key to General North Carolina Wetland Types, v5.14, 3/16/07
Before using this key, the assessor should have read and become familiar with the descriptions of the
general wetland types. The assessor should use best professional judgment to verify that the wetland
type determined with the use of this key matches the written description.
The following rules should be used to assist the assessor in the selection of the most appropriate general
wetland type. Narrative descriptions are also available to assist in this choice (see User Manual Section
3.1).
Wetlands with modifications (man-made or natural) should generally be classified as the
original, naturally occurring type if this determination can be made. However, if the full
range of stable, existing wetland characteristics (vegetation, hydrology, and soils) better
resemble another wetland type because of long-established, permanent alterations, the
wetland should be classified as this current, more appropriate type.
If there is evidence suggesting the wetland is a type other than the keyed type, the wetland may be
classified as the evidenced type. Also, if the wetland does not appear to conform to any of the following
general types, the site should be evaluated based on what the assessor believes is the closest wetland
type. If the wetland is “intensively managed” or “intensively disturbed,” the assessor should note this fact
on the field assessment form and then select the most appropriate general wetland type based on the
guidance provided above.
I. Wetland affected by lunar or wind tide, may include woody areas adjacent to tidal marsh
A. Wetland affected, at least occasionally, by brackish or salt water i. Dominated by herbaceous vegetation – Salt/Brackish Marsh ii. Dominated by woody vegetation – Estuarine Woody Wetland
B. Wetland primarily affected by freshwater i. Dominated by herbaceous vegetation – Tidal Freshwater Marsh ii. Dominated by woody vegetation – Riverine Swamp Forest
II. Wetland not affected by tides
A. Not in a geomorphic floodplain and not associated with a natural linear conveyance (such as a topographic crenulation), nor associated with a natural lake greater than or equal to 20 acres in size i. On a side slope – Seep ii. On interstream divides or on a coastal island
1. Flats or interstream divides in Coastal Plain ecoregions a. Dominated by deciduous trees
i. Intermittently to seasonally inundated (typically dominated by sweetgum and oaks) – Hardwood Flat
ii. Seasonally to semi-permanently inundated (typically dominated by cypress and blackgum) – Non-Riverine Swamp Forest
b. Dominated by evergreens i. Dominated by dense, waxy shrub species (typically include gallberries,
fetterbushes, honeycup, greenbriar); canopy may include pond pine, Atlantic white cedar, and bays – Pocosin
ii. Not dominated by dense, waxy shrub species 1. Dominated by long-leaf or pond pine and wire grass – Pine Savanna 2. Dominated by loblolly or slash pines – Pine Flat
2. In depressions surrounded by uplands anywhere in the state (mafic depressions, lime sinks, Carolina bays) or on shorelines of lakes/pond

____________________________________________________________________________
____________________________________________________________________________ Draft User Manual (version 5.0) NC Wetland Assessment Method (NC WAM)
DICHOTOMOUS KEY TO GENERAL NC WETLAND TYPES, CONTINUED
2. In depressions surrounded by uplands anywhere in the state (mafic depressions, lime sinks, Carolina bays) or on shorelines of lakes/ponds (repeated from the previous page)
a. Dominated by dense, waxy shrub species (typically include gallberries, fetterbushes, honeycup, greenbriar; canopy may include pond pine, Atlantic white cedar, and bays) and not characterized by clay-based soils– Pocosin
b. Not dominated by dense, waxy shrub species and not characterized by a peat-filled bay – Small-Basin Wetland
B. In a geomorphic floodplain or associated with a natural linear conveyance (such as a topographic crenulation) or along shorelines of natural water bodies greater than 20 acres or artificial impoundments i. Northern Inner Piedmont or Blue Ridge Mountains ecoregions and dense herbaceous or
mixed shrub/herbaceous vegetation with characteristic bog species (see wetland type description), with or without tree canopy; typically long-duration saturation; sphagnum moss commonly present – Mountain Bog
ii. Anywhere in the state and not Mountain Bog 1. Dominated by herbaceous vegetation. At least semi-permanently inundated or saturated.
Includes lacustrine and riverine fringe, and beaver ponds with dense herbaceous vegetation of large, grass-like plants and forbs, sphagnum moss scarce or absent – Non-tidal Freshwater Marsh
2. Dominated by woody vegetation. Trees may be present on edges or hummocks. a. Localized depression; semi-permanently inundated – Floodplain Pool b. Not a localized depression
i. Zero- to 1st-order stream
1. May be 2
nd- or 3
rd-order stream in Sandhills level IV
ecoregion. Diffuse surface flow and groundwater more important than overbank flooding.
1. Intermittently inundated to seasonally saturated – Headwater Wetland 2. Seasonally to semi-permanently inundated – Riverine Swamp Forest
ii. Second-order or greater stream or associated with the shoreline of waterbodies 20 acres or greater
1. Intermittently to seasonally inundated for long duration (may be dominated by sweetgum, ash, sycamore, and oaks) – Bottomland Hardwood Forest
2. Seasonally to semi-permanently inundated for very long duration (may be dominated by cypress and blackgums in Coastal Plain and ash, overcup oak, and elms in Piedmont and Mountains) – Riverine Swamp Forest
1See stream order schematic diagram in User Manual Appendix C.

31
Appendix C
NCWAM Field Assessment Form
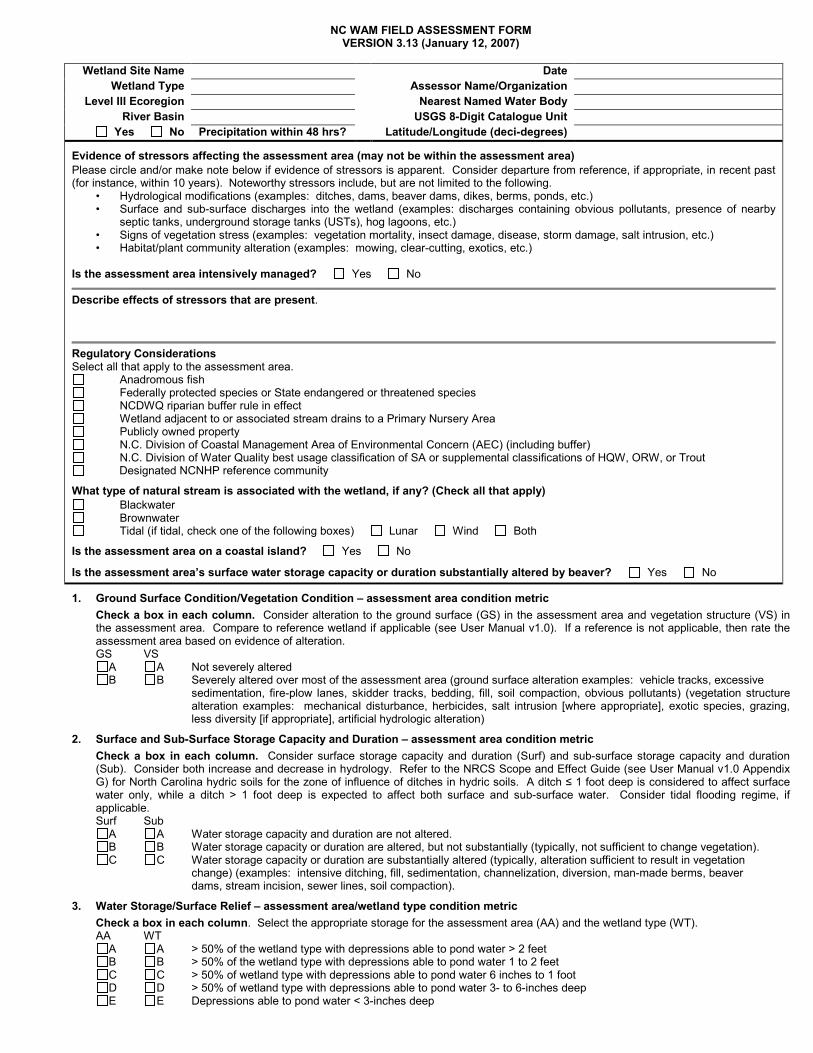
NC WAM FIELD ASSESSMENT FORM VERSION 3.13 (January 12, 2007)
Wetland Site Name Date
Wetland Type Assessor Name/Organization
Level III Ecoregion Nearest Named Water Body
River Basin USGS 8-Digit Catalogue Unit
Yes No Precipitation within 48 hrs? Latitude/Longitude (deci-degrees)
Evidence of stressors affecting the assessment area (may not be within the assessment area)
Please circle and/or make note below if evidence of stressors is apparent. Consider departure from reference, if appropriate, in recent past (for instance, within 10 years). Noteworthy stressors include, but are not limited to the following.
• Hydrological modifications (examples: ditches, dams, beaver dams, dikes, berms, ponds, etc.) • Surface and sub-surface discharges into the wetland (examples: discharges containing obvious pollutants, presence of nearby
septic tanks, underground storage tanks (USTs), hog lagoons, etc.) • Signs of vegetation stress (examples: vegetation mortality, insect damage, disease, storm damage, salt intrusion, etc.) • Habitat/plant community alteration (examples: mowing, clear-cutting, exotics, etc.)
Is the assessment area intensively managed? Yes No
Describe effects of stressors that are present.
Regulatory Considerations Select all that apply to the assessment area. Anadromous fish Federally protected species or State endangered or threatened species NCDWQ riparian buffer rule in effect Wetland adjacent to or associated stream drains to a Primary Nursery Area Publicly owned property N.C. Division of Coastal Management Area of Environmental Concern (AEC) (including buffer) N.C. Division of Water Quality best usage classification of SA or supplemental classifications of HQW, ORW, or Trout Designated NCNHP reference community
What type of natural stream is associated with the wetland, if any? (Check all that apply)
Blackwater Brownwater Tidal (if tidal, check one of the following boxes) Lunar Wind Both
Is the assessment area on a coastal island? Yes No
Is the assessment area’s surface water storage capacity or duration substantially altered by beaver? Yes No
1. Ground Surface Condition/Vegetation Condition – assessment area condition metric
Check a box in each column. Consider alteration to the ground surface (GS) in the assessment area and vegetation structure (VS) in the assessment area. Compare to reference wetland if applicable (see User Manual v1.0). If a reference is not applicable, then rate the assessment area based on evidence of alteration. GS VS A A Not severely altered B B Severely altered over most of the assessment area (ground surface alteration examples: vehicle tracks, excessive
sedimentation, fire-plow lanes, skidder tracks, bedding, fill, soil compaction, obvious pollutants) (vegetation structure alteration examples: mechanical disturbance, herbicides, salt intrusion [where appropriate], exotic species, grazing, less diversity [if appropriate], artificial hydrologic alteration)
2. Surface and Sub-Surface Storage Capacity and Duration – assessment area condition metric
Check a box in each column. Consider surface storage capacity and duration (Surf) and sub-surface storage capacity and duration (Sub). Consider both increase and decrease in hydrology. Refer to the NRCS Scope and Effect Guide (see User Manual v1.0 Appendix G) for North Carolina hydric soils for the zone of influence of ditches in hydric soils. A ditch ≤ 1 foot deep is considered to affect surface water only, while a ditch > 1 foot deep is expected to affect both surface and sub-surface water. Consider tidal flooding regime, if applicable. Surf Sub A A Water storage capacity and duration are not altered. B B Water storage capacity or duration are altered, but not substantially (typically, not sufficient to change vegetation). C C Water storage capacity or duration are substantially altered (typically, alteration sufficient to result in vegetation
change) (examples: intensive ditching, fill, sedimentation, channelization, diversion, man-made berms, beaver dams, stream incision, sewer lines, soil compaction).
3. Water Storage/Surface Relief – assessment area/wetland type condition metric
Check a box in each column. Select the appropriate storage for the assessment area (AA) and the wetland type (WT). AA WT A A > 50% of the wetland type with depressions able to pond water > 2 feet B B > 50% of the wetland type with depressions able to pond water 1 to 2 feet C C > 50% of wetland type with depressions able to pond water 6 inches to 1 foot D D > 50% of wetland type with depressions able to pond water 3- to 6-inches deep E E Depressions able to pond water < 3-inches deep
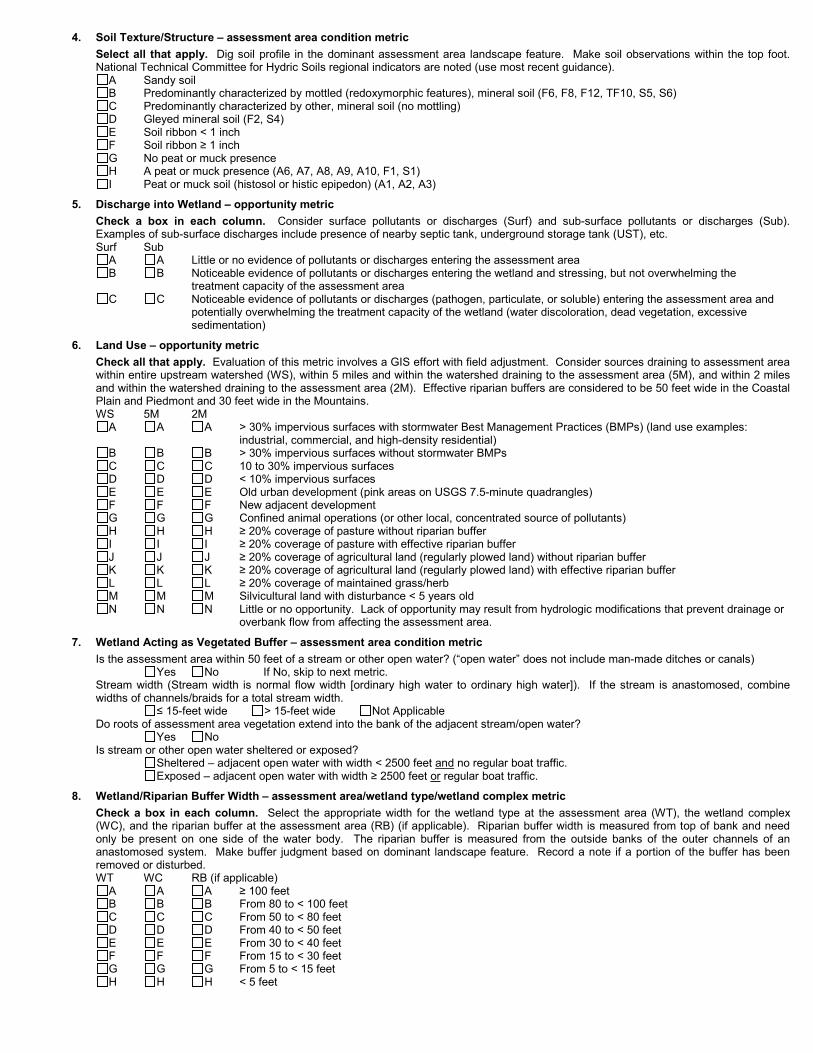
4. Soil Texture/Structure – assessment area condition metric
Select all that apply. Dig soil profile in the dominant assessment area landscape feature. Make soil observations within the top foot. National Technical Committee for Hydric Soils regional indicators are noted (use most recent guidance). A Sandy soil B Predominantly characterized by mottled (redoxymorphic features), mineral soil (F6, F8, F12, TF10, S5, S6) C Predominantly characterized by other, mineral soil (no mottling) D Gleyed mineral soil (F2, S4) E Soil ribbon < 1 inch F Soil ribbon ≥ 1 inch G No peat or muck presence H A peat or muck presence (A6, A7, A8, A9, A10, F1, S1) I Peat or muck soil (histosol or histic epipedon) (A1, A2, A3)
5. Discharge into Wetland – opportunity metric
Check a box in each column. Consider surface pollutants or discharges (Surf) and sub-surface pollutants or discharges (Sub). Examples of sub-surface discharges include presence of nearby septic tank, underground storage tank (UST), etc. Surf Sub A A Little or no evidence of pollutants or discharges entering the assessment area B B Noticeable evidence of pollutants or discharges entering the wetland and stressing, but not overwhelming the
treatment capacity of the assessment area C C Noticeable evidence of pollutants or discharges (pathogen, particulate, or soluble) entering the assessment area and potentially overwhelming the treatment capacity of the wetland (water discoloration, dead vegetation, excessive sedimentation)
6. Land Use – opportunity metric
Check all that apply. Evaluation of this metric involves a GIS effort with field adjustment. Consider sources draining to assessment area within entire upstream watershed (WS), within 5 miles and within the watershed draining to the assessment area (5M), and within 2 miles and within the watershed draining to the assessment area (2M). Effective riparian buffers are considered to be 50 feet wide in the Coastal Plain and Piedmont and 30 feet wide in the Mountains. WS 5M 2M A A A > 30% impervious surfaces with stormwater Best Management Practices (BMPs) (land use examples:
industrial, commercial, and high-density residential) B B B > 30% impervious surfaces without stormwater BMPs
C C C 10 to 30% impervious surfaces D D D < 10% impervious surfaces E E E Old urban development (pink areas on USGS 7.5-minute quadrangles) F F F New adjacent development G G G Confined animal operations (or other local, concentrated source of pollutants) H H H ≥ 20% coverage of pasture without riparian buffer I I I ≥ 20% coverage of pasture with effective riparian buffer J J J ≥ 20% coverage of agricultural land (regularly plowed land) without riparian buffer K K K ≥ 20% coverage of agricultural land (regularly plowed land) with effective riparian buffer L L L ≥ 20% coverage of maintained grass/herb M M M Silvicultural land with disturbance < 5 years old N N N Little or no opportunity. Lack of opportunity may result from hydrologic modifications that prevent drainage or
overbank flow from affecting the assessment area.
7. Wetland Acting as Vegetated Buffer – assessment area condition metric
Is the assessment area within 50 feet of a stream or other open water? (“open water” does not include man-made ditches or canals) Yes No If No, skip to next metric. Stream width (Stream width is normal flow width [ordinary high water to ordinary high water]). If the stream is anastomosed, combine widths of channels/braids for a total stream width. ≤ 15-feet wide > 15-feet wide Not Applicable Do roots of assessment area vegetation extend into the bank of the adjacent stream/open water? Yes No Is stream or other open water sheltered or exposed? Sheltered – adjacent open water with width < 2500 feet and no regular boat traffic.
Exposed – adjacent open water with width ≥ 2500 feet or regular boat traffic.
8. Wetland/Riparian Buffer Width – assessment area/wetland type/wetland complex metric
Check a box in each column. Select the appropriate width for the wetland type at the assessment area (WT), the wetland complex (WC), and the riparian buffer at the assessment area (RB) (if applicable). Riparian buffer width is measured from top of bank and need only be present on one side of the water body. The riparian buffer is measured from the outside banks of the outer channels of an anastomosed system. Make buffer judgment based on dominant landscape feature. Record a note if a portion of the buffer has been removed or disturbed. WT WC RB (if applicable) A A A ≥ 100 feet B B B From 80 to < 100 feet C C C From 50 to < 80 feet D D D From 40 to < 50 feet E E E From 30 to < 40 feet F F F From 15 to < 30 feet G G G From 5 to < 15 feet H H H < 5 feet
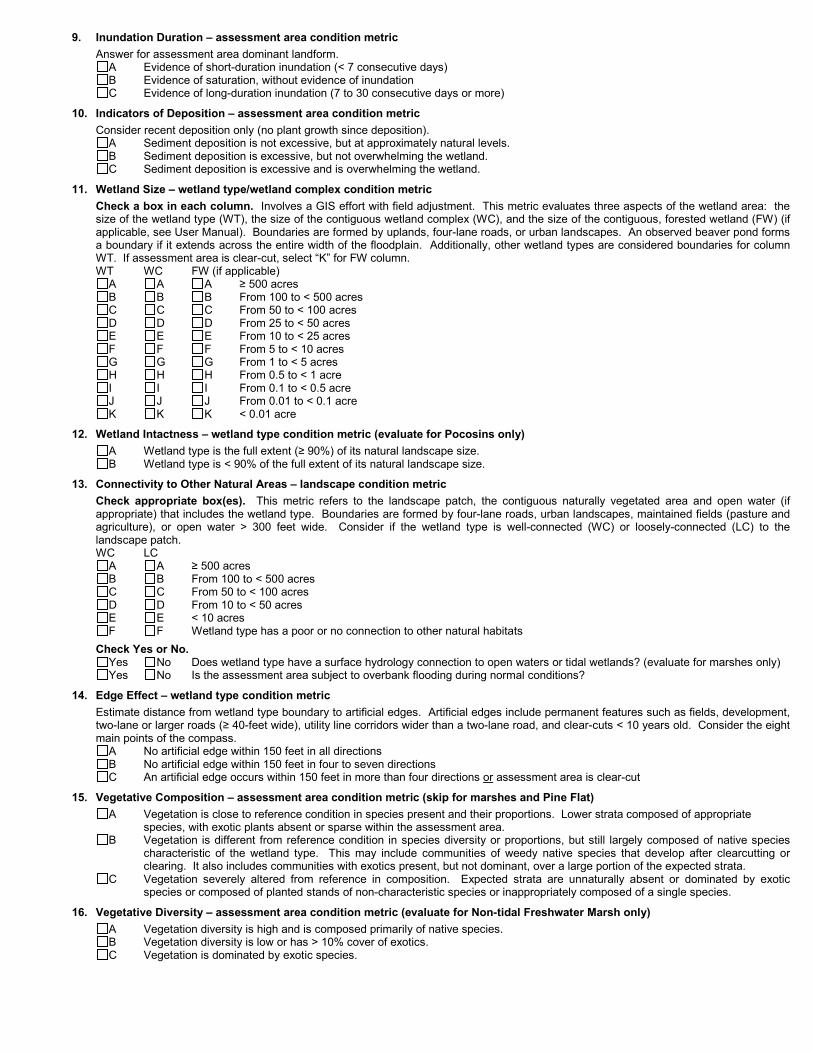
9. Inundation Duration – assessment area condition metric
Answer for assessment area dominant landform. A Evidence of short-duration inundation (< 7 consecutive days) B Evidence of saturation, without evidence of inundation C Evidence of long-duration inundation (7 to 30 consecutive days or more)
10. Indicators of Deposition – assessment area condition metric
Consider recent deposition only (no plant growth since deposition). A Sediment deposition is not excessive, but at approximately natural levels. B Sediment deposition is excessive, but not overwhelming the wetland. C Sediment deposition is excessive and is overwhelming the wetland.
11. Wetland Size – wetland type/wetland complex condition metric
Check a box in each column. Involves a GIS effort with field adjustment. This metric evaluates three aspects of the wetland area: the size of the wetland type (WT), the size of the contiguous wetland complex (WC), and the size of the contiguous, forested wetland (FW) (if applicable, see User Manual). Boundaries are formed by uplands, four-lane roads, or urban landscapes. An observed beaver pond forms a boundary if it extends across the entire width of the floodplain. Additionally, other wetland types are considered boundaries for column WT. If assessment area is clear-cut, select “K” for FW column. WT WC FW (if applicable) A A A ≥ 500 acres B B B From 100 to < 500 acres C C C From 50 to < 100 acres D D D From 25 to < 50 acres E E E From 10 to < 25 acres F F F From 5 to < 10 acres G G G From 1 to < 5 acres H H H From 0.5 to < 1 acre I I I From 0.1 to < 0.5 acre J J J From 0.01 to < 0.1 acre K K K < 0.01 acre
12. Wetland Intactness – wetland type condition metric (evaluate for Pocosins only)
A Wetland type is the full extent (≥ 90%) of its natural landscape size. B Wetland type is < 90% of the full extent of its natural landscape size.
13. Connectivity to Other Natural Areas – landscape condition metric
Check appropriate box(es). This metric refers to the landscape patch, the contiguous naturally vegetated area and open water (if appropriate) that includes the wetland type. Boundaries are formed by four-lane roads, urban landscapes, maintained fields (pasture and agriculture), or open water > 300 feet wide. Consider if the wetland type is well-connected (WC) or loosely-connected (LC) to the landscape patch.
WC LC A A ≥ 500 acres B B From 100 to < 500 acres C C From 50 to < 100 acres D D From 10 to < 50 acres E E < 10 acres F F Wetland type has a poor or no connection to other natural habitats
Check Yes or No. Yes No Does wetland type have a surface hydrology connection to open waters or tidal wetlands? (evaluate for marshes only) Yes No Is the assessment area subject to overbank flooding during normal conditions?
14. Edge Effect – wetland type condition metric
Estimate distance from wetland type boundary to artificial edges. Artificial edges include permanent features such as fields, development, two-lane or larger roads (≥ 40-feet wide), utility line corridors wider than a two-lane road, and clear-cuts < 10 years old. Consider the eight main points of the compass. A No artificial edge within 150 feet in all directions B No artificial edge within 150 feet in four to seven directions C An artificial edge occurs within 150 feet in more than four directions or assessment area is clear-cut
15. Vegetative Composition – assessment area condition metric (skip for marshes and Pine Flat)
A Vegetation is close to reference condition in species present and their proportions. Lower strata composed of appropriate species, with exotic plants absent or sparse within the assessment area.
B Vegetation is different from reference condition in species diversity or proportions, but still largely composed of native species characteristic of the wetland type. This may include communities of weedy native species that develop after clearcutting or clearing. It also includes communities with exotics present, but not dominant, over a large portion of the expected strata.
C Vegetation severely altered from reference in composition. Expected strata are unnaturally absent or dominated by exotic species or composed of planted stands of non-characteristic species or inappropriately composed of a single species.
16. Vegetative Diversity – assessment area condition metric (evaluate for Non-tidal Freshwater Marsh only)
A Vegetation diversity is high and is composed primarily of native species. B Vegetation diversity is low or has > 10% cover of exotics. C Vegetation is dominated by exotic species.
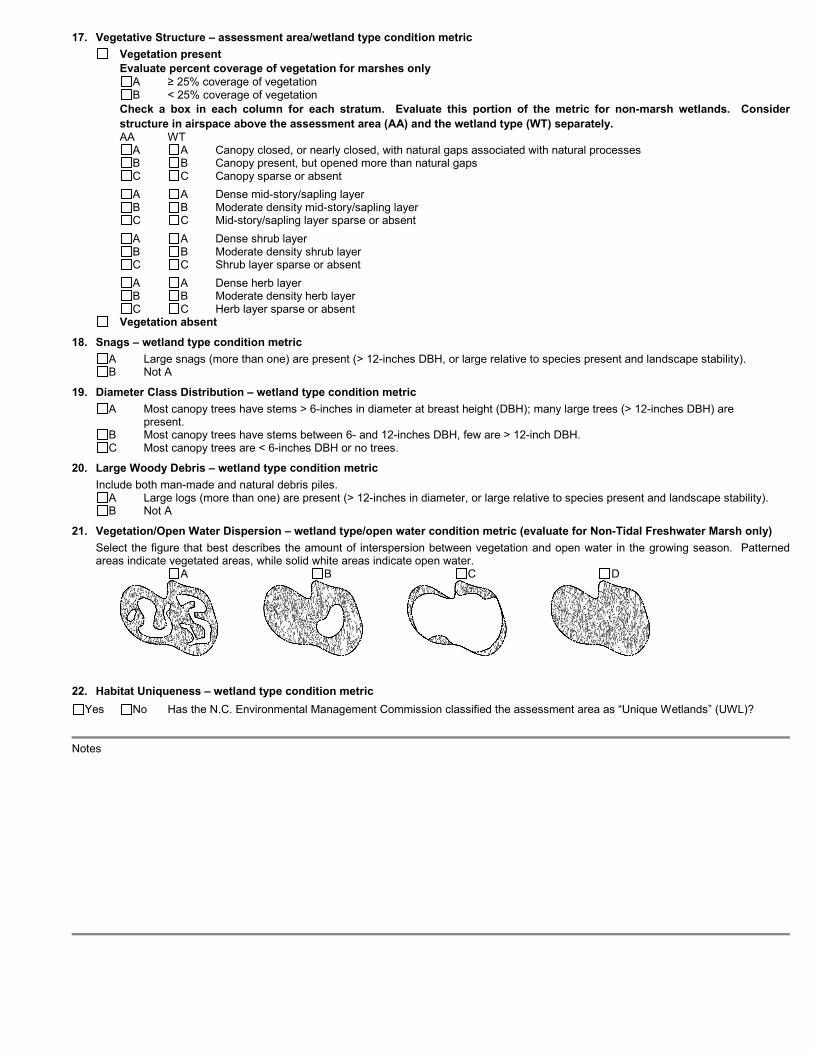
17. Vegetative Structure – assessment area/wetland type condition metric
Vegetation present
Evaluate percent coverage of vegetation for marshes only
A ≥ 25% coverage of vegetation B < 25% coverage of vegetation
Check a box in each column for each stratum. Evaluate this portion of the metric for non-marsh wetlands. Consider
structure in airspace above the assessment area (AA) and the wetland type (WT) separately. AA WT A A Canopy closed, or nearly closed, with natural gaps associated with natural processes B B Canopy present, but opened more than natural gaps C C Canopy sparse or absent
A A Dense mid-story/sapling layer B B Moderate density mid-story/sapling layer C C Mid-story/sapling layer sparse or absent
A A Dense shrub layer B B Moderate density shrub layer C C Shrub layer sparse or absent
A A Dense herb layer B B Moderate density herb layer C C Herb layer sparse or absent
Vegetation absent
18. Snags – wetland type condition metric
A Large snags (more than one) are present (> 12-inches DBH, or large relative to species present and landscape stability). B Not A
19. Diameter Class Distribution – wetland type condition metric
A Most canopy trees have stems > 6-inches in diameter at breast height (DBH); many large trees (> 12-inches DBH) are present.
B Most canopy trees have stems between 6- and 12-inches DBH, few are > 12-inch DBH. C Most canopy trees are < 6-inches DBH or no trees.
20. Large Woody Debris – wetland type condition metric
Include both man-made and natural debris piles. A Large logs (more than one) are present (> 12-inches in diameter, or large relative to species present and landscape stability). B Not A
21. Vegetation/Open Water Dispersion – wetland type/open water condition metric (evaluate for Non-Tidal Freshwater Marsh only)
Select the figure that best describes the amount of interspersion between vegetation and open water in the growing season. Patterned areas indicate vegetated areas, while solid white areas indicate open water.
A B C D
22. Habitat Uniqueness – wetland type condition metric
Yes No Has the N.C. Environmental Management Commission classified the assessment area as “Unique Wetlands” (UWL)?
Notes

32
Appendix D
NC WAM Wetland Rating Sheet
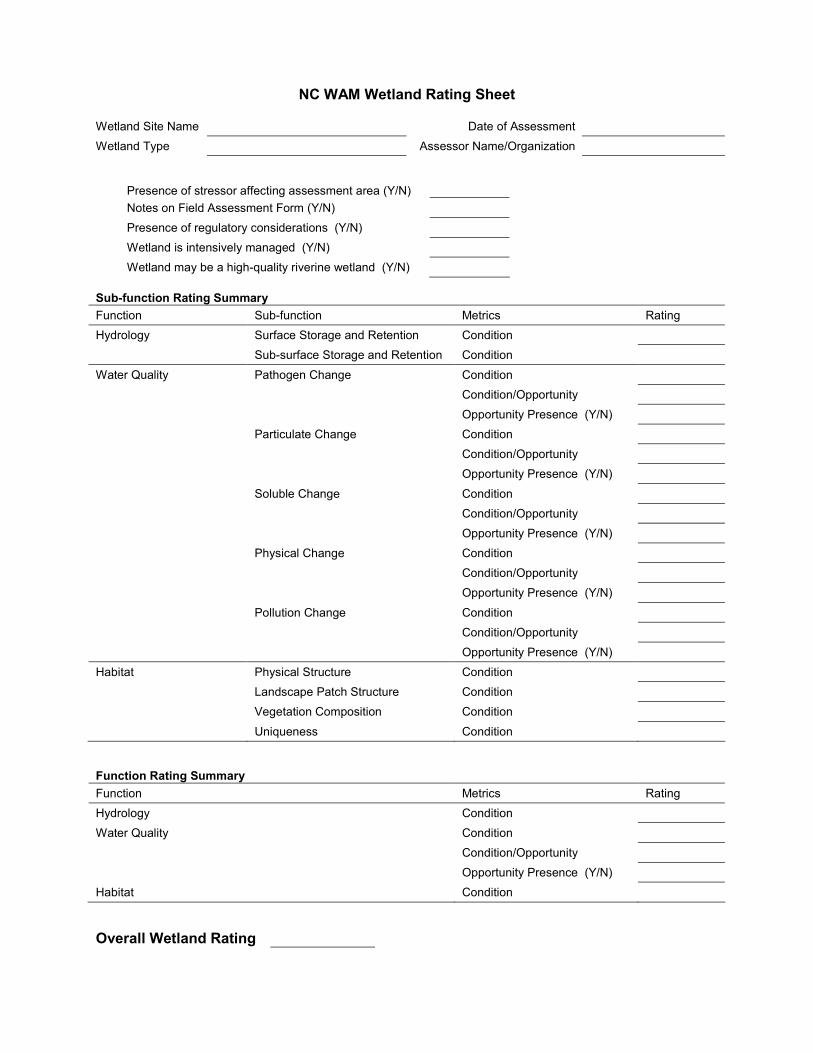
NC WAM Wetland Rating Sheet
Wetland Site Name Date of Assessment
Wetland Type Assessor Name/Organization
Presence of stressor affecting assessment area (Y/N)
Notes on Field Assessment Form (Y/N)
Presence of regulatory considerations (Y/N)
Wetland is intensively managed (Y/N)
Wetland may be a high-quality riverine wetland (Y/N)
Sub-function Rating Summary
Function Sub-function Metrics Rating
Hydrology Surface Storage and Retention Condition
Sub-surface Storage and Retention Condition
Water Quality Pathogen Change Condition
Condition/Opportunity
Opportunity Presence (Y/N)
Particulate Change Condition
Condition/Opportunity
Opportunity Presence (Y/N)
Soluble Change Condition
Condition/Opportunity
Opportunity Presence (Y/N)
Physical Change Condition
Condition/Opportunity
Opportunity Presence (Y/N)
Pollution Change Condition
Condition/Opportunity
Opportunity Presence (Y/N)
Habitat Physical Structure Condition
Landscape Patch Structure Condition
Vegetation Composition Condition
Uniqueness Condition
Function Rating Summary
Function Metrics Rating
Hydrology Condition
Water Quality Condition
Condition/Opportunity
Opportunity Presence (Y/N)
Habitat Condition
Overall Wetland Rating

33
Appendix E
Mitigation Site Descriptions and Photos
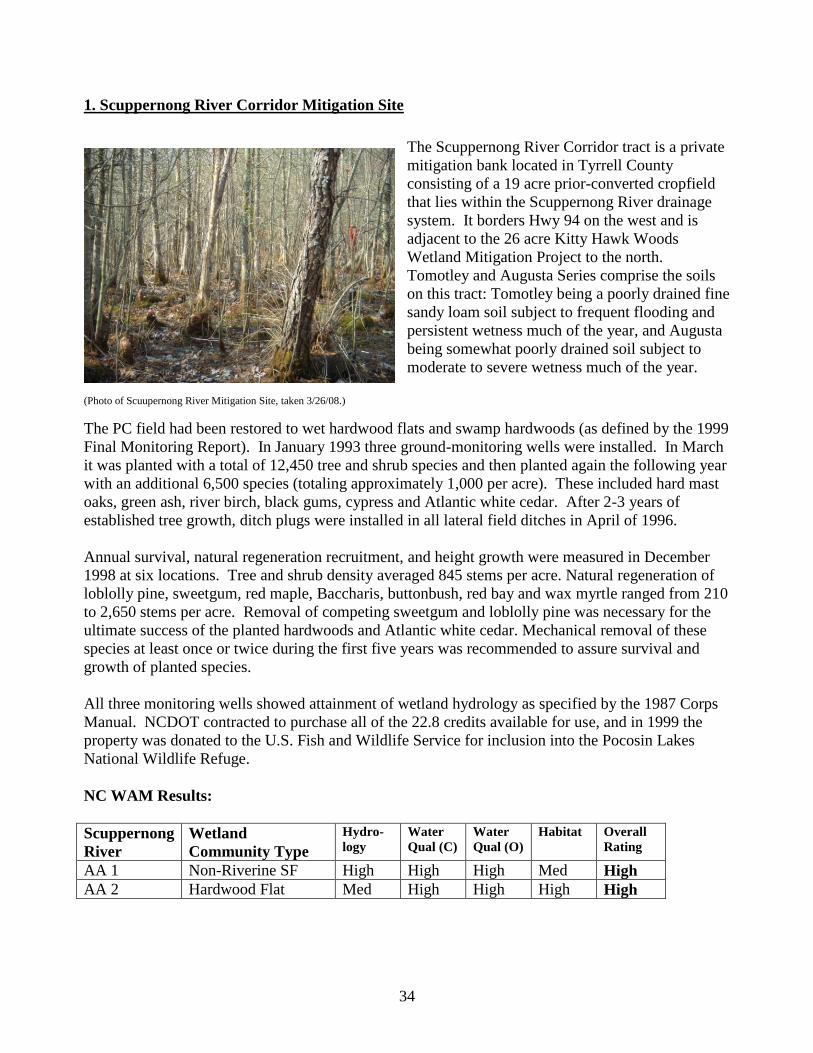
34
1. Scuppernong River Corridor Mitigation Site
The Scuppernong River Corridor tract is a private
mitigation bank located in Tyrrell County
consisting of a 19 acre prior-converted cropfield
that lies within the Scuppernong River drainage
system. It borders Hwy 94 on the west and is
adjacent to the 26 acre Kitty Hawk Woods
Wetland Mitigation Project to the north.
Tomotley and Augusta Series comprise the soils
on this tract: Tomotley being a poorly drained fine
sandy loam soil subject to frequent flooding and
persistent wetness much of the year, and Augusta
being somewhat poorly drained soil subject to
moderate to severe wetness much of the year.
(Photo of Scuupernong River Mitigation Site, taken 3/26/08.)
The PC field had been restored to wet hardwood flats and swamp hardwoods (as defined by the 1999
Final Monitoring Report). In January 1993 three ground-monitoring wells were installed. In March
it was planted with a total of 12,450 tree and shrub species and then planted again the following year
with an additional 6,500 species (totaling approximately 1,000 per acre). These included hard mast
oaks, green ash, river birch, black gums, cypress and Atlantic white cedar. After 2-3 years of
established tree growth, ditch plugs were installed in all lateral field ditches in April of 1996.
Annual survival, natural regeneration recruitment, and height growth were measured in December
1998 at six locations. Tree and shrub density averaged 845 stems per acre. Natural regeneration of
loblolly pine, sweetgum, red maple, Baccharis, buttonbush, red bay and wax myrtle ranged from 210
to 2,650 stems per acre. Removal of competing sweetgum and loblolly pine was necessary for the
ultimate success of the planted hardwoods and Atlantic white cedar. Mechanical removal of these
species at least once or twice during the first five years was recommended to assure survival and
growth of planted species.
All three monitoring wells showed attainment of wetland hydrology as specified by the 1987 Corps
Manual. NCDOT contracted to purchase all of the 22.8 credits available for use, and in 1999 the
property was donated to the U.S. Fish and Wildlife Service for inclusion into the Pocosin Lakes
National Wildlife Refuge.
NC WAM Results:
Scuppernong
River
Wetland
Community Type
Hydro-
logy
Water
Qual (C)
Water
Qual (O)
Habitat Overall
Rating
AA 1 Non-Riverine SF High High High Med High
AA 2 Hardwood Flat Med High High High High
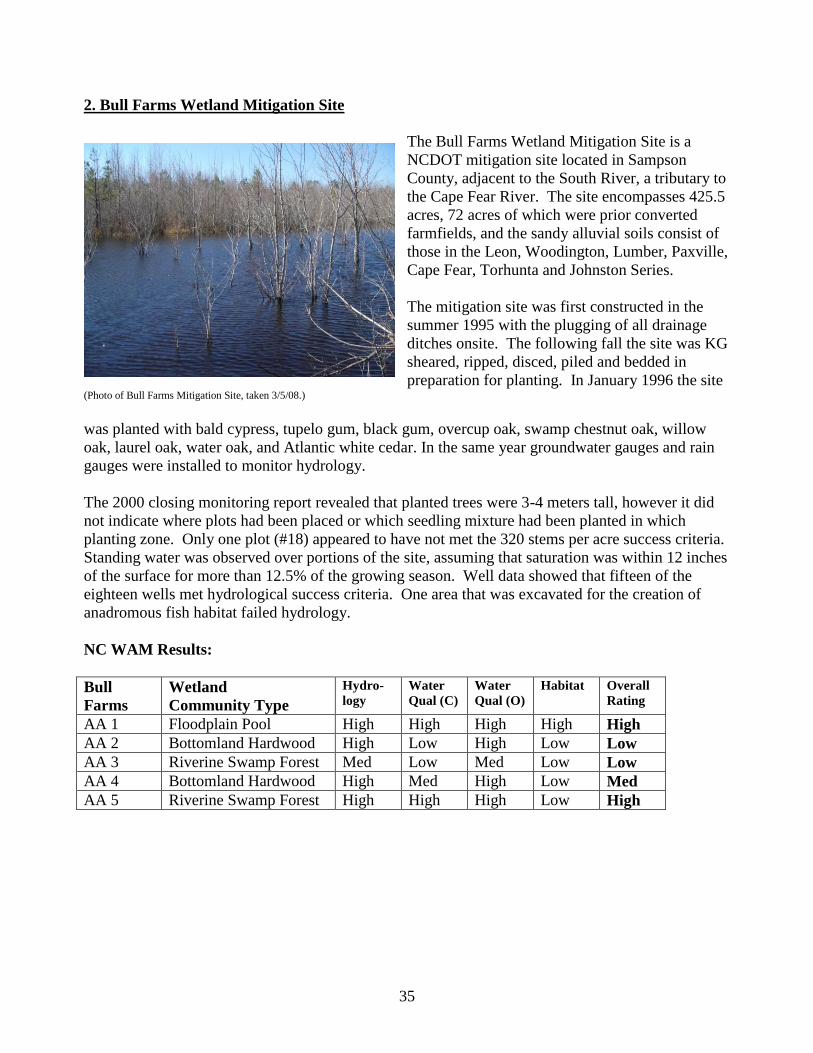
35
2. Bull Farms Wetland Mitigation Site
The Bull Farms Wetland Mitigation Site is a
NCDOT mitigation site located in Sampson
County, adjacent to the South River, a tributary to
the Cape Fear River. The site encompasses 425.5
acres, 72 acres of which were prior converted
farmfields, and the sandy alluvial soils consist of
those in the Leon, Woodington, Lumber, Paxville,
Cape Fear, Torhunta and Johnston Series.
The mitigation site was first constructed in the
summer 1995 with the plugging of all drainage
ditches onsite. The following fall the site was KG
sheared, ripped, disced, piled and bedded in
preparation for planting. In January 1996 the site (Photo of Bull Farms Mitigation Site, taken 3/5/08.)
was planted with bald cypress, tupelo gum, black gum, overcup oak, swamp chestnut oak, willow
oak, laurel oak, water oak, and Atlantic white cedar. In the same year groundwater gauges and rain
gauges were installed to monitor hydrology.
The 2000 closing monitoring report revealed that planted trees were 3-4 meters tall, however it did
not indicate where plots had been placed or which seedling mixture had been planted in which
planting zone. Only one plot (#18) appeared to have not met the 320 stems per acre success criteria.
Standing water was observed over portions of the site, assuming that saturation was within 12 inches
of the surface for more than 12.5% of the growing season. Well data showed that fifteen of the
eighteen wells met hydrological success criteria. One area that was excavated for the creation of
anadromous fish habitat failed hydrology.
NC WAM Results:
Bull
Farms
Wetland
Community Type
Hydro-
logy
Water
Qual (C)
Water
Qual (O)
Habitat Overall
Rating
AA 1 Floodplain Pool High High High High High
AA 2 Bottomland Hardwood High Low High Low Low
AA 3 Riverine Swamp Forest Med Low Med Low Low
AA 4 Bottomland Hardwood High Med High Low Med
AA 5 Riverine Swamp Forest High High High Low High
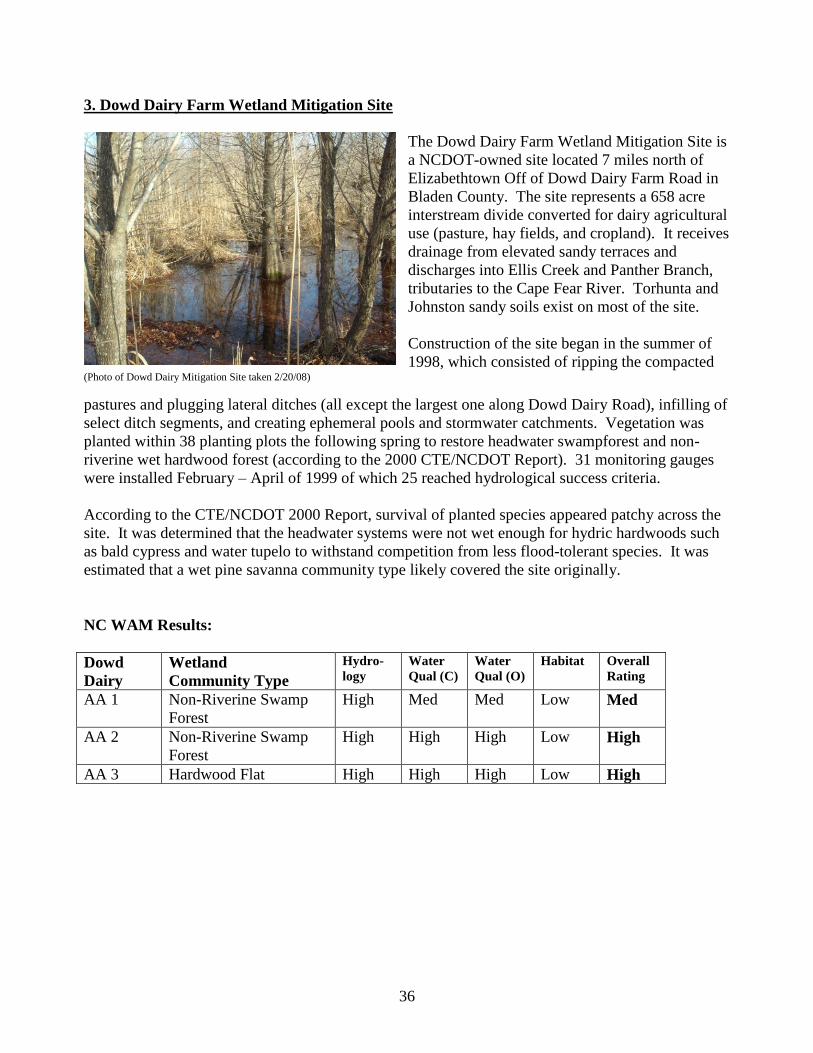
36
3. Dowd Dairy Farm Wetland Mitigation Site
The Dowd Dairy Farm Wetland Mitigation Site is
a NCDOT-owned site located 7 miles north of
Elizabethtown Off of Dowd Dairy Farm Road in
Bladen County. The site represents a 658 acre
interstream divide converted for dairy agricultural
use (pasture, hay fields, and cropland). It receives
drainage from elevated sandy terraces and
discharges into Ellis Creek and Panther Branch,
tributaries to the Cape Fear River. Torhunta and
Johnston sandy soils exist on most of the site.
Construction of the site began in the summer of
1998, which consisted of ripping the compacted (Photo of Dowd Dairy Mitigation Site taken 2/20/08)
pastures and plugging lateral ditches (all except the largest one along Dowd Dairy Road), infilling of
select ditch segments, and creating ephemeral pools and stormwater catchments. Vegetation was
planted within 38 planting plots the following spring to restore headwater swampforest and non-
riverine wet hardwood forest (according to the 2000 CTE/NCDOT Report). 31 monitoring gauges
were installed February – April of 1999 of which 25 reached hydrological success criteria.
According to the CTE/NCDOT 2000 Report, survival of planted species appeared patchy across the
site. It was determined that the headwater systems were not wet enough for hydric hardwoods such
as bald cypress and water tupelo to withstand competition from less flood-tolerant species. It was
estimated that a wet pine savanna community type likely covered the site originally.
NC WAM Results:
Dowd
Dairy
Wetland
Community Type
Hydro-
logy
Water
Qual (C)
Water
Qual (O)
Habitat Overall
Rating
AA 1 Non-Riverine Swamp
Forest
High Med Med Low Med
AA 2 Non-Riverine Swamp
Forest
High High High Low High
AA 3 Hardwood Flat High High High Low High
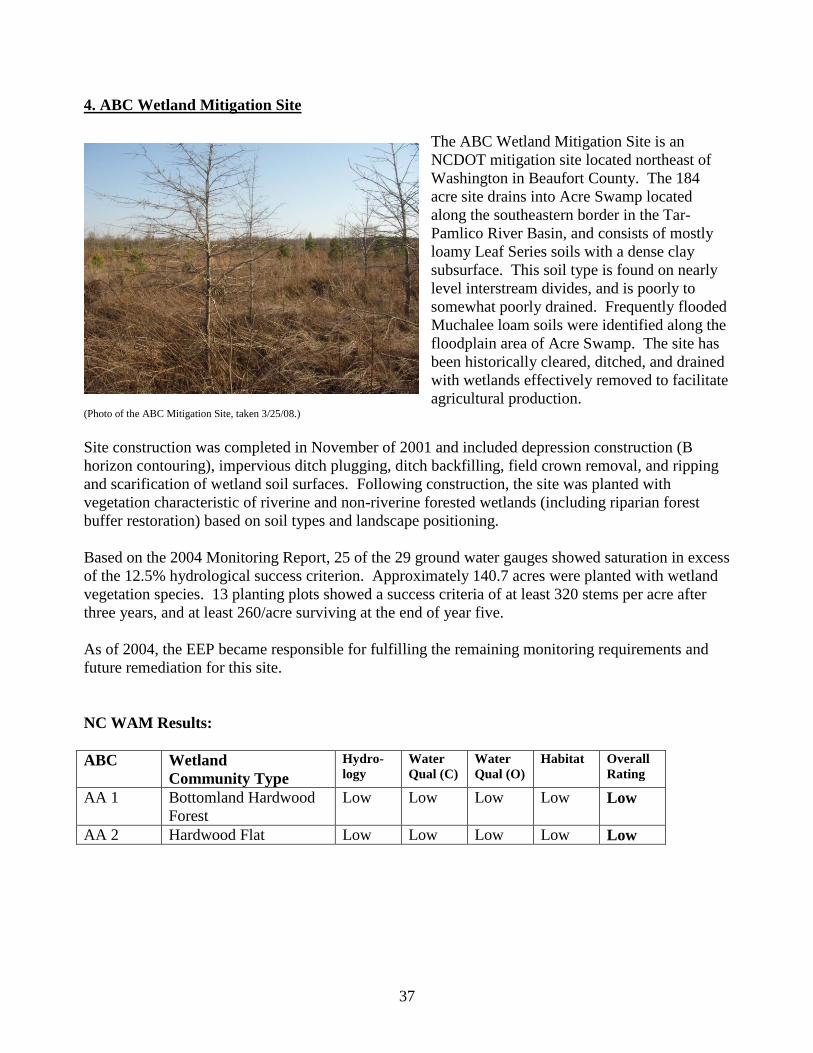
37
4. ABC Wetland Mitigation Site
The ABC Wetland Mitigation Site is an
NCDOT mitigation site located northeast of
Washington in Beaufort County. The 184
acre site drains into Acre Swamp located
along the southeastern border in the Tar-
Pamlico River Basin, and consists of mostly
loamy Leaf Series soils with a dense clay
subsurface. This soil type is found on nearly
level interstream divides, and is poorly to
somewhat poorly drained. Frequently flooded
Muchalee loam soils were identified along the
floodplain area of Acre Swamp. The site has
been historically cleared, ditched, and drained
with wetlands effectively removed to facilitate
agricultural production. (Photo of the ABC Mitigation Site, taken 3/25/08.)
Site construction was completed in November of 2001 and included depression construction (B
horizon contouring), impervious ditch plugging, ditch backfilling, field crown removal, and ripping
and scarification of wetland soil surfaces. Following construction, the site was planted with
vegetation characteristic of riverine and non-riverine forested wetlands (including riparian forest
buffer restoration) based on soil types and landscape positioning.
Based on the 2004 Monitoring Report, 25 of the 29 ground water gauges showed saturation in excess
of the 12.5% hydrological success criterion. Approximately 140.7 acres were planted with wetland
vegetation species. 13 planting plots showed a success criteria of at least 320 stems per acre after
three years, and at least 260/acre surviving at the end of year five.
As of 2004, the EEP became responsible for fulfilling the remaining monitoring requirements and
future remediation for this site.
NC WAM Results:
ABC Wetland
Community Type
Hydro-
logy
Water
Qual (C)
Water
Qual (O)
Habitat Overall
Rating
AA 1 Bottomland Hardwood
Forest
Low Low Low Low Low
AA 2 Hardwood Flat Low Low Low Low Low
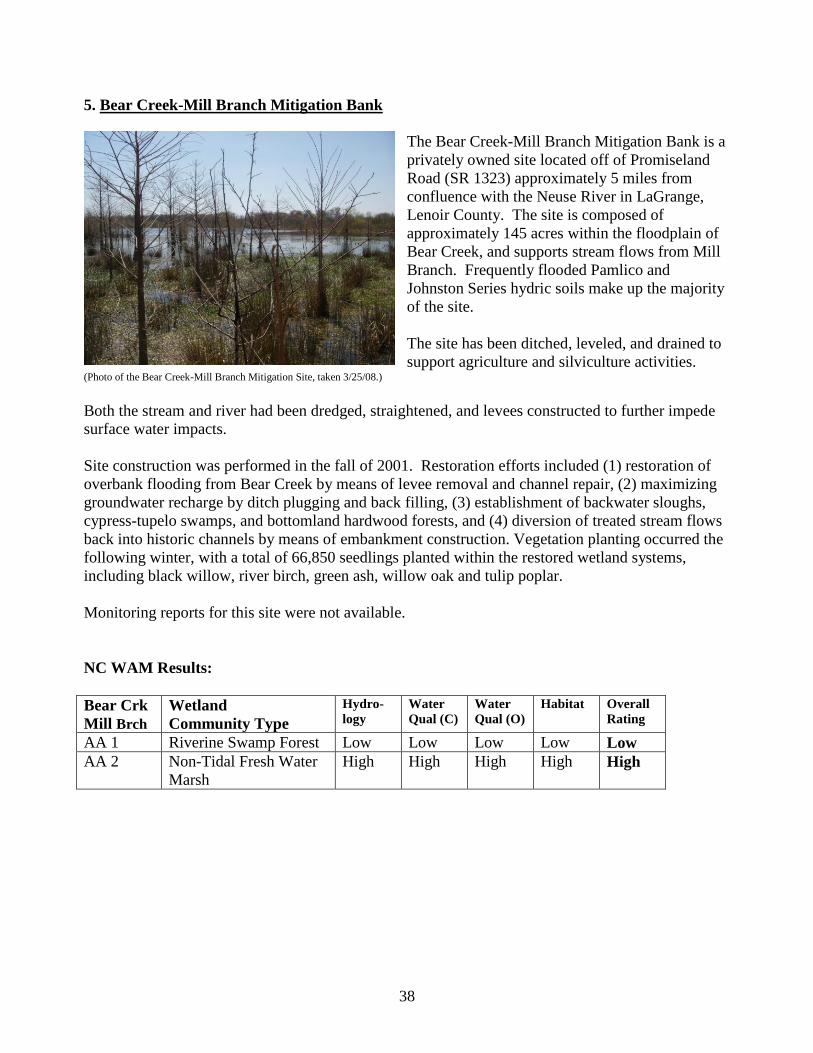
38
5. Bear Creek-Mill Branch Mitigation Bank
The Bear Creek-Mill Branch Mitigation Bank is a
privately owned site located off of Promiseland
Road (SR 1323) approximately 5 miles from
confluence with the Neuse River in LaGrange,
Lenoir County. The site is composed of
approximately 145 acres within the floodplain of
Bear Creek, and supports stream flows from Mill
Branch. Frequently flooded Pamlico and
Johnston Series hydric soils make up the majority
of the site.
The site has been ditched, leveled, and drained to
support agriculture and silviculture activities. (Photo of the Bear Creek-Mill Branch Mitigation Site, taken 3/25/08.)
Both the stream and river had been dredged, straightened, and levees constructed to further impede
surface water impacts.
Site construction was performed in the fall of 2001. Restoration efforts included (1) restoration of
overbank flooding from Bear Creek by means of levee removal and channel repair, (2) maximizing
groundwater recharge by ditch plugging and back filling, (3) establishment of backwater sloughs,
cypress-tupelo swamps, and bottomland hardwood forests, and (4) diversion of treated stream flows
back into historic channels by means of embankment construction. Vegetation planting occurred the
following winter, with a total of 66,850 seedlings planted within the restored wetland systems,
including black willow, river birch, green ash, willow oak and tulip poplar.
Monitoring reports for this site were not available.
NC WAM Results:
Bear Crk
Mill Brch
Wetland
Community Type
Hydro-
logy
Water
Qual (C)
Water
Qual (O)
Habitat Overall
Rating
AA 1 Riverine Swamp Forest Low Low Low Low Low
AA 2 Non-Tidal Fresh Water
Marsh
High High High High High
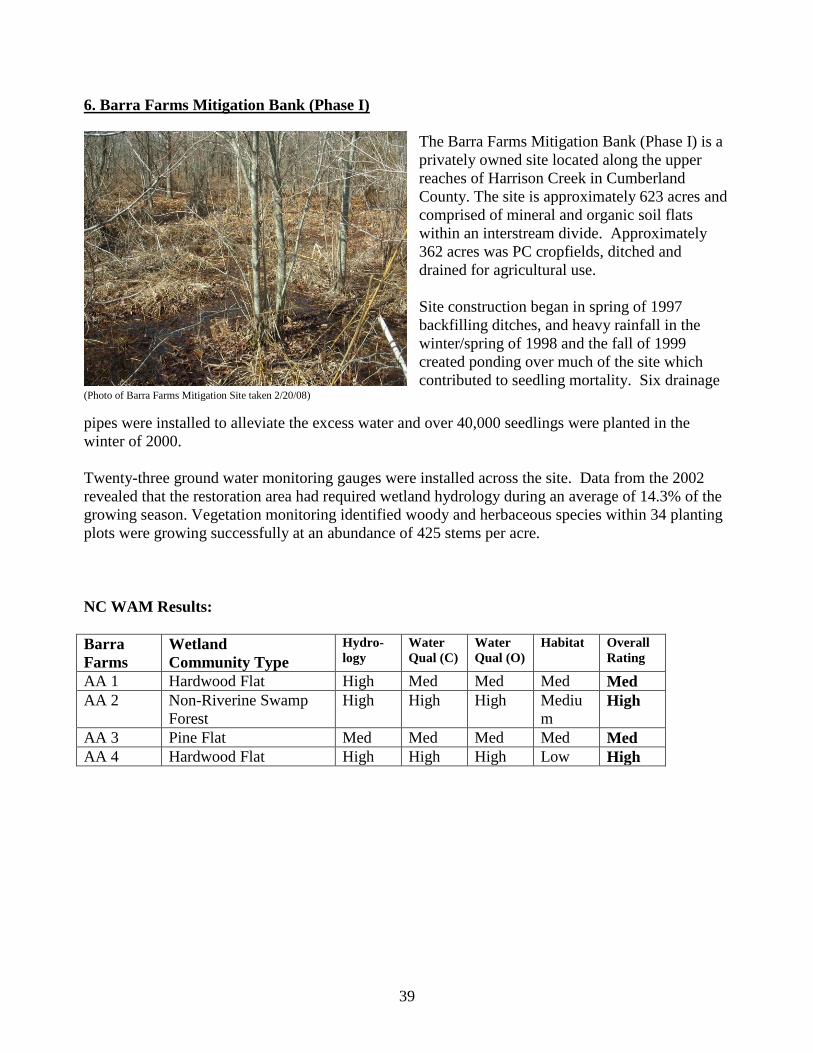
39
6. Barra Farms Mitigation Bank (Phase I)
The Barra Farms Mitigation Bank (Phase I) is a
privately owned site located along the upper
reaches of Harrison Creek in Cumberland
County. The site is approximately 623 acres and
comprised of mineral and organic soil flats
within an interstream divide. Approximately
362 acres was PC cropfields, ditched and
drained for agricultural use.
Site construction began in spring of 1997
backfilling ditches, and heavy rainfall in the
winter/spring of 1998 and the fall of 1999
created ponding over much of the site which
contributed to seedling mortality. Six drainage (Photo of Barra Farms Mitigation Site taken 2/20/08)
pipes were installed to alleviate the excess water and over 40,000 seedlings were planted in the
winter of 2000.
Twenty-three ground water monitoring gauges were installed across the site. Data from the 2002
revealed that the restoration area had required wetland hydrology during an average of 14.3% of the
growing season. Vegetation monitoring identified woody and herbaceous species within 34 planting
plots were growing successfully at an abundance of 425 stems per acre.
NC WAM Results:
Barra
Farms
Wetland
Community Type
Hydro-
logy
Water
Qual (C)
Water
Qual (O)
Habitat Overall
Rating
AA 1 Hardwood Flat High Med Med Med Med
AA 2 Non-Riverine Swamp
Forest
High High High Mediu
m High
AA 3 Pine Flat Med Med Med Med Med
AA 4 Hardwood Flat High High High Low High
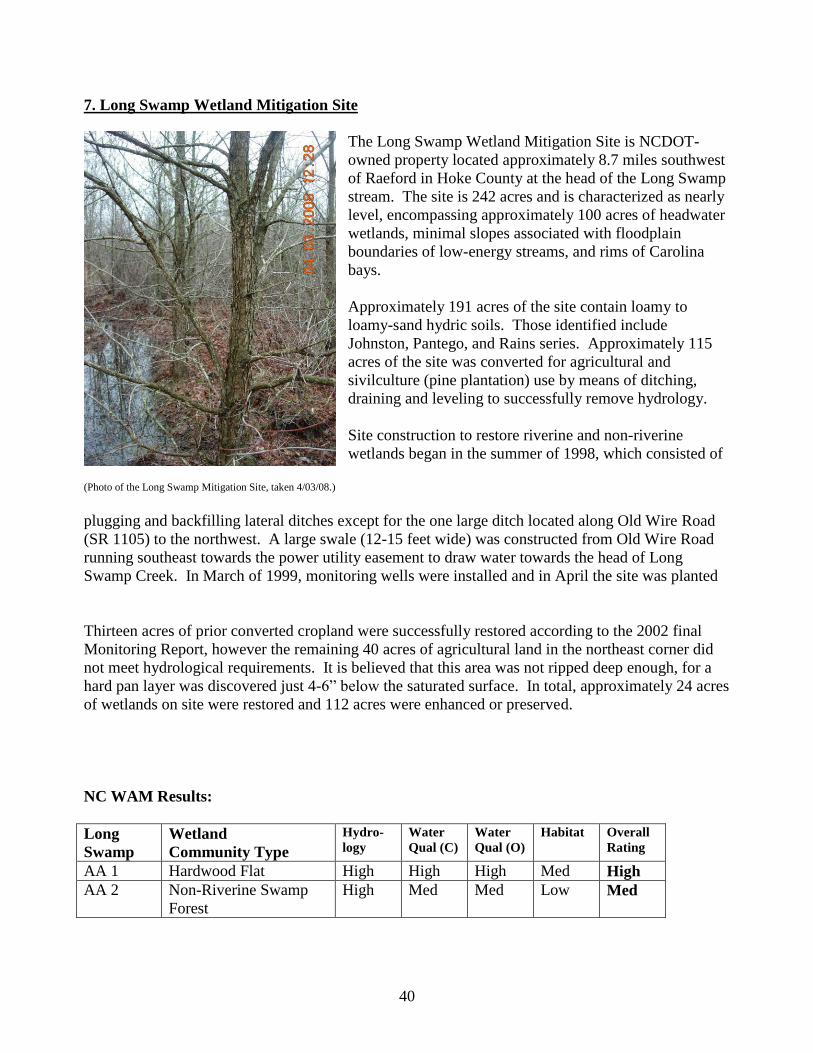
40
7. Long Swamp Wetland Mitigation Site
The Long Swamp Wetland Mitigation Site is NCDOT-
owned property located approximately 8.7 miles southwest
of Raeford in Hoke County at the head of the Long Swamp
stream. The site is 242 acres and is characterized as nearly
level, encompassing approximately 100 acres of headwater
wetlands, minimal slopes associated with floodplain
boundaries of low-energy streams, and rims of Carolina
bays.
Approximately 191 acres of the site contain loamy to
loamy-sand hydric soils. Those identified include
Johnston, Pantego, and Rains series. Approximately 115
acres of the site was converted for agricultural and
sivilculture (pine plantation) use by means of ditching,
draining and leveling to successfully remove hydrology.
Site construction to restore riverine and non-riverine
wetlands began in the summer of 1998, which consisted of
(Photo of the Long Swamp Mitigation Site, taken 4/03/08.)
plugging and backfilling lateral ditches except for the one large ditch located along Old Wire Road
(SR 1105) to the northwest. A large swale (12-15 feet wide) was constructed from Old Wire Road
running southeast towards the power utility easement to draw water towards the head of Long
Swamp Creek. In March of 1999, monitoring wells were installed and in April the site was planted
Thirteen acres of prior converted cropland were successfully restored according to the 2002 final
Monitoring Report, however the remaining 40 acres of agricultural land in the northeast corner did
not meet hydrological requirements. It is believed that this area was not ripped deep enough, for a
hard pan layer was discovered just 4-6” below the saturated surface. In total, approximately 24 acres
of wetlands on site were restored and 112 acres were enhanced or preserved.
NC WAM Results:
Long
Swamp
Wetland
Community Type
Hydro-
logy
Water
Qual (C)
Water
Qual (O)
Habitat Overall
Rating
AA 1 Hardwood Flat High High High Med High
AA 2 Non-Riverine Swamp
Forest
High Med Med Low Med

41
8. Gurley Tract Mitigation Site
The Gurley Tract Mitigation Site is a NCDOT-
owned site located on SR 1058, 8 miles
northwest of Snow Hill in Greene County. The
site is approximately 179 acres, 27 of which was
prior-converted agricultural land. Loamy hydric
soils of the Lumbee and Paxville Series comprise
most of this area. The majority of the site drains
into Beaver Branch which flows south through
the center of the property (except that it has been
impounded by beaver), and is bordered by
Nahunta Swamp to the south.
Nahunta Swamp was historically straightened (Photo of Gurley Mitigation Site taken 3/27/08)
and channelized, with a large levee on the north bank created from the spoil material. Drainage
ditches were installed to covert the area for agriculture and timber harvesting.
The site was constructed in December of 1997. Twenty-five-foot breaks were created every 250 feet
along Nahunta Swamp to increase overbank flooding on the site, and the spoil was used to plug ditch
outlets. Scarification of top 12-18 inches of the PC fields to increase permeability rates and surface
storage capacity was also conducted.
In the winter of 1998, non-riverine wet hardwood forest species (swamp chestnut oak, laurel oak,
water oak, willow oak tulip tree, American sycamore, and American beech) were planted on the PC
section of the site. Vegetation monitoring in 2003 yielded an average tree density of 486 trees per
acre, well above the minimum success criterion of 320 trees per acre.
Sixteen groundwater, three surface water, and one rain gauge were installed on the Gurley Tract to
monitor site hydrology. The 2003 monitoring report concluded that hydrology was successful within
the PC areas.
NC WAM Results:
Gurley
Tract
Wetland
Community Type
Hydro-
logy
Water
Qual (C)
Water
Qual (O)
Habitat Overall
Rating
AA 1 Hardwood Flat High High High Med High
AA 2 Bottomland hardwood
Forest
High High High Med High
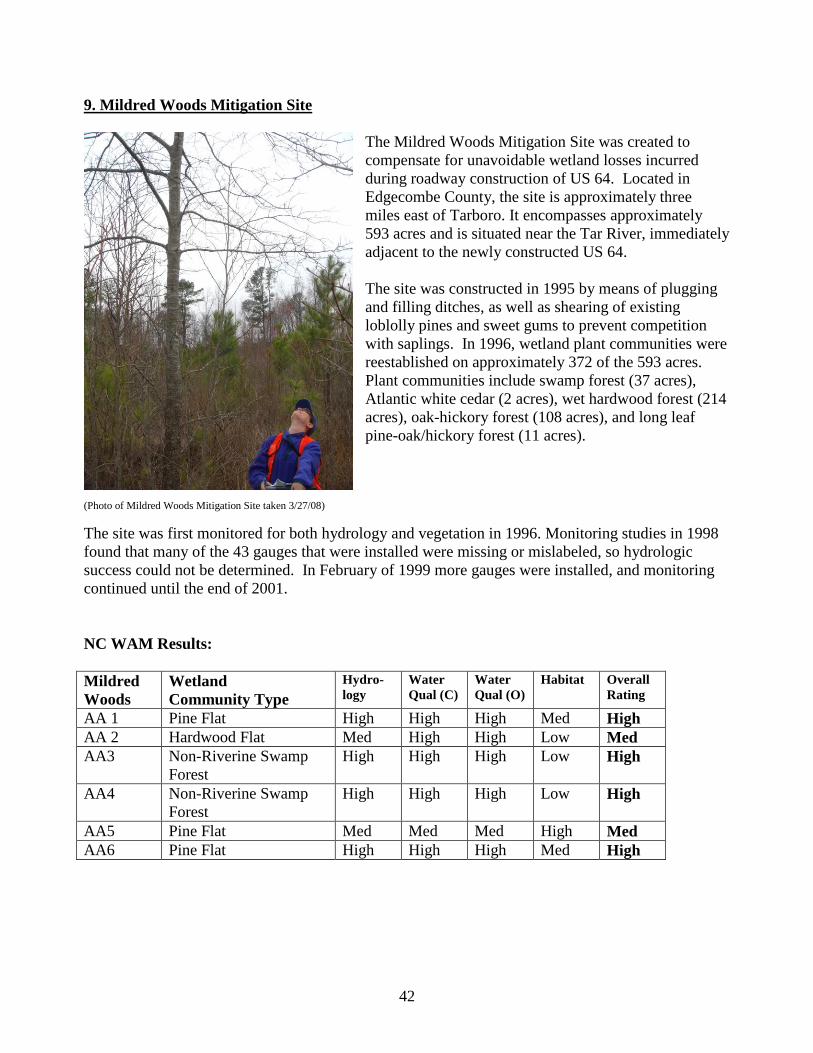
42
9. Mildred Woods Mitigation Site
The Mildred Woods Mitigation Site was created to
compensate for unavoidable wetland losses incurred
during roadway construction of US 64. Located in
Edgecombe County, the site is approximately three
miles east of Tarboro. It encompasses approximately
593 acres and is situated near the Tar River, immediately
adjacent to the newly constructed US 64.
The site was constructed in 1995 by means of plugging
and filling ditches, as well as shearing of existing
loblolly pines and sweet gums to prevent competition
with saplings. In 1996, wetland plant communities were
reestablished on approximately 372 of the 593 acres.
Plant communities include swamp forest (37 acres),
Atlantic white cedar (2 acres), wet hardwood forest (214
acres), oak-hickory forest (108 acres), and long leaf
pine-oak/hickory forest (11 acres).
(Photo of Mildred Woods Mitigation Site taken 3/27/08)
The site was first monitored for both hydrology and vegetation in 1996. Monitoring studies in 1998
found that many of the 43 gauges that were installed were missing or mislabeled, so hydrologic
success could not be determined. In February of 1999 more gauges were installed, and monitoring
continued until the end of 2001.
NC WAM Results:
Mildred
Woods
Wetland
Community Type
Hydro-
logy
Water
Qual (C)
Water
Qual (O)
Habitat Overall
Rating
AA 1 Pine Flat High High High Med High
AA 2 Hardwood Flat Med High High Low Med
AA3 Non-Riverine Swamp
Forest
High High High Low High
AA4 Non-Riverine Swamp
Forest
High High High Low High
AA5 Pine Flat Med Med Med High Med
AA6 Pine Flat High High High Med High
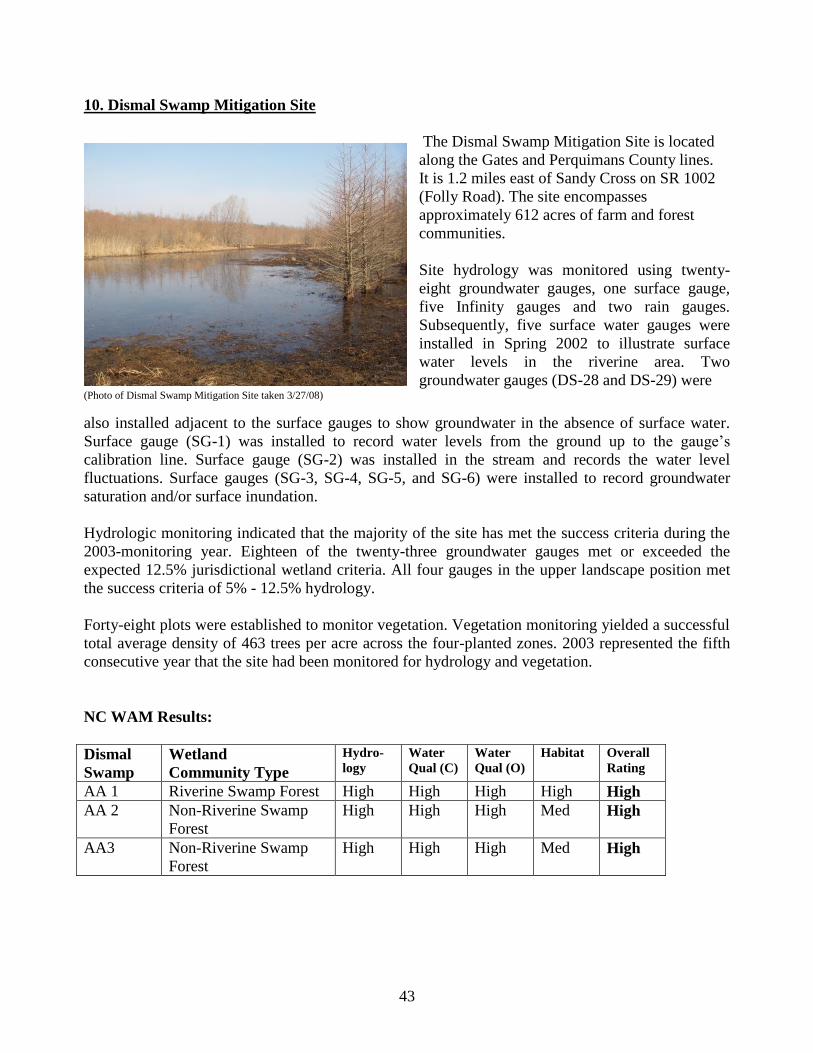
43
10. Dismal Swamp Mitigation Site
The Dismal Swamp Mitigation Site is located
along the Gates and Perquimans County lines.
It is 1.2 miles east of Sandy Cross on SR 1002
(Folly Road). The site encompasses
approximately 612 acres of farm and forest
communities.
Site hydrology was monitored using twenty-
eight groundwater gauges, one surface gauge,
five Infinity gauges and two rain gauges.
Subsequently, five surface water gauges were
installed in Spring 2002 to illustrate surface
water levels in the riverine area. Two
groundwater gauges (DS-28 and DS-29) were (Photo of Dismal Swamp Mitigation Site taken 3/27/08)
also installed adjacent to the surface gauges to show groundwater in the absence of surface water.
Surface gauge (SG-1) was installed to record water levels from the ground up to the gauge’s
calibration line. Surface gauge (SG-2) was installed in the stream and records the water level
fluctuations. Surface gauges (SG-3, SG-4, SG-5, and SG-6) were installed to record groundwater
saturation and/or surface inundation.
Hydrologic monitoring indicated that the majority of the site has met the success criteria during the
2003-monitoring year. Eighteen of the twenty-three groundwater gauges met or exceeded the
expected 12.5% jurisdictional wetland criteria. All four gauges in the upper landscape position met
the success criteria of 5% - 12.5% hydrology.
Forty-eight plots were established to monitor vegetation. Vegetation monitoring yielded a successful
total average density of 463 trees per acre across the four-planted zones. 2003 represented the fifth
consecutive year that the site had been monitored for hydrology and vegetation.
NC WAM Results:
Dismal
Swamp
Wetland
Community Type
Hydro-
logy
Water
Qual (C)
Water
Qual (O)
Habitat Overall
Rating
AA 1 Riverine Swamp Forest High High High High High
AA 2 Non-Riverine Swamp
Forest
High High High Med High
AA3 Non-Riverine Swamp
Forest
High High High Med High
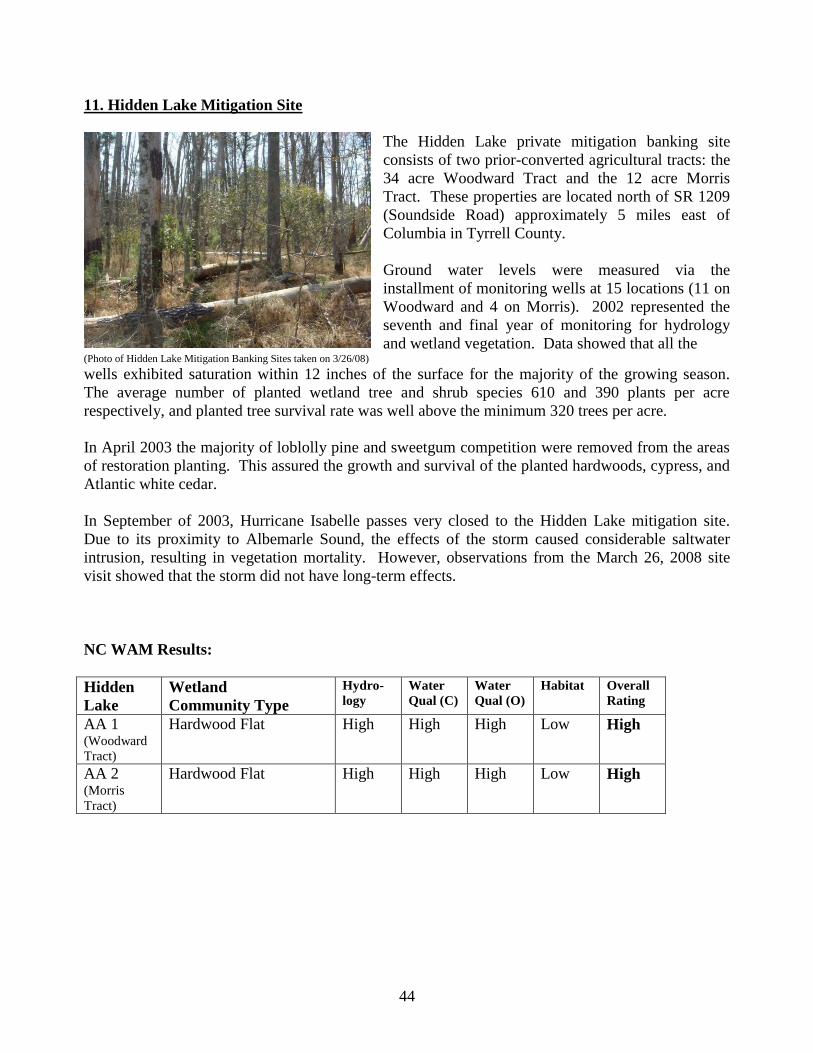
44
11. Hidden Lake Mitigation Site
The Hidden Lake private mitigation banking site
consists of two prior-converted agricultural tracts: the
34 acre Woodward Tract and the 12 acre Morris
Tract. These properties are located north of SR 1209
(Soundside Road) approximately 5 miles east of
Columbia in Tyrrell County.
Ground water levels were measured via the
installment of monitoring wells at 15 locations (11 on
Woodward and 4 on Morris). 2002 represented the
seventh and final year of monitoring for hydrology
and wetland vegetation. Data showed that all the (Photo of Hidden Lake Mitigation Banking Sites taken on 3/26/08)
wells exhibited saturation within 12 inches of the surface for the majority of the growing season.
The average number of planted wetland tree and shrub species 610 and 390 plants per acre
respectively, and planted tree survival rate was well above the minimum 320 trees per acre.
In April 2003 the majority of loblolly pine and sweetgum competition were removed from the areas
of restoration planting. This assured the growth and survival of the planted hardwoods, cypress, and
Atlantic white cedar.
In September of 2003, Hurricane Isabelle passes very closed to the Hidden Lake mitigation site.
Due to its proximity to Albemarle Sound, the effects of the storm caused considerable saltwater
intrusion, resulting in vegetation mortality. However, observations from the March 26, 2008 site
visit showed that the storm did not have long-term effects.
NC WAM Results:
Hidden
Lake
Wetland
Community Type
Hydro-
logy
Water
Qual (C)
Water
Qual (O)
Habitat Overall
Rating
AA 1 (Woodward
Tract)
Hardwood Flat High High High Low High
AA 2 (Morris
Tract)
Hardwood Flat High High High Low High

45
12. Haws Run Mitigation Site
Haws Run Mitigation Site was purchased by the
NC Department of Transportation in 1995 to
provide compensatory mitigation for impacts to
wetlands resulting from the construction of the
Jacksonville Bypass (U-2107). The site is located
approximately 28 miles northeast of Wilmington,
straddling the Pender-Onslow County line. The
595 acre site consists of riverine swampforests on
the northern and southern ends (the north
boundary being Sandy Run Swamp, and the south
being Shelter Swamp), and an interior of former
wet pine flats and savannas containing poorly-
drained clay-rich Torhunta and Grifton soils. (Photo of Haws Run Mitigation Site taken 2/27/08)
Records show that the Haws Run site remained largely unaltered until 1972. In the mid 70s bald
cypress were harvested from the site and the flat area was converted for bison pasture. Conversion
was done through clear-cutting, stumping, chisel-plowing, and extensive ditching. Approximately
900 tons of lime (2 tons/acre) was applied to the acidic soil to increase the pH. The bison operation
lasted about ten years.
The central canal and lateral ditches north of the power line easement were plugged to restore
hydrology in December 1997, and full site construction began in the summer of 1998. Fill was
removed from the roadcrossings and causeways to restore 8 acres of swamp forest. This material was
used to fill the central canal and lateral field ditches to the north of the powerline easement. The
south end ditch could not be filled due to the presence of critical rare species habitat and four listed
federal species of concern. The perimeter ditch also could not be filled as it would flood the
adjacent property.
Additional site construction included the excavation of 33 acres of topsoil (0.5 – 2.0m) to create
supplementary floodplain along Sandy Creek to the north. This area was planted with Bottomland
Hardwood tree species (Taxodium distichum, Nyssa biflora, Quercus lyrata, and Quercus michauxii)
in the early spring of 1999.
A 2000 monitoring report determined the riverine swamp forest created at the north end of the site to
be unsuccessful. Removing the O and A horizons left sandy clay soils exposed at the surface, and
the trees planted were not surviving very well. At the edge of the excavated area, banks were
sloughing off and eroding into the floodplain. In a 2002 monitoring report, it was identified that
“another unintended consequence is that the excavation now functions as a 2m-deep ditch and so is
likely draining the are upgradient from the excavation.”
Ditch filling had appeared to restore hydrology to approximately 81 acres of wet pine savanna at the
central portion of the site, and planted species were doing well.
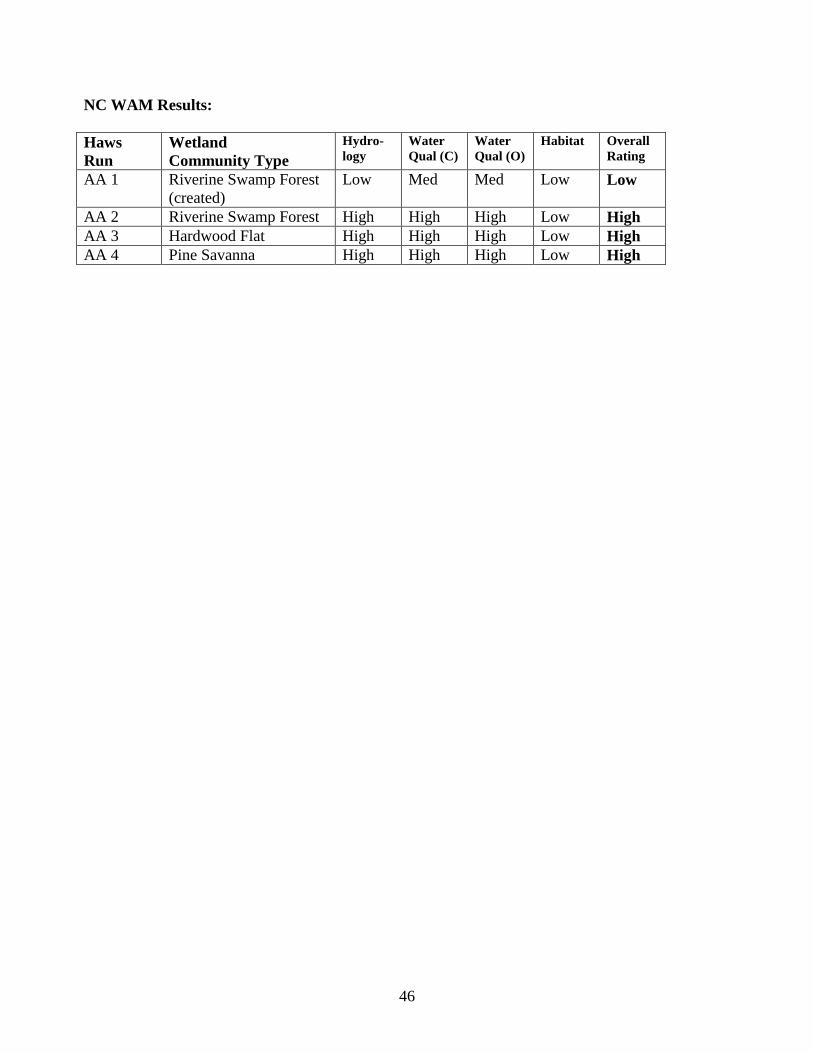
46
NC WAM Results:
Haws
Run
Wetland
Community Type
Hydro-
logy
Water
Qual (C)
Water
Qual (O)
Habitat Overall
Rating
AA 1 Riverine Swamp Forest
(created)
Low Med Med Low Low
AA 2 Riverine Swamp Forest High High High Low High
AA 3 Hardwood Flat High High High Low High
AA 4 Pine Savanna High High High Low High