Embed Size (px)
Citation preview
Classifying wetlands Classifying wetlands and assessing their and assessing their
functions:functions: Using the NC Wetlands Assessment Method Using the NC Wetlands Assessment Method
(NCWAM) to analyze wetland mitigation sites in (NCWAM) to analyze wetland mitigation sites in the coastal plain region.the coastal plain region.
Emily R. BurtonEnvironmental Studies Graduate StudentUniversity of North Carolina, Wilmington
May 5, 2008
North CarolinaNorth Carolina
Wetland Assessment Method
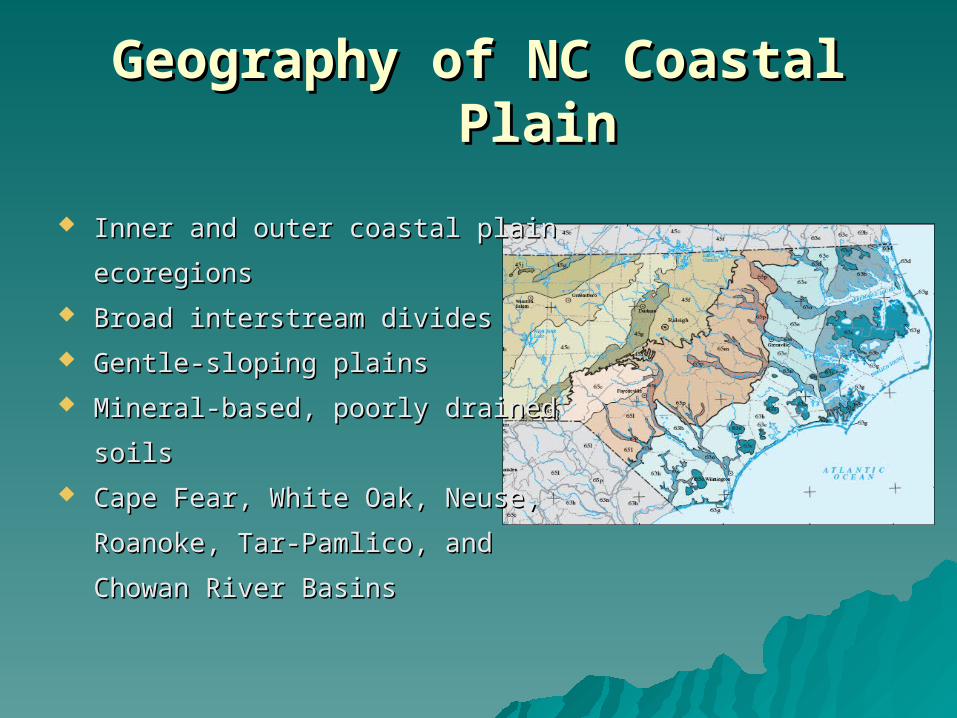
Geography of NC Coastal PlainGeography of NC Coastal Plain
Inner and outer coastal plain Inner and outer coastal plain
ecoregions ecoregions
Broad interstream divides Broad interstream divides
Gentle-sloping plains Gentle-sloping plains
Mineral-based, poorly drained Mineral-based, poorly drained
soilssoils
Cape Fear, White Oak, Neuse, Cape Fear, White Oak, Neuse,
Roanoke, Tar-Pamlico, and Roanoke, Tar-Pamlico, and
Chowan River Basins Chowan River Basins
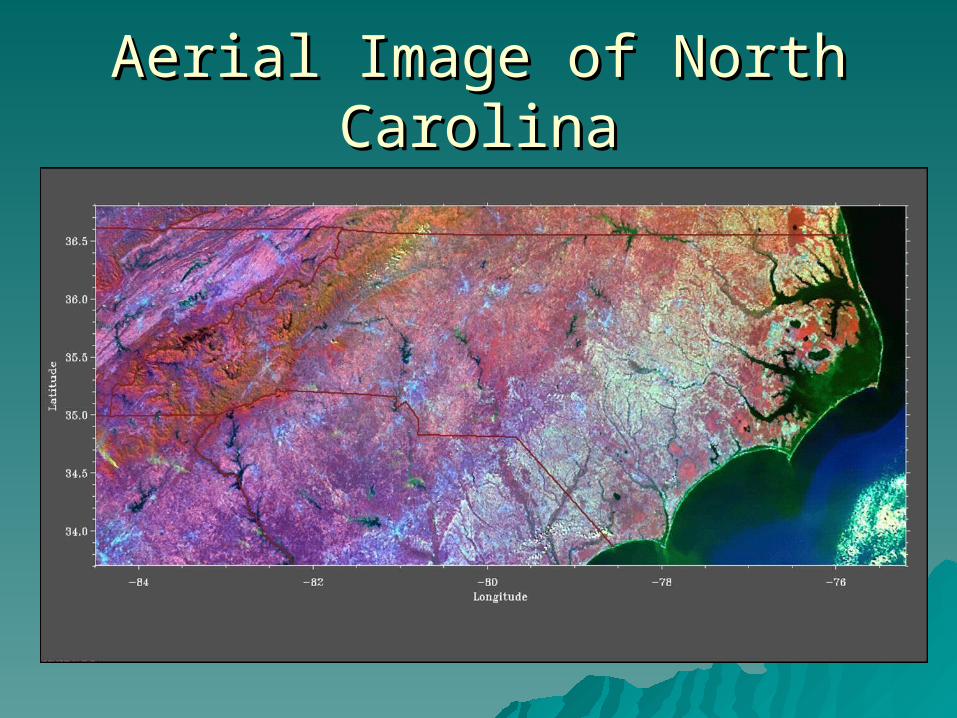
Aerial Image of North CarolinaAerial Image of North Carolina
Land Use and Wetland LossLand Use and Wetland Loss
Once contained approximately 95% of the Once contained approximately 95% of the state’s 6 million acres of wetlands state’s 6 million acres of wetlands
About 51% of the original wetlands in About 51% of the original wetlands in North Carolina had been lost or altered in North Carolina had been lost or altered in some waysome way
Between 1950 – 1980, approx. 42.2% of Between 1950 – 1980, approx. 42.2% of this loss was caused by agricultural this loss was caused by agricultural activities activities
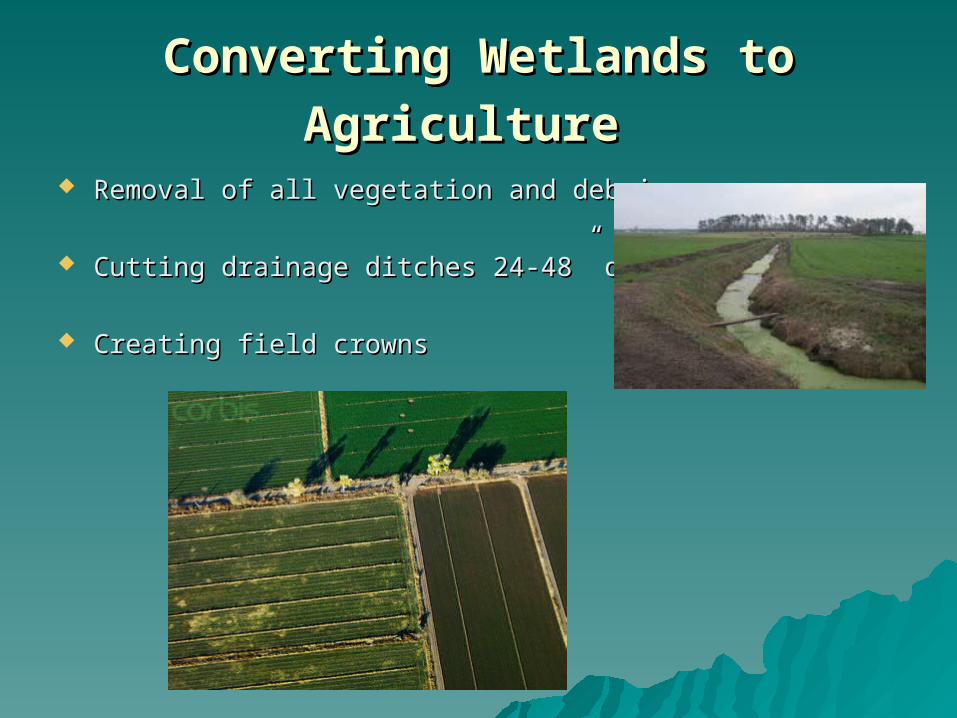
Converting Wetlands to AgricultureConverting Wetlands to Agriculture Removal of all vegetation and debrisRemoval of all vegetation and debris
Cutting drainage ditches 24-48” deepCutting drainage ditches 24-48” deep
Creating field crownsCreating field crowns
Prior Converted (PC) CroplandPrior Converted (PC) Cropland
Compaction of soils creates a plow-panCompaction of soils creates a plow-pan
NRCS declared PC as those lands that converted NRCS declared PC as those lands that converted wetlands prior to December 23, 1985:wetlands prior to December 23, 1985:
1. Do not flood more than 14 days during 1. Do not flood more than 14 days during the the growing seasongrowing season
2. Agricultural commodity 2. Agricultural commodity
3. Not since been abandoned 3. Not since been abandoned
Definition of WetlandsDefinition of Wetlands USACE 1987 Wetland Delineation Manual USACE 1987 Wetland Delineation Manual
3 Parameters:3 Parameters:
1. Hydrology – presence of water within the 1. Hydrology – presence of water within the upper 12 in. for at least 5% of the growing seasonupper 12 in. for at least 5% of the growing season
2. Hydrophytic vegetation – > 50% wetland 2. Hydrophytic vegetation – > 50% wetland species.species.
3. Hydric Soils – formed under wet conditions 3. Hydric Soils – formed under wet conditions long enough to develop anaerobic conditions in long enough to develop anaerobic conditions in upper 12 in. upper 12 in.
Wetlands and their ImportanceWetlands and their Importance
Swamps, marshes, bogs, pine flats, and Swamps, marshes, bogs, pine flats, and floodplains floodplains
Water quality improvement, flood storage, Water quality improvement, flood storage, groundwater recharge, shoreline erosion groundwater recharge, shoreline erosion protection protection
Provide habitat for fish and wildlifeProvide habitat for fish and wildlife
Opportunities for recreation and aesthetic Opportunities for recreation and aesthetic appreciation appreciation
Regulatory ProtectionsRegulatory Protections
Clean Water Act, 1972Clean Water Act, 1972
Army Corps of EngineersArmy Corps of Engineers
Section 404(b)(1) Guidelines: Section 404(b)(1) Guidelines:
1. Avoid filling wetland resources1. Avoid filling wetland resources
2. Minimize adverse impacts2. Minimize adverse impacts
3. Provide compensatory mitigation3. Provide compensatory mitigation
No Net Loss of WetlandsNo Net Loss of Wetlands 1989, President George Bush Sr. 1989, President George Bush Sr.
Reduce the amount of wetlands impacted Reduce the amount of wetlands impacted
Restore and create new wetlands Restore and create new wetlands
Three ways to provide mitigation through the Three ways to provide mitigation through the regulatory process: regulatory process:
1. Mitigation Banking1. Mitigation Banking2. In-Lieu Fee Process2. In-Lieu Fee Process3. Permittee Process (on-site restoration, 3. Permittee Process (on-site restoration,
enhancement, and/or creation) enhancement, and/or creation)
Mitigation BankingMitigation Banking Early 1990s market-Early 1990s market-
based instrument based instrument
Sponsor creates a “bank” Sponsor creates a “bank” of restored, enhanced, andof restored, enhanced, and/or /or created wetlandscreated wetlands
Made credits available to developers to “buy” Made credits available to developers to “buy”
Provides compensatory mitigation Provides compensatory mitigation in advancein advance of of authorized impactsauthorized impacts
Mitigation Banking (cont.)Mitigation Banking (cont.)
Sponsor submits a prospectus to the Corps and Sponsor submits a prospectus to the Corps and Inter-agency Review TeamInter-agency Review Team
Detailed plan of the bank site and success criteriaDetailed plan of the bank site and success criteria
Mitigation Banking Instrument (MBI) provides the Mitigation Banking Instrument (MBI) provides the legal frameworklegal framework
Sponsor becomes responsible for providing Sponsor becomes responsible for providing mitigation for Corps permits and the long-term mitigation for Corps permits and the long-term management and ecological success of the site. management and ecological success of the site.

North Carolina Department of North Carolina Department of TransportationTransportation
1990 ambitious road-1990 ambitious road-building initiativebuilding initiative
NCDOT responsible for NCDOT responsible for
compensating for an compensating for an increasing amount of increasing amount of wetland losses wetland losses
Increased project delaysIncreased project delays
Wetland mitigation needed to expand and become Wetland mitigation needed to expand and become more pro-active more pro-active
In-Lieu Fee ProcessIn-Lieu Fee Process 1997 North Carolina Wetlands Restoration Program 1997 North Carolina Wetlands Restoration Program
(WRP)(WRP)
Allows permittee to provide funds to Allows permittee to provide funds to an in-lieu-fee sponsor (WRP Fund)an in-lieu-fee sponsor (WRP Fund)
First method of developing a per-acre cost of wetland First method of developing a per-acre cost of wetland restorationrestoration
Mitigating within the same river basin as impactsMitigating within the same river basin as impacts
Reporting and documenting of statewide wetland Reporting and documenting of statewide wetland acreage losses and gains acreage losses and gains
NC Ecosystem Enhancement Program NC Ecosystem Enhancement Program (EEP)(EEP)
2003 MOA between the Corps, 2003 MOA between the Corps, DOT, and DENRDOT, and DENR
More consistent and streamlined approach to More consistent and streamlined approach to mitigationmitigation
Implementation of large-scale watershed-based Implementation of large-scale watershed-based restoration efforts restoration efforts
2004 accepted the transfer and responsibility of 2004 accepted the transfer and responsibility of all of NCDOT’s off-site mitigation projects.all of NCDOT’s off-site mitigation projects.
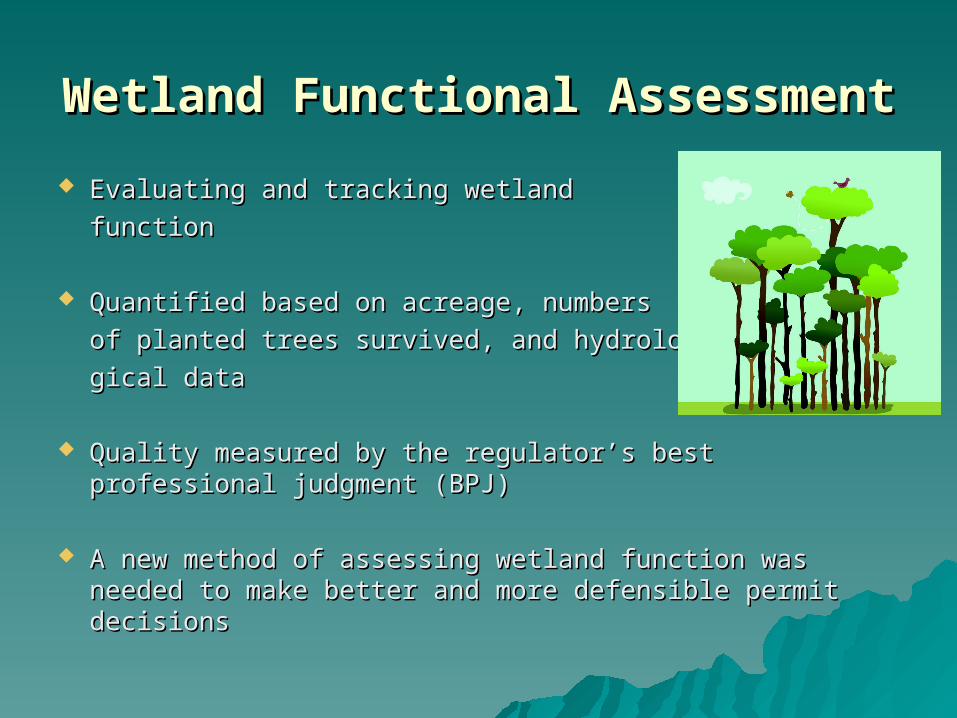
Wetland Functional AssessmentWetland Functional Assessment Evaluating and tracking wetland Evaluating and tracking wetland
functionfunction
Quantified based on acreage, numbers Quantified based on acreage, numbers
of planted trees survived, and hydrolo-of planted trees survived, and hydrolo-
gical datagical data
Quality measured by the regulator’s best professional Quality measured by the regulator’s best professional judgment (BPJ) judgment (BPJ)
A new method of assessing wetland function was needed A new method of assessing wetland function was needed to make better and more defensible permit decisions to make better and more defensible permit decisions
North Carolina Wetland Assessment North Carolina Wetland Assessment Method (NCWAM)Method (NCWAM)
A team of experts gathered in 2003 to A team of experts gathered in 2003 to analyze approx 40 different existing analyze approx 40 different existing methodologiesmethodologies
NCWAM Draft Manual was released in NCWAM Draft Manual was released in December of 2007December of 2007
Provides an accurate, consistent, rapid, Provides an accurate, consistent, rapid,
observational, and scientifically-based field observational, and scientifically-based field methodmethod

Dichotomous Key to General North Dichotomous Key to General North
Carolina Wetland TypesCarolina Wetland Types
16 general wetland types in NC16 general wetland types in NC
Account for impacts by wetland type Account for impacts by wetland type
Account for the inherent differences in Account for the inherent differences in
function for each wetland typefunction for each wetland type
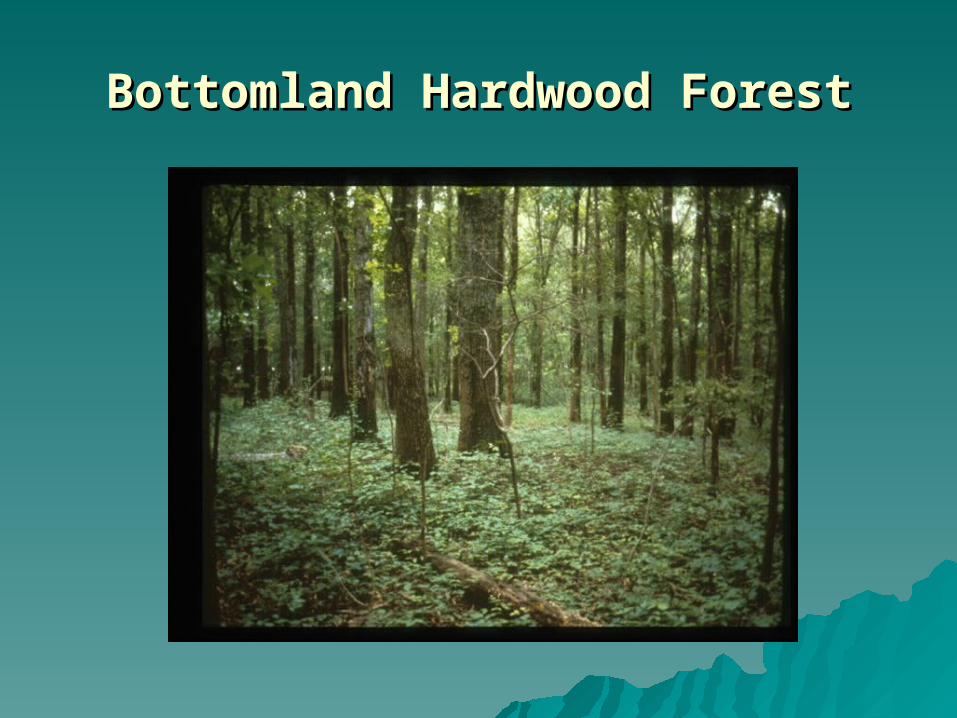
Bottomland Hardwood ForestBottomland Hardwood Forest

Riverine Swamp ForestRiverine Swamp Forest
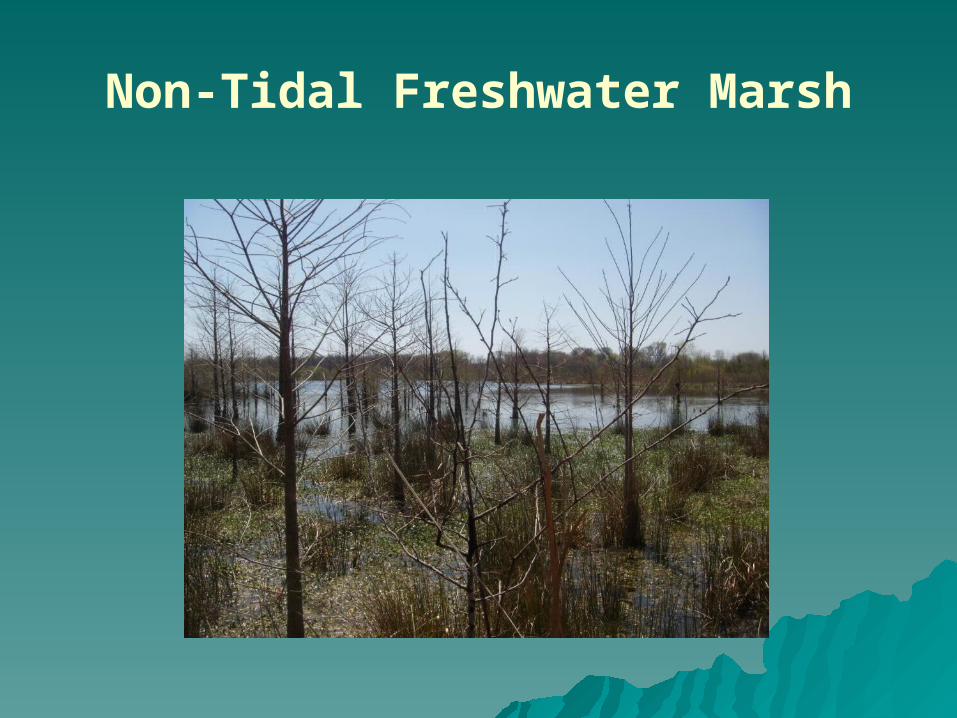
Non-Tidal Freshwater Marsh
NCWAM Field FormNCWAM Field Form
Level of function of wetlands based on ratings of Level of function of wetlands based on ratings of indicators of function rather than their actual indicators of function rather than their actual measurements measurements
Evaluation of 22 metrics using observation, Evaluation of 22 metrics using observation, measurement, and BPJmeasurement, and BPJ
NC WAM rating calculatorNC WAM rating calculator converts data into converts data into “High”, “Medium”, or “Low” functional ratings“High”, “Medium”, or “Low” functional ratings

Wetland FunctionsWetland Functions
11 Sub-functions11 Sub-functions
3 Main functions:3 Main functions:
– HydrologyHydrology
– Water QualityWater Quality
– HabitatHabitat
““HighHigh””, , ““MediumMedium”” and and ““LowLow”” ratings ratings –– by separate by separate function and overallfunction and overall
HydrologyHydrology
Surface storage and retentionSurface storage and retention
Subsurface storage Subsurface storage
and retentionand retention
Water QualityWater Quality
Particulate changeParticulate change
Soluble changeSoluble change
Pathogen changePathogen change
Physical changePhysical change
Pollution Change (combination of the first three)Pollution Change (combination of the first three)
HabitatHabitat
Physical structurePhysical structure
Vegetation compositionVegetation composition
Landscape patch structureLandscape patch structure
Habitat UniquenessHabitat Uniqueness
Site Selection for NC WAM Site Selection for NC WAM EvaluationEvaluation
12 mitigation sites selected based on:12 mitigation sites selected based on:
1. Geographical area – Inner and 1. Geographical area – Inner and Outer Outer Coastal PlainCoastal Plain
2. Age of site development – 1993 – 2. Age of site development – 1993 – 2003; “Closed out”2003; “Closed out”
3. Prior land use – PC cropland3. Prior land use – PC cropland
PC RestorationPC Restoration
The most “bang for your buck”The most “bang for your buck” Historically supported hydric soils Historically supported hydric soils
Encompass larger areasEncompass larger areas Minimal restoration design work and costMinimal restoration design work and cost Restored PC croplands = 2,176 acres Restored PC croplands = 2,176 acres

Site RestorationSite Restoration
Drainage ditches plugged and/or filled Drainage ditches plugged and/or filled
Discing, deep ripping, surface scarificationDiscing, deep ripping, surface scarification
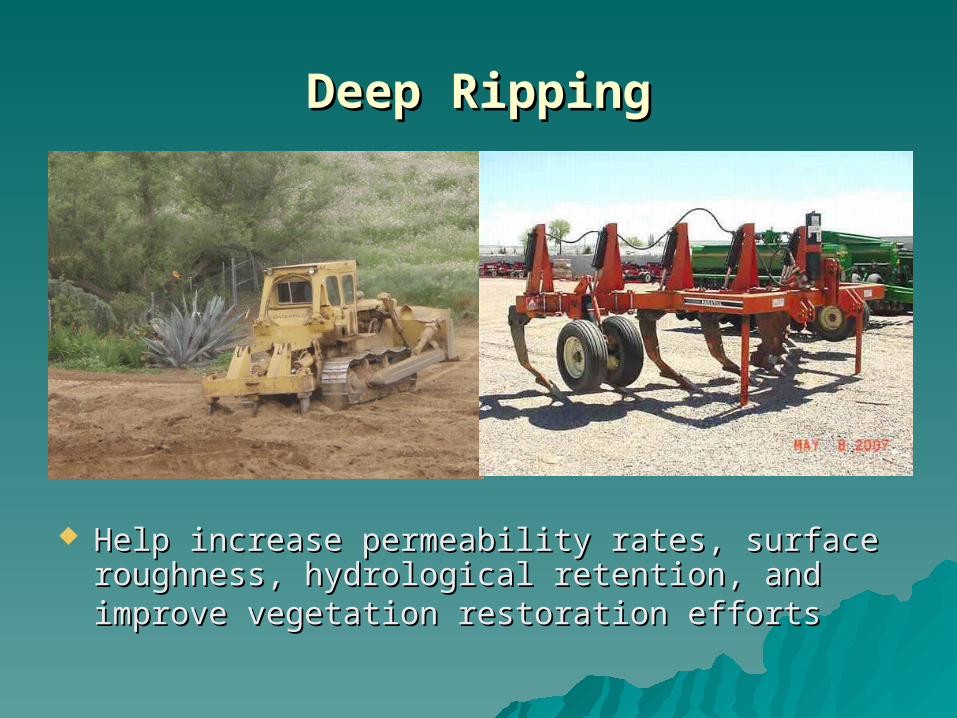
Deep RippingDeep Ripping
Help increase permeability rates, surface Help increase permeability rates, surface roughness, hydrological retention, and improve roughness, hydrological retention, and improve vegetation restoration effortsvegetation restoration efforts
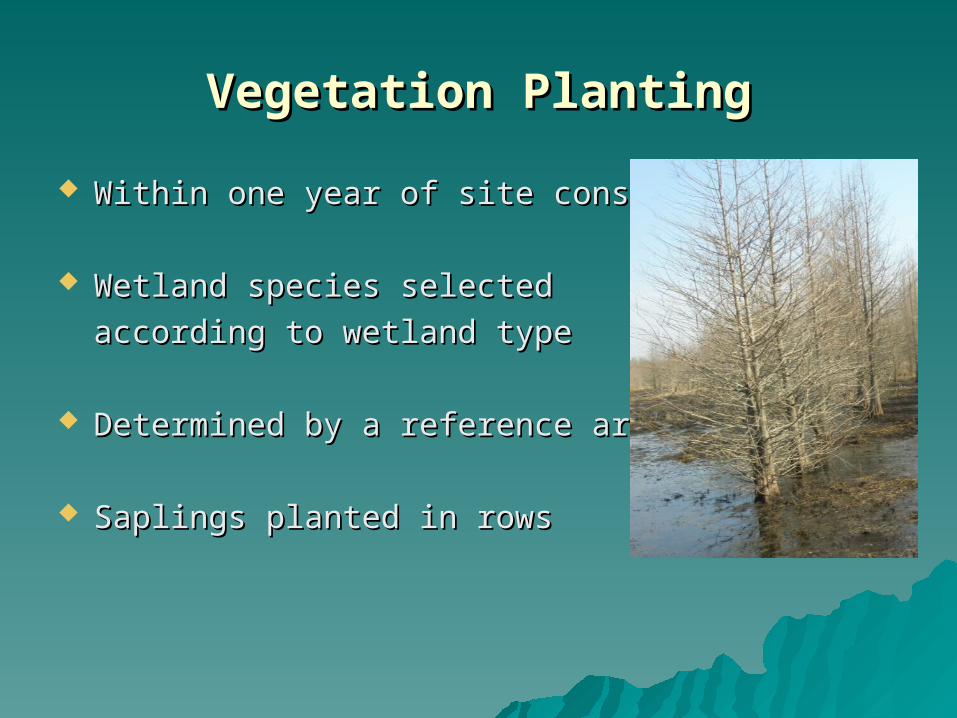
Vegetation PlantingVegetation Planting
Within one year of site constructionWithin one year of site construction
Wetland species selected Wetland species selected
according to wetland typeaccording to wetland type
Determined by a reference areaDetermined by a reference area
Saplings planted in rowsSaplings planted in rows
Site MonitoringSite Monitoring
Installation of ground water monitoring gaugesInstallation of ground water monitoring gauges
Vegetation remediation in first 1-2 yearsVegetation remediation in first 1-2 years
Hydrology and vegetation success monitored for Hydrology and vegetation success monitored for 4 – 6 years4 – 6 years
Annual reports submitted to the CorpsAnnual reports submitted to the Corps
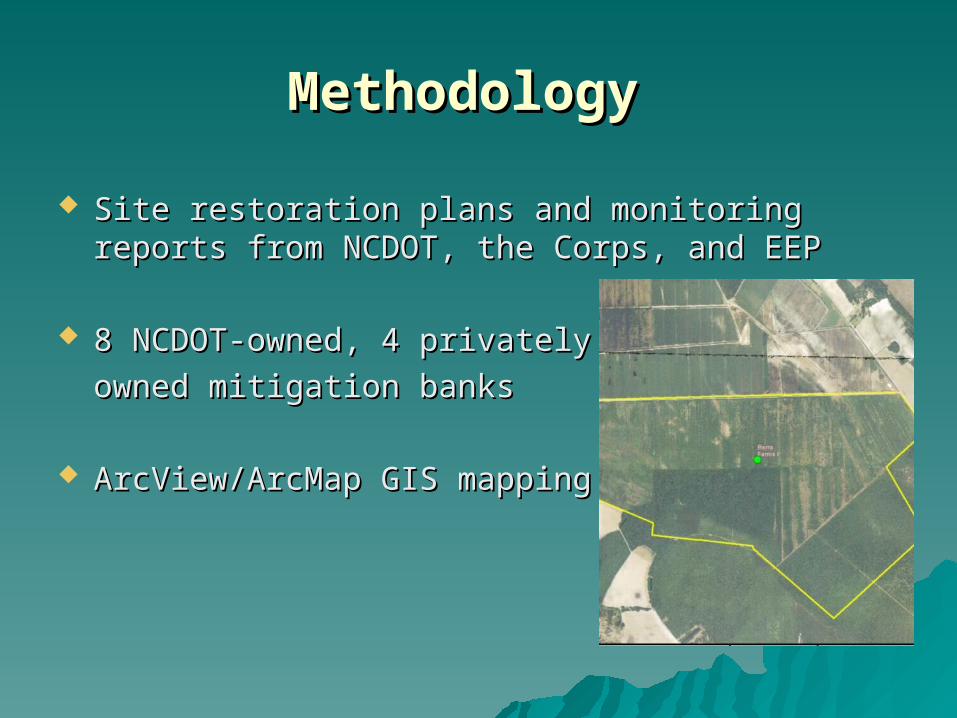
MethodologyMethodology
Site restoration plans and monitoring reports Site restoration plans and monitoring reports from NCDOT, the Corps, and EEP from NCDOT, the Corps, and EEP
8 NCDOT-owned, 4 privately 8 NCDOT-owned, 4 privately
owned mitigation banksowned mitigation banks
ArcView/ArcMap GIS mappingArcView/ArcMap GIS mapping
Tools for the FieldTools for the Field
NCWAM forms and Draft ManualNCWAM forms and Draft Manual Soil augerSoil auger Hand-held Global Position System (GPS)Hand-held Global Position System (GPS) Digital cameraDigital camera Pocket rodPocket rod Soil surveysSoil surveys Munsell Soil Color ChartsMunsell Soil Color Charts Compass Compass
Identifying Assessment AreasIdentifying Assessment Areas
Maps showing where hydrology had been Maps showing where hydrology had been restored and wetland vegetation plantedrestored and wetland vegetation planted
Walked and observed for changesWalked and observed for changes
Identified a favorable, homogenous Identified a favorable, homogenous representation of a particular wetland typerepresentation of a particular wetland type
Keyed out using the Dichotomous KeyKeyed out using the Dichotomous Key
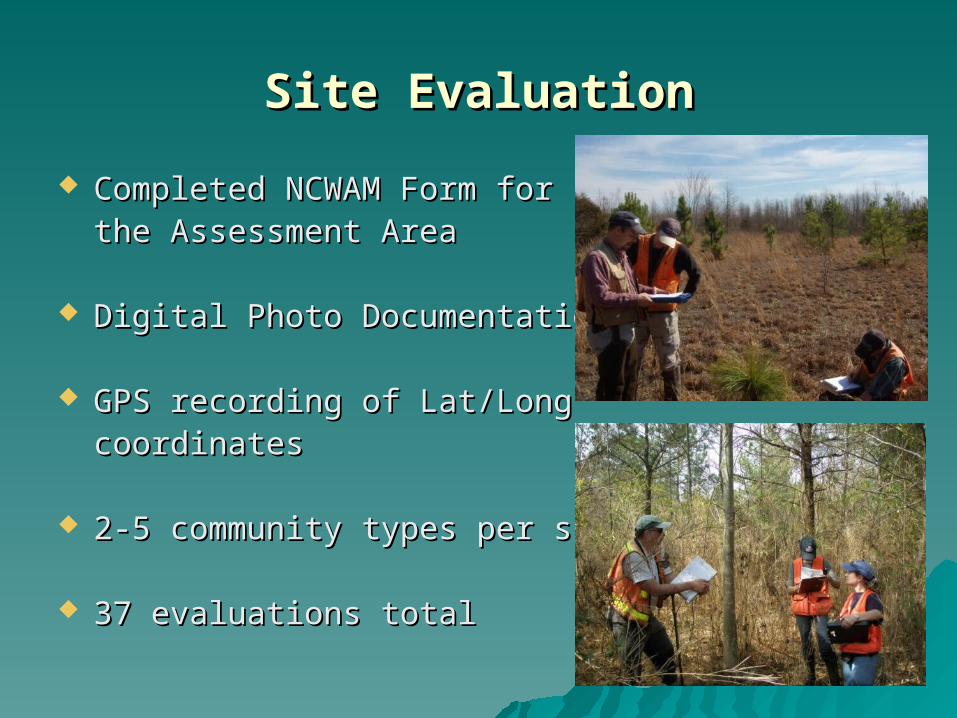
Site EvaluationSite Evaluation
Completed NCWAM Form for Completed NCWAM Form for the Assessment Areathe Assessment Area
Digital Photo DocumentationDigital Photo Documentation
GPS recording of Lat/Long GPS recording of Lat/Long coordinatescoordinates
2-5 community types per site2-5 community types per site 37 evaluations total37 evaluations total

NCWAM ResultsNCWAM Results 8/16 NC wetland community types represented8/16 NC wetland community types represented::
11 Hardwood flats 11 Hardwood flats
9 Non-riverine swamp forests 9 Non-riverine swamp forests
6 Riverine swamp forests 6 Riverine swamp forests
4 Bottomland hardwood forests 4 Bottomland hardwood forests
4 Pine flats 4 Pine flats
1 Pine savanna 1 Pine savanna
1 Floodplain pool1 Floodplain pool
1 Non-tidal freshwater marsh 1 Non-tidal freshwater marsh
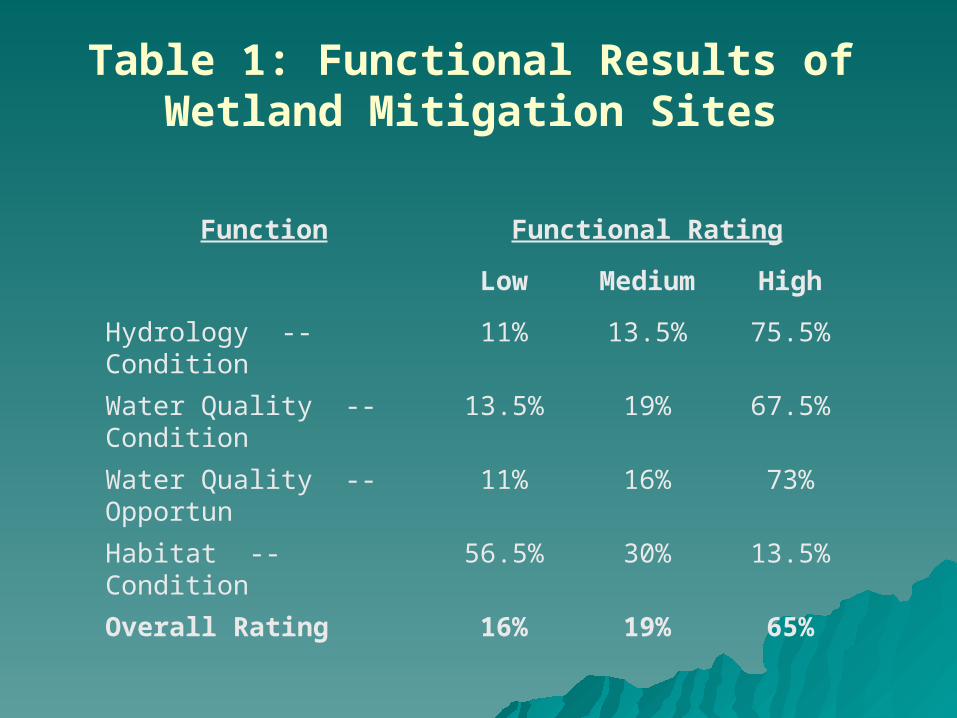
Table 1: Functional Results of Wetland Mitigation Sites
Function Functional Rating
Low Medium High
Hydrology -- Condition 11% 13.5% 75.5%
Water Quality -- Condition 13.5% 19% 67.5%
Water Quality -- Opportun 11% 16% 73%
Habitat -- Condition 56.5% 30% 13.5%
Overall Rating 16% 19% 65%
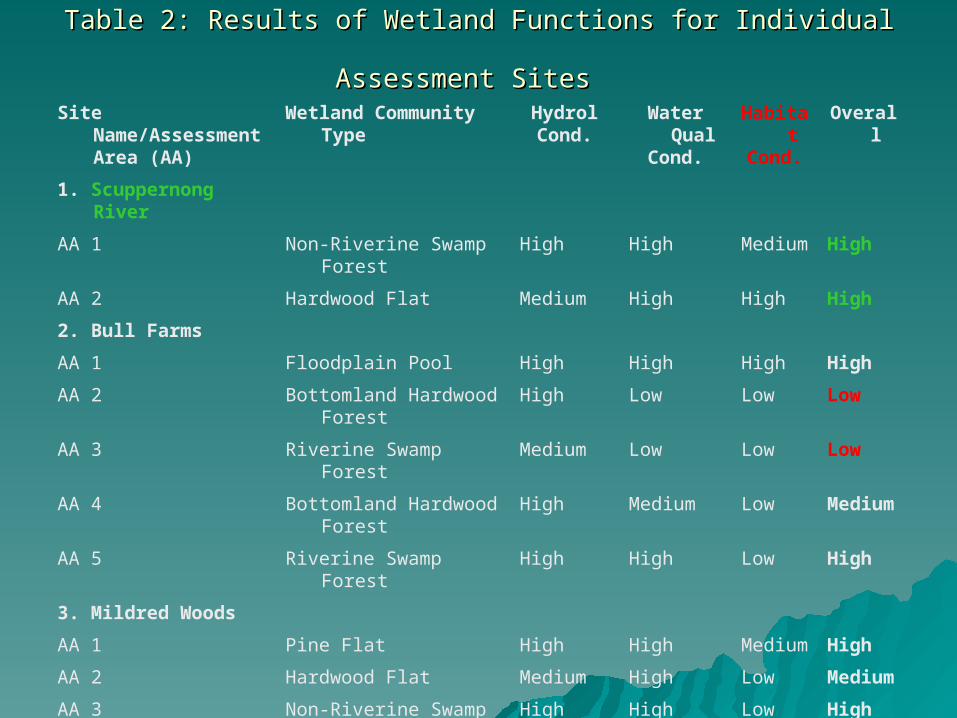
Table 2: Results of Wetland Functions for Individual Assessment SitesTable 2: Results of Wetland Functions for Individual Assessment Sites Site Name/Assessment
Area (AA)Wetland Community
TypeHydrolCond.
Water Qual
Cond.
HabitatCond.
Overall
1. Scuppernong River
AA 1 Non-Riverine Swamp Forest
High High Medium High
AA 2 Hardwood Flat Medium High High High
2. Bull Farms
AA 1 Floodplain Pool High High High High
AA 2 Bottomland Hardwood Forest
High Low Low Low
AA 3 Riverine Swamp Forest Medium Low Low Low
AA 4 Bottomland Hardwood Forest
High Medium Low Medium
AA 5 Riverine Swamp Forest High High Low High
3. Mildred Woods
AA 1 Pine Flat High High Medium High
AA 2 Hardwood Flat Medium High Low Medium
AA 3 Non-Riverine Swamp Forest
High High Low High
AA 4 Non-Riverine Swamp Forest
High High Low High
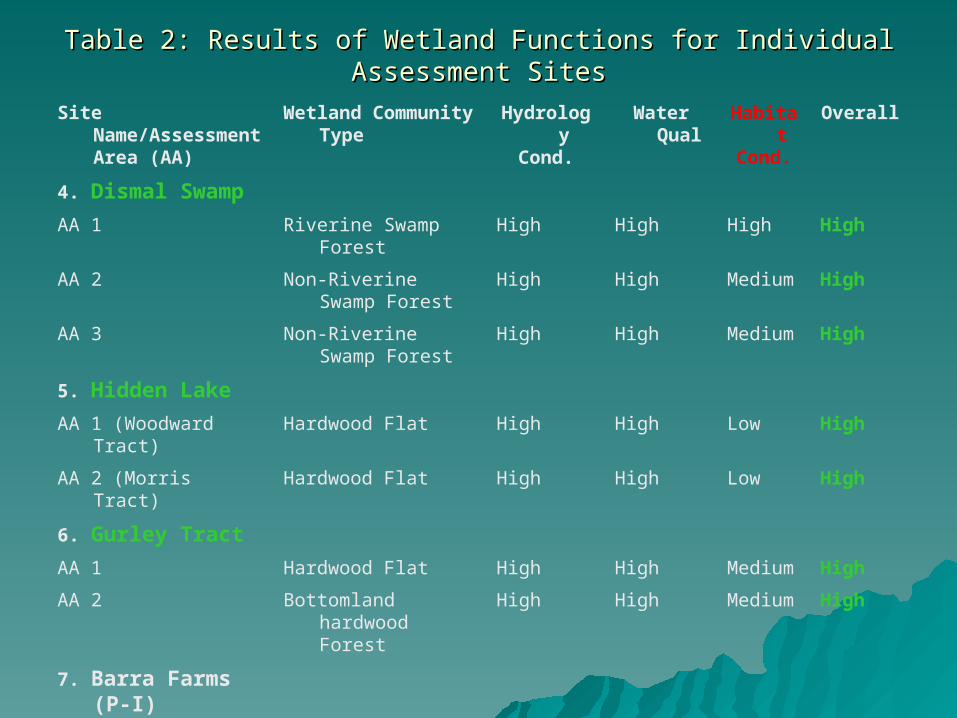
Table 2: Results of Wetland Functions for Individual Assessment SitesTable 2: Results of Wetland Functions for Individual Assessment Sites
Site Name/Assessment Area (AA)
Wetland Community Type
HydrologyCond.
Water Qual
HabitatCond.
Overall
4. Dismal Swamp
AA 1 Riverine Swamp Forest High High High High
AA 2 Non-Riverine Swamp Forest
High High Medium High
AA 3 Non-Riverine Swamp Forest
High High Medium High
5. Hidden Lake
AA 1 (Woodward Tract) Hardwood Flat High High Low High
AA 2 (Morris Tract) Hardwood Flat High High Low High
6. Gurley Tract
AA 1 Hardwood Flat High High Medium High
AA 2 Bottomland hardwood Forest
High High Medium High
7. Barra Farms (P-I)
AA 1 Hardwood Flat High Medium Medium Medium
AA 2 Non-Riverine Swamp Forest
High High Medium High
AA 3 Pine Flat Medium Medium Medium Medium
AA 4 Hardwood Flat High High Low High
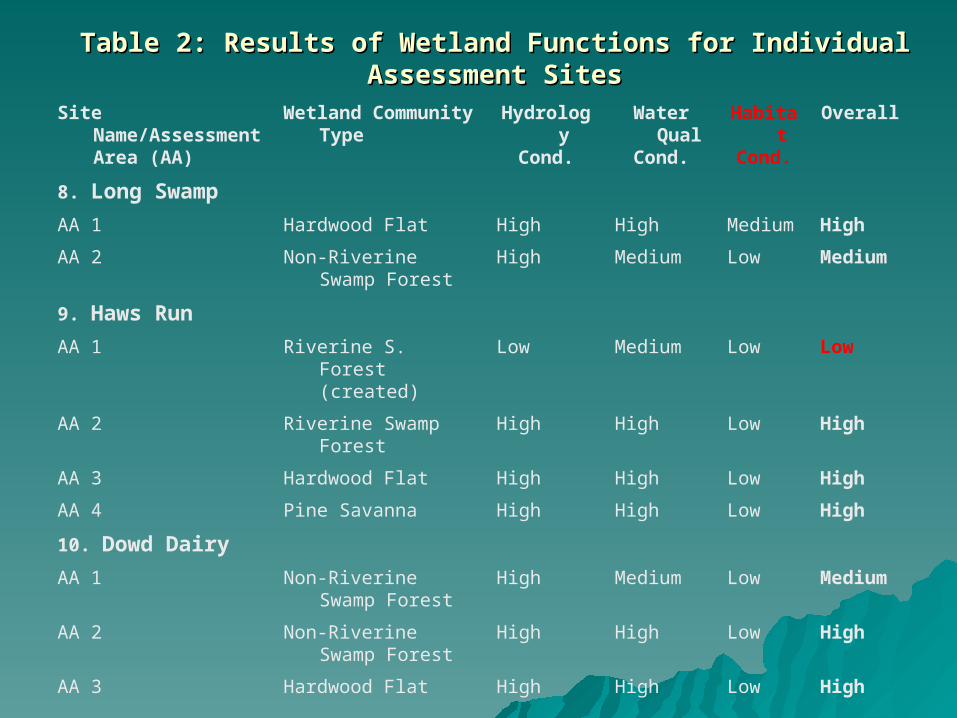
Table 2: Results of Wetland Functions for Individual Assessment SitesTable 2: Results of Wetland Functions for Individual Assessment Sites
Site Name/Assessment Area (AA)
Wetland Community Type
HydrologyCond.
Water Qual
Cond.
HabitatCond.
Overall
8. Long Swamp
AA 1 Hardwood Flat High High Medium High
AA 2 Non-Riverine Swamp Forest
High Medium Low Medium
9. Haws Run
AA 1 Riverine S. Forest (created)
Low Medium Low Low
AA 2 Riverine Swamp Forest High High Low High
AA 3 Hardwood Flat High High Low High
AA 4 Pine Savanna High High Low High
10. Dowd Dairy
AA 1 Non-Riverine Swamp Forest
High Medium Low Medium
AA 2 Non-Riverine Swamp Forest
High High Low High
AA 3 Hardwood Flat High High Low High
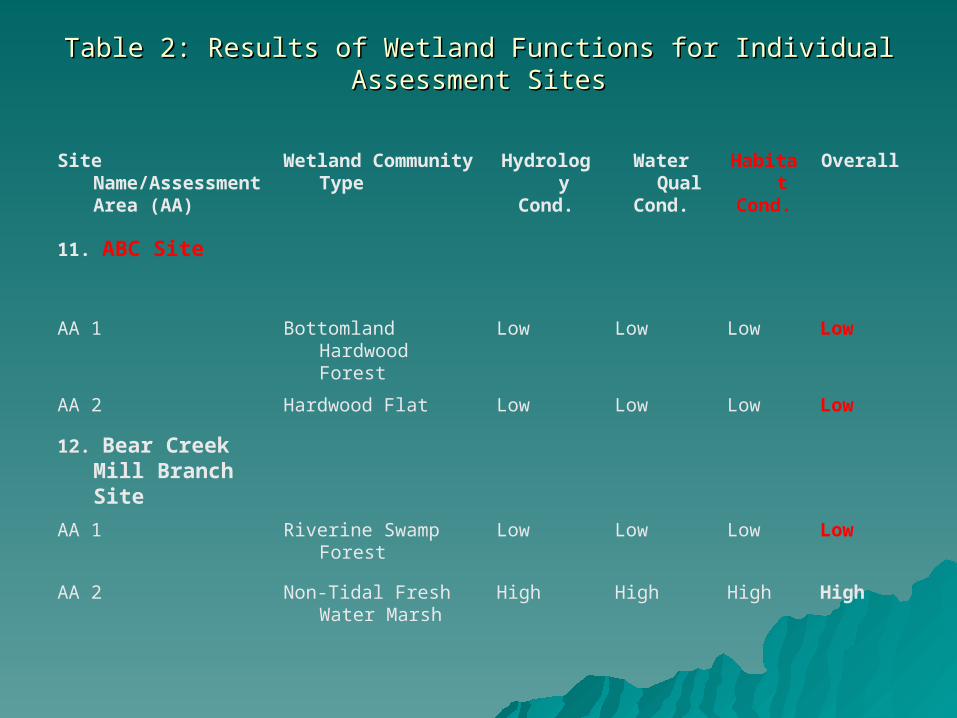
Table 2: Results of Wetland Functions for Individual Assessment SitesTable 2: Results of Wetland Functions for Individual Assessment Sites
Site Name/Assessment Area (AA)
Wetland Community Type
HydrologyCond.
Water Qual
Cond.
HabitatCond.
Overall
11. ABC Site
AA 1 Bottomland Hardwood Forest
Low Low Low Low
AA 2 Hardwood Flat Low Low Low Low
12. Bear Creek Mill Branch Site
AA 1 Riverine Swamp Forest Low Low Low Low
AA 2 Non-Tidal Fresh Water Marsh
High High High High
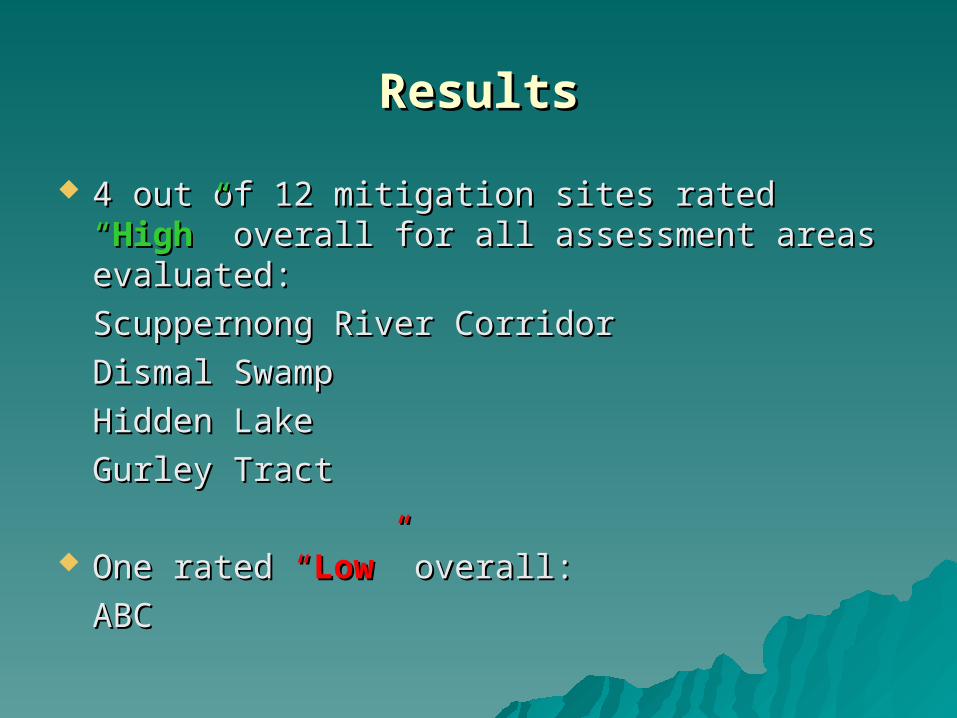
ResultsResults
4 out of 12 mitigation sites rated 4 out of 12 mitigation sites rated ““HighHigh”” overall for all assessment areas evaluated: overall for all assessment areas evaluated:
Scuppernong River CorridorScuppernong River Corridor
Dismal SwampDismal Swamp
Hidden LakeHidden Lake
Gurley Tract Gurley Tract
One rated One rated ““LowLow”” overall: overall:
ABCABC
Results (cont.)Results (cont.)
3 other sites had 3 other sites had ““LowLow”” overall ratings overall ratings
Alterations due to beaver Alterations due to beaver
activityactivity
Lack of wetland functions due to presence of Lack of wetland functions due to presence of stream channelization, man-made berms, or soil stream channelization, man-made berms, or soil compactioncompaction
Negative effects on all three wetland functionsNegative effects on all three wetland functions
DiscussionDiscussion
Identifying the type of wetland Identifying the type of wetland community presentcommunity present
Different than what was originally Different than what was originally planned planned
Post-restoration events substantially altered site Post-restoration events substantially altered site conditions conditions
For purposes of consistency For purposes of consistency site identified as it site identified as it appeared appeared
ConclusionsConclusions
NC WAM has the ability to determine wetland NC WAM has the ability to determine wetland functionality accuratelyfunctionality accurately
Hydrology “High” (75.5%) – first function to be Hydrology “High” (75.5%) – first function to be replaced after a site is constructedreplaced after a site is constructed
Water Quality “High” (67%) – relative to Water Quality “High” (67%) – relative to
inundation duration, vegetation structure, and inundation duration, vegetation structure, and opportunity (surrounding land use)opportunity (surrounding land use)
Habitat “Low” (56.5%) – can take decades to Habitat “Low” (56.5%) – can take decades to hundreds of years to re-establish hundreds of years to re-establish
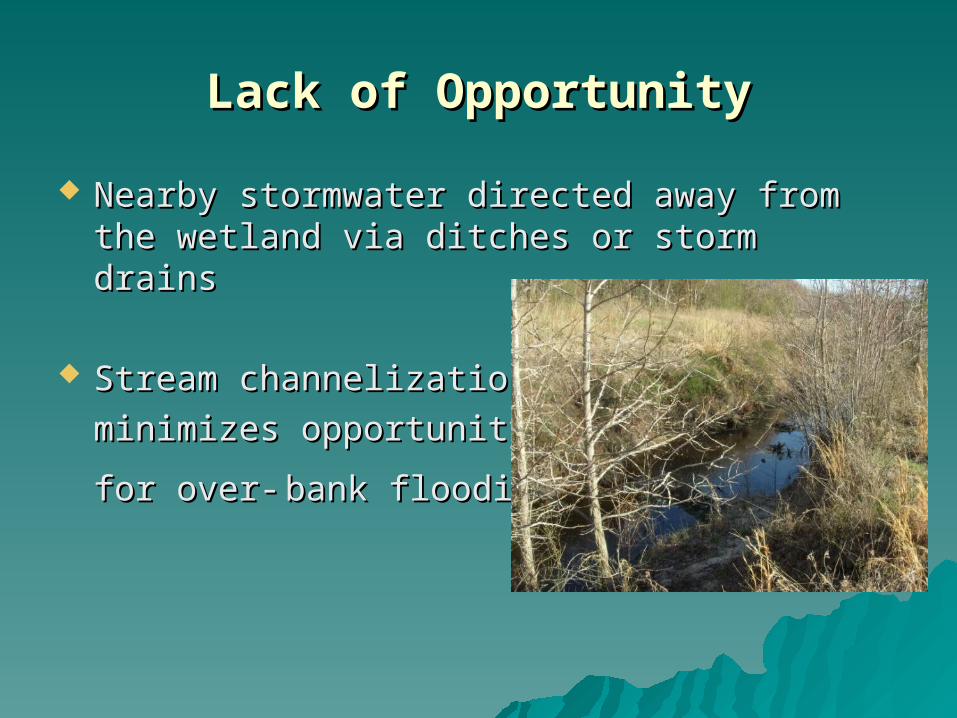
Lack of OpportunityLack of Opportunity
Nearby stormwater directed away from the Nearby stormwater directed away from the wetland via ditches or storm drainswetland via ditches or storm drains
Stream channelization Stream channelization
minimizes opportunity minimizes opportunity
for over-for over- bank floodingbank flooding
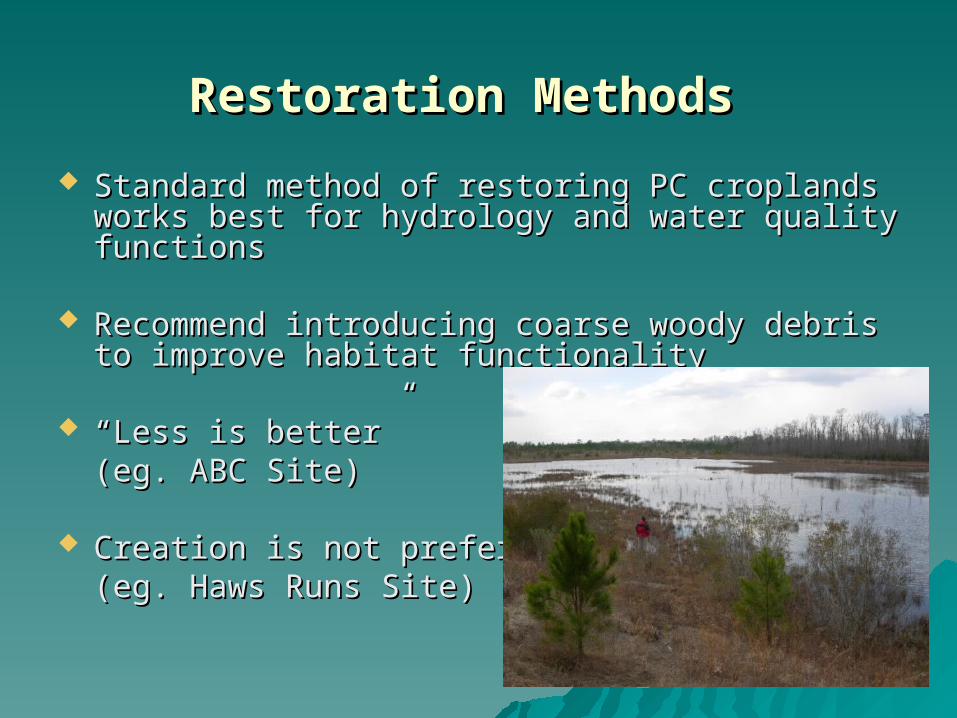
Restoration MethodsRestoration Methods Standard method of restoring PC croplands works Standard method of restoring PC croplands works
best for hydrology and water quality functionsbest for hydrology and water quality functions
Recommend introducing coarse woody debris to Recommend introducing coarse woody debris to improve habitat functionalityimprove habitat functionality
““Less is better” Less is better” (eg. ABC Site)(eg. ABC Site)
Creation is not preferred Creation is not preferred (eg. Haws Runs Site) (eg. Haws Runs Site)
NC WAM: A Validation for SuccessNC WAM: A Validation for Success
Performance measures prior to NCWAM based on Performance measures prior to NCWAM based on minimum standard: minimum standard:
1. Hydrology present at least 12.5% of GS 1. Hydrology present at least 12.5% of GS 2. Coverage of hydrophytic vegetation at 2. Coverage of hydrophytic vegetation at
least 260 stems/acreleast 260 stems/acre
NCWAM examines a range of wetland functions NCWAM examines a range of wetland functions covering a number of observable characteristics covering a number of observable characteristics
Valuable and accurate tool for evaluating success Valuable and accurate tool for evaluating success of mitigated wetlandsof mitigated wetlands
Tracking Function of Mitigation SitesTracking Function of Mitigation Sites
Enhancement areas – evaluate before and after Enhancement areas – evaluate before and after improvements to track functional uplift improvements to track functional uplift
Restoration areas – evaluate before restoration Restoration areas – evaluate before restoration plan approval to determine goals; require as part plan approval to determine goals; require as part of the mitigation monitoring requirementof the mitigation monitoring requirement
““High” ratings required for true High” ratings required for true
functional replacementfunctional replacement
Final WordFinal Word
Mitigation sites are constantly subject to Mitigation sites are constantly subject to changechange
Recommend further evaluation of mitigation Recommend further evaluation of mitigation sites using NCWAMsites using NCWAM
Future study for Regulatory Co-op??Future study for Regulatory Co-op??
Thanks for the good times!!Thanks for the good times!!