Embed Size (px)
Citation preview

ASSESSING THE CONSERVATION VALUE OF WETLANDS AND WATERBIRDS WITH A FOCUS ON
THE WINTER RAINFALL REGION OF SOUTH AFRICA
Douglas Michael Harebottle
Thesis Presented for the Degree of
DOCTOR OF PHILOSOPHY
in the Department of Zoology
UNIVERSITY OF CAPE TOWN
May 2012 Supervised by: Professor L.G. Underhill Dr A.J. Williams Animal Demography Unit c/o CapeNature Department of Zoology Private Bag X29 University of Cape Town Gatesville Rondebosch 7701 7766 South Africa South Africa


iii
“Waterbirds tell many stories
about the biological richness of our planet. They also provide our best tales
of regional and global connectedness. By their individual movements and the variable fates
of their populations in response, to increases or decreases in suitable habitat,
our waterbirds and waders provide connections, between countries,
between different levels of administration and management, between investigators,
between people”
Theunis Piersma Shorebird Researcher
University of Groningen The Netherlands
Foreword to ‘Numbers and distribution of wintering waterbirds in the Western
Palearctic and Southwest Asia in 1997, 1998 and 1999’, Wetlands International, Wageningen


v
Declaration I hereby declare that all of the work presented in this thesis, titled “Assessing the conservation value of wetlands and waterbirds with a focus on the winter rainfall region of South Africa”, is my own, except where otherwise stated in the text. This thesis has not been submitted in whole or part for a degree at any other university. Signed in Cape Town in May 2012
-------------------------------------------------------- Douglas Michael Harebottle


vii
This thesis is dedicated to:
my wife, Samantha, who continually believed in me and supported me throughout many long and sleepless nights. I am extremely grateful for her love
and companionship during this time and for simultaneously keeping a family household going.
and Michael and Regan who patiently endured their father working late nights, odd hours and weekends. May this inspire them to reach great heights in their
chosen career paths.


ix
Contents
Abstract xi
Layout and contributions xiii
Acknowledgements xiv
Chapter One Introduction and background. 1
Chapter Two The Waterbird Conservation Value score: a new method to assess wetland avifaunal importance 45
Chapter Three Further applications of the Waterbird Conservation Value score: visual analyses through time. 93
Chapter Four Waterbird responses to dynamic shifts between lake and estuarine conditions at the Bot River Estuary, Western Cape, South Africa, 2002–2010: a conservation assessment. 115
Chapter Five Wetlands and waterbirds in the Western Cape, South Africa: associations and conservation importance. 187
Chapter Six Synthesis and recommendations. 225 Appendices
Appendix A Waterbirds at Paarl Waste Water Treatment Works 1994–2004: seasonality, trends and conservation outcomes. 245
Appendix B Long-term waterbird trends at a South African farm dam in the winter rainfall region: Droëvlei Dam, Western Cape, South Africa, 1982–2006. 283
Appendix C Seasonality, trends and conservation status of waterbirds at an arid west coastal wetland in South Africa: Rocher Pan, 1979–2004. 319
Appendix D Waterbirds at De Hoop Vlei,a coastal lake in South Africa, 1979–2009: an assessment of its Ramsar status. 359

xi
Assessing the conservation value of wetlands and waterbirds with a focus on the
winter rainfall region of South Africa
Douglas M. Harebottle
Animal Demography Unit, Department of Zoology, University of Cape Town
May 2012
Abstract
This thesis deals with the development and application of a new tool to assess the
conservation significance of wetland avifauna. Termed the Waterbird Conservation
Value (WCV) score, this method sums the proportion of each species’ count relative to
the global 1% threshold level for each species; the value obtained measures the overall
conservation importance of the wetland to waterbirds. The score is evaluated at flyway
level (East-Atlantic flyway) and then applied at regional and local scales. The regional
and local analyses focused on various long-term waterbird monitoring datasets in the
winter-rainfall region of South Africa. The primary aim was to assess the conservation
significance of selected wetlands in the region based on abundance, seasonality and
trend data. The selected sites were representative of different wetland types, inundation
patterns and geographical location.
The results revealed that the WCV score is a useful tool to assess the conservation value
for wetland avifauna and compliments the Ramsar 1% criterion, on which it is based. It
allows for all species at a site to make a contribution to the conservation value of a site
and is not restricted solely to species meeting the 1% criterion. There is a strong, but not
overwhelming relationship between large WCV scores and the number of 1% threshold
species. However, large values for the WCV scores may be obtained either by small
contributions from a many species or large contributions from a few species. The major
contributing factor to the score is the proportion of the ‘count’ estimate to a species’ 1%
threshold value. Ongoing assessment and re-evaluation of waterbird population
estimates is therefore critical to the WCV score as 1% thresholds are derived from these
estimates.
The use of visual analytics to display outputs of these data demonstrated at a regional
scale the effectiveness of colour-coded histograms and radar plots to interpret WCV
scores. These graphical outputs assist in easily setting conservation priorities at multiple

xii
sites or at the larger landscape level. At a site level, the WCV score was used to
specifically address the issue of changing waterbird composition during shifts in the
hydrological state of the Bot River estuary; this new and innovative approach added
value to the standard approaches of assessing survey data of wetland birds.
I used correspondence analysis and estimated Daily Energy Intake (DEI) to determine
waterbird relationships and ecological impact at 30 wetlands in the Western Cape. The
WCV score was applied across all sites determine conservation importance. There were
strong waterbird-wetland associations between saline wetlands (estuaries and estuarine
bays) and freshwater wetlands (lakes and waste water treatment works). Palearctic
migrants were strongly associated with coastal sites while residents showed strong links
with freshwater sites and/or brackish wetlands. Biomass and DEI values varied
seasonally for most wetlands which highlighted the importance of species using different
sites at different times of the year. Site conservation status did not show strong
associations with any waterbird groups. Overall, three sites, Strandfontein Waste Water
Treatment Works, Langebaan Lagoon and Berg River Estuary were the most important
sites in terms of numbers of birds, waterbird conservation value score and energy
consumption. They contributed 49.7 % to the conservation value of all sites in the
Western Cape and are critical localities for waterbird conservation in the region.
In terms of the future of waterbird conservation in the winter rainfall region and the
Western Cape, I discuss the use of holistic, integrated and landscape approaches to
better understand how waterbirds utilise the network of wetlands in the region. The
WCV score is discussed as a useful biodiversity conservation tool which can rapidly
assess conservation importance of wetlands. I suggest that it should be incorporated
within existing national and global waterbird monitoring programmes as a way to
monitor and assess wetland importance and species significance on an ongoing basis.
Finally, proposals and recommendations on how to improve research outputs arising
from waterbird survey data are made.

xiii
Layout and contributions
This thesis consists of six main chapters and four appendices. The chapters and the
appendices were written as papers for submission to journals. Consequently, some
repetition of methods and references was unavoidable; where applicable I describe a
method in a chapter and referred to this elsewhere in the thesis. Tables, figures and
appendices follow the text for each chapter; references for each chapter are given at the
end of the chapter.
Data for some of the site accounts were compiled by various staff members of Cape
Nature (then Cape Nature Conservation) and many public volunteers. Without their
dedication and commitment this regional review of waterbirds would not have been
possible; their vital roles will be acknowledged in co-authorships of the forthcoming
series of papers. I was responsible for the collation, analysis and writing of each chapter.
Fundamental ideas were discussed with my supervisors, Prof. L.G. Underhill and Dr
A.J. Williams, and with Dr Rene Navarro a fellow work colleague. They advised on
methods of data analysis, assisted with the wording of some methods and commented on
chapter drafts. L.G. Underhill developed additional statistical programs to analyse data
for Chapters 4 and 5.
A version of Appendix A was published in Ostrich (African Journal of African
Ornithology), 2008, 79: 147–163.
xiv
Acknowledgements
I am indebted to Prof. Les Underhill, my supervisor and boss for allowing me the opportunity to pursue this PhD. At the outset we had numerous discussions about the topic for my thesis, but thanks to his foresight and knowledge we eventually agreed upon using the ADU and CapeNature waterbird datasets. This was ideal, since soon after I had arrived at the ADU and started working on the CWAC (Coordinated Waterbird Counts) programme I had developed a keen interest in waterbirds and soon discovered that not much is known about the ecology of many of the species in South Africa. This then provided a perfect platform from which to launch my PhD and I owe a great sense of gratitude to Les for spurring me on to undertake this task. His guidance, patience and statistical insights have been inspirational throughout the duration of my PhD Trying to balance the needs of a full-time job, family commitments with a PhD has been the greatest challenge for me, and Les understood this and never pushed me too hard, although sometimes I probably needed a slight push or two. But we managed to work through this at a steady, consistent pace, and I shall never forget the many nights spent at his house, drinking copious amounts of coffee, chatting and working on completing analyses or putting the final touches to chapters. Les, you have not only given me the guidance necessary to complete this ‘chapter’ in my life, but have strengthened my capacity as a scientist, something which I hope to continue building on into the future. To my co-supervisor Dr Anthony (Tony) J. Williams I owe a big thank you. Early on in my PhD we used to sit for a couple of hours a week in his office talking about specific chapters or just waterbirds in general. From these discussions, endless loose pieces of paper with numerous scribbles on them ended up in my possession from which I was meant to interpret later, and quite often I used to head back to Tony’s office for a translation update. Nevertheless, these discussions, ‘notes’ and emails were extremely valuable and provided valuable input into my thesis. Thank you Tony! You so often helped me re-focus my attention on the more ‘practical’ aspects of waterbird ecology and often this was needed as I would often be aiming beyond the scope of the study or had misinterpreted some result or analysis. If there are two things that Tony has left me with it is that you can never have too many references and that it is all about the ‘philosophy’, and not so much about the actual results, provided the latter has been carried out correctly. I am grateful to CapeNature, through Tony Williams, for access to some of the datasets used in the thesis. Numerous people, most now ex-employees of the organisation, diligently carried out surveys at Rocher Pan, De Hoop Vlei and Droëvlei since 1979. Although these surveys were intended to be reported on, only short summaries were published. I am therefore grateful that I could use these data to carry out more detailed analyses and to (eventually) get these results into the scientific domain. Principal staff who diligently coordinated counts at the above sites included: CW Heÿl, MH Currie, G Palmer, A Scott, M Scott and K Shaw. To Vince Ward, who previously worked for CapeNature, I owe a debt of gratitude for digitising the data from De Hoop Vlei (Appendix D). This was a laborious and mundane job but he managed to finish it speedily and efficiently. Cape Nature also provided some funding to reimburse volunteers for their travelling expenses to the Bot River estuary (Chapter 4) in order to carry out counts. This thesis would not have been possible if it were not for the many CWAC volunteers who gave up (and still give up) their ‘Saturday mornings’ to spend a few hours counting waterbirds. To do this month after month, year after year takes enormous effort and

xv
dedication. I will be forever grateful for ‘their man-hours’, turning their observations into useful science and conservation outcomes. In no particular order I would like to mention some of the volunteers who have contributed to some of the datasets here. A list of this nature is bound to miss some people for which I apologise. Yvonne Weiss and Graham Tong were instrumental in setting up the Paarl Monitoring Group, a group which conducted (and is still conducting) counts at Paarl Waste Water Treatment Works (Appendix A) from 1994–2004. Other core members of the group who assisted Yvonne and Graham by diligently conducting counts were Ben Weighill, Sally Weighill, Jeanette Fisher, Louis Hugo, Keith Morgan, Jo Hobbs, Patrick Hurley, Pikkie Rousseau, Penny Lloyd and Rita Meyer. Many others assisted on one or more occasions. Cedric Morkel, Superintendent of the Paarl Waste Water Treatment Works, provided useful information on structural changes to the sewage works and data pertaining to water-level fluctuations, organised building and maintenance of the hides, and of the kingfisher bank. Yvonne and Graham helped supply additional information on the history of the sewage works. Another person who I need to make special mention of is Mariana Delport, from the Tygerberg Bird Club. She has been coordinating waterbird counts at the Bot River Estuary (since 1993) and Droëvlei Dam (since 1995), and is still active in this role today. She was instrumental in coordinating and setting up the monthly counts programme at the Bot River Estuary so that ‘we could see what happens to the birds after they opened the mouth’. It was an onerous task especially because there were no local skilled observers based near the estuary and volunteers had to be sourced from the Tygerberg, Cape Town, Hermanus and Kleinmond Bird Clubs. She managed to get people to count monthly for almost three years (an almost impossible feat) and this data formed the bulk of the data in Chapter 3. Her ‘band of merry counters’ consisted of Lesley Teare, Kevin Drummond-Hay, Rodney and Anke Gray, Penny Palmer, Joy Rüger, Helene Thompson, Ray Gordon, Ken Winterton, Alf Friend, Bernie Edgcumbe and Beverley Patterson; many other observers assisted on one or more occasions. For Droëvlei Dam (Appendix B) stalwart observers included Bernie Edgcumbe, Jurie Fourie, Douw Steyn, Jim Eva, Helene Thompson, Bobby and her late husband Etienne de Villiers, Beverley Patterson, Gerald Wingate and John Fincham; some additional observers helped out occasionally. There is some considerable overlap in the two groups and I am grateful to these dedicated and committed birders/volunteers for making huge contributions to waterbird conservation efforts in the Western Cape. Lastly, to Mariana. A BIG thank you for everything – the emails asking for more data, the Skype messages quering one or two things, the photos of Droëvlei Dam. You have been a star, and at last we will be able to see the Bot and Droëvlei data used! I would also like to thank Lesley Teare, from the Tygerberg Bird Club, for coordinating the ‘Bot counts’ when Mariana was unable to take on this role. I would like to thank Petro Diedericks and Tracy Carstens from Department of Water Affairs for supplying water-level and flow data for the Bot River Estuary that I used in Chapter 4, and to Steve Gildenhuys of CapeNature for supplying salinity data for the estuary. Thanks Steve. You were always willing to help, even when computer crashes and glitches occurred!

xvi
I am thankful to numerous staff and colleagues at the Animal Demography Unit, University of Cape Town:
To Sue Kuyper for her constant encouragement and support, not only related to my actual PhD but also for being a shoulder to lean on through some of my personal frustrations that I faced. Thank you Sue for your patience, listening ear, advice and cups of coffee and pasta at 11 pm!
To Michael Brooks for his IT support, in particular helping with data extraction and manipulation, and the production of some of the maps, particularly in Chapter 2. Thanks Mike for your time and inputs all of which helped in streamlining the functionality of my own working data files.
For assistance and guidance with using ‘Program R’ to produce the graphical outputs in Chapters 4 and 5, I am hugely indebted to Rene Navarro and Res Altwegg. Rene also provided guidance and advice when it came to the cosmetics of the thesis. Thanks Rene, and for all your support and encouragement.
To everyone else at the ADU, thanks for your encouragement and good wishes throughout. Often that little push, or that little ‘keep going’ attitude helped me to stay positive and motivated at times when things seemed too overwhelming.
Margaret Koopman, librarian at the Niven Library, Percy FitzPatrick Institute of African Ornithology, University of Cape Town, helped in so many ways to source references that were not available at the University of Cape Town libraries. She was always willing to help and provided a friendly and efficient service. I would like to thank Lara van Niekerk of the Council for Scientific and Industrial Research (CSIR) from providing water-level data and other comments on the Bot River estuary. I am grateful to Simon Delany and Tim Dodman from Wetlands International for useful discussion around global threshold levels. I was really grateful for their quick responses when deadlines were tight. My thanks also go to Tom Langedoen of Wetlands International for supplying waterbird census data from the International Waterbird Census database. Terry Oatley, Brian Colahan, Kevin Shaw and Craig Whittington-Jones all provided valuable input into some of the history of waterfowl counts in South Africa. We had many interesting email chats and they provided references that I was often not even aware of, or were able to help in correcting some of the references that I was able to source. Some of this meant digging into the library archives of their respective provincial nature conservation departments. Thanks guys! I really appreciated all your efforts. I found these communications really interesting and maybe one day we can all put our heads together and document this history in some more formal manner. Illustrations used in chapter and appendices cover pages are taken from the Southern African Bird Atlas and used by permission of BirdLife South Africa. The contributing artists are as follows: S. MacLarty, Glossy Ibis (Chapter 1), P. Meakin, Curlew Sandpiper (Chapter 2), P. Meakin, Pied Avocet (Chapter 3), P. Noall, Red-knobbed Coot (Chapter 4), S. MacLarty, Yellow-billed Egret (Chapter 5), J. Rooke, Black-necked Grebe (Chapter 6), R. Denison, White-winged Tern (Appendix A), I. Jordaan, Egyptian Goose (Appendix B), P. Noall, Cape Shoveler (Appendix C) and J. Rooke, Yellow-billed Duck (Appendix D).

xvii
This study was supported through a National Research Foundation doctoral bursary to DMH. The World Wildlife Fund for Nature – South Africa, BirdLife South Africa and the Tony and Lisette Lewis Foundation provided financial assistance to the Coordinated Waterbird Counts (CWAC) programme of which the results reported here form part. To my parents, Mervyn and Patricia Harebottle, I owe so much. It has been a long road, dad and mom. From humble beginnings in the Kruger National Park to joining the Witwatersrand Bird Club as a junior member – I always knew, since my high-school days, what career path I wanted to follow. You humbly sacrificed for me to go to University and to leave with a M.Sc.in Zoology. I felt proud of my achievement and I know you were proud of me. This provided the perfect grounding and, although I probably should have followed through with a PhD then, life threw some curve balls and I got to do some ‘other learning’. Well, here it is mom and dad, my dream that has come true. You guys have been so supportive and I really appreciate all that you have done for me over the years. Your constant love and guidance has been pivotal in my life. Thank you both. I love you both very much! To my sons, Michael and Regan. What can I say? I hope that by seeing your father working aimlessly behind his computer night after night with papers and books surrounding the table and floors, it will inspire you to achieve great things in your life. Aim high, achieve your goals and most of all pursue your dreams, as I have mine. There is nothing better than having the personal satisfaction of seeing your hard work pay off. So, whatever your desires and passions are in life, know that I am right behind you in whatever you choose to do, as you have been behind me during the last number of years. We will now have more time to do the things that we have missed out on. I love you both very much. Lastly, and importantly, to my wife Samantha. I cannot begin to express the gratitude that I have for you in allowing me to pursue this PhD. We knew that things were going to be tough and demanding, and they were! You have sacrificed immensely but at the same time you have been a pillar of support and strength to me. When times got tough you constantly pulled me through and said “We’ll get there”. Running a family, a household and keeping up a job at the same time has been exhausting for you but you have done a sterling job in keeping everything together. How you did this has amazed me. Things often got tough but somehow we pulled through and you were always there putting me first to make sure that I focussed on getting this thesis finished. Your help in checking references, and syntax and spelling in final drafts made a huge difference and for this I am deeply grateful. I owe you so much – but know that your enduring support, constant encouragement and most of all your love has been the ‘energy’ that kept me sane during this time. I love you and I hope that we can now look forward to a future filled with many exciting and new opportunities.

1
Chapter 1
Introduction and background

2

3
Introduction
Wetlands and wetland conservation in a global context
Wetlands cover 4–6% of the earth’s surface and are considered to be one of the most
productive ecosystems on earth’s surface (WWF/IUCN 1988, Maltby 1991, Wetlands
International Africa 2009). Globally many wetlands are under threat (Finlayson and
Moser 1991, Cowan 1995, Davies and Day 1998, Terpstra 2003). In the USA it is
estimated that more than 54% wetlands had been lost by the mid-1980s, primarily to
agriculture and industrialization (Gibbs 2000). Foote et al. (1996) described how an
increasing rural population in India places enormous pressure on natural wetlands and
described 12 major causes of wetland loss in that country, agriculture again dominating
as the primary cause. In south-western Australia, Davis and Froend (1999) found that
70% of the wetlands along the coastal margins had been lost to agriculture and urban
development.
In South Africa, Kotze et al. (1995) and Breen and Begg (1989) surmised that
similar trends as described above have occurred and that as much as half of all natural
wetlands were lost in the 20th century, mainly to agriculture and urbanisation. At the
same time, numerous artificial wetlands have been created: state impoundments, large
numbers of farm dams, sewerage works in cities, towns and villages, “water features” in
all manner of contexts (from shopping malls to golf courses) and sportsfields that flood
seasonally (Taylor et al. 1999, Brown and Magoba 2009, Duckworth et al. 2012).
Natural wetlands provide important functions that are essential to the
functioning of biotic communities and maintaining quality of the environment (Noble
and Hemens 1978); these include inter alia shoreline stabilization, flood control,
sediment and nutrient retention, and food chain support (Maltby 1991). Waterbirds, as
top trophic organisms in wetlands, are intricately linked to these systems and are
dependent on these systems for survival and in particular for the provision of food,
nesting material, and breeding and roosting habitats (Dennis and Tarboton 1993).
Generally wetlands are used by a host of different species which either exploit them
throughout the year (resident species) or for only part of the year (migrant and nomadic
species). Thus, wetland sites whether at a local scale or at a global or flyway scale form
important habitat chains for waterbirds which are mobile and able to use a variety of
different sites through the year. The amount of usage, and by how many species and
individuals, can vary depending on environmental conditions. It is in this context that
this thesis was developed.

4
Rationale for this thesis
Waterbirds are generally conspicuous; many are charismatic and others congregate in
large numbers. This makes them readily countable and ideal candidates for long-term
monitoring programmes. Gillisen et al. (2002) stated that “no other group of birds have
been so comprehensively and frequently surveyed”. Their association with wetland
ecosystems makes them good indicators for the condition of these environments. They
are also valued by numerous stakeholders including local human populations, tourists
and hunters (both sport and subsistence) (Gillisen et al. 2002). But ultimately wetlands
play important ecological roles for waterbird populations whose survival and annual
cycles (breeding, moult, migration, etc.) are dependent on these habitats.
Over the last 60–70 years in South Africa, waterbird studies, which have been
based on survey data, have largely been either site-based or species-focused (see below).
Notwithstanding the value of the outputs produced from these studies, they have limited
conservation application for a group of species which are mobile and respond relatively
quickly to changing seasonal and exceptional rainfall, dynamic habitat changes and
hydrological regimes. Regional approaches to understanding the occurrence, abundance
and conservation importance of the full suite of waterbirds have rarely been undertaken
in southern Africa. Winterbottom (1960) conducted multiple vlei counts in the Cape
Town area while Boshoff and Palmer (1991), Boshoff et al. (1991a, b, c) and Boshoff and
Piper (1993) carried out an intensive study at the Wilderness-Sedgefield lakes; the latter
study compared waterbirds across six waterbodies in an area encompassing about
100km2 along the southern coast of the Western Cape. A larger spatial study was done in
Botswana by Herremans (1999) who looked at waterbird densities and seasonality in the
Kalahari Basin (c. 1 050 km2).
Initially, the primary objective of this thesis was to explore patterns of waterbird
abundance at major wetlands in the winter rainfall region of the Western Cape, and to
assess their conservation importance. However, it soon became clear that the standard
approach to wetland assessment, the time-honoured 1% threshold criterion of the
Convention on Wetlands of International Importance (Ramsar Convention) (Wetlands
International 2006) was not sensitive enough to describe the avifaunal value of
wetlands. Thus a key thrust of the thesis became deflected into the development of a new
approach to assess the importance of wetlands based on waterbird surveys. The
effectiveness of this new tool is first demonstrated on a flyway scale, using data from
Europe, western Africa and southern Africa. The thesis then returns to its original focus
on the Western Cape’s wetlands, and uses the new tool as part of the assessment of the
conservation value of these wetlands, based on long-term waterbird surveys.

5
Scope and aims of this thesis
This thesis considers waterbirds and wetlands within the East-Atlantic flyway and in
the winter rainfall region of the Western Cape Province, South Africa. Further details
and reference to the East-Atlantic flyway is made in Chapter 2. The winter-rainfall
region is described in more detail below, but in general waterbirds, and biotic
communities, experience different annual climatic and environmental conditions here
compared with the rest of South Africa which receives predominantly summer rainfall
(Cowling et al. 1997, Schulze and Maharaj 2007).
Based on this the broad aims of this thesis were four-fold:
1) To introduce and describe a new and innovated method to assess the conservation
value of wetlands based on waterbird survey data;
2) Application of the method to determine its effectiveness and value in evaluating
waterbird conservation priorities at various spatial scales;
3) To analyse and critically assess long-term waterbird data at five representative
wetland sites in the winter rainfall region through application of this new method
and other assessment tools; and
4) To assess the outcomes of the site analyses in a regional context as a model for
determining waterbird conservation priorities in the winter rainfall region;
subsidiary aims here were to establish relationships and links amongst
prominent wetlands in the Western Cape in order to try and determine how
waterbirds use sites and what the critical wetlands are for waterbirds in the
winter rainfall region.
Data for the analyses were drawn from three main sources: the International Waterbird
Census (IWC) (Wetlands International 2006), Southern African Waterfowl Census (TB
Oatley in litt.) and the Coordinated Waterbird Counts (CWAC) programme (Taylor et al.
1999). There was some overlap between the data sources and data were either used in
isolation or, where applicable, combined between the two data sources to generate a
longer time series.
From the results I attempt to draw conclusions and recommendations based on
the following questions:
1) Is the new conservation value assessments a valuable and important conservation
tool?

6
2) How important are data graphics and presentation in displaying an interpreting
waterbird assessments?
3) Were the site analyses valuable, based on the quality and quantity of data used?
4) Can this regional approach discern linkages between the sites based on the data
presented and provide conservation outputs?
5) How useful and practical are the Coordinated Waterbird Counts protocols in
relation to other (e.g. are count times and frequency appropriate for long-term
waterbird population monitoring, and if not, why not)?
6) What does the future hold for waterbird monitoring in the region?
7) What does this mean for waterbird conservation in the winter rainfall region and
Western Cape Province?
Background
Climatic and wetland overview
In the context of this thesis, I discuss the climatic conditions present in South Africa.
This is followed by a consideration of wetland regions and wetlands in the winter rainfall
region.
South Africa’s climate
Schulze et al. (2007) classified South Africa into 12 climatic zones using the Köppen
classification system (Figure 1.1, Table 1.2). The system is based on rainfall magnitudes,
rainfall seasonality and rainfall concentration, as well as durations above or below
threshold temperatures on a monthly basis.
In terms of precipitation most of South Africa falls within the summer rainfall
region (Figure 1.2) which is characterised by warm, wet summers and cold, dry winters.
Mean annual rainfall for South Africa is about 500mm with the eastern regions being
wetter (500–800 mm) than the western parts (< 300 mm) (Schulze 1997). The summer
rainfall region largely constitutes the inland plateau occurring above the Escarpment
(600–1 250 m.a.s.l.). Precipitation primarily occurs as thunderstorms, and winters
usually contain frost and in higher lying regions snow is frequent. The region with year-
round rainfall consists of narrow strip of coastal plain between Breede River Mouth and
Port Elizabeth. Rainfall is fairly uniform throughout the year with the mean annual
rainfall exceeding 1 000 mm.
The region of South Africa relevant to this thesis encompass three zones: a desert
zone along the western coastal region, a Mediterranean zone along the western coastal
region and a Mediterranean zone in the Cape Fold Mountains (Figure 1.3). All three

7
regions have an overall strong dry and arid component to them; the Mediterranean zone
is described below.
The winter rainfall region of South Africa
The southwestern part of South Africa constitutes the winter-rainfall region (Figure 1.2).
It stretches from the Olifants River estuary on the Atlantic Ocean to the Breede River
estuary on the Indian Ocean. Most rain falls between May and September, the austral
winter months, with peak rainfall usually from June–August; the amount and intensity
of rain varies spatially and temporarily (Schulze and Maharaj 2007). In the region to the
north of the Olifants River mouth, in the Northern Cape Province, the landscape is arid
with hot, dry summers, and warm winters with erratic rainfall; mean annual rainfall is
less than 250 mm per annum (Schulze 1997). To the south of the Olifants River Mouth
the region falls within the Western Cape Province, and is classified as having a
Mediterranean climate. Here, summers are warm and dry with strong south-east
prevailing winds (known locally as “The Cape Doctor”) while in winter north-west winds
bring the cold fronts and associated rain that falls as prolonged showers (Appendix 1.1).
Mean annual rainfall is c. 400 mm per annum in this region but rainfall varies in the
amount and intensity; more rain falls in the southwest and along the southern coastal
sections than in the interior and along the west coast of the Western Cape. There is also
a large variability in the timing of the start and end of the rainy season, and in the
amount of rain that falls at a single locality. This region, due to its Mediterranean
climate, is more commonly referred to as the winter rainfall region in South Africa and is
the area of focus for this thesis, hereafter referred to as WRR.
The vegetation in the WRR is dominated by plants of both the Fynbos and
Succulent Karoo Biomes. The fynbos is characterised by species belonging to the
Proteaceae, Ericaceae and Restioaceae, while short karoo scrub vegetation dominates the
succulent karoo landscape. The fynbos vegetation is well adapted to survive the dry,
windy summer periods (Cowling et al. 1997).
Wetland regions of South Africa
Cowan (1995) classified four broad wetland regions in South Africa based on the general
morphology of the country: plateau, mountains, coastal slopes and rimland, and coastal
plain. These were further subdivided into sub-groups within each region based on
geomorphology and climate. A total of 26 wetland regions was delineated (Figure 1.3).

8
Within the scope of this thesis, three of these wetland regions fall within the
winter rainfall region: Western coastal slope – desert, Western coastal slope –
Mediterranean and Cape Fold Mountains – Mediterranean (Figure 1.3). The first two
regions form part of the coastal plain in the region and are divided into the drier, arid
region in the north and the moister, semi-arid Mediterranean region in the south; the
Cape Fold Mountains constitute the high-lying interior escarpment region.
Wetlands in the winter rainfall region
The WRR supports a variety of different wetland types. Natural wetlands include
estuaries and estuarine bays, palustrine wetlands (marshes and vleis), lacustrine
wetlands, rivers and seasonal pans; artificial sites incorporate impoundments, farm
dams, waste water treatment works and commercial salt pans.
Historically, this region, and in particular the Cape metropolitan area, contained
more natural wetlands than what is present today (Brown and Magoba 2009). Prior to
colonization by Dutch settlers in the mid-1700s and later by the English in the early
1800s, the region’s coastal plain had large floodplains and its associated marshes and
vleis (freshwater lakes) were extensive, largely inter-linked and undisturbed (Stephens
1929, Southern Waters 2000). The Cape Flats, a flat coastal plain area stretching from
the eastern slopes of Table Mountain 50km westwards to the Hottentots Holland
Mountains, contained many large palustrine wetlands (Brown and Magoba 2009), but
with the development of roads and settlements in the mid-1840s (Stephens 1929), most
of these were drained and filled to make way for a growing human population and
agriculture. Human activities and disturbance changed the size and shape of many of
larger palustrine wetlands and rivers in the region, and in particular on the Cape Flats
(Stephens 1929, Southern Waters 2000). The distribution and extent of present day
wetlands in the region therefore represents the remnants of these larger wetlands and
wetland systems. Historically, waterbird populations would have been far more
abundant and widespread in the region when wetlands were more expansive and more
permanent. Nowadays, due to the loss and degradation to wetlands over the past 300
years, waterbirds make use of a smaller ‘pool’ of natural, permanent wetlands and utilise
more temporary and artificial wetlands (Brown and Magoba 2009).
Seasonally, most of the palustrine wetlands usually start to fill from about May
onwards with the start of the winter rainfall; inundation is either directly from rainfall
which raises the water-table or from inflow from the catchment via rivers and streams.
After September when most of these wetlands have reached peak inundation; this also
coincides with the start of summer when there is high plant and invertebrate

9
productivity (Cowling et al. 1997). The extent of the annual level of peak inundation
depends on the amount of rainfall during the preceding winter. Water-levels start to
subside from about December when hot, dry and windy conditions prevail and lead to
high evaporation levels (Schulze 1997). Some wetlands dry out completely from about
January onwards; some only dry out in drought years. Dry conditions persist until
April–May when the wetlands start to fill again with the onset of the first winter rains.
Permanent wetlands are not subject to the extent of seasonal change of
ephemeral systems. This is particularly true of estuarine bays and permanently open
estuaries which are influenced more from tidal exchange; estuaries have increased
freshwater input during the rainy season. Sewage works, reservoirs and impoundments
generally experience small fluctuations in water-levels during each wet-dry cycle each
year; these fluctuations are usually small or negligible but can vary depending on the
amount of rainfall and extent of the dry season period. Farm dams, are generally smaller
waterbodies than state dams, and vary in their seasonal response to rainfall; however
they are usually subject to greater fluctuations and often dry out towards the end of the
dry season (Davies and Day 1998).
Inundation patterns of wetlands in the WRR are variable both spatially (between
sites in different areas) and temporally (between years). Consequently, waterbirds are
faced annually with varying conditions in different areas at different times of the year.
This variation is based on factors affecting the hydrology at each site and include:
location in the region, location in the catchment, rainfall, temperature, evaporation rates
and wind strength (Davies and Day 1998, Roshier et al. 2002, Brown and Magoba 2009).
A brief overview of the history of waterbird counts and relevant previous studies
Waterbird monitoring – a global perspective
Ever since the time of the Egyptians, waterbirds have held fascination for man and can
nearly always be traced back to hunting for food and sport (Kuijken 2006). It was not
until the mid-1800s during the rise of the industrial revolution that conservation
thinking developed around nature and wild animal populations. However, it was the
development of large scale hunting of wildfowl in the early parts of the 20th century
which placed growing pressure on wild populations and concerns were raised from
naturalists. Through nature conservation organisations and ornithological societies,
naturalists and ornithologists rallied to combat the decline in wild bird populations but
notably wildfowl (Kuijken 2006). The International Committee for Bird Preservation
(now BirdLife International), established in 1922, initiated an International Wildfowl

10
Inquiry in 1941. This probably represented the first coordinated effort to monitor
wildfowl populations on a global scale.
In 1967, the International Waterfowl and Research Bureau (now Wetlands
International), launched its International Waterbird Census through mid-winter
(January, the southern hemisphere summer) censuses of waterfowl in Europe, and some
countries in Asia and Africa. This has continued as a key activity of the organisation and
today over 100 countries, from Africa, Asia, the Neotropics and North America
participate in the counts and which now include all waterbirds (see definition below).
The results of the International Waterbird Census have been used in the designation of nearly
half of the 1 369 Wetlands of International Importance in 138 countries designated under the
Ramsar Convention (http://www.wetlands.org).
Waterbird counts in South Africa and the Western Cape
Waterbird monitoring apparently started in South Africa in the late 1930s and early
1940s; Table 1.1 provides a chronological list of the major published surveys of wetlands
in the winter rainfall region. The first was by Broekhuysen and Meikeljohn (1941) who
reported on casual but regular observations of Palearctic migrant shorebirds at some
local wetlands in the Greater Cape Town area. The Cape Bird Club was formed in 1948,
in Cape Town, and many members participated in ‘bird counts’. The ‘Cape Bird Club vlei
counts’ were started in 1952 (Winterbottom 1960) and were possibly one of the first
coordinated waterbird census projects to be undertaken, largely by volunteers, in the
Western Cape, and possibly South Africa. Winterbottom (1960) reported results from
these vlei counts and also made reference to unpublished studies carried out by Richard
Liversidge on the Black River, Cape Town, prior to the start of the Cape Bird Club vlei
counts in 1952. During this period bird monitoring was generally led and coordinated by
ornithologists based at the University of Cape Town but were well supported by
members of the Cape Bird Club.
In the 1950s, a few sites (e.g. Strandfontein Sewage Works and Rietvlei) started
to be surveyed on a more regular basis (Blaker and Winterbottom 1968). From these
surveys, Strandfontein Sewage Works emerged as a valuable site for waterbirds in the
Western Cape. Monthly surveys, instigated in 1985, were still maintained by members of
the Cape Bird Club in 2011; only a handful of surveys have not taken place (due to bad
weather or lack of suitable manpower). This dataset represents one of the longest
running surveys at a single site at this count frequency in South Africa, and at least in
Africa. Kaletja-Summers et al. (2001a, b) analysed the Strandfontein and Rietvlei
datasets in the early 2000s.

11
During the 1970s and 1980s bird club members also surveyed waterbirds (with
annotated lists of terrestrial species) at a number of wetlands that were under threat
from developments. Two of these included the construction of a residential marina at the
Zandvlei River estuary and the construction of the Milnerton golf course next to the Diep
River estuary; for the latter a 10-year dataset of almost monthly counts exists but
remains unpublished (Animal Demography Unit unpubl. data). Table 1.1 highlights how
the value of the surveys and integrity of the data improved through each decade since
the Broekhuysen and Meikeljohn (1941) counts.
There are also examples of specific waterbird census programmes that have been
set up since the 1950s in southern Africa and South Africa. The African Wildfowl
Enquiry, launched in June 1954 (Anon. 1954), was intended to undertake a
comprehensive investigation into the biology, behaviour and status of ducks and geese in
the southern hemisphere of Africa. The enquiry was coordinated by the Southern African
Ornithological Society (now BirdLife South Africa) and the Witwatersrand Bird Club.
Winterbottom (1964) and Frost (1971, 1972) reported on some results, but this dataset
remains largely unanalysed. The field cards are currently stored in the Animal
Demography Unit, University of Cape Town and were in the process of being digitised in
2010 and 2011; these data will provide opportunities for long term analyses in the
coming years (LG Underhill pers. comm.). It will provide an excellent baseline against
which recent data can be compared to detect changes in distribution and abundance of
species at a sub-regional level.
The South African Waterfowl Census was initiated in 1979 (TB Oatley in litt.)
and, like the African Wildfowl Enquiry, focused on gathering information on waterfowl.
However, the programme was confined to wetlands in South Africa and coordinated
through the Ornithological Research Station at the Barberspan Bird Sanctuary, then
located in the Transvaal Province (now the North West Province), and implemented
through the five provincial nature conservation agencies at the time. Data collection
aimed at the abundance, breeding and moulting of ducks and geese (Anatidae) at major
wetlands in South Africa, but also included other conspicuous waterbirds such as Red-
knobbed Coot, Greater and Lesser Flamingo, and Great White and Pink-backed Pelican.
All waterbird species were included in the censuses at most sites after a few years.
Scientific names are contained in Appendix 1.2. The programme ended in the early
1990s. A large proportion of these data remains unpublished (C. Heÿl pers. comm.) but
the programme did collect good quality data from specific wetlands over a 12–year
period. Data from these surveys have been used here (Chapter 4, Appendices A–D).

12
In the 1970s, the Western Cape Wader Study Group (WCWSG) was established
and there was a strong focus on carrying out ‘wader’ (shorebird) counts around the
coastline of South Africa (Underhill 1979). Although there was a tendency to focus on
Palearctic migrant species, resident species were also considered. Numerous surveys
were undertaken and published under the auspices of the WCWSG (Summers et. al.
1976, 1977, Underhill et al. 1980), some even considering all waterbird species during
the surveys (Underhill and Cooper 1984, Underhill 1987).
As the extent of waterbird surveys increased, so the number of waterbird studies
grew after 1960. These studies took place at a site level or taxonomic level. I select a few
key examples of studies: both Liversidge (1958) and Brooke (1960) studied waterfowl
abundance on pans in the gold mining areas of the Free State; Geldenhuys (1976a, b)
provided a provincial overview of abundance and breeding of waterfowl in the Free
State; Skead and Dean (1977) carried out a thorough study of waterfowl at Barberspan
Bird Sanctuary, North West Province; Martin and Baird (1987) provided an overview of
waterbirds at the Swartkops Estuary, Port Elizabeth, Eastern Cape; both Martin and
Randall (1987) and Velásquez et al. (1991) considered the usage and impact of
waterbirds at commercial salt pans; Boshoff and Palmer (1991) and Boshoff et al. (1991a,
b, c) analysed count and breeding survey data of waterbirds at coastal lakes in the
Wilderness region of the southern Western Cape. In addition, bird atlas data were used
to assess seasonality of migrant shorebird occurrence (Underhill et al. 1992) and
waterfowl breeding seasonality in the Western, Eastern and Northern Cape provinces
(Little et al. 1995). Counts at roosts of colonial waterbirds have also been undertaken
(Tarboton 1977, Harebottle and Wheeler 2004) to provide better estimates of population
sizes. Guillet and Crowe (1986) provided a preliminary overview of general patterns of
waterbird distribution and diversity in southern Africa.
From a taxonomic perspective there have been numerous reviews and studies of
individual species. From the 1950s to the 1970s there was a large emphasis on ducks
and geese (e.g. Middelmiss 1958, Brand 1961, Rowan 1963, Siegfried 1965a, b,
Winterbottom 1974), while a coastal seabird focus in the 1980s and 1990s produced
species reviews for inter alia Cape Cormorant (Cooper et al. 1982), Kelp Gull (Crawford
et al. 1982), Hartlaub’s Gull (Williams et al. 1990), Swift Tern (Cooper et al. 1990 and
Caspian Tern (Cooper et al. 1992). The Western Cape Wader Study Group was
responsible for a series of papers on Palearctic migrant shorebirds: Curlew Sandpiper
(Elliott et al. 1976), Sanderling (Summers et al. 1987), Ruddy Turnstone (Summers et al.
1989), Grey Plover (Serra et al. 2001) and Red Knot (Summers et al. 2010, 2011).

13
The studies mentioned above indicated the growing need for waterbird
monitoring and documentation of results. Besides adding to scientific knowledge, the
value of waterbirds as wetland indicators was becoming apparent (see Paillisson et al.
2002). However, most studies were largely confined to sites, habitats or species groups.
Apart from the African Wildfowl Enquiry and South African Waterfowl Census
programmes, which primarily focused on waterfowl, no coordinated programme existed
to monitor all waterbirds at a national scale, and on an ongoing basis (Underhill et al.
1991).
The Coordinated Waterbird Counts – a new programme for a new era
In November 1991, the Coordinated Waterbird Counts (CWAC) programme was
launched by the then Avian Demography Unit (now Animal Demography Unit) at the
University of Cape Town, under the auspices of the Ramsar Working Group, a committee
of the South African Department of Environmental Affairs and Tourism (DEAT) (Taylor
et al. 1999). This was in response to South Africa’s obligation to meet monitoring
requirements under Wetland International’s African Waterfowl Census (now African
Waterbird Census) programme which had started in 1991. Participation in this
programme also ensured that South Africa would meet its obligations as a signatory to
the Ramsar Convention and Convention on Migratory Species (CMS) under the Bonn
Convention to which South Africa acceded in 1991 (Cowan 1995).
The programme identified three primary aims (Taylor et al. 1999):
(1) to monitor populations of waterbirds by carrying out regular summer and winter
counts at as many of South Africa’s major wetlands as possible, on an ongoing basis;
(2) to identify and document the threats to waterbird populations and wetlands, and
(3) to coordinate the efforts of amateur volunteers and professional conservators in
achieving (1) and (2).
In 1999, a six-year review of CWAC was published (Taylor et al. 1999) which
provided initial useful site- and species-specific insights. The report concluded that
“…CWAC is producing important and meaningful results which are not available
through any other wetland monitoring project...”. It further emphasised that CWAC’s
importance is manifested in its ability to detect changes in bird populations and species
diversity and not just to report on the numbers and variety of birds at site level. It was
highlighted that the programme should continue at its present level, with the intention
of increasing in scope.
14
Taylor et al. (1999) reported on 189 wetland sites; currently 650 sites are
registered with the programme of which 450 (70%) are counted regularly (Animal
Demography Unit unpubl. data, http://cwac.adu.org.za). By 2011, nearly 300 volunteers
participated during each bi-annual census, and most undertook surveys at the same
sites year after year.
Over the last two decades CWAC has made a significant contribution to our
understanding of how waterbirds use wetlands in South Africa, and has radically
improved on the amount, spread and integrity of data that is collected since the 1940s.
Its value as a scientific and conservation tool is extremely valuable. It is for this reason
that a large proportion of the data used in this thesis is derived from the CWAC
database.
General methodology
Selection of the regional study sites
The wetlands that were selected for the site analyses in the winter rainfall region were
based on the following criteria:
a. they had long-term (minimum 10 years) waterbird monitoring datasets which
comprised a large bulk of monthly data;
b. species’ representation was good at each site and numbers of waterbirds were
large enough to make informed statements about their seasonality and
abundance;
c. they represented a range of different wetland types within the winter rainfall
region of the Western Cape;
d. they were spread across the entire winter-rainfall region of the Western Cape;
e. they represented various levels of protection, which would help assess and
compare protected sites with unprotected sites;
A total of 30 wetlands were selected (Appendix 1.5). Detailed analyses were
carried out at five representative wetlands: Paarl Waste Water Treatment Works, Bot
River Estuary, Droëvlei Dam, Rocher Pan and De Hoop Vlei. Only the analysis for the
Bot River estuary is included as part of the thesis as Chapter 4. The assessments for the
remaining sites follow closely the pattern established by the analyses of the surveys
conducted at the Bot River estuary, and are relegated to the status of Appendices to the
thesis (Appendices A–D). Although the analyses are repetitive, each site had its own
specific issues, and therefore it was deemed appropriate that the reports for each site
should be included as Appendices to the thesis. The results of the analyses at these four

15
sites were used in Chapters 2 and 5. The 30 wetlands were used in a regional
comparison in Chapter 5.
Terminology
In the context of this thesis, it is important to define the terms ‘wetlands’ and
‘waterbirds’ from the outset. Terminology varies geographically and colloquial names are
frequently encountered. By defining these terms here, I hope to avoid ambiguity and
that this will assist in understanding some of the terminology used in this thesis.
Wetlands
The term wetland is commonly defined as an area of water-logged soils dominated by
emergent vegetation (Maltby 1991); however, Davies and Day (1998) stated that
technically ‘wetlands are considered to include any ecosystems whose soils show
evidence of at least periodic waterlogging.’ Maltby (1991) further added that wetlands
typically occupy zones between permanently wet and generally dry environments. Based
on these definitions, areas of marsh and swamp are generally thought of as being true
wetlands. However many different types of landscapes have open water in some way,
whether it be in small pools, large lakes or rivers. Thus wetlands encompass many
different kinds of waterbodies (Davies and Day 1998). Consequently, classification of
wetlands has been relatively controversial due the enormous diversity of wetland types
and their often highly dynamic characters (e.g. are temporary flooded areas included as
wetlands when they are perhaps dry for the greater part of the year?). Therefore, for the
purpose of this thesis, I use the Ramsar Convention (Convention on Wetlands of
International Importance) definition (Ramsar 2010):
The convention defines wetlands as “areas of marsh, fen, peatland or water, whether
natural or artificial, permanent or temporary, with water that is static or flowing, fresh,
brackish or salt, including areas of marine water, the depth of which at low tide does not
exceed 6 m”.
This definition (a) essentially covers much of the characteristics of wetlands and (b) is
the universally accepted definition in terms of classifying wetlands of international
importance for waterbirds, the latter being the focal reason for original designation of
Ramsar sites, and (c) has been adopted by the South African authorities, through its
membership of the Ramsar Convention, for its wetlands programmes (Cowan 1995).
Currently a total of 34 different wetland types constitute the Ramsar
classification for wetlands, comprising 12 marine/coastal wetland types and 22 inland

16
wetland types (Appendix 1.4, Ramsar 2010). Maltby (1991) highlighted that although
this definition and classification is comprehensive and covers the complexity of wetland
types, it should be borne in mind that wetlands exhibit enormous variation, some in the
same wetland area, or at greater spatial scales where many different wetland types
occur in close proximity and form distinct landscapes. Local scale differences could be
manifested in subtle difference in flooding regimes. Nevertheless, wetlands will exhibit
variation based on the following factors – genesis, geographical location, water regime
and chemistry, dominant plants and soil or sediment characteristics. Maltby (1991) and
Davies and Day (1998) concur that the dynamics of water supply and loss (i.e. hydrology)
is probably the most critical factor in determining the development, maintenance and
functioning of wetlands. These aspects impact on waterbirds and other wetland flora and
fauna and so play vital ecological roles in the wetland ecosystem.
In South Africa, the vernacular term ‘vlei’ is commonly used but can have
different meanings in different regions. In the northern parts it usually describes a reed-
bed associated with a river course (similar to a marsh), while in the southern parts it is
generally used to refer to any kind of wetland (Davies and Day 1998), but more
frequently applied to large lake-like waterbodies with reed-beds. The term is often used
to describe the name of the wetland e.g. Nylsvlei, De Hoop Vlei (Appendix D). The word
is of Dutch/Afrikaans origin meaning 'pond', 'marsh', and is pronounced as "flay"
(http://wikipedia.com).
Another South African colloquial wetland term is ‘pan’. This term generally refers
to any large, flat, sediment-filled depression that holds water after rainfall and which
are endorheic in nature, having no outlet (Allan et al. 1995, Davies and Day 1998). If
these pans are situated alongside river-courses these are then referred to as floodplain
pans, and may hold water permanently. Pans that are fed by a river but have no outlet
are usually considered lakes (Davies and Day 1998).
Waterbirds
For this thesis I use the definition based on the Ramsar Convention definition, and
which is also used by Wetlands International (2006). The convention uses the term
‘waterfowl’ in the convention text but they have defined ‘waterbird’ as being synonymous
with ‘waterfowl’ for the purposes of the application of the convention. The Ramsar
definition states that waterbirds are defined as “species of birds which are ecologically
dependent on wetlands”

17
Wetlands International (2006) definitions waterbirds to include all species of the
families Gaviidae, Podicepedidae, Pelecanidae, Phalacrocoracidae, Anhingidae,
Ardeidae, Balaenicipitidae, Scopidae, Ciconiidae, Threskiornithidae, Phoenicopteridae,
Anhimidae, Anatidae, Pedionomidae, Gruidae, Aramidae, Rallidae, Heliornithidae,
Eurypygidae, Jacanidae, Rostratulidae, Dromadidae, Haematopodidae, Ibidorhynchidae,
Recurvirostridae, Burhinidae, Glareolidae, Charadriidae, Scolopacidae, Thinocoridae,
Laridae, Sternidae, and Rynchopidae. Using this approach, only a minority of wetland
bird populations are excluded and most of these are pelagic seabird species that venture
occasionally into in-shore waters (Wetlands International 2006).
For the regional and site analyses (Chapters 3, 4, 5 and Appendices A–D) some of
these waterbird families (Gaviidae, Balaenicipitidae, Anhimidae, Pedionomidae,
Aramidae, Eurypygidae, Ibidorhynchidae, Thinocoridae) are not represented in South
Africa, and are therefore excluded. The remaining families are well represented in South
Africa and species within these families (Hockey et al. 1989, 2005) are discussed in this
thesis.
All the waterbird species considered are listed with their common names and
scientific names in Appendices 1.2 and 1.3; these are to be used as a reference for
Chapters 2 and 3 respectively. Due to the nature of the regional analyses (Chapter 5),
additional fields were included, namely: occurrence status, species group, feeding guild,
Red Data status (if applicable) and preferred habitat for each species (Appendix 1.3). For
scientific and vernacular names I have followed Hockey et al. (2005) and Wetlands
International (2006) throughout this thesis. For the sake of brevity, I do not follow the
normal convention of giving scientific names for species at first mention in each chapter;
the scientific names are available in Appendices 1.2 and 1.3.
For occurrence status (in Chapter 5) birds were grouped into southern African
residents and Palearctic migrants. Southern African residents are defined as species
that breed in southern Africa and undertake local and/or long-distance movements
within the region; the Greater Flamingo is the only species that can be regarded as truly
migratory in this group moving regularly between their breeding grounds in Botswana
and Namibia and other regions in southern Africa (Williams and Velásquez 1997).
Palearctic migrants are those species that breed in the Palearctic region during the
boreal summer (June–August) and then undertake long-distance migrations to spend the
non-breeding season during the austral summer (September–April) in the southern
hemisphere. In the thesis I refer to southern African residents as ‘residents’ or ‘resident
species’ and Palearctic migrants as ‘migrants’ or ‘migratory species’.

18
Species groups were categorised into waterfowl, cormorants and darter, pelicans,
waders, flamingos, shorebirds, cranes, gulls, terns, rallids, and raptors. I use the term
waterfowl to define ‘open-water’ species included in the Anatidae, Podicepedidae and two
species in the Rallidae, Red-knobbed Coot and Common Moorhen. The African Darter is
included with the cormorants due to the similar feeding habits of the two species groups.
I use the terms ‘waders’ to refer to those species constituting the families Ardeidae,
Scopidae, Ciconiidae, Threskiornithidae, Phoenicopteridae and Recurvirostridae, and
‘shorebirds’ for species in the Charadriidae and Scolopacidae families, thus following
“American” conventions for these terms.
Species were grouped into four feeding guilds: herbivores, piscivores, invertebrate
feeders and carnivores. Where a species’ diet overlapped between two guilds the type of
food making up the largest proportion was used to assign a species to a specific guild;
dietary information was sourced from Hockey et al. (2005). This information is relevant
to Chapters 4–5 particularly regarding data analysis, and mention or description of a
species, its occurrence status, group or foraging guild should be cross-referenced with the
table in Appendix 1.3.
Conservation assessment
A large focus of the thesis is the assessment of the conservation and global/regional
importance of each of the selected sites based on the waterbird community present. This
was done based on two sets of criteria: (1) identifying threatened species based on the
threat status contained in Barnes (2000) and (2) assessing species which supported
significant numbers of birds. In turn, this was done in two ways: firstly, using the
standard Ramsar criteria, and secondly, using a new approach developed in this thesis.
For the former, the Ramsar criteria and BirdLife International’s Important Bird Area
(IBA) sub-regional thresholds were used (Wetlands International 2006, Barnes 1998).
The Ramsar criteria state that “a wetland should be considered important if it regularly
supports 20 000 or more waterbirds and/or regularly supports 1% of the individuals in a
population of one species, or sub-species of waterbird”. The Ramsar 1% thresholds are
also used by BirdLife International to designate Global IBAs, but in southern Africa a
Sub-regional IBA category was introduced due to the mainly episodic nature of wetlands
where the 1% level would rarely be applied. Here a 0.5% threshold was set to identify
important wetlands in this category. The new approach to wetland conservation
assessment is described and evaluated in Chapters 2 and 3.
19
Species were also assessed at provincial (Western Cape) and, where appropriate,
metropole (Cape Town) levels using estimated values for their respective populations at
these levels. The Cape Town metropole region is shown in Figure 1.5.
The 1% and 0.5% threshold levels and provincial and metropole population
estimates are given in Appendix 1.4. Where results are given in each of the site analyses
(Chapter 3 and Appendices A–D) concerning application of the 1% and 0.5% criteria, and
provincial or metropole significance, reference should be made to this appendix for the
actual threshold levels or population estimates.
Data and analysis considerations of the thesis
The seasonality, abundance and trend analyses for each of the five wetland sites in the
Western Cape were similar (Chapter 4, Appendices A–D). The analysis at the Paarl
Waste Water Treatment Works (Appendix A) was the first to be published (Harebottle et
al. 2008). For this reason, the standard data analysis methods (abundance, seasonality
and inter-annual variation) are described in more detail in Appendix A than in the other
site analyses (Chapter 4, Appendices B–D).
I refer to southern hemisphere seasons: summer is defined as the six months
from October to March and winter as the six months from April to September.
Seasonality analyses were however carried out separately for residents and Palearctic
migrants. Analyses for residents were based on the season definition above, while
Palearctic migrants were analysed using summer as September–April and winter May–
August. This was done because most Palearctic migrants start to arrive in September
with last birds departing in April, and because this division was used by Kaletja-
Summers et al. (2001a, b) and allows for comparisons between sites.
Constraints imposed by data
Waterbird censuses, by their nature, lend themselves to caveats and/or certain
constraints. One limitation relates to observer skill where different observers have
different levels of bird identification and counting skills (Spearpoint et al. 1988). The
count data presented here (Chapter 4, Appendices A–D) were undertaken either by
professional ornithologists, trained volunteers (usually bird club members) and/or
conservation staff. Often turnover of observers at a site occurred, but when this
happened the count methodology at the site remained consistent (e.g. routes, time of
day) as much as possible to minimise the amount of variability in the counts and reduce
the overall error in the dataset (Boshoff and Palmer 1993). Because all counters were

20
trained observers, levels of species identification and counting were reasonably high and
the accuracy of the surveys at species level was regarded as good.
Different waterbird species are variably conspicuous and this leads to different
levels of count accuracy (Spearpoint et al. 1988). Counts of species that remain in the
open were the most accurate as they were conspicuous and easy to count. However,
numbers of cryptic species or those that may move between open water and aquatic
vegetation (usually species within the Rallidae) were considered underestimates and
abundance values were regarded as the ‘minimum’ number of birds present at the site.
Often a small proportion of birds in surveys cannot be identified to species; in all
the surveys reported in this thesis, these birds were identified to groups: ducks,
shorebirds, gulls or terns. This is seldom due to lack of skill on the part of the observers
but is usually attributable to poor light conditions, and/or to flocks which are silhouettes
too distant to be identified to species level with confidence, or to flocks which are mixed.
These data have been consistently handled according to the following strategy. They
have been included in the overall total for a survey. When calculating proportions for a
given species, the overall total, including unidentified birds, has been included in the
denominator, so that the correct proportion might be slightly larger than stated. This is
a conservative approach. When calculating the percentage of birds which belong to a
group (e.g. shorebirds), the unidentified birds of that group have been included in both
the numerator and the denominator.

21
References
Anonymous 1954. The African Wildfowl Enquiry. Bokmakierie 6: 3.
Ashkenazi S 2001. Long-term trends in the breeding populations of waterbirds (1951–1985) at a sewage treatment plant. Ostrich 72: 10–19.
Allan DG, Seaman M and Kaletja B 1995. The endorheic pans of South Africa. In: Cowan GI (ed.) 1995. Wetlands of South Africa. Department of Environmental Affairs and Tourism, Pretoria. pp. 75–101.
Barnes KN (ed.) 1998. The Important Bird Areas of southern Africa. BirdLife South Africa, Johannesburg.
Barnes KN (ed.) 2000. The Eskom Red Data Book of birds of South Africa, Lesotho and Swaziland. BirdLife South Africa, Johannesburg.
Blaker D and Winterbottom JM 1968. Bird counts at Strandfontein sewage works and Riet Vlei, Cape Town. Ostrich 39: 94–104.
Boshoff AF and Palmer NG 1991. Monthly count and breeding data for some waterbirds in the Wilderness-Sedgefield lakes complex, southern Cape Province. Bontebok 7: 36–39.
Boshoff AF, Palmer NG and Piper SE 1991a. Spatial and temporal abundance patterns of waterbirds in the southern Cape Province. Part 1: Diving and surface predators. Ostrich 62: 159–177.
Boshoff AF, Palmer NG and Piper SE 1991b. Spatial and temporal abundance patterns of waterbirds in the southern Cape Province. Part 2: Waterfowl. Ostrich 62: 178–196.
Boshoff AF, Palmer NG and Piper SE 1991c. Spatial and temporal abundance patterns of waterbirds in the southern Cape Province. Part 3: Wading birds. Ostrich 62: 197–214.
Boshoff AF and Piper SE 1993. An ordination study of the waterbird community of a coastal wetland, southern Cape Province. South African Journal of Wildlife Research 23: 17–25.
Branch GM, Bally R, Bennet BA, De Decker HP, Fromme G, Heÿl CW and Willis J 1985. Synopsis of the impact of artificially opening the Bot River estuary: implications for management. Transactions of the Royal Society of South Africa 45: 465–483.
Brand DJ 1961. A comparative study of the Cape Teal (Anas capensis) and Cape Shoveller (Spatula capensis), with special reference to breeding biology, development and food requirements. Unpublished Ph.D thesis, University of South Africa.
Breen CM and Begg GW 1989. Conservation status of southern African wetlands. In: Huntley BJ (ed.) Biotic diversity in southern Africa: concepts and conservation. Oxford University Press, Cape Town. pp. 254–264.
Brooke RK 1960. Waterfowl on the Free State goldfields. Ostrich 31: 27–79.
Broekhuysen GJ and Meiklejohn MFM 1941. Observations on palearctic waders and European Swallows in the Cape. Ostrich Supplement 1: 1–38.
Brown C and Magoba R 2009. Rivers and wetlands of Cape Town: caring for our rich aquatic heritage. Water Research Commission Report No. TT 376/08.
Cooper J, Brooke RK, Shelton PA and Crawford RJM 1982. Distribution, population size and conservation of the Cape Cormorant Phalacrocorax capensis. Fisheries Bulletin of South Africa 16: 121–143.

22
Cooper J, Crawford RJM, Suter W and Williams AJ 1990. Distribution, population size and conservation of the Swift Tern Sterna bergii in southern Africa. Ostrich 61: 56–65.
Cooper J, Brooke RK, Cyrus DP and Martin AP 1992. Distribution, population size and conservation of the Caspian Tern Sterna caspia in southern Africa. Ostrich 63: 58–67.
Cowan GI (ed.) 1995. Wetlands of South Africa. Department of Environmental Affairs and Tourism, Pretoria.
Cowling RM, Richardson DM and Pierce SM (eds) 1997. Vegetation of southern Africa. Cambridge University Press, Cambridge.
Crawford RJM, Cooper J and Shelton PA 1982. Distribution, population size, breeding and conservation of the Kelp Gull in southern Africa. Ostrich 53: 164–177.
Davies B and Day J 1998. Vanishing Waters. University of Cape Town Press, Cape Town.
Davis JA and Froend R 1999. Loss and degradation of wetlands in southwestern Australia: underlying causes, consequences and solutions. Wetlands Ecology and Management 7: 13–23.
Dennis N and Tarboton WR 1993. Waterbirds. Birds of southern African wetlands. Struik, Cape Town.
Duckworth G, Altwegg R & Harebottle DM 2012. Demography and population ecology of the Hadeda Ibis (Bostrychia hagedash) at its expanding range edge in South Africa. Journal of Ornithology153: 421–430.
Elliott CCH, Waltner M, Underhill LG, Pringle JS, Dick WJA 1976. The migration system of the Curlew Sandpiper Calidris ferruginea in Africa. Ostrich 47: 191–213.
Finlayson M and Moser M (eds) 1991. Wetlands. International Waterfowl and Wetlands Research Bureau, Oxford.
Foote AL, Pandey S and Krogman NT 1996 Processes of wetland loss in India. Environmental Conservation 23: 45–54.
Frost PGH 1971. African Wildfowl Enquiry. Bee-eater 22(4). Annexure.
Frost PGH 1972. African Wildfowl Enquiry. Natal Bird Club News Sheet 210: 4–5.
Geldenhuys JN 1976a. Relative abundance of waterfowl in the Orange Free State. Ostrich 47: 27–54.
Geldenhuys JN 1976b. Breeding status of waterfowl at large lakes in the Orange Free State. Ostrich 47: 137–139.
Gibbs JP 2000. Wetland loss and biodiversity conservation. Conservation Biology 14: 314–317.
Gilissen N, Haanstra L, Delany S, Boere G and Hagemeijer W 2002. Numbers and distribution of wintering waterbirds in the western Palearctic and southwest Asia in 1997, 1998 and 1999. Results from the International Waterbird census. Wetlands International Global Series No. 11, Wageningen, The Netherlands.
Guillet A and Crowe TM 1986. A preliminary investigation of patterns of distribution and species richness of southern African waterbirds. South African Journal of Wildlife Research 16: 65–81.
Harebottle DM and Wheeler MJ 2004. Roost counts – adding value to CWAC and wetlands. Bird Numbers 13(1): 46.

23
Harebottle DM, Williams AJ, Weiss Y and Tong G 2008. Waterbirds at Paarl Waste Water Treatment Works, South Africa, 1994–2004: seasonality, trends and conservation importance. Ostrich 79: 147–163.
Herremans M 1999. Waterbird diversity, densities, communities and seasonality in the Kalahari Basin, Botswana. Journal of Arid Environments 43: 319–350.
Hockey PAR, Ryan PG and Dean WRJ (eds) 2005. Roberts’ birds of Southern Africa, 7th edn. Trustees of the John Voelcker Bird Book Fund, Cape Town.
Hockey PAR, Underhill LG, Neatherway M and Ryan PG 1989. Atlas of the birds of the southwestern Cape. Cape Bird Club, Cape Town.
Heÿl CW and Currie MH 1985. Variations in the use of the Bot River Estuary by water-birds. Transactions of the Royal Society of South Africa 45: 397–417.
Kaletja-Summers B, Allan DG and Longrigg TD 2001a. Long-term trends, seasonal abundance and energy consumption of waterbirds at Rietvlei, Western Cape, South Africa, 1950–1993. Ostrich 72: 63–79.
Kaletja-Summers B, Allan DG and Longrigg TD 2001b. Long-term trends, seasonal abundance and energy consumption of waterbirds at Strandfontein, Western Cape, South Africa, 1953–1993. Ostrich 72: 80–95.
Kotze DC, Breen CM and Quinn N 1995. Wetland losses in South Africa. In: Cowan GI (ed.) Wetlands of South Africa. Department of Environmental Affairs and Tourism, Pretoria. pp. 263–272.
Kuijken E 2006. A short history of waterbird conservation. In: Boere GC, Galbraith CA and Stroud DA (Eds) Waterbirds around the World. The Stationery Office, Edinburgh, UK. pp. 52–59.
Little RM, Vester KC and Crowe TM 1995. Temporal and spatial patterns of breeding activity of 12 duck species (Anatidae) in the Cape Provinces, South Africa, and their implications for conservation. South African Journal of Wildlife Research 25: 17–22.
Liversidge R 1958. The bird population of the dams of the Free State goldfields. The Ostrich 29: 107–109.
Liversidge R, Broekhuysen GJ and Thesen AR 1958. The birds of Langebaan Lagoon. Ostrich 29: 95–106.
Maltby E 1991. Wetlands and their values. In: Finlayson M and Moser M (eds). Wetlands. International Waterfowl and Wetlands Research Bureau, Oxford. pp. 8–26.
Martin AP and Baird D 1987. Seasonal abundance and distribution of birds on the Swartkops Estuary, Port Elizabeth. Ostrich 58: 12–134.
Martin AP and Randall RM 1987. Numbers of birds at a commercial saltpan, and suggestions for management, South African Journal of Wildlife Research 17: 75–81.
Middelmiss E 1958. The Southern Pochard Netta erythrophthalma brunnea Ostrich Supplement 13: 1–48.
Noble RG and Hemens J 1978. Inland water ecosystems in South Africa – a review of research needs. South African National Scientific Programmes Report No. 34. CSIR, Pretoria.
Paillisson J-M, Reeber S and Marion L 2002. Bird assemblages as bio-indicators of water regime management and hunting disturbance in natural wet grasslands. Biological Conservation 106: 115–127.
Ramsar 2010. Ramsar Information Sheet. http://www.ramsar.org

24
Roshier DA, Robertson AI and Kingsford RT 2002. Responses of waterbirds to flooding in an arid region of Australia and implications for conservation. Biological Conservation 106: 399–411.
Rowan MK 1963. The Yellowbill Duck Anus undulata [sic] Dubois in southern Africa. Ostrich Supplement 5: 1–56.
Schulze RE 1997. Climate. In: Cowling RM, Richardson DM and Pierce SM (eds) Vegetation of Southern Africa. Cambridge University Press, Cambridge. pp. 21–42.
Schulze RE and Maharaj M 2007. Rainfall seasonality. In: Schulze, RE (Ed). South African atlas of climatology and agrohydrology. Water Research Commission, Pretoria, RSA, WRC Report 1489/1/06, Section 6.5.
Schulze RE, Maharaj M and Ghile Y 2007. Climatic zonation. In: Schulze, R.E. (Ed). South African atlas of climatology and agrohydrology. Water Research Commission, Pretoria, RSA, WRC Report 1489/1/06, Section 3.3.
Serra L, Whitelaw DA, Tree AJ, Underhill LG 2001. Biometrics, possible breeding origins and migration routes of South African Grey Plovers, Pluvialis squatarola. Ostrich 72: 140–144.
Siegfried WR 1965a. The Cape Shoveller Anas smithii (Hartert) in southern Africa. Ostrich 36: 155–198.
Siegfried WR 1965b. The status of the Cattle Egret in the Cape Province. Ostrich 36: 109–116.
Skead DM and Dean WRJ 1977. Seasonal abundance of Anatidae at Barberspan. Ostrich Supplement 12: 49–64.
Southern Waters 2000. Princess Vlei/Little Princess Vlei: Aquatic ecosystem assessment. Unpublished report.
Spearpoint JA, Every B, Underhill LG 1988. Waders (Charadrii) and other shorebirds at Cape Recife, Algoa Bay, South Africa: seasonality, trends, conservation, and reliability of surveys. Ostrich 59: 166–177.
Stephens EL 1929. Freshwater aquatic vegetation of the south-western districts. The botanical features of the south-western Cape Province. Speciality Press, Wynberg. pp. 81–95.
Summers RW, Pringle JS and Cooper J 1976. The status of coastal waders in the south-western Cape, South Africa. Western Cape Wader Study Group, Cape Town.
Summers RW, Cooper J and Pringle JS 1977. Distribution and numbers of coastal waders (Charadrii) in the southwestern Cape, South Africa, summer 1975–1976. Ostrich 48: 85–97.
Summers RW, Underhill LG, Waltner M, Whitelaw DA 1987. Populations, biometrics and movements of the Sanderling Calidris alba in southern Africa. Ostrich 58: 24–39.
Summers RW, Underhill LG, Clinning CF, Nicoll M 1989. Populations, biometrics and moult of the Turnstone Arenaria interpres, with special reference to the Siberian population. Ardea 77: 145–168.
Summers RW, Underhill LG, Waltner M, Swann B 2010. Differences in biometrics and moult of non-breeding Red Knots Calidris canutus in southern Africa and Scotland reflect contrasting climatic conditions. Ibis 157: 127–135.
Summers RW, Underhill LG, Waltner M 2011. The dispersion of Red Knots Calidris canutus in Africa – is southern Africa a buffer for West Africa? African Journal of Marine Science 33: 203–208.

25
Tarboton WR 1977. The status of communal herons, ibis and cormorants on the Witwatersrand. South African Journal of Wildlife Research 7: 19–25.
Taylor PB, Navarro RA, Wren-Sargent M, Harrison JA and Kieswetter SL (eds) 1999. TOTAL CWAC Report: Coordinated Waterbird Counts in South Africa, 1992–1997. Avian Demography Unit, University of Cape Town, Cape Town.
Terpstra PG (ed.) 2003. Wetland management planning. Five years of case studies from West Africa. Wetlands International Publication, Dakar, Senegal.
Underhill LG 1979. The Western Cape Wader Study Group. Bokmakierie 31: 82–85.
Underhill LG 1987. Waders (Charadrii) and other waterbirds at Langebaan Lagoon, South Africa, 1975–1986. Ostrich 58: 145–155.
Underhill LG and Cooper J 1984. Counts of watrebirds at coastal wetlands in southern Africa. Unpubl. report, Western Cape Wader Study Group, Cape Town.
Underhill LG, Cooper J, and Waltner M 1980. The status of waders (Charadrii) and other birds in the coastal region of the southern and eastern cape, summer 1978/79. Western Cape Wader Study Group, Cape Town.
Underhill LG, Oatley TB, Harrison JA 1991. The role of large-scale data collection projects in the study of southern African birds. Ostrich 62: 124–148.
Underhill LG, Prŷs-Jones RP, Harrison JA and Martinez P 1992. Seasonal patterns of occurrence of Palearctic migrants in southern Africa using atlas data. Ibis 134: 99–108.
Velásquez C, Kaletja B and Hockey PAR 1991. Seasonal abundance, habitat selection and energy consumption of waterbirds at the Berg River estuary, South Africa. Ostrich 62: 109–123.
Wetlands International 2006. Waterbird Population Estimates – Fourth Edition. Wetlands International Global Series No. 12, Wageningen, The Netherlands.
Wetlands International 2009. Conserve Africa’s wetlands. Wetlands International, Dakar, Senegal.
Williams AJ and Velasquez C. 1997. Greater Flamingo Phoenicopterus ruber. In: Harrison JA, Allan DG, Underhill LG, Herremans M, Tree AJ, Parker V and Brown CJ (eds) The Atlas of Southern African Birds, vol. 1: Non-passerines. pp 112–113. BirdLife South Africa, Johannesburg.
Williams AJ, Steele WK, Cooper J and Crawford RJM 1990. Distribution, population size and conservation of Hartlaub’s Gull Larus hartlaubii. Ostrich 61: 66–76.
Winterbottom JM 1960. Report on the Cape Bird Club vlei counts, 1952–58. Ostrich 31: 135–168.
Winterbottom JM 1964. Report on the Witwatersrand duck counts 1954–1959. Ostrich 35:188–201.
Winterbottom JM 1974. The Cape Teal. Ostrich 45: 110–132.
WWF/IUCN 1988. Wetlands Conservation Programme 1985–1987: Life at the water's edge. Gland, Switzerland.

26
Table 1.1 Key papers dealing with surveys of waterbirds at the larger wetlands in the Western Cape, South Africa, in chronological order of publication.
Locality Comments Reference(s)
Zeekoeivlei Dealt only with Palearctic waders and the Barn Swallow Hirundo rustica.
Broekhuysen and Meiklejohn 1941
Langebaan Lagoon Report on the status and abundance of waterbirds at the lagoon.
Liversidge et al. 1958
Wetlands of the Cape Peninsula Report on monthly counts by members of the Cape Bird Club at vleis on the Cape Flats, many of which have disappeared under housing.
Winterbottom 1960
Strandfontein Sewage Works and Rietvlei, Milnerton
First detailed summary of waterbirds at these sites.
Blaker and Winterbottom 1968
Bot River Estuary Summary of two years of waterbird surveys in lieu of artificial breaching
Branch et al. 1985; Heÿl and Currie 1985
Langebaan Lagoon Update of population trends of mainly Palearctic shorebirds; some resident waterbird species also included.
Underhill 1987
Berg River Estuary Study to determine abundance and habitat use by waterbirds in lower portions of the estuary.
Velásquez et al. 1991
Wilderness Lakes, Sedgefield Ordination studies that looked at association of waterbirds on different waterbodies.
Boshoff et al. 1991a, b, c
Rietvlei, Milnerton First study looking at long-term trends of waterbird populations at the site.
Kaletja-Summers et al. 2001a
Strandfontein Sewage Works First study looking at long-term trends of waterbird populations at the site.
Kaletja-Summers et al. 2001b
Strandfontein Sewage Works Dealt with overview of breeding outputs.
Ashkenazi 2001
Theewaterskloof Dam First study looking at long-term trends of waterbird populations at the site.
Swanepoel et al. 2006.

27
Table 1.2 The 12 climatic zones in South Africa based on the Klöppen Class climate classification system (Schulze et al. 2007). For more characteristics of each zone refer to Appendix 1.2.
Köppen Class Climatic Characteristics Percentage of South Africa
Aw Tropical wet, dry winter season 1.53%
BSh Semi-arid, hot and dry 15.55%
BSk Semi-arid, cool and dry 17.95%
BWh Arid, hot and dry 16.34%
BWk Arid, cool and dry 9.97%
Cfa Wet all seasons, summers long and hot 4.69%
Cfb Wet all seasons, summers long and cool 8.10%
Csa Summers long, dry and hot 0.24%
Csb Summers long, dry and cool 0.89%
Cwa Winters long, dry and hot 10.10%
Cwb Winters long, dry and cool 14.61%
Cwc Winters dry, summers short and cool 0.02%

28
Figure 1.1 The 12 climatic zones in South Africa based on the Klöppen Class climate classification system. For explanation of the codes refer to Table 1.2 (Schulze et al. 2007).
Figure 1.2 The six major rainfall zones in South Africa. The winter rainfall region is shaded in medium blue. From Schulze and Maharaj (2007).

29
Figure 1.3 Wetland regions of South Africa (modified from Cowan 1995). The regions applicable to the winter rainfall region and referred to in this thesis are shaded in grey and labelled SW.w (Western coastal slope – desert), SW.m (Western coastal slope– Mediterranean) and MCF.m (Cape Fold Mountains – Mediterranean). For descriptions of other regions please refer to Cowan (1995, p.24).

30
Fig
ure
1.4
Th
e lo
cati
on o
f 30
wet
lan
ds (
nu
mbe
red
1–30
) in
th
e W
este
rn C
ape,
Sou
th A
fric
a th
at a
re d
ealt
wit
h in
th
is t
hes
is. S
ites
m
arke
d w
ith
arr
ows
repr
esen
t th
e fi
ve s
ites
in C
hap
ter
4 an
d A
ppen
dice
s A
–D; 5
= R
och
er P
an, 1
0 =
Dro
ëvle
i D
am, 1
1 =
Paa
rl W
aste
W
ater
Tre
atm
ent
Wor
ks, 2
0 =
Bot
Riv
er E
stu
ary
and
23 =
De
Hoo
p V
lei F
or o
ther
sit
e n
ames
ref
er t
o A
ppen
dix
1.5.

31
Figure 1.5 Cape Town metropole region (shaded grey). Major mountainous areas and large waterbodies are shown.

32
Appendix 1.1 Details of the Klöppen Class climate classification system (Schulze et al. 2007).
Letter symbol Climate Characteristics Criteria
1st 2nd 3rd
A
- f w m
- - - -
Humid tropical Tropical wet (rain forest) Tropical wet & dry (savanna) Tropical monsoon
All months have an average temperature of >18oC Wet all seasons; all months at least 60 mm rainfall Winter dry season; rainfall in driest month < 60 mm and <100P/25 (P = Mean Annual Precipitation, mm) Short dry season; rainfall in driest month < 60 mm, but ≥ 100-P/25
B
- - Dry P<20(t+14) when ≥70% rain falls in warmer 6 months (dry winter) P<20t when ≥ 70% rain falls in cooler 6 months (dry summer) P<20(t+7) when neither half year has ≥ 70% rain
S - Semi-arid (steppe) 10(t+14) < P<20(t+14) when ≥ 70% rain falls in warmer 6 months (dry winter) 10t <P< 20t when ≥ 70% rain falls in cooler 6 months (dry summer) 10(t+7) <P <20(t+7) when neither half year has ≥ 70% rain
W - Arid (desert) P <10(t+14) when ≥ 70% rain falls in warmer 6 months (dry winter) P< 10t when ≥ 70% rain falls in warmer 6 months (dry winter) P <10(t+7) when neither half year has ≥ 70% rain
- -
h k
Hot and dry Cool and dry
Mean annual temperature is ≥18oC Mean annual temperature is < 18oC
C
- w s f - - -
- - - - a b c
Moist with mild winters Dry winters Dry summers Wet all seasons Summers long and hot Summers long and cool Summers short and cool
Average temperature of coldest month < -3oC; average temperature of warmest month > 10oC Same as under Cw Same as under Cs Same as under Cf Same as under Cfa Same as under Cfb Same as under Cfc
D
- w s f - - - -
- - - - a b c d
Moist with cold winters Dry winters Dry summers Wet at all seasons Summers long and hot Summers long and cool Summers short and cool Summers short and cool; Winters severe
Average temperature of coldest month < -3oC; average temperature of warmest month > 10oC Same as under Cw Same as under Cs Same as under Cf Same as under Cfa Same as under Cfb Same as under Cfc Average temperature of coldest month < -3oC
E
- T F
- - -
Polar climate Tundra Ice cap
Average temperature of warmest month <10oC Average temperature of warmest month >0oC but < 10oC Average temperature of warmest month < 0oC

33
Appendix 1.2 List of species used in the analyses for Chapter 2. Common name, scientific name and 1% threshold levels for Western Europe and Western Africa are given 1% thresholds sourced from Wetlands International (2006).
English name Scientific name
1% threshold level1 (Ramsar/Global IBA)
Western Europe Western Africa
African Darter Anhinga rufa 250 African Openbill Stork Anastomus lamelligerus - 4000 African Purple Swamphen Porphyrio madagascariensis - 250 African Pygmy Goose Nettapus auritus - 100 African Sacred Ibis Threskiornis aethiopicus - 3300 African Skimmer Rynchops flavirostris - 100 African Spoonbill Platalea alba - 1000 Audouin's Gull Larus audouinii 580 580 Barnacle Goose Branta leucopsis 3600 - Bar-tailed Godwit Limosa lapponica 1200 5200 Bean Goose Anser fabalis 800 - Bewick's Swan Cygnus columbianus 200 - Black Heron Egretta ardesiaca - 1000 Black Stork Ciconia nigra - 15 Black Tern Chlidonias niger - 4000 Black-crowned Crane Balearica pavonina - 150 Black-crowned Night-heron Nycticorax nycticorax 290 790 Black-headed Heron Ardea melanocephala - 3000 Black-legged Kittiwake Rissa tridactyla 20000 - Black-necked Grebe Podiceps nigricollis 2800 2800 Black-tailed Godwit Limosa limosa 1700 1700 Black-throated Diver Gavia arctica 10000 - Black-winged Stilt Himantopus himantopus 770 770 Caspian Gull Larus cachinnans 20000 - Caspian Tern Sterna caspia 65 65 Cattle Egret Bubulcus ibis 2800 2800 Comb Duck Sarkidonis melanotus - 750 Common Black-headed Gull Larus ridibundus 20000 15000 Common Coot Fulica atra 17500 20000 Common Crane Grus grus 750 - Common Eider Somateria mollissima 750 - Common Goldeneye Bucephala clangula 4000 - Common Greenshank Tringa nebularia 3100 3100 Common Gull Larus canus 17000 - Common Moorhen Gallinula chloropus 20000 20000 Common Pochard Aythya ferina 3500 10000 Common Pratincole Glareola pratincola 190 190 Common Redshank Tringa totanus 2500 2500 Common Ringed Plover Charadrius hiaticula 730 1900 Common Sandpiper Actitis hypoleucos 17000 17000 Common Scoter Melanitta nigra 16000 - Common Shelduck Tadorna tadorna 3000 750 Common Snipe Gallinago gallinago 20000 20000 Common Teal Anas crecca 10600 10600 Common Tern Sterna hirundo 1900 1900 Common Whimbrel Numenius phaeopus 2300 6100 Curlew Sandpiper Calidris ferruginea 7400 7400 Dark-Bellied Brent Goose Branta bernicla 2000 - Dunlin Calidris alpina 1300 13300 Egyptian Goose Alopochen aegypticus - 180 Eurasian Bittern Botaurus stellaris 65 - Eurasian Curlew Numenius arquata 4200 4200 Eurasian Golden Plover Pluvialis apricaria 8000 8000 Eurasian Oystercatcher Haematopus ostralegus 10200 10200 Eurasian Spoonbill Platalea leucorodia 100 100 Eurasian Wigeon Anas penelope 15000 3000 Eurasian Woodcock Scolopax rusticola 20000 -

34
Appendix 1.2 contd
English name Scientific name
1% threshold level1 (Ramsar/Global IBA)
Western Europe Western Africa
European Shag Phalacrocorax aristotelis 2400 - European White-fronted Goose Anser albifrons 10000 - Ferruginous Duck Aythya nyroca 30 - Fulvous Duck Dendrocygna bicolor - 1000 Gadwall Anas strepera 600 1100 Garganey Anas querquedula 20000 20000 Glossy Ibis Plegadis falcinellus 530 15000 Goosander Mergus merganser 2500 - Great Black-backed Gull Larus marinus 4700 - Great Cormorant Phalacrocorax carbo 1200 - Great Crested Grebe Podiceps cristatus 4800 - Great Northern Diver Gavia immer 50 - Great Snipe Gallinago media 10000 10000 Great White Egret Ardea alba 470 3000 Great White Pelican Pelecanus onocrotalus - 600 Greater Flamingo Phoenicopterus ruber 1000 400 Greater Scaup Aythya marila 3100 - Greater White-fronted Goose Anser albifrons 10000 - Green Sandpiper Tringa ochropus 14500 14500 Green-backed Heron Butroides striatus - 10000 Grey Heron Ardea cinerea 2700 10000 Grey Plover Pluvialis squatarola 2500 2500 Grey-headed Gull Larus cirrocephalus - 300 Greylag Goose Anser anser 4000 250 Gull-billed Tern Gelochelidon nilotica 130 130 Herring Gull Larus argentatus 11000 - Kentish Plover Charadrius alexandrinus 660 660 Kittlitz's Plover Charadrius pecuarius - 350 Lesser Black-backed Gull Larus fuscus 5300 5300 Lesser Flamingo Phoenicopterus minor 150 Little Egret Egretta garzetta 1300 1300 Little Grebe Tachybaptus ruficollis 3400 1000 Little Gull Larus minutus 840 - Little Ringed Plover Charadrius dubius 2400 2400 Little Stint Calidris minuta 2000 2000 Little Tern Sterna albifrons 340 340 Long-tailed Duck Clangula hyemalis 20000 - Mallard Anas platyrhynchos 20000 10000 Marbled Teal Marmaronetta angustirostris 40 - Marsh Sandpiper Tringa stagnatilis 370 Mediterranean Gull Larus melanocephalus 8400 - Mute Swan Cygnus olor 2500 - Northern Lapwing Vanellus vanellus 20000 20000 Northern Pintail Anas acuta 600 10000 Northern Shoveler Anas clypeata 400 4500 Pied Avocet Recurvirostra avosetta 730 730 Pink-backed Pelican Pelecanus - 750 Pink-footed Goose Anser brachyrhynchus 2770 - Purple Heron Ardea purpurea 120 120 Purple Sandpiper Calidris maritima 750 - Purple Swamphen Porphyrio porphyrio 250 - Red Knot Calidris canutus 4500 3400 Red-breasted Merganser Mergus merganser 1700 - Red-crested Pochard Aythya ferina 500 - Red-knobbed Coot Fulica cristata - 80 Red-necked Grebe Podiceps grisegena 1000 - Red-throated Diver Gavia stellata 10000 - Reed Cormorant Phalacrocorax africanus - 1000 Royal Tern Sterna maxima - 1500

35
Appendix 1.2 contd
English name Scientific name
1% threshold level1 (Ramsar/Global IBA)
Western Europe Western Africa
Ruddy Turnstone Arenaria interpres 1000 830 Ruff Philomachus pugnax 20000 20000 Sanderling Calidris alba 1200 1200 Sandwich Tern Sterna bergii 1700 1700 Senegal Thick-knee Burhinus senegalensis - 250 Slavonian Grebe Podiceps auritus 35 - Slender-billed Gull Larus genei 1800 230 Smew Mergellus albellus 400 - Spotted Redshank Tringa erythropus 1000 1000 Spur-winged Goose Plectropterus gambensis - 1000 Spur-winged Lapwing Vanellus spinosus - 4000 Squacco Heron Ardeola ralloides - 40 Stone Curlew Burhinus oedicnemus 1400 - Taiga Bean Goose Anser fabalis 1000 - Temminck's Stint Calidris temminckii 600 600 Tufted Duck Aythya fuligula 12000 7000 Tundra Bean Goose Anser fabalis 6000 - Velvet Scoter Melanitta fusca 10000 - Water Rail Rallus aquaticus 10000 - Western Reef Egret Egretta gularis - 1000 Western Yellow-legged Gull Larus michahellis 7000 - Whiskered Tern Chlidonias hybrida 260 260 White Stork Ciconia ciconia 930 930 White-breasted Cormorant Phalacrocorax lucidus - 350 White-faced Duck Dendrocygna viduata - 3800 White-fronted Plover Charadrius marginatus - 130 Whooper Swan Cygnus cygnus 590 - Wood Sandpiper Tringa glareola - 10400 Yellow-billed Egret Egretta intermedia - 1000 Yellow-billed Stork Mycteria ibis - 750
1 Threshold levels sourced from Wetlands International (2006) and represent levels for global and biogeographical (southern Africa) populations. These are based on criterion set out in the Ramasr Convention.

36
Appendix 1.3 List of species used in the analyses for Chapters 3 and 5, and Appendices A–D. Common name, scientific name, occurrence status, group foraging guild, IUCN threat status, and habitat preference are given for each species. Species are listed in taxonomic order according to Hockey et al. (2005). All information sourced from Hockey et al. (2005) except for IUCN threat status which is taken from Barnes (1998). Habitat preference sourced from Kaletja-Summers (2001 a, b) and Hockey et al. (2005). Species marked in italics are endemic to southern Africa.
Common name Scientific name Occurrence
status1 Species group2
Feeding guild3
Threat status4
Habitat5 Mass (g) 6
White-faced Duck Dendrocygna viduata Res. Waterfowl I – OW –
White-backed Duck Thalassornis leuconotus Res. Waterfowl H – OW –
Maccoa Duck Oxyura maccoa Res. Waterfowl I – OW 659
Egyptian Goose Alopochen aegyptiaca Res. Waterfowl H – OW 1990
South African Shelduck Tadorna cana Res. Waterfowl I – OW 1240
Spur-winged Goose Plectropterus gambensis Res. Waterfowl H – OW 4480
Cape Teal Anas capensis Res. Waterfowl I – OW 402
Yellow-billed Duck Anas undulata Res. Waterfowl H – OW 412
Cape Shoveler Anas smithii Res. Waterfowl I – OW 643
Red-billed Teal Anas erythrorhyncha Res. Waterfowl H – OW 569
Southern Pochard Netta erythrophthalma Res. Waterfowl H – OW 818
Half-collared Kingfisher Alcedo semitorquata Res. Kingfishers P NT OW –
Malachite Kingfisher Alcedo cristata Res. Kingfishers P – OW 17
Giant Kingfisher Megaceryle maximus Res. Kingfishers P – OW 364
Pied Kingfisher Ceryle rudis Res. Kingfishers P – OW 84
Marsh Owl Asio capensis Res. Raptors C – SEV –
Blue Crane Anthropoides paradiseus Res. Cranes H VU SEV –
African Rail Rallus caerulescens Res. Rallids I – SEV –
Black Crake Amaurornis flavirostris Res. Rallids I – SEV –
Baillon's Crake Porzana pusilla Res. Rallids I – SEV –
African Purple Swamphen Porphyrio madagascariensis Res. Rallids H – SEV 596
Common Moorhen Gallinula chloropus Res. Waterfowl H – OW 247
Red-knobbed Coot Fulica cristata Res. Waterfowl H – OW 737
African Snipe Gallinago nigripennis Res. Shorebirds I – SEV 122
Bar-tailed Godwit Limosa lapponica Pal. Shorebirds I – BSM 264
Common Whimbrel Numenius phaeopus Pal. Shorebirds I – BSM 402
Eurasian Curlew Numenius arquata Pal. Shorebirds I – BSM 590
Marsh Sandpiper Tringa stagnatilis Pal. Shorebirds I – BSM 69
Common Greenshank Tringa nebularia Pal. Shorebirds I – BSM 175
Wood Sandpiper Tringa glareola Pal. Shorebirds I – SEV 60
Terek Sandpiper Xenus cinereus Pal. Shorebirds I – BSM –
Common Sandpiper Actitis hypoleucos Pal. Shorebirds I – BSM 47
Ruddy Turnstone Arenaria interpres Pal. Shorebirds I – BSM 101
Red Knot Calidris canutus Pal. Shorebirds I – BSM –
Sanderling Calidris alba Pal. Shorebirds I – BSM 55
Little Stint Calidris minuta Pal. Shorebirds I – BSM 23

37
Appendix 1.3 contd
Common name Scientific name Occurrence
status1 Species group2
Feeding guild3
Threat status4
Habitat5 Mass (g) 6
Curlew Sandpiper Calidris ferruginea Pal. Shorebirds I – BSM 57
Ruff Philomachus pugnax Pal. Shorebirds I – BSM 132
Greater Painted-snipe Rostratula benghalensis Res. Shorebirds I NT BSM –
Water Thick-knee Burhinus vermiculatus Res. Shorebirds I – BSM 304
African Black Oystercatcher Haematopus moquini Res. Shorebirds I NT BSM 699
Black-winged Stilt Himantopus himantopus Res. Waders I – BSM 165
Pied Avocet Recurvirostra avosetta Res. Shorebirds I – BSM 323
Grey Plover Pluvialis squatarola Pal. Shorebirds I – BSM 218
Common Ringed Plover Charadrius hiaticula Pal. Shorebird I – BSM 50
Kittlitz's Plover Charadrius pecuarius Res. Shorebirds I – BSM 36
Three-banded Plover Charadrius tricollaris Res. Shorebirds I – BSM 33
Chestnut-banded Plover Charadrius pallidus Res. Shorebirds I NT BSM –
White-fronted Plover Charadrius marginatus Res. Shorebirds I – BSM 46
Blacksmith Lapwing Vanellus armatus Res. Waders I – BSM 163
Kelp Gull Larus dominicanus Res. Gulls P – OW 1008
Grey-headed Gull Larus cirrocephalus Res. Gulls I – OW 280
Hartlaub's Gull Larus hartlaubii Res. Gulls I – OW 279
Caspian Tern Sterna caspia Res. Terns P NT OW 690
Swift Tern Sterna bergii Res. Terns P – OW 394
Sandwich Tern Sterna sandvicensis Pal. Terns P – OW 220
Common Tern Sterna hirundo Pal. Terns P – OW 131
Arctic Tern Sterna paradisaea Pal. Terns P – OW –
Antarctic Tern Sterna vittata Pal. Terns P – OW –
Little Tern Sterna albifrons Pal. Terns P – OW –
Damara Tern Sterna balaenarum Res. Terns P EN OW –
Whiskered Tern Chlidonias hybrida Res. Terns I – OW 100
White-winged Tern Chlidonias leucopterus Pal. Terns I – OW 54
Black Tern Chlidonias niger Pal. Terns I – OW –
Osprey Pandion haliaetus Pal. Raptors P – OW 1485
African Fish-Eagle Haliaeetus vocifer Res. Raptors P – OW –
African Marsh-Harrier Circus ranivorus Res. Raptors C VU TEV 501
Black Harrier Circus maurus Res. Raptors C NT TEV –
Little Grebe Tachybaptus ruficollis Res. Waterfowl I – OW 146
Great Crested Grebe Podiceps cristatus Res. Waterfowl P – OW 621
Black-necked Grebe Podiceps nigricollis Res. Waterfowl I – OW 298
African Darter Anhinga rufa Res. Cormorants2 P – OW 1508
Reed Cormorant Phalacrocorax africanus Res. Cormorants P – OW 555
Crowned Cormorant Phalacrocorax coronatus Res. Cormorants P NT OW –
White-breasted Cormorant Phalacrocorax lucidus Res. Cormorants P – OW 2980
Bank Cormorant Phalacrocorax neglectus Res. Cormorants P VU OW –

38
Appendix 1.3 contd
Common name Scientific name Occurrence
status1 Species group2
Feeding guild3
Threat status4
Habitat5 Mass (g) 6
Cape Cormorant Phalacrocorax capensis Res. Cormorants P NT OW 1220
Little Egret Egretta garzetta Res. Waders I – SEV 521
Yellow-billed Egret Egretta intermedia Res. Waders P – SEV 894
Great Egret Egretta alba Res. Waders P – SEV 1110
Grey Heron Ardea cinerea Res. Waders P – SEV 1435
Black-headed Heron Ardea melanocephala Res. Waders I – TERR 1440
Goliath Heron Ardea goliath Res. Waders P – TEV –
Purple Heron Ardea purpurea Res. Waders P – TEV 873
Cattle Egret Bubulcus ibis Res. Waders I – TERR 374
Squacco Heron Ardeola ralloides Res. Waders F – SEV –
Black-crowned Night-Heron Nycticorax nycticorax Res. Waders P – SEV 636
Little Bittern Ixobrychus minutus Res. Waders I – SEV –
Hamerkop Scopus umbretta Res. Waders I – BSM –
Greater Flamingo Phoenicopterus ruber Res. Flamingos I NT OW 3470
Lesser Flamingo Phoenicopterus minor Res. Flamingos H NT OW 1725
Glossy Ibis Plegadis falcinellus Res. Waders I – SEV 634
Hadeda Ibis Bostrychia hagedash Res. Waders I – SEV 1280
African Sacred Ibis Threskiornis aethiopicus Res. Waders I – SEV 1500
African Spoonbill Platalea alba Res. Waders I – OW 1560
Great White Pelican Pelecanus onocrotalus Res. Pelicans P NT OW 9520
Black Stork Ciconia nigra Res. Waders I NT OW –
1 Res. = Southern African resident, Pal. = Palearctic migrant 2 African Darter has been included with the cormorant group due to similar feeding habits. 3 H= Herbivore, I = Invertebrate feeder, P = Piscivore, C = Carnivore 4 EN = Endangered, VU = Vulnerable, NT = Near-threatened 5 OW = Open water, SEV Short emergent vegetation = BSM = Bare shoreline/mudflats, TEV = Tall emergent vegetation, TERR = Terrestrial 6 Only those species whose mass was used in the calculation of Field Metabolic Rate (Chapter 5) are given.

39
Appendix 1.4 Global and sub-regional IBA population threshold levels and estimated Western Cape and Cape Town metropole populations of waterbirds used in Chapter 3 and Appendices A–D.
Threshold level Estimated population size
Species Ramsar
(1%)1 Sub-regional IBA (0.5%)2
Western Cape3
Cape Town metropole
African Black Oystercatcher 55 28 693 124 African Darter 1000 500 2895 993 African Fish Eagle – – 202 66 African Marsh Harrier – – 150 45 African Purple Swamphen 1000 500 251 145 African Sacred Ibis 3300 1650 9744 4908 African Snipe 250 125 364 225 African Spoonbill 1000 500 2422 376 Arctic Tern 20000a - 222 25 Bank Cormorant 100 50 50* ? Bar-tailed Godwit 5200 2600 771 1 Black Crake 10000 5000 103 38 Black Harrier – – 6 1 Black Stork 30 15 19 – Black-crowned Night-heron 20000 20000 555 272 Black-headed Heron 3000 1500 656 267 Black-necked Grebe 150 75 4879 1640 Blacksmith Lapwing 10000 5000 5844 2517 Black-winged Stilt 230 115 7089 2195 Cape Cormorant 2200 1100 57942 51439 Cape Shoveler 350 175 12345 4223 Cape Teal 1750 875 7906 2862 Caspian Tern 15 8 689 129 Cattle Egret 10000 5000 7420 3774 Chestnut-banded Plover 110 55 798 1 Common Greenshank 3100 1550 4419 295 Common Moorhen 1000 500 2213* 1209* Common Ringed Plover 1900 950 3742 477 Common Sandpiper 15000a 15000 2201 139 Common Tern 6400 3200 31240 7469 Common Whimbrel 10000 5000 2445 18 Crowned Cormorant 85 43 247 21 Curlew Sandpiper 3300 1650 58135 3611 Damara Tern 140 70 11* ? Egyptian Goose 3500 1750 42041 9055 Fulvous Duck 99 67 Eurasian Curlew 1000 500 1535 4 Giant Kingfisher – – 104 39 Glossy Ibis 15000 7500 1909 924 Goliath Heron 250 125 45 1 Great Crested Grebe 100 50 1617 277 Great Egret 3000 1500 98 14 Great White Pelican 200 100 4637 1267 Greater Flamingo 760 380 26761 7331 Greater Painted-snipe 1000 500 33* 21* Grey Heron 10000 5000 1534 363 Grey Plover 2500 1250 7512 143 Grey-headed Gull 3000 1500 1294 353 Hadeda Ibis 1000 500 897* 205* Half-collared Kingfisher – – 16 5

40
Appendix 1.4 contd
Threshold level Estimated population size
Species Ramsar(1%)1
Sub-regionalIBA (0.5%)2
Western Cape3
Cape Town metropole
Hamerkop 10000 5000 85 10 Hartlaub's Gull 300 150 18398 10806 Kelp Gull 700 350 21057 7714 Kittlitz's Plover 1000 500 6415 956 Lesser Flamingo 600 300 9024 2424 Little Bittern 1000 500 42 27 Little Egret 3500 1750 1715 208 Little Grebe 1000 500 8216 3274 Little Stint 10000 5000 19129 4483 Little Tern 365 183 196 71 Maccoa Duck 100 50 1625 757 Malachite Kingfisher – – 165 75 Marsh Owl – – 3* 3* Marsh Sandpiper 750 380 1685 266 Osprey – – 54 2 Pied Avocet 190 95 8941 3844 Pied Kingfisher – – 607 96 Purple Heron 880 440 284 102 Red Knot 3400 1700 2597 3 Red-billed Teal 7500 3750 6130 2244 Red-knobbed Coot 10000 5000 81471 6874 Reed Cormorant 10000 5000 8004 1827 Ruddy Turnstone 1000 500 4691 32 Ruff 20000a 10000a 8197 1809 Sanderling 1400 700 4253 78 Sandwich Tern 1700 850 7573 3445 South African Shelduck 500 250 10496 280 Southern Pochard 500 250 4291 2592 Spur-winged Goose 750 375 5780 1231 Squacco Heron – – 16 7 Swift Tern 200 100 7869 2116 Terek Sandpiper 10000 5000 277 1 Three-banded Plover 1000 500 2028 400 Water Thick-knee 1000 500 315 108 Whiskered Tern 100 50 1026 207 White-backed Duck 180 90 1041 354 White-breasted Cormorant 120 60 6553 1563 White-faced Duck 10000 5000 306 192 White-fronted Plover 180 90 1675 45 White-winged Tern 20000 10000 19291 15793 Wood Sandpiper 20000 10000 516 132 Yellow-billed Duck 1000 500 18877 4513 Yellow-billed Egret 1000 500 334 147
1 Threshold levels sourced from Wetlands International (2006) and represent levels for global and biogeographical (southern Africa) populations. These are based on criterion set out in the Ramasr Convention. Also represents the 1% Global IBA thresholds.
2 Threshold sourced from Barnes (1998) to identify Sub-regional IBAs in southern Africa. 3 Figure refers to sum of maximum count across all major wetlands in the Western Cape or Cape Town
metropole and represents the estimated minimum population in the these regions. Data sourced from Coordinated Waterbird Counts (Animal Demography Unit, unpubl. data, 2006).
* Due to the cryptic nature of the species or association with terrestrial habitats these figures should be treated as absolute minimum estimates and therefore interpreted with caution.

Appendix 1.5 Summary of 30 wetland sites in the Western Cape, South Africa. Sites sorted in ascending order based on site no. (Figure 1.4). Sites in bold indicate the five representative sites used in Chapter 4 and Appendices A–D.
Site no.
Site name Site code1
Coordinates Wetland type Hydrology2 Estuarine bio-region2
Conservation status
1 Olifants River Mouth ol 31°41S 18°12E Estuary Permanently open Cold temperate Unprotected 2 Jakkalsvlei jk 32°05S 18°19E Coastal lake Temporarily inundated — Unprotected 3 Wadrif Saltpan ws 32°12S 18°20E Coastal lake Temporarily inundated — Unprotected 4 Verlorenvlei vv 32°19S 18°24E Estuary Permanently inundated — Unprotected 5 Rocher Pan RP 32°19S 18°23E Coastal lake Temporarily inundated — Protected 6 Berg River Estuary bg 32°47S 18°09E Estuary Permanently open Cold temperate Unprotected 7 Langebaan Lagoon lb 33°08S 18°03E Estuarine bay Permanently open Cold temperate Protected 8 Radyn Dam rd 33°18S 18°43E Farm dam Temporarily inundated — Unprotected 9 Voelvlei Dam wa 33°22S 19°02E State dam Permanently inundated — Unprotected 10 Droëvlei Dam DV 33°59S 18°10E Farm dam Temporarily inundated — Unprotected 11 Paarl WWTW PA 33°51S 18°40E Sewage works Permanently inundated — Unprotected 12 Rietvlei Rv 33°50S 18°30E Freshwater pans Temporarily inundated — Partially protected 13 Diep River Estuary dp 33°53S 18°29E Estuary Temporarily open Cold temperate Unprotected 14 Wildevoelvlei Wv 34°08S 18°21E Coastal lake Permanently inundated — Unprotected 15 Zandvlei River Estuary Zv 34°05S 18°28E Estuary Temporarily open Warm temperate Partially protected 16 Rondevlei Rn 34°03S 18°29E Coastal lake Permanently inundated — Protected 17 Strandfontein WWTW St 34°04S 18°30E Sewage works Permanently inundated — Unprotected 18 Macasser WWTW Mc 34°04S 18°46E Sewage works Permanently inundated — Unprotected 19 Theewaterskloof Dam Ve 34°24S 19°13E State dam Permanently inundated — Unprotected 20 Bot River Estuary BT 34°13S 19°20E Estuary Temporarily open Warm temperate Partially protected 21 Klein River Estuary kl 34°25S 19°55E Estuary Temporarily open Warm temperate Partially protected 22 De Mond Estuary dm 34°42S 20°06E Estuary Temporarily open Warm temperate Unprotected 23 De Hoop Vlei DH 34°38S 20°19E Coastal lake Temporarily inundated — Protected 24 Breede River Estuary br 34°24S 20°48E Estuary Permanently open Warm temperate Unprotected 25 Great Brak Estuary gb 34°03S 22°14E Estuary Temporarily open Warm temperate Unprotected 26 Wilderness Estuarine System wt 33°59S 22°38E Coastal lake Temporarily open Warm temperate Partially protected 27 Swartvlei Estuarine System th 33°59S 22°45E Coastal lake Temporarily open Warm temperate Partially protected 28 Knysna Lagoon kn 34°03S 23°02E Estuarine bay Permanently open Warm temperate Unprotected 29 Keurbooms River Estuary kb 34°01S 23°23E Estuary Permanently open Warm temperate Unprotected 30 Beaufort West WWTW bw 32°22S 22°35E Sewage works Permanently inundated — Unprotected
1 Site code used in correspondence analysis (Chapter 5); codes in caps are of the five focal sites to make them easily distinguishable for plotting purposes
2 From Whitfield (2000)
41

42
Appendix 1.6 The Ramsar classification of wetlands (as provided on the Information Sheet for Ramsar wetlands, 2009-2012 version. (http://www.ramsar.org)
Marine/Coastal Wetlands
A – Permanent shallow marine waters in most cases less than six metres deep at low tide; includes sea bays and straits.
B – Marine subtidal aquatic beds; includes kelp beds, sea-grass beds, tropical marine meadows.
C – Coral reefs. D – Rocky marine shores; includes rocky offshore islands, sea cliffs. E – Sand, shingle or pebble shores; includes sand bars, spits and sandy islets;
includes dune systems and humid dune slacks. F – Estuarine waters; permanent water of estuaries and estuarine systems of
deltas. G – Intertidal mud, sand or salt flats. H – Intertidal marshes; includes salt marshes, salt meadows, saltings, raised salt
marshes; includes tidal brackish and freshwater marshes. I – Intertidal forested wetlands; includes mangrove swamps, nipah swamps and
tidal freshwater swamp forests. J – Coastal brackish/saline lagoons; brackish to saline lagoons with at least one
relatively narrow connection to the sea. K – Coastal freshwater lagoons; includes freshwater delta lagoons. Zk(a) – Karst and other subterranean hydrological systems, marine/coastal Inland Wetlands
L – Permanent inland deltas. M – Permanent rivers/streams/creeks; includes waterfalls. N – Seasonal/intermittent/irregular rivers/streams/creeks. O – Permanent freshwater lakes (over 8 ha); includes large oxbow lakes. P – Seasonal/intermittent freshwater lakes (over 8 ha); includes floodplain lakes. Q – Permanent saline/brackish/alkaline lakes. R – Seasonal/intermittent saline/brackish/alkaline lakes and flats. Sp – Permanent saline/brackish/alkaline marshes/pools. Ss – Seasonal/intermittent saline/brackish/alkaline marshes/pools. Tp – Permanent freshwater marshes/pools; ponds (below 8 ha), marshes and
swamps on inorganic soils; with emergent vegetation water-logged for at least most of the growing season.
Ts – Seasonal/intermittent freshwater marshes/pools on inorganic soils; includes sloughs, potholes, seasonally flooded meadows, sedge marshes.
U – Non-forested peatlands; includes shrub or open bogs, swamps, fens. Va – Alpine wetlands; includes alpine meadows, temporary waters from snowmelt. Vt – Tundra wetlands; includes tundra pools, temporary waters from snowmelt. W – Shrub-dominated wetlands; shrub swamps, shrub-dominated freshwater
marshes, shrub carr, alder thicket on inorganic soils. Xf – Freshwater, tree-dominated wetlands; includes freshwater swamp forests,
seasonally flooded forests, wooded swamps on inorganic soils. Xp – Forested peatlands; peatswamp forests. Y – Freshwater springs; oases. Zg – Geothermal wetlands Zk(b – Karst and other subterranean hydrological systems, inland

43
Appendix 1.5 contd
Human-made wetlands
1 – Aquaculture (e.g., fish/shrimp) ponds 2 – Ponds; includes farm ponds, stock ponds, small tanks; (generally below 8 ha). 3 – Irrigated land; includes irrigation channels and rice fields. 4 – Seasonally flooded agricultural land (including intensively managed or grazed
wet meadow or pasture). 5 – Salt exploitation sites; salt pans, salines, etc. 6 – Water storage areas; reservoirs/barrages/dams/impoundments (generally
over 8 ha). 7 – Excavations; gravel/brick/clay pits; borrow pits, mining pools. 8 – Wastewater treatment areas; sewage farms, settling ponds, oxidation basins,
etc. 9 – Canals and drainage channels, ditches. Zk(c) – Karst and other subterranean hydrological systems, human-made Note: “floodplain” is a broad term used to refer to one or more wetland types, which may include examples from the R, Ss, Ts, W, Xf, Xp, or other wetland types. Some examples of floodplain wetlands are seasonally inundated grassland (including natural wet meadows), shrublands, woodlands and forests. Floodplain wetlands are not listed as a specific wetland type herein.
45
Chapter 2
The Waterbird Conservation Value score: a new
method to assess wetland avifaunal importance

46

47
Abstract
Various analytical methods (species richness, species diversity, total count, biomass and
energy consumption) have been used to assess the importance of wetlands for
waterbirds. Although these are important indicators, they are limited in describing the
real conservation value of the wetland for waterbirds. Traditionally, designation of
wetlands of international importance (Ramsar sites) based on waterbirds has focused on
those species meeting the Ramsar 1% population threshold levels. These levels, applied
at global or sub-regional levels, prioritise a subset of species as being important with
little or no consideration to the contributions of the remaining species’ populations. In
this chapter, I describe and discuss a new method to assess wetland avifaunal
importance. Termed the Waterbird Conservation Value (WCV) score, this method
calculates the ratio of each species’ abundance to its known 1% threshold level and
summed across all species to give a an overall waterbird conservation score. Larger
score values indicate greater conservation value. There is a clear relationship between
numbers of 1% threshold species and larger WCV scores but levels of species abundance
determine the impact on the WCV score. Scores can be evaluated at site and species
levels. Relative contributions made by all species are thus considered in the assessment
and not limited to the Ramar 1% threshold species. The outputs of the WCV score are
demonstrated using a case study from three regions within the East-Atlantic flyway.

48
Introduction
Assessing the value and importance of biological communities plays a critical role in
conservation planning and management (Spellerberg 1981, Begon et al. 1990,
Sutherland et al. 2004). Knowing the functions and status of organisms in ecosystems
places value on sites and habitats and these have significance in determining the
importance of the availability and distribution of habitats and sites for species (Ando et
al. 1998). The ecological requirements vary between species so that habitats or sites
become important or valuable for different species at different times throughout their
annual cycle (Weller 1988, Tucker and Evans 1997).
From a conservation perspective, the importance of a site is measured or gauged
based on site characteristics and the intrinsic value of the species’ populations at that
site. Assessing these attributes assigns a value to the site and species present.
Consequently, one can ask not only how important a site is for a species or a suite of
species (i.e. spatial component), but also how important is a species or species’
population at site (or local), regional or global levels (i.e. numerical component). There is
inter-play between these two aspects so that an individual site can have greater
conservation relevance to a single species compared with the actual abundance of a
species.
A variety of studies has used varying methodologies to assess the biological,
ecological or ornithological importance of a site. Goldsmith (1975) proposed a single
index system to assess and prioritise ecological quality for different land-use patterns in
the United Kingdom which considered criteria such as area, naturalness, richness and
diversity. Gehlbach (1975) proposed a scoring system based on quantitative values for
climax condition, educational suitability, species significance, community representation
and human impact to prioritize natural areas in Texas, USA. Adamus and Clough (1978)
considered 13 characteristics in evaluating the importance of species in natural areas in
Maine, USA; the key ones were spatial distribution, area size needs, endemicity, scarcity
and habitat specialisation. They highlighted the need for a ranking or weighted system
to refine criteria important to site and species conservation. In The Netherlands, van der
Ploeg and Vlijm (1978) evaluated procedures and usefulness of ecological methodologies
for nature conservation and land use planning. Their assessment highlighted that
ecological site evaluation ecological criteria and land-use types need to be weighted to
prioritize conservation efforts.
Fuller (1980) attributed three aspects to classify sites of ornithological interest in
the United Kingdom: population size, rarity and diversity. Using quantitative
information, he assessed each attribute at local, county, regional, national and

49
international level and assigned a rank for each attribute for each level; this provided a
way to prioritise sites at different spatial scales. Spellerberg (1981) differentiated
between ecological evaluation of a species and habitat evaluation. The former focuses
entirely on the status of a species (e.g. how common or rare it is) and considers the
degree of threat experienced by that species, while evaluating habitats is more complex
and focuses on determining priority ranking of natural areas based on a range of
habitats. Determining minimum population sizes and land area requirements for
threatened species were the focus of Schaffer’s (1981) species conservation review while
Carter et al. (2000) determined the conservation priorities of North American songbird
species using seven parameters namely relative abundance, area abundance, spatial
extent of breeding and non-breeding distribution and threat indicators. They identified a
‘watch list’ for the USA based on a summation of parameter scores as a way to highlight
species in urgent need of conservation attention. Finer spatial scale studies have also
been undertaken to determine conservation priorities for specific species (e.g. Fischer
and Lindenmayer 2002, McCann et al. 2007).
During the mid-1980s, BirdLife International launched its Important Bird Area
(IBA) programme (http://birdlife.org/action/science/sites/index.html). This programme
designates and defines areas that are important for birds based on the occurrence and/or
population size of the following: globally threatened species, nationally threatened
species, range restricted species, biome-restricted species and/or congregatory species;
the latter group applies more regularly to waterbirds than terrestrial species. The first
IBA directory was published for Europe (Grimmett and Jones 1989) followed by the
Middle-East (Evans 1994) and Southern Africa (Barnes 1998). An extension of the IBA
programme has been the identification of globally important Endemic Bird Areas
(Stattersfield et al. 1998). A total of 218 EBAs have been designated worldwide and
these focus mainly on range-restricted species. Although these areas have high
conservation priorities for species with limited ranges most of them constitute passerine
species with few waterbirds included. This makes ecological sense due to the fact that
waterbirds are highly mobile, often migratory organisms, often not limited to specific
wetlands for the most part of their annual cycle and able to move between sites when
conditions become unfavourable. Although IBAs and EBAs are providing opportunities
to identify and conserve areas for a wide-range of largely terrestrial species, there seems
to be limited value of these programmes for long-term waterbird conservation.
Waterbirds and wetlands have been well studied in Western Eurasia and Africa
over the past 40–50 years, but site conservation for waterbirds has been an ongoing
challenge (Beintema and van Essen 1999, Davidson and Stroud 2006). Concern for
waterfowl populations and wetland habitats were first raised in the late 1930s and this

50
led to an International Wildfowl Inquiry being set up (Kuijken 2006). This group
formulated initiatives to assess the reasons for the worldwide decline of waterfowl
populations and loss of related wetland habitats, and determine protective measures to
put in pace. In 1954 the International Waterfowl and Wetlands Research Bureau was
established and in 1967 the first formal research and monitoring programme was
introduced – the International Waterbird Census (initially called the International
Wildfowl Census). In 1971, the Convention on the Conservation of Wetlands of
International Importance (commonly referred to as the Ramsar Convention) was
established and the 1% criterion was adopted as a tool in ecological evaluations
specifically to identify wetlands of international importance for waterbirds. The 1%
criterion is discussed in more detail below. Recently programmes such as Wings Over
Wetlands (Barnard et al. 2010, http://www.wingsoverwetlands.org) have provided
additional conservation approaches to promote species and site conservation for
migratory waterbirds in the African-Eurasian flyway.
In this chapter I identify and discuss the various ways of assessing avifaunal
importance at site level, bearing waterbirds in mind. I then describe a new method to
assess the conservation value of wetlands for waterbirds within the flyway framework
and discuss the value of this method as a tool to develop better priorities for waterbird
conservation globally.
Assessing avifaunal importance at site level
In the context of this paper, a site may be thought of as a wetland. Wetlands are
generally perceived as discrete sites, with clearly defined natural boundaries. Terrestrial
sites may, or may not, have natural boundaries. Much of what follows can also be
applied to terrestrial sites. Various ecological attributes have been used to attempt to
define the avifaunal importance of a wetland. Attributes (a) to (e) are listed, and
dismissed as being either simplistic or inappropriate.
Species richness and species diversity
The number of different species at a wetland provides a measure of species richness. The
generally accepted convention is that the greater the number of species the greater the
importance this places on the value of the wetland.
On its own species richness has limited value. This is because the wetland may
support many different species but each with small numbers of individuals. Species
richness is particularly misleading if it includes vagrant species which have only
occurred rarely at the wetland. Species richness thus does not necessarily indicate that
the wetland is ecologically important, either overall or for particular species. As a result

51
species richness is frequently linked together with abundance values to provide an index
of species diversity. The number of indices which attempt to measure species diversity is
enormous and definitions of species diversity are unclear and ambiguous (MacArthur
1961, MacArthur 1964, Hurlbert 1971, Whittaker 1972, Peet 1974, Huston 1979);
Simpson’s diversity index (λ) and the Shannon diversity index (H′) are generally
considered the most popular and are extensively used in ecological studies (Pielou 1966,
Peet 1975, Begon et al. 1990, Magurran 2004). But even here definitions and
applications differ based largely on underlying assumptions that need to be considered,
such as that all species are considered to be equally different, that all individuals in a
species class are considered equal, and that all individuals are distributed evenly
through the community (Hendrickson and Ehrlich 1971, Whittaker 1972, Peet 1974,
Begon et al. 1990). For waterbirds, these assumptions are rarely met; Götmark et al.
(1986), evaluated λ and H′ using data from Swedish wetland bird surveys, and concluded
that these indices are of little value in site evaluation and should not be used to rank
sites of ornithological interest.
Peet (1974) explored the methods and value of measuring species diversity and
concluded that multiple concepts tend to be evaluated under the title of diversity. He
highlighted that the characteristics and responses of species diversity indices will change
based on community structure and that this needed to be understood as a basis for their
application. Huston (1979) attempted to explain species diversity based on non-
equilibrium interactions of competing populations. Hurlbert (1971) and Bachman (1998)
even dismissed the species as a valid unit to measure diversity and argued that it was an
outdated or non-concept; Bachmann (1998) added that there is an increasing consensus
that as a category, the species is an artificial construct and suggested molecular units as
more appropriate ‘measurements’ of diversity.
Based on the above, it is evident that there are many theoretical and conceptual
issues surrounding ‘species diversity’. The resultant opposing views leads to ambiguity
and uncertainty of which indices provides the better evaluation. I therefore disregard
species richness and species diversity as appropriate methods for evaluating the
importance of a wetland site for waterbirds.
(a) Species status
The number of species with an adverse conservation status at a wetland has regularly
been used to determine the value and or importance of a wetland. Status here includes
Red Data Book species (Stattersfield and Capper 2004, Barnes 2000), range-restricted
species (IBAs, see Heath et al. 2000), biome-restricted species (IBAs, see Heath et al.
2000), endemic species and breeding endemics (for southern Africa, see Hockey et al.

52
2005). Although this does have conservation value it frequently applies to a small
percentage of the number of species recorded at the wetland and the focus of
conservation efforts are therefore geared specifically towards these ‘special’ species. The
remaining species are generally considered as having no or little conservation value
either at an individual species level or at the overall wetland level. Using species status
as a final wetland evaluation tool is too simplistic because it usually considers a small
subset of the entire waterbird community at a site and therefore not representative of all
species present at the site.
(b) Abundance
The total number of individuals at a wetland is frequently used to provide a measure of
the significance of a wetland. It is usually regarded that the larger the number of
individuals at the site the greater the conservation value of the site. While this may have
importance at a local/site level, from a regional or global population perspective the
number of birds may have less significance.
The Convention on the Conservation of Wetlands of International Importance
especially as Waterfowl Habitat (Ramsar Convention) identifies, under Criterion 5, that
a wetland should be considered as internationally important if it regularly supports
20 000 or more waterbirds. This criterion is simple to implement because it requires
knowledge only of the number of birds counted at the site.
This criterion rarely applies to southern African wetlands; wetlands holding more
than 20 000 waterbirds are rare in this region. Compared with temperate regions in the
northern hemisphere, where permanent wetlands support predictable numbers of
waterbirds (Cramp and Simmons 1977), most southern African wetlands are temporary
and ephemeral, and waterbird occurrence thus unpredictable.
Although abundance on its own provides some indication of how important a site
may be for waterbirds, there is usually a bias towards sites which support over-abundant
species with less attention paid to sites which support less abundant sites (Rosa et al.
2003, Paracuellos and Telleria 2004, Bolduc and Afton 2008). In addition, the Ramsar
20 000 criterion cannot be adequately applied globally because of varying wetland types,
particularly marine areas (Skov et al. 2007). Total abundance is therefore not a
definitive method to evaluate wetland importance for waterbirds.
Another disadvantage of simple numerical abundance is that it takes no account
of the size of the bird. These disadvantages are addressed in (d) and (e) below.

53
(c) Biomass
Biomass, also referred to as the standing crop, is defined as the mass of living biological
organisms per unit area at a given time and can be expressed in units of energy (e.g.
joules/m2) or dry organic matter (tonnes ha–1) (Begon et al. 1990). It is usually measured
to give the natural mass of organisms in situ.
Although overall abundance (see above) represents a first quantitative measure of
the importance of a wetland, biomass represents an alternative quantitative method to
assess site importance. Measuring the importance of a wetland as the total number of
waterbirds present makes the assumption that each individual of a species makes an
equal contribution to the waterbird community, so that one Greater Flamingo
Phoenicopterus ruber is equivalent to one Little Stint Calidris minuta. This has
limitations in assessing wetland importance for waterbirds as larger and heavier species
have a larger impact on the wetland than smaller birds. One alternative to using a
simple total of the number of each species of waterbird is to compute the total biomass of
all the birds. The composition of the waterbird community may be such that large
numbers of smaller-sized (lighter) birds could represent the same biomass as a smaller
number of larger-sized (heavier) birds. For example, at a given wetland 20 000 Little
Stints (mean mass 20 g) would represent the same biomass as 115 Greater Flamingos
(mean mass 3500 g). In the biomass calculation, each Greater Flamingo is equivalent to
175 Little Stints.
However, this is going to the opposite extreme. On the one hand, the abundance
equation “one flamingo = one stint” is clearly unsatisfactory; on the other hand, the
biomass equation “one flamingo = 175 stints” is also unsatisfactory, because we know
that the metabolic rates of smaller birds are greater than those of heavier birds (Daan et
al. 1990, Martin and Palumbi 1993, Gillooly et al. 2001). Thus an analysis based on
biomass analyses will be biased in favour of the large species and an analysis based on
numerical abundance will be biased in favour of the small species.
Ideally, what is needed is an index which measures the impact of each species on
the wetland, effectively a measure of energy flow. However, I do not have measurements
for each species; but we can estimate this from allometric equations, from which we
know that energy is scaled as approximately mass to the power of two-thirds. This is the
topic of the next section. Although the estimates of energy for individual species may
differ from the allometric equation, the results obtained must be closer to the truth than
either raw abundance or total biomass.

54
(d) Energy consumption
As argued above, energy, which is closely related to biomass, is a better way to assess
the importance of a site is for waterbird communities. In ecological terms energy can be
defined as ecological efficiency which is described as resource utilization and the extent
to which resources are converted into biomass (Krebs 1999, Ricklefs and Miller 2000).
Ecological efficiency, or how energy is transferred between different trophic levels, can
be broken down into and quantified at various levels as described below:
Exploitation efficiency is the amount of food ingested divided by the amount of prey
production (I / Pn)
Assimilation efficiency is the amount of assimilation divided by the amount of food
ingestion (A / I)
Net Production efficiency is the amount of consumer production divided by the
amount of assimilation (Pn + 1 / A)
Gross Production efficiency is the assimilation efficiency multiplied by the net
production efficiency, which is equivalent to the amount of consumer production
divided by amount of ingestion (Pn + 1 / I)
Ecological efficiency is the exploitation efficiency multiplied by the assimilation
efficiency multiplied by the net production efficiency, which is equivalent to the
amount of consumer production divided by the amount of prey production (Pn + 1 / Pn)
Nagy (1987) investigated the allometric relationship between body mass M (g)
and field metabolic rate (FMR, kJ/day) for different vertebrate groups. For birds, he
estimated that the relationship is given by FMR = 10.9M0.640. An estimate of the Daily
Energy Intake (DEI, kJ/day), including metabolized and non-metabolized energy, is then
obtained by correcting the FMR for Assimilation Efficiency (AE, dimensionless):
DEI=FMR/AE. Values of AE that are usually used for birds are 58% for herbivores
(DEI=FMR/0.58) and 75% for invertebrate feeders and piscivores (DEI=FMR/0.75)
(Velásquez et al. 1991, Ricklefs et al. 1996). The total DEI for a species is estimated as
the product of the number of birds of the species and the DEI of the species. The overall
DEI for the wetland is then estimated by summing the DEI values for all species
occurring at the site. This value provides an estimate of total the amount of energy that
the waterbird community extracts from the wetland.
On average, the DEI for one Greater Flamingo is 1373 kJ/day, and for one Little
Stint is 63 kJ/day. Thus on the energy scale, one flamingo = 22 stints, compared with one
flamingo = one little stint on the abundance scale and one flamingo = 175 stints on the
mass scale. The allometric relationship thus suggests the 22 Little Stints have an impact
on the wetland which is comparable to that of one Greater Flamingo.

55
Energy consumption is a useful tool when assessing the importance of a site for a
waterbird species because it represents a common currency that facilitates inter-species
comparisons. It also represents a valuable method for comparing wetlands because the
importance of a wetland for waterbirds can be measured as an estimate of the total
amount of energy extracted from it by the waterbirds. Generally, there is a strong
correlation between high productivity and increased waterbird abundance and richness
(Berruti 1983, González-Solís et al. 1996, Hornung and Foote 2006). For discussions of
the importance of wetlands based solely on numerical data, this approach based on
estimates of energy consumption is recommended, because it reduces the counts to an
ecologically meaningful quantity for comparisons between species at a site and between
sites.
However, none of the criteria (a) to (e) discussed takes any account of the
conservation status of the species occurring at a wetland. Thus they do not adequately
provide a measure for the overall importance of a wetland for waterbirds from a
conservation perspective. They take no cognisance of the size of a population of a
waterbird species at a wetland in relation to the overall population size. The rest of the
chapter thus focuses on the following two criteria (f) the standard Ramsar 1% threshold
and (g) a proposal for an extension to the standard assessment method, which I will
describe as the Waterbird Conservation Value score.
(e) The 1% criterion
Counts of waterbirds at a wetland provide a measure of abundance for species present.
But, as mentioned in (c) above, how significant that value is will be dependent on the
knowledge of the proportion this count constitutes to the overall (global) or regional
population for that species.
The concept of the 1% criterion was first introduced to waterbird ecology in 1971
at the inaugural meeting of the Ramsar Convention in Ramsar, Iran (Kuijken 2006).
Prior to 1971, the International Waterfowl Research Bureau, (IWRB, predecessor of
Wetlands International) had several meetings to consider the required level of waterbird
numbers before a wetland could be considered as being of ‘international importance’.
After some debate and consideration of 5% and 2% models, the latter excluding a large
number of critical network sites, particularly for migrant species, the 1% criterion was
adopted (Kuijken 2006). The criterion (Criterion 6 of the Ramsar Convention) states that
a wetland should be deemed internationally important if “it regularly supports 1% of the
individuals in a population of one species or subspecies of waterbird”. This criterion has
ever since been used to evaluate the ecological importance of wetlands for waterbirds on
a global scale. Wetlands of International Importance (known colloquially as

56
“Ramsar sites”) have been designated based on this criterion and to date 1 953 wetlands
have been registered under the Ramsar Convention covering 190 455 433 ha of the
earth’s surface (http://www.ramsar.org). This criterion has also been used to designate
Important Bird Areas (IBAs) in terms of BirdLife International’s IBA programme
(Barnes 1998, Heath et al 2000, Fishpool and Evans 2001).
Application of the 1% criterion has been based on the waterbird databases held by
the IWRB and and its successor Wetlands International. This covered the data
submitted as part of the International Waterbird Census (IWC) initiated in 1967. Since
1995, Wetlands International has maintained the IWC databases and 1% thresholds are
provided by Waterbird Population Estimates, a four-yearly publication published by
Wetlands International, since 1994. The latest edition (Wetlands International 2006)
contains the most up-to-date available population information for 2305 bio-geographical
populations of 878 waterbird species; numerical abundance is provided for 79% of these
populations.
The development and application of the 1% criterion considered a flyway
approach to waterbird conservation, something that was not considered prior to the
adoption of the Ramsar Convention. By far, this approach held the strongest
conservation argument for identifying sites of conservation and flyway significance for
many waterbird species.
However, the application of the Ramsar “1% criterion” is subject to considerable
uncertainty. The 1% values themselves are generated by Wetlands International, and for
many species they are based on educated guesses. But even if we accept these 1%
threshold values, there are still question marks. Does a site meet the 1% threshold if this
value is exceeded for a species on a single survey, or is it necessary for the mean (or
median) of a series of counts of a species to exceed the threshold? Clearly, the latter is
more convincing, because then the wetland regularly contains more the 1% of the
population of a species that really does “want to be” at the wetland (as opposed to a
potentially once off visitation).
However, from the perspective of the measure of wetland value to be proposed
here, the key limitation with the Ramsar approach is its dichotomy. A species either
meets the threshold at a wetland or does not meet it, and we are generally provided with
a simple list of species meeting the threshold. Species just missing the threshold are
disregarded. The Important Bird Area (IBA) site selection criteria, for southern Africa,
recognised this flaw and created a third category of species, those that met the “half-
percent criterion”, i.e. with between 0.5% and 1% of their population at the site.
All of the above attributes have significance at some or other level and used in
conjunction they do provide a strong base for providing an assessment of the

57
conservation importance of a site for waterbird populations. However, these criteria are
usually considered in isolation, on a species by species basis, and although this provides
valuable input, the overall consideration of all species is not taken into account,
particularly with regards to the 1%, threshold levels. Bearing this in mind, I present an
alternative way of assessing the importance of a wetland site for waterbirds. This is
known as the Waterbird Conservation Score (WCS) and is defined below.
(f) The Waterbird Conservation Value score
The foundation of the Waterbird Conservation Value (WCV) score is based on the 1%
threshold levels and the contribution each species makes to the overall population at a
wetland. In principle the score is a measure of the proportion of each species’ count
relative to the global 1% threshold level for each species. The score is calculated by
dividing the number of waterbirds of each species by the 1% threshold value of the
species. This yields the number of 1% units of the species at the wetland. These values
are then summed for all the species at the wetland to estimate the overall WCV score for
the wetland. This can be represented by the following formula:
WCV score = ∑
si
Rt
where
si = abundance of the species at a wetland
Rt = current Ramsar 1% threshold for the species si
Thus, if the WCV of a wetland is 45, then this is equivalent to having 45% of the entire
population of a single (imaginary) species at the wetland. This approach to evaluating
the ‘value’ of a wetland is more precisely nuanced than the crude method of counting the
number of species that exceed the 1% thresholds. Because of the way that the WCV score
is calculated, with the 1% threshold values in the denominators of a series of terms
which are added, it is important that the 1% values are accurately estimated. If the
threshold values are incorrect for a species which is abundant at a wetland, then the
contribution of that species to the WCV score will either be biased large or biased small.
If this system is adopted for assessing wetland importance, it increases the obligation on
Wetlands International to estimate the 1% threshold as accurately as possible.
The underlying consideration is that each species makes a contribution to the
WCV score, whether large or small. The overall score obtained represents a value which
represents the importance of the combined conservation value of each species. Each
individual bird makes a contribution to the WCV.

58
What values constitute a good or poor conservation score? This will depend on
three inter-related factors: (1) the number of species recorded at the site, (2) the number
of species reaching the 1% threshold and (3) the proportion values that each species
makes to the total WCV score. Generally, large values for the WCV scores may be
obtained in two ways: small contributions from a large number of species and large
contributions from a few species. It is therefore difficult to interpret what constitutes a
good or poor score as this will depend on the site or regions in which the waterbirds have
been surveyed. This will be examined further in the case study described below. The
hypothesis is that sites that support large numbers of birds with a high species richness
will have high WCV scores.
Case study – East Atlantic Flyway
In order to test the application of the WCV score I gathered waterbird count data from
wetland sites along the East-Atlantic Flyway (Figure 2.2). I chose three regions along
this flyway: western Europe, West Africa and southern Africa. I selected the East
Atlantic Flyway for three reasons: (1) it supports migrant waterbird populations that
utilise the entire length of the flyway and which would lend itself to making comparisons
between wetlands and regions; (2) there are well-established programmes of waterbird
surveys at these wetlands, many with long-term datasets, within each section in the
flyway and (3) the count data were readily available.
Methods
Waterbird census data were sourced from the International Waterbird Census database
(Wetlands International unpubl. data), and the Coordinated Waterbird Counts (Animal
Demography Unit unpubl. data) for sites within South Africa. Sites were grouped into
three regions encompassing the flyway: Western Europe, West Africa and Southern
Africa.
I selected January census data because this is the compulsory count period for the
IWC which would ensure maximum availability to data. For logistical reasons, counts for
some sites were not always carried out in January and were either undertaken in
December or February (T. Langendoen in litt.). This three-month period was then
identified as the ‘January’ count period which for the Northern Hemisphere would
represent ‘midwinter’, while for the Southern Hemisphere this would be ‘midsummer’.
Mean counts for all species at all sites were extracted for the analysis. I restricted the
analysis to wetlands for which the total number of waterbirds exceeded 20 000 and for
those species which had defined 1% threshold levels (Wetlands International 2006);
species which did not have defined levels or which occurred in small numbers were

59
excluded. The data covered the period 1960–2011; however, the surveys at most
wetlands spanned a shorter period. The frequency of counts varied across wetlands
during this period.
Results
Totals of 137 sites were included from western Europe (comprising 105 species), 22 sites
from western Africa (comprising 99 species), and 11 sites from southern Africa
(comprising 65 species).
Summary statistics for each region are given in Tables 2.1 and 2.2. On average,
western European sites had the smallest WCV scores (21.8), southern African sites the
largest (77.0); West African sites had a mean WCV score of 59.2. For western Europe,
WCV scores ranged from 1.7–205.5, for Western Africa 2.5–195.8 and for Southern
Africa 4.1–174.2 (Table 2.1).
The relationship between the WCV score and the number of species reaching the
1% threshold for each region showed that there was a general trend towards sites that
supported larger number of species reaching 1% threshold having large WCV scores
(Figures 2.6a–2.6c). Although this was particularly notable in western Europe, there was
large variation around this pattern. Across all three regions, sites with WCV values
between 50–75 had a range of species from 2–16 reaching the 1% threshold.
In each region outliers were evident (Figures 2.6a–2.6c). In western Europe, two
sites in the Waddenzee (MON01 and SEA01) had high WCV scores but were separated
due to the number of species meeting threshold levels (Figure 2.6a). SEA01 had a single
species (Common Eider) meeting 1% threshold and which contributed 100% to the site’s
WCV score (124.4), while MON01 had a higher WCV score (205.5) but had 16 species
meeting Ramsar threshold levels (Appendix 2.1). Of the 16 species, three species
constituted 60% to the overall score – Dunlin (80.4%), Bar-tailed Godwit (21.3) and
Eurasian Curlew (19.9).
Three sites in western Africa (Waza Lagoon, Lac Tchad/Nigeria and Mare de
Albarkaize) revealed WCV scores greater than 100 but with five or fewer species meeting
1% threshold levels (Appendix 2.2). Waza Lagoon had the largest WCV score of 195.8,
with Squacco Heron comprising 94% of the overall score, while Mare de Albarkaize had a
score of 152.6 of which 140.6 comprised White-faced Duck and Fulvous Duck (Table 2.2,
(Appendix 2.2). Lac Tchad/Nigeria scored 149.8, 87% of which comprised Squacco Heron.
In contrast, Delta du Saloum National Park supported 26 Ramsar-threshold species and
scored 131.3; the species making the greatest contributions were Slender-billed Gull
(score = 33), Caspian Tern (26), Grey-headed Gull (8.6) and Little Stint (6.7).

60
In southern Africa, Walvis Bay had 21 species exceeding the 1% threshold, the
largest of any wetland in the region. It has a large WCV score of 137.8; in contrast, Sua
Pan had the largest WCV score (174.2) but only had two species which reached the 1%
threshold (Appendix 2.3). Sua Pan was dominated by Lesser Flamingo (166.7) and to a
lesser degree by Greater Flamingo (6.6), while five species comprised more than 50% of
the WCV score at Walvis Bay: Chestnut-banded Plover (23.6), Greater Flamingo (20.1),
Lesser Flamingo (18.2), Black-necked Grebe (15.1) and Pied Avocet (6.9). Three
additional sites (Sandwich Harbour: Western Sandspit, Langebaan Lagoon and
Swakopmund Saltworks) had WCV scores greater than 100 but with eight or fewer
species reaching the 1% threshold (Table 2.2, Appendix 2.3).
A summary of the priority species (i.e. species showing large WCV scores)
contributing to the overall WCV score in each flyway region is shown in Figure 2.7. Both
mean and maximum scores are presented; for the latter a threshold value of 20 or more
was used to indicate species making substantial contributions. Patterns of species’
dominance were noted between each region. A shorebird–waterfowl grouping was
evident in western Europe; on average Dunlin made the largest contribution followed by
Northern Shoveler, Common Eider and Light-bellied Brent Goose. Interestingly Bar-
tailed Godwit contributed to the overall maximum score but did not feature in the mean
WCV score. In western Africa, a wader-waterfowl emerged as the dominat species
grouping; Squacco Heron ranked first as the species making the largest contribution to
the region’s waterbird populations while White-faced Duck and Fulvous Duck made
important contributions. A wader–shorebird grouping occurred in southern Africa
dominated by Lesser Flamingo and Greater Flamingo; Black-winged Pratincole and
Curlew Sandpiper made smaller, but important, contributions to the region’s WCV score.
Discussion
In considering the outcomes from the relationships between the 1% threshold species
and the WCV scores across the three regions in the flyway, it is evident that this places a
new emphasis on the way in which waterbird population data are interpreted. The WCV
score takes into account the entire waterbird assemblage and its relative contribution to
global and/or regional species populations. It does not focus solely on the 1% threshold
species, an approach that has largely been adopted in most waterbird studies to assess
importance at a global level (e.g. Scott 1980, Perez-Arteaga et al 2002, Anderson et al.
2003). The overriding concept of the WCV score is that each species makes a contribution
to the waterbird populations at site level and that the cumulative score (or index) is
therefore an improved representation of the overall waterbird conservation value of a
site. This means that species that fall just short of the 1% threshold (e.g. WCV score of

61
0.99), would now make a contribution to the value of the site, whereas before they would
have been excluded and been deemed unimportant. Notwithstanding this, it is important
to note that species reaching the 1% threshold levels will tend to make larger
contributions to the overall WCV score.
Regional variation in WCV scores
Why do the southern African sites have, on average, the largest WCV scores, bearing in
mind that only 11 sites were assessed for this region; this was the number of sites
supporting more than 20 000 waterbirds. The large WCV scores resulted mainly from
the abundance of two species: Greater Flamingo and Lesser Flamingo (Table 2.2, Figure
3.7). All WCV scores for these species were high, particularly at the two sites in
Botswana: Sua Pan and Sua Spit Natural Reserve. These sites represent two of three
major breeding sites for these species in southern Africa (Williams and Velasquez 1997a,
b). The large WCV scores for these two species resulted from the large counts during this
period which resulted in larger proportions of birds relative to the estimated global
population and this contributed to the large overall WCV score for this region. The
Coefficient of Variation (CV) values showed that this region had relatively less variation
in WCV scores across sites (Table 2.1). The reason for this is probably because
waterbirds are less widespread and are concentrated at various permanent wetlands in
the region.
For western Africa, high WCV scores for Squacco Heron from Waza Lagone
Floodplain and Lac Tchad elevated the overall WCV score for this region (Table 2.2,
Figure 2.7). There was substantial variability in the WCV scores for each site
(Appendix 2.2) but, like southern Africa, this was considerably less than that for western
Europe. In western Africa during January it is the peak of the dry season so waterbirds
are congregated at sites which hold permanent water.
Western Europe, although it supported more sites, had the most variability
(Table 2.1) in terms of the WCV score at any given site during January. Waterbirds are
less evenly distributed in western Europe during January than western Africa and
southern Africa due to greater availability of wetland sites across the region and a
greater number of waterbird species. Three anatids (Common Eider, Northern Shoveler
and Light-Bellied Brent Goose) had peak numbers during January (Table 2.2,
Figure 2.7) which indicated its importance as a non-breeding refuge for these species;
Dunlin was the only additional species with a mean WCV score above 1; this supports
evidence that most of the populations for this species spend the non-breeding season in
Western Europe (Delany et al. 2009, Figure 2.7).

62
The results of this case study showed that, on a flyway scale, the WCV scores
provide a different perspective on the conservation value of a site than only considering
the number of species which reached the 1% threshold. Based on this criterion, many
sites appear to have limited conservation value because the importance of the site is
based solely on the number of species attaining the threshold. In contrast, the WCV
score has two advantages: (1) it considers all species, including those that do not reach
the 1% threshold, and evaluates an overall cumulative conservation importance of all the
species on the site; (2) for those species that exceed the 1% threshold it is sensitive to the
amount by which the threshold is exceeded.
Conclusions and recommendations
The WCV score provides a rapid conservation assessment of a wetland based on the
cumulative sum of 1% thresholds of the community of waterbird species at the wetland;
this is a first attempt, since the implementation of the 1% levels at the Ramsar
Convention in 1971 (Kuijken 2006) to reconsider methods of assessing the conservation
value of waterbird populations at wetlands. This new ‘index’ is based on the average
number of birds of each species present at a site. As such, it is a unidimensional
criterion. Potential future extensions and developments could be multidimensional and
also include, for example, the threat status of the species at the wetland, their taxonomic
uniqueness, measures of the extent to which the species is dependent of the wetland at
some stage in the annual cycle, etc. Under this scenario, a good strategy for evaluating
the importance of a wetland is to use the techniques selected from Multiple Criterion
Decisions Analysis, as undertaken by Mostert (2012) to prioritize species for
conservation management action in terrestrial protected areas in South Africa.
In terms of the application of the WCV score in the broader conservation context,
there is a need to consider its effective use in guiding wetland and waterbird
assessments. As a tool to measure the conservation value of waterbird populations, it
will be necessary to look at determining thresholds above which sites become regionally,
nationally or internationally important. Results in this chapter showed that scores
varied between sites, and between and within regions and based on large numbers of a
single species or across multiple species. Although the score itself is a simple index, its’
calculation is based on multiple criteria such as species composition, species abundance
and set (known) 1% thresholds for each species, Linked to these are seasonal variations,
changes in population demographics and survey frequencies. Combined, all these will
impact on the site WCV score – scores may be higher in one month or season and lower
in others. Ultimately scores will need to be determined based on the temporal survey

63
data available. Consequently, determining thresholds may not be a simple task.
However, a score of 25 or more is proposed as a preliminary threshold above which sites
could be deemed to be internationally important. This level would represent at least 25%
of our single (imaginary) waterbird population (see above), which would represent a
significant proportion of a ‘species’ global population. Sites scoring 100 or more could be
deemed to be priority conservation sites. However, this threshold concept will need to be
explored further in greater detail to fully understand the meaning of both the WCV score
measure and deemed thresholds. This will be the case for national and regional
thresholds which will depend on national or regional population estimates being
available. Thus, some sites may well reach national or regional thresholds but fail to
reach an international threshold. The identification of site thresholds and describing
WCV scores as “poor” or “good” will ultimately assist managers, administrators and
politicians in easily interpreting and understanding the importance of wetland sites for
waterbirds and their conservation value for biodiversity.
It should be noted that the use of the WCV score should not be seen in isolation,
rather it should be used as a tool that will complement the application of the Ramsar 1%
thresholds. Adopting Multiple Criterion Decision Analysis (see above) techniques with
additional in-depth exploration of the data should make valuable improvements to the
WCV score and its application. A final recommendation, therefore, is that these aspects
should be incorporated into the next phase of the development of the WCV score
whereafter the score should thoroughly tested and reviewed before consideration as a
new method to assess wetland and waterbird conservation status.
This chapter dealt with an introduction to the description and methodology of the
WCV score and was based on a single set of averaged values per wetland. In Chapter 3, I
explore further applications of the WCV score in the context where there is a time series
of surveys at a single wetland. Here the score is applied to the individual surveys.

64
References
Adamus PR and Clough GC 1978 Evaluating species for protection in natural areas.
Biological Conservation 13: 165–178.
Anderson MA, Kolberg H, Anderson PC, Dini J and Abrahams A 2003. Waterbird
populations at the Orange River Mouth from 1980–2001: a re-assessment of its
Ramsar status. Ostrich 74: 159–172.
Ando A, Camm J, Polasky S and Solow A 1998. Species distributions, land values and
efficient conservation. Science 297: 2126–2128.
Bachmann K 1998. Species as units of diversity: an outdated concept. Theory in
Bioscience 117: 213–230.
Barnard, J, Bennun L, Iyer S, Keil F and Ponziani C 2010 (eds) Wings Over Wetlands
(WOW)—flyway conservation at work across Africa and Eurasia. Enhancing the
conservation of the critical network of sites required by migratory waterbirds on the
African–Eurasian Flyways. UNEP-GEF.
Barnes KN (ed.) 1998. Important Bird Areas of southern Africa. BirdLife South Africa,
Johannesburg.
Barnes KN (ed.) 2000. The Eskom Red Data Book of birds of South Africa, Lesotho and
Swaziland. BirdLife South Africa, Johannesburg.
Beintema A and van Vessen J (eds) 1999. Strategies for conserving migratory
waterbirds– Proceedings of workshop 2 of the 2nd International Conference on
wetlands and development held in Dakar, Senegal, 8–14 November 1998. Wetlands
International Publication 55, Wageningen, The Netherlands.
Begon M, Harper JL and Townsend CR 1990. Ecology: individuals, populations and
communities. Second edition. Blackwell Science, Cambridge, USA.
Berruti A. 1983. Biomass, energy consumption and breeding of waterbirds relative to
hydrological conditions at lake St Lucia. Ostrich 54: 65–82.
Bolduc F and Afton AD 2008. Monitoring waterbird abundance in wetlands-importance
of controlling results for variation in water depth. Ecological Modelling 216:
402–408.
Carter M, Hunter WC, Pashley DN and Rosenberg KV 2000. Setting conservation
priorities for landbirds in the United States – the partners in flight approach. The
Auk 117: 541–548.
Cramp S and Simmons KEL 1977. Handbook of the birds of Europe, the Middle East and
North Africa: Vol. 1, the birds of the Western Palaearctic. Oxford University Press,
Oxford.
65
Daan S, Masman D and Groenewold A 1990. Avian basal metabolic rates their
association with body composition and energy expenditure in nature. American
Journal of Physiology 259: 333–340.
Davidson NC and Stroud DA 2006. African-Western Eurasian flyways: current
knowledge, population status and future challenges. In: Boere GC, Galbraith CA and
Stroud DA (eds) Waterbirds Around the World. The Stationery Office, Edinburgh,
UK pp.63–73.
Delany S, Scott D, Dodman T and Stroud D (eds) 2009. An atlas of wader populations in
Africa and Western Eurasia. Wetlands International, Wageningen, The
Netherlands.
Evans MI 1994. Important Bird Areas in the Middle East. Birdlife Conservation Series
No. 2. BirdLife International, Cambridge.
Fischer J and Lindenmayer DB 2002. The conservation value of paddock trees for birds
in a variegated landscape in southern New South Wales. 1. Species composition and
site occupancy patterns. Biodiversity and Conservation 11: 807–832.
Fishpool LDC and Evans MI (eds) 2001. Important Bird Areas in Africa and associated
islands: priority sites for conservation. BirdLife International, Oxford.
Fuller RJ 1980. A method for assessing the ornithological interest of sites for
conservation. Biological Conservation 17: 229–239.
Gehlbach FR 1975. Investigation, evaluation, and priority ranking of natural areas.
Biological Conservation 8: 79–88.
Gillolly JF, Brown JH, West GB, Savage VM and Charnov EL 2001. Effects of size and
temperature on metabolic rate. Science 293: 2248–2251.
Goldsmith FB 1975. The evaluation of ecological resources in the countryside for
conservation purposes. Biological Conservation 8: 89–96.
González-Solís J, Bernadí X and Ruiz X 1996. Seasonal variation of waterbird prey in
the Ebro Delta rice fields. Colonial Waterbirds 19. Special Publication 1: Ecology,
conservation, and management of colonial waterbirds in the Mediterranean region.
135–142.
Götmark F, Ahlund M and Eriksson MOG 1986. Are indices reliable for assessing
conservation value of natural areas? An avian case study. Biological Conservation
38: 55–73.
Grimmett RFA and Jones TA 1989. Important Bird Areas in Europe: ICBP Technical
Publication 9. ICBP, Cambridge.
Heath MF, Evans MI, Hoccom DG, Payne AJ and Peet NB 2000. Important Bird Areas
in Europe: priority sites for conservation. BirdLife International, Oxford.

66
Hendrickson JA Jnr, and Ehrlich PR 1971. An expanded concept of species diversity.
Notulae Naturae of the Academy of Natural Sciences of Philadelphia 439: 2–6.
Hockey PAR, Dean WRJ and Ryan PG (eds) 2005. Roberts’ birds of southern Africa - VII
edition. The Trustees of the John Voelcker Bird Book Fund, Cape Town.
Hornung JP and Foote AL 2006. Aquatic invertebrate responses to fish presence and
vegetation complexity in western Boreal wetlands, with implications for waterbird
productivity. Wetlands 26: 1–12.
Hurlbert SH 1971. The nonconcept of species diversity: a critique and alternative
parameters. Ecology 52: 577–586.
Huston M 1979. A general hypothesis of species diversity. The American Naturalist 113:
81–101.
Krebbs CJ 1999. Ecological methodology. Second edition. Harper and Row, New York.
Kuijken E 2006. A short history of waterbird conservation. In: Boere GC, Galbraith CA
and Stroud DA (eds) Waterbirds Around the World. The Stationery Office,
Edinburgh, UK. pp. 52–59.
MacArthur RH 1964. Factors effecting bird species diversity. The American Naturalist
98: 387–397.
MacArthur RH and MacArthur JW 1961. On bird species diversity. Ecology 42: 594–598.
Magurran AE 2004. Measuring biological diversity. Blackwell Science, Massachusetts.
Martin AP and Palumbi SR 1993. Body size, metabolic rate, generation time, and the
molecular clock. Proceedings of the Natural Academy of Sciences, USA 90:
4087–4091.
McCann K, Theron L-J and Morrison K 2007.Conservation priorities for the Blue Crane
Anthropoides paradiseus in South Africa – the effects of habitat changes on
distribution and numbers. Ostrich 78: 205–211.
Mostert E 2012. Prioritising bird species of special concern in protected areas. Unpubl.
MSc thesis, University of Cape Town.
Nagy KA 1987. Field metabolic rate and food requirement scaling in mammals and
birds. Ecological Monographs 57: 111–128.
Paracuellos M and Telleria JL 2004.Factors affecting the distribution of a waterbird
community: the role of habitat configuration and bird abundance. Waterbirds 27:
446–453.
Peet RK 1974. The measurement of species diversity. Annual Review of Ecology and
Systematics 5: 285–307.
Peet RK 1975. Relative diversity indices. Ecology 56: 496–498.

67
Pe rez-Arteaga A, Gaston K and Kershaw M 2002. Undesignated sites in Mexico
qualifying as wetlands of international importance. Biological Conservation 107:
47–57.
Pielou EC 1966. Shannon’s formula as a measure of species diversity: its use and misuse.
American Naturalist 100: 463–465.
Ricklefs RE and Miller GL 2000. Ecology. Fourth edition. W. H. Freeman and Company,
New York, USA.
Ricklefs RE, Konarzewski M, Daan S 1996. The relationship between basal metabolic
rate and daily energy expenditure in birds and mammals. The American Naturalist
147: 1047–1071.
Rosa S, Palmeirim JM and Moreira F 2003. Factors affecting waterbird abundance and
species richness in an increasingly urbanized area of the Tagus Estuary in Portugal.
Waterbirds 26: 226–232.
Scott DA 1980. A preliminary inventory of wetlands of international importance for
waterfowl in Western Europe and Northwest Africa. International Waterfowl
Research Bureau, Slimbridge.
Scott DA and Rose PM 1996. Atlas of Anatidae populations in Africa and western
Eurasia. Wetlands International Publication 41. Wetlands International,
Wageningen, The Netherlands.
Shaffer ML 1981. Population sizes for species conservation. BioScience 31: 131–134.
Skov H, Durinck J, Leopold MF and Tasker ML 2007. A quantitative method for
evaluating the importance of marine areas for conservation of birds. Biological
Conservation 136: 362–371.
Spellerberg IF 1981. Ecological evaluation for conservation. Studies in Biology 133.
Edward Arnold, London.
Stattersfield AJ and Capper DR 2004. Threatened birds of the world. Lynx Editions and
BirdLife International, Barcelona, Spain, and Cambridge, United Kingdom.
Stattersfield AJ, Crosby MJ, Long AJ and Wege DC 1998. Endemic bird areas of the
world: priorities for conservation. BirdLife International, Oxford.
Sutherland WJ, Newton I and Green RE (eds) 2004. Bird ecology and conservation: a
handbook of techniques. Techniques in Ecology and Conservation Series. Oxford,
United Kingdom.
Tucker GM and Evans MI 1997. Habitat for birds in Europe. A conservation strategy for
the wider environment. BirdLife Conservation Series 6. BirdLife International,
Oxford.

68
Van der Ploeg SWF and Vlijm L 1978. Ecological evaluation, nature conservation and
land use planning with particular reference to methods used in the Netherlands.
Biological Conservation 14: 197–221.
Velásquez C, Kaletja B and Hockey PAR 1991. Seasonal abundance, habitat selection
and energy consumption of waterbirds at the Berg River estuary, South Africa.
Ostrich 62: 109–123.
Weller MW 1988. Issues and approaches in assessing cumulative impacts on waterbird
habitat in wetlands. Environmental Management 12: 695–701.
Wetlands International 2006. Waterbird Population Estimates – Fourth Edition.
Wetlands International Global Series 12. Wageningen, The Netherlands.
Whittaker RH 1972. Evolution and measurement of species diversity. Taxon 21:
213–251.
Williams AJ and Velásquez C. 1997a. Greater Flamingo Phoenicopterus ruber. In:
Harrison JA, Allan DG, Underhill LG, Herremans M, Tree AJ, Parker V and Brown
CJ (eds) The Atlas of Southern African Birds, vol. 1: Non-passerines. pp 112–113.
BirdLife South Africa, Johannesburg.
Williams AJ and Velasquez C 1997b. Lesser Flamingo Phoeniconaias minor. In:
Harrison JA, Allan DG, Underhill LG, Herremans M, Tree AJ, Parker V and Brown
CJ (eds) The Atlas of Southern African Birds, vol. 1: Non-passerines. pp 114–115.
BirdLife South Africa, Johannesburg.
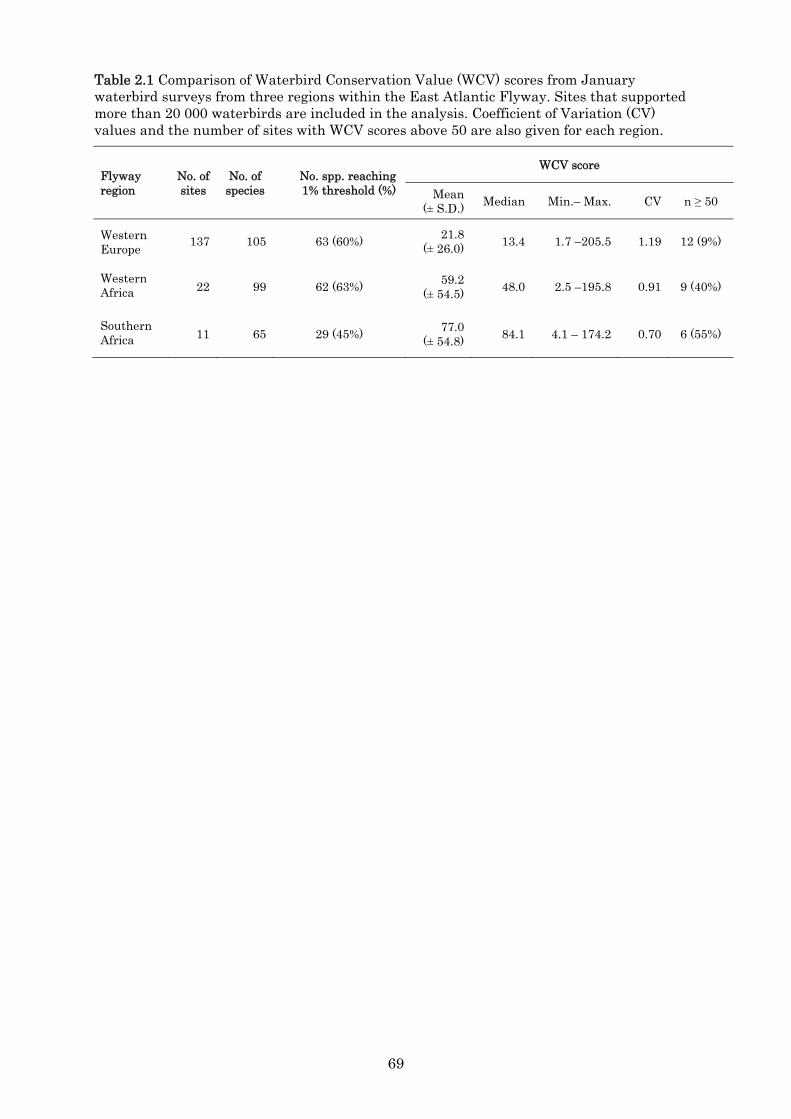
69
Table 2.1 Comparison of Waterbird Conservation Value (WCV) scores from January waterbird surveys from three regions within the East Atlantic Flyway. Sites that supported more than 20 000 waterbirds are included in the analysis. Coefficient of Variation (CV) values and the number of sites with WCV scores above 50 are also given for each region.
Flyway region
No. of sites
No. of species
No. spp. reaching 1% threshold (%)
WCV score
Mean(± S.D.) Median Min.– Max. CV n ≥ 50
Western Europe
137 105 63 (60%) 21.8(± 26.0) 13.4 1.7 –205.5 1.19 12 (9%)
Western Africa 22 99 62 (63%) 59.2
(± 54.5) 48.0 2.5 –195.8 0.91 9 (40%)
Southern Africa 11 65 29 (45%) 77.0
(± 54.8) 84.1 4.1 – 174.2 0.70 6 (55%)

70
Table 2.2 Mean and maximum WCV scores for 117 waterbird species within the three regions of the East Atlantic flyway. Species selected based on at least one site within in each region meeting the 1% threshold. See text for explanation and derivation of the WCV score. WE = western Europe, WA = western Africa and SA = southern Africa.
Species Mean Max.
WE WA SA WE WA SA African Black Oystercatcher - - 0.23 - - 1.61 African Darter - 0.15 - - 1.83 - African Purple Swamphen - 0.76 - - 13.30 - African Pygmy Goose - 0.08 - - 1.23 - African Skimmer - 0.08 - - 1.69 - Audouin's Gull - 0.17 - - 2.85 - Barnacle Goose 0.11 - - 6.20 - - Bar-tailed Godwit 0.55 0.13 - 21.29 1.32 - Bean Goose 0.14 - - 14.50 - - Bewick's Swan 0.15 - - 13.83 - - Black Heron - 0.21 - - 3.15 - Black Stork - 0.39 - - 5.53 - Black Tern - - 0.29 - - 1.48 Black-crowned Crane - 0.16 - - 1.73 - Black-crowned Night-heron 0.02 0.41 - 1.11 7.92 - Black-headed Gull 0.21 - - 2.87 - - Black-necked Grebe - - 1.83 - - 15.10 Black-tailed Godwit 0.35 1.38 0.22 11.79 7.78 2.40 Black-winged Pratincole - - 9.53 - - 104.79 Black-winged Stilt 0.06 0.84 0.38 1.72 6.56 1.71 Cape Cormorant - - 3.35 - - 17.72 Caspian Tern - 2.02 1.93 - 26.06 6.20 Cattle Egret - 0.49 - - 2.76 - Chestnut-banded Sandplover - - 4.04 - - 23.59 Comb Duck - 0.43 - - 2.72 - Common Coot 0.23 - - 1.66 - - Common Crane 0.13 - - 14.73 - - Common Eider 1.78 - - 124.36 - - Common Greenshank - 0.07 - - 1.04 - Common Gull 0.07 - - 1.30 - - Common Pochard 0.33 - - 4.53 - - Common Pratincole - 1.16 - - 17.33 - Common Redshank 0.20 0.11 - 3.20 1.61 - Common Ringed Plover - 0.87 - - 5.03 - Common Scoter 0.04 - - 3.23 - - Common Shelduck 0.44 0.21 - 10.28 2.56 - Common Teal 0.17 - - 2.48 - - Common Tern - - 1.50 - - 14.69 Crested Tern (Swift tern) - - 0.71 - - 3.89 Curlew Sandpiper - 0.25 3.44 - 2.18 15.67 Damara Tern - - 0.31 - - 1.82 Dark-Bellied Brent Goose 0.40 - - 14.11 - - Dunlin 4.89 0.23 - 80.41 3.02 - Eurasian Curlew 0.33 - - 19.90 - - Eurasian Golden Plover 0.12 - - 1.61 - - Eurasian Oystercatcher 0.39 - - 19.56 - - Eurasian Spoonbill 0.12 0.64 - 3.47 4.52 - Eurasian Wigeon 0.18 0.49 - 1.78 6.18 - Fulvous Duck - 5.14 - - 75.07 - Gadwall 0.40 - - 16.89 - - Garganey - 1.59 - - 11.7 - Glossy Ibis 0.02 - - 1.39 - - Goldeneye 0.08 - - 1.56 - - Goosander 0.05 - - 2.86 - - Great Cormorant 0.35 - - 4.01 - - Great Crested Grebe 0.08 - - 1.88 - - Great ringed Plover 0.13 - - 3.00 - - Great White Pelican - 1.42 1.60 - 19.35 7.81 Greater Flamingo 0.50 2.20 12.62 11.84 21.22 78.86 Greater Scaup 0.26 - - 18.06 - - Greater White-fronted Goose 0.04 - - 2.24 - - Grey Plover 0.19 0.26 0.48 4.18 2.15 3.73 Grey-headed Gull - 0.52 - - 8.56 - Greylag Goose 0.27 0.13 - 9.37 1.52 - Gull-billed Tern - 0.21 - - 1.79 -

71
Table 2.2 contd
Species Mean Max.
WE WA SA WE WA SA Hartlaub's Gull - - 0.68 - - 2.27 Herring Gull 0.14 - - 3.32 - - Kelp Gull - - 0.60 - - 2.76 Kentish Plover 0.09 1.16 - 2.31 12.45 - Kittlitz's Plover - - 0.62 - - 3.63 Lesser Black-backed Gull 0.05 0.22 - 1.4 3.61 - Lesser Crested Tern - - 0.10 - - 1.12 Lesser Flamingo - 2.55 23.31 - 45.03 166.67 Light-bellied Brent Goose 1.29 - - 56.06 - - Little Egret 0.10 0.25 - 1.56 1.76 - Little Stint 0.06 1.10 0.45 1.57 6.86 3.47 Little Tern - 0.18 - - 1.69 - Mallard 0.24 - - 1.84 - - Marbled Teal 0.02 - - 1.38 - - Mute Swan 0.08 - - 3.30 - - Northern Lapwing 0.13 - - 2.09 - - Northern Pintail 0.79 0.87 - 11.25 10.17 - Northern Shoveler 2.11 0.23 - 37.65 1.7 - Pied Avocet 0.42 0.88 1.58 9.2 9.04 7.58 Pink-backed Pelican - 0.11 - - 2.14 - Pink-footed Goose 0.21 - - 7.83 - - Purple Heron - 0.17 - - 1.19 - Purple Swamphen 0.12 - - 5.33 - - Red Knot 0.54 0.07 - 12.6 1.23 - Red-breasted Merganser 0.06 - - 2.11 - - Red-crested Pochard 0.33 - - 9.15 - - Red-knobbed Coot - 0.11 - - 1.61 - Reed Cormorant - 0.26 - - 1.85 - Royal Tern - 0.17 - - 2.79 - Ruddy Turnstone 0.10 0.15 0.41 2.39 2.9 1.68 Ruff - 0.99 - - 15.25 - Sanderling 0.09 0.20 2.33 2.18 2.13 14.12 Sandwich Tern - 0.10 0.14 - 1.14 1.08 Senegal Thick-knee - 0.13 - - 2.10 - Slender-billed Gull - 1.54 - - 33.07 - Smew 0.07 - - 3.95 - - Spotted Redshank - 0.17 - - 3.28 - Spur-winged Goose - 0.63 - - 6.50 - Squacco Heron - 16.21 - - 185.19 - Temminck's Stint 0.01 - - 1.62 - - Tufted Duck 0.18 - - 2.68 - - Western Reef Egret - 0.08 - - 1.48 - Western Yellow-legged Gull 0.06 - - 1.81 - - Whiskered Tern - 0.12 0.71 - 1.7 3.69 White Stork - 0.06 - - 1.01 - White-breasted Cormorant - 0.55 1.53 - 6.86 5.49 White-faced Duck - 5.85 - - 65.80 - White-fronted Plover - 0.14 1.21 - 2.35 - White-fronted Plover - - - - - 6.23 White-headed Duck 0.06 - - 4.49 - - Whooper Swan 0.06 - - 1.43 - - Yellow-legged Gull 0.05 - - 1.18 - -
Total 21.30 58.44 76.12 648.86 705.15 520.86

72
Figure 2.1 The extent of the eight major global bird migration flyways. The East-Atlantic flyway is shaded blue with a white border. (Map courtesy of International Wader Study Group)

73
Figure 2.2 Locations of 170 wetland sites within the East Atlantic flyway used in the computation and comparison of WCV scores.

74
Figure 2.3 Locations of 137 wetland sites in western Europe used in the computation and comparison of WCV scores. Refer to Appendix 2.4 for names of the sites.

75
Figure 2.4 Locations of 22 wetland sites in western Africa used in the computation and comparison of WCV scores. Refer to Appendix 2.5 for names of the sites.
Figure 2.5 Locations of 11 wetland sites in southern Africa used in the computation and comparison of WCV scores. Refer to Appendix 2.6 for names of the sites.

76
Figure 2.6 The relationship between the number of species reaching the 1% threshold and the Waterbird Conservation Value (WCV) score for (a) western Europe, (b) western Africa and (c) southern Africa. The dotted line represents the mean WCV score.
y = 1.38x + 66.37R² = 0.0212
0
25
50
75
100
125
150
175
200
225
250
0 5 10 15 20 25
No.of species reaching 1% threshold
(c)
y = 2.9603x + 37.154R² = 0.108
0
50
100
150
200
250
0 5 10 15 20 25 30
WC
V s
core
(b)
x = 21.8
x = 59.2
y = 5.883x + 2.5236R² = 0.5411
0
50
100
150
200
250
0 2 4 6 8 10 12 14 16
(a)

77
Figure 2.7 Comparison of mean and maximum WCV scores for priority species in western Europe, western Africa, and southern Africa. Species with mean WCV scores values ≥ 1 and maximum scores ≥ 20 are shown. Species colours are unique and used throughout the thesis. Values on y-axis given on logarithmic scale (log10).
1
10
100
1000
Mean Max.
WC
V s
core
Western Europe
1
10
100
1000
Mean Max.
WC
V s
core
Western Africa
1
10
100
1000
Mean Max.
WC
V s
core
Southern Africa

78

ES
0001
7
ES
0218
8
GB
0010
1
DE
0011
6
ES
0007
1
FR
0008
8
IT00
036
FR
0010
9
FR
0012
3
FR
0013
9
NL
0019
4
GB
0052
5
CH
0002
1
DE
0026
2
CH
0002
2
DE
0026
3
GB
0067
5
GB
0102
0
IE00
148
FR
0016
7
Audouin's Gull 0.00 0.01 0.00 0.00 0.00 0.00 0.00 0.00 0.00 0.00 0.00 0.00 0.00 0.00 0.00 0.00 0.00 0.00 0.00 0.00Barnacle Goose 0.00 0.00 0.00 0.00 0.00 0.00 0.01 0.01 0.00 0.00 0.00 0.00 0.00 0.00 0.00 0.00 0.00 0.00 0.00 0.00Bar-tailed Godwit 0.00 0.00 3.16 0.00 4.62 0.00 0.01 0.48 0.65 0.10 0.00 0.10 0.00 0.00 0.00 0.00 0.03 0.62 0.22 0.00Bean Goose 0.00 0.00 0.00 14.50 0.00 0.00 0.04 0.00 0.00 0.00 0.00 0.00 0.01 0.01 0.03 0.03 0.00 0.00 0.00 2.32Bewick's Swan 0.00 0.00 0.00 0.00 0.00 0.00 0.00 0.00 0.00 0.00 0.00 0.10 0.00 0.00 0.00 0.00 0.59 0.04 0.02 0.02Black-crowned Night-heron 0.00 0.09 0.00 0.00 1.11 0.00 0.00 0.00 0.00 0.03 0.00 0.00 0.00 0.00 0.00 0.00 0.00 0.00 0.00 0.00Black-headed Gull 0.45 1.25 0.08 0.00 0.06 0.01 0.20 0.00 2.87 0.27 0.05 0.02 0.18 0.39 0.07 0.18 0.29 0.08 0.11 0.11Black-legged Kittiwake 0.00 0.00 0.00 0.00 0.00 0.00 0.00 0.00 0.00 0.00 0.00 0.00 0.00 0.00 0.00 0.00 0.00 0.00 0.01 0.00Black-necked Grebe 0.01 0.01 0.00 0.00 0.00 0.00 0.19 0.00 0.00 0.04 0.00 0.00 0.01 0.03 0.02 0.04 0.00 0.00 0.00 0.00Black-tailed Godwit 0.00 0.04 0.01 0.00 0.26 0.00 0.00 3.15 0.60 0.06 0.00 0.16 0.00 0.00 0.00 0.00 0.42 0.22 0.45 0.00Black-throated Diver 0.00 0.00 0.00 0.00 0.00 0.00 0.00 0.00 0.00 0.00 0.00 0.00 0.00 0.00 0.00 0.00 0.00 0.00 0.00 0.00Black-winged Stilt 0.00 0.02 0.00 0.00 1.03 0.00 0.00 0.00 0.00 0.00 0.00 0.00 0.00 0.00 0.00 0.00 0.00 0.00 0.00 0.00Caspian Gull 0.16 0.12 0.00 0.00 0.00 0.00 0.03 0.00 0.00 0.01 0.00 0.00 0.00 0.00 0.00 0.00 0.00 0.00 0.00 0.00Caspian Tern 0.00 0.00 0.00 0.00 0.00 0.00 0.00 0.00 0.00 0.00 0.00 0.00 0.00 0.00 0.00 0.00 0.00 0.00 0.00 0.00Cattle Egret 0.49 0.68 0.00 0.00 0.01 0.00 0.00 0.00 0.00 0.01 0.00 0.00 0.00 0.00 0.00 0.00 0.00 0.00 0.00 0.00Common Coot 0.03 0.01 0.01 0.00 0.00 0.01 0.33 0.01 0.01 0.34 0.18 0.02 0.44 0.54 0.41 1.02 0.02 0.01 0.00 0.35Common Crane 0.01 0.00 0.00 0.00 0.00 0.02 0.00 0.11 0.00 0.01 0.00 0.00 0.00 0.00 0.00 0.00 0.00 0.00 0.00 0.00Common Eider 0.00 0.00 0.00 0.00 0.00 0.00 0.04 0.02 0.04 0.01 0.00 0.06 0.01 0.02 0.00 0.00 0.00 0.01 0.01 0.01Common Greenshank 0.00 0.01 0.00 0.00 0.02 0.00 0.01 0.00 0.00 0.00 0.00 0.00 0.00 0.00 0.00 0.00 0.00 0.00 0.01 0.00Common Gull 0.00 0.00 0.07 0.00 0.00 0.00 0.03 0.00 0.18 0.00 0.01 0.00 0.02 0.09 0.02 0.03 0.02 0.09 0.02 0.01Common Pochard 0.02 0.27 0.02 0.00 0.00 0.01 0.12 0.01 0.01 0.06 0.26 0.03 0.81 1.40 2.33 1.98 0.00 0.00 0.01 1.66Common Redshank 0.00 0.01 0.24 0.00 0.04 0.00 0.06 0.12 0.01 0.06 0.00 0.46 0.00 0.00 0.00 0.00 0.26 0.48 0.57 0.00Common Sandpiper 0.00 0.00 0.00 0.00 0.00 0.00 0.00 0.00 0.00 0.00 0.00 0.00 0.00 0.00 0.00 0.00 0.00 0.00 0.00 0.00Common Scoter 0.00 0.00 0.01 0.00 0.00 0.00 0.00 0.11 0.26 0.00 0.00 0.00 0.00 0.00 0.00 0.00 0.00 0.00 0.00 0.00Common Shelduck 0.01 0.02 0.05 0.00 0.01 0.00 0.04 3.03 0.60 0.10 0.03 0.75 0.00 0.00 0.00 0.00 0.11 0.65 0.50 0.00Common Snipe 0.02 0.02 0.00 0.00 0.01 0.00 0.00 0.00 0.00 0.01 0.00 0.00 0.00 0.00 0.00 0.00 0.00 0.01 0.00 0.00Common Teal 0.27 0.07 0.02 0.00 0.10 0.00 0.25 0.52 0.02 0.09 0.13 0.12 0.03 0.04 0.04 0.12 0.08 0.10 0.10 0.11Curlew Sandpiper 0.00 0.00 0.00 0.00 0.00 0.00 0.00 0.00 0.00 0.00 0.00 0.00 0.00 0.00 0.00 0.00 0.00 0.00 0.00 0.00Dark-Bellied Brent Goose 0.00 0.00 0.00 0.00 0.00 0.00 0.00 0.60 1.31 14.11 0.00 3.17 0.00 0.00 0.00 0.00 0.02 3.82 0.01 0.00Dunlin 0.03 0.23 1.09 0.00 6.17 0.00 0.58 15.08 19.94 38.29 0.01 9.78 0.00 0.00 0.00 0.00 2.16 12.46 4.52 0.00Eurasian Bittern 0.03 0.00 0.00 0.00 0.00 0.02 0.09 0.00 0.00 0.02 0.06 0.03 0.02 0.00 0.02 0.02 0.00 0.00 0.00 0.02Eurasian Curlew 0.02 0.00 0.09 0.00 0.00 0.00 0.10 0.20 0.61 0.37 0.02 0.23 0.02 0.01 0.01 0.03 0.15 0.23 0.26 0.00Eurasian Golden Plover 0.11 0.02 0.03 0.00 0.09 0.54 0.00 0.09 0.16 0.00 0.02 0.34 0.00 0.00 0.00 0.00 0.88 0.14 0.35 0.00Eurasian Oystercatcher 0.00 0.00 0.15 0.00 0.00 0.00 0.00 0.07 1.01 0.04 0.00 0.07 0.00 0.00 0.00 0.00 0.00 0.11 0.09 0.00Eurasian Spoonbill 0.01 0.03 0.00 0.00 0.15 0.00 0.00 0.01 0.05 0.88 0.00 0.00 0.00 0.00 0.00 0.00 0.00 0.00 0.00 0.00Eurasian Wigeon 0.02 0.05 0.00 0.00 0.02 0.00 0.65 0.33 0.11 0.08 0.00 0.17 0.00 0.00 0.00 0.01 0.40 0.08 0.12 0.06Eurasian Woodcock 0.00 0.00 0.00 0.00 0.00 0.00 0.00 0.00 0.00 0.00 0.00 0.00 0.00 0.00 0.00 0.00 0.00 0.00 0.00 0.00European White-fronted Goose 0.00 0.00 0.00 0.00 0.00 0.00 0.00 0.00 0.00 0.00 0.00 0.00 0.00 0.00 0.00 0.00 0.01 0.00 0.00 0.00Ferruginous Duck 0.05 0.12 0.00 0.00 0.00 0.00 0.11 0.00 0.00 0.03 0.03 0.00 0.03 0.04 0.08 0.09 0.00 0.00 0.00 0.05Gadwall 0.25 0.17 0.01 0.00 0.00 0.02 0.66 0.08 0.01 0.13 0.00 0.08 0.45 0.40 0.68 1.98 0.07 0.04 0.01 5.52Glossy Ibis 0.01 0.01 0.00 0.00 0.95 0.00 0.00 0.00 0.00 0.00 0.00 0.00 0.00 0.00 0.00 0.00 0.00 0.00 0.00 0.00Goldeneye 0.00 0.00 0.01 0.00 0.00 0.00 0.09 0.00 0.00 0.00 0.05 0.06 0.14 0.55 0.38 0.18 0.00 0.01 0.00 0.21Goosander 0.00 0.00 0.00 0.01 0.00 0.00 0.00 0.00 0.00 0.00 0.08 0.00 0.03 0.05 0.02 0.05 0.00 0.01 0.00 0.11Great Black-backed Gull 0.00 0.00 0.02 0.00 0.00 0.00 0.00 0.00 0.03 0.00 0.01 0.01 0.00 0.00 0.00 0.00 0.04 0.00 0.01 0.00Great Cormorant 0.20 2.16 0.25 0.01 0.73 0.04 0.20 0.06 0.03 0.41 0.38 0.13 0.07 0.15 0.08 0.12 0.08 0.03 0.23 1.21Great Crested Grebe 0.01 0.01 0.00 0.05 0.00 0.00 0.06 0.00 0.00 0.01 0.08 0.01 0.12 0.23 0.25 0.13 0.00 0.00 0.04 0.15Great Northern Diver 0.03 0.00 0.02 0.00 0.00 0.00 0.02 0.00 0.00 0.15 0.02 0.04 0.02 0.02 0.00 0.02 0.00 0.05 0.04 0.04Great Ringed Plover 0.00 0.03 0.09 0.00 1.74 0.00 0.00 0.13 0.29 0.34 0.00 0.18 0.00 0.00 0.00 0.00 0.10 0.39 0.04 0.00Great White Egret 0.00 0.02 0.00 0.00 0.00 0.03 0.14 0.00 0.00 0.07 0.02 0.00 0.01 0.01 0.01 0.04 0.00 0.00 0.03 0.07Greater Flamingo 0.02 0.02 0.00 0.00 0.82 0.00 0.01 0.00 0.00 0.00 0.00 0.00 0.00 0.00 0.00 0.00 0.00 0.00 0.00 0.00Greater Scaup 0.00 0.00 0.01 0.00 0.00 0.00 0.03 0.01 0.01 0.00 0.00 0.01 0.00 0.01 0.00 0.00 0.00 0.00 0.00 0.00Greater White-fronted Goose 0.00 0.00 0.00 0.00 0.00 0.00 0.05 0.00 0.00 0.00 0.00 0.00 0.00 0.00 0.00 0.00 0.00 0.00 0.00 0.00Green Sandpiper 0.00 0.00 0.00 0.00 0.01 0.00 0.00 0.00 0.00 0.00 0.00 0.00 0.00 0.00 0.00 0.00 0.00 0.00 0.00 0.00Grey Heron 0.01 0.44 0.00 0.00 0.16 0.01 0.04 0.00 0.01 0.04 0.03 0.01 0.02 0.02 0.01 0.02 0.00 0.01 0.02 0.05Grey Plover 0.00 0.02 0.25 0.00 0.03 0.00 0.01 0.78 1.11 0.31 0.00 0.58 0.00 0.00 0.00 0.00 0.02 0.46 0.02 0.00Greylag Goose 0.01 0.00 0.00 0.00 0.15 0.00 0.07 0.45 0.01 0.02 0.00 0.03 0.00 0.01 0.00 0.00 0.02 0.00 0.00 0.08Herring Gull 0.01 0.00 0.21 0.00 0.00 0.00 0.00 0.00 0.22 0.49 0.00 0.01 0.00 0.00 0.00 0.00 0.04 0.00 0.01 0.00Kentish Plover 0.01 0.04 0.00 0.00 1.35 0.00 0.06 0.01 0.00 0.02 0.00 0.00 0.00 0.00 0.00 0.00 0.00 0.00 0.00 0.00Lesser Black-backed Gull 0.00 0.21 0.06 0.00 1.33 0.00 0.00 0.00 0.00 0.27 0.00 0.01 0.00 0.00 0.00 0.00 0.00 0.00 0.06 0.00Light-bellied Brent Goose 0.00 0.00 0.00 0.00 0.00 0.00 0.00 0.00 0.71 0.02 0.00 0.14 0.00 0.00 0.00 0.00 0.00 0.07 0.22 0.00Little Egret 0.02 1.56 0.00 0.00 1.30 0.00 0.12 0.00 0.04 0.73 0.00 0.01 0.00 0.00 0.00 0.00 0.02 0.02 0.02 0.00Little Grebe 0.01 0.01 0.00 0.00 0.00 0.00 0.08 0.00 0.00 0.02 0.01 0.01 0.02 0.03 0.14 0.05 0.00 0.01 0.01 0.12Little Gull 0.00 0.00 0.00 0.00 0.00 0.00 0.00 0.00 0.03 0.14 0.00 0.00 0.00 0.00 0.00 0.00 0.00 0.00 0.00 0.00Little Ringed Plover 0.00 0.00 0.00 0.00 0.05 0.00 0.00 0.00 0.00 0.00 0.00 0.00 0.00 0.00 0.00 0.00 0.00 0.00 0.00 0.00Little Stint 0.01 0.02 0.00 0.00 0.80 0.00 0.00 0.00 0.01 0.01 0.00 0.00 0.00 0.00 0.00 0.00 0.00 0.00 0.00 0.00Long-tailed Duck 0.00 0.00 0.00 0.00 0.00 0.00 0.00 0.00 0.00 0.00 0.00 0.00 0.00 0.00 0.00 0.00 0.00 0.00 0.00 0.00Mallard 0.44 0.35 0.02 0.06 0.03 0.02 0.29 0.36 0.14 0.02 0.35 0.03 0.12 0.32 0.08 0.16 0.01 0.02 0.02 1.05Marbled Teal 0.00 0.00 0.00 0.00 0.00 0.00 0.00 0.00 0.00 0.00 0.00 0.00 0.00 0.00 0.00 0.00 0.00 0.00 0.00 0.00Mediterranean Gull 0.00 0.00 0.00 0.00 0.00 0.00 0.03 0.00 0.00 0.00 0.00 0.00 0.00 0.00 0.00 0.00 0.01 0.00 0.00 0.00Moorhen 0.10 0.01 0.00 0.00 0.00 0.00 0.01 0.00 0.00 0.01 0.01 0.00 0.00 0.00 0.00 0.00 0.00 0.00 0.00 0.00Mute Swan 0.00 0.00 0.00 0.00 0.00 0.00 0.08 0.01 0.00 0.21 0.00 0.03 0.04 0.15 0.11 0.22 0.04 0.03 0.01 0.45Northern Lapwing 0.33 0.06 0.02 0.00 0.15 2.09 0.01 0.13 0.16 0.01 0.05 0.20 0.00 0.00 0.00 0.00 0.63 0.10 0.25 0.00Northern Pintail 0.06 0.84 0.01 0.00 3.60 0.00 0.25 7.07 0.13 1.68 0.38 0.26 0.04 0.01 0.05 0.34 0.25 0.19 0.06 0.05Northern Shoveler 1.77 23.01 0.01 0.00 9.99 0.05 0.53 3.39 0.14 0.59 0.49 0.10 0.10 0.11 0.02 0.58 0.46 0.02 0.17 0.13Pied Avocet 0.01 0.06 0.00 0.00 1.87 0.00 0.00 6.68 0.07 0.15 0.00 0.15 0.00 0.00 0.00 0.00 0.12 0.01 0.00 0.00Pink-footed Goose 0.00 0.00 0.19 0.00 0.00 0.00 0.00 0.00 0.00 0.00 0.00 0.00 0.00 0.00 0.00 0.00 2.44 0.00 0.00 0.00Purple Sandpiper 0.00 0.00 0.00 0.00 0.00 0.00 0.00 0.00 0.00 0.01 0.00 0.00 0.00 0.00 0.00 0.00 0.00 0.00 0.00 0.00Purple Swamphen 0.23 0.08 0.00 0.00 4.29 0.00 0.00 0.00 0.00 0.00 0.00 0.00 0.00 0.00 0.00 0.00 0.00 0.00 0.00 0.00Red Knot 0.00 0.00 2.30 0.00 0.00 0.00 0.00 1.16 1.18 0.01 0.00 0.28 0.00 0.00 0.00 0.00 0.08 0.16 0.02 0.00Red-breasted Merganser 0.00 0.00 0.00 0.00 0.00 0.00 0.09 0.00 0.01 0.02 0.00 0.02 0.00 0.00 0.00 0.00 0.00 0.05 0.05 0.00Red-crested Pochard 0.00 9.15 0.00 0.00 0.00 0.00 0.00 0.00 0.00 0.00 0.00 0.00 0.38 0.11 0.05 4.51 0.00 0.00 0.00 0.03Red-necked Grebe 0.00 0.00 0.00 0.00 0.00 0.00 0.01 0.00 0.00 0.00 0.00 0.00 0.01 0.01 0.00 0.00 0.00 0.00 0.00 0.00Red-throated Diver 0.00 0.00 0.00 0.00 0.00 0.00 0.00 0.00 0.00 0.00 0.00 0.00 0.00 0.00 0.00 0.00 0.00 0.00 0.00 0.00Ruddy Turnstone 0.00 0.00 0.11 0.00 0.00 0.00 0.01 0.12 0.05 0.38 0.00 0.28 0.00 0.00 0.00 0.00 0.01 0.11 0.08 0.00Ruff 0.00 0.00 0.00 0.00 0.01 0.00 0.00 0.00 0.01 0.00 0.00 0.00 0.00 0.00 0.00 0.00 0.00 0.00 0.00 0.00Sanderling 0.00 0.06 0.40 0.00 0.01 0.00 0.01 0.17 0.23 0.07 0.00 0.02 0.00 0.00 0.00 0.00 0.02 0.07 0.00 0.00Shag 0.00 0.00 0.00 0.00 0.00 0.00 0.00 0.00 0.01 0.00 0.00 0.00 0.00 0.00 0.00 0.00 0.00 0.00 0.00 0.00Slavonian Grebe 0.00 0.00 0.03 0.00 0.00 0.00 0.07 0.06 0.03 0.12 0.00 0.26 0.04 0.05 0.03 0.04 0.00 0.11 0.06 0.04Slender-billed Gull 0.00 0.00 0.00 0.00 0.00 0.00 0.00 0.00 0.00 0.00 0.00 0.00 0.00 0.00 0.00 0.00 0.00 0.00 0.00 0.00Smew 0.00 0.00 0.00 0.00 0.00 0.01 0.01 0.01 0.01 0.01 0.14 0.01 0.01 0.02 0.01 0.03 0.01 0.01 0.00 0.06Spotted Redshank 0.01 0.05 0.00 0.00 0.28 0.00 0.01 0.01 0.00 0.03 0.00 0.00 0.00 0.00 0.00 0.00 0.00 0.00 0.00 0.00Stone Curlew 0.09 0.00 0.00 0.00 0.02 0.00 0.00 0.00 0.00 0.00 0.00 0.00 0.00 0.00 0.00 0.00 0.00 0.00 0.00 0.00Taiga Bean Goose 0.00 0.00 0.00 0.00 0.00 0.00 0.00 0.00 0.00 0.00 0.00 0.00 0.00 0.00 0.00 0.00 0.07 0.00 0.00 0.00Temminck's Stint 0.00 0.00 0.00 0.00 0.00 0.00 0.00 0.00 0.00 0.00 0.00 0.00 0.00 0.00 0.00 0.00 0.00 0.00 0.00 0.00Tufted Duck 0.00 0.00 0.00 0.00 0.00 0.00 0.00 0.00 0.00 0.01 0.47 0.01 0.35 1.08 1.26 0.90 0.00 0.00 0.00 1.36Tundra Bean Goose 0.00 0.00 0.00 0.00 0.00 0.00 0.01 0.00 0.00 0.00 0.00 0.00 0.00 0.00 0.00 0.00 0.00 0.00 0.00 0.28Velvet Scoter 0.00 0.00 0.00 0.00 0.00 0.00 0.00 0.00 0.00 0.00 0.00 0.00 0.00 0.00 0.00 0.00 0.00 0.00 0.00 0.00Water Rail 0.03 0.00 0.00 0.00 0.00 0.00 0.00 0.00 0.00 0.01 0.00 0.00 0.00 0.00 0.00 0.00 0.00 0.00 0.00 0.00Western Yellow-legged Gull 0.53 0.25 0.00 0.00 0.00 0.00 0.07 0.00 0.00 0.00 0.00 0.00 0.01 0.03 0.00 0.01 0.00 0.00 0.00 0.00Whimbrel 0.00 0.00 0.00 0.00 0.00 0.00 0.00 0.00 0.00 0.00 0.00 0.00 0.00 0.00 0.00 0.00 0.00 0.00 0.00 0.00Whiskered Tern 0.00 0.01 0.00 0.00 0.00 0.00 0.00 0.00 0.00 0.01 0.00 0.00 0.00 0.00 0.00 0.00 0.00 0.00 0.00 0.00White Stork 0.05 0.00 0.00 0.00 0.74 0.00 0.00 0.00 0.00 0.09 0.00 0.00 0.00 0.00 0.00 0.00 0.00 0.00 0.00 0.01White-headed Duck 0.00 0.00 0.00 0.00 0.00 0.00 0.00 0.00 0.00 0.00 0.00 0.00 0.00 0.00 0.00 0.00 0.00 0.00 0.00 0.00Whooper Swan 0.00 0.00 0.00 0.00 0.00 0.00 0.00 0.00 0.00 0.00 0.00 0.01 0.07 0.11 0.03 0.13 0.01 0.00 0.02 0.02Yellow-legged Gull 0.00 0.00 0.00 0.00 0.00 0.00 0.72 0.00 0.00 0.00 0.00 0.00 0.00 0.00 0.00 0.00 0.00 0.00 0.00 0.00No. species at 1% level 1.00 5.00 3.00 1.00 12.00 1.00 0.00 7.00 6.00 3.00 0.00 2.00 0.00 2.00 2.00 4.00 2.00 2.00 1.00 6.00Total WCV score 6.02 41.73 9.08 14.64 44.10 2.90 6.78 44.64 33.18 61.63 3.39 18.57 3.65 6.06 6.27 13.07 10.00 21.16 8.86 15.79
Appendix 2.1 Matrix of mean Waterbird Conservation Value (WCV) scores for 137 sites and 105 waterbird species in western Europe during January. Data on which the scores are based were sourced from International Waterbird Census database, Wetlands International (T. Langedoen in litt.).
Wetlands International Site Code
Species
79

Appendix 2.1 contd
DE
0043
1
DK
0004
7
ES
0064
2
GB
0136
4
ES
0065
2
IT00
137
DE
0039
0
IE00
192
IE00
195
ES
0115
4
PT
0006
3
FR
0021
2
FR
0025
8
GB
0181
7
NL
0014
1
NL
0015
4
NL
0015
5
FR
0026
6
ES
0145
3
DE
0078
5
Audouin's Gull 0.00 0.00 0.00 0.10 0.00 0.00 0.00 0.00 0.00 0.00 0.00 0.00 0.00 0.00 0.00 0.00 0.00 0.00 0.00 0.00Barnacle Goose 1.26 0.00 0.00 0.00 0.00 0.00 0.00 0.00 0.00 0.00 0.00 0.00 0.00 0.00 0.00 0.00 0.00 0.00 0.00 0.00Bar-tailed Godwit 1.26 0.00 1.53 0.12 0.00 0.00 1.01 0.00 1.26 0.00 0.64 0.00 0.00 0.73 0.00 0.00 0.00 0.03 0.00 0.00Bean Goose 0.01 0.00 0.00 0.00 0.04 0.00 0.00 0.01 0.00 0.00 0.00 0.00 0.00 0.00 0.00 0.00 0.00 0.00 0.00 0.83Bewick's Swan 0.43 0.00 0.20 0.00 0.00 0.00 0.00 0.00 0.00 0.00 0.00 0.00 0.00 0.00 0.00 0.00 0.00 0.00 0.00 0.00Black-crowned Night-heron 0.00 0.00 0.00 0.43 0.37 0.00 0.00 0.00 0.00 0.00 0.02 0.00 0.02 0.00 0.00 0.00 0.00 0.00 0.00 0.00Black-headed Gull 0.07 0.01 0.09 0.00 0.63 0.00 0.15 0.01 0.12 0.02 0.02 0.05 1.60 0.15 0.42 1.07 0.30 0.41 2.39 0.00Black-legged Kittiwake 0.00 0.00 0.00 0.00 0.00 0.00 0.00 0.00 0.00 0.00 0.00 0.00 0.00 0.00 0.00 0.00 0.00 0.00 0.00 0.00Black-necked Grebe 0.00 0.00 0.00 0.10 0.70 0.00 0.00 0.00 0.00 0.01 0.00 0.00 0.20 0.00 0.00 0.00 0.00 0.41 0.00 0.00Black-tailed Godwit 0.00 4.62 0.74 2.25 0.01 0.00 0.21 0.00 0.61 0.00 11.79 0.00 0.00 0.03 0.00 0.00 0.00 0.41 0.00 0.00Black-throated Diver 0.00 0.00 0.00 0.00 0.00 0.00 0.00 0.00 0.00 0.00 0.00 0.00 0.00 0.00 0.00 0.00 0.00 0.00 0.00 0.00Black-winged Stilt 0.00 0.84 0.00 0.01 0.00 0.00 0.00 0.00 0.00 0.00 0.10 0.00 0.03 0.00 0.00 0.00 0.00 0.00 0.02 0.00Caspian Gull 0.00 0.00 0.00 0.00 0.43 0.00 0.00 0.00 0.00 0.00 0.00 0.00 0.43 0.00 0.00 0.00 0.00 0.00 0.00 0.00Caspian Tern 0.00 0.00 0.00 0.03 0.00 0.00 0.00 0.00 0.00 0.00 0.00 0.00 0.00 0.00 0.00 0.00 0.00 0.00 0.00 0.00Cattle Egret 0.00 0.01 0.00 0.97 0.01 0.00 0.00 0.00 0.00 0.02 0.01 0.02 0.07 0.00 0.00 0.00 0.00 0.01 0.37 0.00Common Coot 0.00 0.08 0.01 0.93 0.68 0.20 0.00 0.00 0.00 0.02 0.01 0.14 0.22 0.00 0.41 0.38 0.42 0.27 0.00 0.04Common Crane 0.00 0.00 0.00 0.01 0.00 0.00 0.00 0.00 0.00 0.00 0.00 0.71 0.00 0.00 0.00 0.00 0.00 0.00 0.00 0.00Common Eider 39.25 0.00 0.00 0.01 0.00 0.00 0.00 0.00 0.00 0.00 0.26 0.00 0.00 4.89 0.00 0.00 0.00 0.00 0.00 0.00Common Greenshank 0.00 0.00 0.00 0.03 0.00 0.00 0.00 0.00 0.00 0.00 0.01 0.00 0.00 0.00 0.00 0.00 0.00 0.00 0.00 0.00Common Gull 0.68 0.00 0.04 0.00 0.01 0.00 0.01 0.00 0.02 0.00 0.00 0.00 0.00 0.03 0.06 0.20 0.09 0.07 0.00 0.00Common Pochard 0.01 0.13 0.01 0.39 0.30 0.50 0.00 0.13 0.00 0.09 0.01 0.70 0.20 0.12 0.43 0.42 0.26 0.26 0.33 0.00Common Redshank 0.21 0.03 1.41 0.35 0.02 0.00 0.44 0.00 0.36 0.01 0.61 0.01 0.01 1.13 0.00 0.00 0.00 0.11 0.00 0.00Common Sandpiper 0.00 0.00 0.00 0.00 0.00 0.00 0.00 0.00 0.00 0.00 0.00 0.00 0.00 0.00 0.00 0.00 0.00 0.00 0.00 0.00Common Scoter 1.05 0.00 0.00 0.00 0.00 0.00 0.00 0.00 0.02 0.00 0.00 0.00 0.00 0.04 0.00 0.00 0.00 0.01 0.00 0.00Common Shelduck 4.18 0.01 0.63 0.21 0.27 0.00 0.36 0.00 0.15 0.01 0.01 0.00 0.26 0.39 0.01 0.00 0.00 0.61 0.00 0.00Common Snipe 0.00 0.01 0.00 0.06 0.00 0.00 0.00 0.00 0.00 0.00 0.00 0.00 0.00 0.00 0.00 0.00 0.00 0.01 0.00 0.00Common Teal 0.02 1.39 0.20 0.70 0.18 0.01 0.07 0.02 0.05 1.25 0.45 0.12 0.07 0.09 0.04 0.02 0.01 0.19 0.01 0.00Curlew Sandpiper 0.00 0.00 0.00 0.00 0.00 0.00 0.00 0.00 0.00 0.00 0.01 0.00 0.00 0.00 0.00 0.00 0.00 0.00 0.00 0.00Dark-Bellied Brent Goose 0.30 0.00 0.00 0.00 0.00 0.00 0.72 0.00 0.16 0.00 0.00 0.00 0.00 0.00 0.00 0.00 0.00 3.33 0.00 0.00Dunlin 14.22 1.12 15.01 14.38 4.76 0.00 3.31 0.00 4.44 0.00 10.33 0.08 0.35 5.17 0.00 0.00 0.00 18.10 0.00 0.00Eurasian Bittern 0.00 0.00 0.00 0.07 0.05 0.00 0.00 0.00 0.00 0.00 0.00 0.03 0.00 0.00 0.02 0.04 0.02 0.00 0.00 0.00Eurasian Curlew 0.47 0.00 0.46 0.05 0.06 0.00 0.16 0.00 0.17 0.00 0.09 0.01 0.00 0.36 0.13 0.02 0.11 0.08 0.00 0.00Eurasian Golden Plover 0.27 0.00 0.02 0.21 0.01 0.00 0.07 0.00 0.51 0.00 0.04 0.05 0.02 0.10 0.00 0.00 0.00 0.01 0.00 0.00Eurasian Oystercatcher 2.26 0.00 1.86 0.00 0.00 0.00 0.22 0.00 0.59 0.00 0.01 0.00 0.00 0.55 0.00 0.00 0.00 0.01 0.00 0.00Eurasian Spoonbill 0.00 2.29 0.00 0.17 0.06 0.00 0.00 0.00 0.00 0.00 1.05 0.01 0.00 0.00 0.00 0.00 0.00 0.17 0.00 0.00Eurasian Wigeon 0.26 0.61 0.08 0.22 1.71 0.00 0.02 0.15 0.03 0.08 0.18 0.02 0.01 0.08 0.00 0.00 0.00 0.45 0.00 0.06Eurasian Woodcock 0.00 0.00 0.00 0.00 0.00 0.00 0.00 0.00 0.00 0.00 0.00 0.00 0.00 0.00 0.00 0.00 0.00 0.00 0.00 0.00European White-fronted Goose 0.00 0.00 0.00 0.00 0.00 0.00 0.00 0.00 0.00 0.00 0.00 0.00 0.00 0.00 0.00 0.00 0.00 0.00 0.00 0.00Ferruginous Duck 0.00 0.00 0.00 0.08 0.05 0.03 0.00 0.00 0.00 0.00 0.00 0.06 0.03 0.00 0.00 0.03 0.00 0.03 0.05 0.00Gadwall 0.00 1.60 0.03 3.58 0.57 0.10 0.00 0.00 0.00 2.03 0.04 0.36 0.05 0.00 0.00 0.00 0.00 0.06 0.05 0.00Glossy Ibis 0.00 1.39 0.00 0.10 0.00 0.00 0.00 0.00 0.00 0.00 0.17 0.00 0.00 0.00 0.00 0.00 0.00 0.00 0.00 0.00Goldeneye 0.06 0.00 0.00 0.00 0.00 0.15 0.00 0.00 0.01 0.00 0.00 0.00 0.00 0.43 0.00 0.01 0.00 0.13 0.00 0.12Goosander 0.05 0.00 0.00 0.00 0.00 0.10 0.00 0.12 0.00 0.00 0.00 0.02 0.00 0.01 0.04 0.03 0.01 0.00 0.00 0.16Great Black-backed Gull 0.14 0.00 0.02 0.00 0.00 0.00 0.01 0.00 0.02 0.00 0.00 0.00 0.00 0.02 0.00 0.00 0.00 0.01 0.00 0.00Great Cormorant 0.01 0.00 0.72 2.10 2.73 0.79 0.02 0.13 0.05 0.03 0.32 0.54 0.83 0.27 0.22 0.29 0.14 0.26 0.23 0.01Great Crested Grebe 0.00 0.00 0.00 0.09 0.23 0.01 0.01 0.00 0.01 0.01 0.00 0.08 0.12 0.04 0.03 0.04 0.04 0.10 0.00 0.03Great Northern Diver 0.00 0.00 0.00 0.05 0.02 0.00 0.05 0.00 0.18 0.00 0.00 0.00 0.04 0.03 0.00 0.00 0.00 0.06 0.00 0.00Great Ringed Plover 0.01 0.00 0.18 0.41 0.02 0.00 0.24 0.00 0.16 0.00 0.55 0.00 0.02 0.20 0.00 0.00 0.00 0.67 0.00 0.00Great White Egret 0.00 0.00 0.00 0.14 0.97 0.00 0.00 0.00 0.01 0.00 0.00 0.30 0.09 0.00 0.00 0.00 0.00 0.00 0.00 0.00Greater Flamingo 0.00 0.28 0.00 4.67 0.48 0.00 0.00 0.00 0.00 0.00 1.32 0.00 8.40 0.00 0.00 0.00 0.00 0.00 0.00 0.00Greater Scaup 0.06 0.00 0.00 0.00 0.00 0.00 0.00 0.00 0.01 0.00 0.00 0.00 0.00 1.36 0.00 0.00 0.00 0.00 0.00 4.84Greater White-fronted Goose 0.00 0.00 0.00 0.00 0.00 0.00 0.00 0.00 0.00 0.00 0.00 0.00 0.00 0.00 0.00 0.00 0.00 0.00 0.00 0.02Green Sandpiper 0.00 0.00 0.00 0.00 0.00 0.00 0.00 0.00 0.00 0.00 0.00 0.00 0.00 0.00 0.00 0.00 0.00 0.00 0.00 0.00Grey Heron 0.00 0.02 0.01 0.73 0.23 0.00 0.00 0.00 0.01 0.00 0.13 0.11 0.10 0.01 0.02 0.03 0.01 0.02 0.00 0.01Grey Plover 0.08 0.00 0.32 0.38 0.22 0.00 0.14 0.00 0.03 0.00 1.28 0.00 0.03 0.08 0.00 0.00 0.00 0.57 0.00 0.00Greylag Goose 0.44 1.78 0.01 0.11 0.01 0.12 0.00 0.01 0.05 0.16 0.50 0.02 0.00 0.06 0.00 0.00 0.00 0.00 0.00 0.02Herring Gull 2.81 0.00 0.07 0.00 0.00 0.00 0.02 0.01 0.03 0.00 0.00 0.00 0.00 0.17 0.02 0.05 0.02 0.35 0.00 0.00Kentish Plover 0.00 0.00 0.00 0.62 0.11 0.00 0.00 0.00 0.00 0.00 0.53 0.00 0.03 0.00 0.00 0.00 0.00 0.00 0.00 0.00Lesser Black-backed Gull 0.00 0.07 0.02 0.00 0.00 0.00 0.00 0.00 0.00 0.17 0.02 0.00 0.01 0.00 0.00 0.00 0.00 0.04 0.45 0.00Light-bellied Brent Goose 0.00 0.00 1.08 0.00 0.00 0.00 21.66 0.00 21.79 0.00 0.00 0.00 0.00 0.05 0.00 0.00 0.00 0.00 0.00 0.00Little Egret 0.00 0.22 0.02 1.45 0.42 0.00 0.00 0.00 0.00 0.00 0.19 0.01 0.43 0.00 0.00 0.00 0.00 0.12 0.00 0.00Little Grebe 0.00 0.00 0.00 0.08 0.20 0.09 0.00 0.00 0.00 0.00 0.01 0.00 0.02 0.00 0.00 0.01 0.00 0.04 0.00 0.00Little Gull 0.00 0.00 0.00 0.00 0.02 0.00 0.00 0.00 0.00 0.00 0.00 0.00 0.00 0.00 0.00 0.00 0.00 0.00 0.00 0.00Little Ringed Plover 0.00 0.00 0.00 0.00 0.00 0.00 0.00 0.00 0.00 0.00 0.01 0.00 0.00 0.00 0.00 0.00 0.00 0.00 0.00 0.00Little Stint 0.00 0.08 0.00 1.29 0.02 0.00 0.00 0.00 0.00 0.00 0.09 0.00 0.06 0.00 0.00 0.00 0.00 0.00 0.00 0.00Long-tailed Duck 0.01 0.00 0.00 0.00 0.00 0.00 0.00 0.00 0.00 0.00 0.00 0.00 0.00 0.01 0.00 0.00 0.00 0.00 0.00 0.02Mallard 0.46 0.04 0.08 1.84 0.62 0.46 0.00 1.12 0.02 0.43 0.11 0.25 0.02 0.09 0.25 0.31 0.13 0.13 0.04 0.04Marbled Teal 0.00 1.13 0.00 0.00 0.00 0.00 0.00 0.00 0.00 0.00 0.00 0.00 0.00 0.00 0.00 0.00 0.00 0.00 0.00 0.00Mediterranean Gull 0.00 0.00 0.00 0.00 0.00 0.00 0.00 0.00 0.00 0.00 0.00 0.00 0.03 0.00 0.00 0.00 0.00 0.01 0.00 0.00Moorhen 0.00 0.00 0.00 0.00 0.01 0.00 0.00 0.00 0.00 0.00 0.00 0.00 0.00 0.00 0.00 0.01 0.01 0.00 0.00 0.00Mute Swan 0.01 0.00 0.02 0.00 0.01 0.17 0.00 0.00 0.02 0.00 0.00 0.05 0.02 0.03 0.00 0.00 0.00 0.01 0.00 0.46Northern Lapwing 0.02 0.02 0.23 0.40 0.06 0.00 0.00 0.00 0.18 0.02 0.03 0.80 0.02 0.09 0.10 0.06 0.04 0.13 0.00 0.00Northern Pintail 2.33 1.60 3.83 3.42 0.63 0.00 0.28 0.01 0.21 5.20 0.97 0.03 0.16 0.13 0.09 0.01 0.04 2.14 0.03 0.00Northern Shoveler 0.01 13.71 0.09 27.54 6.48 0.00 0.30 0.01 0.01 34.55 4.86 0.87 1.22 0.01 0.11 0.01 0.05 0.96 0.77 0.00Pied Avocet 0.00 0.44 0.00 1.24 1.24 0.00 0.00 0.00 0.00 0.22 9.20 0.00 0.95 0.00 0.00 0.00 0.00 0.90 0.00 0.00Pink-footed Goose 0.34 0.00 0.02 0.00 0.01 0.00 0.00 0.00 0.00 0.00 0.00 0.00 0.00 0.62 0.00 0.00 0.00 0.00 0.00 0.00Purple Sandpiper 0.00 0.00 0.04 0.00 0.00 0.00 0.00 0.00 0.00 0.00 0.00 0.00 0.00 0.07 0.00 0.00 0.00 0.00 0.00 0.00Purple Swamphen 0.00 1.33 0.00 0.02 0.00 0.00 0.00 0.00 0.00 0.00 0.00 0.00 0.00 0.00 0.00 0.00 0.00 0.00 0.02 0.00Red Knot 1.90 0.00 3.37 0.00 0.02 0.00 0.56 0.00 1.23 0.00 0.14 0.00 0.00 1.32 0.00 0.00 0.00 0.07 0.00 0.00Red-breasted Merganser 0.04 0.00 0.01 0.04 0.05 0.00 0.01 0.00 0.03 0.00 0.01 0.00 0.02 0.20 0.00 0.00 0.00 0.64 0.00 0.06Red-crested Pochard 0.00 0.00 0.00 7.36 0.00 0.00 0.00 0.00 0.00 0.00 0.03 0.01 0.01 0.00 0.00 0.00 0.00 0.00 0.03 0.00Red-necked Grebe 0.00 0.00 0.00 0.00 0.00 0.00 0.00 0.00 0.00 0.00 0.00 0.00 0.00 0.01 0.00 0.00 0.00 0.00 0.00 0.00Red-throated Diver 0.00 0.00 0.00 0.00 0.00 0.00 0.00 0.00 0.00 0.00 0.00 0.00 0.00 0.00 0.00 0.00 0.00 0.00 0.00 0.00Ruddy Turnstone 0.01 0.00 0.38 0.06 0.02 0.00 0.16 0.00 0.04 0.00 0.07 0.00 0.00 0.41 0.00 0.00 0.00 0.04 0.00 0.00Ruff 0.00 0.00 0.00 0.02 0.00 0.00 0.00 0.00 0.00 0.00 0.00 0.00 0.00 0.00 0.00 0.00 0.00 0.00 0.00 0.00Sanderling 0.26 0.00 0.23 0.36 0.04 0.00 0.15 0.00 0.00 0.00 0.05 0.00 0.01 0.10 0.00 0.00 0.00 0.00 0.00 0.00Shag 0.00 0.00 0.00 0.00 0.00 0.00 0.00 0.00 0.00 0.00 0.00 0.00 0.00 0.20 0.00 0.00 0.00 0.00 0.00 0.00Slavonian Grebe 0.00 0.00 0.00 0.06 0.00 0.03 0.00 0.00 0.00 0.00 0.00 0.00 0.04 0.79 0.00 0.00 0.00 0.47 0.00 0.00Slender-billed Gull 0.00 0.00 0.00 0.10 0.00 0.00 0.00 0.00 0.00 0.00 0.00 0.00 0.00 0.00 0.00 0.00 0.00 0.00 0.00 0.00Smew 0.01 0.00 0.00 0.00 0.01 0.04 0.00 0.08 0.00 0.00 0.00 0.02 0.01 0.00 0.29 0.04 0.03 0.01 0.00 0.45Spotted Redshank 0.00 0.00 0.00 0.21 0.09 0.00 0.00 0.00 0.00 0.00 0.01 0.03 0.00 0.00 0.00 0.00 0.00 0.03 0.00 0.00Stone Curlew 0.00 0.00 0.00 0.05 0.00 0.00 0.00 0.00 0.00 0.00 0.00 0.00 0.00 0.00 0.00 0.00 0.00 0.00 0.00 0.00Taiga Bean Goose 0.00 0.00 0.00 0.00 0.00 0.00 0.00 0.00 0.00 0.00 0.00 0.00 0.00 0.00 0.00 0.00 0.00 0.00 0.00 0.00Temminck's Stint 0.00 0.00 0.00 0.02 0.00 0.00 0.00 0.00 0.00 0.00 0.00 0.00 0.00 0.00 0.00 0.00 0.00 0.00 0.00 0.00Tufted Duck 0.00 0.00 0.00 0.01 0.02 0.45 0.00 0.00 0.00 0.00 0.02 0.02 0.03 0.03 0.08 0.14 0.15 0.01 0.01 0.04Tundra Bean Goose 0.00 0.00 0.00 0.00 0.00 0.00 0.00 0.00 0.00 0.00 0.00 0.00 0.00 0.00 0.00 0.00 0.00 0.00 0.00 0.00Velvet Scoter 0.02 0.00 0.00 0.00 0.00 0.00 0.00 0.00 0.00 0.00 0.00 0.00 0.00 0.02 0.00 0.00 0.00 0.00 0.00 0.00Water Rail 0.00 0.00 0.00 0.00 0.00 0.00 0.00 0.00 0.00 0.00 0.00 0.00 0.00 0.00 0.00 0.00 0.00 0.00 0.00 0.00Western Yellow-legged Gull 0.00 0.00 0.00 0.00 1.16 0.00 0.00 0.00 0.00 0.00 0.00 0.00 0.00 0.00 0.00 0.00 0.00 0.00 0.00 0.00Whimbrel 0.00 0.00 0.00 0.00 0.00 0.00 0.00 0.00 0.00 0.00 0.06 0.00 0.00 0.00 0.00 0.00 0.00 0.00 0.00 0.00Whiskered Tern 0.00 0.00 0.00 0.46 0.00 0.00 0.00 0.00 0.00 0.00 0.00 0.00 0.37 0.00 0.00 0.00 0.00 0.00 0.00 0.00White Stork 0.00 0.21 0.00 0.00 0.00 0.00 0.00 0.00 0.00 0.00 0.03 0.00 0.08 0.00 0.00 0.00 0.00 0.00 0.00 0.00White-headed Duck 0.00 0.00 0.00 0.00 0.00 0.00 0.00 0.00 0.00 0.00 0.00 0.00 0.00 0.00 0.00 0.00 0.00 0.00 0.00 0.00Whooper Swan 0.14 0.00 0.03 0.01 0.00 0.00 0.00 0.01 0.05 0.00 0.00 0.00 0.00 0.05 0.00 0.00 0.00 0.00 0.00 0.19Yellow-legged Gull 0.00 0.00 0.00 0.00 0.66 0.00 0.00 0.00 0.00 0.00 0.00 0.00 0.00 0.00 0.00 0.00 0.00 0.00 0.00 0.00No. spp at 1% 10.00 11.00 7.00 12.00 6.00 0.00 3.00 1.00 4.00 4.00 7.00 0.00 3.00 5.00 0.00 1.00 0.00 3.00 1.00 1.00WCV score 75.44 35.07 33.13 80.96 27.72 3.29 30.40 1.83 32.63 44.35 46.43 5.54 16.77 20.82 2.79 3.22 1.89 32.96 4.81 7.40
Wetlands International Site Code
Species
80

Appendix 2.1 contd
NL
0013
6
GB
0208
6
GB
0208
7
NL
0016
8
GB
0232
9
NL
0015
6
NL
0014
2
GB
0236
9
NL
0020
2
FR
0028
5
ES
0155
4
FR
0029
9
CH
0007
4
FR
0031
4
CH
0007
9
FR
0031
9
IT00
304
IT00
365
ES
0161
4
IT00
445
Audouin's Gull 0.00 0.00 0.00 0.00 0.00 0.00 0.00 0.00 0.00 0.00 0.00 0.00 0.00 0.00 0.00 0.00 0.00 0.00 0.00 0.00Barnacle Goose 0.00 0.00 0.00 0.00 0.00 0.00 0.00 0.00 0.00 0.00 0.00 0.00 0.00 0.00 0.00 0.00 0.00 0.00 0.00 0.00Bar-tailed Godwit 0.04 0.36 0.28 0.01 0.91 0.00 0.00 1.13 0.00 0.00 0.00 0.00 0.00 0.00 0.00 0.00 0.00 0.00 0.00 0.00Bean Goose 0.00 0.00 0.00 0.00 0.00 0.00 0.00 0.00 0.00 0.00 0.00 0.00 0.07 0.51 0.01 0.00 0.00 0.00 0.00 0.07Bewick's Swan 0.00 0.00 0.09 0.00 0.03 0.00 0.00 0.00 0.00 0.35 0.00 0.01 0.00 0.13 0.00 0.00 0.00 0.00 0.00 0.00Black-crowned Night-heron 0.00 0.00 0.00 0.00 0.00 0.00 0.00 0.00 0.00 0.00 0.00 0.02 0.00 0.00 0.00 0.00 0.00 0.00 0.00 0.01Black-headed Gull 0.03 0.06 0.06 0.05 0.01 0.05 0.48 0.01 0.09 0.06 0.00 0.85 0.21 0.22 0.15 0.05 0.16 0.46 0.00 0.12Black-legged Kittiwake 0.00 0.00 0.00 0.00 0.00 0.00 0.00 0.00 0.00 0.00 0.00 0.00 0.00 0.00 0.00 0.00 0.00 0.00 0.00 0.00Black-necked Grebe 0.13 0.00 0.00 0.00 0.00 0.00 0.00 0.00 0.00 0.18 0.00 0.00 0.02 0.00 0.47 0.26 0.06 0.98 0.00 0.03Black-tailed Godwit 0.00 0.15 0.14 0.00 0.14 0.00 0.00 0.00 0.00 0.02 0.00 0.00 0.00 0.00 0.00 0.00 0.00 0.00 0.00 0.00Black-throated Diver 0.00 0.00 0.00 0.00 0.00 0.00 0.00 0.00 0.00 0.00 0.00 0.00 0.00 0.00 0.00 0.00 0.00 0.00 0.00 0.00Black-winged Stilt 0.00 0.00 0.00 0.00 0.00 0.00 0.00 0.00 0.00 0.00 0.00 0.00 0.00 0.00 0.00 0.00 0.00 0.00 0.00 0.00Caspian Gull 0.00 0.00 0.00 0.00 0.00 0.00 0.00 0.00 0.00 0.10 0.00 0.00 0.00 0.00 0.00 0.00 0.02 0.01 0.00 0.02Caspian Tern 0.00 0.00 0.00 0.00 0.00 0.00 0.00 0.00 0.00 0.00 0.00 0.00 0.00 0.00 0.00 0.00 0.00 0.00 0.00 0.00Cattle Egret 0.00 0.00 0.00 0.00 0.00 0.00 0.00 0.00 0.00 0.00 0.00 0.05 0.00 0.00 0.00 0.00 0.00 0.00 0.00 0.00Common Coot 0.21 0.00 0.00 0.15 0.02 0.13 1.07 0.00 0.46 1.19 0.00 0.29 0.53 0.12 0.75 0.22 0.79 0.70 0.00 0.65Common Crane 0.00 0.00 0.00 0.00 0.00 0.00 0.01 0.00 0.00 1.40 0.00 0.00 0.00 14.73 0.00 0.00 0.00 0.00 0.00 0.00Common Eider 0.00 0.01 0.02 0.00 0.03 0.00 0.00 0.24 0.00 0.01 0.00 0.01 0.01 0.00 0.08 0.02 0.00 0.00 0.00 0.00Common Greenshank 0.00 0.00 0.00 0.00 0.00 0.00 0.00 0.00 0.00 0.00 0.00 0.00 0.00 0.00 0.00 0.00 0.00 0.00 0.00 0.00Common Gull 0.01 0.00 0.01 0.02 0.01 0.08 0.09 0.02 0.03 0.00 0.00 0.11 0.02 0.00 0.04 0.01 0.00 0.03 0.00 0.03Common Pochard 0.00 0.01 0.02 0.18 0.09 0.89 0.64 0.00 0.01 2.04 0.00 0.80 2.07 0.26 3.05 0.53 1.02 0.52 0.00 0.35Common Redshank 0.03 0.73 0.50 0.00 1.05 0.00 0.00 0.85 0.00 0.04 0.00 0.00 0.00 0.00 0.00 0.00 0.00 0.00 0.00 0.00Common Sandpiper 0.00 0.00 0.00 0.00 0.00 0.00 0.00 0.00 0.00 0.00 0.00 0.00 0.00 0.00 0.00 0.00 0.00 0.00 0.00 0.00Common Scoter 0.00 0.00 0.00 0.00 0.00 0.00 0.00 0.08 0.00 0.01 0.00 0.00 0.00 0.00 0.00 0.00 0.00 0.00 0.00 0.02Common Shelduck 0.26 0.57 0.62 0.12 0.71 0.03 0.01 0.12 0.00 0.31 0.00 0.01 0.00 0.00 0.00 0.00 0.01 0.00 0.00 0.00Common Snipe 0.00 0.00 0.00 0.00 0.00 0.00 0.00 0.00 0.00 0.00 0.00 0.02 0.00 0.00 0.00 0.00 0.00 0.00 0.00 0.00Common Teal 0.03 0.22 0.16 0.08 0.09 0.01 0.05 0.12 0.02 2.45 0.11 0.18 0.02 0.17 0.01 0.00 0.06 0.00 0.05 0.12Curlew Sandpiper 0.00 0.00 0.00 0.00 0.00 0.00 0.00 0.00 0.00 0.00 0.00 0.00 0.00 0.00 0.00 0.00 0.00 0.00 0.00 0.00Dark-Bellied Brent Goose 0.00 1.79 1.80 0.00 0.69 0.00 0.00 0.00 0.00 0.00 0.00 0.00 0.00 0.00 0.00 0.00 0.00 0.00 0.00 0.00Dunlin 0.58 2.72 4.19 0.19 14.67 0.04 0.00 3.19 0.00 1.32 0.00 0.00 0.00 0.02 0.00 0.00 0.08 0.00 0.00 0.51Eurasian Bittern 0.00 0.00 0.00 0.03 0.03 0.02 0.02 0.00 0.02 0.02 0.00 0.03 0.06 0.02 0.02 0.00 0.02 0.03 0.00 0.07Eurasian Curlew 0.08 0.30 0.13 0.10 0.45 0.30 0.06 0.31 0.02 0.02 0.00 0.01 0.01 0.04 0.00 0.00 0.00 0.00 0.00 0.03Eurasian Golden Plover 0.23 0.36 0.25 0.19 1.61 0.01 0.00 0.01 0.04 0.02 0.08 0.00 0.00 0.00 0.00 0.00 0.02 0.00 0.00 0.00Eurasian Oystercatcher 0.05 0.08 0.09 0.02 0.24 0.00 0.00 0.47 0.00 0.00 0.00 0.00 0.00 0.00 0.00 0.00 0.00 0.00 0.00 0.00Eurasian Spoonbill 0.02 0.00 0.00 0.00 0.00 0.00 0.00 0.00 0.00 0.27 0.00 0.00 0.00 0.01 0.00 0.00 0.00 0.00 0.00 0.00Eurasian Wigeon 0.00 0.12 0.14 0.00 0.19 0.00 0.00 0.32 0.00 0.78 0.01 0.09 0.01 0.06 0.00 0.00 0.01 0.00 0.00 0.05Eurasian Woodcock 0.00 0.00 0.00 0.00 0.00 0.00 0.00 0.00 0.00 0.00 0.00 0.00 0.00 0.00 0.00 0.00 0.00 0.00 0.00 0.00European White-fronted Goose 0.00 0.00 0.00 0.00 0.00 0.00 0.00 0.00 0.00 0.00 0.00 0.00 0.00 0.00 0.00 0.00 0.00 0.00 0.00 0.00Ferruginous Duck 0.00 0.00 0.00 0.00 0.00 0.13 0.00 0.00 0.00 0.06 0.00 0.04 0.06 0.04 0.16 0.05 0.12 0.05 0.00 0.12Gadwall 0.00 0.04 0.02 0.00 0.08 0.00 0.00 0.00 0.00 16.89 0.01 0.84 0.52 0.35 0.59 0.04 0.40 0.01 0.00 0.71Glossy Ibis 0.00 0.00 0.00 0.00 0.00 0.00 0.00 0.00 0.00 0.02 0.00 0.00 0.00 0.01 0.00 0.00 0.00 0.00 0.00 0.00Goldeneye 0.48 0.00 0.01 0.04 0.04 0.32 0.01 0.08 0.00 0.00 0.00 0.00 0.13 0.01 0.63 0.11 0.04 0.00 0.00 0.00Goosander 0.02 0.00 0.00 0.03 0.00 2.86 0.08 0.16 0.01 0.00 0.00 0.00 0.15 0.04 0.36 0.07 0.00 0.00 0.00 0.00Great Black-backed Gull 0.02 0.01 0.01 0.01 0.01 0.03 0.00 0.01 0.00 0.00 0.00 0.00 0.00 0.00 0.00 0.00 0.00 0.00 0.00 0.00Great Cormorant 0.11 0.02 0.02 0.18 0.07 1.74 0.35 0.16 0.26 1.09 0.00 0.26 0.22 0.93 0.72 0.22 1.87 0.66 0.00 0.71Great Crested Grebe 1.34 0.00 0.00 0.03 0.00 0.21 0.05 0.00 0.01 0.26 0.00 0.06 0.65 0.16 1.88 0.87 0.16 0.44 0.00 0.03Great Northern Diver 0.03 0.00 0.02 0.02 0.00 0.00 0.00 0.02 0.00 0.02 0.00 0.03 0.04 0.04 0.02 0.03 0.00 0.00 0.00 0.00Great Ringed Plover 0.00 0.31 0.19 0.00 0.22 0.00 0.00 0.09 0.00 0.02 0.00 0.00 0.00 0.00 0.00 0.00 0.00 0.00 0.00 0.00Great White Egret 0.00 0.00 0.00 0.01 0.00 0.00 0.00 0.00 0.02 0.19 0.00 0.25 0.08 0.16 0.01 0.00 0.02 0.00 0.00 0.23Greater Flamingo 0.00 0.00 0.00 0.00 0.00 0.00 0.00 0.00 0.00 8.55 0.00 0.00 0.00 0.00 0.00 0.00 0.01 0.00 0.00 0.00Greater Scaup 0.01 0.00 0.02 0.01 0.03 18.06 0.00 0.06 0.00 0.00 0.00 0.00 0.01 0.00 0.00 0.01 0.00 0.00 0.00 0.00Greater White-fronted Goose 0.00 0.00 0.00 0.00 0.00 0.00 0.00 0.00 0.00 0.00 0.00 0.00 0.00 0.01 0.00 0.00 0.00 0.00 0.00 0.09Green Sandpiper 0.00 0.00 0.00 0.00 0.00 0.00 0.00 0.00 0.00 0.00 0.00 0.00 0.00 0.00 0.00 0.00 0.00 0.00 0.00 0.00Grey Heron 0.01 0.00 0.00 0.01 0.00 0.01 0.04 0.01 0.06 0.05 0.00 0.03 0.04 0.03 0.03 0.01 0.02 0.01 0.00 0.03Grey Plover 0.03 0.81 0.58 0.00 0.29 0.00 0.00 0.01 0.00 0.10 0.00 0.00 0.00 0.00 0.00 0.00 0.00 0.00 0.00 0.03Greylag Goose 0.00 0.01 0.01 0.00 0.05 0.00 0.00 0.29 0.00 0.27 4.40 0.02 0.02 0.48 0.00 0.00 0.00 0.00 4.55 0.01Herring Gull 0.06 0.01 0.01 0.01 0.01 0.03 0.02 0.05 0.00 0.14 0.00 0.47 0.01 0.00 0.02 0.01 0.00 0.00 0.00 0.00Kentish Plover 0.00 0.00 0.00 0.00 0.00 0.00 0.00 0.00 0.00 0.09 0.00 0.00 0.00 0.00 0.00 0.00 0.15 0.00 0.00 0.03Lesser Black-backed Gull 0.00 0.00 0.00 0.00 0.00 0.00 0.00 0.00 0.00 0.00 0.00 0.24 0.00 0.00 0.00 0.00 0.00 0.00 0.00 0.00Light-bellied Brent Goose 0.00 0.10 0.08 0.00 0.15 0.00 0.00 0.51 0.00 0.00 0.00 0.00 0.00 0.00 0.00 0.00 0.00 0.00 0.00 0.00Little Egret 0.00 0.01 0.01 0.00 0.01 0.00 0.00 0.00 0.00 0.28 0.00 0.02 0.00 0.00 0.00 0.00 0.04 0.00 0.00 0.08Little Grebe 0.04 0.02 0.01 0.00 0.01 0.00 0.01 0.00 0.00 0.00 0.00 0.04 0.03 0.00 0.18 0.07 0.03 0.03 0.00 0.03Little Gull 0.00 0.00 0.00 0.00 0.00 0.15 0.00 0.00 0.00 0.00 0.00 0.01 0.00 0.00 0.00 0.00 0.00 0.00 0.00 0.00Little Ringed Plover 0.00 0.00 0.00 0.00 0.00 0.00 0.00 0.00 0.00 0.00 0.00 0.00 0.00 0.00 0.00 0.00 0.00 0.00 0.00 0.00Little Stint 0.00 0.00 0.00 0.00 0.00 0.00 0.00 0.00 0.00 0.19 0.00 0.00 0.00 0.00 0.00 0.00 0.00 0.00 0.00 0.03Long-tailed Duck 0.00 0.00 0.00 0.00 0.00 0.00 0.00 0.14 0.00 0.00 0.00 0.00 0.00 0.00 0.00 0.00 0.00 0.00 0.00 0.00Mallard 0.24 0.02 0.02 0.44 0.18 0.27 0.45 0.05 0.32 1.20 0.04 0.21 0.11 0.22 0.18 0.03 0.00 0.03 0.07 0.20Marbled Teal 0.00 0.00 0.00 0.00 0.00 0.00 0.00 0.00 0.00 0.00 0.00 0.00 0.00 0.00 0.00 0.00 0.00 0.00 0.00 0.00Mediterranean Gull 0.00 0.00 0.00 0.00 0.00 0.00 0.00 0.00 0.00 0.00 0.00 0.01 0.00 0.00 0.00 0.00 0.39 0.00 0.00 0.00Moorhen 0.00 0.00 0.00 0.00 0.00 0.00 0.01 0.00 0.01 0.00 0.00 0.02 0.00 0.00 0.00 0.00 0.00 0.00 0.00 0.00Mute Swan 0.00 0.03 0.01 0.00 0.03 0.00 0.00 0.02 0.00 0.13 0.00 0.01 0.18 0.05 0.31 0.06 0.00 0.08 0.00 0.11Northern Lapwing 0.06 0.15 0.11 0.12 0.41 0.02 0.15 0.02 0.09 0.13 0.25 0.05 0.00 0.14 0.00 0.00 0.00 0.00 0.00 0.02Northern Pintail 0.12 0.28 0.32 0.15 0.08 0.06 0.04 0.22 0.01 3.31 0.02 0.42 0.06 0.08 0.01 0.00 0.22 0.00 0.00 0.03Northern Shoveler 0.12 0.12 0.07 0.08 0.06 0.03 0.04 0.01 0.83 22.50 2.29 7.76 0.01 0.35 0.05 0.01 1.87 0.03 0.20 0.14Pied Avocet 0.02 0.43 0.31 0.00 0.00 0.00 0.00 0.00 0.00 1.42 0.00 0.01 0.00 0.00 0.00 0.00 0.00 0.00 0.00 0.00Pink-footed Goose 0.00 0.00 0.01 0.00 0.23 0.00 0.00 0.20 0.00 0.00 0.00 0.00 0.00 0.00 0.00 0.00 0.00 0.00 0.00 0.00Purple Sandpiper 0.00 0.00 0.00 0.00 0.00 0.00 0.00 0.03 0.00 0.00 0.00 0.00 0.00 0.00 0.00 0.00 0.00 0.00 0.00 0.00Purple Swamphen 0.00 0.00 0.00 0.00 0.00 0.00 0.00 0.00 0.00 0.00 0.00 0.00 0.00 0.00 0.00 0.00 0.00 0.00 0.00 0.00Red Knot 0.02 0.68 0.33 0.00 4.40 0.00 0.00 0.52 0.00 0.00 0.00 0.00 0.00 0.00 0.00 0.00 0.00 0.00 0.00 0.00Red-breasted Merganser 2.11 0.01 0.02 0.02 0.00 0.73 0.00 0.18 0.00 0.01 0.00 0.00 0.01 0.00 0.01 0.00 0.11 0.00 0.00 0.01Red-crested Pochard 0.00 0.00 0.00 0.00 0.00 0.00 0.00 0.00 0.00 5.96 0.00 0.00 4.53 0.01 1.91 0.04 0.00 0.07 0.00 0.00Red-necked Grebe 0.00 0.00 0.00 0.00 0.00 0.00 0.00 0.00 0.00 0.00 0.00 0.00 0.00 0.00 0.00 0.01 0.00 0.01 0.00 0.00Red-throated Diver 0.00 0.00 0.00 0.00 0.00 0.00 0.00 0.00 0.00 0.00 0.00 0.00 0.00 0.00 0.00 0.00 0.00 0.00 0.00 0.00Ruddy Turnstone 0.03 0.27 0.17 0.00 0.25 0.00 0.00 0.14 0.00 0.01 0.00 0.00 0.00 0.00 0.00 0.00 0.00 0.00 0.00 0.00Ruff 0.00 0.00 0.00 0.00 0.00 0.00 0.00 0.00 0.00 0.00 0.00 0.00 0.00 0.00 0.00 0.00 0.00 0.00 0.00 0.00Sanderling 0.00 0.06 0.11 0.00 0.15 0.00 0.00 0.06 0.00 0.05 0.00 0.00 0.00 0.00 0.00 0.00 0.06 0.00 0.00 0.03Shag 0.00 0.00 0.00 0.00 0.00 0.00 0.00 0.00 0.00 0.00 0.00 0.00 0.00 0.00 0.00 0.00 0.00 0.00 0.00 0.00Slavonian Grebe 0.97 0.06 0.04 0.00 0.04 0.00 0.00 0.13 0.00 0.06 0.00 0.03 0.05 0.04 0.06 0.07 0.00 0.06 0.00 0.03Slender-billed Gull 0.00 0.00 0.00 0.00 0.00 0.00 0.00 0.00 0.00 0.01 0.00 0.00 0.00 0.00 0.00 0.00 0.00 0.00 0.00 0.00Smew 0.02 0.00 0.02 0.03 0.00 1.65 0.22 0.00 0.02 0.00 0.00 0.01 0.02 0.13 0.01 0.00 0.00 0.01 0.00 0.00Spotted Redshank 0.00 0.00 0.00 0.00 0.00 0.00 0.00 0.00 0.00 0.03 0.00 0.00 0.00 0.01 0.00 0.00 0.00 0.00 0.00 0.00Stone Curlew 0.00 0.00 0.00 0.00 0.00 0.00 0.00 0.00 0.00 0.00 0.00 0.00 0.00 0.00 0.00 0.00 0.00 0.00 0.00 0.00Taiga Bean Goose 0.00 0.00 0.01 0.00 0.00 0.00 0.00 0.00 0.00 0.00 0.00 0.00 0.00 0.00 0.00 0.00 0.00 0.00 0.00 0.00Temminck's Stint 0.00 0.00 0.00 0.00 0.00 0.00 0.00 0.00 0.00 0.08 0.00 0.00 0.00 0.00 0.00 0.00 0.00 0.00 0.00 0.00Tufted Duck 0.00 0.00 0.00 0.39 0.02 1.62 0.16 0.03 0.01 0.20 0.00 0.02 1.83 0.02 2.15 0.78 0.05 0.12 0.00 0.00Tundra Bean Goose 0.00 0.00 0.00 0.00 0.00 0.00 0.00 0.00 0.00 0.00 0.00 0.00 0.00 0.09 0.00 0.00 0.00 0.00 0.00 0.00Velvet Scoter 0.00 0.00 0.00 0.00 0.00 0.00 0.00 0.04 0.00 0.00 0.00 0.00 0.00 0.00 0.00 0.00 0.00 0.00 0.00 0.05Water Rail 0.00 0.00 0.00 0.00 0.00 0.00 0.00 0.00 0.00 0.00 0.00 0.01 0.00 0.00 0.00 0.00 0.00 0.00 0.00 0.00Western Yellow-legged Gull 0.00 0.00 0.00 0.00 0.00 0.00 0.00 0.00 0.00 0.00 0.00 0.00 0.09 0.00 0.10 0.04 0.16 0.05 0.00 0.17Whimbrel 0.00 0.00 0.00 0.00 0.00 0.00 0.00 0.00 0.00 0.00 0.00 0.00 0.00 0.00 0.00 0.00 0.00 0.00 0.00 0.00Whiskered Tern 0.00 0.00 0.00 0.00 0.00 0.00 0.00 0.00 0.00 0.00 0.00 0.00 0.00 0.00 0.00 0.00 0.00 0.00 0.00 0.00White Stork 0.00 0.00 0.00 0.00 0.00 0.00 0.01 0.00 0.01 0.03 0.00 0.00 0.00 0.00 0.00 0.00 0.00 0.00 0.00 0.00White-headed Duck 0.00 0.00 0.00 0.00 0.00 0.00 0.00 0.00 0.00 0.00 0.00 0.05 0.00 0.00 0.00 0.00 0.00 0.00 0.00 0.00Whooper Swan 0.00 0.00 0.00 0.00 0.01 0.00 0.00 0.03 0.00 0.00 0.00 0.00 0.02 0.03 0.00 0.00 0.00 0.00 0.00 0.01Yellow-legged Gull 0.00 0.00 0.00 0.00 0.00 0.00 0.00 0.00 0.00 0.00 0.00 0.00 0.00 0.00 0.00 0.00 0.07 0.08 0.00 0.80No. spp at 1% 2.00 2.00 2.00 0.00 4.00 5.00 1.00 2.00 0.00 13.00 2.00 1.00 3.00 1.00 4.00 0.00 3.00 0.00 1.00 0.00WCV score 7.57 10.97 11.08 2.74 27.84 29.49 4.08 10.16 2.34 73.97 7.23 13.42 11.90 19.73 14.01 3.65 8.06 4.50 4.88 5.81
Wetlands International Site Code
Species
81

Appendix 2.1 contd
IT00
446
IT00
447
ES
0197
0
GB
0260
9
GB
0267
4
FR
0033
4
FR
0034
1
DK
0016
3
ES
0201
8
GB
0335
6
IT00
494
ES
0205
2
ES
0206
8
ES
0207
2
NL
0015
7
GB
0350
8
GB
0353
5
NL
0015
3
GB
0364
4
Audouin's Gull 0.00 0.00 0.00 0.00 0.00 0.00 0.00 0.00 0.10 0.00 0.00 0.00 0.04 0.13 0.00 0.00 0.00 0.00 0.00Barnacle Goose 0.00 0.00 0.00 0.00 0.01 0.00 0.00 0.33 0.00 0.00 0.00 0.00 0.00 0.00 0.00 0.00 0.00 0.00 0.00Bar-tailed Godwit 0.00 0.00 0.00 0.30 2.69 0.05 0.02 0.00 0.00 0.00 0.00 0.00 0.74 0.22 0.00 0.04 0.01 0.00 2.89Bean Goose 0.05 0.00 0.00 0.00 0.00 0.01 0.00 0.19 0.00 0.00 0.00 0.00 0.00 0.00 0.00 0.00 0.00 0.00 0.00Bewick's Swan 0.00 0.00 0.00 0.00 0.03 0.02 0.00 0.02 0.00 0.58 0.00 0.00 0.00 0.00 0.00 0.17 0.05 0.00 0.05Black-crowned Night-heron 0.00 0.18 0.00 0.00 0.00 0.01 0.03 0.00 0.00 0.00 0.00 0.00 0.00 0.00 0.00 0.00 0.00 0.00 0.00Black-headed Gull 0.34 0.70 0.00 0.04 0.02 0.11 0.14 0.02 0.04 0.05 0.25 0.05 0.13 0.28 0.05 0.03 0.01 0.20 0.24Black-legged Kittiwake 0.00 0.00 0.00 0.00 0.00 0.00 0.00 0.00 0.00 0.00 0.00 0.00 0.00 0.00 0.00 0.00 0.00 0.00 0.00Black-necked Grebe 0.39 0.74 0.00 0.00 0.00 0.00 0.00 0.00 0.33 0.00 0.06 0.02 0.00 0.02 0.00 0.00 0.00 0.00 0.00Black-tailed Godwit 0.00 0.01 0.00 0.15 0.00 0.09 0.08 0.00 3.18 0.02 0.03 3.17 0.33 0.83 0.00 0.04 0.24 0.00 0.07Black-throated Diver 0.00 0.00 0.00 0.00 0.00 0.00 0.00 0.00 0.00 0.00 0.00 0.00 0.00 0.00 0.00 0.00 0.00 0.00 0.00Black-winged Stilt 0.00 0.00 0.00 0.00 0.00 0.00 0.00 0.00 0.48 0.00 0.00 0.18 1.71 0.90 0.00 0.00 0.00 0.00 0.00Caspian Gull 0.31 0.42 0.00 0.00 0.00 0.06 0.00 0.00 0.00 0.00 0.17 0.00 0.20 0.19 0.00 0.00 0.00 0.00 0.00Caspian Tern 0.00 0.00 0.00 0.00 0.00 0.00 0.00 0.00 0.18 0.00 0.00 0.00 0.77 0.64 0.00 0.00 0.00 0.00 0.00Cattle Egret 0.00 0.00 0.00 0.00 0.00 0.01 0.04 0.00 0.01 0.00 0.00 0.00 0.00 0.03 0.00 0.00 0.00 0.00 0.00Common Coot 1.07 1.61 0.01 0.00 0.00 0.06 0.05 0.38 0.09 0.15 0.26 0.15 0.00 0.01 0.09 0.00 0.00 0.22 0.02Common Crane 0.00 0.00 0.02 0.00 0.00 0.00 0.00 0.00 0.07 0.00 0.01 0.00 0.00 0.00 0.00 0.00 0.00 0.00 0.00Common Eider 0.02 0.00 0.00 0.01 1.65 0.38 0.19 7.47 0.00 0.00 0.00 0.00 0.00 0.00 0.00 0.01 0.00 0.00 2.06Common Greenshank 0.01 0.01 0.00 0.00 0.00 0.00 0.00 0.00 0.01 0.00 0.00 0.00 0.07 0.02 0.00 0.00 0.00 0.00 0.00Common Gull 0.02 0.04 0.00 0.01 0.03 0.14 0.00 0.00 0.00 0.01 0.00 0.00 0.00 0.00 0.01 0.00 0.00 0.02 0.10Common Pochard 0.16 0.19 0.01 0.01 0.01 0.04 0.02 0.02 0.21 4.53 0.11 0.09 0.00 0.00 2.12 0.03 0.01 0.90 0.04Common Redshank 0.15 0.15 0.00 0.15 0.55 0.02 0.00 0.01 0.06 0.01 0.20 0.06 0.39 0.45 0.00 0.56 0.74 0.00 2.21Common Sandpiper 0.00 0.00 0.00 0.00 0.00 0.00 0.00 0.00 0.00 0.00 0.00 0.00 0.00 0.00 0.00 0.00 0.00 0.00 0.00Common Scoter 0.00 0.00 0.00 0.00 0.02 0.08 0.00 0.02 0.00 0.00 0.00 0.00 0.00 0.00 0.00 0.00 0.00 0.00 0.01Common Shelduck 0.00 0.34 0.00 0.37 0.25 1.87 0.37 0.20 0.06 0.01 1.19 0.05 0.10 0.05 0.01 1.08 0.77 0.01 1.24Common Snipe 0.01 0.00 0.00 0.00 0.00 0.00 0.01 0.00 0.00 0.00 0.00 0.00 0.00 0.00 0.00 0.00 0.00 0.00 0.01Common Teal 0.41 1.94 0.13 0.03 0.03 0.04 0.61 0.00 0.14 0.10 0.14 0.63 0.00 0.01 0.00 0.15 0.56 0.05 0.12Curlew Sandpiper 0.00 0.00 0.00 0.00 0.00 0.00 0.00 0.00 0.00 0.00 0.00 0.00 0.10 0.01 0.00 0.00 0.00 0.00 0.00Dark-Bellied Brent Goose 0.00 0.00 0.00 2.59 0.02 0.00 0.02 0.02 0.00 0.00 0.00 0.00 0.00 0.00 0.00 0.64 0.00 0.00 0.01Dunlin 10.76 17.08 0.03 13.82 10.90 5.74 3.53 0.07 3.33 0.16 3.44 5.19 8.86 6.57 0.00 7.90 21.47 0.00 28.50Eurasian Bittern 0.10 0.06 0.00 0.02 0.00 0.02 0.02 0.00 0.00 0.00 0.02 0.00 0.00 0.00 0.02 0.02 0.00 0.04 0.00Eurasian Curlew 0.21 0.24 0.00 0.12 0.18 0.30 0.09 0.00 0.01 0.07 0.07 0.00 0.04 0.06 0.01 0.18 0.17 0.00 1.75Eurasian Golden Plover 0.00 0.01 0.03 0.01 0.19 0.05 0.03 0.01 0.02 0.48 0.00 0.01 0.01 0.00 0.00 0.06 0.12 0.00 0.24Eurasian Oystercatcher 0.00 0.00 0.00 0.12 0.08 0.64 0.04 0.00 0.00 0.00 0.00 0.00 0.03 0.04 0.00 0.15 0.01 0.00 3.92Eurasian Spoonbill 0.00 0.30 0.02 0.00 0.00 0.10 0.05 0.00 0.43 0.00 0.58 0.00 1.99 3.47 0.00 0.00 0.00 0.00 0.00Eurasian Wigeon 0.93 0.36 0.02 0.06 0.25 0.02 0.08 0.04 0.26 0.14 0.95 0.49 0.00 0.04 0.00 0.25 0.33 0.00 0.29Eurasian Woodcock 0.00 0.00 0.00 0.00 0.00 0.00 0.00 0.00 0.00 0.00 0.00 0.00 0.00 0.00 0.00 0.00 0.00 0.00 0.00European White-fronted Goose 0.00 0.00 0.00 0.00 0.00 0.00 0.00 0.00 0.00 0.00 0.00 0.00 0.00 0.00 0.00 0.01 0.00 0.00 0.00Ferruginous Duck 0.16 0.08 0.00 0.00 0.00 0.00 0.00 0.00 0.00 0.00 0.11 0.00 0.00 0.00 0.03 0.00 0.00 0.05 0.00Gadwall 1.86 0.24 0.18 0.02 0.00 0.05 0.10 0.02 0.22 0.11 0.33 1.43 0.00 0.00 0.00 0.01 0.00 0.00 0.04Glossy Ibis 0.00 0.00 0.01 0.00 0.00 0.00 0.00 0.00 0.00 0.00 0.01 0.00 0.00 0.00 0.00 0.00 0.00 0.00 0.00Goldeneye 0.35 0.04 0.00 0.01 0.01 0.00 0.00 0.48 0.00 1.56 0.00 0.00 0.00 0.00 0.21 0.01 0.00 0.03 0.06Goosander 0.00 0.00 0.00 0.00 0.00 0.01 0.00 0.17 0.00 0.00 0.00 0.00 0.00 0.00 0.29 0.00 0.00 0.04 0.01Great Black-backed Gull 0.00 0.00 0.00 0.03 0.01 0.09 0.01 0.00 0.00 0.01 0.00 0.00 0.00 0.00 0.01 0.00 0.00 0.00 0.07Great Cormorant 0.71 1.73 0.01 0.02 0.04 0.16 0.30 0.32 0.08 0.44 0.30 0.02 0.83 0.81 0.08 0.10 0.03 0.32 0.28Great Crested Grebe 0.08 0.31 0.00 0.01 0.00 0.14 0.00 0.00 0.00 0.03 0.06 0.00 0.03 0.12 0.04 0.01 0.01 0.10 0.03Great Northern Diver 0.00 0.00 0.00 0.02 0.02 0.05 0.00 0.00 0.00 0.00 0.00 0.00 0.00 0.00 0.02 0.04 0.00 0.03 0.03Great Ringed Plover 0.00 0.01 0.00 0.32 0.15 0.09 0.08 0.00 0.27 0.00 0.00 0.00 3.00 1.45 0.00 0.32 0.04 0.00 0.36Great White Egret 0.37 0.89 0.00 0.00 0.00 0.02 0.01 0.00 0.00 0.00 0.19 0.00 0.02 0.01 0.00 0.00 0.00 0.00 0.00Greater Flamingo 0.01 0.00 0.00 0.00 0.00 0.00 0.00 0.00 2.96 0.00 2.35 1.04 3.39 1.80 0.00 0.00 0.00 0.00 0.00Greater Scaup 0.07 0.00 0.00 0.00 0.00 0.00 0.01 0.03 0.00 0.68 0.00 0.00 0.00 0.00 0.83 0.00 0.00 0.00 0.01Greater White-fronted Goose 0.01 0.01 0.00 0.00 0.00 0.00 0.00 0.00 0.00 0.00 0.00 0.00 0.00 0.00 0.00 0.00 0.00 0.00 0.00Green Sandpiper 0.00 0.00 0.00 0.00 0.00 0.00 0.00 0.00 0.00 0.00 0.00 0.00 0.00 0.00 0.00 0.00 0.00 0.00 0.00Grey Heron 0.13 0.33 0.00 0.00 0.00 0.01 0.02 0.00 0.08 0.03 0.04 0.02 0.23 0.47 0.00 0.01 0.00 0.02 0.01Grey Plover 0.48 0.15 0.00 0.27 0.31 0.17 0.10 0.00 0.04 0.00 0.05 0.03 0.35 0.35 0.00 0.48 0.09 0.00 0.31Greylag Goose 0.06 0.04 6.16 0.00 0.22 0.04 0.09 0.34 1.33 0.06 0.00 1.96 0.00 0.00 0.00 0.04 0.00 0.00 0.08Herring Gull 0.00 0.00 0.00 0.01 0.01 0.59 0.18 0.02 0.00 0.01 0.00 0.00 0.00 0.00 0.01 0.01 0.00 0.08 0.70Kentish Plover 0.04 0.13 0.00 0.00 0.00 0.01 0.00 0.00 0.61 0.00 0.49 0.03 2.14 2.31 0.00 0.00 0.00 0.00 0.00Lesser Black-backed Gull 0.00 0.00 0.00 0.00 0.00 0.00 0.01 0.00 0.05 0.02 0.00 0.04 0.46 1.25 0.00 0.00 0.00 0.00 0.06Light-bellied Brent Goose 0.00 0.00 0.00 0.05 23.93 0.00 0.10 0.00 0.00 0.00 0.00 0.00 0.00 0.00 0.00 0.00 0.00 0.00 0.57Little Egret 0.68 0.68 0.00 0.01 0.00 0.12 0.08 0.00 0.20 0.00 0.10 0.02 0.50 0.51 0.00 0.00 0.00 0.00 0.01Little Grebe 0.08 0.07 0.00 0.01 0.00 0.01 0.00 0.00 0.13 0.06 0.03 0.00 0.01 0.01 0.00 0.01 0.00 0.01 0.01Little Gull 0.00 0.00 0.00 0.00 0.00 0.06 0.00 0.00 0.00 0.00 0.01 0.00 0.00 0.00 0.24 0.00 0.00 0.00 0.01Little Ringed Plover 0.00 0.00 0.00 0.00 0.00 0.00 0.00 0.00 0.00 0.00 0.00 0.00 0.00 0.40 0.00 0.00 0.00 0.00 0.00Little Stint 0.00 0.02 0.00 0.00 0.00 0.00 0.01 0.00 0.29 0.00 0.22 0.18 0.76 0.32 0.00 0.00 0.00 0.00 0.00Long-tailed Duck 0.00 0.00 0.00 0.00 0.00 0.00 0.00 0.00 0.00 0.00 0.00 0.00 0.00 0.00 0.00 0.00 0.00 0.00 0.00Mallard 0.28 1.04 0.16 0.00 0.03 0.03 0.13 0.24 0.09 0.10 0.01 0.06 0.00 0.07 0.05 0.03 0.04 0.31 0.09Marbled Teal 0.00 0.00 0.00 0.00 0.00 0.00 0.00 0.00 0.00 0.00 0.00 0.00 0.00 0.00 0.00 0.00 0.00 0.00 0.00Mediterranean Gull 0.08 0.26 0.00 0.00 0.00 0.00 0.00 0.00 0.00 0.00 0.02 0.00 0.00 0.00 0.00 0.00 0.00 0.00 0.00Moorhen 0.00 0.01 0.00 0.00 0.00 0.01 0.00 0.00 0.00 0.01 0.00 0.00 0.00 0.00 0.00 0.00 0.00 0.00 0.00Mute Swan 0.05 0.24 0.00 0.00 0.02 0.07 0.00 3.30 0.00 0.38 0.01 0.00 0.00 0.00 0.00 0.01 0.01 0.00 0.04Northern Lapwing 0.02 0.03 0.06 0.05 0.07 0.03 0.13 0.00 0.03 0.26 0.01 0.01 0.00 0.00 0.00 0.10 0.18 0.03 0.42Northern Pintail 0.57 7.38 0.05 0.16 0.16 1.56 0.88 0.02 0.98 0.01 1.06 5.00 0.00 0.03 0.00 0.84 5.46 0.01 1.82Northern Shoveler 1.49 7.44 1.35 0.16 0.01 0.36 2.76 0.00 4.56 0.05 1.26 16.31 0.00 0.06 0.01 0.27 0.04 0.02 0.09Pied Avocet 0.01 0.65 0.01 0.01 0.00 0.06 2.18 0.00 5.08 0.00 2.07 1.85 2.02 2.35 0.00 0.24 0.00 0.00 0.00Pink-footed Goose 0.00 0.00 0.00 0.00 0.02 0.00 0.00 0.00 0.00 0.00 0.00 0.00 0.00 0.00 0.00 0.00 0.05 0.00 0.72Purple Sandpiper 0.00 0.00 0.00 0.00 0.03 0.00 0.00 0.00 0.00 0.00 0.00 0.00 0.00 0.00 0.00 0.00 0.00 0.00 0.02Purple Swamphen 0.00 0.00 0.00 0.00 0.00 0.00 0.00 0.00 0.09 0.00 0.00 5.33 0.00 0.00 0.00 0.00 0.00 0.00 0.00Red Knot 0.00 0.00 0.00 0.14 0.79 0.13 0.02 0.00 0.00 0.00 0.00 0.00 0.02 0.01 0.00 0.22 0.03 0.00 8.36Red-breasted Merganser 0.19 0.13 0.00 0.04 0.01 0.03 0.00 0.73 0.00 0.01 0.11 0.00 0.00 0.00 0.01 0.01 0.00 0.00 0.10Red-crested Pochard 0.00 0.01 0.00 0.00 0.00 0.00 0.00 0.00 0.04 0.00 0.00 2.49 0.00 0.00 0.00 0.00 0.00 0.00 0.00Red-necked Grebe 0.02 0.00 0.00 0.00 0.00 0.01 0.00 0.00 0.00 0.00 0.00 0.00 0.00 0.00 0.00 0.00 0.00 0.00 0.00Red-throated Diver 0.00 0.00 0.00 0.00 0.00 0.03 0.00 0.00 0.00 0.00 0.00 0.00 0.00 0.00 0.00 0.00 0.00 0.00 0.00Ruddy Turnstone 0.01 0.00 0.00 0.08 0.14 0.11 0.05 0.00 0.00 0.00 0.00 0.00 0.23 0.24 0.00 0.20 0.00 0.00 1.24Ruff 0.00 0.00 0.00 0.00 0.00 0.00 0.00 0.00 0.01 0.00 0.00 0.01 0.00 0.00 0.00 0.00 0.00 0.00 0.00Sanderling 0.00 0.01 0.00 0.01 0.08 0.20 0.09 0.00 0.00 0.00 0.00 0.00 0.61 0.33 0.00 0.00 0.00 0.00 0.10Shag 0.00 0.00 0.00 0.00 0.00 0.00 0.00 0.00 0.00 0.00 0.00 0.00 0.00 0.00 0.00 0.00 0.00 0.00 0.00Slavonian Grebe 0.00 0.13 0.00 0.07 0.13 0.05 0.00 0.00 0.00 0.00 0.00 0.00 0.00 0.00 0.00 0.03 0.00 0.02 0.04Slender-billed Gull 0.00 0.00 0.00 0.00 0.00 0.00 0.00 0.00 0.00 0.00 0.09 0.00 0.02 0.00 0.00 0.00 0.00 0.00 0.00Smew 0.01 0.01 0.00 0.00 0.00 0.01 0.00 0.01 0.00 0.00 0.00 0.00 0.00 0.00 3.95 0.00 0.00 0.11 0.00Spotted Redshank 0.01 0.12 0.00 0.00 0.00 0.00 0.00 0.00 0.52 0.00 0.07 0.20 0.00 0.00 0.00 0.00 0.00 0.00 0.00Stone Curlew 0.00 0.00 0.00 0.00 0.00 0.00 0.00 0.00 0.00 0.00 0.00 0.02 0.06 0.03 0.00 0.00 0.00 0.00 0.00Taiga Bean Goose 0.00 0.00 0.00 0.00 0.01 0.00 0.00 0.00 0.00 0.00 0.00 0.00 0.00 0.00 0.00 0.01 0.00 0.00 0.01Temminck's Stint 0.00 0.00 0.00 0.00 0.00 0.00 0.00 0.00 1.62 0.00 0.00 0.00 0.00 0.00 0.00 0.00 0.00 0.00 0.00Tufted Duck 0.00 0.00 0.00 0.00 0.00 0.01 0.00 0.18 0.00 1.19 0.00 0.00 0.00 0.00 2.68 0.01 0.00 0.15 0.01Tundra Bean Goose 0.00 0.00 0.00 0.00 0.00 0.02 0.00 0.00 0.00 0.00 0.00 0.00 0.00 0.00 0.00 0.00 0.00 0.00 0.00Velvet Scoter 0.01 0.00 0.00 0.00 0.00 0.00 0.00 0.01 0.00 0.00 0.00 0.00 0.00 0.00 0.00 0.00 0.00 0.00 0.00Water Rail 0.00 0.00 0.00 0.00 0.00 0.00 0.00 0.00 0.00 0.00 0.00 0.00 0.00 0.00 0.00 0.00 0.00 0.00 0.00Western Yellow-legged Gull 0.75 1.81 0.00 0.00 0.00 0.00 0.00 0.00 0.00 0.00 1.32 0.00 0.00 0.00 0.00 0.00 0.00 0.00 0.00Whimbrel 0.00 0.13 0.00 0.00 0.00 0.00 0.00 0.00 0.00 0.00 0.00 0.00 0.03 0.00 0.00 0.00 0.00 0.00 0.00Whiskered Tern 0.00 0.00 0.00 0.00 0.00 0.00 0.00 0.00 0.04 0.00 0.00 0.00 0.00 0.00 0.00 0.00 0.00 0.00 0.00White Stork 0.00 0.00 0.02 0.00 0.00 0.02 0.01 0.00 0.07 0.00 0.00 0.02 0.04 0.13 0.00 0.00 0.00 0.00 0.00White-headed Duck 0.00 0.00 0.00 0.00 0.00 0.00 0.00 0.00 4.05 0.00 0.00 0.00 0.00 0.00 0.00 0.00 0.00 0.04 0.00Whooper Swan 0.00 0.01 0.00 0.00 0.14 0.00 0.00 0.62 0.00 1.43 0.00 0.00 0.00 0.00 0.00 0.02 0.04 0.00 0.03Yellow-legged Gull 1.18 0.98 0.00 0.00 0.00 0.00 0.00 0.00 0.00 0.00 0.65 0.00 0.00 0.00 0.00 0.00 0.00 0.00 0.00No. spp at 1% 5.00 8.00 2.00 2.00 4.00 3.00 3.00 2.00 8.00 4.00 7.00 10.00 7.00 7.00 3.00 2.00 2.00 0.00 10.00WCV score 24.75 49.55 8.32 19.32 43.26 14.26 12.81 15.31 32.49 12.75 18.46 46.19 30.25 27.09 10.76 14.38 30.53 2.83 59.49
Species
Wetlands International Site Code
82

Appendix 2.1 contd
NL
0023
3
NL
0013
5
GB
0379
0
NL
0013
7
IT00
535
IT00
536
NL
0022
2
NL
0022
3
NL
0022
4
NL
0022
6
NL
0022
7
NL
0022
8
NL
0022
9
NL
0023
1
NL
0023
0
GB
0389
7
ES
0218
4
FR
0038
2
FR
0039
4
DE
0211
4
Audouin's Gull 0.00 0.00 0.00 0.00 0.00 0.00 0.00 0.00 0.00 0.00 0.00 0.00 0.00 0.00 0.00 0.00 0.00 0.00 0.00 0.00Barnacle Goose 0.00 0.00 0.00 0.00 0.00 0.00 0.00 0.00 0.00 0.00 0.00 0.00 0.00 0.00 0.00 0.00 0.00 0.00 0.00 0.00Bar-tailed Godwit 0.00 0.00 0.89 3.97 0.00 0.00 0.00 0.00 0.00 0.00 0.06 0.00 0.00 0.02 0.03 0.00 0.02 0.10 0.51 0.00Bean Goose 0.00 0.00 0.00 0.00 0.00 0.01 0.00 0.00 0.00 0.00 0.00 0.00 0.00 0.00 0.00 0.01 0.00 0.00 0.00 0.00Bewick's Swan 0.00 0.00 0.03 0.00 0.00 0.00 0.00 0.00 0.00 0.00 0.00 0.00 0.00 0.00 0.00 13.83 0.00 0.00 0.00 0.02Black-crowned Night-heron 0.00 0.00 0.00 0.00 0.00 0.00 0.00 0.00 0.00 0.00 0.00 0.00 0.00 0.01 0.00 0.00 0.00 0.00 0.00 0.00Black-headed Gull 0.00 0.02 0.04 0.06 0.09 0.13 0.16 0.70 0.24 0.26 0.41 0.30 0.34 0.29 0.75 0.11 0.03 0.39 0.09 0.00Black-legged Kittiwake 0.00 0.00 0.00 0.00 0.00 0.00 0.00 0.00 0.00 0.00 0.00 0.00 0.00 0.00 0.00 0.00 0.00 0.00 0.00 0.00Black-necked Grebe 0.00 0.00 0.00 0.00 0.12 0.09 0.00 0.00 0.00 0.00 0.00 0.00 0.00 0.00 0.00 0.00 0.02 0.03 0.01 0.00Black-tailed Godwit 0.00 0.00 0.07 0.01 0.00 0.00 0.00 0.00 0.00 0.00 0.00 0.00 0.00 0.04 0.00 0.20 2.69 0.66 0.66 0.00Black-throated Diver 0.00 0.00 0.00 0.00 0.00 0.00 0.00 0.00 0.00 0.00 0.00 0.00 0.00 0.00 0.00 0.00 0.00 0.00 0.00 0.00Black-winged Stilt 0.00 0.00 0.00 0.00 0.00 0.00 0.00 0.00 0.00 0.00 0.00 0.00 0.00 0.00 0.00 0.00 0.61 0.00 0.00 0.00Caspian Gull 0.00 0.00 0.00 0.00 0.00 0.11 0.00 0.00 0.00 0.00 0.00 0.00 0.00 0.00 0.00 0.00 0.00 0.00 0.01 0.00Caspian Tern 0.00 0.00 0.00 0.00 0.00 0.05 0.00 0.00 0.00 0.00 0.00 0.00 0.00 0.00 0.00 0.00 0.09 0.00 0.00 0.00Cattle Egret 0.00 0.00 0.00 0.00 0.01 0.06 0.00 0.00 0.00 0.00 0.00 0.00 0.00 0.00 0.00 0.00 0.02 0.04 0.01 0.00Common Coot 0.00 0.00 0.03 0.07 0.48 0.42 0.47 0.30 0.29 0.26 1.56 0.30 0.74 0.37 1.27 0.10 0.13 0.06 0.01 0.18Common Crane 0.00 0.00 0.00 0.00 0.00 0.04 0.00 0.00 0.00 0.00 0.01 0.00 0.00 0.00 0.00 0.00 0.92 0.00 0.01 0.00Common Eider 20.61 0.00 0.08 0.00 0.00 0.00 0.00 0.00 0.00 0.00 0.00 0.00 0.00 0.00 0.00 0.00 0.00 0.19 0.00 0.00Common Greenshank 0.00 0.00 0.00 0.00 0.00 0.00 0.00 0.00 0.00 0.00 0.00 0.00 0.00 0.00 0.00 0.00 0.02 0.00 0.00 0.00Common Gull 0.00 0.50 0.03 0.06 0.00 0.00 1.30 0.61 0.64 0.17 0.34 0.47 0.46 0.15 0.50 0.02 0.00 0.03 0.00 0.00Common Pochard 0.00 0.00 0.01 0.03 0.82 1.90 0.26 0.11 0.09 0.34 0.82 0.09 0.12 0.16 0.56 0.48 0.02 0.04 0.00 0.64Common Redshank 0.00 0.00 0.33 0.44 0.09 0.05 0.00 0.00 0.00 0.00 0.01 0.00 0.00 0.08 0.01 0.03 0.07 0.04 0.17 0.00Common Sandpiper 0.00 0.00 0.00 0.00 0.00 0.00 0.00 0.00 0.00 0.00 0.00 0.00 0.00 0.00 0.00 0.00 0.00 0.00 0.00 0.00Common Scoter 3.23 0.00 0.10 0.00 0.00 0.00 0.00 0.00 0.00 0.00 0.00 0.00 0.00 0.00 0.00 0.00 0.07 0.01 0.02 0.00Common Shelduck 0.00 0.10 0.32 1.45 0.04 0.09 0.02 0.00 0.01 0.03 0.10 0.00 0.01 0.31 0.04 0.00 0.15 0.52 0.75 0.00Common Snipe 0.00 0.00 0.00 0.00 0.00 0.00 0.00 0.00 0.00 0.00 0.00 0.00 0.00 0.00 0.00 0.00 0.01 0.02 0.00 0.00Common Teal 0.00 0.00 0.15 0.07 0.14 0.35 0.06 0.07 0.02 0.13 0.10 0.04 0.02 0.08 0.11 0.18 2.48 0.13 0.16 0.03Curlew Sandpiper 0.00 0.00 0.00 0.00 0.00 0.00 0.00 0.00 0.00 0.00 0.00 0.00 0.00 0.00 0.00 0.00 0.11 0.00 0.00 0.00Dark-Bellied Brent Goose 0.00 0.00 3.10 0.00 0.00 0.00 0.00 0.00 0.00 0.00 0.00 0.00 0.00 0.00 0.00 0.00 0.00 0.99 3.75 0.00Dunlin 0.00 0.00 2.52 18.53 0.50 0.55 0.01 0.00 0.05 0.03 0.15 0.00 0.04 0.16 0.09 0.06 2.42 5.41 16.03 0.00Eurasian Bittern 0.00 0.00 0.02 0.02 0.02 0.04 0.05 0.02 0.04 0.04 0.10 0.03 0.03 0.05 0.09 0.00 0.00 0.03 0.00 0.00Eurasian Curlew 0.00 0.00 0.23 1.56 0.01 0.02 1.02 0.05 0.34 0.20 0.36 0.15 0.02 1.06 0.27 0.00 0.01 0.07 0.25 0.00Eurasian Golden Plover 0.00 0.00 0.30 0.15 0.00 0.05 0.41 0.01 0.03 0.04 0.20 0.07 0.02 0.39 0.38 0.19 0.09 0.01 0.13 0.00Eurasian Oystercatcher 0.00 0.00 0.29 4.35 0.00 0.00 0.03 0.00 0.01 0.00 0.16 0.00 0.00 0.30 0.09 0.00 0.03 0.16 0.18 0.00Eurasian Spoonbill 0.00 0.00 0.00 0.01 0.73 0.04 0.01 0.00 0.01 0.00 0.00 0.00 0.00 0.05 0.01 0.00 0.70 0.49 0.03 0.00Eurasian Wigeon 0.00 0.00 0.50 0.00 0.10 0.15 0.00 0.00 0.00 0.00 0.00 0.00 0.00 0.00 0.00 1.59 0.74 0.02 0.10 0.02Eurasian Woodcock 0.00 0.00 0.00 0.00 0.00 0.00 0.00 0.00 0.00 0.00 0.00 0.00 0.00 0.00 0.00 0.00 0.00 0.00 0.00 0.00European White-fronted Goose 0.00 0.00 0.02 0.00 0.00 0.00 0.00 0.00 0.00 0.00 0.00 0.00 0.00 0.00 0.00 0.00 0.00 0.00 0.00 0.00Ferruginous Duck 0.00 0.00 0.00 0.00 0.11 0.06 0.03 0.03 0.03 0.07 0.03 0.05 0.11 0.03 0.07 0.00 0.00 0.06 0.00 0.06Gadwall 0.00 0.00 0.15 0.00 0.15 0.40 0.00 0.00 0.00 0.00 0.00 0.00 0.00 0.00 0.00 0.22 3.16 0.23 0.10 1.41Glossy Ibis 0.00 0.00 0.00 0.00 0.00 0.01 0.00 0.00 0.00 0.00 0.00 0.00 0.00 0.00 0.00 0.00 0.01 0.00 0.00 0.00Goldeneye 0.00 0.01 0.03 0.43 0.00 0.00 0.01 0.00 0.01 0.02 0.04 0.00 0.01 0.05 0.04 0.00 0.00 0.00 0.00 0.05Goosander 0.00 0.00 0.00 0.00 0.00 0.00 0.07 0.03 0.06 0.02 0.13 0.04 0.02 0.02 0.07 0.00 0.00 0.02 0.00 0.03Great Black-backed Gull 0.00 0.47 0.01 0.04 0.00 0.00 0.00 0.00 0.01 0.00 0.05 0.00 0.00 0.05 0.06 0.00 0.00 0.02 0.01 0.00Great Cormorant 0.00 0.00 0.06 0.05 0.80 4.01 0.13 0.21 0.19 0.25 0.40 0.32 0.15 0.14 0.56 0.10 0.22 0.33 0.05 0.29Great Crested Grebe 0.00 0.00 0.00 0.04 0.13 0.10 0.03 0.02 0.01 0.04 0.15 0.02 0.03 0.06 0.22 0.00 0.00 0.02 0.00 0.04Great Northern Diver 0.00 0.00 0.05 0.02 0.00 0.00 0.00 0.02 0.00 0.00 0.03 0.00 0.02 0.02 0.02 0.00 0.00 0.06 0.02 0.02Great Ringed Plover 0.00 0.00 0.22 0.09 0.01 0.02 0.00 0.00 0.00 0.00 0.01 0.00 0.00 0.04 0.02 0.00 0.29 0.37 0.85 0.00Great White Egret 0.00 0.00 0.00 0.00 0.33 0.52 0.08 0.05 0.05 0.05 0.04 0.09 0.08 0.01 0.08 0.00 0.00 0.05 0.00 0.00Greater Flamingo 0.00 0.00 0.00 0.00 1.72 3.50 0.00 0.00 0.00 0.00 0.00 0.00 0.00 0.00 0.00 0.00 2.68 0.01 0.00 0.00Greater Scaup 0.00 0.15 0.02 0.01 0.00 0.00 0.03 0.00 0.00 0.00 0.08 0.00 0.00 0.01 0.39 0.00 0.00 0.01 0.00 0.00Greater White-fronted Goose 0.00 0.00 0.00 0.00 0.00 0.00 0.00 0.00 0.00 0.00 0.00 0.00 0.00 0.00 0.00 0.00 0.00 0.00 0.00 0.00Green Sandpiper 0.00 0.00 0.00 0.00 0.00 0.00 0.00 0.00 0.00 0.00 0.00 0.00 0.00 0.00 0.00 0.00 0.00 0.00 0.00 0.00Grey Heron 0.00 0.00 0.01 0.01 0.14 0.15 0.09 0.09 0.10 0.05 0.15 0.10 0.09 0.11 0.18 0.01 0.02 0.06 0.01 0.01Grey Plover 0.00 0.00 0.34 1.89 0.01 0.02 0.00 0.00 0.00 0.00 0.01 0.00 0.00 0.05 0.01 0.00 0.04 0.14 0.86 0.00Greylag Goose 0.00 0.00 0.13 0.00 0.00 0.01 0.00 0.00 0.00 0.00 0.00 0.00 0.00 0.00 0.00 0.02 9.37 0.01 0.09 0.00Herring Gull 0.00 1.59 0.11 0.34 0.00 0.02 0.05 0.04 0.18 0.06 0.46 0.02 0.03 0.60 0.65 0.00 0.00 0.93 0.05 0.00Kentish Plover 0.00 0.00 0.00 0.00 0.02 0.54 0.00 0.00 0.00 0.00 0.00 0.00 0.00 0.00 0.00 0.00 0.77 0.01 0.00 0.00Lesser Black-backed Gull 0.00 0.00 0.00 0.00 0.00 0.00 0.00 0.00 0.00 0.00 0.00 0.00 0.00 0.00 0.00 0.04 1.40 0.02 0.02 0.00Light-bellied Brent Goose 0.00 0.00 0.03 0.00 0.00 0.00 0.00 0.00 0.00 0.00 0.00 0.00 0.00 0.00 0.00 0.00 0.00 0.03 0.02 0.00Little Egret 0.00 0.00 0.04 0.01 0.17 0.41 0.00 0.00 0.00 0.00 0.00 0.00 0.00 0.06 0.01 0.00 0.05 1.15 0.01 0.00Little Grebe 0.00 0.00 0.01 0.04 0.08 0.06 0.00 0.03 0.00 0.02 0.06 0.02 0.01 0.11 0.03 0.00 0.01 0.01 0.00 0.03Little Gull 0.00 0.00 0.01 0.07 0.00 0.00 0.00 0.00 0.00 0.00 0.01 0.00 0.00 0.02 0.00 0.00 0.06 0.06 0.00 0.00Little Ringed Plover 0.00 0.00 0.00 0.00 0.00 0.00 0.00 0.00 0.00 0.00 0.00 0.00 0.00 0.00 0.00 0.00 0.03 0.00 0.00 0.00Little Stint 0.00 0.00 0.00 0.00 0.01 0.07 0.00 0.00 0.00 0.00 0.00 0.00 0.00 0.00 0.00 0.00 1.57 0.01 0.01 0.00Long-tailed Duck 0.00 0.00 0.00 0.00 0.00 0.00 0.00 0.00 0.00 0.00 0.00 0.00 0.00 0.00 0.00 0.00 0.00 0.00 0.00 0.00Mallard 0.00 0.00 0.06 0.42 0.08 0.11 0.93 0.41 0.99 0.69 1.32 0.56 0.49 0.82 0.92 0.15 0.07 0.07 0.11 0.34Marbled Teal 0.00 0.00 0.00 0.00 0.03 0.00 0.00 0.00 0.00 0.00 0.00 0.00 0.00 0.00 0.00 0.00 0.00 0.03 0.00 0.00Mediterranean Gull 0.00 0.00 0.00 0.00 0.00 0.02 0.00 0.00 0.00 0.00 0.00 0.00 0.00 0.00 0.00 0.00 0.00 0.00 0.00 0.00Moorhen 0.00 0.00 0.01 0.00 0.00 0.00 0.01 0.03 0.01 0.03 0.10 0.02 0.04 0.12 0.08 0.01 0.00 0.01 0.00 0.00Mute Swan 0.00 0.00 0.02 0.00 0.00 0.00 0.00 0.00 0.00 0.00 0.00 0.00 0.00 0.00 0.00 0.15 0.00 0.02 0.02 0.04Northern Lapwing 0.00 0.00 0.23 0.10 0.06 0.14 0.22 0.11 0.05 0.09 0.22 0.06 0.12 0.34 0.21 0.22 0.14 0.26 0.11 0.00Northern Pintail 0.00 0.00 0.82 2.42 0.36 0.53 0.04 0.03 0.05 0.23 0.03 0.03 0.01 0.36 0.09 1.67 1.90 0.29 0.43 0.01Northern Shoveler 0.00 0.00 0.22 2.04 1.61 5.27 0.19 0.10 0.17 0.47 0.67 0.07 0.07 0.77 0.93 0.49 37.65 1.61 1.10 0.07Pied Avocet 0.00 0.00 0.03 0.34 0.32 0.25 0.00 0.00 0.00 0.04 0.00 0.00 0.00 0.10 0.02 0.00 0.66 1.59 0.72 0.00Pink-footed Goose 0.00 0.00 4.97 0.00 0.00 0.00 0.00 0.00 0.00 0.00 0.00 0.00 0.00 0.00 0.00 0.00 0.00 0.00 0.00 0.00Purple Sandpiper 0.00 0.00 0.00 0.00 0.00 0.00 0.00 0.00 0.00 0.00 0.03 0.00 0.00 0.12 0.05 0.00 0.00 0.06 0.01 0.00Purple Swamphen 0.00 0.00 0.00 0.00 0.00 0.11 0.00 0.00 0.00 0.00 0.00 0.00 0.00 0.00 0.00 0.00 0.17 0.00 0.00 0.00Red Knot 0.00 0.00 1.06 4.00 0.00 0.00 0.00 0.00 0.00 0.00 0.06 0.00 0.00 0.01 0.01 0.00 0.00 0.01 1.81 0.00Red-breasted Merganser 0.00 0.01 0.03 0.29 0.04 0.00 0.01 0.00 0.01 0.01 0.05 0.00 0.00 0.10 0.03 0.00 0.00 0.01 0.00 0.00Red-crested Pochard 0.00 0.00 0.01 0.00 0.01 0.06 0.01 0.00 0.00 0.00 0.01 0.00 0.06 0.00 0.01 0.00 0.70 0.00 0.00 0.01Red-necked Grebe 0.00 0.00 0.00 0.00 0.00 0.02 0.00 0.00 0.00 0.00 0.00 0.00 0.00 0.00 0.00 0.00 0.00 0.00 0.00 0.00Red-throated Diver 0.00 0.00 0.00 0.00 0.00 0.00 0.00 0.00 0.00 0.00 0.01 0.00 0.00 0.00 0.00 0.00 0.00 0.00 0.00 0.00Ruddy Turnstone 0.00 0.25 0.29 0.77 0.00 0.05 0.01 0.00 0.00 0.00 0.36 0.00 0.00 0.49 0.11 0.00 0.00 0.80 0.16 0.00Ruff 0.00 0.00 0.00 0.00 0.00 0.00 0.00 0.00 0.00 0.00 0.00 0.00 0.00 0.01 0.00 0.01 0.01 0.00 0.00 0.00Sanderling 0.00 2.18 0.28 0.13 0.01 0.01 0.00 0.00 0.00 0.00 0.34 0.00 0.00 0.23 0.43 0.00 0.15 0.07 0.28 0.00Shag 0.00 0.00 0.00 0.00 0.00 0.01 0.00 0.00 0.00 0.00 0.00 0.00 0.00 0.00 0.00 0.00 0.00 0.01 0.00 0.00Slavonian Grebe 0.00 0.00 0.11 0.40 0.09 0.00 0.07 0.03 0.03 0.06 0.08 0.00 0.05 0.06 0.08 0.00 0.00 0.08 0.00 0.04Slender-billed Gull 0.00 0.00 0.00 0.00 0.00 0.10 0.00 0.00 0.00 0.00 0.00 0.00 0.00 0.00 0.00 0.00 0.00 0.00 0.00 0.00Smew 0.00 0.00 0.01 0.03 0.00 0.00 0.26 0.10 0.08 0.08 0.31 0.15 0.09 0.10 0.20 0.00 0.00 0.01 0.00 0.02Spotted Redshank 0.00 0.00 0.01 0.04 0.01 0.02 0.00 0.00 0.00 0.00 0.00 0.00 0.00 0.03 0.00 0.00 0.20 0.02 0.02 0.00Stone Curlew 0.00 0.00 0.00 0.00 0.00 0.01 0.00 0.00 0.00 0.00 0.00 0.00 0.00 0.00 0.00 0.00 0.02 0.00 0.00 0.00Taiga Bean Goose 0.00 0.00 0.00 0.00 0.00 0.00 0.00 0.00 0.00 0.00 0.00 0.00 0.00 0.00 0.00 0.01 0.00 0.00 0.00 0.00Temminck's Stint 0.00 0.00 0.00 0.00 0.00 0.00 0.00 0.00 0.00 0.00 0.00 0.00 0.00 0.00 0.00 0.00 0.00 0.00 0.00 0.00Tufted Duck 0.00 0.00 0.00 0.02 0.03 0.04 0.25 0.09 0.15 0.15 0.93 0.06 0.13 0.22 0.54 0.04 0.00 0.01 0.00 0.49Tundra Bean Goose 0.00 0.00 0.00 0.00 0.00 0.00 0.00 0.00 0.00 0.00 0.00 0.00 0.00 0.00 0.00 0.00 0.00 0.00 0.00 0.00Velvet Scoter 0.00 0.06 0.00 0.00 0.00 0.00 0.00 0.00 0.00 0.00 0.00 0.00 0.00 0.00 0.00 0.00 0.00 0.00 0.00 0.00Water Rail 0.00 0.00 0.00 0.00 0.00 0.00 0.00 0.00 0.00 0.00 0.00 0.00 0.00 0.00 0.00 0.00 0.00 0.00 0.00 0.00Western Yellow-legged Gull 0.00 0.00 0.00 0.00 0.13 0.43 0.00 0.00 0.00 0.00 0.00 0.00 0.00 0.00 0.00 0.00 0.00 0.00 0.00 0.00Whimbrel 0.00 0.00 0.00 0.00 0.00 0.00 0.00 0.00 0.00 0.00 0.00 0.00 0.00 0.00 0.00 0.00 0.00 0.00 0.00 0.00Whiskered Tern 0.00 0.00 0.00 0.00 0.00 0.01 0.00 0.00 0.00 0.00 0.00 0.00 0.00 0.00 0.00 0.00 0.07 0.00 0.00 0.00White Stork 0.00 0.00 0.00 0.00 0.00 0.00 0.01 0.01 0.00 0.00 0.00 0.00 0.01 0.00 0.05 0.00 0.20 0.01 0.00 0.00White-headed Duck 0.00 0.00 0.00 0.00 0.00 0.00 0.00 0.00 0.00 0.00 0.04 0.00 0.00 0.00 0.00 0.00 0.08 0.00 0.00 0.00Whooper Swan 0.00 0.00 0.01 0.00 0.00 0.00 0.00 0.00 0.00 0.00 0.00 0.00 0.00 0.00 0.00 1.38 0.00 0.00 0.00 0.00Yellow-legged Gull 0.00 0.00 0.00 0.00 0.24 0.51 0.00 0.00 0.00 0.00 0.00 0.00 0.00 0.00 0.00 0.00 0.00 0.00 0.00 0.00No. spp at 1% 2.00 2.00 4.00 9.00 2.00 4.00 2.00 0.00 0.00 0.00 2.00 0.00 0.00 1.00 1.00 4.00 10.00 4.00 4.00 1.00WCV score 23.84 5.36 18.45 44.84 9.90 21.75 6.35 3.36 3.96 3.96 10.62 3.08 3.47 8.81 10.39 21.34 73.16 18.01 29.76 3.86
Species
Wetlands International Site Code
83

Appendix 2.1 contd
GB
0422
4
DK
0022
1
FR
0046
3
GB
0490
8
IE00
490
GB
0501
7
GB
0502
1
GB
0504
2
IT00
640
GB
0519
3
GB
0520
5
GB
0526
1
DK
0026
4
GB
0535
3
GB
0538
2
IT00
670
IT00
671
IT00
696
ES
0203
5
CH
0013
5
Audouin's Gull 0.00 0.00 0.00 0.00 0.00 0.00 0.00 0.00 0.00 0.00 0.00 0.00 0.00 0.00 0.00 0.00 0.00 0.00 0.00 0.00Barnacle Goose 0.00 0.00 0.00 0.01 0.00 3.08 0.00 0.00 0.00 0.00 0.04 0.00 0.02 0.00 0.00 0.00 0.00 0.00 0.00 0.00Bar-tailed Godwit 3.82 0.00 0.01 0.01 0.16 1.92 0.00 0.00 0.00 0.07 0.60 0.34 0.00 3.29 6.81 0.00 0.00 0.00 0.05 0.00Bean Goose 0.00 0.03 0.00 0.00 0.00 0.00 0.00 0.00 0.00 0.00 0.00 0.00 0.00 0.00 0.00 0.00 0.00 0.01 0.00 0.00Bewick's Swan 0.66 0.01 0.00 1.32 0.00 0.11 0.61 0.00 0.03 0.02 0.03 0.10 0.00 0.09 0.18 0.00 0.00 0.00 0.00 0.00Black-crowned Night-heron 0.00 0.00 0.00 0.00 0.00 0.00 0.00 0.00 0.00 0.00 0.00 0.00 0.00 0.00 0.00 0.00 0.00 0.00 0.62 0.00Black-headed Gull 0.09 0.07 0.01 0.20 0.05 0.06 0.09 0.00 0.09 0.12 0.12 0.03 0.00 0.62 0.17 1.17 0.00 0.07 0.11 0.18Black-legged Kittiwake 0.00 0.00 0.00 0.00 0.00 0.00 0.00 0.00 0.00 0.00 0.00 0.00 0.00 0.00 0.00 0.00 0.00 0.00 0.00 0.00Black-necked Grebe 0.00 0.00 0.00 0.00 0.00 0.00 0.00 0.00 0.10 0.00 0.00 0.00 0.00 0.00 0.00 0.01 0.01 0.37 0.25 0.02Black-tailed Godwit 0.50 0.00 0.00 0.04 0.40 0.01 0.02 0.00 0.02 0.54 0.07 0.31 0.00 0.40 0.43 0.00 0.00 0.00 5.16 0.00Black-throated Diver 0.00 0.00 0.00 0.00 0.00 0.00 0.00 0.00 0.00 0.00 0.00 0.00 0.00 0.00 0.00 0.00 0.00 0.00 0.00 0.00Black-winged Stilt 0.00 0.00 0.00 0.00 0.00 0.00 0.00 0.00 0.01 0.00 0.00 0.00 0.00 0.00 0.00 0.00 0.00 0.00 1.72 0.00Caspian Gull 0.00 0.00 0.00 0.00 0.00 0.00 0.00 0.00 0.08 0.00 0.00 0.00 0.00 0.00 0.00 0.00 0.00 0.15 0.03 0.00Caspian Tern 0.00 0.00 0.00 0.00 0.00 0.00 0.00 0.00 0.00 0.00 0.00 0.00 0.00 0.00 0.00 0.00 0.00 0.00 0.10 0.00Cattle Egret 0.00 0.00 0.00 0.00 0.00 0.00 0.00 0.00 0.01 0.00 0.00 0.00 0.00 0.00 0.00 0.00 0.00 0.00 0.07 0.00Common Coot 0.01 0.72 0.01 0.04 0.00 0.00 0.01 0.00 0.21 0.00 0.02 0.03 0.53 0.05 0.01 0.00 1.66 0.79 0.13 0.28Common Crane 0.00 0.00 0.00 0.00 0.00 0.00 0.00 0.00 0.01 0.00 0.00 0.00 0.00 0.00 0.00 0.00 0.00 0.00 0.30 0.00Common Eider 0.00 0.59 0.00 0.00 0.00 0.00 0.00 0.00 0.00 0.00 0.18 0.02 19.53 0.01 0.43 0.00 0.00 0.00 0.00 0.03Common Greenshank 0.00 0.00 0.00 0.00 0.00 0.00 0.00 0.00 0.01 0.00 0.01 0.00 0.00 0.00 0.00 0.00 0.00 0.00 0.03 0.00Common Gull 0.08 0.02 0.00 0.04 0.01 0.06 0.00 0.00 0.00 0.01 0.01 0.01 0.00 0.07 0.06 0.00 0.00 0.00 0.00 0.02Common Pochard 0.01 0.06 0.00 0.26 0.00 0.00 0.04 0.00 0.06 0.02 0.03 0.03 0.07 0.15 0.02 0.00 0.54 0.26 0.37 0.41Common Redshank 0.44 0.01 0.02 0.61 0.21 0.64 0.01 0.00 0.25 0.62 0.75 0.37 0.00 1.03 0.83 0.00 0.00 0.04 0.17 0.00Common Sandpiper 0.00 0.00 0.00 0.00 0.00 0.00 0.00 0.00 0.00 0.00 0.00 0.00 0.00 0.00 0.00 0.00 0.00 0.00 0.00 0.00Common Scoter 0.00 0.00 0.00 0.00 0.00 0.00 0.00 0.00 0.00 0.00 0.00 0.01 0.00 0.00 0.03 0.00 0.00 0.00 0.00 0.00Common Shelduck 0.78 0.05 0.46 0.51 0.18 0.23 0.01 0.00 0.10 0.64 0.88 0.62 0.15 0.85 3.64 0.00 0.00 0.12 0.08 0.00Common Snipe 0.00 0.00 0.00 0.01 0.00 0.00 0.05 0.00 0.00 0.00 0.00 0.00 0.00 0.00 0.00 0.00 0.00 0.00 0.01 0.00Common Teal 0.23 0.02 0.03 0.20 0.08 0.04 0.66 0.00 0.10 0.04 0.13 0.17 0.01 0.24 0.06 0.00 0.04 0.11 0.39 0.00Curlew Sandpiper 0.00 0.00 0.00 0.00 0.00 0.00 0.00 0.00 0.00 0.00 0.00 0.00 0.00 0.00 0.00 0.00 0.00 0.00 0.00 0.00Dark-Bellied Brent Goose 0.00 0.00 0.00 0.00 0.03 0.00 0.00 0.00 0.00 0.42 0.00 0.66 0.11 2.74 6.72 0.00 0.00 0.00 0.00 0.00Dunlin 13.58 0.46 3.78 22.97 3.69 7.57 0.28 0.00 2.16 8.49 2.75 6.16 0.15 19.52 21.67 0.01 0.05 0.28 9.07 0.00Eurasian Bittern 0.00 0.00 0.00 0.02 0.00 0.00 0.03 0.00 0.00 0.00 0.00 0.00 0.00 0.00 0.00 0.00 0.02 0.04 0.00 0.00Eurasian Curlew 0.15 0.02 0.04 0.65 0.40 0.63 0.00 0.00 0.03 0.19 0.34 0.24 0.02 0.53 0.56 0.00 0.00 0.02 0.02 0.00Eurasian Golden Plover 0.26 0.00 0.06 0.09 0.47 0.42 0.54 0.00 0.00 0.03 0.44 0.43 0.00 0.24 0.64 0.00 0.00 0.02 0.09 0.00Eurasian Oystercatcher 0.92 0.00 0.00 0.03 0.02 2.41 0.00 0.00 0.00 0.11 0.57 0.39 0.01 1.50 1.28 0.00 0.00 0.00 0.00 0.00Eurasian Spoonbill 0.00 0.00 0.00 0.00 0.00 0.00 0.00 0.00 0.59 0.00 0.00 0.01 0.00 0.00 0.00 0.00 0.00 0.07 2.23 0.00Eurasian Wigeon 1.78 0.06 0.08 0.37 0.21 0.10 0.69 0.00 0.12 0.17 0.09 0.65 0.09 0.25 0.16 0.00 0.20 0.14 0.16 0.00Eurasian Woodcock 0.00 0.00 0.00 0.00 0.00 0.00 0.00 0.00 0.00 0.00 0.00 0.00 0.00 0.00 0.00 0.00 0.00 0.00 0.00 0.00European White-fronted Goose 0.00 0.00 0.00 0.25 0.00 0.00 0.00 0.00 0.00 0.00 0.00 0.07 0.00 0.02 0.00 0.00 0.00 0.00 0.00 0.00Ferruginous Duck 0.00 0.00 0.00 0.00 0.00 0.00 0.00 0.00 0.10 0.00 0.00 0.00 0.00 0.00 0.00 0.00 0.79 0.07 0.00 0.06Gadwall 0.01 0.02 1.33 0.35 0.00 0.01 0.43 0.00 0.10 0.03 0.11 0.10 0.00 0.31 0.10 0.00 1.01 0.20 0.86 0.05Glossy Ibis 0.00 0.00 0.00 0.00 0.00 0.00 0.00 0.00 0.01 0.00 0.00 0.00 0.00 0.00 0.00 0.00 0.00 0.00 0.10 0.00Goldeneye 0.00 0.90 0.00 0.00 0.00 0.02 0.00 0.00 0.00 0.02 0.05 0.00 0.72 0.00 0.03 0.00 0.00 0.10 0.00 0.05Goosander 0.00 0.61 0.00 0.00 0.00 0.01 0.01 0.00 0.00 0.00 0.00 0.00 0.09 0.00 0.00 0.00 0.00 0.00 0.00 0.04Great Black-backed Gull 0.01 0.02 0.00 0.01 0.00 0.01 0.00 0.00 0.00 0.00 0.01 0.00 0.00 0.14 0.04 0.00 0.00 0.00 0.00 0.00Great Cormorant 0.15 0.09 0.24 0.06 0.09 0.23 0.07 0.00 0.80 0.05 0.09 0.06 0.59 0.22 0.14 0.02 1.26 0.80 0.44 0.08Great Crested Grebe 0.00 0.03 0.01 0.00 0.00 0.01 0.00 0.00 0.04 0.01 0.01 0.01 0.00 0.01 0.00 0.01 0.21 0.18 0.00 0.22Great Northern Diver 0.00 0.00 0.00 0.00 0.04 0.02 0.02 0.00 0.00 0.04 0.05 0.02 0.00 0.03 0.03 0.00 0.00 0.00 0.00 0.02Great Ringed Plover 0.04 0.00 0.01 0.21 0.00 0.47 0.00 0.00 0.08 0.22 0.17 0.20 0.00 0.68 0.13 0.00 0.00 0.00 0.19 0.00Great White Egret 0.00 0.00 0.02 0.00 0.01 0.00 0.00 0.00 0.12 0.00 0.00 0.00 0.00 0.00 0.00 0.00 0.02 0.64 0.01 0.01Greater Flamingo 0.00 0.00 11.84 0.00 0.00 0.00 0.00 0.00 4.54 0.00 0.00 0.00 0.00 0.00 0.00 0.00 0.00 0.46 8.10 0.00Greater Scaup 0.01 0.01 0.00 0.00 0.03 0.14 0.00 0.00 0.00 0.00 0.01 0.00 0.92 0.00 0.01 0.00 0.00 0.00 0.00 0.00Greater White-fronted Goose 0.00 0.00 0.00 0.00 0.00 0.00 0.00 0.00 0.00 0.00 0.00 0.00 0.00 0.00 0.00 0.00 0.00 0.01 0.00 0.00Green Sandpiper 0.00 0.00 0.00 0.00 0.00 0.00 0.00 0.00 0.00 0.00 0.00 0.00 0.00 0.00 0.00 0.00 0.00 0.00 0.01 0.00Grey Heron 0.00 0.02 0.01 0.01 0.00 0.01 0.04 0.00 0.08 0.00 0.02 0.01 0.00 0.03 0.01 0.00 0.02 0.23 0.13 0.02Grey Plover 0.52 0.00 0.07 0.15 0.01 0.17 0.01 0.00 0.09 0.53 0.03 0.42 0.00 1.12 1.55 0.00 0.00 0.00 0.17 0.00Greylag Goose 0.01 0.18 0.00 0.05 0.01 0.06 0.01 0.00 0.00 0.01 0.07 0.08 0.26 0.04 0.05 0.00 0.00 0.12 0.46 0.00Herring Gull 0.39 0.11 0.00 0.07 0.01 0.05 0.00 0.00 0.00 0.01 0.04 0.02 0.00 0.19 0.35 0.00 0.00 0.00 0.00 0.00Kentish Plover 0.00 0.00 0.06 0.00 0.00 0.00 0.00 0.00 0.54 0.00 0.00 0.00 0.00 0.00 0.00 0.01 0.00 0.01 1.38 0.00Lesser Black-backed Gull 0.01 0.00 0.00 0.21 0.01 0.00 0.00 0.00 0.00 0.01 0.00 0.00 0.00 0.08 0.03 0.00 0.00 0.00 0.39 0.00Light-bellied Brent Goose 0.02 0.00 0.00 0.03 0.20 0.02 0.02 0.00 0.00 0.00 56.06 0.04 0.00 0.02 0.04 0.00 0.00 0.00 0.00 0.00Little Egret 0.01 0.00 0.01 0.01 0.00 0.00 0.02 0.00 0.25 0.01 0.01 0.01 0.00 0.03 0.03 0.00 0.02 0.12 0.62 0.00Little Grebe 0.00 0.02 0.01 0.00 0.00 0.00 0.00 0.00 0.02 0.00 0.03 0.03 0.00 0.04 0.01 0.00 0.10 0.12 0.07 0.04Little Gull 0.00 0.00 0.00 0.00 0.00 0.00 0.00 0.00 0.00 0.00 0.00 0.00 0.00 0.01 0.00 0.00 0.00 0.00 0.01 0.01Little Ringed Plover 0.00 0.00 0.00 0.00 0.00 0.00 0.00 0.00 0.00 0.00 0.00 0.00 0.00 0.00 0.00 0.00 0.00 0.00 0.04 0.00Little Stint 0.00 0.00 0.38 0.00 0.00 0.00 0.00 0.00 0.34 0.00 0.00 0.00 0.00 0.00 0.00 0.00 0.00 0.02 1.10 0.00Long-tailed Duck 0.00 0.00 0.00 0.00 0.00 0.00 0.00 0.00 0.00 0.00 0.00 0.00 0.00 0.00 0.00 0.00 0.00 0.00 0.00 0.00Mallard 0.05 0.16 0.06 0.13 0.01 0.05 0.04 0.00 0.04 0.04 0.05 0.06 0.18 0.06 0.12 0.00 0.06 0.21 0.20 0.08Marbled Teal 0.00 0.00 0.00 0.00 0.00 0.00 0.00 0.00 0.00 0.00 0.00 0.00 0.00 0.00 0.00 0.00 0.00 0.00 1.38 0.00Mediterranean Gull 0.00 0.00 0.00 0.00 0.00 0.00 0.00 0.00 0.00 0.00 0.00 0.00 0.00 0.00 0.00 0.00 0.00 0.00 0.00 0.00Moorhen 0.00 0.00 0.00 0.01 0.00 0.00 0.01 0.00 0.00 0.00 0.00 0.00 0.00 0.01 0.00 0.00 0.00 0.01 0.00 0.00Mute Swan 0.02 1.60 0.03 0.06 0.01 0.01 0.17 0.00 0.00 0.10 0.03 0.04 1.32 0.06 0.01 0.00 0.00 0.00 0.00 0.06Northern Lapwing 0.40 0.00 0.00 0.32 0.74 0.25 1.75 0.00 0.06 0.07 0.31 0.34 0.00 0.36 0.36 0.00 0.01 0.06 0.09 0.00Northern Pintail 1.53 0.01 0.02 0.73 0.01 1.26 0.43 0.00 0.54 0.57 0.36 0.59 0.04 0.27 1.58 0.00 0.01 0.05 4.46 0.00Northern Shoveler 0.20 0.03 1.07 0.49 0.01 0.06 1.09 0.00 0.98 0.03 0.27 0.56 0.02 0.49 0.03 0.00 0.20 0.82 20.75 0.02Pied Avocet 0.00 0.00 1.04 0.01 0.00 0.00 0.00 0.00 0.57 0.10 0.00 0.17 0.00 0.53 0.00 0.00 0.00 0.24 7.05 0.00Pink-footed Goose 1.33 0.00 0.00 0.00 0.00 0.95 0.00 7.83 0.00 0.00 0.00 0.00 0.00 0.00 4.08 0.00 0.00 0.00 0.00 0.00Purple Sandpiper 0.00 0.00 0.00 0.00 0.00 0.04 0.00 0.00 0.00 0.00 0.00 0.00 0.00 0.00 0.01 0.00 0.00 0.00 0.00 0.00Purple Swamphen 0.00 0.00 0.00 0.00 0.00 0.00 0.00 0.00 0.02 0.00 0.00 0.00 0.00 0.00 0.00 0.00 0.00 0.00 4.22 0.00Red Knot 2.78 0.00 0.01 0.30 0.02 1.63 0.00 0.00 0.00 0.45 1.45 0.54 0.00 4.52 12.60 0.00 0.00 0.00 0.00 0.00Red-breasted Merganser 0.00 0.02 0.01 0.00 0.00 0.02 0.00 0.00 0.00 0.02 0.07 0.01 0.56 0.01 0.02 0.01 0.00 0.01 0.00 0.00Red-crested Pochard 0.00 0.00 0.00 0.00 0.00 0.00 0.00 0.00 0.00 0.00 0.00 0.00 0.00 0.00 0.00 0.00 0.01 0.00 0.57 6.71Red-necked Grebe 0.00 0.01 0.00 0.00 0.00 0.00 0.00 0.00 0.00 0.00 0.00 0.00 0.03 0.00 0.00 0.00 0.00 0.00 0.00 0.00Red-throated Diver 0.00 0.00 0.00 0.00 0.00 0.00 0.00 0.00 0.00 0.00 0.00 0.00 0.00 0.00 0.00 0.00 0.00 0.00 0.00 0.00Ruddy Turnstone 0.13 0.00 0.00 0.22 0.04 0.32 0.00 0.00 0.03 0.30 0.22 0.22 0.00 0.37 0.51 0.00 0.00 0.00 0.00 0.00Ruff 0.00 0.00 0.00 0.00 0.00 0.00 0.00 0.00 0.00 0.00 0.00 0.00 0.00 0.00 0.00 0.00 0.00 0.00 0.03 0.00Sanderling 1.08 0.00 0.05 0.02 0.01 0.10 0.00 0.00 0.02 0.02 0.08 0.02 0.00 0.14 0.21 0.00 0.00 0.09 0.00 0.00Shag 0.00 0.00 0.00 0.00 0.00 0.00 0.00 0.00 0.00 0.00 0.05 0.00 0.00 0.00 0.00 0.00 0.00 0.00 0.00 0.00Slavonian Grebe 0.00 0.04 0.00 0.03 0.00 0.03 0.00 0.00 0.00 0.04 0.00 0.03 0.00 0.09 0.04 0.00 0.00 0.03 0.00 0.03Slender-billed Gull 0.00 0.00 0.02 0.00 0.00 0.00 0.00 0.00 0.46 0.00 0.00 0.00 0.00 0.00 0.00 0.00 0.00 0.01 0.00 0.00Smew 0.00 0.26 0.00 0.01 0.00 0.00 0.00 0.00 0.00 0.00 0.00 0.00 0.03 0.01 0.01 0.00 0.01 0.01 0.00 0.00Spotted Redshank 0.00 0.00 0.02 0.00 0.00 0.00 0.00 0.00 0.16 0.00 0.00 0.00 0.00 0.00 0.00 0.00 0.00 0.04 0.09 0.00Stone Curlew 0.00 0.00 0.00 0.00 0.00 0.00 0.00 0.00 0.04 0.00 0.00 0.00 0.00 0.00 0.00 0.00 0.00 0.00 0.01 0.00Taiga Bean Goose 0.00 0.00 0.00 0.00 0.00 0.00 0.00 0.00 0.00 0.01 0.00 0.00 0.00 0.01 0.00 0.00 0.00 0.00 0.00 0.00Temminck's Stint 0.00 0.00 0.00 0.00 0.00 0.00 0.00 0.00 0.00 0.00 0.00 0.00 0.00 0.00 0.00 0.00 0.00 0.00 0.00 0.00Tufted Duck 0.01 1.28 0.00 0.04 0.00 0.00 0.01 0.00 0.00 0.00 0.02 0.00 0.59 0.04 0.01 0.00 0.01 0.01 0.00 0.43Tundra Bean Goose 0.00 0.00 0.00 0.00 0.00 0.00 0.00 0.00 0.00 0.00 0.00 0.00 0.00 0.00 0.00 0.00 0.00 0.00 0.00 0.00Velvet Scoter 0.00 0.00 0.00 0.00 0.00 0.00 0.00 0.00 0.00 0.00 0.00 0.00 0.00 0.00 0.00 0.00 0.00 0.00 0.00 0.00Water Rail 0.00 0.00 0.00 0.00 0.00 0.00 0.00 0.00 0.00 0.00 0.00 0.00 0.00 0.00 0.00 0.00 0.00 0.00 0.00 0.00Western Yellow-legged Gull 0.00 0.00 0.00 0.00 0.00 0.00 0.00 0.00 0.27 0.00 0.00 0.00 0.00 0.00 0.00 0.31 0.02 1.02 0.04 0.01Whimbrel 0.00 0.00 0.00 0.00 0.00 0.00 0.00 0.00 0.00 0.00 0.00 0.00 0.00 0.00 0.00 0.00 0.00 0.00 0.00 0.00Whiskered Tern 0.00 0.00 0.00 0.00 0.00 0.00 0.00 0.00 0.00 0.00 0.00 0.00 0.00 0.00 0.00 0.00 0.00 0.02 0.38 0.00White Stork 0.00 0.00 0.00 0.00 0.00 0.00 0.00 0.00 0.00 0.00 0.00 0.00 0.00 0.00 0.00 0.00 0.00 0.00 0.32 0.00White-headed Duck 0.00 0.00 0.00 0.00 0.00 0.00 0.00 0.00 0.00 0.00 0.00 0.00 0.00 0.00 0.00 0.00 0.00 0.04 4.49 0.00Whooper Swan 0.10 0.71 0.00 0.00 0.34 0.13 0.01 0.00 0.00 0.00 0.11 0.00 0.80 0.01 0.02 0.00 0.00 0.00 0.00 0.00Yellow-legged Gull 0.00 0.00 0.00 0.00 0.00 0.00 0.00 0.00 0.32 0.00 0.00 0.00 0.00 0.00 0.00 0.11 0.00 0.56 0.00 0.00No. spp at 1% 7.00 2.00 5.00 2.00 1.00 6.00 2.00 1.00 2.00 1.00 3.00 1.00 2.00 7.00 9.00 1.00 3.00 1.00 13.00 1.00WCV score 32.15 8.26 20.81 31.20 7.52 23.39 7.20 7.83 14.62 14.16 66.83 14.26 26.86 41.56 65.85 1.66 6.31 8.86 79.31 8.87
Species
Wetlands International Site Code
84

Appendix 2.1 contd
NL
0016
9
NL
0014
0
NL
0014
9
NL
0013
4
NL
0023
2
DE
0279
9
DE
0280
0
DE
0280
1
DE
0280
2
DE
0280
3
DE
0280
4
DE
0280
5
DE
0280
6
NL
0013
9
IE00
555
BE
0102
6
NL
0001
4
CH
0014
6
Audouin's Gull 0.00 0.00 0.00 0.00 0.00 0.00 0.00 0.00 0.00 0.00 0.00 0.00 0.00 0.00 0.00 0.00 0.00 0.00Barnacle Goose 0.00 0.00 0.00 0.00 0.00 0.24 0.01 0.59 0.01 0.96 0.61 0.58 1.26 0.00 0.00 0.06 6.20 0.00Bar-tailed Godwit 0.11 0.17 0.00 21.29 0.00 1.35 1.76 0.64 0.07 0.00 0.11 0.01 0.14 0.79 0.62 0.00 0.00 0.00Bean Goose 0.00 0.00 0.00 0.00 0.00 0.00 0.14 0.04 0.04 0.00 0.00 0.00 0.01 0.00 0.00 0.02 0.00 0.01Bewick's Swan 0.00 0.00 0.00 0.00 0.00 0.05 0.00 0.06 0.00 0.01 0.09 0.04 0.01 0.00 0.66 0.00 0.00 0.00Black-crowned Night-heron 0.00 0.00 0.00 0.00 0.00 0.00 0.00 0.00 0.00 0.00 0.00 0.00 0.00 0.00 0.00 0.00 0.00 0.00Black-headed Gull 0.02 0.05 0.20 0.36 0.00 0.01 0.01 0.01 0.00 0.01 0.02 0.01 0.01 0.12 0.05 0.00 0.00 0.35Black-legged Kittiwake 0.00 0.00 0.00 0.00 0.00 0.00 0.00 0.00 0.00 0.00 0.00 0.00 0.00 0.00 0.00 0.00 0.00 0.00Black-necked Grebe 0.00 0.00 0.00 0.00 0.00 0.00 0.00 0.00 0.00 0.00 0.00 0.00 0.00 0.00 0.00 0.00 0.00 0.01Black-tailed Godwit 0.00 0.00 0.00 0.01 0.00 0.00 0.00 0.00 0.00 0.00 0.00 0.00 0.00 0.09 0.42 0.00 0.00 0.00Black-throated Diver 0.00 0.00 0.00 0.00 0.00 0.00 0.00 0.00 0.00 0.00 0.00 0.00 0.00 0.00 0.00 0.00 0.00 0.00Black-winged Stilt 0.00 0.00 0.00 0.00 0.00 0.00 0.00 0.00 0.00 0.00 0.00 0.00 0.00 0.00 0.00 0.00 0.00 0.00Caspian Gull 0.00 0.00 0.00 0.00 0.00 0.00 0.00 0.00 0.00 0.00 0.00 0.00 0.00 0.00 0.00 0.00 0.00 0.00Caspian Tern 0.00 0.00 0.00 0.00 0.00 0.00 0.00 0.00 0.00 0.00 0.00 0.00 0.00 0.00 0.00 0.00 0.00 0.00Cattle Egret 0.00 0.00 0.00 0.00 0.00 0.00 0.00 0.00 0.00 0.00 0.00 0.00 0.00 0.00 0.00 0.00 0.00 0.00Common Coot 0.09 0.01 0.32 0.14 0.00 0.00 0.00 0.01 0.00 0.00 0.00 0.01 0.00 0.01 0.00 0.00 0.00 0.47Common Crane 0.00 0.00 0.00 0.00 0.00 0.00 0.00 0.00 0.00 0.00 0.00 0.00 0.00 0.00 0.00 0.00 0.00 0.00Common Eider 0.00 0.00 0.00 0.00 124.36 6.46 5.11 3.10 2.58 2.68 0.67 0.62 0.07 0.00 0.00 0.00 0.00 0.02Common Greenshank 0.00 0.00 0.00 0.00 0.00 0.00 0.00 0.00 0.00 0.00 0.00 0.00 0.00 0.00 0.00 0.00 0.00 0.00Common Gull 0.01 0.08 0.03 1.28 0.00 0.05 0.07 0.03 0.01 0.10 0.06 0.03 0.03 0.04 0.01 0.00 0.00 0.02Common Pochard 0.14 0.10 0.73 0.06 0.00 0.02 0.00 0.04 0.00 0.00 0.01 0.01 0.00 0.01 0.02 0.00 0.00 0.44Common Redshank 0.01 0.10 0.00 3.20 0.00 0.09 0.14 0.12 0.04 0.08 0.06 0.04 0.02 0.21 0.07 0.00 0.00 0.00Common Sandpiper 0.00 0.00 0.00 0.00 0.00 0.00 0.00 0.00 0.00 0.00 0.00 0.00 0.00 0.00 0.00 0.00 0.00 0.00Common Scoter 0.00 0.00 0.00 0.00 0.04 0.02 0.00 0.00 0.01 0.00 0.00 0.00 0.00 0.00 0.00 0.00 0.00 0.00Common Shelduck 0.18 0.06 0.00 10.28 0.00 1.91 1.87 2.84 0.83 3.99 0.36 0.58 0.18 0.44 0.13 0.00 0.00 0.00Common Snipe 0.00 0.00 0.00 0.00 0.00 0.00 0.00 0.00 0.00 0.00 0.00 0.00 0.00 0.00 0.00 0.00 0.00 0.00Common Teal 0.04 0.04 0.02 0.29 0.00 0.04 0.01 0.05 0.00 0.00 0.00 0.02 0.01 0.12 0.08 0.00 0.00 0.01Curlew Sandpiper 0.00 0.00 0.00 0.00 0.00 0.00 0.00 0.00 0.00 0.00 0.00 0.00 0.00 0.00 0.00 0.00 0.00 0.00Dark-Bellied Brent Goose 0.00 0.00 0.00 0.00 0.00 0.13 0.16 0.18 0.06 0.04 0.01 0.01 0.01 0.00 0.54 0.01 0.00 0.00Dunlin 0.59 1.78 0.00 80.41 0.00 3.00 3.28 5.63 1.43 2.43 0.47 1.12 2.83 19.52 1.53 0.00 0.00 0.00Eurasian Bittern 0.02 0.00 0.05 0.03 0.00 0.00 0.00 0.00 0.00 0.00 0.00 0.02 0.00 0.02 0.00 0.00 0.00 0.02Eurasian Curlew 0.07 0.19 0.05 19.90 0.00 0.35 0.55 1.09 0.47 0.94 0.54 0.71 0.72 0.61 0.14 0.00 0.00 0.03Eurasian Golden Plover 0.03 0.03 0.01 0.76 0.00 0.03 0.08 0.03 0.02 0.01 0.00 0.01 0.01 0.26 0.57 0.00 0.00 0.00Eurasian Oystercatcher 0.13 0.28 0.00 19.56 0.00 0.60 1.28 1.49 1.24 1.13 0.48 0.32 0.41 1.11 0.03 0.00 0.00 0.00Eurasian Spoonbill 0.00 0.00 0.00 0.00 0.00 0.00 0.00 0.00 0.00 0.00 0.00 0.00 0.00 0.00 0.00 0.00 0.00 0.00Eurasian Wigeon 0.00 0.00 0.00 0.00 0.00 0.35 0.38 0.60 0.37 0.65 0.21 0.31 0.14 0.00 0.19 0.00 0.00 0.00Eurasian Woodcock 0.00 0.00 0.00 0.00 0.00 0.00 0.00 0.00 0.00 0.00 0.00 0.00 0.00 0.00 0.00 0.00 0.00 0.00European White-fronted Goose 0.00 0.00 0.00 0.00 0.00 0.00 0.00 0.00 0.00 0.00 0.00 0.00 0.00 0.00 0.00 0.00 0.00 0.00Ferruginous Duck 0.07 0.00 0.00 0.03 0.00 0.00 0.00 0.00 0.00 0.00 0.00 0.00 0.00 0.00 0.00 0.00 0.00 0.06Gadwall 0.00 0.00 0.00 0.00 0.00 0.01 0.00 0.08 0.00 0.00 0.03 0.01 0.00 0.00 0.03 0.00 0.00 0.23Glossy Ibis 0.00 0.00 0.00 0.00 0.00 0.00 0.00 0.00 0.00 0.00 0.00 0.00 0.00 0.00 0.00 0.00 0.00 0.00Goldeneye 0.32 0.17 0.00 0.13 0.00 0.03 0.00 0.11 0.00 0.02 0.02 0.04 0.00 0.00 0.02 0.00 0.00 0.05Goosander 0.01 0.00 0.02 0.23 0.00 0.01 0.00 0.01 0.00 0.00 0.01 0.01 0.00 0.00 0.00 0.00 0.00 0.07Great Black-backed Gull 0.01 0.11 0.00 0.55 0.00 0.02 0.01 0.01 0.01 0.01 0.02 0.01 0.02 0.04 0.01 0.00 0.00 0.00Great Cormorant 0.36 0.29 0.17 0.30 0.00 0.00 0.00 0.00 0.00 0.00 0.00 0.00 0.00 0.15 0.09 0.00 0.00 0.37Great Crested Grebe 0.08 0.04 0.03 0.08 0.00 0.00 0.00 0.00 0.00 0.00 0.00 0.00 0.00 0.06 0.02 0.00 0.00 0.39Great Northern Diver 0.02 0.03 0.00 0.02 0.00 0.00 0.00 0.00 0.00 0.00 0.00 0.00 0.00 0.02 0.33 0.00 0.00 0.03Great Ringed Plover 0.00 0.05 0.00 0.12 0.00 0.00 0.01 0.00 0.00 0.00 0.01 0.00 0.00 0.10 0.10 0.00 0.00 0.00Great White Egret 0.00 0.00 0.00 0.00 0.00 0.00 0.00 0.00 0.00 0.00 0.00 0.00 0.00 0.00 0.01 0.00 0.00 0.01Greater Flamingo 0.00 0.00 0.00 0.00 0.00 0.00 0.00 0.00 0.00 0.00 0.00 0.00 0.00 0.00 0.00 0.00 0.00 0.00Greater Scaup 0.00 0.52 0.00 7.24 0.00 0.00 0.00 0.00 0.00 0.01 0.00 0.01 0.00 0.00 0.07 0.00 0.00 0.00Greater White-fronted Goose 0.00 0.00 0.00 0.00 0.00 0.01 0.00 0.01 0.00 0.02 0.02 0.05 0.00 0.00 0.82 2.06 2.24 0.00Green Sandpiper 0.00 0.00 0.00 0.00 0.00 0.00 0.00 0.00 0.00 0.00 0.00 0.00 0.00 0.00 0.00 0.00 0.00 0.00Grey Heron 0.01 0.01 0.02 0.05 0.00 0.00 0.00 0.01 0.00 0.00 0.01 0.00 0.00 0.02 0.00 0.00 0.00 0.02Grey Plover 0.02 0.09 0.00 4.18 0.00 0.05 0.17 0.52 0.11 0.09 0.08 0.16 0.09 0.62 0.15 0.00 0.00 0.00Greylag Goose 0.00 0.00 0.00 0.00 0.00 0.11 0.06 0.06 0.01 0.02 0.17 0.07 0.13 0.00 0.00 1.18 0.07 0.00Herring Gull 0.02 0.65 0.01 3.32 0.00 0.22 0.10 0.21 0.05 0.12 0.11 0.06 0.08 0.74 0.00 0.00 0.00 0.00Kentish Plover 0.00 0.00 0.00 0.00 0.00 0.00 0.00 0.00 0.00 0.00 0.00 0.00 0.00 0.00 0.00 0.00 0.00 0.00Lesser Black-backed Gull 0.00 0.00 0.00 0.00 0.00 0.00 0.00 0.00 0.00 0.00 0.00 0.00 0.00 0.00 0.00 0.00 0.00 0.00Light-bellied Brent Goose 0.00 0.00 0.00 0.00 0.00 0.18 0.04 0.00 0.00 0.04 0.00 0.10 0.02 0.00 48.68 0.47 0.00 0.00Little Egret 0.00 0.00 0.00 0.00 0.00 0.00 0.00 0.00 0.00 0.00 0.00 0.00 0.00 0.01 0.01 0.00 0.00 0.00Little Grebe 0.01 0.00 0.00 0.03 0.00 0.00 0.00 0.00 0.00 0.00 0.00 0.00 0.00 0.01 0.01 0.00 0.00 0.06Little Gull 0.00 0.01 0.00 0.04 0.00 0.02 0.00 0.01 0.00 0.00 0.00 0.00 0.00 0.02 0.00 0.00 0.00 0.00Little Ringed Plover 0.00 0.00 0.00 0.00 0.00 0.00 0.00 0.00 0.00 0.00 0.00 0.00 0.00 0.00 0.00 0.00 0.00 0.00Little Stint 0.00 0.04 0.00 0.00 0.00 0.00 0.00 0.00 0.00 0.00 0.00 0.00 0.00 0.00 0.00 0.00 0.00 0.00Long-tailed Duck 0.00 0.00 0.00 0.00 0.00 0.00 0.00 0.00 0.00 0.00 0.00 0.00 0.00 0.00 0.00 0.00 0.00 0.00Mallard 0.42 0.03 0.19 1.83 0.00 0.14 0.11 0.23 0.07 0.28 0.24 0.25 0.21 0.75 0.03 0.00 0.00 0.14Marbled Teal 0.00 0.00 0.00 0.00 0.00 0.00 0.00 0.00 0.00 0.00 0.00 0.00 0.00 0.00 0.00 0.00 0.00 0.00Mediterranean Gull 0.00 0.00 0.00 0.00 0.00 0.00 0.00 0.00 0.00 0.00 0.00 0.00 0.00 0.00 0.00 0.00 0.00 0.00Moorhen 0.00 0.00 0.00 0.01 0.00 0.00 0.00 0.00 0.00 0.00 0.00 0.00 0.00 0.00 0.00 0.00 0.00 0.00Mute Swan 0.00 0.00 0.00 0.00 0.00 0.01 0.00 0.02 0.00 0.01 0.01 0.00 0.00 0.00 0.05 0.00 0.12 0.11Northern Lapwing 0.03 0.01 0.10 0.15 0.00 0.01 0.00 0.00 0.00 0.00 0.00 0.00 0.00 0.22 0.35 0.00 0.00 0.00Northern Pintail 0.32 0.81 0.07 11.25 0.00 0.52 0.14 0.23 0.00 0.15 0.10 0.33 0.24 4.72 0.10 0.00 0.00 0.00Northern Shoveler 0.13 0.06 0.08 1.30 0.00 0.32 0.09 0.26 0.00 0.05 0.09 0.06 0.01 0.11 0.04 0.00 0.00 0.03Pied Avocet 0.03 0.08 0.00 0.94 0.00 0.00 0.00 0.00 0.00 0.00 0.00 0.00 0.00 0.43 0.00 0.00 0.00 0.00Pink-footed Goose 0.00 0.00 0.00 0.00 0.00 0.05 0.03 0.02 0.00 0.00 0.00 0.00 0.00 0.00 0.00 4.00 0.08 0.00Purple Sandpiper 0.00 0.01 0.00 0.09 0.00 0.01 0.00 0.00 0.00 0.00 0.00 0.00 0.00 0.00 0.00 0.00 0.00 0.00Purple Swamphen 0.00 0.00 0.00 0.00 0.00 0.00 0.00 0.00 0.00 0.00 0.00 0.00 0.00 0.00 0.00 0.00 0.00 0.00Red Knot 0.03 0.02 0.00 11.26 0.00 0.27 0.70 0.87 0.16 0.11 0.04 0.01 0.01 0.32 0.05 0.00 0.00 0.00Red-breasted Merganser 0.06 0.10 0.00 0.51 0.00 0.00 0.00 0.02 0.00 0.00 0.00 0.00 0.00 0.07 0.08 0.00 0.00 0.00Red-crested Pochard 0.00 0.00 0.00 0.00 0.00 0.00 0.00 0.00 0.00 0.00 0.00 0.00 0.00 0.00 0.00 0.00 0.00 0.15Red-necked Grebe 0.00 0.01 0.00 0.00 0.00 0.00 0.00 0.00 0.00 0.00 0.00 0.00 0.00 0.00 0.00 0.00 0.00 0.01Red-throated Diver 0.00 0.00 0.00 0.00 0.00 0.00 0.00 0.00 0.00 0.01 0.00 0.00 0.00 0.00 0.00 0.00 0.00 0.00Ruddy Turnstone 0.01 0.08 0.00 2.39 0.00 0.03 0.03 0.12 0.08 0.01 0.01 0.01 0.00 0.31 0.03 0.00 0.00 0.00Ruff 0.00 0.00 0.00 0.01 0.00 0.00 0.00 0.00 0.00 0.00 0.00 0.00 0.00 0.00 0.00 0.00 0.00 0.00Sanderling 0.00 0.23 0.00 1.46 0.00 0.04 0.06 0.00 0.03 0.04 0.08 0.00 0.01 0.46 0.09 0.00 0.00 0.00Shag 0.00 0.00 0.00 0.00 0.00 0.00 0.00 0.00 0.00 0.00 0.00 0.00 0.00 0.00 0.00 0.00 0.00 0.00Slavonian Grebe 0.06 0.15 0.00 0.05 0.00 0.00 0.00 0.00 0.03 0.00 0.00 0.03 0.00 0.00 0.11 0.00 0.00 0.03Slender-billed Gull 0.00 0.00 0.00 0.00 0.00 0.00 0.00 0.00 0.00 0.00 0.00 0.00 0.00 0.00 0.00 0.00 0.00 0.00Smew 0.01 0.03 0.22 0.19 0.00 0.02 0.01 0.14 0.00 0.01 0.06 0.05 0.01 0.00 0.00 0.00 0.00 0.01Spotted Redshank 0.00 0.00 0.00 0.01 0.00 0.00 0.00 0.00 0.00 0.01 0.00 0.00 0.00 0.02 0.00 0.00 0.00 0.00Stone Curlew 0.00 0.00 0.00 0.00 0.00 0.00 0.00 0.00 0.00 0.00 0.00 0.00 0.00 0.00 0.00 0.00 0.00 0.00Taiga Bean Goose 0.00 0.00 0.00 0.00 0.00 0.00 0.00 0.00 0.00 0.00 0.00 0.00 0.00 0.00 0.00 0.09 0.00 0.00Temminck's Stint 0.00 0.00 0.00 0.00 0.00 0.00 0.00 0.00 0.00 0.00 0.00 0.00 0.00 0.00 0.00 0.00 0.00 0.00Tufted Duck 0.33 0.01 0.09 0.11 0.00 0.00 0.00 0.00 0.00 0.01 0.00 0.00 0.00 0.01 0.01 0.00 0.00 0.41Tundra Bean Goose 0.00 0.00 0.00 0.00 0.00 0.00 0.00 0.00 0.00 0.00 0.00 0.00 0.00 0.00 0.00 0.11 0.00 0.00Velvet Scoter 0.00 0.01 0.00 0.00 0.00 0.00 0.00 0.00 0.00 0.00 0.00 0.00 0.00 0.00 0.00 0.00 0.00 0.00Water Rail 0.00 0.00 0.00 0.00 0.00 0.00 0.00 0.00 0.00 0.00 0.00 0.00 0.00 0.00 0.00 0.00 0.00 0.00Western Yellow-legged Gull 0.00 0.00 0.00 0.00 0.00 0.00 0.00 0.00 0.00 0.00 0.00 0.00 0.00 0.00 0.00 0.00 0.00 0.01Whimbrel 0.00 0.00 0.00 0.00 0.00 0.00 0.00 0.00 0.00 0.00 0.00 0.00 0.00 0.00 0.00 0.00 0.00 0.00Whiskered Tern 0.00 0.00 0.00 0.00 0.00 0.00 0.00 0.00 0.00 0.00 0.00 0.00 0.00 0.00 0.00 0.00 0.00 0.00White Stork 0.00 0.00 0.01 0.00 0.00 0.00 0.00 0.00 0.00 0.00 0.00 0.00 0.00 0.00 0.00 0.00 0.00 0.00White-headed Duck 0.00 0.00 0.00 0.00 0.00 0.00 0.00 0.00 0.00 0.00 0.00 0.00 0.00 0.00 0.00 0.00 0.00 0.00Whooper Swan 0.00 0.00 0.00 0.00 0.00 0.12 0.03 0.09 0.04 0.02 0.02 0.19 0.00 0.00 0.14 0.00 0.01 0.00Yellow-legged Gull 0.00 0.00 0.00 0.00 0.00 0.00 0.00 0.00 0.00 0.00 0.00 0.00 0.00 0.00 0.00 0.00 0.00 0.00No. species at 1% level 0.00 1.00 0.00 16.00 1.00 4.00 5.00 5.00 3.00 4.00 0.00 1.00 2.00 3.00 2.00 3.00 2.00 0.00Total WCV score 3.81 6.54 2.43 205.47 124.39 16.92 16.48 19.62 7.82 14.09 4.83 5.88 6.68 32.58 56.54 7.99 8.71 3.61
Wetlands International Site Code
Species
85

MA
0002
2
CM
0000
7
NG
0000
1
MR
0000
5
GH
0000
3
MR
0001
2
MR
0001
5
CM
0002
3
CM
0002
6
NG
0001
1
BF
0000
6
MR
0001
9
NE
0003
3
NE
0003
5
NE
0003
8
MA
0014
7
MA
0014
8
SN
0001
9
SN
0002
5
SN
0002
6
GN
0001
0
CM
0005
5
African Darter 0.0 0.0 0.0 0.1 0.0 0.0 0.0 0.0 0.0 0.0 0.0 0.0 0.0 0.0 0.0 0.0 0.0 0.0 1.3 1.8 0.0 0.0African Openbill Stork 0.0 0.0 0.0 0.0 0.0 0.0 0.0 0.0 0.0 0.0 0.0 0.0 0.0 0.0 0.0 0.0 0.0 0.0 0.0 0.0 0.0 0.1African Purple Swamphen 0.0 0.0 0.0 0.0 0.0 2.2 0.1 0.0 0.0 0.0 13.3 0.7 0.0 0.0 0.0 0.0 0.0 0.0 0.3 0.0 0.0 0.0African Pygmy Goose 0.0 0.0 0.0 0.0 0.0 0.0 0.0 0.0 0.0 0.0 1.2 0.0 0.0 0.0 0.0 0.0 0.0 0.0 0.5 0.0 0.0 0.1African Sacred Ibis 0.0 0.2 0.0 0.0 0.0 0.0 0.0 0.0 0.0 0.0 0.2 0.0 0.0 0.0 0.0 0.0 0.0 0.0 0.0 0.0 0.0 0.1African Skimmer 0.0 0.0 0.0 0.0 0.0 0.0 0.0 0.0 0.0 0.0 0.0 0.0 0.0 0.0 0.0 0.0 0.0 0.0 0.0 0.0 1.7 0.0African Spoonbill 0.0 0.4 0.0 0.0 0.0 0.0 0.0 0.0 0.0 0.0 0.0 0.0 0.0 0.0 0.0 0.0 0.0 0.0 0.1 0.1 0.1 0.1Audouin's Gull 2.8 0.0 0.0 0.0 0.0 0.0 0.0 0.0 0.0 0.0 0.0 0.0 0.0 0.0 0.0 0.1 0.0 0.0 0.0 0.7 0.0 0.0Bar-tailed Godwit 1.3 0.0 0.0 0.0 0.0 0.0 0.0 0.0 0.0 0.0 0.0 0.0 0.0 0.0 0.0 0.0 0.0 0.0 0.0 1.1 0.4 0.0Black Heron 0.0 0.0 0.0 0.0 0.0 0.0 0.0 0.0 0.3 3.2 0.0 0.0 0.0 0.0 0.0 0.0 0.0 0.0 0.0 0.0 0.0 1.0Black Stork 0.0 0.0 0.0 1.2 0.0 0.0 1.1 0.0 0.0 0.0 0.0 5.5 0.0 0.0 0.0 0.0 0.0 0.4 0.3 0.0 0.0 0.0Black Tern 0.0 0.0 0.0 0.0 0.4 0.0 0.0 0.0 0.0 0.0 0.0 0.0 0.0 0.0 0.0 0.0 0.0 0.0 0.0 0.0 0.0 0.0Black-crowned Crane 0.0 0.0 0.0 0.1 0.0 0.0 0.0 0.0 0.0 0.0 0.1 1.7 0.0 0.0 0.0 0.0 0.0 0.4 0.5 0.0 0.0 0.8Black-crowned Night-heron 0.0 0.0 0.0 0.0 0.2 0.0 0.0 0.0 0.0 0.9 0.0 0.0 0.0 0.0 0.0 0.0 0.0 0.0 7.9 0.0 0.0 0.0Black-headed Gull 0.0 0.0 0.0 0.0 0.0 0.0 0.0 0.0 0.0 0.0 0.0 0.0 0.0 0.0 0.0 0.0 0.0 0.0 0.0 0.0 0.0 0.0Black-headed Heron 0.0 0.0 0.0 0.0 0.0 0.0 0.0 0.0 0.0 0.1 0.0 0.0 0.0 0.0 0.0 0.0 0.0 0.0 0.0 0.0 0.0 0.1Black-tailed Godwit 0.1 7.8 0.0 0.1 0.4 0.0 0.0 0.0 0.0 2.7 6.9 0.3 0.0 0.0 0.0 4.5 4.1 1.4 0.8 0.4 0.0 0.8Black-winged Stilt 0.0 0.2 0.3 0.2 2.6 0.3 0.2 0.1 0.0 0.5 4.4 6.6 0.0 0.0 0.0 0.1 0.1 0.1 0.3 0.8 1.6 0.1Caspian Tern 12.3 0.0 0.0 2.1 0.6 0.0 0.0 0.0 0.0 0.0 0.0 1.2 0.0 0.0 0.0 0.1 0.1 0.1 0.6 26.1 1.4 0.0Cattle Egret 0.0 0.1 0.5 0.0 0.0 0.3 0.6 0.1 2.8 0.9 1.2 0.4 0.0 0.1 0.0 0.1 0.0 0.0 0.0 1.4 0.0 2.3Comb Duck 0.0 0.5 1.2 0.0 0.0 0.2 0.3 0.1 0.8 0.1 2.7 0.4 0.0 0.0 0.0 0.0 0.0 0.3 2.7 0.0 0.0 0.1Common Coot 0.0 0.0 0.0 0.0 0.0 0.0 0.0 0.0 0.0 0.0 0.0 0.0 0.0 0.0 0.0 0.6 0.9 0.0 0.0 0.0 0.0 0.0Common Greenshank 0.0 0.0 0.1 0.0 1.0 0.0 0.0 0.0 0.0 0.0 0.0 0.0 0.0 0.0 0.0 0.0 0.0 0.0 0.0 0.4 0.0 0.0Common Moorhen 0.0 0.0 0.0 0.0 0.0 0.0 0.0 0.0 0.0 0.0 0.0 0.0 0.0 0.0 0.0 0.0 0.0 0.0 0.0 0.0 0.0 0.0Common Pochard 0.0 0.0 0.0 0.0 0.0 0.0 0.0 0.0 0.0 0.0 0.0 0.0 0.0 0.0 0.0 0.0 0.0 0.0 0.0 0.0 0.0 0.0Common Pratincole 0.0 0.0 0.0 0.4 0.5 0.0 0.0 0.0 5.3 0.0 1.7 17.3 0.0 0.0 0.0 0.0 0.0 0.1 0.0 0.1 0.0 0.0Common Redshank 0.1 0.0 0.0 0.0 0.0 0.0 0.0 0.0 0.0 0.0 0.0 0.1 0.0 0.0 0.0 0.2 0.1 0.0 0.0 1.6 0.2 0.0Common Ringed Plover 1.4 0.0 0.0 0.0 2.4 0.0 0.0 0.0 0.0 0.0 0.1 0.5 0.0 0.0 0.0 5.0 4.7 0.0 0.0 4.1 0.9 0.0Common Sandpiper 0.0 0.0 0.0 0.0 0.0 0.0 0.0 0.0 0.0 0.0 0.0 0.0 0.0 0.0 0.0 0.0 0.0 0.0 0.0 0.0 0.0 0.0Common Shelduck 0.0 0.0 0.0 0.0 0.0 0.0 0.0 0.0 0.0 0.0 0.0 0.0 0.0 0.0 0.0 2.6 2.1 0.0 0.0 0.0 0.0 0.0Common Snipe 0.0 0.0 0.0 0.0 0.0 0.0 0.0 0.0 0.0 0.0 0.0 0.0 0.0 0.0 0.0 0.0 0.0 0.0 0.0 0.0 0.0 0.0Common Teal 0.0 0.0 0.0 0.0 0.0 0.0 0.0 0.0 0.0 0.0 0.0 0.0 0.0 0.0 0.0 0.6 0.2 0.0 0.0 0.0 0.0 0.0Common Tern 0.0 0.0 0.0 0.0 0.4 0.0 0.0 0.0 0.0 0.0 0.0 0.0 0.0 0.0 0.0 0.0 0.0 0.0 0.0 0.1 0.1 0.0Common Whimbrel 0.0 0.0 0.0 0.0 0.0 0.0 0.0 0.0 0.0 0.0 0.0 0.0 0.0 0.0 0.0 0.0 0.0 0.0 0.0 0.8 0.1 0.0Curlew Sandpiper 0.0 0.0 0.0 0.0 1.8 0.0 0.0 0.0 0.0 0.0 0.0 0.0 0.0 0.0 0.0 0.1 0.0 0.0 0.0 2.2 1.3 0.0Dunlin 0.5 0.0 0.0 0.0 0.0 0.0 0.0 0.0 0.0 0.0 0.0 0.0 0.0 0.0 0.0 3.0 1.3 0.0 0.0 0.1 0.0 0.0Egyptian Goose 0.0 0.0 0.0 0.2 0.0 0.0 0.1 0.0 0.0 0.0 0.3 0.0 0.0 0.0 0.0 0.0 0.0 1.0 0.9 0.0 0.0 0.0Eurasian Curlew 0.0 0.0 0.0 0.0 0.0 0.0 0.0 0.0 0.0 0.0 0.0 0.0 0.0 0.0 0.0 0.0 0.0 0.0 0.0 0.2 0.0 0.0Eurasian Golden Plover 0.0 0.0 0.0 0.0 0.0 0.0 0.0 0.0 0.0 0.0 0.0 0.0 0.0 0.0 0.0 0.3 0.1 0.0 0.0 0.0 0.0 0.0Eurasian Oystercatcher 0.1 0.0 0.0 0.0 0.0 0.0 0.0 0.0 0.0 0.0 0.0 0.0 0.0 0.0 0.0 0.0 0.0 0.0 0.0 0.5 0.0 0.0Eurasian Spoonbill 0.3 0.0 0.0 4.5 0.0 0.0 0.7 0.0 0.0 0.0 0.0 0.0 0.0 0.0 0.0 0.3 0.3 0.3 3.8 3.9 0.0 0.0Eurasian Wigeon 0.0 0.0 0.0 0.0 0.0 0.0 0.0 0.0 0.0 0.0 0.0 0.0 0.0 0.0 0.0 6.2 4.6 0.0 0.0 0.0 0.0 0.0Fulvous Duck 0.0 0.2 0.1 0.1 0.9 0.0 0.0 0.0 0.0 0.1 3.9 1.1 75.1 29.3 0.0 0.0 0.0 0.1 1.9 0.0 0.0 0.0Gadwall 0.0 0.0 0.0 0.0 0.0 0.0 0.0 0.0 0.0 0.0 0.0 0.0 0.0 0.0 0.0 0.1 0.2 0.0 0.0 0.0 0.0 0.0Garganey 0.0 4.3 1.2 0.1 0.0 0.3 0.7 0.9 11.7 8.3 1.1 1.8 0.0 0.0 0.0 0.0 0.0 0.1 4.4 0.0 0.0 0.1Glossy Ibis 0.0 0.2 0.0 0.0 0.0 0.0 0.0 0.0 0.2 0.2 0.2 0.1 0.0 0.0 0.0 0.0 0.0 0.0 0.0 0.0 0.0 0.0Great Snipe 0.0 0.0 0.0 0.0 0.0 0.0 0.0 0.0 0.0 0.0 0.0 0.0 0.0 0.0 0.0 0.0 0.0 0.0 0.0 0.0 0.0 0.0Great White Egret 0.0 0.0 0.1 0.1 0.1 0.0 0.0 0.0 0.3 0.2 0.0 0.0 0.0 0.0 0.0 0.0 0.0 0.0 0.1 0.1 0.1 0.3Great White Pelican 0.0 0.0 0.0 10.8 0.0 0.0 0.2 0.0 0.0 0.0 0.0 0.0 0.0 0.0 0.0 0.0 0.0 0.5 19.4 0.1 0.2 0.1Greater Flamingo 2.1 0.0 0.0 16.4 0.0 0.0 0.0 0.0 0.0 0.0 0.0 0.0 0.0 0.0 0.0 1.1 1.8 0.7 21.2 4.4 0.7 0.0Green Sandpiper 0.0 0.0 0.0 0.0 0.0 0.0 0.0 0.0 0.0 0.0 0.0 0.0 0.0 0.0 0.0 0.0 0.0 0.0 0.0 0.0 0.0 0.0Green-backed Heron 0.0 0.0 0.3 0.0 0.0 0.0 0.0 0.0 0.0 0.0 0.0 0.0 0.0 0.0 0.0 0.0 0.0 0.0 0.0 0.0 0.0 0.0Grey Heron 0.0 0.0 0.0 0.0 0.1 0.0 0.0 0.0 0.0 0.0 0.1 0.0 0.0 0.0 0.0 0.0 0.0 0.0 0.0 0.1 0.0 0.0Grey Plover 0.8 0.0 0.0 0.0 0.2 0.0 0.0 0.0 0.0 0.0 0.0 0.0 0.0 0.0 0.0 2.2 0.8 0.0 0.0 1.6 0.2 0.0Grey-headed Gull 0.0 0.0 0.1 0.4 0.0 0.0 0.0 0.0 0.8 0.2 0.0 0.0 0.0 0.0 0.0 0.0 0.0 0.0 0.0 8.6 1.1 0.3Greylag Goose 0.0 0.0 0.0 0.0 0.0 0.0 0.0 0.0 0.0 0.0 0.0 0.0 0.0 0.0 0.0 1.3 1.5 0.0 0.0 0.0 0.0 0.0Gull-billed Tern 0.0 0.0 0.0 0.7 0.4 0.0 0.0 0.0 0.0 0.0 0.0 0.0 0.0 0.0 0.0 0.0 0.0 0.0 0.0 1.8 1.6 0.0Intermediate Egret 0.0 0.0 0.0 0.0 0.0 0.0 0.0 0.0 0.0 0.0 0.1 0.0 0.0 0.0 0.0 0.0 0.0 0.0 0.0 0.0 0.0 0.0Kentish Plover 2.9 0.0 0.0 0.0 0.0 0.0 0.0 0.0 0.0 0.0 0.0 0.0 0.0 0.0 0.0 6.3 12.4 0.4 0.0 3.5 0.0 0.0Kittlitz's Plover 0.0 0.0 0.0 0.0 0.8 0.0 0.0 0.0 0.0 0.0 0.6 0.5 0.0 0.0 0.0 0.0 0.0 0.1 0.1 0.5 0.0 0.0Lesser Black-backed Gull 3.6 0.0 0.0 0.0 0.0 0.0 0.0 0.0 0.0 0.0 0.0 0.0 0.0 0.0 0.0 0.2 0.1 0.0 0.0 0.9 0.0 0.0Lesser Flamingo 0.0 0.0 0.0 6.5 0.0 0.0 0.0 0.0 0.0 0.0 0.0 0.0 0.0 0.0 0.0 0.0 0.0 2.0 2.5 0.0 45.0 0.0Little Egret 0.0 0.0 0.3 0.2 1.8 0.0 0.1 0.0 0.0 0.8 0.0 0.0 0.1 0.0 0.0 0.1 0.0 0.0 0.1 1.6 0.1 0.3Little Grebe 0.0 0.0 0.0 0.0 0.0 0.0 0.0 0.0 0.0 0.0 0.0 0.1 0.0 0.0 0.0 0.1 0.0 0.0 0.1 0.0 0.0 0.0Little Ringed Plover 0.0 0.0 0.0 0.0 0.0 0.0 0.0 0.0 0.0 0.0 0.1 0.6 0.0 0.0 0.0 0.0 0.0 0.0 0.0 0.2 0.0 0.0Little Stint 0.2 0.0 0.0 0.1 2.1 0.1 0.0 0.0 0.0 0.0 0.3 1.1 0.0 0.0 0.0 6.9 4.9 0.4 0.0 6.7 1.1 0.0Little Tern 0.0 0.0 0.0 0.1 1.7 0.0 0.0 0.0 0.0 0.0 0.0 0.0 0.0 0.0 0.0 0.0 0.0 0.0 0.0 0.9 1.2 0.0Mallard 0.0 0.0 0.0 0.0 0.0 0.0 0.0 0.0 0.0 0.0 0.0 0.0 0.0 0.0 0.0 0.2 0.0 0.0 0.0 0.0 0.0 0.0Marsh Sandpiper 0.0 0.0 0.0 0.0 0.8 0.0 0.0 0.0 0.0 0.0 0.4 0.2 0.0 0.0 0.0 0.0 0.0 0.1 0.0 0.1 0.0 0.0Northern Lapwing 0.0 0.0 0.0 0.0 0.0 0.0 0.0 0.0 0.0 0.0 0.0 0.0 0.0 0.0 0.0 0.1 0.0 0.0 0.0 0.0 0.0 0.0Northern Pintail 0.0 2.5 0.0 0.0 0.0 0.3 0.2 0.1 3.6 0.0 0.0 1.4 0.0 0.0 0.0 0.2 0.1 0.4 10.2 0.0 0.1 0.0Northern Shoveler 0.0 0.4 0.0 0.4 0.0 0.1 0.0 0.0 0.0 0.0 0.0 0.1 0.0 0.0 0.0 1.5 0.7 0.1 1.7 0.0 0.0 0.0Pied Avocet 0.0 0.0 0.0 0.1 0.6 0.0 0.0 0.0 0.0 0.0 0.0 0.0 0.0 0.0 0.0 9.0 5.4 0.2 0.1 3.3 0.8 0.0Pink-backed Pelican 0.0 0.0 0.0 0.0 0.2 0.0 0.0 0.0 0.0 0.0 0.0 0.0 0.0 0.0 0.0 0.0 0.0 0.0 0.0 2.1 0.1 0.0Purple Heron 0.0 0.1 0.7 0.1 0.1 0.0 0.1 0.0 0.2 0.4 0.5 0.1 0.1 0.0 0.0 0.0 0.0 0.0 1.2 0.1 0.0 0.1Red Knot 1.2 0.0 0.0 0.0 0.1 0.0 0.0 0.0 0.0 0.0 0.0 0.0 0.0 0.0 0.0 0.0 0.0 0.0 0.0 0.2 0.0 0.0Red-knobbed Coot 0.0 0.0 0.0 0.0 0.0 0.0 0.0 0.0 0.0 0.0 0.0 0.0 0.0 0.0 0.0 1.6 0.8 0.0 0.0 0.0 0.0 0.0Reed Cormorant 0.0 1.3 0.8 0.2 0.4 0.0 0.0 0.1 0.0 0.0 0.1 0.0 0.0 0.0 0.0 0.0 0.0 0.1 0.8 1.9 0.0 0.1Royal Tern 0.1 0.0 0.0 0.0 0.5 0.0 0.0 0.0 0.0 0.0 0.0 0.0 0.0 0.0 0.0 0.0 0.0 0.0 0.0 0.3 2.8 0.0Ruddy Turnstone 0.2 0.0 0.0 0.0 0.1 0.0 0.0 0.0 0.0 0.0 0.0 0.0 0.0 0.0 0.0 0.1 0.0 0.0 0.0 2.9 0.1 0.0Ruff 0.0 0.2 0.2 0.0 0.0 0.0 1.1 0.1 0.4 1.4 0.2 0.2 0.0 15.3 0.0 0.0 0.0 1.1 0.8 0.1 0.0 0.5Sanderling 2.1 0.0 0.0 0.0 0.7 0.0 0.0 0.0 0.0 0.0 0.0 0.1 0.0 0.0 0.0 0.1 0.1 0.0 0.0 1.0 0.2 0.0Sandwich Tern 0.2 0.0 0.0 0.0 0.7 0.0 0.0 0.0 0.0 0.0 0.0 0.0 0.0 0.0 0.0 0.0 0.0 0.0 0.0 1.1 0.2 0.0Senegal Thick-knee 0.0 0.0 0.2 0.3 0.0 0.0 0.1 0.0 0.0 0.0 0.1 0.0 0.0 0.0 0.0 0.0 0.0 0.0 0.1 2.1 0.0 0.0Slender-billed Gull 0.2 0.0 0.0 0.2 0.0 0.0 0.0 0.0 0.0 0.0 0.0 0.0 0.0 0.0 0.0 0.1 0.0 0.1 0.0 33.1 0.0 0.0Spotted Redshank 0.0 0.0 0.0 0.1 3.3 0.0 0.0 0.0 0.0 0.0 0.1 0.1 0.0 0.0 0.0 0.0 0.0 0.0 0.1 0.0 0.0 0.0Spur-winged Goose 0.0 0.0 0.1 0.0 0.0 0.2 0.2 0.0 2.5 0.1 6.5 1.7 0.0 0.0 0.0 0.0 0.0 0.2 0.8 0.0 0.0 1.3Spur-winged Plover 0.0 0.0 0.0 0.0 0.0 0.0 0.0 0.0 0.0 0.0 0.2 0.1 0.1 0.1 0.0 0.0 0.0 0.0 0.0 0.3 0.0 0.0Squacco Heron 0.0 2.3 7.5 0.2 3.6 0.1 0.8 0.4 10.0 129.5 2.6 0.1 11.4 0.4 0.0 0.0 0.0 0.4 2.3 0.0 0.0 185.2Temminck's Stint 0.0 0.0 0.0 0.0 0.0 0.0 0.0 0.0 0.0 0.0 0.0 0.2 0.0 0.0 0.0 0.0 0.0 0.0 0.0 0.0 0.0 0.0Tufted Duck 0.0 0.0 0.0 0.0 0.0 0.0 0.0 0.0 0.0 0.0 0.0 0.0 0.0 0.0 0.0 0.0 0.0 0.0 0.0 0.0 0.0 0.0Western Reef Egret 0.0 0.0 0.0 0.0 0.3 0.0 0.0 0.0 0.0 0.0 0.0 0.0 0.0 0.0 0.0 0.0 0.0 0.0 0.0 1.5 0.0 0.0Whiskered Tern 0.0 0.0 0.0 0.3 0.2 0.2 0.0 0.0 0.0 0.0 0.0 1.7 0.0 0.0 0.0 0.1 0.1 0.1 0.0 0.0 0.0 0.0White Stork 0.0 0.0 0.0 0.0 0.0 0.0 0.1 0.0 0.0 0.0 0.0 0.0 0.0 0.0 0.0 0.0 0.0 0.0 0.0 0.0 0.0 1.0White-breasted Cormorant 1.6 0.0 0.0 1.4 0.0 0.0 0.1 0.0 0.0 0.0 0.0 0.0 0.0 0.0 0.0 0.1 0.0 0.0 6.9 2.0 0.0 0.0White-faced Duck 0.0 3.7 3.9 0.1 3.0 2.7 0.1 0.5 0.4 0.4 4.9 3.6 65.8 18.0 5.3 0.0 0.0 0.1 14.6 0.0 1.2 0.6White-fronted Plover 0.0 0.0 0.0 0.0 0.2 0.0 0.0 0.0 0.0 0.0 0.0 0.0 0.0 0.0 0.0 0.0 0.0 0.0 0.0 2.4 0.4 0.0Wood Sandpiper 0.0 0.0 0.0 0.0 0.0 0.0 0.0 0.0 0.0 0.0 0.1 0.0 0.0 0.0 0.0 0.0 0.0 0.0 0.0 0.0 0.0 0.0Yellow-billed Stork 0.0 0.0 0.0 0.0 0.0 0.0 0.0 0.0 0.0 0.0 0.0 0.0 0.0 0.0 0.0 0.0 0.0 0.0 0.4 0.0 0.0 0.1No. species at 1% level 10 6 4 7 10 2 2 0 6 5 12 12 3 3 1 13 10 3 15 26 11 5Total WCV score 34.6 24.4 17.7 48.1 33.6 7.1 6.9 2.5 39.5 149.8 54.3 50.0 152.6 63.1 5.3 55.1 47.9 11.5 110.5 131.6 65.0 195.8
Wetlands International Site Code
Appendix 2.2 Matrix of mean Waterbird Conservation Value (WCV) scores for 22 sites and 99 waterbird species in western Africa during January. Data on which the scores are based were sourced from International Waterbird Census database, Wetlands International (T. Langedoen in litt.).
Species
86

BW
0005
6
NA
0003
1
NA
0003
3
NA
0003
4
BW
0008
1
BW
0009
4
NA
0004
1
ZA
0042
9
NA
0004
6
ZA
0001
9
ZA
0046
9
African Black Oystercatcher 0.00 0.00 0.17 0.00 0.00 0.00 0.35 0.00 1.61 0.40 0.00
African Darter 0.00 0.00 0.00 0.00 0.00 0.00 0.00 0.00 0.00 0.00 0.05
African Sacred Ibis 0.00 0.00 0.00 0.00 0.00 0.00 0.00 0.00 0.00 0.06 0.06
African Spoonbill 0.70 0.00 0.00 0.00 0.00 0.04 0.00 0.00 0.00 0.03 0.09
Bar-tailed Godwit 0.00 0.00 0.11 0.00 0.00 0.00 0.00 0.00 0.11 0.09 0.00
Black Tern 0.00 0.00 0.04 1.38 0.00 0.00 0.30 0.00 1.48 0.00 0.00
Black-necked Grebe 0.00 0.00 0.09 0.00 0.00 0.00 4.64 0.00 15.10 0.00 0.25
Blacksmith Lapwing 0.00 0.00 0.00 0.00 0.00 0.01 0.00 0.05 0.00 0.00 0.02
Black-tailed Godwit 0.00 0.00 2.40 0.00 0.00 0.00 0.00 0.00 0.00 0.00 0.00
Black-winged Pratincole 0.08 0.00 0.00 0.00 0.00 0.00 0.00 104.79 0.00 0.00 0.00
Black-winged Stilt 1.71 0.00 0.00 0.00 0.07 0.16 0.21 0.07 0.64 0.14 1.22
Cape Cormorant 0.00 0.00 15.52 0.51 0.00 0.00 17.72 0.00 2.44 0.10 0.59
Cape Shoveler 0.02 0.02 0.04 0.00 0.00 0.00 0.04 0.12 0.07 0.00 0.11
Cape Teal 0.16 0.15 0.12 0.00 0.00 0.23 0.18 0.02 0.56 0.00 0.14
Caspian Tern 2.91 6.20 1.65 0.00 0.07 0.33 0.13 2.18 4.04 0.69 3.01
Cattle Egret 0.00 0.00 0.00 0.00 0.00 0.01 0.00 0.05 0.00 0.00 0.00
Chestnut-banded Sandplover 4.08 10.08 5.15 0.00 0.07 0.00 0.37 0.00 23.59 0.33 0.77
Common Greenshank 0.03 0.00 0.01 0.00 0.00 0.00 0.01 0.00 0.06 0.16 0.11
Common Moorhen 0.00 0.00 0.00 0.00 0.00 0.00 0.00 0.00 0.02 0.00 0.00
Common Pratincole 0.00 0.00 0.00 0.00 0.00 0.08 0.00 0.00 0.00 0.00 0.00
Common Ringed Plover 0.02 0.00 0.14 0.00 0.00 0.00 0.00 0.00 0.33 0.16 0.07
Common Tern 0.00 0.00 14.69 0.00 0.00 0.00 0.00 0.00 1.53 0.16 0.07
Common Whimbrel 0.00 0.00 0.02 0.00 0.00 0.00 0.00 0.00 0.00 0.07 0.00
Crested Tern (Swift tern) 0.00 0.00 1.06 0.00 0.00 0.00 0.49 0.00 3.89 1.28 1.04
Curlew Sandpiper 0.02 15.67 9.58 0.06 0.00 0.00 0.44 0.00 5.93 5.06 1.12
Damara Tern 0.00 0.84 0.65 0.03 0.00 0.00 0.12 0.00 1.82 0.00 0.00
Egyptian Goose 0.00 0.00 0.00 0.00 0.00 0.00 0.00 0.88 0.01 0.01 0.06
Eurasian Curlew 0.00 0.00 0.00 0.00 0.00 0.00 0.00 0.00 0.00 0.17 0.02
Eurasian Golden Plover 0.00 0.00 0.00 0.00 0.00 0.00 0.00 0.00 0.20 0.00 0.00
Fulvous Whistling Duck 0.00 0.00 0.00 0.00 0.00 0.14 0.00 0.01 0.00 0.00 0.00
Glossy Ibis 0.00 0.00 0.00 0.00 0.00 0.00 0.00 0.02 0.00 0.00 0.00
Great Crested Grebe 0.00 0.00 0.00 0.00 0.00 0.00 0.00 0.00 0.00 0.00 0.11
Great White Pelican 4.15 1.08 1.25 0.07 0.04 7.81 0.04 0.01 2.42 0.19 0.51
Greater Flamingo 3.14 19.13 5.78 1.45 6.58 78.86 1.63 0.00 20.06 0.73 1.48
Grey Heron 0.01 0.00 0.00 0.00 0.00 0.00 0.00 0.00 0.00 0.00 0.01
Grey Plover 0.00 0.00 0.30 0.00 0.00 0.00 0.03 0.00 1.00 3.73 0.18
Grey-headed Gull 0.07 0.00 0.00 0.00 0.02 0.04 0.00 0.07 0.00 0.00 0.01
Hartlaub's Gull 0.00 0.00 0.21 0.01 0.00 0.00 1.53 0.00 2.27 1.65 1.80
Hottentot Teal 0.57 0.00 0.00 0.00 0.00 0.01 0.00 0.00 0.04 0.00 0.00
Kelp Gull 0.00 0.00 1.75 0.23 0.00 0.00 0.90 0.00 2.76 0.39 0.56
Kittlitz's Plover 0.90 0.00 0.00 0.00 0.22 0.02 0.00 0.84 0.06 1.14 3.63
Lesser Crested Tern 0.00 0.00 0.00 0.00 0.00 0.00 0.00 0.00 1.12 0.00 0.00
Lesser Flamingo 16.99 26.11 5.45 0.00 166.67 20.73 1.78 0.00 18.23 0.00 0.40
Little Egret 0.00 0.00 0.01 0.00 0.00 0.00 0.00 0.01 0.02 0.02 0.02
Little Grebe 0.00 0.00 0.00 0.00 0.00 0.00 0.00 0.00 0.00 0.00 0.02
Little Stint 0.08 3.47 0.79 0.02 0.00 0.00 0.04 0.00 0.43 0.04 0.11
Little Tern 0.00 0.00 0.00 0.00 0.00 0.00 0.00 0.00 0.00 0.02 0.03
Marsh Sandpiper 0.00 0.00 0.00 0.00 0.00 0.00 0.00 0.00 0.00 0.02 0.08
Pied Avocet 7.58 0.00 0.08 0.00 0.26 1.31 0.51 0.00 6.88 0.24 0.46
Red Knot 0.00 0.00 0.01 0.00 0.00 0.00 0.02 0.00 0.08 0.55 0.00
Red-billed Teal 0.03 0.00 0.00 0.00 0.00 0.06 0.00 0.01 0.00 0.00 0.00
Red-knobbed Coot 0.02 0.00 0.00 0.00 0.00 0.00 0.00 0.05 0.00 0.00 0.02
Reed Cormorant 0.00 0.00 0.00 0.00 0.00 0.01 0.00 0.00 0.00 0.00 0.01
Ruddy Turnstone 0.00 0.00 0.66 0.00 0.00 0.00 0.54 0.00 1.63 1.68 0.00
Ruff 0.02 0.00 0.00 0.00 0.00 0.00 0.00 0.00 0.00 0.00 0.01
Sanderling 0.00 14.12 4.35 0.00 0.00 0.00 0.09 0.00 5.74 1.27 0.02
Sandwich Tern 0.00 0.00 1.08 0.00 0.00 0.00 0.03 0.00 0.29 0.04 0.05
South African Shelduck 0.00 0.00 0.00 0.00 0.00 0.00 0.00 0.00 0.00 0.04 0.35
Spur-winged Goose 0.00 0.00 0.00 0.00 0.00 0.00 0.00 0.18 0.00 0.00 0.28
Three-banded Plover 0.00 0.00 0.00 0.00 0.00 0.00 0.00 0.00 0.00 0.00 0.02
Whiskered Tern 3.69 0.00 0.00 0.00 0.21 0.32 0.00 3.59 0.00 0.00 0.00
White-breasted Cormorant 0.60 0.00 5.49 0.25 0.00 0.00 2.73 0.50 5.10 0.14 2.08
White-fronted Plover 0.20 0.00 5.40 0.14 0.00 0.02 0.10 0.00 6.23 1.21 0.05
White-winged Tern 0.03 0.00 0.00 0.00 0.00 0.00 0.00 0.00 0.01 0.00 0.00
Yellow-billed Duck 0.00 0.00 0.00 0.00 0.00 0.02 0.00 0.25 0.00 0.07 0.32
No. species at 1% level 8.00 8.00 15.00 2.00 2.00 4.00 6.00 3.00 21.00 8.00 8.00
Total WCV Score 47.83 96.87 84.06 4.14 174.22 110.21 34.99 113.72 137.78 22.10 21.45
Appendix 2.3 Matrix of mean Waterbird Conservation Value (WCV) scores for 11 sites and 65 waterbird species in southern Africa during January. Data on which the scores are based were sourced from International Waterbird Census database, Wetlands International (T. Langedoenin litt. ).
Wetlands International Site Code
Species
87
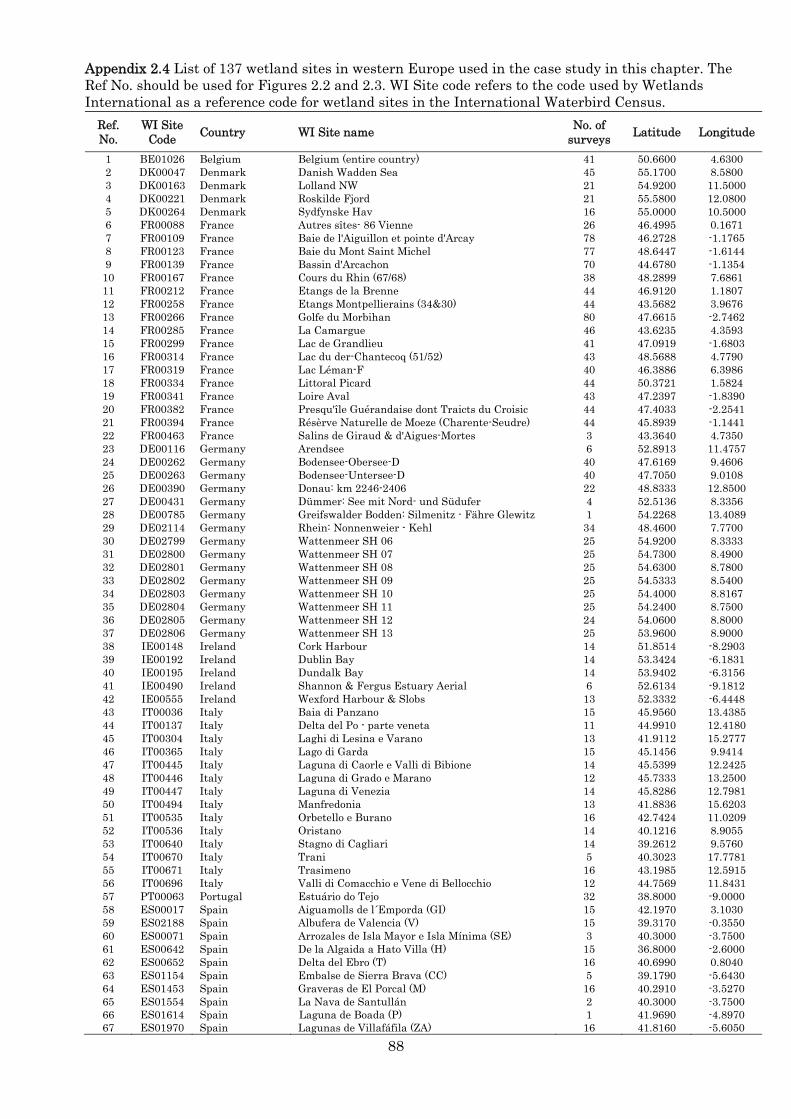
88
Appendix 2.4 List of 137 wetland sites in western Europe used in the case study in this chapter. The Ref No. should be used for Figures 2.2 and 2.3. WI Site code refers to the code used by Wetlands International as a reference code for wetland sites in the International Waterbird Census.
Ref. No.
WI Site Code Country WI Site name No. of
surveys Latitude Longitude
1 BE01026 Belgium Belgium (entire country) 41 50.6600 4.6300 2 DK00047 Denmark Danish Wadden Sea 45 55.1700 8.5800 3 DK00163 Denmark Lolland NW 21 54.9200 11.5000 4 DK00221 Denmark Roskilde Fjord 21 55.5800 12.0800 5 DK00264 Denmark Sydfynske Hav 16 55.0000 10.5000 6 FR00088 France Autres sîtes- 86 Vienne 26 46.4995 0.1671 7 FR00109 France Baie de l'Aiguillon et pointe d'Arcay 78 46.2728 -1.1765 8 FR00123 France Baie du Mont Saint Michel 77 48.6447 -1.6144 9 FR00139 France Bassin d'Arcachon 70 44.6780 -1.1354
10 FR00167 France Cours du Rhin (67/68) 38 48.2899 7.6861 11 FR00212 France Etangs de la Brenne 44 46.9120 1.1807 12 FR00258 France Etangs Montpellierains (34&30) 44 43.5682 3.9676 13 FR00266 France Golfe du Morbihan 80 47.6615 -2.7462 14 FR00285 France La Camargue 46 43.6235 4.3593 15 FR00299 France Lac de Grandlieu 41 47.0919 -1.6803 16 FR00314 France Lac du der-Chantecoq (51/52) 43 48.5688 4.7790 17 FR00319 France Lac Léman-F 40 46.3886 6.3986 18 FR00334 France Littoral Picard 44 50.3721 1.5824 19 FR00341 France Loire Aval 43 47.2397 -1.8390 20 FR00382 France Presqu'île Guérandaise dont Traicts du Croisic 44 47.4033 -2.2541 21 FR00394 France Résèrve Naturelle de Moeze (Charente-Seudre) 44 45.8939 -1.1441 22 FR00463 France Salins de Giraud & d'Aigues-Mortes 3 43.3640 4.7350 23 DE00116 Germany Arendsee 6 52.8913 11.4757 24 DE00262 Germany Bodensee-Obersee-D 40 47.6169 9.4606 25 DE00263 Germany Bodensee-Untersee-D 40 47.7050 9.0108 26 DE00390 Germany Donau: km 2246-2406 22 48.8333 12.8500 27 DE00431 Germany Dümmer: See mit Nord- und Südufer 4 52.5136 8.3356 28 DE00785 Germany Greifswalder Bodden: Silmenitz - Fähre Glewitz 1 54.2268 13.4089 29 DE02114 Germany Rhein: Nonnenweier - Kehl 34 48.4600 7.7700 30 DE02799 Germany Wattenmeer SH 06 25 54.9200 8.3333 31 DE02800 Germany Wattenmeer SH 07 25 54.7300 8.4900 32 DE02801 Germany Wattenmeer SH 08 25 54.6300 8.7800 33 DE02802 Germany Wattenmeer SH 09 25 54.5333 8.5400 34 DE02803 Germany Wattenmeer SH 10 25 54.4000 8.8167 35 DE02804 Germany Wattenmeer SH 11 25 54.2400 8.7500 36 DE02805 Germany Wattenmeer SH 12 24 54.0600 8.8000 37 DE02806 Germany Wattenmeer SH 13 25 53.9600 8.9000 38 IE00148 Ireland Cork Harbour 14 51.8514 -8.2903 39 IE00192 Ireland Dublin Bay 14 53.3424 -6.1831 40 IE00195 Ireland Dundalk Bay 14 53.9402 -6.3156 41 IE00490 Ireland Shannon & Fergus Estuary Aerial 6 52.6134 -9.1812 42 IE00555 Ireland Wexford Harbour & Slobs 13 52.3332 -6.4448 43 IT00036 Italy Baia di Panzano 15 45.9560 13.4385 44 IT00137 Italy Delta del Po - parte veneta 11 44.9910 12.4180 45 IT00304 Italy Laghi di Lesina e Varano 13 41.9112 15.2777 46 IT00365 Italy Lago di Garda 15 45.1456 9.9414 47 IT00445 Italy Laguna di Caorle e Valli di Bibione 14 45.5399 12.2425 48 IT00446 Italy Laguna di Grado e Marano 12 45.7333 13.2500 49 IT00447 Italy Laguna di Venezia 14 45.8286 12.7981 50 IT00494 Italy Manfredonia 13 41.8836 15.6203 51 IT00535 Italy Orbetello e Burano 16 42.7424 11.0209 52 IT00536 Italy Oristano 14 40.1216 8.9055 53 IT00640 Italy Stagno di Cagliari 14 39.2612 9.5760 54 IT00670 Italy Trani 5 40.3023 17.7781 55 IT00671 Italy Trasimeno 16 43.1985 12.5915 56 IT00696 Italy Valli di Comacchio e Vene di Bellocchio 12 44.7569 11.8431 57 PT00063 Portugal Estuário do Tejo 32 38.8000 -9.0000 58 ES00017 Spain Aiguamolls de l´Emporda (GI) 15 42.1970 3.1030 59 ES02188 Spain Albufera de Valencia (V) 15 39.3170 -0.3550 60 ES00071 Spain Arrozales de Isla Mayor e Isla Mínima (SE) 3 40.3000 -3.7500 61 ES00642 Spain De la Algaida a Hato Villa (H) 15 36.8000 -2.6000 62 ES00652 Spain Delta del Ebro (T) 16 40.6990 0.8040 63 ES01154 Spain Embalse de Sierra Brava (CC) 5 39.1790 -5.6430 64 ES01453 Spain Graveras de El Porcal (M) 16 40.2910 -3.5270 65 ES01554 Spain La Nava de Santullán 2 40.3000 -3.7500 66 ES01614 Spain Laguna de Boada (P) 1 41.9690 -4.8970 67 ES01970 Spain Lagunas de Villafáfila (ZA) 16 41.8160 -5.6050

89
Appendix 2.4 contd
Ref. No.
WI Site Code Country WI Site Name No. of
surveys Latitude Longitude
68 ES02018 Spain Los Pobres. Lucios de Beta La Plama (consolidated) 6 36.9270 -6.2380 69 ES02052 Spain Marisma de Hinojos (H) 14 36.9760 -6.3820 70 ES02068 Spain Marismas del P.N. Bahía de Cádiz (CA) 1 36.5333 -6.2667 71 ES02072 Spain Marismas P.N. Bahía de Cádiz 4 36.5333 -6.2667 72 ES02184 Spain Parque Nacional de Doñana (consolidation) 5 37.0110 -6.3520 73 ES02035 Spain Veta La Palma (SE) 15 36.9270 -6.2380 74 CH00021 Switzerland Bodensee-Obersee-CH 43 47.5828 9.3661 75 CH00022 Switzerland Bodensee-Untersee-CH 43 47.6778 9.0233 76 CH00074 Switzerland Lac de Neuchâtel 43 46.8956 6.8350 77 CH00079 Switzerland Lac Léman-CH 43 46.4719 6.6964 78 CH00135 Switzerland Vierwaldstättersee 43 47.0100 8.3986 79 CH00146 Switzerland Zürichsee 43 47.2231 8.7061 80 NL00194 The Netherlands BiesboschMON61 34 51.7658 4.7614 81 NL00141 The Netherlands Gelderse PoortMON08 34 51.8764 6.0191 82 NL00154 The Netherlands Gestuwde MaasMON21 34 51.7500 5.8021 83 NL00155 The Netherlands Getijde-beinvloede MaasMON22 34 51.7532 5.1731 84 NL00136 The Netherlands GrevelingenMON03 22 51.7367 3.9942 85 NL00168 The Netherlands HaringvlietMON35 34 51.7856 4.2063 86 NL00156 The Netherlands IJsselmeerMON23 34 52.7682 5.3769 87 NL00142 The Netherlands IJsselMON09 34 51.9947 6.0129 88 NL00202 The Netherlands KrimpenerwaardMON69 34 51.9538 4.7190 89 NL00157 The Netherlands MarkermeerMON24 34 52.5322 5.2122 90 NL00153 The Netherlands Midden-Limburgse MaasplassenMON20 34 51.1540 5.9132 91 NL00233 The Netherlands Noordzee benoorden de WaddenSEA02 27 53.4889 5.6077 92 NL00135 The Netherlands Noordzee benoorden WaddenMON02 34 53.4200 5.3358 93 NL00137 The Netherlands OosterscheldeMON04 22 51.5825 3.9512 94 NL00222 The Netherlands other sites in FrieslandMONFR 34 52.8126 5.8886 95 NL00223 The Netherlands other sites in GelderlandMONGL 34 52.1969 5.7919 96 NL00224 The Netherlands other sites in GroningenMONGR 34 53.3170 6.7065 97 NL00226 The Netherlands other sites in Noord-BrabantMONNB 34 51.5463 5.1148 98 NL00227 The Netherlands other sites in Noord-HollandMONNH 34 52.3453 4.8915 99 NL00228 The Netherlands other sites in OverijsselMONOV 34 52.4136 6.4556
100 NL00229 The Netherlands other sites in UtrechtMONUT 34 52.0835 5.2107 101 NL00231 The Netherlands other sites in ZeelandMONZL 34 51.2788 3.7994 102 NL00230 The Netherlands other sites in Zuid-HollandMONZH 34 51.6826 4.3377 103 NL00169 The Netherlands VolkerakmeerMON36 34 51.6452 4.2828 104 NL00140 The Netherlands VoordeltaMON07 22 51.6054 3.6731 105 NL00149 The Netherlands Waal: Nijmegen - WaardenburgMON16 34 51.8987 5.5667 106 NL00134 The Netherlands WaddenzeeMON01 34 53.4303 5.9560 107 NL00232 The Netherlands WaddenzeeSEA01 27 53.4344 5.9791 108 NL00139 The Netherlands WesterscheldeMON06 22 51.3748 3.8977 109 NL00014 The Netherlands Wonseradeel en WorkumGSC114 136 52.9043 5.4432 110 GB00101 United Kingdom Alt Estuary 41 53.5167 -3.0500 111 GB00525 United Kingdom Blackwater Estuary: Total 44 51.7167 0.8000 112 GB00675 United Kingdom Breydon Water & Berney Marshes 43 52.6000 1.6833 113 GB01020 United Kingdom Chichester Harbour 43 50.7833 -0.9000 114 GB01364 United Kingdom Dee Estuary (England and Wales) 44 53.2667 -3.1000 115 GB01817 United Kingdom Forth Estuary 44 56.0000 -3.2667 116 GB02086 United Kingdom Hamford Water 5 51.8667 1.2333 117 GB02087 United Kingdom Hamford Water and Naze Combined 41 51.8667 1.2333 118 GB02329 United Kingdom Humber Estuary 44 53.5333 -0.1333 119 GB02369 United Kingdom Inner Moray and Inverness Firth 44 57.5333 -4.2000 120 GB02609 United Kingdom Langstone Harbour 44 50.8167 -1.0000 121 GB02674 United Kingdom Lindisfarne 44 55.6667 -1.8167 122 GB03356 United Kingdom Loughs Neagh & Beg 27 54.6167 -6.4167 123 GB03508 United Kingdom Medway Estuary 44 51.4000 0.6500 124 GB03535 United Kingdom Mersey Estuary 44 53.3000 -2.8167 125 GB03644 United Kingdom Morecambe Bay 44 54.1167 -2.9167 126 GB03790 United Kingdom North Norfolk Coast 44 52.9833 0.7500 127 GB03897 United Kingdom Ouse Washes 44 52.5167 0.2500 128 GB04224 United Kingdom Ribble Estuary 44 53.7167 -2.9167 129 GB04908 United Kingdom Severn Estuary 44 54.8000 -2.5000 130 GB05017 United Kingdom Solway Estuary 44 54.9167 -3.4000 131 GB05021 United Kingdom Somerset Levels 43 51.1500 -2.9833 132 GB05042 United Kingdom South Lancashire Mosses (Geese) 1 53.6167 -2.8833 133 GB05193 United Kingdom Stour Estuary 44 51.9333 1.1500 134 GB05205 United Kingdom Strangford Lough 38 54.5000 -5.6000 135 GB05261 United Kingdom Swale Estuary 44 51.3500 0.8333 136 GB05353 United Kingdom Thames Estuary 44 51.4833 0.5667 137 GB05382 United Kingdom The Wash 43 52.9333 0.3000

90
Appendix 2.5 List of 22 wetland sites in western Africa used in the case study in this chapter. The Ref No. should be used for Figures 2.2 and 2.3. WI Site code refers to the code used by Wetlands International as a reference code for wetland sites in the International Waterbird Census.
Ref. No.
WI Site Code Country WI Site Name No. of
surveys Latitude Longitude
138 BF00006 Burkina Faso Lake Oursi-Lake Darkoye 1 0.0800 14.7000 139 CM00007 Cameroon Bas Chari (Cameroun) 2 12.6353 14.8061 140 CM00023 Cameroon Lac Tchad - quadrat 101 1 12.3333 14.5000 141 CM00026 Cameroon Lac Tchad (Cameroon) 1 12.8371 14.2936 142 CM00055 Cameroon Waza Logone Floodplain 2 11.0184 14.7343 143 GH00003 Ghana Keta Lagoon complex 11 5.8996 0.9085 144 GN00010 Guinea Vasieres de Khonibenki et Yongo Sale 4 10.4391 -14.5507 145 MR00005 Mauritania Bell 4 16.3272 -16.3839 146 MR00012 Mauritania Lac d Aleg 1 17.0833 -13.9833 147 MR00015 Mauritania Lac Rkiz 3 16.8459 -15.3064 148 MR00019 Mauritania Mahmouda 2 16.3660 -7.6870 149 MA00022 Morocco Baie d'Ad Dakhla 5 23.6500 -15.8700 150 MA00147 Morocco Merja Zerga plus Roosts 17 34.8000 -6.3000 151 MA00148 Morocco Merja Zerga: Kenitra 20 34.8000 -6.3000 152 NE00033 Niger Mare de Albarkaize 2 12.0842 3.2265 153 NE00035 Niger Mare de Dole 2 14.1756 11.1799 154 NE00038 Niger Mare de Guiwana 1 13.5164 2.1157 155 NG00001 Nigeria Baturiya Complex 3 12.3372 10.1561 156 NG00011 Nigeria Lac Tchad/Nigeria 1 12.9159 13.9506 157 SN00019 Senegal Ndiael 25 16.2333 -16.0833 158 SN00025 Senegal Parc National des Oiseaux du Djoudj 5 16.4167 -16.2500 159 SN00026 Senegal Parc National du Delta du Saloum 2 13.6331 -16.5674

91
Appendix 2.6 List of 11 wetland sites in southern Africa used in the case study in this chapter. The Ref No. should be used for Figures 2.2 and 2.3. WI Site code refers to the code used by Wetlands International as a reference code for wetland sites in the International Waterbird Census.
Ref. No.
WI Site Code Country WI Site Name
No. of surveys Latitude Longitude
160 BW00056 Botswana Nata Sanctuary 13 -20.3333 26.0833 161 NA00031 Namibia Sandwich Harbour Total 4 -23.3580 14.4683 162 NA00033 Namibia Sandwich Harbour: southern wetlands 19 -23.4175 14.4625 163 NA00034 Namibia Sandwich Harbour: Western SandSpit 4 -23.4102 14.4353 164 BW00081 Botswana Sua Pan 4 -20.6565 25.9832 165 BW00094 Botswana Sua Spit Natural Reserve 3 -20.8133 25.4217 166 NA00041 Namibia Swakopmund Saltworks 12 -22.5888 14.5166 167 ZA00429 South Africa Vaal Dam: South 3 -27.0200 28.1800 168 NA00046 Namibia Walvis Bay Ramsar Site 27 -22.9943 14.4476 169 ZA00019 South Africa Berg River 18 -32.7788 18.1488 170 ZA00469 South Africa Langebaan Lagoon 32 -33.1409 18.0558

93
Chapter 3
Further applications of the Waterbird Conservation
Value score: visual analyses through time

94

95
Abstract
Analyses of waterbird census data has traditionally focussed on species composition and
abundance, particularly species reaching the 1% threshold levels. In this chapter I
explore additional aspects of the Waterbird Conservation Value (WCV) score using data
drawn from long-term waterbird surveys from four representative wetlands in the
winter-rainfall region of South Africa. Wetlands included two artificial sites (a sewerage
treatment works and farm dam), and two natural sites (coastal lakes). I use visual
analytics (colour-coded histograms and radar graphics) to explore how WCV score
outputs for each site provide ways in which to assess waterbird conservation priorities.
Assessments were based on species composition, priority species, and temporal
fluctuations and importance. Emphasis is placed on the visual assessment of patterns,
sporadic influxes and the conservation implications of the generated outputs. The overall
site conservation significance at a regional level is discussed in light of the flyway level
approach discussed in Chapter 1. The conservation assessments are then discussed in
light of the wetlands, their habitats and associated waterbird communities.
Recommendations are made to apply and refine the WCV score and associated graphical
outputs within the national waterbird monitoring programme in South Africa in order
assess waterbird conservation priorities in the country.
96
Introduction
The development of the Waterbird Conservation Value (WCV) score and a case study to
demonstrate its application were undertaken in Chapter 2. The case study provided
valuable insight into how this new method provided an improved waterbird
conservation assessment at a flyway level. But in what other ways can the WCV score
be considered and applied?
Tufte (1983) explored ways in which scientific data could be visually assessed. His
widely recognised book on the theory and design of data graphics showed that results
from large-scale and long-term data collection studies could be better interpreted when
presented graphically rather than using the standard tabular formats and statistical
procedures. Using visual outputs, Tufte (1983) formulated methods to display data for
precise, effective and quick communication analysis. His basic principles cover aspects
such as efficient design, content rich data representations and the presentation of
information in a non-redundant way. Application of data visualization is also used in
other sectors. Centrifuge Systems Inc. (http://www.centrifugesystems.com/), a fraud
analysis and cyber security company, supports Tufte’s (1983) concepts and has employed
interactive data visualization in their system analyses. Their outputs have provided
valuable tools combining agile data integration, dynamic relationship mapping, and
interactive visual analytics to reveal insights in big data (Centrifuge Systems 2008,
2012). Using visualizations and link intelligence, Centrifuge Systems analysts have
improved fraud detection and pharmaceutical risk analyses (Centrifuge Systems 2008).
This chapter explores additional aspects of the WCV score using data from
waterbird counts from selected wetlands in the Western Cape, South Africa. The
primary focus is on the use of graphical outputs to assess priority species, temporal
importance and fluctuations, and determine overall site conservation significance.
Emphasis will be on the visual assessment of patterns and the conservation implications
of the generated outputs. The conservation assessments are then discussed in light of
the wetlands, their habitats and associated waterbird communities.
Methods
Four wetland sites were selected from the Western Cape, South Africa, to illustrate the
analyses: Rocher Pan, Droëvlei Dam, Paarl Waste Water Treatment Works and De
Hoop Vlei (Figure 1.4 in Chapter 1). These sites were selected based on (a) their
geographic location in the winter rainfall region of South Africa, (b) their different
inundation patters and (c) the availability of long-term, monthly waterbird surveys

97
which had been undertaken at each site. The winter rainfall region is described in
Chapter 1. To meet the objectives of this chapter, the results presented here are a
synthesis of relevant outputs of detailed analyses for each site (Appendices A, B, C
and D).
Waterbird census data for the five selected sites were sourced from the
Coordinated Waterbird Counts programme (CWAC, Animal Demography Unit, unpubl.
data) and from CapeNature, the provincial conservation authority in the Western Cape
Province. At each site, a minimum of 10 years census period was selected for each site:
Rocher Pan (September 1985–June 2004), Droëvlei Dam (November 1982–March 1990),
Paarl Waste Water Treatment Works (May 1994–June 2004) and De Hoop Vlei (June
1984–September 2006).
WCV scores were calculated as described in Chapter 2. However, the scores were
computed for each monthly survey, rather than on averaged data, as in Chapter 2.
Seasonal scores were also computed to provide a measure of the conservation
importance of the site during summer and winter. For the winter rainfall region, I
defined summer as October–March and winter as April–September (Chapter 1).
Priority species were determined for each site based on WCV scores. Scores equal or
greater to 1 were identified as globally important (Ramsar and Global IBA) species and
scores greater or equal to 0.5 but less than 1 as regionally important (Sub-regional IBA)
species; the latter was identified as a criterion for designating southern Africa sub-
regional IBAs (Barnes 1998).
Results for the WCV score analyses are presented graphically in the form of
colour-coded histograms and radar plots. Generalised linear models (GLMs) were used
to determine the relationship between the WCV score and proportion of 1% threshold
species and total abundance. Scatterplots were used to display the results graphically.
Discussion of the results are dealt with under each result heading and not separately
after presentation of the results; this was done to help provide clarity for each of the
results obtained.
Results and discussion
Monthly WCV scores and priority species
The monthly WCV scores and species contributions to the WCV score for each site are
given in Figures 3.1, 3.2, 3.3 and 3.4. Scores generally fluctuated widely at all sites
between months and between years. The largest mean WCV score was recorded at De
Hoop Vlei (6.49) with Droëvlei Dam recording the smallest mean WCV score (1.01)
(Table 3.1). The WCV scores at Rocher Pan showed a strong seasonal pattern

98
(Figure 3.1); none of the other sites’ scores revealed any seasonality of occurrence.
Rocher Pan is an ephemeral wetland with annual wet/dry periods (Appendix C) and this
strongly influences the occurrence of waterbirds at this wetland; the other sites tend to
hold water throughout the year. Droëvlei Dam (Appendix B) and De Hoop Vlei (Appendix
D) and have been known to dry out completely in summer, but not on an annual basis, as
happens at Rocher Pan (Appendix C).
The colour-coded histograms show the composition of species making the greatest
contributions (i.e. equal to or greater than a score of 1.0) to each monthly WCV score.
Consequently species patterns were easily noticeable and dominant species easily
recognisable: Cape Shoveler at De Hoop Vlei, Hartlaub’s Gull at Paarl WWTW, Maccoa
Duck at Droëvlei Dam and equal proportions of White-breasted Cormorant and Cape
Shoveler at Rocher Pan. The colour-codes for each of the priority species also revealed
changes in contributions to WCV scores at each site during the respective study periods.
For example, at De Hoop Vlei, large populations of Cape Shoveler (orange shading,
Figure 3.4) were recorded regularly from August 1985–January 2001, but it was evident
that from February 2001 numbers started to decline as was evidenced by their WSC
scores dropping below 1.0. Other examples included Greater Flamingo (light pink
shading) at Paarl WWTW (Figure 3.3) which occurred fairly regularly from May 1994–
1999 but with no records post 1999, and White-breasted Cormorant (brown shading) and
Cape Shoveler (orange shading) at Rocher Pan (Figure 3.1) whose numbers declined
substantially after 1995.
The variability of the contributions by individual species to WCV scores also
becomes apparent through the histograms. Effectively, there is a signature for each
species. Even quite large variations in numbers at a single site of a species with a large
flyway population (and therefore 1% level) make little impression on the WCV score
histogram. This is because the denominator, the 1% level, is large. However, if the
variability in numbers for a species is large relative to the flyway population, it will
immediately be apparent in these histograms. The histograms therefore highlight the
relative variability of the ’important species’. This variability translates into defining the
important periods or seasons during which these important species occur. Thus the
colour-codes allow for patterns of variability for the WCV score of each species to be
easily visible. For example, at all four sites Pied Avocet (blue shading) showed larger
WCV score contributions during specific months; this reflects its known nomadic habits
in southern Africa (Tree 1997). Other species which showed these irregular but large
contributions to the WCV score included Caspian Tern (green shading) at De Hoop Vlei
and Rocher Pan, Greater Flamingo (light pink shading) at De Hoop Vlei, and Swift Tern

99
(dark green shading) at Rocher Pan (Figures 3.1). These sporadic peaks may (e.g. Pied
Avocet) or may not (e.g. Caspian Tern) show annual patterns, nevertheless their
contributions to the WCV score at these times highlights the conservation value of these
species at a site at a specific, usually limited, time during the annual cycle.
Large seasonal contributions to the WCV score were made regularly for certain
species. At Droëvlei Dam, Black-necked Grebe (dark red shading) contributed more to
the WCV score during early summer (November–January), and Yellow-billed Duck
(yellow shading) during late summer (March–April) (Figure 3.2). Cape Shoveler scores at
Rocher Pan were greatest in early summer while at De Hoop Vlei they showed a strong
late summer peak (Figures 3.1 and 3.4). Black-winged Stilts (black shading) made larger
contributions in winter at Paarl WWTW (Figure 3.3) compared with early summer
(November–January) at Rocher Pan (Figure 3.1). Most of the seasonal occurrence
patterns based around the WCV scores relate to post-breeding moult congregations of
waterfowl species. These are described and discussed in each of the site papers
(Appendices A–D).
The relationships between the WCV scores and the number of species reaching
1% threshold levels are shown for each of the four sites in Figures 3.5a–3.5d. The
scatterplots reveal stronger relationships at the coastal sites (Rocher Pan, and De Hoop
Vlei) compared with the inland sites (Paarl WWTW and Droëvlei Dam). Coastal sites
also showed higher overall WCV scores than inland scores; mean seasonal scores for
Rocher Pan, and De Hoop Vlei were greater than 15 compared with Paarl WWTW and
Droëvlei Dam which had mean WCV scores of less than 10 (Figures 3.5a–3.5d). The
reason for this disparity is probably due to the coastal sites (a) being larger,
(b) supporting more habitats and (c) able to support greater number of waterbirds.
Rocher Pan and De Hoop Vlei are well known non-breeding sites for migrating
shorebirds (Scolopacidae) and terns (Sternidae), and significantly large numbers of these
species groups occur at these sites during the austral summer. Both Rocher Pan and De
Hoop Vlei also act as local refuges for various waterfowl species, particularly during
summer.
When comparing the relationship between the WCV scores and total abundance
at each site (Figures 3.6a–3.6d) with the 1% threshold species, it was clear that, overall,
these relationships were weaker. This strongly suggests that the WCV score is
dependent more on the number of species reaching 1% levels than the total number of
birds counted at a site. Total abundance does however play a role in determining species
population levels at a site which is critical in separating out the priority versus non-
priority species.

100
Interestingly the largest WCV score for Paarl WWTW occurred when only a
single species (Hartlaub’s Gull) reached the 1% threshold (WCV score of 3.53, Figure
3.3). This highlighted the importance of a single species to the overall score at a site.
Droëvlei Dam highlighted that in the absence of globally important species the waterbird
conservation value reached similar levels even when a single 1% threshold species was
present. Thus the combined contributions of all waterbird species had the same or
similar value as that of the contribution made by a single species which had 1% or more
of its global population present at the site. The remaining sites tended to show that
larger WCV scores occurred when there were at least two species at the 1% level but that
there was overlap at all levels. For these sites, large concentrations of a few species
made larger contributions to the score, although there were exceptions
(Figures 3.5a–3.5d). There were occasions when there were no 1% level species present
but the overall WCV score was similar to that when two or three species reached 1%
levels. This suggested that counts of species were more evenly spread at these times and
therefore made a significant contribution to the overall waterbird conservation value at
that site.
Variation around the linear regression
WCV scores varied at particular threshold levels, particularly for the larger sites; the
smaller sites did not show as large variation and this is possibly due to the fact that they
exhibited smaller, overall WCV scores. For example, at Rocher Pan, when two species
reached 1% levels WCV scores ranged from 3.98 to 13.86 (Figure 3.5a), a difference of
9.88 at this level. Similar variability occurred at De Hoop Vlei (6.16–16.66, diff. = 10.5,
level 3, Figure 3.5c). For all sites these differences relate to species’ variation in
abundance (i.e. different species contribute to the WCV score at different times). A single
species can either make an extra-ordinary large contribution to the score or two species
can make equal or similar contributions. These contributions are related to the ratio of
the 1% threshold level to the number of individuals present for a species (i.e. a species
individual CV score). For example, in southern Africa, the Caspian Tern has a 1% level
of 15; if 100 individuals are observed the resultant score is high (6.67). In comparison,
White-breasted Cormorant has a 1% level of 120, so if 100 individuals are observed the
resultant score (0.83) is considered low. When the number of waterbirds observed is less
than the 1% threshold, WCV scores are less than one. Ultimately the WCV score is
dependent on the estimated population size which then determines the 1% level. From
data presented in this thesis (this chapter and Appendices A–D), and from other studies
(Anderson et al. 2003, Bamford and Watkins 2005, Moores 2006, Bamford et al. 2008),

101
waterbird occurrence and abundance at any given wetland can be extremely variable
from one year to the next depending on factors such as amount of inundation, water
depth, food availability and extent of other fringing habitats for roosting and breeding.
This annual variability will influence 1% levels at a site which determine the WCV score
and hence its conservation importance.
However, the WCV score does put the interpretation of waterbird count data and
the conservation value of a wetland into a new perspective. A new concept to emerge
from this is that sites do not necessarily require individual species to meet the 1%
threshold levels in order to make them conservation worthy. Each species’ contribution
to the score is valuable with some species contributing more and therefore will have
greater value.
Seasonal WCV scores
Mean monthly summary WCV scores for each site are given in Figure 3.7 and Table 3.2.
Mean WCV scores varied considerably through the year across all sites; Rocher Pan
scores fluctuated the most during the year while De Hoop Vlei showed less variation.
Droëvlei Dam and Paarl WWTW showed more constant scores throughout the year.
Some sites had similar WCV scores at specific times of the year. For example,
Rocher Pan and De Hoop Vlei had similar scores from November–December and from
July–August but from January to June their scores differed considerably (Figure 3.7,
Table 3.2). There were times (February) when Droëvlei Dam and Rocher Pan had similar
WCV scores. Thus despite the relative size of each wetland and vastly different wetland
types each site had equal conservation value or importance. Paarl WWTW was the only
site which had its largest WCV score in winter (June); all other sites had summer WCV
peaks: Rocher Pan in October, Droëvlei Dam in January, and De Hoop Vlei in February.
Application and conservation value of the WCV score
Overall, there is a clear separation in the way that waterbird species respond at each of
the four sites (Table 3.2). This provides strong evidence for preferred site selection by
certain species. Species with high WCV scores at sites will tend to favour that site over
others. Monthly data have shown how changes in the WCV score help assess the
conservation value on both a survey-by-survey and seasonal basis. Thus a wetland
becomes important for a different suite of species at varying stages throughout the year
and could provide evidence for inter-connectivity between wetlands. Seasonal WCV
scores could also help identify sites that have a regular seasonal influx of waterbirds;

102
changes in seasonal patterns of abundance for the whole waterbird community and for
priority species can then be identified.
But what conservation value does the WCV score have for these sites and how
relevant are regional WCV scores compared with flyway level values discussed in
Chapter 1? By using the WCV score, the significance of local species populations and site
evaluation can be assessed at the waterbird community level and not solely for species
reaching 1% threshold levels. This places a strong conservation value on the entire
wetland avifauna and focuses attention on how waterbird populations use wetlands at a
regional scale. Priority species can be identified rapidly at sites and changes in their
WCV scores over time can provide important trends from which alert systems can be put
in place if populations suddenly start declining. Monitoring of wetland characteristics
and changes to habitats are important covariates that need to be monitored or assessed
in order to draw appropriate conclusions from the WCV score.
These results highlight how the value of a wetland can be assessed relatively
quickly based on a single score both at a site scale and at species levels. Thus intra- and
inter variability can be gauged and comparisons made seasonally within a site and
between sites. It is important to bear in mind that the score cannot be seen in isolation
but should be considered as part of the entire ecology and functioning of a wetland
system, i.e. annual water level fluctuations, extent of habitats and availability of food.
These all impact on the occurrence and abundance of waterbirds at any given wetland.
Flyway versus regional evaluation
In Chapter 1, flyway WCV scores enabled evaluation of different sites throughout the
East Atlantic flyway region. Site and species scores fluctuated within each region and
between regions. From a species perspective, however, the WCV score at this scale has
value for evaluation of migrant species, particularly during different stages of their
annual migratory cycle and across different bio-regions. The WCV score can therefore be
used as a tool to explore annual changes of flyway populations and formulate guidelines
for setting future conservation priorities.
In contrast, regional evaluation as described in this chapter, tends to have
greater relevance for resident species, although it does also allow for migrant scores to be
assessed and evaluated. Regional WCV scores help to evaluate the roles individual sites
play within a defined geographical, vegetative and climatological area. Thus, the sites
selected for this chapter have relevance to a specific bio-climatic zone – the winter
rainfall region of South Africa – a region in which wetlands have not been cumulatively
assessed at the broader landscape level (Chapter 1). It is important that wetlands should

103
not be seen in isolation but as forming a critical network for waterbirds in the landscape
(this is further explored in Chapter 5). Since evaluation of sites at regional level usually
take place at country level attention is focused on resident species, a ‘group’ for which
national or regional (provincial) environmental agencies are responsible. Thus regional
WCV score computation will benefit local waterbird conservation initiatives and help
drive regional and national waterbird conservation priorities.
Both flyway and regional application of the WCV score have conservation benefits
and complement each other. Migrant species and local species are equally assessed albeit
at different scales and, importantly, the WCV scores can be compared across these
different spatial scales. Historically, conservation directives have been largely focused on
migrant shorebird species and for good reason – their annual survival is dependent on
the extent and protection of suitable wetlands along the length of the flyway. At the
flyway level, then, the consistent application of the WCV score will assist in assessing
the importance of sites on an annual basis. From this, international cooperation will be
needed to ensure site protection. But what about local, resident species? In South Africa,
at least, there has been limited focus placed on conservation directives of resident
waterbirds (Chapter 1), especially endemics and breeding endemics, something that
could be addressed through introduction of the WCV score approach. This could easily be
implemented and applied within other countries or regions to set national or regional
waterbird conservation priorities. Overall, the WCV score can be seen as an important
and valuable tool that can be adapted at various levels to enhance the way in which
conservation agencies and national governments can assess waterbird populations both
globally and regionally.
Visual analytics as waterbird conservation tools
Data visualisation and presentation has been a primary focus of this chapter. The use of
colour-coded histograms (Figures 3.2–3.5) and annotated radar plots
(http://projects.gnome.org/gnumeric/doc/sect-graphs-overview-types-radar.shtml;
Pedersen et al. 2002, Mann 2003) (Figure 3.7) have shown the benefits of using visual
analytics as a useful tool in determining the conservation value of wetlands for
waterbirds. The data presentation and outputs used have allowed visual comparisons to
be made quickly and easily for large and long-term datasets, both at monthly and
seasonal levels. Specifically, the benefits of the colour-coded histograms include:
The overall conservation importance of the site is immediately noticeable. The
histogram presents multiple data layers in a single graphical output, namely (a)
overall WCV score, (b) species with WCV scores ≥1.0 (i.e. priority species),

104
(c) seasonality of priority species, and (d) population trends of priority species. It
should be noted that in this study, Droëvlei dam and Paarl WWTW included
species that reached the 0.5% threshold but which did not reach the 1% level. This
was because few species reached the 1% threshold levels and to gauge Sub-regional
IBA status, the 0.5% levels for southern Africa were used to assess the
conservation value of the wetland. Based on this, it is suggested that sites which
support few species meeting 1% threshold be assessed using the 0.5% levels,
especially since the WCV score considers each species contribution to the overall
score as important.
Priority species are easily recognisable and their occurrence patterns are
discernible at a glance. Each species generates a signature in the colour-coded
histogram. In this regard, colours for species can be pre-determined for ease of
comparison between sites and for familiarisation. Standardisation of species
colours is particularly useful at regional or national level. At the flyway level,
colour visualisation would be extremely valuable but this would require careful
consideration in terms of the number of waterbird species for which colour-
specificity would be required. It is important that colours are discrete and easily
discernible to allow for ease of comparison. Nevertheless, the results from this
study have shown the value of this colour-coded system in determining the
conservation value of a wetland based on waterbird abundance patterns.
Species with sporadic abundance peaks are easily noticed. This may require
specific conservation action in terms of species using the site as a staging area or at
certain times of the year.
The combined contributions made by additional species are easily recognisable and
often elucidates the important contributions made by these species to the overall
WCV score.
They assist in determining which months/seasons/periods the conservation
significance for a species is greatest. From these temporal variations one can
elucidate if occurrence patterns are noticeable.
The radar plot visualisation is a new and innovative way to display the
conservation value of wetland sites on a temporal basis. The example described in this
chapter used monthly survey data but other temporal data (quarterly and six-monthly)
can easily be substituted in the radar graphic. However, less frequent surveys will
provide coarser data outputs which would impact on the interpretation of the analyses.

105
Monthly surveys do provide better analysis of seasonality and are strongly encouraged
as the minimum count frequency to be used in waterbird studies.
Can the WCV score tell us something about the wetland itself? Can it provide an
indirect assessment of the state of the wetland? Based on the known ecological
parameters or requirements for species or species groups the composition of the priority
species could provide an indication of the health of a wetland. For example, if there were
large numbers (larger than the 1% level) of pelicans and terns we could assume that fish
availability was high; similarly large numbers of shorebird species (e.g. Curlew
Sandpiper, Little Stint, Black-winged Stilt) would indicate that invertebrate prey was
readily available. Changes in the abundance of priority species and/or the waterbird
community itself would then indicate or infer changes in the structural composition of
the wetland.
Concluding remarks
In terms of application of the WCV score, the above has shown how it can be used as a
rapid conservation assessment tool. Waterbird ecologists and conservation authorities
alike would greatly benefit from using this method to identify important sites and
priority species. Using current information technology the WCV score can easily be
incorporated as an algorithm into long-term waterbird datasets to gauge conservation
importance. The conservation value can be assessed as survey data is added to the
database. This would enable near real-time assessment of a site based on the
accumulation of waterbird survey data, given that surveys can be carried out on a
frequent basis. Visual outputs can be generated which will graphically illustrate the
waterbird importance and value at a site.
Importantly and from a conservation perspective WCV scores can assess global
and sub-regional IBA designation. Since the WCV score takes into account the relative
contributions made by all species, and not only those of species reaching 1% threshold
levels, I propose that the WCV score be considered as an alternative assessment tool for
designating wetlands of international importance.

106
References
Anderson MA, Kolberg H, Anderson PC, Dini J and Abrahams A 2003. Waterbird
populations at the Orange River Mouth from 1980–2001: a re-assessment of its Ramsar
status. Ostrich 74: 159–172.
Barnes KN (ed.) 1998. Important Bird Areas of Southern Africa. BirdLife South Africa,
Johannesburg.
Barnes KN (ed.) 2000. The Eskom Red Data Book of Birds of South Africa, Lesotho and
Swaziland. BirdLife South Africa, Johannesburg.
Bamford M and Watkins D 2005. Population estimates and important sites for shorebirds in
the East Asian-Australasian Flyway. In: Straw, P. Status and conservation of shorebirds
in East Asian Australasian Flyway. Proceedings of the Australasian Shorebirds
Conference 13–15 Dec 2003, Canberra, Australia. Wetlands International Global Series
18, International Wader Studies 17. Sydney, Australia. pp. 146–152.
Bamford MD, Watkins D, Bancroft W, Tischler G and Wahl J. 2008. Migratory shorebirds of
the East Asian-Australasian Flyway; population estimates and internationally
important sites. Review article. Notornis 55: 226–228.
Centrifuge Systems 2008. Next generation information visualisation. A white paper
developed by Centrifuge Systems Inc. Centrifuge Systems Inc, Vancouver, Canada.
Centrifuge Systems 2012. Big data is here to stay. A white paper developed by Centrifuge
Systems Inc. Centrifuge Systems Inc,Vancouver, Canada.
Hockey PAR, Ryan PG and Dean WRJ (eds) 2005. Roberts’ birds of southern Africa, 7th
edition. Trustees of the John Voelcker Bird Book Fund, Cape Town.
Mann DL 2003. Better technology forecasting using systematic innovation methods.
Technological Forecasting and Social Change 70: 779–795.
Moores N 2006. South Korea’s shorebirds – a review of abundance, distribution, threats and
conservation status. Stilt 50: 62–72.
Pedersen E, Inoue K and Tsugane M 2002. Evaluation of a radar plot and display technique
for anti-collision assessment of multiple targets in true vector representation by
application of the environmental stress model. Journal of Japan Institute of Navigation
106: 1–12.
Tufte ER 1983. The visual display of quantitative information. Graphics Press Cheshire,
Conneticutt. 197 pp.
Tree AJ 1997. Avocet Recurvirostra avosetta. In: The atlas of southern African birds. Vol. 1:
Non-passerines. Harrison JA, Allan DG, Underhill LG, Herremans M, Tree AJ, Parker V
and Brown CJ (eds), pp. 434–435 BirdLife South Africa, Johannesburg.

Table 3.1 Summary information and count statistics for the four sites dealt with in this chapter and the Bot River Estuary in Chapter 4. WWTW = Waste Water Treatment Works, S = Summer, W = Winter. Species in bold are Red Data species (Barnes 2000) and those in italics are endemic to southern Africa (Hockey et al. 2005).
Description Site name
Rocher Pan Droëvlei Dam Paarl WWTW De Hoop Vlei Bot River Estuary
Wetland type Coastal lake Farm dam Waste Water
Treatment Works Coastal lake
Temporary closed estuary
Inundation, water quality Ephemeral,
brackish-freshwater Permanent, freshwater
Permanent, freshwater
Mainly permanent, fresh to brackish
Permanent, brackish to saline
Size (ha) 260 30 72 750 1400
Conservation status Protected Unprotected Partially protected Protected Partially protected
Total no. species 80 50 75 83 86
Mean abundance S.D.
S 3197.1 ± 2731.1 1935 ± 973.4 2821.8 ± 504.4 5710.2 ± 909.6 4558.9 ± 2664.1
W 1534.2 ± 1730.3 791.9 ± 481 1650.9 ± 250.6 5203.9 ± 534.3 5265.6 ± 2759.8
Density1 (birds/ha)
S 12.3 64.5 39.1 7.7 3.3
W 5.9 26.3 22.9 6.9 3.8
Max. abundance S 13 708 5701 5269 16 338 16 600
W 9062 3002 2728 13 792 17 290 Mean Waterbird
Conservation Value Score
S 6.03 1.52 2.64 6.49 6.83
W 4.66 1.01 3.19 5.5 5.16
Threshold levels 1%2 14 3 6 16 13
0.5%3 6 5 3 5 4
Number. of Red Data species 9 3 4 12 13
Top five abundant species (Max. count)
Red-knobbed Coot (6259) Curlew Sandpiper (5012) Greater Flamingo (4239) White-winged Tern (1662) Cape Shoveler (1619)
Ruff (920) Egyptian Goose (902) Little Stint (837) Red-knobbed Coot (837) White-winged Tern (590)
White-winged Tern (2796) Egyptian Goose (1341) Lesser Flamingo (1200) Hartlaub's Gull (1058) African Sacred Ibis (940)
Red-knobbed Coot (10801) Egyptian Goose (3175) Yellow-billed Duck (3005) Cape Shoveler (2542) Curlew Sandpiper (2467)
Red-knobbed Coot (15352) Greater Flamingo (2884) Common Tern (2351) Sandwich Tern 2059) Yellow-billed Duck (2030)
1.Estimates based on mean abundance values 2 Values are number of species reaching or surpassing the Ramsar (1%) 3 Values are number of species reaching or surpassing the IBA Sub-regional (0.5%) but not surpassing the Ramsar 1% level
107

108
Table 3.2. List of priority species and their associated mean monthly and seasonal WCV scores for five selected sites in the Western Cape, South Africa. ‘Additional species’ refers to all other species which did not reach or surpass their respective 1% thresholds and represents the cumulative total of their individual WCV scores.
Sep Oct Nov Dec Jan Feb Mar Apr May Jun Jul Aug Mean ± S.D. Mean ± S.D.
Paarl WWTWHartlaub's Gull 1.4 0.9 0.9 1.0 0.9 0.7 0.7 0.4 0.8 0.7 1.3 1.2 0.84 0.13 0.98 0.39Black-winged Stilt 0.5 0.4 0.3 0.3 0.3 0.4 0.4 0.6 1.0 1.3 0.9 0.7 0.33 0.06 0.81 0.29White-breasted Cormorant 0.3 0.3 0.2 0.1 0.2 0.3 0.3 0.4 0.5 0.6 0.4 0.3 0.23 0.07 0.40 0.12Lesser Flamingo 0.0 0.4 0.4 0.2 0.2 0.1 0.0 0.0 0.1 0.2 0.0 0.0 0.20 0.16 0.05 0.07Additional species 0.7 0.8 1.1 1.1 1.3 1.0 1.0 1.2 0.8 1.2 1.0 0.9 1.05 0.16 0.95 0.21
Total 2.8 2.7 2.9 2.7 2.8 2.4 2.4 2.6 3.2 3.9 3.6 3.1 2.64 0.21 3.19 0.50Rocher PanWhite-breasted Cormorant 0.68 1.18 1.18 2.34 1.81 0.54 0.05 0.00 0.23 0.81 0.64 0.52 1.18 0.83 0.48 0.30Cape Shoveler 1.31 1.75 1.87 1.14 0.68 0.33 0.06 0.09 0.08 0.34 0.33 0.54 0.97 0.75 0.45 0.46Greater Flamingo 1.16 1.11 0.94 0.75 0.19 0.07 0.02 0.03 0.01 0.02 0.11 0.47 0.51 0.48 0.30 0.46Black-winged Stilt 0.98 1.57 1.03 0.33 0.08 0.06 0.02 0.02 0.03 0.07 0.13 0.30 0.52 0.64 0.25 0.37Black-necked Grebe 1.23 0.85 0.29 0.06 0.00 0.00 0.00 0.00 0.02 0.09 0.30 0.81 0.20 0.34 0.41 0.50Hartlaub's Gull 0.02 0.04 0.03 0.07 0.10 0.02 0.01 0.01 0.00 0.24 0.00 0.71 0.04 0.03 0.16 0.28Pied Avocet 0.53 0.39 0.23 0.14 0.06 0.07 0.02 0.03 0.09 0.27 0.36 0.37 0.15 0.14 0.27 0.19Swift Tern 0.04 0.08 0.12 0.07 0.19 0.09 0.03 0.00 0.06 0.13 0.09 0.11 0.10 0.06 0.07 0.05Caspian Tern 0.02 0.14 0.13 0.03 0.05 0.15 0.06 0.00 0.01 0.01 0.00 0.00 0.09 0.05 0.01 0.01Curlew Sandpiper 0.01 0.06 0.13 0.37 0.23 0.30 0.10 0.01 0.00 0.00 0.00 0.01 0.20 0.12 0.01 0.01Lesser Flamingo 0.07 0.06 0.01 0.00 0.00 0.04 0.01 0.00 0.01 0.19 0.22 0.40 0.02 0.02 0.15 0.15Kelp Gull 0.05 0.13 0.05 0.06 0.06 0.02 0.00 0.00 0.01 0.02 0.04 0.05 0.05 0.04 0.03 0.02Yellow-billed Duck 0.23 0.19 0.10 0.08 0.04 0.03 0.04 0.06 0.11 0.27 0.23 0.25 0.08 0.06 0.19 0.08Great Crested Grebe 0.00 0.00 0.00 0.00 0.00 0.00 0.00 0.00 0.00 0.00 0.00 0.00 0.00 0.00 0.00 0.00Additional species 3.60 2.78 2.59 2.39 1.74 1.45 0.53 0.32 0.57 1.62 2.14 3.05 1.91 0.85 1.88 1.31
Total 9.92 10.33 8.71 7.81 5.23 3.17 0.95 0.59 1.22 4.08 4.58 7.57 6.03 3.56 4.66 3.60Droevlei DamMaccoa Duck 0.35 0.44 0.43 0.38 0.27 0.26 0.31 0.33 0.40 0.30 0.44 0.31 0.35 0.08 0.35 0.05Pied Avocet 0.00 0.03 0.03 0.18 0.18 0.25 0.17 0.08 0.01 0.10 0.12 0.02 0.14 0.09 0.05 0.05Black-necked Grebe 0.15 0.18 0.17 0.32 0.07 0.05 0.00 0.02 0.06 0.05 0.10 0.06 0.13 0.11 0.07 0.04Cape Shoveler 0.15 0.27 0.14 0.17 0.26 0.19 0.22 0.14 0.21 0.22 0.14 0.09 0.21 0.05 0.16 0.05Yellow-billed Duck 0.00 0.04 0.04 0.06 0.13 0.13 0.19 0.14 0.10 0.06 0.01 0.01 0.10 0.06 0.05 0.06Lesser Flamingo 0.00 0.00 0.00 0.00 0.00 0.00 0.00 0.08 0.08 0.13 0.03 0.00 0.00 0.00 0.05 0.05Additional species 0.15 0.32 0.32 0.56 0.85 0.81 0.71 0.53 0.25 0.30 0.21 0.14 0.60 0.24 0.26 0.14
Total 0.81 1.28 1.12 1.68 1.76 1.70 1.60 1.32 1.11 1.15 1.04 0.62 1.52 0.26 1.01 0.25De Hoop VleiCape Shoveler 1.06 2.45 1.86 2.34 1.79 1.88 1.27 1.09 1.34 1.18 1.34 1.34 1.93 0.42 1.23 0.13Great Crested Grebe 0.61 0.64 0.52 0.42 0.64 0.68 0.61 0.48 0.55 0.43 0.39 0.59 0.59 0.10 0.51 0.09White-breasted Cormorant 0.94 0.43 0.39 0.42 0.42 0.69 0.55 0.41 0.73 0.64 0.75 0.78 0.48 0.12 0.71 0.18Yellow-billed Duck 0.19 0.19 0.21 0.26 0.63 1.08 0.77 0.64 0.66 0.49 0.38 0.27 0.52 0.36 0.44 0.19Black-necked Grebe 0.27 0.42 0.75 0.67 0.11 0.18 0.11 0.42 0.88 0.60 0.21 0.27 0.37 0.29 0.44 0.25Caspian Tern 0.76 0.12 0.11 0.21 0.32 1.08 0.26 0.43 0.13 0.19 0.41 0.87 0.35 0.37 0.46 0.30Black-winged Stilt 0.30 0.56 0.32 0.40 0.35 0.31 0.25 0.17 0.26 0.28 0.32 0.51 0.36 0.11 0.31 0.11Greater Flamingo 0.19 0.28 0.35 0.31 0.12 0.01 0.02 0.03 0.02 0.05 0.04 0.19 0.18 0.15 0.09 0.08Southern Pochard 0.30 0.34 0.56 0.50 0.17 0.03 0.00 0.00 0.00 0.00 0.07 0.21 0.27 0.24 0.10 0.13Great White Pelican 0.05 0.01 0.04 0.08 0.16 0.35 0.25 0.12 0.14 0.25 0.09 0.06 0.15 0.13 0.12 0.07Whiskered Tern 0.00 0.00 0.07 0.01 0.63 0.00 0.00 0.00 0.00 0.00 0.00 0.00 0.12 0.25 0.00 0.00Red-knobbed Coot 0.26 0.27 0.29 0.30 0.24 0.19 0.19 0.18 0.25 0.24 0.32 0.36 0.25 0.05 0.27 0.06Maccoa Duck 0.36 0.06 0.01 0.04 0.02 0.01 0.01 0.04 0.05 0.01 0.03 0.00 0.03 0.02 0.08 0.14Pied Avocet 0.10 0.15 0.07 0.10 0.11 0.11 0.19 0.04 0.07 0.16 0.11 0.12 0.12 0.04 0.10 0.04Crowned Cormorant 0.02 0.01 0.00 0.02 0.02 0.05 0.10 0.00 0.04 0.00 0.00 0.01 0.03 0.04 0.01 0.02Additional species 0.47 0.60 0.44 0.61 0.88 0.95 0.99 0.74 0.72 0.58 0.70 0.62 0.75 0.22 0.64 0.10
Total 5.87 6.52 5.99 6.68 6.61 7.59 5.55 4.78 5.84 5.11 5.16 6.20 6.49 0.69 5.50 0.55Bot River EstuaryCaspian Tern 0.29 0.32 0.18 0.45 1.87 1.98 2.67 1.05 0.32 0.48 0.48 0.55 1.24 1.05 0.53 0.28Great Crested Grebe 0.82 1.10 1.66 1.61 0.93 0.76 1.19 0.87 0.54 0.47 0.95 0.56 1.21 0.36 0.70 0.20White-breasted Cormorant 0.36 0.32 0.36 0.36 0.58 0.79 0.54 0.75 0.83 0.55 1.04 0.39 0.49 0.18 0.65 0.27Hartlaub's Gull 0.90 0.67 0.46 0.80 1.05 0.96 0.26 0.12 0.32 0.43 0.61 0.29 0.70 0.30 0.44 0.28Greater Flamingo 0.68 0.84 0.59 0.96 0.67 0.27 0.29 0.06 0.42 0.00 0.16 0.18 0.60 0.28 0.25 0.25Cape Shoveler 0.50 0.17 0.09 0.08 0.32 0.40 0.80 0.19 0.23 0.50 0.32 0.33 0.31 0.27 0.34 0.13Swift Tern 0.11 0.04 0.13 0.57 0.17 0.80 0.18 0.23 0.82 0.06 0.08 0.09 0.31 0.30 0.23 0.29Yellow-billed Duck 0.19 0.14 0.08 0.16 0.37 0.45 0.61 0.57 0.40 0.27 0.20 0.19 0.30 0.21 0.30 0.15Red-knobbed Coot 0.24 0.30 0.20 0.13 0.11 0.12 0.11 0.28 0.06 0.38 0.36 0.49 0.16 0.08 0.30 0.15Black-necked Grebe 0.20 0.05 0.06 0.17 0.03 0.04 0.05 0.00 0.09 0.02 0.39 0.17 0.07 0.05 0.14 0.14Kelp Gull 0.32 0.36 0.13 0.13 0.40 0.34 0.25 0.29 0.41 0.12 0.27 0.15 0.27 0.12 0.26 0.11Great White Pelican 0.10 0.30 0.07 0.03 0.06 0.23 0.34 0.15 0.10 0.05 0.30 0.00 0.17 0.14 0.12 0.10Black-winged Stilt 0.07 0.22 0.18 0.18 0.26 0.23 0.17 0.09 0.13 0.08 0.12 0.06 0.21 0.03 0.09 0.03Sandwich Tern 0.00 0.00 0.33 0.01 0.03 0.06 0.03 0.01 0.00 0.00 0.00 0.00 0.08 0.13 0.00 0.00White-fronted Plover 0.06 0.06 0.08 0.05 0.09 0.12 0.09 0.11 0.12 0.03 0.25 0.13 0.08 0.03 0.12 0.07African Black Oystercatcher 0.15 0.03 0.09 0.06 0.08 0.15 0.11 0.08 0.16 0.11 0.13 0.10 0.09 0.04 0.12 0.03Additional species 0.63 0.49 0.56 0.37 0.43 0.68 0.73 0.54 0.45 0.49 0.72 0.55 0.54 0.14 0.56 0.10
Total 5.62 5.41 5.24 6.13 7.44 8.38 8.39 5.39 5.39 4.05 6.35 4.19 6.83 3.71 5.16 2.59
Summer WinterMonthSite/Priority species

109
Figure 3.1 Colour-coded histogram plotting the monthly WCV scores for priority species at Rocher Pan.
Figure 3.2 Colour-coded histogram plotting the monthly WCV scores for priority species at Droëvlei Dam. The dotted line represents the date from which all species were surveyed.
0
2
4
6
8
10
12
14
16
18
20
Sep
-85
Mar
-86
Sep
-86
Mar
-87
Oct
-87
Apr
-88
Oct
-88
Apr
-89
Oct
-89
Apr
-90
Oct
-90
Apr
-91
Oct
-91
Apr
-92
Oct
-92
Apr
-93
Oct
-93
Apr
-94
Oct
-94
Apr
-95
Oct
-95
Apr
-96
Oct
-96
Apr
-97
Oct
-97
Apr
-98
Oct
-98
Apr
-99
Oct
-99
Apr
-00
Oct
-00
Apr
-01
Oct
-01
Apr
-02
Oct
-02
May
-03
WC
V s
core
Survey date
White-breasted Cormorant Cape Shoveler Greater FlamingoBlackwinged Stilt Black-necked Grebe Hartlaub's GullPied Avocet Swift Tern Curlew SandpiperCaspian Tern Lesser Flamingo Kelp GullYellow-billed Duck Great Crested Grebe Other
0
1
2
3
Nov
-82
Mar
-83
Jul-
83
Nov
-83
Mar
-84
Jul-
84
Nov
-84
Mar
-85
Jul-
85
Nov
-85
Mar
-86
Jul-
86
Nov
-86
Mar
-87
Jul-
87
Nov
-87
Mar
-88
Jul-
88
Nov
-88
Mar
-89
Jul-
89
Nov
-89
Mar
-90
WC
V s
core
Survey date
Maccoa Duck Pied Avocet Black-necked Grebe Cape Shoveler
Yellow-billed Duck Lesser Flamingo Other

110
Figure 3.3 Colour-coded histogram plotting the monthly WCV scores for priority species at Paarl Waste Water Treatment Works.
Figure 3.4 Colour-coded histogram plotting the monthly WCV scores for priority species at De Hoop Vlei.
0
1
2
3
4
5
6
7
May
-94
Sep
-94
Jan-
95
May
-95
Sep
-95
Jan-
96
May
-96
Sep
-96
Jan-
97
May
-97
Sep
-97
Jan-
98
May
-98
Sep
-98
Jan-
99
May
-99
Sep
-99
Jan-
00
May
-00
Sep
-00
Jan-
01
May
-01
Sep
-01
Jan-
02
May
-02
Sep
-02
Jan-
03
May
-03
Sep
-03
Jan-
04
WC
V s
core
Survey date
Hartlaub's Gull Black-winged Stilt Lesser FlamingoMaccoa Duck Pied Avocet White-breasted CormorantCape Shoveler Black-necked Grebe Great White PelicanOther
0
2
4
6
8
10
12
14
16
18
Jun
84O
ct-8
4F
eb-8
5Ju
n-85
Oct
-85
Feb
-86
Jun-
86O
ct-8
6F
eb-8
7Ju
n-87
Oct
-87
Feb
-88
Jun-
88O
ct-8
8F
eb-8
9Ju
n-89
Oct
-89
Feb
-90
Jul-
90Ju
l-91
Jul-
92Ju
l-93
Oct
-94
Jun-
97Ju
l-99
Aug
-00
Dec
-00
Apr
-01
Aug
-01
Dec
-01
Apr
-02
Sep
-02
Jun-
03O
ct-0
3F
eb-0
4Ju
n-04
Mar
-05
Jan-
07Ja
n-09
WC
V s
core
Survey date
Cape Shoveler Yellow-billed Duck Red-knobbed CootWhite-breasted Cormorant Great Crested Grebe Caspian TernMaccoa Duck Black-necked Grebe Black-winged StiltSouthern Pochard Greater Flamingo Great White PelicanPied Avocet Whiskered Tern Crowned CormorantOther

Figure 3.5 Scatterplots showing the relationship between the number of species reaching the 1% threshold and the Waterbird Conservation Value (WCV) score for (a) Rocher Pan, (b) Droëvlei Dam, (c) De Hoop Vlei and (d) Paarl Waste Water Treatment Works. Each data point represents one survey.
y = 0.6461x + 1.0916R² = 0.0505
0
1
2
3
0 1
WC
V s
core
No. of species reaching 1% threshold
(b)
y = 1.1376x + 2.2351R² = 0.5618
0
1
2
3
4
5
6
7
0 1 2 3
WC
V s
core
No. of species reaching 1% threshold
(d)
y = 2.5598x + 1.3194R² = 0.8189
02468
101214161820
0 1 2 3 4 5
WC
V s
core
(a)
y = 2.4607x + 2.0367R² = 0.8014
02468
1012141618
0 1 2 3 4 5 6
WC
V s
core
(c)
111

Figure 3.6 Scatterplot showing the relationship between total waterbird count (abundance) and the Waterbird Conservation Value (WCV) score for (a) Rocher Pan, (b) Droëvlei Dam, (c) De Hoop Vlei and (d) Paarl Waste Water Treatment Works. Each point represents one survey.
y = 0.0004x + 0.7652R² = 0.4448
0
0.5
1
1.5
2
2.5
3
3.5
0 1000 2000 3000 4000
WC
V s
core
(b)
y = 0.0012x + 0.9933R² = 0.7797
02468
101214161820
0 5000 10000 15000
WC
V s
core
(a)
y = 0.0002x + 2.5183R² = 0.0197
0
1
2
3
4
5
6
7
0 1000 2000 3000 4000 5000 6000
WC
V s
core
(d)
y = 0.0004x + 2.792R² = 0.4174
02468
1012141618
0 5000 10000 15000 20000 25000 30000
WC
V s
core
(c)
112

0
2
4
6
8
10October
November
December
January
February
March
April
May
June
July
August
September
Rocher Pan De Hoop Vlei Paarl WWTW Droëvlei Dam
Figure 3.7 Annotated radar graphic to illustrate the change in the mean monthly Waterbird Conservation Value (WCV) scores (y-axis) for four wetland sites in the Western Cape, South Africa. The closer the lines of each site are to each other the more similar the WCV scores, the more similar their waterbird conservation value.
S U
M M
E R
W I
N T
E R
113

115
Chapter 4
Waterbird responses to dynamic shifts between lake
and estuarine conditions at the Bot River Estuary,
Western Cape, South Africa, 2002–2010:
a conservation assessment

116

117
Abstract
The Bot River Estuary is a temporarily open-closed estuary on the south coast of South
Africa. The mouth is artificially breached at 2–3 year intervals. I assessed the changes in
waterbird composition and abundance at the estuary between 2002–2010 in relation to
open-closed phases of the mouth. Three wetland conditions were identified during the
study period: (1) a saline estuarine phase, (2) a brackish lagoon phase and (3) a
freshwater lake phase. Sensitivity indices were calculated to measure the responses of
birds between each phase and to measure overall and species trends in numbers over the
eight year period. A total of 86 waterbird species were recorded; mean numbers of birds
in summer was 4558 2664 and 5265 2759 in winter. A maximum count of 17 300
birds was recorded. Red-knobbed Coot, Common Tern and Sandwich Tern were
numerically the most abundant species. Waterbirds responded variably to the changing
hydrological conditions and their occurrence and dominance at the estuary is typically
cyclical based on site conditions. Lake conditions supported more waterfowl, especially
Red-knobbed Coot and Yellow-billed Duck, while estuarine and lagoonal phases
supported more waders and shorebirds. Ramsar thresholds were met for Great Crested
Grebe, White-breasted Cormorant, Caspian Tern, Greater Flamingo and Swift Tern. The
estuary was designated an IBA based on large waterfowl populations; these showed
declines of up to 97% over the study period, Red-knobbed Coot declined by 99%.
Proposals are discussed concerning how best to manage the system to maximise
waterbird abundance and conservation in light of the changing hydrological changes.
Plate 4.1 The Bot River Estuary looking eastwards from Arabella Spa and Hotel. This picture was taken one day after the mouth was artificially breached in August 2003. The exposed shoreline due to the drawdown can be seen at the edge of the estuary.

118
Introduction
As an interface between marine and freshwater systems, estuaries are considered to be
one of the most productive of aquatic eco-systems (Breen and McKenzie 2001). The
transition zones created between freshwater input at the head of the estuary and
saltwater entry at the estuary mouth, contribute to high levels of biodiversity within
these systems (Whitfield and Wood 2003). They are dynamic environments with
conditions changing more widely, rapidly and frequently than any other aquatic habitat.
This is due primarily to changes in river inflow and tidal exchange when the mouth is
open to the sea. Fluctuations in salinity, nutrient content, sediment deposition and
water-levels are considered to be some of the important features that contribute to
changes in biodiversity and ecological processes within these systems (Whitfield 2001).
Estuarine biota constitutes both freshwater and marine taxa which adapt to the physical
and chemical components associated with changes in the system (Whitfield and Wood
2003). Waterbirds are among the most conspicuous of all organisms in aquatic systems
and, as the top predator, their abundance and occurrence often reflects the health of
these systems. This allows for rapid assessment of the ecological state within wetlands
and aquatic systems (Peakall and Boyd 1987, Martinez et al. 2005).
In South Africa more than 75% of all estuaries are temporarily closed to the sea
with openings occurring naturally (i.e. during flooding events) or artificially (i.e. during
mechanical breaching of the sand-barrier) (Whitfield 1992, Whitfield et al. 2008). These
‘change-over’ periods are usually of short duration but rapidly alter estuarine conditions.
The effects on birds of such abrupt abiotic events are difficult to assess because these
events are generally unpredictable, and while it is usually easier to monitor the post-
event condition, the context of pre-event conditions is generally lacking.
The Bot River Estuary, known locally as the Botriviervlei, is subject to regular
artificial breaching of its mouth (van Niekerk et al. 2005). For the most part it exists as a
coastal lake or lagoon with periodic estuarine (tidal) interludes. Water flow has been
reduced or diverted through human interference which has impacted on the natural
ability of the estuary to breach regularly. Estuarine ecologists are in favour of breaching
the estuary annually in order to restore the estuary to its original reference state and
maintain it as an open estuarine system (van Niekerk et al. 2005). In contrast, other
users (birdwatchers, fisherman and residents) support a less frequent breaching protocol
in order to support recreational activities and aesthetic aspects at the estuary (Bally and
Branch 1986).
Monthly waterbird surveys were carried out in the early 1980s (Heÿl and Currie
1985) and preliminary results showed that the estuary provided a safe dry-season refuge

119
for many waterbird species, particularly waterfowl and that changes in the hydrology
did impact on the waterbird community. Surveys were re-instated in the early 1990s
(Coordinated Waterbird Counts, Animal Demography Unit; Taylor et al. 1999) and were
carried out twice-yearly during the austral mid-summer and mid-winter periods.
However, much of these data have been collected over short-term periods or at intervals
that are too coarse to determine the short- or long-term impact of breaches on the
waterbird community at the estuary. Consequently, this has led to insufficient data on
which to base an effective waterbird conservation strategy for the estuary.
From February 2003, more regular surveys were introduced to provide
opportunities to document and monitor the impacts of impending changing hydrological
conditions on the waterbird community. These surveys continued, albeit at varying
intensity, over the next six years covering four breaches. The draft management plan for
the estuary (Anon. 2001) focuses primarily on overall management policies for the
catchment and the estuary itself, particularly in light of the controlled artificial
breaching policy. No sound waterbird conservation strategy is included in the
management plan.
In this chapter, I investigate how waterbirds respond to changing hydrological
and chemical conditions at the Bot River Estuary and compare these results with those
obtained by Heÿl and Currie (1985). Application of the Waterbird Conservation Value
(WCV) score is applied locally in the context of the estuary’s hydrological cycle to assess
conservation value of waterbirds in light of the changing physical conditions. I highlight
the overall conservation importance of the site for waterbirds and discuss
recommendations for maintaining and conserving waterbird diversity in light of current
management policies at the estuary.
Study area
The Bot River Estuary (34°21’S 19°06’E) is the second largest estuary in the Western
Cape covering an area of c. 14 km2 when fully inundated (Branch et al. 1985). The
estuary is fed by the Bot River from the north and the small Afdaks River which enters
the estuary halfway along the eastern shore (Figure 4.1). The catchment (c. 900 km2) is
split into three sections: the Bot, Swart and Afdaks Rivers; the confluence of the Swart
and Bot Rivers is c. 10 km from the head of the estuary (Figure 4.1) and comprises 45%
land under agriculture, 43% natural fynbos vegetation, 4.5% covered by alien vegetation
(including plantations) and the remaining 7.5% urban settlements, road infrastructure
and other modified landscapes (Adams 2000). Agriculture results in high loads of silt and
other erosion inputs into the system (Koop et al. 1983). The surrounding geology

120
comprises predominantly shales, and Table Mountain Sandstone occurs in the Afdaks
River catchment. Unlike most rivers in the Western Cape, water entering the estuary is
generally unstained by humic acids resulting in good light penetration (Koop et al. 1983).
The estuary is located within the Overberg wheatbelt within the Cape Floristic
Region, a global biodiversity hotspot, and an Important Bird Area (Barnes 1998, Cowling
et al. 2003). The estuary is also part of the Kogelberg Biosphere Reserve, and is itself an
Important Bird Area, on account of its waterbird populations (Barnes 1998). It was rated
by Turpie (1995) as one of the top 10 estuaries in South Africa for waterbirds.
The hydrodynamics of the estuary were described by Branch et al. (1985), van
Niekerk and Huizenga (2000) and van Niekerk et al. (2005). The estuary opens
periodically to the sea, on a scale of years, either naturally after heavy flooding or by
artificially breaking the sandbar, a process known as breaching (Koop et al. 1983, van
Niekerk et al. 2005). Although some wave-overtopping of the sandbar by seawater occurs
during spring high tides, the lack of regular marine input into the estuary for periods of
a year or more has a substantial impact on the biodiversity and functioning of the
system. Due to limited and reduced salinities in the system the estuary mostly functions
as a coastal freshwater lake rather than a typical tidal estuary (Koop et al. 1983).
During the study period, the estuary was breached four times; three were artificial and
one was natural. The estuary has only opened naturally on four occasions between 1940
and 2010 (Bally 1985, van Niekerk et al. 2005, this study).
The estuary is shallow (averaging 1.5 m below MSL) with a narrow central area
up to 2.5 m below MSL (Koop 1982, van Niekerk et al. 2005). Water-levels fluctuate
between 1.4 m and 2.7 m above MSL when the mouth is closed, but varies seasonally
and from year to year (Branch et al. 1985).
The estuary comprises five major habitats for waterbirds: (a) open water which
supports two submerged plants: Ruppia maritima generally dominates throughout the
estuary but at depths less than 1.9 m above MSL, while smaller Potamogeton pectinatus
beds occur in the northern sections; (b) a rocky, eastern shoreline with limited or no
emergent vegetation; (c) extensive Phragmites and Scirpus areas in the north where the
Bot River enters and near the mouth of the Kleinmond estuary, and smaller stands
where the Afdaks River enters the estuary; (d) an open, vegetated western shoreline
comprising mainly of marsh grass Chondropetalum tectorum and salt marsh grass
Sarcocornia natalensis and (e) a sandy beach near the mouth with dune vegetation (Koop
et al. 1983, Adams 2000). A few emergent rocks occur in the open water of the northern
sections of the estuary and these become exposed when water-levels are low.

121
Methods
I used data from waterbird surveys conducted between 2002 and 2010 (Coordinated
Waterbird Counts, Animal Demography Unit). Most surveys were conducted at monthly
intervals from February 2003 to December 2006 and at quarterly or six-monthly
intervals from December 2006 to February 2010. Surveys were conducted in six sections
with each being covered by a team of 3–4 people. Surveys started at 0800 and took about
four hours.
I assessed changes in abundance, composition (richness) and biomass of
waterbird species before, during and after a breaching event. These periods corresponded
with three phases of the estuary: the lake phase, the estuary phase and lagoon phase
respectively, with the phases characterized by mouth status, salinity and water-level
(Table 4.1). Apart from the abrupt transition between the lake phase and the estuary
phase, these other transitions were gradual.
Species were categorized as residents or Palearctic migrants and grouped into
three feeding guilds (Appendix 1.3, Chapter 1): herbivores, piscivores and invertebrate
feeders. Species that occurred on 25% or more of the surveys and that averaged 10 or
more individuals were selected for analyses. These focal species made the greatest
contribution to the waterbird population at the estuary.
By tracking the changes in mean abundance of the focal species through the
phases, I evaluated (a) which species responded first to the changing conditions, (b) how
the changing conditions impacted on them, (c) whether changes in abundance were
linked to water-level and/or salinity changes and (d) the length of time it took for
waterbird numbers to recover after a breach. I calculated a sensitivity index for each
species; the index was designed to measure the changes in numbers immediately before
and after a breaching event. For example, to calculate the sensitivity index (SI) for a
species from the lake phase to the estuarine phase and I calculated the difference
between mean abundance values in the estuarine phase and the immediately preceding
lake phase, and divided this by the mean of these two values. In general, for all pairs of
phases, this is represented by the formula:
SI =
xi – xi–1
½ (xi + xi–1)
where
xi = mean abundance of the species for phase i,
xi–1 = mean abundance of the species for the preceding phase i–1.
122
Negative values for this index indicate a decline in numbers after a breach; positive
values indicated increases.
To relate changing hydrological conditions during each phase to changes in
waterbird abundance and composition, I examined four hydrological variables: water-
level, salinity, run-off and rainfall. Water-level data were obtained from a recorder
(GR4003) located at the Ysterklip Jetty (Figure 4.1), maintained by the Department of
Water Affairs and Forestry and were corrected to MSL (mean sea-level) by subtracting
0.6 m. Salinity data were provided by CapeNature (S. Gildenhuys in litt.). Data were
incomplete and only available for 29 of the 55 months; missing monthly data were
linearly interpolated from the values on either side of the missing month(s). Monthly
run-off into the estuary was measured at river gauging station G4H014-A01 situated on
the farm Roode Heuvel (34°14’S, 19°12’E) in the Bot River c. 13 km upstream of the head
of the estuary, maintained by the Department of Water Affairs and Forestry. Rainfall
data were supplied by the South African Weather Service for the weather station
00062235 at Haasvlakte (34°13’S, 19°08’E) situated within the catchment area of the Bot
River. Summer and winter are defined as October–March and April–September for
residents and as September–April and May–August for migrants, respectively.
Correspondence Analysis (CA) was used to assess the relationship between species
abundance and the eleven estuarine phases. Correspondence analysis was selected
because it would determine the association between waterbird composition and the
hydrological conditions associated with each estuarine phases (the data matrix) and
display these in graphical two dimensional plots (Greenacre 1984). The interpretation of
these plots is based on the clusterings of the two “clouds” of points representing the rows
(species) and columns (wetland state) of the data matrix and in understanding why they
are clustered (Underhill & Peisach 1985). In the plots generated by the correspondence
analysis, a cluster of row points plotted close together represent sites which have a
similar species composition and a cluster of column points plotted close together
represent species which have a similar pattern of occurrence across the sites. When
plotted, each plot represents the first principal plane of the correspondence analysis, and
contains the maximal amount of information from the data basis, in relation to a set of
criteria described by Greenacre (1984). The correspondence analysis was carried out
using function CA of the package SensoMineR in program R v. 2.15.0 (R Development
Core Team 2012), and was performed using a mean species count and estuary phase
matrix. The results were then plotted using graphical functions in program R.
I then examined which hydrological variable (see above) could best explain the
variability in the waterbird composition during the different estuarine phases. Linear

123
models were fitted to the row scores (wetland states) of the first CA dimension. Akaike's
An Information Criterion (AIC) (Sakamoto et al. 1986) was used to determine the
goodness of fit of the models based on the explanatory variables used.
To assess the waterbird conservation value and assign conservation importance
during the estuary’s hydrological changes, I calculated WCV scores per month and per
estuarine phase for all species; scores were computed and interpretations made based on
methods outlined in Chapter 2. Colour-coded histograms and radar plots were used to
graphically display the results.
I make reference to six-monthly surveys from July 1993 to June 2002 (Harebottle
and Delport 2000) as needed, particularly when these data show comparative results
during a breaching event. However, interpretation of the six-monthly surveys should be
viewed with caution because the time between surveys is too broad to give clear
indications of trends or patterns for the entire population or individual species.
Nevertheless, certain conclusions can be drawn and these are made using results from
the present study and previous studies (e.g. Heÿl and Currie 1985).
Results
Physio-chemical conditions
During the study period, the Bot River Estuary shifted through 11 phases (Table 4.2,
Figure 4.2). During the initial lake phase (February 2002–August 2003), the water-level
in the estuary averaged 2.53 above MSL with a maximum of 2.88 above MSL in July
2002. Salinity values in July and August 2003 averaged 7.1 p.p.t., an essentially
freshwater system. The sand barrier was breached in August 2003 which opened the
mouth and the estuary became inter-tidal. Water-levels had dropped by 1.66 m to 1.12 m
above MSL and salinity increased five-fold to 30.7 p.p.t. indicating the commencement of
the estuary phase. By December 2003 salinity levels had gradually increased to 38.2
p.p.t. After the mouth closed in January 2004, water-levels decreased and reached 0.85
m above MSL in May 2004 (Figure 4.2). At the end of the lagoon phase in March 2005,
one year after the closure of the mouth, water levels had increased to 1.6 m above MSL.
The winter rains resulted in salinity decreasing to 19.8 p.p.t. in October 2004 and after
the dry season, it increased to 26.1 p.p.t. in March 2005.
The start of the 2005 winter rains in April 2005 heralded the beginning of the
second lake phase (Figure 4.2) with water-levels rising to 3.2 m above MSL in June
2005, the highest recorded during the study period. Levels averaged 2.5 m above MSL
during this phase and by June 2006 had dropped to 1.9 m above MSL; levels had
increased to 2.2 m above MSL two months later in August 2006. Salinity dropped to
124
7.2 p.p.t. in April 2005 and averaged 8.8 p.p.t. for the rest of this phase. The second
estuarine phase started in late August 2006 after the estuary was artificially breached;
water-levels dropped to 1.1 m above MSL and salinity increased to 15.8 p.p.t. in
September 2006. The mouth closed in October 2006; salinity increased to 19.4 p.p.t.
During the subsequent lagoon phase, water-levels averaged 1.1 m above MSL but ranged
from 0.8 m above MSL in February 2007 to 2.2 m above MSL in July 2007. Salinities
ranged from 26.5 p.p.t. in February 2007 to 15.7 p.p.t. in July 2007 and averaged
25.3 p.p.t. Water-levels during the third lake phase averaged 2.4 m MSL while salinity
averaged 7.4 p.p.t. The third mouth opening during the study period resulted in water-
levels dropping to 0.9 m above MSL in November 2008 from a level of 2.3 m above MSL
in July 2008. The estuary’s salinity rose from 7.4 p.p.t. to 28.5 p.p.t. during the same
period. The lagoon phase that followed until the end of the study period showed little
variability in salinity and water-level values (Table 4.2).
Rainfall and run-off
Most rain, on average, fell from June–August (> 80 mm/month) with a peak in July; the
driest months were from December–March (< 30 mm/month) (Figure 4.3a). The months
with the highest mean winter and lowest summer rainfall were July (104 mm) and
January (17 mm) respectively.
There were inter-annual fluctuations in seasonal rainfall (Figure 4.3b). The
wettest winters occurred in 2005 (632 mm) and 2006 (602 mm); 2004 (336 mm) and 2003
(381 mm) were the driest. The wettest summers were 2006/07 (369 mm), 2007/08
(322 mm) and 2003/04 (320 mm); other summers had more than 300 mm of rainfall. The
driest summers were 2004/05 (120 mm) and 2008/09 (134 mm).
The inflow rate was correlated to rainfall (r = 0.79, p < 0.001). Mean winter flow
rates from 2002–2005 were considerably lower than those from 2006–2010 (Figure 4.4).
The highest mean flow rate was recorded in November 2008 (8.2 m3/sec.) and the lowest
during January 2004 (0.024 m3/sec.). The highest maximum flow rate of 212 m3/sec was
recorded during November 2008 when 200 mm was recorded in a flood event. The
620 mm of rain recorded during the five-month period ending November 2008 resulted in
a large flow-rates into the estuary which raised water-levels and which led to decision to
breach the estuary artificially already in September 2008.
Waterbird composition, abundance and seasonality
A total of 55 waterbird surveys was carried out at the Bot River Estuary between
February 2002 and February 2010 and 86 species of waterbirds were recorded. Of these,

125
66 were residents and 20 were Palearctic migrants. Twenty-three species (27%) were
recorded on fewer than 25% of surveys or in small numbers (Table 4.3). Of the focal 63
species, 38 contributed more than 95% of the total abundance of waterbirds at the
wetland; of these 33 were residents and five were Palearctic migrants (Table 4.3).
Overall, waterbird abundance ranged from 1 095 birds (May 2005) to 17 290
(August 2003) (Figure 4.5). Mean summer abundance was 4 559 ± 2 664 and winter
abundance 5 266 ± 2 759 (Table 4.3). Large fluctuations in abundance occurred
throughout the study period and were associated with changes in hydrological conditions
(Figure 4.5). Red-knobbed Coot was the dominant species and accounted, on average, for
35% of all waterbirds in summer and 57% in winter (Table 4.3). Fluctuations in
abundance were less pronounced when the Red-knobbed Coot was excluded from the
analysis highlighting the species’ dominance at the estuary, particularly under lake
conditions (Figure 4.5). August had the highest mean count of 6 493 waterbirds and May
the lowest count of 3 075. During the study period, peak counts of for species (Greater
Flamingo, Common Tern, Sandwich Tern and Yellow-billed Duck) exceeded 2 000 birds
on one occasion; Red-knobbed Coot exceeded this level during 19 surveys.
There was no clear overall seasonal pattern for waterbirds; migratory shorebirds
and terns revealed usual austral summer seasonal occurrence and generally started
arriving in November and departed by April (Figure 4.6). Some species from the resident
waterbird community showed seasonal patterns of occurrence. Of the waterfowl,
Egyptian Goose, Yellow-billed Duck, Spur-winged Goose, Southern Pochard and Great
Crested Grebe showed the strongest seasonal patterns; all except Southern Pochard
showed high abundance during summer, the pochard occurred mainly during winter and
early summer (Figure 4.7). Greater Flamingo numbers were, on average, larger in
summer (September–January). Black-winged Stilt numbers showed notable increases in
summer (October–February); Kittlitz’s Plover numbers were higher from December to
February with an exaggerated March peak (Figure 4.8).
Other species that reveled seasonality included Reed Cormorant and African
Darter; their numbers were, on average, higher in late winter (July–September); in
contrast White-breasted Cormorant was more abundant in late summer and early winter
(February– May) (Figure 4.8). Caspian Tern showed strong late summer peaks at the
estuary from January to March (Figure 4.8). For Palearctic shorebirds, numbers of Little
Stint peaked in March and Curlew Sandpiper in January. Both species started to arrive
in small numbers from September–November. Most Little Stints had arrived by
December, while Curlew Sandpipers showed their major influx in January (Figure 4.8).

126
Curlew Sandpiper populations departed abruptly in April. Small numbers of Little Stint
were still present in April; all birds had departed by May (Figure 4.8).
Changes in abundance and composition during different phases
General changes and patterns
Total waterbird numbers varied at the estuary and fluctuated widely between the
different phases (Table 4.4) over the study period; there was a general pattern of
decreases in overall abundance after breaches occurred (i.e. estuarine phases) when the
system was open to the sea followed by increases during the lagoon and lake phases
when the system was closed to the sea (Figure 4.9).
Prior to the August 2003 breach, during the first lake phase, the mean abundance
was 10 593 waterbirds. Numbers then declined by 24%, to 8 109 birds, during the first
estuarine phase (after the mouth was opened) and during the first lagoon phase
decreased, on average, by a further 41% to 2 664 birds. The second lake phase saw a 75%
increase in numbers (4 865 birds) which was followed by a 40% decrease, to 3 012 birds,
after the second mouth opening in August 2006 and then a 30% increase, to 3 880 birds,
during the next lagoon phase. Numbers continued to increase during the third lake
phase and averaged 6 961 birds. This was followed by a 30% decline during the third
estuarine phase when the mouth was breached in September 2008, and a further 11%
decline by the time the next lagoon phase ended; numbers by the end of the latter phase
averaged 2 696 birds. Natural breaching of the sandbar in July 2009 occurred before the
lagoonal state could shift into a more freshwater lake phase; mean waterbird numbers
declined again by a further 30%, to 1 877 birds during the fourth estuarine phase. After
the mouth closed in December 2009 to the end of the study period in February 2010
mean waterbird numbers increased by 61%, to 2 785 birds, from the estuarine phase.
Phase by phase breakdown
Table 4.4 and Figures 4.9, 4.10 and 4.11 show the changes in species and species group
abundance during each of the eleven phases of the estuary for the study period. Prior to
the August 2003 breach (i.e. the first lake phase), waterfowl dominated the waterbird
community and comprised 87.8% of all birds at the estuary; of this Red-knobbed Coot
comprised 72.4% and was the most abundant species at the estuary during this phase
(Figure 4.10). Following the breaching event, and during the first estuarine phase, Red-
knobbed Coot declined, on average, by 41%. Numbers of resident shorebirds and resident
gulls tended to increase when the mouth was tidal and showed increases of 24% and 65%

127
respectively. Flamingos were also abundant during this phase with numbers showing an
eight-fold increase over the first lake phase.
After closure of the mouth, Red-knobbed Coot numbers continued to decline
during the first lagoon phase; a further 95% reduction was noted. Large declines were
also reported in populations of Red-Billed Teal (76%), Cape Shoveler (42%), Great
Crested Grebe (38%), Little Grebe (77%), Greater Flamingo (68%) and Hartlaub’s Gull
(43%) during this phase. Interestingly, Yellow-billed Duck and Spur-winged Goose
numbers showed an increase of 54% and 130% respectively. White-breasted Cormorant
and Kittlitz’s Plover showed, on average, a two-fold increase, in numbers. During the
second lake phase Red-knobbed Coot populations recovered and showed an 11-fold
increase; other waterfowl that showed increases were Egyptian Goose (156%), Yellow-
billed Duck (77%), Cape Shoveler (145%) and Little Grebe (520%). Great Crested Grebe
numbers declined by 62% during this phase. Greater Flamingos continued to decline and
numbers decreased by a further 89% in the second lake phase. Kittlitz’s Plover numbers
declined by 52% at the site during this phase.
During the second mouth opening from August–October 2006, Red-knobbed Coot
(28.8%) dominated but showed a 65% decline in numbers from the previous lake phase.
Hartlaub’s and Kelp Gull numbers increased by 148% and 53% respectively and
comprised 9.6% and 9.1% of the overall waterbird community at the estuary. Other
species that showed considerable increases included Great White Pelican (285%), Little
Egret (165%), African Sacred Ibis (102%), African Darter (80%), Blacksmith Lapwing
(44%) and Kittlitz’s Plover (33%). Although Yellow-billed Duck, Egyptian Goose, Reed
Cormorant and Cape Shoveler numbers declined during this period they still comprised
the dominant group of species at the estuary; combined they constituted 22.2% of all
waterbirds.
Red-knobbed Coot numbers declined by a further 34% in the second lagoon phase
and although they dominated the waterbird community comprised 15% of all waterbirds
at the estuary (Table 4.4). Greater Flamingo was the next dominant species and
comprised 11.9% of all waterbirds and showed an almost 500-fold increase from the
previous phase. Cape Cormorant was absent from all previous phases as an abundant
species but comprised 3.4% of the total waterbird population during this phase. Notable
declines in numbers were noted for African Darter (72%), Cape Shoveler (54%) and
Egyptian Goose (35%), and numbers of Hartlaub’s and Kelp Gulls showed decreases of
11% and 39% respectively. In contrast, a range of species showed significant increases
including African Spoonbill (818%), White-fronted Plover (631%), Black-winged Stilt

128
(227%), Three-banded Plover (191%), White-breasted Cormorant (105%), Black-necked
Grebe (58%) and Great Crested Grebe (63%).
During the third lake phase, Red-knobbed Coot and Yellow-billed Duck comprised
half of all waterbirds present; they constituted 39.8% and 10.2% respectively. Reed
Cormorant and Common Tern were the next most abundant species and comprised 6.6%
and 5.5% respectively. Numbers of three waterfowl species increased by over 300%
during this phase, namely Red-knobbed Coot (375%), Yellow-billed Duck (345%) and
Spur-winged Goose (314%). Cape Shoveler, Sandwich Tern and Egyptian Goose numbers
increased dramatically, showing 289%, 249% and 168% increases respectively. Reed
Cormorant numbers almost doubled, while Common Tern numbers increased by 60%
during this phase. Species with notably declining population numbers included Greater
Flamingo (92%), Little Stint (91%), African Spoonbill (72%) and Kittlitz’s Plover (44%).
Three species constituted 70% of all waterbirds during the third estuarine phase:
Common Tern (35.7%), Sandwich Tern (21.6%) and Red-knobbed Coot (13.6%). Other
resident species that comprised substantial proportions of the waterbird community
were Kelp Gull (5.8%), Hartlaub’s Gull (3.9%), African Sacred Ibis (3.3%) and Reed
Cormorant (2.2%). Up to 26 species showed more than 50% declines during the third
breaching of the study period; Black-necked Grebe and Little Grebe showed 100%
declines (Table 4.4).
The third lagoon phase comprised mainly Kelp Gull (24.2%), Reed Cormorant
(20.9%) and Cape Cormorant (8.0%); these three species supported up to 53% of the
waterbirds present at the estuary during this phase (Table 4.4). Red-knobbed Coot
numbers declined by 81% and constituted 4.7% of all waterbirds. Egyptian Goose
numbers increased by 82%; most other waterfowl did not show any large increases or
declines, except for Little Grebe and Great Crested Grebe which increased in numbers
(Table 4.3). Greater Flamingos disappeared from the estuary during this phase. The
cormorant species and African Darter showed large (60%–438%) increases; Hartlaub’s
Gull showed declines of 47% and Kelp Gull numbers were 2.5 times greater than during
the previous phase (Table 4.4).
There was no third lake phase as the estuary breached during the third lagoon
phase before lake conditions prevailed. During the fourth estuarine phase, Kelp Gull
(30.7%), Greater Flamingo (19.9%) and Hartlaub’s Gull (12.5%) comprised 63% of the
entire estuarine waterbird community. Red-knobbed Coot was virtually absent from the
system during this phase; numbers had declined by a further 98% since the third lagoon
phase. All three cormorant species showed large (> 85%) declines; additional notable

129
declines were noted for Yellow-billed Duck, Little Grebe, Great Crested Grebe, Swift
Tern, African Sacred Ibis, Little Egret and Grey Heron.
The fourth lagoon phase was the final phase of the study period and showed a
more evenly distributed group of species that dominated the waterbird community; this
evenness was similar to that of the other lagoon phases. Five species contributed to 60%
of all waterbirds: Little Stint (19.1%), Kelp Gull (17.7%), Common Tern (11.5%),
Kittlitz’s Plover (8.7%) and Greater Flamingo (7.0%) (Table 4.4). Yellow-billed Duck
continued to show declines, numbers dropped by a further 83%, while other species that
showed significant declines included Black-winged Stilt (95%), Hartlaub’s Gull (65%)
and Egyptian Goose (30%). Red-knobbed Coot were low (averaging three birds). Some
species showed notable increases in numbers: there were six-fold increases in African
Sacred Ibis and Kittlitz’s Plover populations, Reed Cormorant increased by 120%, Little
Egret by 92% and Spur-winged Goose by 75%. All Palearctic migrant populations showed
substantial increases except for Common Greenshank which showed a decline of 20%
(Table 4.4).
Species sensitivity to changing phases
Results for the sensitivity analyses are presented here for the lake, estuarine and lagoon
phases respectively, and then summarized across all phases for all species to gauge
general responses for species and/or guilds.
For the lake phase, 22 species scored mean values larger or equal to zero (least
sensitive) and 16 species smaller than zero (more sensitive) (Table 4.5). Red-knobbed
Coot, Little Grebe, Cape Shoveler, African Darter, Yellow-billed Duck, Egyptian Goose,
Cattle Egret and Reed Cormorant were the least sensitive to lake conditions; Greater
Flamingo, Common Greenshank, Southern Pochard, Little Stint, Kittlitz’s Plover, and
African Spoonbill the most sensitive. There was some mixture of feeding guilds during
this phase in how birds responded, but the data did show piscivores and herbivores
showing greater preference for lake conditions compared with invertebrate feeders
(Table 4.8).
When the estuary was tidal and estuarine conditions prevailed, 30 species showed
a negative response to these conditions; mean indices for only seven species were positive
(Table 4.6). Of these seven species, Common Greenshank, Kittlitz’s Plover, and Southern
Pochard responded positively to inter-tidal conditions; Little Grebe, Cape Cormorant,
Black-necked Grebe, Cattle Egret, Red-knobbed Coot, Swift Tern, Hadeda Ibis, Yellow-
billed Duck and Cape Shoveler showed the least preference (Table 4.6). None of the
feeding guilds showed a preference for the estuarine phase.

130
The lagoon phase showed 26 species that, on average, responded positively to the
higher water-levels and decreased salinities that occurred during this phase; 12 species
showed less tolerance (Table 4.7). The species that showed greatest sensitivity were
Southern Pochard, Red-knobbed Coot, African Darter, Hartlaub’s Gull, Cape Shoveler
and Red-billed Teal. Swift Tern, Little Stint, Black-necked Grebe, Cape Cormorant,
Caspian Tern, Curlew Sandpiper and Reed Cormorant showed the greatest tolerance to
these conditions. In contrast to the lake phase, piscivores and invertebrate feeders
showed greater preference for lagoon conditions compared with herbivores which were
mainly intolerant of conditions (Table 4.8).
In summary, species and guild responses fluctuated between the different phases
(Table 4.8). Waterfowl had varying responses. Red-knobbed Coot, Cape Shoveler, Yellow-
billed Duck, Red-billed Teal and Egyptian Goose all preferred the lake phases and were
not able to tolerate estuarine or lagoon conditions. Cape Teal, Great Crested Grebe and
Black-necked Grebe all responded with preference for lagoon conditions but not for the
lake or estuarine phases. Little Grebe and Spur-winged Goose preferred lake and lagoon
conditions. Southern Pochard was the only waterfowl species that tolerated estuarine
conditions.
All three cormorant species preferred lake and lagoon conditions; African Darter
was unable to adapt to estuarine or lagoon phases (Table 4.8). Of the waders, Cattle
Egret, Hadeda Ibis and Grey Heron showed preference for the lake and lagoon phases,
while Little Egret and Greater Flamingo preferred the lagoon phase. Large shorebirds
such as Blacksmith Lapwing and Black-winged Stilt showed preference for lake
conditions; the smaller Thee-banded Plover and White-fronted Plover preferred the
lagoon phase, and Kittlitz’s Plover was dominant in the estuarine phase. Hartlaub’s Gull
response was more positive during the estuarine phase compared to Kelp Gull which
responded well to both estuarine and lagoon phases. Both Caspian and Swift Terns
showed a strong preference for lagoon conditions, although Caspian Tern also showed a
positive response to lake conditions. Great White Pelican showed a constant positive
response during all three phases. Pied Kingfisher did not tolerate estuarine conditions.
Species in the Palearctic migrant group showed variable responses. Smaller
shorebirds such as Curlew Sandpiper and Little Stint preferred the lagoon phase, the
longer-legged Common Greenshank showed preference for estuarine conditions.
Common Tern and Sandwich Tern, responded well to the lagoon phase although
Sandwich Tern also showed strong links with the lake phase and Common Tern with the
estuarine phase.

131
The lagoon phase supported the largest number of species (26) that showed a
positive response, followed by the lake phase (20) and the estuarine phase (8) (Table 4.8).
In contrast, 30 species responded negatively in the estuarine phase, 18 in the lake phase
and 12 in the lagoon phase. The estuarine phase had the smallest ratio of negative to
positive responses (1:0.27), followed by the lake phase (1:1.1) and the lagoon phase
(1:1.7). Lake conditions thus provided a more even spread of species, while the estuarine
phase showed one in every four species responding negatively and the lagoon phase one
in every two species responding positively.
Waterbird and estuary phase associations
The correspondence analysis (CA) initially revealed Common Tern and Sandwich Tern
as distinct outliers compared with the rest of the data points which were tightly grouped
within the CA plot. This distinction resulted because of large abundance values for both
species (Table 4.3). This made it difficult to interpret the underlying associations of the
remaining data points. Because both species are Palearctic migrants and utilise the
estuary only as a roost site (see below), and in order to elucidate the overall patterns,
both terns were removed from the primary analysis and included as supplementary
columns; this allowed the CA to reveal the structure hidden by the dominant effect of the
two terns. The resultant plots provided a more robust output of the association between
species abundance and the 11 estuarine phases.
Figures 4.12 and 4.13 show the final plots for the CA; the latter providing a
detailed look at the core data points in Figure 4.12. The first axis explained 45.5% of the
inertia and can be interpreted as a water-level–salinity gradient (see next section for
details); phases with high water levels and low salinities are represented on the far left
of the x-axis and those with low water-levels and high salinities on the far right of the x-
axis. The second axis explained 21.9% of the inertia. No clear environmental component
could be identified from this axis.
The plot of the first two axis of the CA (Figure 4.12) shows a strong association of
‘short-legged’ migratory shorebirds with the fourth lagoon phase. This phase had the
lowest overall mean water-level (Table 4.2) which probably accounted for these species
making use of increased shoreline and open mudflat habitats during the dry, summer
months. A close-up on the central area (Figure 4.13), revealed some variation and
overlap in species-estuarine relationships but some associations were noticeable: (a) a
waterfowl and ‘long-legged wader/shorebird’ component in the top left and bottom left
quadrants associated with lake phases, (b) a cormorant and ‘long-legged wader’ grouping
in the top right quadrant which is associated with lagoon and estuarine phases of the

132
estuary; interestingly all three gull species (Hartlaub’s, Kelp and Grey-headed) were also
grouped in this quadrant, (c) a predominantly ‘short-legged shorebird’ component was
identified in the bottom right quadrant associated with saline estuarine conditions;
South African Shelduck was the only waterfowl species placed in this quadrant.
Species plotted between the water-level–salinity extremes on the x-axis would
generally be classified as species tolerant of either high- or low-water levels or high or
low salinities and have stronger or weaker affiliations to either of these conditions
depending on their location within the plot.
Modelling CA scores with hydrological variables
Seven models were considered (Table 4.9). Model selection favoured a model that
considered water depth as the primary hydrological variable driving changes in the
waterbird community during each of the eleven estuarine phases (r = 0.69, p < 0.01)
(Figure 4.14). Model 2 was also significant, but because water depth and salinity were
strongly correlated (r2 = 0.853, p < 0.0001) and the higher AIC of Model 1, Model 2 was
not considered further. None of the other five models considered were significant
(Table 4.9). Similar models were fitted for the second CA axis but none of these were
significant (results not shown).
In Model 1 (Figure 4.14) the lake phases were separated widely from the lagoon
and estuary phases; the latter phases were more variable, and showed no clear
separation but tended to reflect a single cluster. The plot showed clear separation of a
high water-level/low salinity and low water-level/high salinity patterns at the estuary
which are responsible for the changing waterbird composition.
Long-term trends of waterbirds to changing conditions at the estuary
Although most of the waterbird guilds showed fluctuating populations over the study
period, some guilds and certain species were more badly impacted than others by the
changing conditions. The waterfowl and cormorant-darter guilds showed the largest
declines, populations of these guilds declined by 97% and 76% respectively between the
first lake and the final lagoon phases (Table 4.8); nine out of 11 waterfowl species
declined by more than 95%. Southern Pochard, Red-knobbed Coot, Little Grebe and
Great Crested Grebe were the most impacted of the waterfowl species, and within the
entire waterbird community; their numbers declined rapidly after the first breach in
August 2003 and never recovered for the remainder of the study period. They showed the
greatest intolerance to the dynamics of the estuary. Cape Teal, Red-billed Teal, Yellow-
billed Duck, Cape Shoveler and Black-necked Grebe numbers showed greater

133
fluctuations after the August 2003 breach but did occur at similar levels, at least once,
before the third breach in September 2008; following this breach their numbers declined
rapidly. These species were thus better able to respond to the changing conditions at the
estuary between August 2003 and September 2008, and were able to tolerate the
changing salinities and water-levels better than the Southern Pochard, Red-knobbed
Coot, Little Grebe and Great Crested Grebe. Egyptian Goose declined by 54%.The Spur-
winged Goose was the only species whose populations increased; in this case by 46%. The
increase in Spur-winged Goose populations is more likely linked to increases in regional
populations (Siegfried 1964, Harebottle 2003) than to conditions at the estuary. Like
Egyptian Geese, Spur-winged Geese feed in the surrounding agricultural croplands and
use the Bot River Estuary as a safe daytime refuge and moult site. Wheat, the
predominant cereal crop in the region, is harvested in November–December (Anon. 2009)
which provides the geese with harvest debris from February–March, their peak time of
abundance at the estuary. The widespread availability of food and the small dams
provided by agricultural activities have most likely led to the increase in Spur-winged
Goose populations in the area surrounding the estuary.
Within the cormorant-darter guild, African Darter showed the largest declines
(97%); Reed Cormorant had the smallest declines, at 67%. Other species that showed
overall negative trends were Hartlaub’s Gull, Black-winged Stilt, Blacksmith Lapwing,
White-fronted Plover, Caspian Tern, African Spoonbill, Hadeda Ibis, Cattle Egret and
Grey Heron (Table 4.8).
Responses of feeding guilds
Results are presented for herbivores, piscivores and invertebrate feeders. Carnivorous
species were omitted because they comprised only two species (African Marsh Harrier
and Black Harrier) and constituted less than 0.1% of the total biomass. The three guilds
responded differently to the changing conditions at the estuary.
Herbivores constituted the smallest guild (14 species) but their numbers and
associated biomass showed the greatest fluctuation between each of the phases. They
were the most abundant guild during all lake phases when they dominated the
waterbird community. They were most numerous during the first lake phase both in
terms of abundance and biomass; here they constituted 80% of all waterbirds at the
estuary and comprised 9.1-tonnes (84.5 %) of the total waterbird biomass (Figures 4.15a,
b). Red-knobbed Coot comprised by far the greatest numbers within this group during
the lake phases. By the end of the third lagoon phase herbivore numbers had dropped,
on average, by 60% and biomass was reduced to 0.61 tonnes (Figures 4.15a, b).

134
The invertebrate feeders comprised the largest foraging guild with 50 species.
Overall, they were the second most abundant group at the estuary over the 11 phases
and showed fluctuations between phases; peak abundances coincided with either
estuarine or lagoon conditions (Figure 4.15a, b), when water-levels were low. The first
estuarine phase and fourth lagoon phase showed the largest numbers on average, 2 507
and 2 066 birds respectively. In terms of biomass, they contributed 4.3 tonnes (43%) to
the total biomass during the first estuarine lagoon phase (Figure 4.13); in the second and
third estuarine phases their contributions dropped to 0.64 tonnes and 0.63 tonnes
respectively. The fourth estuarine phase recorded 1.8 tonnes of invertebrate feeders,
their second largest contribution during the study period.
Less inter-phase variation was recorded for piscivores. They dominated in
biomass during the second lake and third lagoon phase; numbers remained relatively
stable prior to the third lake phase but showed fluctuations following the third breaching
(Figure 4.15a, b). Overall, this group did not tend to show a preference for any specific
phase of the estuary’s open-closed cycle.
Species thresholds and Waterbird Conservation Value (WCV) scores
A total of 13 species reached global (Ramsar) population thresholds (Table 4.10) during
the study period (Wetlands International 2006). Four species, Great Crested Grebe,
White-breasted Cormorant, Caspian Tern and Hartlaub’s Gull, passed these levels on
more than 10 occasions; Great Crested Grebe recorded globally important populations on
22 surveys (40%). Eight species, Cape Shoveler, Caspian Tern, Great Crested Grebe,
Greater Flamingo, Hartlaub’s Gull, Swift Tern, White-breasted Cormorant, Yellow-billed
Duck, occurred at levels that surpassed double the 1% threshold for southern Africa.
Seventeen species reached or surpassed sub-regional 0.5% Important Bird Area
population thresholds (Table 4.10, Barnes 1998) without reaching 1% thresholds; this
includes the 13 species above that reached 1% levels. The four additional species that
reached these thresholds included Black-winged Stilt, Southern Pochard, White-backed
Duck and White-fronted Plover (Table 4.10). Four species passed this threshold on more
than 10 occasions: Great Crested Grebe, White-breasted Cormorant, Caspian Tern and
Hartlaub’s Gull; Caspian Tern reached sub-regional levels 14 times during the surveys
(25%).
In terms of South Africa’s Western Cape Province, the Bot River Estuary
supported 34 species which had maximum counts representing 5% or more of the
estimated provincial populations for each species; four of these species contributed more

135
than 20%: Sandwich Tern (49.8%), Great Crested Grebe (26.6%, Southern Pochard
(23.5%) and Red-knobbed Coot (20.6%) (Table 4.10).
The Waterbird Conservation Value (WCV) scores for each survey fluctuated
widely (Figure 4.16). Eight surveys scored 10 or more and the survey in February 2003
exceeded 12. Generally, scores peaked in summer (October–April); May 2007 and May–
June 2008 showed winter peaks. Surveys between May 2005 and November 2005 had
the lowest WCV scores. The mean summer and winter scores were 6.83 and 5.16
respectively (Table 3.1).
I found that changes that contribute to the WCV score in the different phases the
most interesting aspect of Figure 4.17. The lake phase had the highest mean WCV score
(7.78) for each of the three phases; the lagoon (5.83) and estuary (5.22) phase had similar
scores (Table 4.11). From the first lake phase to the second estuary phase there was a
45% decline in the score (from 8.37 to 4.35), and the number of species with important
threshold populations dropped from eight to three. There was an increase in the
composition of threshold species and the score during the following two phases and by
the end of the third lake phase the WCV score had doubled to 9.60. The third estuarine
phase had a 54% drop in both important species and the following three phases revealed
only small changes to the overall index; similarly, threshold species did show some
change during these three phases. It should be noted that the estuarine phases, except
for the first estuarine phase, showed the lowest indices scores and the lake phases the
highest scores.
The composition of priority species contributing to the overall WCV score
described above are shown in Figures 4.18a, b. Twelve species contributed between
75–93% to the overall WCV scores in each phase; five species had scores of at least 1.0 in
any one phase (Ramsar thresholds) and seven species with scores between 0.50–0.99
(Sub-regional IBA thresholds). Important species were Great Crested Grebe, White-
breasted Cormorant and Caspian Tern; each had WCV scores of 1.0 or more on three
occasions (Table 4.11). Figure 4.19 shows the relationship between the monthly WCV
scores and the number of species reaching or surpassing the 1% threshold levels. There
was a strong linear relationship (r = 0.75, p < 0.01) indicating that high indices are
usually associated with more species reaching 1% thresholds; in March 2005 and
February 2006 large WCV scores occurred but only two species reached the 1%
thresholds. Similar relationships were obtained for the site analyses presented and
described in Chapter 3.

136
Threatened and endemic waterbirds at the Bot River Estuary
Thirteen of the 88 waterbirds recorded at the Bot River Estuary are listed in the South
African Red Data Book (Barnes 2000): three as Vulnerable (Bank Cormorant, African
Marsh Harrier and Blue Crane), and nine as Near-threatened (Great White Pelican,
Cape Cormorant, Crowned Cormorant, Greater Flamingo, Black Harrier, African Black
Oystercatcher, Chestnut-banded Plover, Caspian Tern and Half-collared Kingfisher).
Eight species are endemic to southern Africa (Hockey et al. 2005): Bank Cormorant,
Cape Cormorant, Crowned Cormorant, Black Harrier, Hartlaub’s Gull, African Black
Oystercatcher, Blue Crane, South African Shelduck and Cape Shoveler. Of all the
threatened and endemic species only the Cape Shoveler has been reported breeding at
the estuary (M. Delport pers. comm.).
Discussion
Waterbird fluctuations and estuary phase associations
The results demonstrated that the shift to estuarine conditions associated with a
breaching event impacted on the waterbird occurrence and abundance at the estuary.
The system was subject to cyclical changes every 2–3 years, depending on the frequency
of mouth breachings. Physiochemical properties and water-levels cycled through three
phases: lake phase, open, tidal estuarine system phase, and lagoon phase. Each phase
was characterized by varying water depths and salinities. These two environmental
variables had direct impacts on the estuarine ecosystem and resulted in the waterbird
community changing from one phase to the next. Water-level and salinity were thus the
ultimate drivers of waterbird occurrence and abundance at the estuary; this was a
primary outcome of the correspondence analysis and modeling (Figures 4.12, 4.13 and
4.14).
Waterfowl (ducks, geese, grebes and coot) were the dominant species group and
had the largest influence on the overall waterbird abundance patterns observed at the
estuary during the study period (Figure 4.9); influxes of large numbers of cormorants,
Greater Flamingos, and migratory shorebirds and terns occurred during different phases
(Figure 4.9) but these influxes of birds were sporadic and had negligible impacts on the
observed overall waterbird abundance at the estuary. Due to its dominance, Red-
knobbed Coot was focal in determining the changes to the overall abundance of
waterbirds through each phase. When the coot was excluded from the analyses,
waterbird populations fluctuated less and did not exhibit a strong overall decline
(Figure 4.5).

137
How exactly did the hydro-dynamics at the estuary impact on waterbirds over the
study period? Overall, changes in the waterbird community varied spatially and
temporarily; there was a general pattern of a waterfowl-‘long-legged’ wader/shorebird
dominated community when the lake phases occurred and a predominantly ‘short-legged’
shorebird/wader-dominated community when estuarine conditions existed (Figures 4.12,
4.13 and 4.14). A more cosmopolitan community occurred during the lagoon stage. The
changing waterbird communities were strongly associated with the changing physio-
chemical conditions in the estuary, i.e. fluctuations in water-levels and salinity, which
were determined by the open-closed cycles of the mouth. These lake-estuarine cycles
modified the habitats that were available to waterbirds and these habitat induced
changes impacted on the way different guilds made use of the estuary.
During this study, artificial breaches usually occurred in August or September,
given the hydrological conditions, this is the most likely period for them to occur (van
Niekerk 2005, Anon. 2008). Coupled with falling water-levels, inter-tidal conditions alter
the extent and availability of exposed shoreline and mudflats that utilized by waders
and shorebirds; the Palearctic shorebirds arrive at the estuary during this period after
migration. The shallow, exposed muddy and shoreline habitats, created during and after
an August or September breaching event, supported more Palearctic shorebirds than
when the mouth was closed and water levels were higher (Figure 4.9). This suggests that
migrant shorebirds prefer these conditions and will be more abundant in years after
breaches occur. For waterfowl, breaches are too short to have an immediate impact on
numbers but increased salinities and turbidity (van Niekerk et al. 2005) provide
unsuitable conditions for most waterfowl species, and particularly the Red-knobbed Coot.
As the estuary filled after the mouth closed, salinities dropped to below 15 p.p.t.
and primary productivity increased under increasingly freshwater conditions. This led to
a recurrence and dominance of waterfowl which usually occurred with the start of the
winter rains in May–June in the year following a breach. Red-knobbed Coot numbers
exhibited this pattern; they were almost absent until after the first mouth closure in
January 2004, and by August 2004 had increased to about 800 birds. A year later, in
August 2005, the number of coots increased to 1 420 and reached 7 100 birds in June
2006 shortly before the August 2006 breach. Thus, Red-knobbed Coot populations
recovered steadily over a period of two years following a breach.
The degree of change to the system’s physiochemical composition is strongly
linked to the length of time the mouth remained opened or closed. The longest time the
mouth remained open was five months, after the breach in August 2003 while the
shortest was two months; mouth closure is dependent on the development of on-shore

138
currents; these enhance the development of the sand-bar across the mouth (Branch et al.
1985). The longer the mouth remains open and the longer the connection to the sea, the
greater the fish recruitment and establishment of estuarine conditions over a longer
period; shorter mouth closures lead to less marine influences, poorer fish recruitment,
less diverse estuarine faunal communities and a quicker return to freshwater conditions
(Branch et al. 1985).
A long period of opening is advantageous for wader/shorebird communities as
more open shoreline and mud-flat habitats persist for longer; in contrast, a short period
allows the system to shift into to a lake phase sooner which favours the waterfowl
communities particularly when coupled with long mouth closures. For example, when
the estuary was closed to the sea for long periods (31 and 23 months after the 2003 and
2006 breaches respectively) waterfowl, and in particular Red-knobbed Coot, populations
returned in large numbers. These ‘closed’ periods, which last up to three years (Branch
et al. 1985), are characterised by high primary productivity, especially of aquatic
macrophytes, which grow rapidly in low-salinity water and provide abundant food for the
coot and other waterfowl species. If inter-breach periods are short saline conditions
persist for longer and the system is unable to shift into a lake phase. This occurred
between the mouth closure in February 2009 and the mouth opening in May 2009. This
five-month period maintained salinities close to 30 p.p.t at the estuary; in February
2010, nine months after the May 2009 mouth opening salinity approached 35 p.p.t,
almost that of seawater. Due to the estuary persisting in a high-saline condition for
c. 16 months (September 2008 – February 2010) waterfowl and cormorant-darter
populations were unable to recover while shorebird populations showed increases.
Day (1981) showed that hypersaline conditions are detrimental to estuarine
primary productivity, including phytoplankton and macrophytes, the latter constituting
72% of primary production at the estuary. Zooplankton and benthic fauna are species
poor with low biomass (Branch et al. 1985) and both groups generally prefer low salinity
conditions. Branch et al. (1985) elucidated that the unusually low diversity of
invertebrates at the estuary reflects the instability of the system. Few estuarine fish are
also able to tolerate extreme saline conditions (Day 1981) and this limits their
availability as suitable prey. With reduced food availability, this probably led to the
large decline in the waterfowl and cormorant guilds during the fourth lagoon phase.

139
Feeding guild responses
Herbivores
Generally, herbivore abundance decreased after breaching events (Figures 4.15a, b).
Their pattern of decline during the study period can be explained by the parallel
fluctuations in the occurrence and abundance of the aquatic macrophytes, Ruppia
maritama and Potamogeton pectinatus.
Red-knobbed Coot, Yellow-billed Duck, and Red-billed Teal showed preference for
lake phases, with smaller numbers during lagoon and estuarine phases; however the
Red-billed Teal did show a positive response after the August 2003 breach. Yellow-billed
Duck and Red-billed Teal are also known to feed on invertebrates (Hockey et al. 2005),
although they comprise substantially less in their diet. They were probably able to shift
to this prey source during the estuarine and lagoon phases when the phytoplankton and
macrophytes died back as a result of salinity increases.
For the Red-knobbed Coot, its decline was closely linked to Ruppia and
Potamogeton, particularly under estuarine and lagoon conditions when salinities were
high (> 25 p.p.t.); these plants do not survive in salinities above 18 p.p.t. and die-off due
to desiccation and salt exposure (Adams 2000). The coot feed exclusively on these
macrophytes and as they die-off it prevented them from feeding optimally. It takes about
2–3 months before complete salinity mixing occurs in the estuary after a breach,
depending on the type of breach and strength of inter-tidal activity (S Gildenhhuys in.
litt.); thus it takes a further two months before the Ruppia and Potamogeton die off and
explains why a large proportion of coot remained at the estuary during the first
estuarine phase; however fewer birds returned and stayed after the second and third
breaches. In their study, Heÿl and Currie (1985) also found that breaches impact heavily
on this species and that it can take up to 19 months before numbers show a recovery.
Some birds (c. 20–30) were killed during the first mouth opening (September 2003) as a
result of the strong outflow to the sea (Williams 2004) but this mortality probably
impacts a negligible small percentage of the overall coot population at the estuary. Heÿl
and Currie (1985) further state that if favourbale conditions prevail Red-knobbed Coot
will remain at the estuary until there is a change in hydrological conditions. Boshoff et
al. (1991b) also found a strong relationship between fluctuations in Potamogeton and the
abundance of Red-knobbed Coot. But where do these birds go once they leave the
estuary? Count data from the Klein River Estuary, 10 km to the east of the Bot River
Estuary, suggested that at least Red-knobbed Coots and Cape Shoveler find refuge at
this site (Harebottle 2010). I recommend that intensive ringing of coot, ducks and
possibly flamingo would be a valuable exercise in determining the movements of these

140
birds not only after a breach occurs but generally throughout their annual cycle at the
estuary.
Piscivores
Contrasting patterns were shown by piscivores: African Darter, White-breasted
Cormorant and Reed Cormorant. The Reed and White-breasted Cormorants both showed
increasing abundance up until the third lake phase and then showed rapid declines
during and after the fourth estuarine phase (Figures 4.15a, b). African Darter was less
abundant and showed greater fluctuations between each phase. These species occurrence
at the estuary was driven by the availability of fish, their main diet. Based on the results
fish availability seemed to be impacted only after the fourth breaching event when
number of these species declined. Fish recruitment is an important ecological role played
by estuaries and one of the primary reasons why the Bot River Estuary is artificially
breached. The estuary is one of the top three estuaries on the southern coast for marine
fish recruitment; 29 fish species use the Bot River Estuary as nursery grounds
(Lamberth 2000) including estuarine-dependent species such as White Steenbras
Lithognathus lithognathus, Leervis Lichia amia, Cape Stumpnose Rhabdosargus holubi
and Dusky Cob Argyrosomus japonicus (Lamberth and Turpie 2003). It is estimated that
the estuary provides up to 20% of nursery habitat for marine and estuarine fish
populations (S. Lamberth in litt.).
Other piscivores, such as Great Crested Grebe, Great White Pelican, Caspian
Tern, Common Tern, Sandwich Tern all showed variable changes in their response to the
changing conditions; only the Great Crested Grebe showed an overall decline in
numbers. Overall this guild showed the least amount of variation during this study.
Critical factors determining the occurrence of piscivores at the estuary would be
the availability and size of fish, and associated water turbidity during each phase. The
lake phase is generally dominated by freshwater species such as Carp Cyprinus carpio;
some estuarine species do occur, such as the endemic Bot River Klipvis Clinus
spatulatus but they occur at lower densities due to the low salinities (< 5 p.p.t.). Carp are
taken by the White-breasted Cormorant; Reed Cormorants and African Darter take
small fish species. During the estuarine phase, availability of fish increases following
recruitment and this probably supported and led to the increases in the numbers of
cormorants, darters, and Great White Pelicans at the estuary. During the estuarine
phase tidal exchanges increases water turbidity and this probably inhibits feeding by
most piscivores; Great Crested Grebe, however, was more abundant during the first
estuarine phase suggesting it is able to tolerate the turbid conditions. Great Crested

141
Grebes feed on small fish and the increase in their abundance after the breach is
probably related to the recruitment of young fish into the estuary when the mouth is
open. Although Great Crested Grebes are usually associated with clear waterbodies
(Dean 1997), it is possible that the species preference for high visibility (Clinning 1985)
is compensated for by the abundant food resources. In the Wilderness Lakes complex,
Boshoff et al. (1991a) also found that abundance of Great Crested Grebes and African
Darters increased during turbid conditions caused by flooding and suggested that
reduced water transparency may benefit piscivores by reducing detection of the predator
by the prey.
The post-breach decline of most piscivores seemed counter-intuitive, because the
lowering of the water levels and increased salinities resulted in many freshwater fish
being killed (Branch et al. 1985, pers. obs, A.J. Williams pers. comm.). However, these
dead fish are better suited to scavengers such as Hartlaub’s Gulls and Kelp Gulls, and
perhaps raptors such as African Fish Eagle, than to piscivores. Also, because these
species dive to catch their prey, they require relative deep water in which to feed. The
water-level during the estuarine phase averaged 1.4 m above MSL and may have been
too shallow for these species. These conditions may have favoured the smaller Reed
Cormorant, which declined in numbers at a slower rate than the larger White-breasted
Cormorant and African Darter (Table 4.2).
Invertebrate feeders
This group showed fluctuations in terms of abundance and species composition
throughout the study period (Figures 4.15a, b). Based on the changing conditions,
individual species responded differently but overall insectivores were the second most
dominant group at the estuary both in terms of abundance and biomass.
When water levels were high, Cape Teal, Little Grebe, Black-necked Grebe,
Southern Pochard and Cape Shoveler were abundant and these species dominated this
group prior to a breaching event. These species were probably able to sustain their
populations during periods of higher salinities (i.e. estuarine and lagoon phases),
because biomass of invertebrates was higher at these times. When temporarily closed
estuaries are opened to the sea, estuarine conditions are restored through increased
salinities and they support a more estuarine zooplankton community, particularly when
salinities and water-levels stabilise after mouth closure (Day 1981, Davies and Day
1998). These changes were probably responsible for supporting these waterfowl species
through the estuarine and lagoon phases.

142
The Southern Pochard showed the fastest decline in this guild. This species has
localised populations in the winter rainfall region; and most of the large flocks observed
are known to move in from the summer rainfall region during August–September to
moult (Hockey et al. 1989, 2005). Large numbers (more than 150 birds) were recorded at
the estuary suggesting that these birds were most likely migrant birds and not resident
birds. They prefer deep and clear freshwater systems (Hockey et al. 1989, 2005) and
their decline after the first breach and virtual absence thereafter (Figure 4.10) was
therefore linked to the increased turbidity and salinity associated with mouth openings
and inter-tidal fluctuations. Most birds were recorded near the head of the estuary
(M Delport pers. comm.) where salinities are generally low during estuarine phases
(S Gildenhuys in litt.).
Because these species find their food amongst the submerged vegetation by either
diving (grebes) or upending (shoveler) deep water and low turbidity are required for
these birds to forage optimally; pre-breach conditions usually provide these conditions
and explains the dominance of these species at the estuary during this period. Once
inter-tidal conditions are restored during the breach phase, these species decline and are
replaced by increasing numbers of waders, notably Greater Flamingo, Kittlitz’s Plover
and Black-winged Stilt, and gulls (Table 4.2). South African Shelduck was the only
anatid to show a strong association during estuarine-lagoonal phases (Figure 4.12),
confirming its affinity in tolerating high salinities than most other anatids (Hockey et al.
2005). These birds preferred shallower water and exposed muddy and sandy areas in
which to feed, and their increased abundance was directly related to an increase in these
types of habitats when the mouth was open. Greater Flamingos dominated the
insectivores during the estuarine period which is evidenced both by their contribution to
the total biomass (93%) for this group and the overall biomass (42%) for all trophic
groups. With decreasing water-levels and die-off of Ruppia and Potamogeton, the insect
fauna associated with the submerged vegetation became available, providing the waders
improved foraging opportunities. Increases in Kittlitz’s Plover, Black-winged Stilt.
Curlew Sandpiper and Little Stint during the estuarine phase were probably associated
with this phenomenon. A breach in late winter is therefore advantageous to these species
and could make the Bot River Estuary an important site for waders under these
conditions.
Water-levels decreased slowly after closure of the mouth (Figure 4.2) due mainly
to high evaporation rates during the dry summer. This resulted in shoreline and other
previously inter-tidal areas to remain exposed, sustaining the invertebrate abundance
present in the rotting macrophytes. Kelp Gull, Greater Flamingo, White-fronted Plover,

143
Kittlitz’s Plover and Three-banded Plover increased in numbers at this time. The
maximum numbers of White-fronted Plover and Kittlitz’s Plover occurred in July 2004,
mid-way through the austral winter; it is possible that competition with Palearctic
waders during summer suppressed numbers of these resident waders during this period
in spite of favourable feeding conditions created after the breach.
Overall the small resident waders respond relatively slowly to the change in
hydrological conditions taking up to six months before any build of reasonable numbers,
although fluctuations are evident. Palearctic species do not seem affected by changing
conditions at the estuary; e.g. a count of over 900 Curlew Sandpiper in February 2000
occurred at a time when the estuary was closed and water levels were high compared
with a count of just over 100 in December 2003 four months after the 2003 breach when
water-levels were down and greater shoreline and mudflats were exposed.
The early lake conditions that persisted from February 2004 also resulted in
unfavourable conditions for Little Grebe, Black-necked Grebe and Cape Shoveler;
numbers for these species declined dramatically during this period, particularly for the
grebes. All three species struggled to recover in the short- to medium term and confirm
their preference for high-water levels and low-salinities, features borne out by their pre-
breach abundance levels. Black-necked Grebes tend to show some tolerance, however, in
the short-term (up to five months) before their numbers are seriously affected.
The drop in Greater Flamingo numbers from mid-summer to early winter could
be due to adults leaving to breed at Sua Pan or Etosha Pan (Williams and Velásquez
1997) leaving behind immature and/or non-breeding adults. Both Heÿl and Currie (1985)
and Boshoff et al. (1991c) found no clear seasonal pattern for Greater Flamingo during
their studies of waterbirds at the Bot River Estuary and Wilderness Lakes complex
respectively, although Heÿl and Currie (1985) but did find a negative correlation with
water-levels.
The erratic occurrence of Pied Avocets at the estuary highlights its nomadic
nature, moving in response mainly to rainfall events and changing conditions at wetland
sites (Tree 1997). It is highly likely, therefore, that their occurrence at the estuary is not
linked in any way to a breaching event but rather to their foraging movements over a
wider area.
In summary, it was evident that numbers of birds fluctuated between phases and
that abundance of different species and species groups were variably impacted. However,
the decline in the total number of birds over the study period (2002–2010) was
significant; this highlighted the impact of multiple breaches on the estuarine avifauna.
The changes in composition and abundance of waterbirds was largely driven by the

144
availability and abundance of different food resources; these were in turn dependent on
the physio-chemical composition of the estuary during its three phases. Together with
other hydrodynamic factors, they govern, to a large extent, estuarine habitats and
availability of food for waterbirds, which in turn drives their diversity and abundance
during different hydrological stages. Warnock and Takekawa (1995), Ntiamoa-Baidu et
al. (1998), Kingsford et al. (2004) and Boertman and Riget (2005) considered water depth
to be a critical environmental factor governing the availability of habitat and food for
waterbirds, specifically for shorebirds and ducks. Kushlan (1986) demonstrated that for
wading birds (Ciconiiformes), water levels can influence foraging tactics, breeding
seasonality and colony site selection. This study has shown similar results where
changing water-levels that resulted from inflow patterns and breaching events created
different habitats for different waterbirds on a two-three year cycle.
Importance of the Bot River Estuary for waterbirds
During the study period, the Bot River Estuary was mainly important for waterbirds
and in particular resident species, although it did have some significance for Palearctic
migrants. The changing hydrological conditions determined which species and/or species
groups dominated at different times. Ducks, geese and coot, which, on average comprised
over half (53%) of the resident species were a prominent component of the waterbird
community. Heÿl and Currie (1985) and Harebottle and Delport (2000) both found the
Bot River Estuary to be an important dry-season refuge for anatidae particularly when
the estuary is full and the mouth is closed (lake phase). Birds tended to move to the
estuary during early parts of summer. Because ducks generally breed at temporarily
inundated wetlands during winter and early summer (Heÿl et al. 1993) it is assumed
that most ducks would have come from surrounding wetlands in the region; these would
have started drying up at this time. However if conditions on the estuary were not
favourable when they arrived, i.e. after a breach has occurred these birds must find
alternative refuges. Studies at the nearby Klein River Estuary in Hermanus (25 km to
the east of the Bot River Estuary) showed increased numbers of Cape Shoveler and Red-
knobbed Coot in the three months following the breach at the Bot River Estuary
(Harebottle 2010). Thus this estuary could provide a refuge for these two species if
conditions at the Bot River Estuary are poor. Movement of other waterbirds between
these two sites may also take place under similar circumstances, especially when the
Klein River Estuary breaches. In the absence of other large waterbodies within 50 km of
the Bot River Estuary it is assumed that waterbirds take refuge at surrounding farm
dams or fly longer distances to find suitable waterbodies. However, the Bot River

145
Estuary is likely to be the preferred coastal refuge in the region, particularly for
waterfowl. The Klein River Estuary is breached at least annually (Anon. 2010) which
results in a more regular saline system than the Bot River Estuary. Prolonged
macrophytic growth is therefore largely inhibited in the Klein River Estuary. As a result
waterfowl numbers are lower than at the Bot River Estuary; Harebottle (2010) reported
a maximum count of 589 for all waterfowl between 2001 and 2009. In contrast, the Bot
River Estuary is usually breached every two-three years (Branch et al. 1985) and
brackish–freshwater conditions over a prolonged period creates favourable conditions for
the growth of macrophytes. As seen in this study, up to 16 000 waterfowl can utilise the
Bot River Estuary; this highlights the important role the estuary plays in providing a
more reliable supply of food for ducks and coot than the nearby Klein River Estuary.
The site was designated an Important Bird Area (SA118) based on the estuary
meeting the 1% criterion for six species: Great Crested Grebe, Black-necked Grebe,
South African Shelduck, Cape Shoveler, Southern Pochard and Red-knobbed Coot
(Barnes 1998). During the study period, two species, South African Shelduck and
Southern Pochard, failed to meet these thresholds. Nine additional species occurred
which met the 1% criterion on more than five occasions: Caspian Tern, Greater
Flamingo, Great White Pelican, Sandwich Tern, Swift Tern, Hartlaub’s Gull, Kelp Gull,
White-breasted Cormorant and Yellow-billed Duck. Four of these species comprised more
than 15% of their estimated provincial populations and all but the Red-knobbed Coot are
classified as threatened species (Barnes 2000): Great Crested Grebe, Red-knobbed Coot,
Greater Flamingo and Caspian Tern. It is interesting to note the change from Barnes
(1998) of a waterfowl dominated site, to one with a more cosmopolitan community
(Table 4.4). The increasing instability of the system probably has resulted in this shift.
Greater Flamingo, an intra-African migrant, is probably the most significant
intra-African species due to its threatened status. Birds were present all year-round, but
occurred in largest numbers after a breach had occurred, and the inter-tidal conditions
provided the shallow areas which the flamingos prefer when feeding (Williams and
Velásquez 1997).
Conservation and management recommendations
The irregular cycles between freshwater coastal lake, tidal estuary and saline lagoon
created by artificial breaching events make the Bot River Estuary difficult to manage
effectively for biodiversity. At each breach an ecological equilibrium is suddenly
disrupted, largely a result of the exposure and drying-out of the beds of macrophytes
(Branch et al. 1985). Waterbirds play an important role in the ecological functioning of

146
the estuary – for example, Red-knobbed Coot are estimated to utilise up to 10% of the
submerged macrophytes annually (Stewart and Bally 1985). Lamont (1996) emphasized
the role that Red-knobbed Coot play in maintaining wetland health; this needs to be
explored further when considering the overall management of the site. Waterbirds are
not the only “users” of the system; however, they are a natural component of the system,
and their status should be regarded above that of other more ‘ecologically-passive’ users
such as property owners and boat users.
Conflicts in management strategies at the Bot River Estuary have been ongoing for
at least three decades (Bally 1987) and some authorities have argued that a consistent
strategy will be difficult to reach due to the diversity of roleplayers and stakeholders
involved (Branch et al. 1985, Bally and Branch 1986, van Niekerk et al. 2005).
Nevertheless, a management strategy is necessary to avoid further conflict among users
and to maintain the integrity of the system as much as possible. Branch et al. (1985)
proposed that either the estuary should never be breached (allowing it to develop into a
fresh-water natural lake) or that it should be breached on a controlled basis in a manner
determined by certain ecological principles. For the latter, these included allowing the
estuary to stabilize for three to four years before breaching and to consider breaching
only when salinities fall below 6 p.p.t. the level which threatens survival of marine and
estuarine dependent fish species (Bennett 1985). These points were adopted into the
initial management plan and which were accepted, in 1995, by the Bot River Estuary
Advisory Committee (BREAC) the main controlling body governing management
policies at the estuary, established in 1993 (I. Horwood in litt.).
During the study period, several criteria were assessed prior to an undertaking
an artificial breach (Anon. 2008). A decision to breach was taken in the first year after a
breach, if water height was at or above 2.5 m above MSL and average salinity was
6 p.p.t. or less. In the second year after a previous breach, the criteria to breach were
water height is at or above 2.5 m above MSL and average salinity is at or between
6–8 p.p.t., (c) if, after the third year of a previous breach, water height is at or above
2.5 m above MSL regardless of salinity or (d) by consensus of the BREAC in the event
that salinities fall below 6 p.p.t. and a catastrophe is imminent (e.g. fish mortalities)
regardless of water-level. It is also stipulated that any breach will take place between 1
May and 31 August and during daylight hours.
In light of the above breaching criteria, and the use of the estuary by waterbirds
under varying environmental conditions (this study, Heÿl and Currie 1985), two
scenarios are possible that can influence waterbird populations at the estuary:
(1) should the estuary not meet the breaching criteria within three years of the previous

147
breach, waterfowl would dominate the system and overall the estuary would support a
richer waterbird community, or (2) should the estuary meet the breaching criteria
within two years, the waterbird community would become shorebird-dominated. The
first scenario relies on the system maintaining relatively high water-levels for a long-
period allowing for good macrophytic development, which supports the estuary’s
regionally important waterfowl component. The second scenario causes frequent
disruption to the ecological processes, creates inter-tidal areas and does not allow
development and re-growth of macrophytes, making the system unfavourable to
waterfowl both in the short- and long-term.
Both Heÿl and Currie (1985) and Turpie (2000) suggested that in order to
maximize biodiversity and conservation importance, the Bot River Estuary should be
managed as a shallow coastal lake (i.e. longer breaks between breaches) because under
these conditions the estuary supports a larger diversity and abundance of waterbirds.
These findings are supported in this study, which emphasizes the cyclical nature of
waterbird abundance patterns at the estuary. This outcome was generally supported by
the WCV scores; however, the scores also showed that the estuary supported important
numbers of species during estuary and lagoonal phases (Figure 4.18a, b). Importance is
therefore shifted to different species dependent on the state of the estuary.
Is it possible to maintain the Bot River Estuary as a freshwater lake rather than as
a tidal estuary? Without mouth breaches, the system would undoubtedly exist more as a
coastal lake rather than an open estuarine system. The diversion of water to the
Kleinmond River estuary, via Die Keel (Figure 4.1) at 1.7 m above MSL, is a major
factor which prevents the Bot River Estuary from opening naturally on a more regular
basis. Van Niekerk et al. (2005) added that reduced run-off from the catchment, due to
water abstraction from farming activities and alien vegetation infestations, has further
limited the amount of inflow into the estuary; mean annual run-off has been reduced by
an estimated 25.6% based on virgin run-off calculations (van Niekerk et al. 2005).
Overall, the Bot River Estuary is receiving less water than it did historically and this
has impacted on the hydrological regimes at the wetland. Coupled with climate change
predictions of reduced and more erratic rainfall in the WRR (Midgley et al. 2005)
natural breachings are less likely to occur in the future. This then favours the notion of
increasing frequencies of artificial breaches to restore estuarine conditions on a more
regular basis. Should this occur, and given the results in this chapter, the estuary will
probably support a more shorebid-wader community. The current breaching criteria
(Anon. 2009) favour a more freshwater, coastal lake system and is therefore beneficial to
maintaining diverse waterbird populations (see results from this study). Lake conditions

148
would also benefit eco-tourism and have the potential to create local employment; the
training of community bird guides to showcase the birdlife of the estuary has positive
socio-economic spin-offs.
However, some stakeholders do not support the view that the estuary should be
maintained as a coastal freshwater lake. Van Niekerk et al. (2005) proposed that the
beaching criteria be amended to favour more natural estuarine conditions. This would
imply more regular breaches. More regular openings of the mouth would allow the
system to function as close to its natural or reference condition; as an open system the
estuary benefits from a more saline water column, an inter-tidal zone, connection to the
sea and re-suspension and flushing of sediment (van Niekerk et al. 2005). The local
subsistence fishermen support this more open-system as fish stocks would be
replenished on a more regular basis. However, shorter intervals between breaches (as
shown in this study), impacts negatively on waterbird populations at the Bot River
Estuary and would not be beneficial to maintaining abundance and richness of
waterbirds.
Stakeholder and user-group involvement in managing the estuary will remain a
contentious and conflicting issue. The different groups expect different outcomes; van
Niekerk et al. (1985) proposed a balanced approach whereby the ecological integrity of
the system be prioritized ahead of satisfying the requirements of user groups. Bally
(1987) and van Niekerk et al. (2005) acknowledged that the sustainability of the system
can only be maintained through continued research and the open sharing of
management insight. Without regular natural breaches, it is ultimately management
decisions that will drive the state and condition of the estuary, and waterbirds will
respond to the changes that take place. A more holistic and integrated approach is
needed to managing the estuary’s hydrological requirements (i.e. estuarine functioning),
biodiversity and socio-economic needs.
The Bot River Estuary is an important coastal wetland for waterbirds on the
south-western coastline of the winter rainfall region. The wetland is a dynamic system
with an associated dynamic estuarine fauna. Its management in terms of its hydrological
fluctuations impacts the long-term sustainability of waterbird populations at the site.
Cyrus and Mackay (2007) demonstrated that estuarine avifaunal communities are
important components in estuarine ecosystems and that the quantity and quality of
water in the system is vital to maintain their diversity and abundance. Catchment
management is therefore also important (van Niekerk et al. 2005) to ensure that inflow
rates are not substantially reduced because this will further impact on long-term
changes to the estuarine waterbird community.
149
This study has presented some insights in the management of the Bot River
Estuary for waterbirds and provides a framework for future detailed studies and for
long-term monitoring, particularly for other open-closed estuaries in the WRR and
elsewhere in South Africa. In addition, more systematic and ongoing data needs to be
collected on the distribution, abundance and biomass of aquatic macrophytes, benthic
and zooplankton faunal communities and fish at the estuary, particularly during each of
the phases described above. This will compliment and aid in the interpretation of
ongoing waterbird data collection and analysis at the estuary.

150
References
Adams J 2000. Vegetation. In: Anon. (ed) Proceedings of the Bot River Estuary Workshop held at Jonkershoek Conference Room on 26 October 2000. Cape Nature, Jonkershoek.
Anon 2001. Bot River lagoon management plan. Draft copy compiled by Western Cape Nature Conservation Board.
Anon 2008. Bot River Estuary – record of the breaching criteria indaba held at the Arabella Hotel on 5 February 2003.
Anon. 2009. Wheat Triticum aestivum. Information brochure produced by the Department of Agriculture, Forestry and Fisheries, South Africa, Pretoria.
Anon. 2010. Minutes of a Klein River Estuary Forum workshop held at Fernkloof Nature Reserve, Hermanus, 4 March 2010.
Bally R 1985. Historical records of the Bot River estuarine system. Transactions of the Royal Society of South Africa 45: 291–303.
Bally R 1987. Conservation problems and management options in estuaries. The Bot River Estuary, South Africa, as a case-history for management of closed estuaries. Environmental Conservation 14: 45–51.
Bally R and Branch GM 1986. The Bot River Estuary – should we interfere? African Wildlife 40: 230–239.
Barnes KN (ed.) 1998. The Important Bird Areas of southern Africa. BirdLife South Africa, Johannesburg.
Barnes KN (ed.) 2000. The Eskom Red Data Book of birds of South Africa, Lesotho and Swaziland. BirdLife South Africa, Johannesburg.
Bennet BA 1985. A mass mortality of fish associated with low salinity conditions in the Bot River Estuary. Transactions of the Royal Society of South Africa 45: 437–447.
Boertman D and Riget F 2005 Effects of changing water levels on numbers of staging dabbling ducks in a Danish wetland. Waterbirds 29: 1–8.
Boshoff AF, Palmer NG and Piper SE 1991a. Spatial and temporal abundance patterns of waterbirds in the southern Cape Province. Part 1: Diving and surface predators. Ostrich 62: 159–177.
Boshoff AF, Palmer NG and Piper SE 1991b. Spatial and temporal abundance patterns of waterbirds in the southern Cape Province. Part 2: Waterfowl. Ostrich 62: 178–196.
Boshoff AF, Palmer NG and Piper SE 1991c. Spatial and temporal abundance patterns of waterbirds in the southern Cape Province. Part 3: Wading birds. Ostrich 62: 197–214.
Branch GM, Bally R, Bennet BA, De Decker HP, Fromme G, Heÿl CW and Willis J 1985. Synopsis of the impact of artificially opening the Bot River Estuary: implications for management. Transactions of the Royal Society of South Africa 45: 465–483.
Breen CM and McKenzie M (eds) 2001. Managing estuaries in South Africa.: An Introduction. Institute of Natural Resources, Pietermaritzburg.
Clinning CF 1995. Grebes – Podicipedidae. In: Wetlands of South Africa. Cowan, G.I. (ed.), pp. 141–145. Department of Environmental Affairs and Tourism, Pretoria.
Cowling RM, Pressey RL, Rouget M and Lombard AT 2003. A conservation plan for a global biodiversity hotspot—the Cape Floristic Region, South Africa. Biological Conservation112: 191–216.
Cyrus DG and Mackay CF 2007. The environmental reserve and its role in retaining the diversity of birds at the Thukela Estuary. Ostrich 78: 621–631.
Davies B and Day J 1998. Vanishing Waters. University of Cape Town Press, Cape Town.

151
Day JH (ed.) 1981. Estuarine Ecology, with particular reference to southern Africa. A.A. Balkema, Cape Town.
Dean WRJ 1997. Great Crested Grebe Podiceps cristatus. In: The atlas of southern African birds. Vol. 1: Non-passerines. Harrison JA, Allan DG, Underhill LG, Herremans M, Tree AJ, Parker V and Brown CJ (eds) pp. 8–9. BirdLife South Africa, Johannesburg.
Greenacre MJ 1984. Theory and application of correspondence analysis. Academic Press, London.
Harebottle DM 2003. Spur-winged Goose Plectropterus gambensis. In: Young DJ, Harrison JA, Navarro RA, Anderson MD, Colahan BD (eds) Big Birds on Farms: Mazda CAR Report 1993–2001. Avian Demography Unit, Cape Town.
Harebottle DM 2010. Report on the status of waterbirds at the Klein River Estuary. Unpublished report to the Klein River Estuary Forum, March 2010.
Harebottle DM and Delport M 2000. Waterbird responses to management decisions at Botriviervlei, Western Cape Province. Bird Numbers 9: 39–44.
Heÿl CW and Currie MH 1985. Variations in the use of the Bot River Estuary by water-birds. Transactions of the Royal Society of South Africa 45: 397–417.
Heÿl, CW, Anderson MD, Loubser DI and Scott HA 1993 Duck population monitoring in the Cape Province. Internal Report No. 12. Cape Nature Conservation, Stellenbosch.
Hockey PAR, Underhill LG, Neatherway M and Ryan PG 1989. Atlas of the birds of the southwestern Cape. Cape Bird Club, Cape Town.
Hockey PAR, Dean, WRJ and Ryan P (eds) 2005. Roberts’ birds of southern Africa – 7th edition. John Voelcker Bird Book Fund, Johannesburg.
Kingsford RT, Jenkins KM and Porter JL 2004. Imposed hydrological stability on lakes in arid Australia and effects on waterbirds. Ecology 85: 2478–2492.
Koop K 1982. Estuaries of the Cape Part II: Synopsis of available information on individual systems. Report No. 18 Bot/Kleinmond sytem (CSW 13). Heydorn AEF and Grindley JR (eds). CSIR Research Report 417. 62 pp.
Koop K, Bally R and McQuaid CD 1983. The ecology of South African estuaries. Part XII: The Bot River, a closed estuary in the south-western Cape. South African Journal of Zoology 18: 1–10.
Kushlan JA 1986. Responses of wading birds to seasonally fluctuating water levels: strategies and their limits. Colonial Waterbirds 9: 155–162.
Lamberth SJ 2000. Fish. In: Proceedings of the Bot River Estuary Workshop held at Jonkershoek Conference Room on 26 October 2000. CapeNature, Stellenbosch.
Lamberth SJ and Turpie JK 2003. The role of estuaries in south African fisheries: economic importance and management implications. Water Research Commission Report No. 756/2/03. Water Research Commission, Pretoria.
Lamont G 1996. Redknobbed Coots and wetland health. Bird Numbers 6: 32.
Martínez J, Esteve MA, Robledano F, Pardo MT and Carreño MF 2005. Aquatic birds as bioindicators of trophic changes and ecosystem deterioration in the Mar Menor lagoon (SE, Spain). Hydrobiologia 550: 221–235.
Midgley GF, Chapman RA, Hewitson B, Johnston P, de Wit M, Ziervogel G, Mukheibir P, van Niekerk L, Tadross M, van Wilgen BW, Kgope B, Moran PD, Theron A, Scholes RJ and Forsyth GG 2005. A Status Quo, Vulnerability and Adaptation Assessment of the Physical and Socio-economic Effects of Climate Change in the Western Cape. Report to the Western Cape Government, Cape Town, South Africa. CSIR Report No. ENV-S-C 2005-073, Stellenbosch.
Ntiamoa-Baidu Y, Piersma T, Wiersma P, Poot M, Battley P and Gordon C 1998. Water depth selection, daily feeding routines and diets of waterbirds in coastal lagoons in Ghana. Ibis 140: 89–103.

152
Peakall DB and Boyd H 1987. Birds as bio-indicators of environmental conditions. In: Diamond AW and Filion J (eds). The value of birds. ICBP Technical Publication 6, Cambridge, UK. pp 113–118.
R Development Core Team 2012. R: A language and environment for statistical computing. R Foundation for Statistical Computing, Vienna, Austria. URL http://www.R-project.org/.
Sakamoto Y, Ishiguro M and Kitagawa G 1986. Akaike Information Criterion Statistics. D. Reidel Publishing Company.
Siegfried WR 1964. Wildfowl in South Africa. Lantern 57–61.
Stewart BA and Bally R 1985. The ecological role of the Red-knobbed Coot Fulica cristata Gmelin at the Bot River Estuary, South Africa. Transactions of the Royal Society of South Africa 45: 419‒426.
Taylor PB, Navarro RA, Wren-Sargent M, Harrison JA and Kieswetter SL (eds) 1999. TOTAL CWAC Report: Coordinated Waterbird Counts in South Africa, 1992–1997. Avian Demography Unit, University of Cape Town, Cape Town.
Tree AJ 1997. Avocet Recurvirostra avosetta. In: The atlas of southern African birds. Vol. 1: Non-passerines. Harrison JA, Allan DG, Underhill LG, Herremans M, Tree AJ, Parker V and Brown CJ (eds). pp. 434–435. BirdLife South Africa, Johannesburg.
Turpie JK 1995. Prioritizing South African estuaries for conservation: a practical example using waterbirds. Biological Conservation 74: 175–185.
Turpie JK 2000. Birds of the Bot River Estuary. In: Anon. (ed) Proceedings of the Bot River Estuary Workshop held at Jonkershoek Conference Room on 26 October 2000. Cape Nature, Jonkershoek.
Underhill LG and Peisach M 1985. Correspondence analysis and its application in multielemental trace analysis. Journal of Trace and Microprobe Techniques 3: 41–65.
van Niekerk L and Huizenga P 2000. The hydrodynamics of the Bot River Estuary. In: Proceedings of the Bot River Estuary Workshop held at Jonkershoek Conference Room on 26 October 2000. Cape Nature.
van Niekerk L, van der Merwe JH and Huizinga P 2005. The hydrodynamics of the Bot River Estuary revisited. Water SA 31(1): 73–85.
Warnock SE and Takekawa JY 1995. Habitat preferences of wintering shorebirds in a temporally changing environment: Western Sandpipers in the San Francisco Bay Estuary. Auk 112: 920–930.
Wetlands International 2006. Waterbird Population Estimates, 4th edition. Wetlands International Global Series 12. Wetlands International, Wageningen.
Whitfield A 1992. A characterization of South African estuaries. South African Journal of Aquatic Science 18: 89–103.
Whitfield A 2001. Structure and functioning. In: Breen CM and McKenzie M (eds) Managing estuaries in South Africa: An introduction. Institute of Natural Resources, Pietermaritzburg.
Whitfield AK and Wood AD 2003. Studies of the river-estuary interface region of selected eastern Cape estuaries. WRC Report No. 756/1/03. Report to the Water Research Commission, Pretoria.

153
Whitfield AK, Adams JB, Bate GC, Bezuidenhout K, Bornman TG, Cowley PD, Froneman PW, Gama PT, James NC, Mackenzie B, Riddin T, Snow GC, Strydom NA, Taljaard S, Terörde AI, Theron AK, Turpie JK, van Niekerk L, Vorwerk PD and Wooldridge TH 2008. A multidisciplinary study of a small, temporarily open/closed South African estuary, with particular emphasis on the influence of mouth state on the ecology of the system. South African Journal of Marine Science 30: 453–473.
Williams AJ 2004. Acute death of some not-so-cute coot. Bird Numbers 13(2): 12–13.
Williams AJ and Velasquez C. 1997. Greater Flamingo Phoenicopterus ruber. In: The atlas of southern African birds. Vol. 1: Non-passerines. Harrison JA, Allan DG, Underhill LG, Herremans M, Tree AJ, Parker V and Brown CJ (eds) pp. 112–113. BirdLife South Africa, Johannesburg.
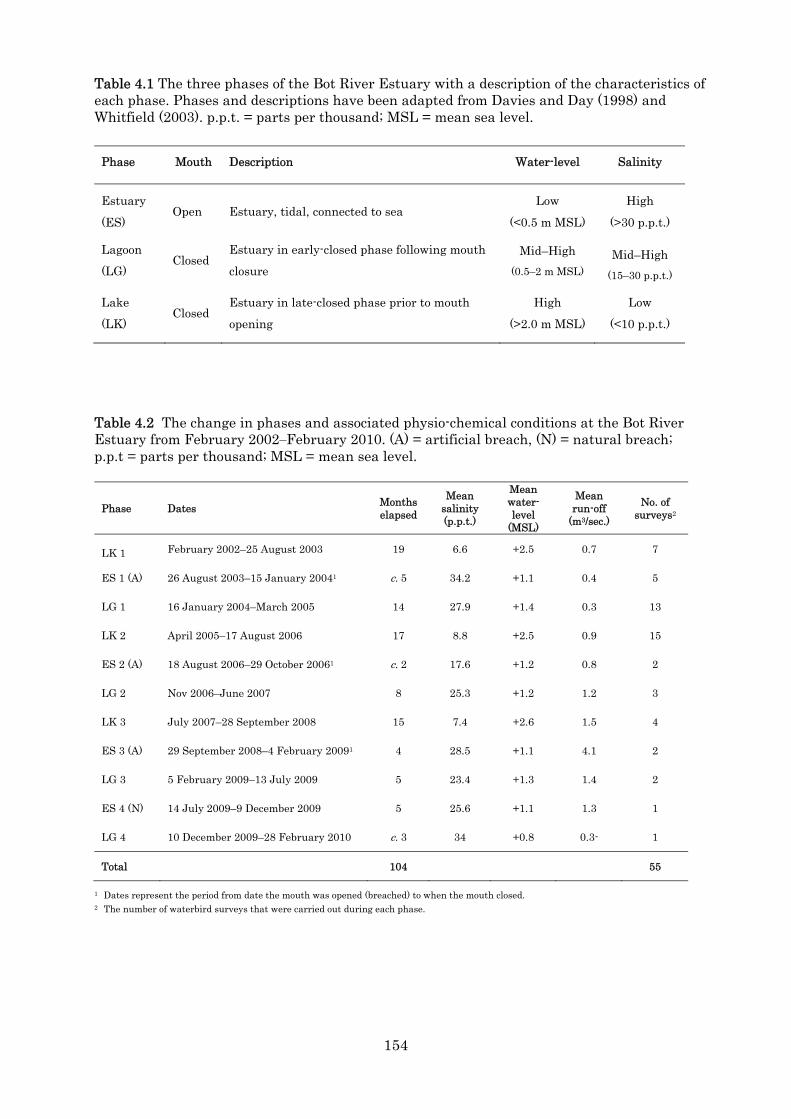
154
Table 4.1 The three phases of the Bot River Estuary with a description of the characteristics of each phase. Phases and descriptions have been adapted from Davies and Day (1998) and Whitfield (2003). p.p.t. = parts per thousand; MSL = mean sea level.
Table 4.2 The change in phases and associated physio-chemical conditions at the Bot River Estuary from February 2002‒February 2010. (A) = artificial breach, (N) = natural breach; p.p.t = parts per thousand; MSL = mean sea level.
Phase Dates Months elapsed
Mean salinity (p.p.t.)
Mean water-level
(MSL)
Mean run-off
(m3/sec.)
No. of surveys2
LK 1 February 2002–25 August 2003 19 6.6 +2.5 0.7 7
ES 1 (A) 26 August 2003–15 January 20041 c. 5 34.2 +1.1 0.4 5
LG 1 16 January 2004–March 2005 14 27.9 +1.4 0.3 13
LK 2 April 2005–17 August 2006 17 8.8 +2.5 0.9 15
ES 2 (A) 18 August 2006–29 October 20061 c. 2 17.6 +1.2 0.8 2
LG 2 Nov 2006–June 2007 8 25.3 +1.2 1.2 3
LK 3 July 2007–28 September 2008 15 7.4 +2.6 1.5 4
ES 3 (A) 29 September 2008–4 February 20091 4 28.5 +1.1 4.1 2
LG 3 5 February 2009–13 July 2009 5 23.4 +1.3 1.4 2
ES 4 (N) 14 July 2009–9 December 2009 5 25.6 +1.1 1.3 1
LG 4 10 December 2009–28 February 2010 c. 3 34 +0.8 0.3- 1
Total 104 55
1 Dates represent the period from date the mouth was opened (breached) to when the mouth closed. 2 The number of waterbird surveys that were carried out during each phase.
Phase Mouth Description Water-level Salinity
Estuary
(ES) Open Estuary, tidal, connected to sea
Low
(<0.5 m MSL)
High
(>30 p.p.t.)
Lagoon
(LG) Closed
Estuary in early-closed phase following mouth
closure
Mid–High
(0.5–2 m MSL) Mid–High
(15–30 p.p.t.)
Lake
(LK) Closed
Estuary in late-closed phase prior to mouth
opening
High
(>2.0 m MSL)
Low
(<10 p.p.t.)

155
Table 4.3 Seasonal abundance of waterbirds at the Bot River Estuary from 2002–2010. Species marked with an asterisk (*) were recorded on less than 25% of surveys. Species sorted in descending order of mean summer abundance. Species in italics are listed in the South African Red data Book (Barnes 2000).
Species Summer Winter
Mean S.D. Min-Max1 Mean S.D. Min-Max1 Residents Waterfowl Red-knobbed Coot 1608.6 ± 780.1 0–12544 3018.1 ± 1467 0–15352 Yellow-billed Duck 301.6 ± 207.5 13–1423 302.2 ± 153.6 0–2030 Egyptian Goose 162.1 ± 103.3 37–845 175.4 ± 65.7 0–612 Great Crested Grebe 120.7 ± 36.1 1–356 70 ± 20.3 0–187 Cape Shoveler 108.6 ± 94.7 0–720 120.6 ± 46.4 0–466 Spur-winged Goose 61.2 ± 35.8 1–272 22.8 ± 8.7 0–156 Little Grebe 32.4 ± 24.1 0–204 121 ± 62.1 0–484 Southern Pochard 28.5 ± 44.9 0–390 20.4 ± 21.2 0–150 Red-billed Teal 19.1 ± 14.9 0–181 19.3 ± 18.8 0–130 Cape Teal 17.5 ± 8.9 0–86 6.5 ± 2.5 0–35 Black-necked Grebe 10 ± 7.9 0–103 21.5 ± 21.4 0–199 South African Shelduck* 1.1 ± 1 0–8 2 ± 2.1 0–26 Common Moorhen* 1 ± 0.7 0–9 6.4 ± 4.8 0–41 African Black Duck* 0.9 ± 0.7 0–9 0.4 ± 0.6 0–5 Maccoa Duck* 0.4 ± 0.9 0–20 0.6 ± 1 0–11 White-backed Duck* 0.4 ± 0.9 0–11 14.2 ± 11.7 0–134 Hottentot Teal* – – 0.1 ± 0.3 0–5
Sub-total 2474 ± 1362.4 199–14182 3921.5 ± 1908.2 0–16366 Cormorants and darter Reed Cormorant 128.3 ± 67.5 21–456 255.9 ± 111.4 0–947 White-breasted Cormorant 58.7 ± 21.6 10–166 78.4 ± 31.9 0–247 African Darter 21 ± 5.8 0–63 32.9 ± 18.7 0–100 Cape Cormorant 4.8 ± 4.1 0–35 40.7 ± 63.6 0–452 Crowned Cormorant* 0.2 ± 0.3 0–2 0.5 ± 1.2 0–9 Bank Cormorant* – – 0.2 ± 0.3 0–4
Sub-total 213.1 ± 99.3 32–563 408.6 ± 227.1 0–1551
Pelicans Great White Pelican 34.3 ± 27 0–149 23 ± 20.5 0–222
Waders African Sacred Ibis 30.9 ± 21.5 0–282 44.9 ± 40.6 0–199 Grey Heron 20.9 ± 9.4 1–80 19.5 ± 3.4 0–47 African Spoonbill 15 ± 5.1 0–57 18.5 ± 8.6 0–89 Little Egret 14.8 ± 5.4 1–40 21.4 ± 12.9 0–79 Hadeda Ibis 6.7 ± 2.9 0–28 17.7 ± 9.9 0–81 Cattle Egret 6.2 ± 5.4 0–48 15.1 ± 20.8 0–257 Black-headed Heron* 3.7 ± 2.3 0–16 4.7 ± 1.1 0–16 Glossy Ibis* 2.3 ± 2.0 0–20 0.1 ± 0.2 0–1 Purple Heron* 2.3 ± 1.5 0–18 1.1 ± 0.3 0–4 Water Thick-knee* 1.7 ± 1.0 0–6 2.8 ± 2.1 0–14 Yellow-billed Egret* 1.2 ± 1.2 0–10 1.6 ± 1.4 0–15 Blue Crane* 0.9 ± 1.0 0–14 0 – Great Egret* 0.2 ± 0.2 0–1 0.3 ± 0.3 0–3 Hamerkop* 0.1 ± 0.3 0–1 0.3 ± 0.5 0–5 Black Stork* – 0–1 – – African Jacana* – – 0.1 ± 0.2 0–1 Black-crowned Night-heron* – – 0.2 ± 0.1 0–1
Sub-total 107 ± 59.3 37–314 148.3 ± 102.4 0–376
Flamingos
Greater Flamingo 457.2 ± 212.5 0–2884 188.9 ± 193.4 0–1619

156
Table 4.3 contd
Species Summer Winter
Mean S.D. Min-Max1 Mean S.D. Min-Max1
Shorebirds Kittlitz's Plover 94.5 ± 38.7 18–241 51.2 ± 17.7 0–207 Black-winged Stilt 47.5 ± 7.7 1–124 21.2 ± 6.6 0–125 Blacksmith Lapwing 46.4 ± 14.4 3–96 43.9 ± 9.6 0–102 White-fronted Plover 14.3 ± 4.7 0–59 20.8 ± 13.3 0–106 Three-banded Plover 13.1 ± 5.9 0–35 13.1 ± 4.1 0–56 African Snipe 4.8 ± 2.2 0–21 6.7 ± 1.9 0–25 Pied Avocet* 1.9 ± 2.1 0–35 1.0 ± 1.8 0–27 African Black Oystercatcher 0.3 ± 0.5 0–12 0.1 ± 0.2 0–2 Chestnut-banded Plover* – – 0.1 ± 0.2 0–2
Sub-total 222.8 ± 76.3 92–458 158 ± 55.4 0–371
Gulls Hartlaub's Gull 209.7 ± 90.8 27–728 133.2 ± 82.7 0–434 Kelp Gull 188.3 ± 82.7 56–577 181 ± 78.2 0–867 Grey-headed Gull* 1.4 ± 1.2 0–7 1.3 ± 1.5 0–12
Sub-total 399.4 ± 174.7 128–845 315.5 ± 162.4 0–912
Terns Swift Tern 62.8 ± 60.2 0–704 46.3 ± 58.6 0–511 Caspian Tern 18.7 ± 15.8 0–88 7.9 ± 4.1 0–44
Sub-total 81.4 ± 76 0–739 54.2 ± 62.8 0–515
Kingfishers Pied Kingfisher 9.5 ± 4 1–28 12.1 ± 2.6 0–29 Giant Kingfisher* 0.5 ± 0.5 0–4 1.1 ± 0.3 0–4 Malachite Kingfisher* 0.3 ± 0.3 0–2 0.7 ± 0.4 0–4 Half-collared Kingfisher* 0 – 0.1 0–1
Sub-total 10.3 ± 4.8 1–30 14 ± 3.5 0–31
Rallids African Purple Swamphen* 0.3 ± 0.4 0–4 0.9 ± 0.5 0–5 Black Crake* 0.1 ± 0.1 0–1 0.2 ± 0.4 0–3
Sub-total 0.4 ± 0.5 0–4 1.1 ± 0.9 0–5
Raptors African Fish-Eagle* 6.2 ± 1.8 1–23 4 ± 1 0–11 African Marsh-Harrier* 1.9 ± 0.6 0–5 1.8 ± 0.8 0–8 Black Harrier* 0.1 ± 0.2 0–2 0.3 ± 0.4 0–2
Sub-total 8.2 ± 2.5 1–25 6.1 ± 2.2 0–14 Paleractic migrants Shorebirds Little Stint 75.5 ± 64.5 0–554 0.5 ± 1.0 0–8 Curlew Sandpiper 33.1 ± 36.4 0–263 0.6 ± 0.8 0–11 Common Ringed Plover* 15.6 ± 9.1 0–72 1.2 ± 1.2 0–9 Common Sandpiper* 7.1 ± 10.1 0–66 0.3 ± 0.6 0–5 Common Whimbrel* 5.8 ± 5.1 0–34 – – Sanderling* 3.9 ± 5.4 0–64 – – Ruff* 1.8 ± 3.2 0–30 – – Common Greenshank 0.7 ± 0.7 0–12 0.3 ± 0.3 0–4 Eurasian Curlew* 0.6 ± 0.9 0–8 0.1 0–1 Red Knot* 0.5 ± 1.0 0–11 – – Marsh Sandpiper* 0.5 ± 1.0 0–9 – – Grey Plover* 0.4 ± 0.7 0–11 – – Terek Sandpiper* 0.1 ± 0.4 0–4 – – Wood Sandpiper* 0.1 ± 0.2 0–2 – – Ruddy Turnstone* 0.1 0–1 0.1 0–1
Sub-total 145.5 ± 138.6 0–767 3.0 ± 4.1 0–14

157
Table 4.3 contd
Species Summer Winter
Mean S.D. Min-Max1 Mean S.D. Min-Max1
Terns Common Tern 296.6 ± 226.2 0–2351 21.6 ± 15 0–211 Sandwich Tern 99.7 ± 190.1 0–2059 1.4 ± 1.3 0–13 White-winged Tern* 6.8 ± 9.1 0–90 0.3 ± 0.5 0–5 Little Tern* 0.1 0–1 – –
Sub-total 403.1 ± 425.4 0–4501 23.3 ± 16.8 0–229
Raptors
Osprey* 0.7 ± 0.4 0–4 0.2 ± 0.2 0–3
Waders
White Stork* 1.5 ± 4.2 0–107 – –
Sub-total: Residents 4008 ± 2095.4 1237–16497 5239.1 ± 2738.6 0–17282
Sub-total: Palearctic migrants 550.8 ± 568.7 48–4436 26.4 ± 21.2 0–936
Overall total 4558.9 ± 2664.1 1344–16600 5265.6 ± 2759.8 0–17290
1 The sub-total values here reflect the minimum/ maximum number for the group profile as a whole and not the sum of individual minima/maxima for each species which would represent estimated min./max. carrying capacity and not actual min./max. numbers reflected by the dataset

158
Table 4.4 Change in the mean abundance of 39 species of waterbirds during 11 hydrological phases at the Bot River Estuary from February 2002–February 2010. For estuarine phase abbreviations refer to Table 4.2.
Species Estuary phase
% overall change
LK1 ES1 LG1 LK2 ES2 LG2 LK3 ES3 LG3 ES4 LG4
Residents Waterfowl Red-knobbed Coot 7670.9 4428.8 230.1 2556.1 889.0 583.3 2771.8 650.5 125.5 2.0 3.0 -99.9% Egyptian Goose 210.4 135.6 95.1 243.9 153.0 99.0 265.8 87.5 159.0 167.0 122.0 -42.0% Red-billed Teal 38.0 53.2 12.7 10.8 23.0 34.5 41.3 3.0 1.5 0.0 0.0 -100.0% Southern Pochard 56.9 172.2 2.0 0.3 9.0 0.0 0.0 3.0 1.5 0.0 0.0 -100.0% Spur-winged Goose 39.7 25.0 57.5 41.0 32.0 26.3 108.8 30.5 14.5 33.0 58.0 46.4% Yellow-billed Duck 591.0 145.0 223.2 395.3 196.5 159.5 709.3 102.0 134.5 68.0 13.0 -97.8% Cape Shoveler 239.0 100.2 57.8 141.6 116.5 52.8 205.5 13.0 25.0 6.0 1.0 -99.6% Cape Teal 9.7 14.8 13.9 14.7 5.5 20.3 7.5 0.0 0.0 0.0 0.0 -100.0% Black-necked Grebe 41.7 45.8 9.1 5.3 1.0 59.0 57.5 0.5 9.5 0.0 2.0 -95.2% Great Crested Grebe 123.0 228.8 141.6 53.8 27.5 45.8 90.0 11.0 41.5 13.0 14.0 -88.6% Little Grebe 276.1 72.0 16.2 101.9 50.0 46.0 92.0 0.0 23.5 2.0 2.0 -99.3%
Sub-total 9296.4 5421.4 859.2 3564.8 1503.0 1126.3 4349.3 901.0 536.0 291.0 215.0 -97.7% Cormorants and darter African Darter 34.9 25.2 12.2 37.2 67.0 18.3 51.3 6.0 11.5 16.0 1.0 -97.1% Cape Cormorant 17.6 0.4 9.6 21.9 23.5 137.0 158.8 12.0 217.0 13.0 3.0 -82.9% Reed Cormorant 195.6 130.4 162.1 242.9 218.5 233.3 456.8 104.5 562.5 29.0 64.0 -67.3% White-breasted Cormorant 114.6 27.8 46.3 79.9 70.0 143.8 184.8 76.5 122.0 18.0 16.0 -86.0%
Sub-total 362.6 183.8 230.2 382.0 379.0 532.3 851.5 199.0 913.0 76.0 84.0 -76.8% Flamingos Greater Flamingo 170.6 1398.2 447.6 47.1 1.0 405.8 30.3 0.0 37.5 374.0 194.0 13.74%
Gulls Hartlaub's Gull 198.3 294.4 166.6 120.0 297.5 262.8 295.8 186.0 97.5 234.0 81.0 -59.2% Kelp Gull 72.0 150.4 183.0 183.3 281.0 197.5 148.3 275.0 663.5 577.0 493.0 584.7%
Sub-total 270.3 444.8 349.6 303.3 578.5 460.3 444.0 461.0 761.0 811.0 574.0 112.4% Kingfishers Pied Kingfisher 13.0 6.2 7.9 14.1 11.5 18.3 19.3 8.0 15.5 14.0 13.0 0% Pelicans Great White Pelican 5.9 10.2 18.7 26.6 102.5 87.8 117.0 19.5 34.0 120.0 110.0 1778.0%
Shorebirds Blacksmith Lapwing 50.1 44.8 44.1 45.2 65.0 54.0 62.3 27.5 45.0 32.0 3.0 -94.0% Black-winged Stilt 30.1 37.2 30.1 36.2 22.0 72.0 70.3 28.5 15.0 19.0 1.0 -96.7% Kittlitz's Plover 10.1 53.4 121.0 57.7 76.5 154.3 85.8 71.0 3.5 42.0 241.0 2276.0% Three-banded Plover 10.1 9.0 14.8 17.1 8.5 24.8 11.5 4.0 1.0 1.0 35.0 245.0% White-fronted Plover 22.4 6.6 29.8 18.6 5.5 40.3 35.3 32.5 0.5 2.0 2.0 -91.0%
Sub-total 123.0 151.0 239.8 174.9 177.5 345.3 265.0 163.5 65.0 96.0 282.0 129.3% Terns Caspian Tern 16.4 5.8 16.2 18.7 4.0 9.8 12.5 6.0 9.5 4.0 12.0 -26.9% Swift Tern 68.7 10.2 26.8 28.2 32.5 250.8 239.3 49.5 124.5 0.0 135.0 96.5%
Sub-total 85.1 16.0 43.0 46.9 36.5 260.5 251.8 55.5 134.0 4.0 147.0 72.6% Waders African Sacred Ibis 10.3 52.2 29.1 30.9 62.5 80.8 41.0 155.5 96.0 14.0 78.0 658.3% African Spoonbill 6.6 14.2 22.5 20.7 9.5 87.3 24.0 8.0 6.5 7.0 0.0 -100.0% Cattle Egret 48.0 7.8 6.8 7.6 0.0 1.0 8.0 2.0 3.0 2.0 0.0 -100.0% Hadeda Ibis 13.3 4.6 8.3 20.3 7.0 21.3 23.3 3.0 28.5 8.0 3.0 -77.4% Little Egret 12.7 27.4 13.7 16.1 41.5 40.3 29.3 7.5 38.0 13.0 25.0 96.6% Grey Heron 29.1 13.2 13.4 25.7 36.5 33.8 43.0 11.5 17.5 5.0 8.0 -72.5%
Sub-total 120.0 119.4 93.8 121.3 157.0 264.3 168.5 187.5 189.5 49.0 114.0 -5.0%
Palearctic migrants Shorebirds Common Greenshank 5.3 20.2 15.8 3.9 12.0 29.8 2.0 13.5 0.0 28.0 22.0 316.2% Curlew Sandpiper 4.4 41.0 51.2 9.9 2.0 1.8 22.3 0.0 0.0 0.0 102.0 2203.2%
Little Stint 2.6 43.4 66.8 60.4 18.0 93.5 8.0 0.0 0.0 0.0 531.0
20550.0%
Sub-total 12.3 104.6 133.7 74.3 32.0 125.0 32.3 13.5 0.0 28.0 655.0 5231.4% Terns Common Tern 51.3 205.4 215.5 99.9 33.5 241.0 386.0 1712.5 10.5 14.0 321.0 525.91% Sandwich Tern 82.6 48.0 25.2 10.0 0.0 13.5 46.3 1034.5 0.0 0.0 76.0 -7.9%
Sub-total 133.9 253.4 240.6 109.9 33.5 254.5 432.3 2747.0 10.5 14.0 397.0 196.5%
Sub-total: Residents 10446.9 7751 2289.8 4681.0 2946.5 3500.9 6496.7 1995 2685.5 1835.0 1733.0 -83.4% Sub total: Palearctic migrants 146.2 358.0 374.3 184.2 65.5 379.5 464.6 2760.5 10.5 42.0 1052.0 620.0% Overall total 10593.1 8109.0 2664.1 4865.2 3012.0 3880.4 6961.3 4755.5 2696.0 1877.0 2785.0 -73.7%

159
Table 4.5 Sensitivity indices for 38 waterbird species during two lake phases of the Bot River Estuary from 2002–2010. Species sorted in descending order of sensitivity based on mean values of the index. H = Herbivore, I – Invertebrate feeder, P = Piscivore. For response + denotes a positive response, – denotes a negative response, and 0 unknown.
Species Feeding guild
Lake phase Mean Response
1 2
Greater Flamingo I -1.62 -1.72 -1.67 – – Common Greenshank I -1.20 -1.75 -1.47 – – Southern Pochard H -1.43 – -1.43 – 0 Little Stint I -0.10 -1.68 -0.89 – – Kittlitz's Plover I -0.71 -0.57 -0.64 – – African Spoonbill I -0.08 -1.14 -0.61 – – Cape Teal I 0.06 -0.92 -0.43 + – White-fronted Plover I -0.46 -0.13 -0.30 – – African Sacred Ibis I 0.06 -0.65 -0.30 + – Three-banded Plover I 0.15 -0.73 -0.29 + – Black-necked Grebe I -0.52 -0.03 -0.27 – – Kelp Gull I 0.00 -0.28 -0.14 + – Common Tern P -0.73 0.46 -0.14 – + Great Crested Grebe P -0.90 0.65 -0.12 – + Hartlaub's Gull I -0.33 0.12 -0.10 – + Little Egret I 0.16 -0.32 -0.08 + – Swift Tern P 0.05 -0.05 0.00 + – Red-billed Teal H -0.16 0.18 0.01 – + Black-winged Stilt I 0.18 -0.02 0.08 + – Blacksmith Lapwing I 0.03 0.14 0.08 + + Sandwich Tern P -0.86 1.10 0.12 – + Curlew Sandpiper I -1.35 1.71 0.18 – + Caspian Tern P 0.14 0.25 0.20 + + Pied Kingfisher P 0.56 0.05 0.31 + + Great White Pelican P 0.35 0.29 0.32 + + White-breasted Cormorant P 0.53 0.25 0.39 + + Grey Heron P 0.63 0.24 0.44 + + Spur-winged Goose H -0.33 1.22 0.44 – + Hadeda Ibis I 0.84 0.09 0.46 + + Cape Cormorant P 0.78 0.15 0.46 + + Reed Cormorant P 0.40 0.65 0.52 + + Cattle Egret I 0.12 1.56 0.84 + + Egyptian Goose H 0.88 0.91 0.90 + + Yellow-billed Duck H 0.56 1.27 0.91 + + African Darter P 1.01 0.95 0.98 + + Cape Shoveler I 0.84 1.18 1.01 + + Little Grebe I 1.45 0.67 1.06 + + Red-knobbed Coot H 1.67 1.30 1.49 + +

160
Table 4.6 Sensitivity indices for 38 waterbird species during four estuarine phases of the Bot River Estuary from 2002–2010. Species sorted in descending order of sensitivity based on mean values of the index. H = Herbivore, I – Invertebrate feeder, P = Piscivore. For response + denotes a positive response, – denotes a negative response, and 0 unknown.
Species Feeding guild
Estuarine phase Mean Response
1 2 3 4
Little Grebe I -1.17 -0.68 -2.00 -1.69 -1.39 – – – – Cape Cormorant P -1.91 0.07 -1.72 -1.77 -1.33 – + – – Black-necked Grebe I 0.09 -1.37 -1.97 -2.00 -1.31 + – – – Cattle Egret I -1.44 -2.00 -1.20 -0.40 -1.26 – – – – Red-knobbed Coot H -0.54 -0.97 -1.24 -1.94 -1.17 – – – – Swift Tern P -1.48 0.14 -1.31 -2.00 -1.16 – + – – Hadeda Ibis I -0.97 -0.97 -1.54 -1.12 -1.15 – – – – Yellow-billed Duck H -1.21 -0.67 -1.50 -0.66 -1.01 – – – – Cape Shoveler I -0.82 -0.19 -1.76 -1.23 -1.00 – – – – Caspian Tern P -0.96 -1.29 -0.70 -0.81 -0.94 – – – – White-breasted Cormorant P -1.22 -0.13 -0.83 -1.49 -0.92 – – – – Reed Cormorant P -0.40 -0.11 -1.26 -1.80 -0.89 – – – – Cape Teal I 0.41 -0.91 -2.00 – -0.83 + – – 0 Grey Heron P -0.75 0.35 -1.16 -1.11 -0.67 – + – – Red-billed Teal H 0.33 0.72 -1.73 -2.00 -0.67 + + – – Great Crested Grebe P 0.60 -0.65 -1.56 -1.05 -0.66 + – – – Curlew Sandpiper I 1.61 -1.33 -2.00 – -0.57 + – – 0 Egyptian Goose H -0.43 -0.46 -1.01 0.05 -0.46 – – – + Pied Kingfisher P -0.71 -0.21 -0.83 -0.10 -0.46 – – – – Three-banded Plover I -0.12 -0.67 -0.97 0.00 -0.44 – – – + Little Stint I 1.78 -1.08 -2.00 – -0.44 + – – 0 White-fronted Plover I -1.09 -1.09 -0.08 1.20 -0.26 – – – + Spur-winged Goose H -0.45 -0.25 -1.12 0.78 -0.26 – – – + African Darter P -0.32 0.57 -1.58 0.33 -0.25 – + – + African Spoonbill I 0.73 -0.74 -1.00 0.07 -0.23 + – – + Sandwich Tern P -0.53 -2.00 1.83 – -0.23 – – + 0 Black-winged Stilt I 0.21 -0.49 -0.85 0.24 -0.22 + – – + Blacksmith Lapwing I -0.11 0.36 -0.77 -0.34 -0.22 – + – – Greater Flamingo I 1.57 -1.92 -2.00 1.64 -0.18 + – – + Little Egret I 0.73 0.88 -1.18 -0.98 -0.14 + + – – Great White Pelican P 0.54 1.18 -1.43 1.12 0.35 + + – + Kelp Gull I 0.71 0.42 0.60 -0.14 0.40 + + + – Hartlaub's Gull I 0.39 0.85 -0.46 0.82 0.40 + + – + African Sacred Ibis I 1.34 0.68 1.17 -1.49 0.42 + + + – Common Tern P 1.20 -1.00 1.26 0.29 0.44 + – + + Southern Pochard H 1.01 1.86 2.00 -2.00 0.72 + + + – Kittlitz's Plover I 1.36 0.28 -0.19 1.69 0.79 + + – + Common Greenshank I 1.17 1.01 1.48 2.00 1.42 + + + +

161
Table 4.7 Sensitivity indices for 38 waterbird species during four lagoon phases of the Bot River Estuary from 2002–2010. Species sorted in descending order of sensitivity based on mean values of the index. H = Herbivore, I – Invertebrate feeder, P = Piscivore. For response + denotes a positive response, – denotes a negative response, and 0 unknown.
Species Feeding guild
Lagoon phase Mean Response
1 2 3 4
Southern Pochard H -1.95 -2.00 -0.67 – -1.54 – – – 0 Red-knobbed Coot H -1.80 -0.42 -1.35 0.40 -0.79 – – – + African Darter P -0.70 -1.14 0.63 -1.76 -0.74 – – + – Hartlaub's Gull I -0.55 -0.12 -0.62 -0.97 -0.57 – – – – Cape Shoveler I -0.54 -0.75 0.63 -1.43 -0.52 – – + – Red-billed Teal H -1.23 0.40 -0.67 – -0.50 – + – 0 Common Greenshank I -0.25 0.85 -2.00 -0.24 -0.41 – + – – Black-winged Stilt I -0.21 1.06 -0.62 -1.80 -0.39 – + – – Blacksmith Lapwing I -0.02 -0.18 0.48 -1.66 -0.34 – – + – Yellow-billed Duck H 0.42 -0.21 0.27 -1.36 -0.22 + – + – Egyptian Goose H -0.35 -0.43 0.58 -0.31 -0.13 – – + – African Spoonbill I 0.45 1.61 -0.21 -2.00 -0.04 + + – – Cattle Egret I -0.14 2.00 0.40 -2.00 0.06 – + + – Spur-winged Goose H 0.79 -0.20 -0.71 0.55 0.11 + – – + Kelp Gull I 0.20 -0.35 0.83 -0.16 0.13 + – + – African Sacred Ibis I -0.57 0.25 -0.47 1.39 0.15 – + – + Little Grebe I -1.26 -0.08 2.00 0.00 0.16 – – + + Grey Heron P 0.01 -0.08 0.41 0.46 0.20 + – + + White-fronted Plover I 1.28 1.52 -1.94 0.00 0.21 + + – + Great White Pelican P 0.59 -0.16 0.54 -0.09 0.22 + – + – Kittlitz's Plover I 0.78 0.67 -1.81 1.41 0.26 + + – + Pied Kingfisher P 0.24 0.45 0.64 -0.07 0.32 + + + – Great Crested Grebe P -0.47 0.50 1.16 0.07 0.32 – + + + Little Egret I -0.67 -0.03 1.34 0.63 0.32 – – + + Sandwich Tern P -0.62 2.00 -2.00 2.00 0.34 – + – + Common Tern P 0.05 1.51 -1.98 1.83 0.35 + + – + White-breasted Cormorant P 0.50 0.69 0.46 -0.12 0.38 + + + – Three-banded Plover I 0.49 0.98 -1.20 1.89 0.54 + + – + Cape Teal I -0.06 1.15 – – 0.54 – + 0 0 Hadeda Ibis I 0.57 1.01 1.62 -0.91 0.57 + + + – Greater Flamingo I -1.03 1.99 2.00 -0.63 0.58 – + + – Reed Cormorant P 0.22 0.07 1.37 0.75 0.60 + + + + Curlew Sandpiper I 0.22 -0.13 – 2.00 0.70 + – 0 + Caspian Tern P 0.94 0.84 0.45 1.00 0.81 + + + + Cape Cormorant P 1.84 1.41 1.79 -1.25 0.95 + + + – Black-necked Grebe I -1.34 1.93 1.80 2.00 1.10 – + + + Little Stint I 0.42 1.35 – 2.00 1.26 + + 0 + Swift Tern P 0.90 1.54 0.86 2.00 1.33 + + + +

Table 4.8 Summary of sensitivity indices across all 11 phases of the Bot River Estuary from 2002–2010. The response notation indicated if a species responded strongly positive (++, values > 0.5), weakly positive (+, values < 0.5 but > 0), strongly negative (– –, values < –0.5) or weakly negative (–, values > –0.5 but < 0).
Species Feeding
guild Estuary phase
Mean Response
LK1 ES1 LG1 LK2 ES2 LG2 ES3 LG3 ES4 LG4 LK ES LG LK ES LG
Residents Little Grebe I 1.45 -1.17 -1.26 0.67 -0.68 -0.08 -2.00 2.00 -1.69 0.00 1.06 -1.39 0.16 ++ – – + Great Crested Grebe P -0.90 0.60 -0.47 0.65 -0.65 0.50 -1.56 1.16 -1.05 0.07 -0.12 -0.66 0.32 – – – + Black-necked Grebe I -0.52 0.09 -1.34 -0.03 -1.37 1.93 -1.97 1.80 -2.00 2.00 -0.27 -1.31 1.10 – – – ++ Red-knobbed Coot H 1.67 -0.54 -1.80 1.30 -0.97 -0.42 -1.24 -1.35 -1.94 0.40 1.49 -1.17 -0.79 ++ – – – – Cape Shoveler I 0.84 -0.82 -0.54 1.18 -0.19 -0.75 -1.76 0.63 -1.23 -1.43 1.01 -1.00 -0.52 ++ – – – – Yellow-billed Duck H 0.56 -1.21 0.42 1.27 -0.67 -0.21 -1.50 0.27 -0.66 -1.36 0.91 -1.01 -0.22 ++ – – – Egyptian Goose H 0.88 -0.43 -0.35 0.91 -0.46 -0.43 -1.01 0.58 0.05 -0.31 0.90 -0.46 -0.13 ++ – – Spur-winged Goose H -0.33 -0.45 0.79 1.22 -0.25 -0.20 -1.12 -0.71 0.78 0.55 0.44 -0.26 0.11 + – + Red-billed Teal H -0.16 0.33 -1.23 0.18 0.72 0.40 -1.73 -0.67 -2.00 – 0.01 -0.67 -0.50 + -- -- Cape Teal I 0.06 0.41 -0.06 -0.92 -0.91 1.15 -2.00 – – – -0.43 -0.83 0.54 - -- ++ Southern Pochard H -1.43 1.01 -1.95 – 1.86 -2.00 2.00 -0.67 -2.00 – -1.43 0.72 -1.54 -- ++ -- African Darter P 1.01 -0.32 -0.70 0.95 0.57 -1.14 -1.58 0.63 0.33 -1.76 0.98 -0.25 -0.74 ++ – – – Reed Cormorant P 0.40 -0.40 0.22 0.65 -0.11 0.07 -1.26 1.37 -1.80 0.75 0.52 -0.89 0.60 ++ – – ++ Cape Cormorant P 0.78 -1.91 1.84 0.15 0.07 1.41 -1.72 1.79 -1.77 -1.25 0.46 -1.33 0.95 + – – ++ White-breasted Cormorant P 0.53 -1.22 0.50 0.25 -0.13 0.69 -0.83 0.46 -1.49 -0.12 0.39 -0.92 0.38 + – – + Great White Pelican P 0.35 0.54 0.59 0.29 1.18 -0.16 -1.43 0.54 1.12 -0.09 0.32 0.35 0.22 + + + Cattle Egret I 0.12 -1.44 -0.14 1.56 -2.00 2.00 -1.20 0.40 -0.40 -2.00 0.84 -1.26 0.06 ++ – – + Hadeda Ibis I 0.84 -0.97 0.57 0.09 -0.97 1.01 -1.54 1.62 -1.12 -0.91 0.46 -1.15 0.57 + – – ++ Grey Heron P 0.63 -0.75 0.01 0.24 0.35 -0.08 -1.16 0.41 -1.11 0.46 0.44 -0.67 0.20 + – – + Little Egret I 0.16 0.73 -0.67 -0.32 0.88 -0.03 -1.18 1.34 -0.98 0.63 -0.08 -0.14 0.32 – – + African Sacred Ibis I 0.06 1.34 -0.57 -0.65 0.68 0.25 1.17 -0.47 -1.49 1.39 -0.30 0.42 0.15 – + + African Spoonbill I -0.08 0.73 0.45 -1.14 -0.74 1.61 -1.00 -0.21 0.07 -2.00 -0.61 -0.23 -0.04 – – – – Greater Flamingo I -1.62 1.57 -1.03 -1.72 -1.92 1.99 -2.00 2.00 1.64 -0.63 -1.67 -0.18 0.58 – – – ++ Blacksmith Lapwing I 0.03 -0.11 -0.02 0.14 0.36 -0.18 -0.77 0.48 -0.34 -1.66 0.08 -0.22 -0.34 + – – Black-winged Stilt I 0.18 0.21 -0.21 -0.02 -0.49 1.06 -0.85 -0.62 0.24 -1.80 0.08 -0.22 -0.39 + – – Three-banded Plover I 0.15 -0.12 0.49 -0.73 -0.67 0.98 -0.97 -1.20 0.00 1.89 -0.29 -0.44 0.54 – – ++ White-fronted Plover I -0.46 -1.09 1.28 -0.13 -1.09 1.52 -0.08 -1.94 1.20 0.00 -0.30 -0.26 0.21 – – + Kittlitz's Plover I -0.71 1.36 0.78 -0.57 0.28 0.67 -0.19 -1.81 1.69 1.41 -0.64 0.79 0.26 – – ++ + Pied Kingfisher P 0.56 -0.71 0.24 0.05 -0.21 0.45 -0.83 0.64 -0.10 -0.07 0.31 -0.46 0.32 + – + Hartlaub's Gull I -0.33 0.39 -0.55 0.12 0.85 -0.12 -0.46 -0.62 0.82 -0.97 -0.10 0.40 -0.57 – + – – Kelp Gull I 0.00 0.71 0.20 -0.28 0.42 -0.35 0.60 0.83 -0.14 -0.16 -0.14 0.40 0.13 – + + Caspian Tern P 0.14 -0.96 0.94 0.25 -1.29 0.84 -0.70 0.45 -0.81 1.00 0.20 -0.94 0.81 + – – ++ Swift Tern P 0.05 -1.48 0.90 -0.05 0.14 1.54 -1.31 0.86 -2.00 2.00 0.00 -1.16 1.33 – – ++ Palearctic migrants Curlew Sandpiper I -1.35 1.61 0.22 1.71 -1.33 -0.13 -2.00 – – 2.00 0.18 -0.57 0.70 – – – ++ Little Stint I -0.10 1.78 0.42 -1.68 -1.08 1.35 -2.00 – – 2.00 -0.89 -0.44 1.26 – – – ++ Common Greenshank I -1.20 1.17 -0.25 -1.75 1.01 0.85 1.48 -2.00 2.00 -0.24 -1.47 1.42 -0.41 – – ++ – Sandwich Tern P -0.86 -0.53 -0.62 1.10 -2.00 2.00 1.83 -2.00 - 2.00 0.12 -0.23 0.34 + – + Common Tern P -0.73 1.20 0.05 0.46 -1.00 1.51 1.26 -1.98 0.29 1.83 -0.14 0.44 0.35 – + +
162

163
Table 4.9 Summary of linear model selection analysis for waterbird variability at the Bot River Estuary, 2002–2010. Covariate labels: wl = water-level, s = salinity, mbp = months between phases, mr = mean run-off. r2 = adjusted correlation coefficients, P = model probability and AIC = Akaike's An Information Criterion.
1 Model selection was based on Akaike’s An Information Criterion (AIC). A lower AIC value indicates a better model.
Model and co-variates r2 P AIC1
Model 1 : β0 + βwl.X 0.482 0.018 20.4
Model 2 : β0 + βs.X 0.394 0.039 22.1
Model 3 : β0 + βwl + βsX 0.354 0.072 22.3
Model 4 : β0 + βwl.+ ΒmbpX 0.355 0.071 22.3
Model 5 : β0 + βmbp.X 0.288 0.051 22.7
Model 6 : β0 + βmr + βmbp + βsX 0.164 0.315 26.0
Model 7 : β0 + βmrX -0.107 0.850 27.5

164
Table 4.10 Species of conservation importance at Bot River Estuary based on maximum counts from 55 surveys. Ramsar 1% levels, sub-regional IBA levels and provincial (Western Cape) thresholds are given. Species are sorted in descending order of the global 1% threshold level. Species in bold are included in the South African Red Data Book (Barnes 2000).
Species Max. count
Threshold
Ramsar 1%1
IBA 0.5%2
Western Cape3
Caspian Tern 88 5.9% (13) 14 15.7% Greater Flamingo 2884 3.8% (7) 7 14.8% Great Crested Grebe 356 3.7% (22) 11 26.6% Swift Tern 704 3.5% (6) 3 12.2% Hartlaub's Gull 728 2.4% (12) 14 9.6% White-breasted Cormorant 247 2.1% (15) 13 5.0% Cape Shoveler 720 2.1% (5) 8 8.9% Yellow-billed Duck 2030 2.0% (3) 8 14.2% Red-knobbed Coot 15352 1.5% (3) 6 20.6% Black-necked Grebe 199 1.3% (2) 2 6.1% Kelp Gull 867 1.2% (1) 6 6.6% Sandwich Tern 2059 1.2% (1) 1 49.9% Great White Pelican 222 1.1% (1) 6 6.8% Black-winged Stilt 125 – 4 – Southern Pochard 390 – 2 23.5% White-backed Duck 134 – 2 19.5% White-fronted Plover 106 – 1 6.5% Reed Cormorant – – – 15.4% African Spoonbill – – – 14.4% Purple Heron – – – 9.9% Common Tern – – – 9.9% Little Grebe – – – 9.9% African Snipe – – – 8.6% Cattle Egret – – – 8.2% Yellow-billed Egret – – – 8.0% Bank Cormorant – – – 8.0% Grey Heron – – – 7.1% Cape Cormorant – – – 7.0% Water Thick-knee – – – 6.8% African Sacred Ibis – – – 6.3% Spur-winged Goose – – – 6.0% African Darter – – – 5.3% Black Stork – – – 5.3% Little Egret – – – 5.2% African Black Duck – – – 5.1%
1 Figures represent the percentage of the estimated global* or Southern African# population based on the maximum count. Numbers in parentheses represent the number of counts which met or surpassed the 1% threshold level. Calculated from Wetlands International (2006).
2 Figures represent the number of counts which met or surpassed the Sub-regional IBA level (0.5% threshold) for southern Africa (Barnes 1998) but did not surpass the 1% global threshold level.
3 Value represents the percentage of the estimated provincial population and based on the maximum count. Estimates sourced and calculated from Coordinated Waterbird Counts, Avian Demography Unit, unpublished data (2006)

Table 4.11 Waterbird Conservation Value (WCV) scores for 22 waterbirds at the Bot River Estuary from February 2002–February 2010. Only species that had at least one score index value 0.1 during any one phase are listed. Scores equalling or surpassing the 0.5% and/or 1.0% thresholds are highlighted in italics and bold respectively. For estuarine phase abbreviations refer to Table 4.2.
Species Estuarine phase Mean WCV score
LK1 ES1 LG1 LK2 ES2 LG2 LK3 ES3 LG3 ES4 LG4 Lake Estuary Lagoon
Great Crested Grebe 1.23 2.29 1.42 0.54 0.28 0.50 0.90 0.11 0.42 0.13 0.14 0.89 0.70 0.62 Caspian Tern 1.10 0.39 1.08 1.24 0.27 0.76 0.83 0.40 0.63 0.27 0.80 1.06 0.33 0.82 White-breasted Cormorant 0.95 0.23 0.39 0.67 0.58 1.00 1.54 0.64 1.02 0.15 0.13 1.05 0.40 0.63 Red-knobbed Coot 0.77 0.44 0.02 0.26 0.09 0.07 0.28 0.07 0.01 0.00 0.00 0.43 0.15 0.03 Cape Shoveler 0.68 0.29 0.17 0.40 0.33 0.17 0.59 0.04 0.07 0.02 0.00 0.56 0.17 0.10 Hartlaub's Gull 0.66 0.98 0.56 0.40 0.99 0.74 0.99 0.62 0.33 0.78 0.27 0.68 0.84 0.47 Yellow-billed Duck 0.59 0.15 0.22 0.40 0.20 0.14 0.71 0.10 0.13 0.07 0.01 0.57 0.13 0.13 Swift Tern 0.34 0.05 0.13 0.14 0.16 1.61 1.20 0.25 0.62 0.00 0.68 0.56 0.12 0.76 Black-necked Grebe 0.28 0.31 0.06 0.04 0.01 0.08 0.38 0.00 0.06 0.00 0.01 0.23 0.08 0.05 Little Grebe 0.28 0.07 0.02 0.10 0.05 0.04 0.09 0.00 0.02 0.00 0.00 0.16 0.03 0.02 White-backed Duck 0.24 0.05 0.00 0.01 0.00 0.00 0.00 0.00 0.00 0.00 0.00 0.08 0.01 0.00 Greater Flamingo 0.22 1.84 0.59 0.06 0.00 0.71 0.04 0.00 0.05 0.49 0.26 0.11 0.58 0.40 Black-winged Stilt 0.13 0.16 0.13 0.16 0.10 0.40 0.31 0.12 0.07 0.08 0.00 0.20 0.12 0.15 White-fronted Plover 0.12 0.04 0.17 0.10 0.03 0.15 0.20 0.18 0.00 0.01 0.01 0.14 0.06 0.08 Southern Pochard 0.11 0.34 0.00 0.00 0.02 0.00 0.00 0.01 0.00 0.00 0.00 0.04 0.09 0.00 African Black Oystercatcher 0.10 0.12 0.11 0.12 0.16 0.19 0.05 0.10 0.10 0.02 0.38 0.09 0.10 0.19 Kelp Gull 0.10 0.21 0.26 0.26 0.40 0.32 0.21 0.39 0.95 0.82 0.70 0.19 0.46 0.56 Spur-winged Goose 0.05 0.03 0.08 0.05 0.04 0.03 0.15 0.04 0.02 0.04 0.08 0.08 0.04 0.05 Sandwich Tern 0.05 0.03 0.01 0.01 0.00 0.01 0.03 0.61 0.00 0.00 0.04 0.03 0.16 0.02 Great White Pelican 0.03 0.05 0.09 0.13 0.51 0.22 0.59 0.10 0.17 0.60 0.55 0.25 0.32 0.26 Kittlitz's Plover 0.01 0.05 0.12 0.06 0.08 0.15 0.09 0.07 0.00 0.04 0.24 0.05 0.06 0.13 Common Tern 0.01 0.03 0.03 0.02 0.01 0.05 0.06 0.27 0.00 0.00 0.05 0.03 0.08 0.03 Additional species1 0.30 0.22 0.20 0.24 0.23 0.42 0.38 0.17 0.35 0.16 0.33 0.31 0.19 0.32
Total 8.37 8.38 5.85 5.40 4.53 7.75 9.58 4.28 5.03 3.69 4.70 7.78 5.22 5.83
1 This category refers to the sum of scores for all remaining species.
165

166
Figure 4.1 Bot River Estuary and its link to the Kleinmond Estuary via Die Keel and the Lamloch Swamps. Inset shows the three catchments (Bot River, Swart River and Afdaks River) which drain into the estuary. Modified from van Niekerk et al. 2005.

167
Figure 4.2 The 11 hydrological phases of the Bot River Estuary from February 2002–February 2010 in relation to water-level (solid line) and salinity (dashed line). Values from February 2003–December 2006 are monthly or quarterly; values after December 2006 are at less frequent intervals. A–B represents the conditions during the ‘normal’ (i.e. non-breaching) annual cycle of the estuary. Black arrows indicate when a breach occurred. For explanation of the codes refer to Table 4.2.
0
5
10
15
20
25
30
35
40
45
0.0
0.5
1.0
1.5
2.0
2.5
3.0
3.5
Sal
init
y (p
.p.t.
)
Wat
er le
vel t
o M
SL
Month
LK
1
E1
LG
1
LK
2
E2
LG
2
LK
3
E3
LG
3
E4
LG
4
A B

168
Figure 4.3 (a) Monthly mean, median and maximum monthly rainfall from weather station at Haasvlakte, near Caledon, from 2002–2009; (b) Inter-annual variation in mean summer and winter rainfall from Haasvlakte, 2002/03–2009/10.
0
20
40
60
80
100
120
Mea
n ra
infa
ll (
mm
)
Year
WinterSummer
(b)
0
50
100
150
200
250
300
Rai
nfal
l (m
m)
Month
MeanMedianMax
(a)

169
Figure 4.4 Mean, maximum and minimum flow rate of the Bot River upstream from the estuary between February 2002–February 2010.
0.01
0.1
1
10
100
1000
Log
10 f
low
rat
e (m
3/se
c.)
Month
Mean Max Min

170
Figure 4.5 Changes in total waterbird abundance in relation to changes in salinity (dashed line) at the Bot River Estuary from February 2002–February 2010 with (a) Red-knobbed Coot (dark bars) included and (b) Red-knobbed Coot excluded. Both graphs shown at the same scale to facilitate comparison.
0
2000
4000
6000
8000
10000
12000
14000
16000
18000
0
5
10
15
20
25
30
35
40
45N
o. o
f bi
rds
Sal
init
y (p
.p.t.
)
(a)
0
2000
4000
6000
8000
10000
12000
14000
16000
18000
0
5
10
15
20
25
30
35
40
45
No.
of
bird
s
Survey date
Sal
init
y (p
.p.t.
)
(b)

171
Figure 4.6 Mean monthly abundance of all waterbirds and the main waterbird groups at the Bot River Estuary from February 2002–February 2010.
0
2000
4000
6000
8000 All waterbirds
050
100150200250300350
Grebes
0
50
100
150
200 Resident terns
0
500
1000
1500Migratory terns
0
200
400
600Resident gulls
0
500
1000
1500Ducks and Geese
Mea
n no
. of
bird
s
0
200
400
600
800 Cormorants and Darter
0
200
400
600
800
1000
Month
Waders Flamingos
0
200
400
600 Migratory shorebirds
Resident shorebirds
0
20
40
60
80
Month
Great White Pelican

172
Figure 4.7 Mean monthly abundance of 10 waterfowl species at the Bot River Estuary from February 2002–February 2010.
0
100
200
300Cape Shoveler
0
200
400
600
800Yellow-billed Duck
0
1000
2000
3000
4000
5000
6000
Month
Red-knobbed Coot
0
20
40
60
80
100
120
Month
Southern Pochard
0
100
200
300
400Egyptian Goose
0
100
200
300 Little Grebe
0
20
40
60
80Black-necked Grebe
0
20
40
60 Red-billed Teal
0
50
100
150
200Great Crested Grebe
0
50
100
150 Spur-winged Goose
Mea
n n
o. o
f bi
rds

173
Figure 4.8 Mean monthly abundance of nine waterbirds at the Bot River Estuary from February 2002–February 2010.
0
10
20
30
40
50
Sep Oct Nov Dec Jan Feb Mar AprMay Jun Jul Aug
Month
Caspian Tern
0
50
100
150
200 Kittlitz's Plover
0
200
400
600
800 Greater Flamingo
0
200
400
600 Reed Cormorant
0
20
40
60
80 African Darter
0
50
100 Black-winged Stilt
0
50
100
150 White-breasted Cormorant
Mea
n no
. of
bird
s
0
50
100
150
200
250
Sep Oct Nov Dec Jan Feb Mar Apr May Jun Jul Aug
Month
Little Stint Curlew Sandpiper

174
Figure 4.9 Mean abundance of different waterbird groups during the 11 phases of the Bot River Estuary from February 2002–February 2010.
0
2000
4000
6000
8000
10000
Mea
n no
. of
bird
s
Red-knobbed CootDucks and GeeseGrebes
0
500
1000
1500 Flamingos
Waders (herons, ibis, egret, spoonbill)
0
500
1000
1500
2000 Pelican Cormorants and Darter
0
500
1000
1500
2000
2500
3000
3500
Estuary phase
Migratory ternsResident gulls
0
5
10
15
20
25
30 Kingfishers
0
2000
4000
6000
8000
10000
12000 All waterbirds
0
200
400
600
800
1000
1200
Estaury phase
Migratory shorebirds
Resident shorebirds

175
0
100
200
300Egyptian Goose
0
50
100
150
200Southern Pochard
0
20
40
60Red-billed Teal
0
50
100
150Spur-winged Goose
0
200
400
600
800Yellow-billed Duck
050
100150200250300
Estuary phase
Cape Shoveler
0
10
20
30 Cape Teal
0
50
100 Black-necked Grebe
0
100
200
300 Great Crested Grebe
050
100150200250300
Estuary phase
Little Grebe
0
2000
4000
6000
8000 Red-knobbed Coot
Mea
nno
.of
bird
s
Figure 4.10 Mean abundance of 11 waterfowl species during the 11 phases of the Bot River Estuary from February 2002–February 2010.

176
Mea
n no
. of
bird
s
0
50
100 African Darter
0
200
400Cape Cormorant
0
200
400
600 Reed Cormorant
0
100
200 White-breastedCormorant
0
500
1000
1500Greater Flamingo
020406080
100120
140
Estuary phase
Great White Pelican
0
500
1000 Hartlaub's GullKelp Gull
0
50
100
150 Black-winged Stilt Blacksmith Lapwing
0
100
200 African Sacred IbisAfrican Spoonbill
0100200300400500600700
Estuary phase
Curlew Sandpiper
Little Stint
0
150
300 White-fronted PloverThree-banded PloverKittlitz's Plover
Figure 4.11 Mean abundance of 17 waterbird species during the 11 phases of the Bot River Estuary from February 2002–February 2010.

177
Figure 4.12 Plot of mean species abundance and estuarine phase at the Bot River estuary (2002–2010) based on correspondence analysis. The plot represents the first principal plane of the correspondence analysis. The horizontal axis accounts for 45.49% of the inertia, and the vertical axis accounts for 21.85% of the inertia. The boxed area is detailed in Figure 4.13.

178
Figure 4.13 Plot of mean species abundance and estuarine phase at the Bot River estuary (2002–2010) based on correspondence analysis (zoomed in view from inset in Figure 4.12). The plot represents the first principal plane of the correspondence analysis. The horizontal axis accounts for 45.49% of the inertia, and the vertical axis accounts for 21.85% of the inertia.

179
Figure 4.14 Plot showing the relationship between the estuarine phase CA scores (derived from the first axis, Figure 4.12) and water-level at the Bot River Estuary, 2002–2010.
1.0 1.5 2.0 2.5
-0.5
0.0
0.5
1.0
1.5
Water level
CA
Sco
re, a
xis
1
LK1
ES1
LG1
LK2
ES2
LG2
LK3
ES3
LG3
ES4
LG4
y 1.34 - 0.708x
r2 = 0.482; n = 11; p < 0.05

180
Figure 4.15 Mean (a) abundance and (b) biomass of herbivores, invertebrate feeders and piscivores during the 11 phases of the Bot River Estuary from February 2002–February 2010.
0
10
20
30
40
50
60
70
80
90
100
Lake 1 Estuary 1 Lagoon 1 Lake 2 Estuary 2 Lagoon 2 Lake 3 Estuary 3 Lagoon 3 Estuary 4 Lagoon 4
Bio
mas
s (k
g x
102 )
Estuary phase
(b)
0
2
4
6
8
10
No.
of
bird
s (x
103 )
HerbivoresInvertebrate feedersPiscivores
(a)

181
Figure 4.16 Colour-coded histogram to show the change in the Waterbird Conservation Value (WCV) score at the Bot River Estuary from 1993–2010. Species listed are those that reached or surpassed the 0.5% or 1% threshold level at least once. The line A–B represents six-monthly surveys from1993–July 2002. The dashed line represents water–level and the black down arrows indicate when a breach occurred. MSL = mean sea level.
Figure 4.17 Changes in the WCV scores between the 11 different estuarine phases at the Bot River estuary, 2002–2010. Species groups for which WCV scores were greater than 1.0 are shown. Species breakdowns are shown in Figures 4.18a, b.
0
0.5
1
1.5
2
2.5
3
3.5
0
2
4
6
8
10
12
14
16
18Ju
l-93
Jul-
94
Jul-
95
Jul-
96
Jul-
97
Jul-
98
Jul-
99
Jul-
00
Jul-
01
Feb
-02
Feb
-03
Jun
-03
Au
g-03
Oct
-03
Dec
-03
Feb
-04
Apr
-04
Jul-
04
Sep
-04
Nov
-04
Jan
-05
Mar
-05
May
-05
Jul-
05
Oct
-05
Dec
-05
Feb
-06
Apr
-06
Jul-
06
Sep
-06
Dec
-06
May
-07
Feb
-08
Jul-
08
Feb
-09
Jul-
09
Feb
-10
Wat
er le
vel (
m a
bove
MS
L)
WC
V s
core
Survey date
Caspian Tern White-breasted Cormorant Great Crested Grebe Hartlaub's GullGreater Flamingo Swift Tern Cape Shoveler Red-knobbed CootYellow-billed Duck Black-necked Grebe Kelp Gull Sandwich TernGreat White Pelican Little Grebe Black-winged Stilt White-backed DuckWhite-fronted Plover Southern Pochard Other
A B
0
2
4
6
8
10
12
WC
V s
core
Estuarine phase
Grebes Waterfowl CormorantsFlamingos Pelicans GullsResident shorebirds Resident terns Migrant terns

182
Figure 4.18 Colour-coded radar plots showing the change in Waterbird Conservation Value (WCV) scores (vertical axis) between the 11 phases of the Bot River estuary, February 2002–February 2010, for (a) species with WCV scores ≥ 1 (i.e. species meeting Ramsar thresholds) and (b) species with WCV scores ≥ 0.5 and < 1.0 (i.e. species meeting Sub-regional IBA thresholds)
0.0
0.5
1.0
1.5
2.0
2.5Lake 1
Estuary 1
Lagoon 1
Lake 2
Estuary 2
Lagoon 2Lake 3
Estuary 3
Lagoon 3
Estuary 4
Lagoon 4
Great Crested Grebe
White-breasted Cormorant
Caspian Tern
Greater Flamingo
Swift Tern
(a)
0.0
0.1
0.2
0.3
0.4
0.5
0.6
0.7
0.8
0.9
1.0Lake 1
Estuary 1
Lagoon 1
Lake 2
Estuary 2
Lagoon 2Lake 3
Estuary 3
Lagoon 3
Estuary 4
Lagoon 4
Hartlaub's Gull
Cape Shoveler
Red-knobbed Coot
Yellow-billed Duck
Kelp Gull
Sandwich Tern
Great White Pelican
(b)

183
Figure 4.19 The relationship between the monthly Waterbird Conservation Value (WCV) score and the number of species reaching 1% thresholds at the Bot River Estuary, 2002–2010 (n = 55).
y = 1.657x + 3.7175R² = 0.7528
0
2
4
6
8
10
12
14
16
0 1 2 3 4 5 6
WC
V s
core
No. of species reaching 1% threshold

184
Appendix 4.1 List of 84 waterbird species used in the correspondence analyses (CA). Species codes And the CA coordinates (scores) for Axes 1 and 2 are given for each species. The species codes refer to the labels used in the CA plots (Figures 4.12 and 4.13). Species marked with an asterisk (*) were used as supplementary columns in the analysis.
Common name Species code
CA coordinates
Axis 1 Axis 2 African Black Duck abd 0.303379 0.366455 African Black Oystercatcher abo 0.886694 -0.40744 African Darter ad -0.0067 0.349558 African Fish-Eagle afe 0.310852 -0.14816 African Jacana aj -0.71693 -0.64584 African Marsh-Harrier amh -0.08164 0.261772 African Purple Swamphen aps -0.30788 0.151213 African Sacred Ibis asi 0.684271 0.349468 African Snipe asn -0.96582 -0.43437 African Spoonbill as 0.221789 0.356978 Bank Cormorant bcm 0.770795 1.833399 Black Crake blc -0.52208 -0.0222 Black Harrier blh -0.03445 0.757105 Black Stork bls 0.76107 0.054929 Black-crowned Night-Heron bnh 0.177219 0.490996 Black-headed Heron bh 0.301239 0.571423 Black-necked Grebe bg -0.09306 0.12196 Blacksmith Lapwing bl 0.188449 0.441437 Black-winged Stilt bws 0.13823 0.350075 Blue Crane bc 1.903786 -0.9578 Cape Cormorant cc 0.517179 1.138804 Cape Shoveler cs -0.28383 0.121359 Cape Teal ct -0.01202 0.050747 Caspian Tern cat 0.357002 0.02867 Cattle Egret ce -0.55015 -0.13951 Chestnut-banded Plover cbp -0.4615 -0.00299 Common Greenshank cg 0.819947 -0.07239 Common Moorhen cm -0.74552 -0.20808 Common Ringed Plover crp 1.943957 -2.00262 Common Sandpiper csp 0.709201 0.103117 Common Tern* cot 0.510315 0.218332 Common Whimbrel cw 2.186517 -1.51888 Crowned Cormorant crc 0.984186 1.711969 Curlew Sandpiper cus 1.253561 -1.2185 Egyptian Goose eg 0.289815 0.231169 Eurasian Curlew ec -0.11619 -0.30379 Giant Kingfisher gk 0.703893 -0.16113 Glossy Ibis gi -0.55146 -0.13939 Great Crested Grebe gcg -0.05942 -0.05329 Great Egret ge -0.54089 -0.18769 Great White Pelican gwp 0.885091 0.149599 Greater Flamingo gfl 0.258345 -0.27951 Grey Plover gh 2.591037 -2.47984 Grey Heron gp 0.153021 0.339056 Grey-headed Gull ghg 0.425127 0.63733 Hadeda Ibis hi 0.316962 0.640416 Half-collared Kingfisher hck -0.4615 -0.00299 Hamerkop hkp -0.38671 -0.14207 Hartlaub's Gull hg 0.282487 0.273477 Hottentot Teal ht -1.05217 -0.45883 Kelp Gull kg 0.981259 0.406007 Kittlitz's Plover kp 0.991134 -0.41646 Little Egret le 0.533932 0.324137 Little Grebe lg -0.45412 -0.02309 Little Stint ls 1.916477 -1.66323 Little Tern lt 0.76107 0.054929 Maccoa Duck md -1.03693 -0.46733

185
Appendix 4.1 contd.
Common name Species Code
CA coordinates
Axis 1 Axis 2
Malachite Kingfisher mk -0.29523 0.121559 Marsh Sandpiper msp -0.1156 -0.10024 Osprey osp 0.058908 0.31866 Pied Avocet pa 0.494393 0.24589 Pied Kingfisher pk 0.503778 0.289975 Purple Heron ph -0.11552 0.375286 Red Knot rkn 2.239221 -2.30751 Red-billed Teal rtl -0.19674 0.034469 Red-knobbed Coot rc -0.56231 -0.17795 Reed Cormorant rcm 0.309139 0.680323 Ruddy Turnstone rt 0.149784 0.025968 Ruff rf -0.56552 -0.15166 Sanderling sdg 0.926915 -0.6158 Sandwich Tern* sat 0.405460 0.423002 South African Shelduck sas 0.468886 -0.16685 Southern Pochard sp -0.60426 -0.57431 Spur-winged Goose swg 0.446996 -0.00326 Swift Tern swt 0.6181 0.234049 Terek Sandpiper tsp -0.54931 -0.73935 Three-banded Plover tp 0.79072 -0.51929 Water Thick-knee wtk 0.438098 1.00388 White Stork wst 2.852699 -2.6525 White-backed Duck wbd -0.95862 -0.49139 White-breasted Cormorant wcm 0.192246 0.536314 White-fronted Plover wp 0.151278 0.27697 White-winged Tern wwt 0.308466 -0.46349 Wood Sandpiper ws -0.9045 -0.34487 Yellow-billed Duck yd -0.15081 0.245635 Yellow-billed Egret ye -0.37376 -0.12366

187
Chapter 5
Wetlands and waterbirds in the Western Cape,
South Africa: associations and conservation
importance

188

189
Abstract The spatial context and importance of waterbirds and wetlands in the Western Cape
were assessed using three methods – correspondence analysis, the Waterbird
Conservation Value (WCV) score and Daily Energy Intake (DEI). There were strong
waterbird-wetland associations between saline wetlands (estuaries and estuarine bays)
and freshwater wetlands (lakes and waste water treatment works). Palearctic migrants
were strongly associated with coastal sites while residents showed strong relationships
with freshwater and/or brackish wetlands. Waterbird Conservation Value scores were
higher in larger wetlands than in smaller wetlands and where large numbers of birds
congregated. Fourteen species had populations that reached or surpassed 1% of their
global populations during summer and winter at major wetlands in the Western Cape.
Biomass and DEI values varied seasonally for most sites, with more energy being
removed from wetlands during summer than winter which highlighted the importance of
species using different sites at different times of the year. Site conservation status did
not show strong associations with any waterbird groups. Overall, three sites,
Strandfontein Waste Water Treatment Works, Langebaan Lagoon and Berg River
Estuary were the most important sites in terms of numbers of birds, waterbird
conservation value score and energy consumption. They contributed 49.7 % to the
conservation value of all sites in the Western Cape and are critical localities for
waterbird conservation in the region.
Plate 5.1 Waterbirds making use of a temporary flooded wetland area near Cape Town in August 2010. The white dots in the waterbody are Greater Flamingos. Photo: DM Harebottle.

190
Introduction
Chapter 2 described the development of the Waterbird Conservation Value (WCV) score
and its application at flyway level. In Chapter 3, the WCV score was applied regionally
at four representative wetlands within South Africa using visual analyses methods; the
data on which the analyses were based were sourced from detailed site assessments in
Appendices A–D. Chapter 4 looked at how the WCV score can be applied locally at site
level and particularly at a site that has complex hydrological cycles, such as a
temporary closed estuary. There is, however, a need to discuss the results of the five
sites above in a greater regional context and to place these sites in the wider framework
of wetland and waterbird conservation in the Western Cape.
Collins and Glen (1991), Bohninggaese et al. (1994), Flather and Sauer (1996)
and Roshier et al. (2001) recognised that ecological processes that structure populations
operate at broader landscape scales than those at which humans can visualise the
landscape. Briggs and Lawler (1991) also found that Australian waterbirds interact
with their habitat and visualise their environment at larger spatial scales than a single
wetland or catchment
At site level, changes in species’ populations are often attributed to overall
demographic changes or spatial re-arrangement of individuals within it (Roshier et al.
2001). The latter infers that connections between wetland sites exist and that these
inter-relationships contribute to both the spatial and temporal changes in populations,
regardless of distances between sites. Although waterbird habitat may not be
distributed evenly through the landscape (Roshier et al. 2001), characteristics at each
wetland usually define the species composition and abundance; therefore similarities
and associations between sites can be assessed.
It is therefore necessary to look at the broader network of wetlands in the winter
rainfall region and assess their relative importance at a larger spatial scale. In this
chapter I aim to determine waterbird associations between 30 key wetland sites in the
Western Cape to identify any relationships between sites and then assess which sites
are important. This was done based on three separate but related analyses:
(1) correspondence analysis that considers the composition, status and abundance of
selected waterbirds at each site, (2) determining the Waterbird Conservation Value
(WCV) score (see Chapter 2) of each site and assessing the conservation importance of
these wetlands based on the WCV scores and (3) estimating and comparing the energy
intake and biomass of waterbirds at each site. I also discuss the importance of inter-
connectivity, landscape and climatic changes and local site factors in determining the
relative significance of spatial distribution of wetlands in the winter rainfall region.

191
Methods
Correspondence analysis
To assess the spatial context of wetlands and waterbirds in the Western Cape Province,
I applied correspondence analysis (CA) to the data matrix of mean species counts at a
selection of 30 key wetlands; characteristics of each wetland are summarized in
Appendix 1.5 (Chapter 1). Correspondence analysis would determine the association
between waterbird composition and wetland sites (the data matrix) and display these in
graphical two dimensional plots (Greenacre 1984, Underhill and Peisach 1985). The
interpretation of the plots is described the Methods section in Chapter 4.
Correspondence analysis was performed using two matrices of mean species
counts of waterbirds at sites, one for summer and one for winter. Counts of waterbirds
at wetland sites were drawn from the Coordinated Waterbird Counts (CWAC) database
at the Animal Demography Unit, University of Cape Town (unpubl. data). Sites which
had two primary criteria were selected for inclusion in the analysis: (a) sites which
supported, on average, a mean count of at least 2000 waterbirds during summer and/or
winter surveys, or (b) sites which supported more than 50 species. The correspondence
analysis and the resultant plots were carried out using program R (R Development Core
Team 2012).
Waterbird Conservation Value (WCV) score
To place the conservation value of the five sites dealt with in this thesis within a
broader landscape perspective (i.e. within the Western Cape Province), I compared each
site’s WCV score with the scores for the wetlands selected for the CA. The WCV score
was based on the mean summer and winter abundance of each species. For computation
and interpretation of the score refer to Methods in Chapter 2.
Biomass, Field Metabolic Rate and Daily Energy Intake
The total biomass of waterbirds at each priority wetland selected for the CA was
estimated from the mean count of each species at each site in both summer and winter.
Bird masses were taken from Hockey et al. (2005). The Field Metabolic Rate (FMR,
kJ/day) was calculated for each species for each of the priority wetlands for summer and
winter. FMRs were calculated using the same approach as in Underhill (1987) and
Velásquez et al. (1991) the formula 10.9M0.640, where M is the body mass (g) of the
species (Nagy 1987). An estimate of the Daily Energy Intake (DEI, kJ/day), including
metabolized and non-metabolized energy, was obtained by correcting for Assimilation
Efficiency (AE). Values of AE used were 58% for herbivores and 75% for invertebrate

192
feeders and piscivores (Velásquez et al. 1991). Final assimilated DEI values were then
summed across all species for each site to get an overall DEI value at each site. These
values represent an estimate of total the amount of energy that the waterbird
community extracts from each wetland.
Results and discussion
In this section it was convenient to discuss each of the results in turn, rather than
attempt to separate them.
Waterbird and wetland relationships in the Western Cape
Results of the correspondence analyses are presented in Figures 5.1–5.8. When
considering the type of wetland, it is evident that the estuaries and estuarine bays are
well separated from the inland wetlands (e.g. farm dams, state impoundments and
sewage works); the man-made sites are also quite distinct and form their own cluster in
the bottom-right quadrant of the summer and winter plots (Figures 5.1a, b). The plots
have a saline-freshwater gradient running from left to right such that sites plotted on
the far left of the x-axis (e.g. De Mond Estuary, Langebaan Lagoon and Keurbooms
Estuary) represent wetlands that are permanently or mostly saline while sites plotted
on the far right of the x-axis are predominantly freshwater. The plots for the species
during summer and winter confirm this with the marine/estuarine species (e.g.
Palearctic and resident shorebirds and terns) being plotted more on the left and the
freshwater species (kingfishers, waterfowl, grebes and waders) towards the right
(Figures 5.6a, b). Sites plotted between these extremes would generally be classified as
brackish wetlands and would have stronger or weaker affiliations to either saline or
freshwater conditions depending on their location within the plot. Thus, for example,
the Klein River, Diep River, Berg River and Groot Brak estuaries are plotted more
towards the left hand side of the x-axis as they are more regularly open to the sea and
therefore have stronger affinities to sites that are more saline or are permanently open
to the sea (Figures 5.1a, b). They show a mixture of freshwater and coastal /marine
species but do include species such as Wood Sandpiper and Common Sandpiper that are
not entirely coastal or marine but which can tolerate more brackish conditions.
However, they also include some coastal/marine species (Cape Cormorant, Common
Whimbrel, African Black Oystercatcher, Common Greenshank and White-fronted
Plover) that are absent or uncommon in freshwater wetlands.
In comparison, the Bot River Estuary, Wildevoëlvlei, Verlorenvlei, Wilderness
Lakes and Zandvlei Estuary are open less frequently to the sea and therefore display

193
stronger freshwater affinities, being plotted more towards the right side of the x-axis
(Figures 5.1a, b). Zandvlei, Wildevoëlvlei, Verlorenvlei and Wilderness estuarine
system in particular are estuaries that were grouped amongst the natural and man-
made freshwater sites highlighting their freshwater dominance and sporadic (> 3 yrs)
connection to the sea (Figure 5.4a, b). This results in their avifauna being dominated by
species preferring freshwater, notably waterfowl (ducks, geese, coots and grebes).
Seasonally, there were differences between sites. For example, Langebaan
Lagoon and Olifants River Mouth are more closely associated during summer than
winter (Figures 5.1a, b). This is primarily due to similarities in their Palearctic
shorebird communities over the austral summer. However, during winter, Langebaan
Lagoon supports far greater numbers of Palearctic shorebirds than the Olifants River
Mouth, notably Ruddy Turnstones, Sanderlings, Bar-tailed Godwits and Eurasian
Curlews (Figures 5.6a, b, Figures 5.7a, b). These and other Palearctic shorebirds at the
lagoon represent non-breeding, first-year birds and measure the annual breeding
success from the previous season (Robertson 1981, Underhill 1987). Langebaan Lagoon
is known to support the largest populations of over-wintering shorebirds in South
Africa (Underhill 1987) and the results from this analysis provide evidence for this
site’s uniqueness in this regard during winter. A similar pattern was observed for the
De Mond Estuary and Keurbooms Estuary; they had stronger association in winter
than summer. Their summer waterbird populations comprised mainly Palearctic terns
and shorebirds, but the De Mond Estuary supported larger numbers of these species. In
winter, the Keurbooms Estuary supported more overwintering shorebirds but Cape
Cormorant, White-breasted Cormorant and White-fronted Plover occurred in similar
numbers at these sites.
A similar seasonal pattern was seen for the Wilderness and Swartvlei estuarine
systems). However, compared with Langebaan Lagoon and Olifants River Mouth these
sites are further removed from each other during winter. The plot shows that the
Swartvlei estuarine system tends to become more saline during this period (Figure
5.1a, b). Whitfield et al. (1983) detailed how the Swartvlei opens more frequently
during winter than the Wilderness estuarine system and how this changes the
composition and abundance of the biodiversity in the system. Boshoff and Palmer
(1991a, b, c) and Boshoff and Piper (1993) also provided evidence of a seasonal
separation of the waterbird community at the Wilderness and Swartvlei estuarine
systems.
The Berg River estuary lies separated and in similar positions in both the
summer and winter plots (Figures 5.1a, b). This estuary is able to support large

194
numbers of waterbirds (Table 2.5) and has high species richness, particularly during
summer (Velasquez et al. 1991). One would anticipate that it would have stronger
associations with other coastal sites such as Langebaan Lagoon and Olifants River
Mouth, both of which support similar numbers and richness of waterbirds. The reason
for the Berg River’s separation from other coastal estuaries probably lies in its large
size and greater habitat diversity; the site incorporates saline, brackish and freshwater
habitats ranging from commercial saltpans, saltmarshes and sandbanks, to the river
channel and adjacent floodplains (Velasquez et al. 1991). All these habitats are
included in the waterbirds counts conducted as part of CWAC and are not restricted to
the lower parts of the estuary. This habitat diversity allows the site to support a greater
cosmopolitan avifauna rather than restricting it to species that preferentially prefer or
utilise one or a couple of habitats.
Four sites – Rondevlei, Theewaterskloof, Zandvlei and Wildevoëlvlei – display
particularly strong associations during summer but less so during winter (Figures 5.1a,
b). Zandvlei and Wildevoëlvlei are classified as estuaries but are only intermittently
open to the sea (Whitfield 2000). Theewaterskloof Dam is a large state dam while
Rondevlei is a freshwater lake. There is a strong cormorant and waterfowl component
in winter while in summer there were stronger links with kingfishers, rallids and
waders (Figures 5.6a, b).
The four waste water treatment works (Strandfontein, Beaufort West, Macasser
and Paarl) are generally closely associated during summer and winter, but have a
stronger association during winter (Figures 5.1a, b). This is probably due to the high
concentrations of waterfowl species that congregate at these sites after breeding in
spring and early summer. These sites have permanent, deep water and are eutrophic
throughout the year, ensuring a regular and constant supply of food (particularly
macro-invertebrates). These factors probably aid in drawing these species to these sites
during a period when food availability is lower in surrounding natural wetlands.
Radyn Dam and Droëvlei Dam, the two farms dams, are more closely associated
during summer than during winter (Figures 5.1a, b). They are grouped together with
other man-made sites such as Voëlvlei Dam, Strandfontein WWTW, Beaufort West
WWTW and Rietvlei. These sites support species such as South African Shelduck,
Maccoa Duck, Ruff, and White-winged Tern (Figures 5.6a, b and 5.7a, b).
If we consider the location of the wetlands in terms of being coastal or inland
(Figures 5.2a, b) there was generally no strong associations and generally different
wetlands types were well spread across these two spatial scales. Most sites were coastal
wetlands, being either estuaries or coastal lakes. The six inland sites tended to be

195
loosely grouped on the right hand side of axis one which confirmed their freshwater
status, and with the exclusion of Theewaterskloof Dam, showed stronger affinities in
summer than during winter (Figures 5.2a, b). If we consider just the estuarine sites,
their waterbird communities reflected fairly strong summer and winter associations
with the bioregion in which the estuary is located (Whitfield 2000). The cool temperate
estuaries or estuarine bays – Olifants River, Verlorenvlei, Langebaan Lagoon, Berg
River and Diep River – are loosely grouped together; however Verlorenvlei is well
separated from the others (Figures 5.3a, b). This is most likely linked to the site being
more of a coastal lake and having little estuarine affinity; the system rarely opens to
the sea due to the mouth being blocked by a stony ridge and a dune barrier. The warm
temperate sites showed stronger associations and interestingly the western estuaries
(Zandvlei, Bot River and Klein River) show a closer relationship than the easterly
located estuaries, particularly in winter. In summer, however, the Klein River Estuary
was associated with the Breede River Estuary and Knysna Lagoon (Figures 5.3a, b).
Inundation patterns showed the strongest associations between sites, and more
so in summer than in winter (Figures 5.4a, b). There were clear groupings between
estuaries that were permanently open versus estuaries that are temporarily open, and
between other sites with permanent water versus sites holding temporary water.
Summer showed stronger affinities within groups especially for the permanently
inundated sites; these sites would support higher concentrations of waterbirds during
the dry season when temporary wetlands (such as Rocher Pan) would usually dry up. In
winter, most of the non-estuarine wetlands would hold water making more sites
available for waterbirds to use and hence the slighter weaker associations between
groups as waterbird communities tended to diversify during this time. The permanently
open estuaries showed little change from one season to the next and highlighted their
specific role in supporting mainly marine and coastal waterbird communities. The
temporarily open estuaries showed a little more variation but tended to show more
similar waterbird associations during winter than summer. In winter, these estuaries
are usually open to the sea due to increased run-off and therefore support similar
waterbirds. The plot also elucidated the marine-freshwater gradient along Axis 1,
which was discussed earlier in this section (Figures 5.4a, b).
In terms of conservation status at each site, there were no distinct clusters
showing strong associations of sites with the same protection status during summer or
winter (Figures 5.5a, b). Generally most sites were unprotected. The plot shows that
protected sites covered an array of different wetland types ensuring that all major
waterbird groups are afforded protection at least at some stage during their annual

196
cycle. However, site conservation status probably does not play an over-riding factor in
determining selection by waterbirds. Rather the type of inundation and associated site
characteristics, typified by wetland type, were more important factors determining the
composition and abundance of waterbirds at wetlands in the region.
For the species analyses, the species groups showed various associations (Figures
5.6 a, b, 5.7a, b, 5.8a, b). There was a distinct separation of coastal/estuarine species, on
the left of the x-axis, from the freshwater species, to the right of the x-axis; there is a
strong Palearctic migrant association with the coastal/saline species, while the
freshwater species are primarily residents; some overlap does exist (Figures 5.6a, b).
The Palearctic migrants mainly consist of shorebirds while the waterfowl, waders,
kingfishers, cormorants and flamingos make up the bulk of the residents
(Figures 5.7a, b). The freshwater Palearctic migrants such as Ruff, and White-winged
Tern are grouped with the waterfowl and flamingos. Curlew Sandpiper and Little Stint
are intermediate in their position on the plot which indicated that they were not
confined to solely one habitat type. In winter the waterfowl show a tighter grouping as
do the cormorants and kingfishers; most of the waterfowl tend to congregate in winter
prior to breeding and are generally quite site specific in this regard (Figures 5.6a, b).
Interestingly five species, South African Shelduck, Black-necked Grebe, Maccoa Duck,
White-winged Tern and Ruff show a small grouping in the bottom right ‘quadrant’ of
the plot. There are relatively few sites supporting these species and suggests that they
are habitat specialists. These groupings mostly reflect the arrangement of sites during
summer and winter with the estuarine sites (e.g. Langebaan Lagoon, De Mond Estuary)
plotted on the extreme left and freshwater sites (Strandfontein WWTW, Rondevlei,
Wilderness and Swartvlei estuarine systems) on the extreme right (see Figures 5.1a, b).
In terms of feeding guilds, the plots showed less clustering in summer and
tighter grouping in winter (Figures 5.8a, b). Invertebrates were well spread throughout
the plot, and in summer were dominated by the Palearctic shorebirds. Herbivores, were
dominated by waterfowl and Lesser Flamingo, and showed a strong preference for the
freshwater or brackish sites located on the right side of the x-axis. In this group, South
African Shelduck and Lesser Flamingo showed a strong relationship both in summer
and winter (Figures 5.8a, b) and suggests they prefer similar, select habitats. The
piscivores showed some clustering particularly in summer; Cape Cormorant, Swift
Tern, Common Tern, and Sandwich Tern formed a small ‘coastal marine’ cluster, while
Reed Cormorant, White-breasted Cormorant, Grey Heron and Caspian Tern were
grouped in a brackish cluster (Figure 5.8a). African Darter was separated from the
Reed Cormorant and White-breasted Cormorant and showed a stronger association

197
with Malachite Kingfisher, although in winter the darter and the cormorants had a
stronger association (Figure 5.8b). This suggests that darters prefer more freshwater
habitats all year round while the cormorants tend to show a shift from brackish to more
freshwater sites during winter.
Waterbird ConservationValue (WCV) scores
Figures 5.9 and 5.10 show the variation of the WCV scores across all 30 sites for mean
abundance during summer and winter respectively. The arrangements of sites along
the x-axis in each figure from left to right is based on the first axes inertia of the CA so
that they reflect the similarities presented in CA above.
All the open estuaries or estuarine bay sites are on the extreme left and
primarily support the Palearctic shorebirds and other marine species, while the man-
made, freshwater sites occur on the extreme right and support predominantly a
freshwater avifauna (see Figures 5.1a, b and 5.2a, b). Sites situated between these two
extremes usually comprise a mixture of brackish and freshwater components and
therefore support a more mixed waterbird fauna. For example, Strandfontein WWTW
lies approximately halfway on the x-axis. This site lies adjacent to the False Bay
coastline and marine species such as Cape Cormorant, Kelp Gull and Swift Tern utilise
the site for roosting and or breeding often in large numbers. The freshwater settling
and oxidation ponds comprise by far the greatest open-water habitats and these support
the significant number of waterfowl and other freshwater species present at the site
(see below).
It is noticeable that the arrangements of sites on the x-axis varies slightly from
summer to winter, but more importantly the composition of species at each site changes
seasonally. Details of these changes and relevance are described and discussed in the
following sections.
Three sites dominated both in summer and winter, all with WCV scores greater
than 10: Strandfontein WWTW, Langebaan Lagoon and Berg River Estuary (Table 5.2).
In summer, Strandfontein WWTW had the highest conservation value score (19.75)
with Langebaan Lagoon (16.92) and Berg River Estuary (13.01) ranked second and
third respectively. De Hoop Vlei and Bot River Estuary follow in fourth and fifth place
with WCV scores of 7.27 and 6.72 respectively. Sites that rank sixth to 10th included, in
order, Verlorenvlei (6.00), Wilderness estuarine system (5.68), Rietvlei (5.41), Rocher
Pan (4.56) and Knysna Lagoon (3.99) (Table 5.2).
Strandfontein WWTW is dominated by seven species during summer, all of
which have, on average, 1% or more of their global populations present at the site –

198
Hartlaub’s Gull, Cape Shoveler, White-breasted Cormorant, Pied Avocet, Black-winged
Stilt, Greater Flamingo and Kelp Gull (Figure 5.2, Table 5.2). The works supported the
largest population of Hartlaub’s Gull in the Western Cape at this time; Crawford
(1997a) reported that the population had increased in the Cape Town metropole and
that almost half the population was located in this region. Species that dominated
Langebaan Lagoon included six shorebird species (Curlew Sandpiper, Grey Plover,
Sanderling, Ruddy Turnstone and White-fronted Plover) and Hartlaub’s Gull, while the
four species that occurred at the Berg River that comprised 1% or more of their global
populations included White-breasted Cormorant, Greater Flamingo, Hartlaub’s Gull
and Caspian Tern (Table 5.2).
During winter, Berg River estuary had the highest WCV score (15.16), with
Langebaan Lagoon (13.83) and Strandfontein WWTW (11.68) ranked second and third
respectively (Table 5.3). There is less variability in the WCV scores between the sites in
winter compared with summer. De Hoop Vlei remains as fourth ranked wetland during
winter with a score of 7.02, Wilderness estuarine system (6.44) moves up from seventh
in summer to fifth in winter, while Verlorenvlei (5.30) remained ranked at number six
for winter. The remaining four ranked sites in order were Swartvlei estuarine system
(4.57), Bot River Estuary (4.53), Rietvlei (4.36) and Wadrif Saltpan (4.13) (Table 5.3).
The Berg River had a larger CV score during winter for resident species than
during summer. This is due to the influx of three species which reach 1% levels during
winter (Black-necked Grebe, Lesser Flamingo and Black-winged Stilt) (Table 5.3).
Black-necked Grebes also reach 1% levels at Strandfontein WWTW in winter. Other
species that reached 1% levels in summer are below this level (e.g. Cape Shoveler,
Black-winged Stilt, Greater Flamingo and Hartlaub’s Gull) or are absent from the site
completely (e.g. Pied Avocet) in winter and this results in lower WCV scores during this
period (Table 5.3). This reduces its overall conservation importance. Langebaan Lagoon
in winter shows fairly large declines in the numbers of Greater Flamingo with
populations falling below the 1% level to 0.85, (from 1.46 in summer), while Hartlaub’s
Gull increases its 1% level from 1.65 in summer to 2.56 in winter. Coupled with the
absence of the majority of the 1% shorebird populations (Curlew Sandpiper, Grey
Plover and Sanderling) in winter, the lagoon’s WCV score decreases from
16.92 to13.83. Nevertheless it remains ranked as the second most important wetland
during winter.
Fourteen species had populations that reached or surpassed 1% of their global
populations during summer and winter at major wetlands in the Western Cape
(Tables 5.2 and 5.3). Of these only the Ruddy Turnstone is a Palearctic migrant;

199
populations of this species were concentrated at Langebaan Lagoon. The remaining
species showed a mixed composition and comprised three waterfowl species (Cape
Shoveler, Yellow-billed Duck and Great Crested Grebe), two species of cormorants
(White-breasted Cormorant and Cape Cormorant), two species of shorebirds (African
Black Oystercatcher and White-fronted Plover), two species of waders (Greater
Flamingo and Black-winged Stilt), two species of gulls (Hartlaub’s Gull and Kelp Gull)
and two species of terns (Caspian Tern and Swift Tern). The Cape Cormorant and
African Black Oystercatcher are both Red Data species (Barnes 2000). Cape Shoveler
dominated at four sites: Swartvlei estuarine system, Strandfontein WWTW, De Hoop
Vlei and Wilderness estuarine system, all located along the southern coast of the
Western Cape. Yellow-billed Duck seems to prefer De Hoop Vlei and Wilderness
estuarine system (Table 5.3). Regionally, Greater Flamingos are more abundant in
winter; in summer their overall WCV score was 5.37 while in winter it was 8.40; i.e. an
increase of three times the global 1% threshold level for this species and substantiates
the post-breeding dispersal of this species after summer from their breeding localities
in Botswana and Namibia (Williams and Velasquez 1997). Swift Tern dominated in
winter with Rocher Pan supporting the bulk of the winter population (WCV score =
1.66); no sites supported 1% or more of the species global population in summer,
although some sites (Keurbooms Estuary, Langebaan Lagoon and Strandfontein
WWTW) did meet 0.5% levels (Table 5.5). The Rocher Pan influx in winter possibly
represents post-breeding dispersal northward away from localities in the Western Cape
where it breeds in late-summer (Crawford 1997b).
Black-winged Stilts showed summer dominance at Strandfontein WWTW (WCV
score = 1.07) and the Berg River Estuary (0.94) (Table 5.2). In winter, their abundance
declined at Strandfontein WWTW to below a WCV score of 0.50% but increased at Bot
River Estuary to 1.65. Paarl WWTW showed a winter influx from a WCV score in
summer of 0.33 to 0.83 in winter (Table 5.3), the site having sub-regional significance
for this species. These results suggest that this species tends to prefer sewage
treatment works and is not partial to coastal versus inland sites. Langebaan Lagoon
supports by far the greatest White-fronted Plover population in the Western Cape. It is
the only site that supports more than 1% of its global population during summer and
winter (Tables 5.2 and 5.3). The only other site to support any reasonable populations
was Olifants River Mouth, particularly in winter when its WCV index was 0.29, the
highest of any other site (Table 5.3).
Five species – Pied Avocet, South African Shelduck, Egyptian Goose, Great
White Pelican and Grey Plover – had populations that, on average, reached 1% or 0.5%

200
levels only in summer (Table 5.2). Again, only a single Palearctic species, Grey Plover,
was listed amongst these and most of its Western Cape population is concentrated at
Langebaan Lagoon during this period (Table 5.2). The South African Shelduck and
Egyptian Goose congregate in early summer to moult (Maclean 1997a, b.) and their
large numbers at Radyn Dam and Voëlvlei Dam confirm their preference for large, deep
waterbodies to complete their annual moult. Voëlvlei Dam is an historical moulting site
for Egyptian Goose (Siegfried 1967) which continues to be favoured by the geese. Pied
Avocet is primarily nomadic moving around in response to rainfall and wetland
inundation (Tree 1997). Their summer peaks at selected sites, particularly
Strandfontein, Verlorenvlei, and Rietvlei highlights their occurrence at shallow,
permanent waterbodies during the dry summer period when temporary wetlands dry
out in the surrounding landscape. Numbers of Great White Pelican increased in
summer, especially along the west coast of the Western Cape. Verlorenvlei is the only
site that supports more than 0.5% of the global population during this period (Table
5.2) and is possibly due to sections of the lake drying up providing shallow water in
which fish become concentrated. Up to 650 pairs breed on Dassen Island (33°35’S
18°04’E) from October–January and they undertake the 250-km round trip to
Verlorenvlei daily during this period to feed chicks (de Ponte Machado 2010). The Great
White Pelican is the only Red Data species in this group (Barnes 2000)
The following species only reached threshold levels during winter at respective
sites: Black-necked Grebe, Red-knobbed Coot, Maccoa Duck, Lesser Flamingo, Little
Grebe and Southern Pochard (Table 5.3). These species’ winter dominance probably
indicates partial seasonal movement within the region after summer. Black-necked
Grebes are known to move to coastal localities once their summer rainfall inland
breeding localities have dried up in winter (Boshoff et al. 1991a, Dean and Underhill
1997). Globally important numbers occurred at Berg River Estuary and Strandfontein
WWTW (Table 5.3). The highest proportion of Red-knobbed Coots occurred at coastal
localities particularly Bot River Estuary, De Hoop Vlei and Swartvlei estuary system
(Table 5.3). These sites offer large open-water habitats with predominantly still water
and emergent and aquatic vegetation, characteristics which are preferred by Red-
knobbed Coots. It is possible that their large concentrations at the above three sites
relates to post-breeding flocking (Taylor 1997) from temporarily inundated sites during
the wet season, and historically these three sites have been selected for this annual
activity. Lesser Flamingo, a near-threatened species (Barnes 2000), may be more
mobile than Greater Flamingo and prefer selected localities which could explain their
higher winter numbers compared with Greater Flamingo. Movements of Maccoa Duck

201
are poorly understood but bird atlas models (Maclean 1997c) suggest that influxes occur
in the southwestern parts of the Western Cape during times when water-levels are at
their peak, confirming the high winter populations of the species in this study. Two
artificial wetlands, Strandfontein WWTW and Droëvlei, supported by far the largest
concentration and together they accounted for 1.13% of the global population (Table
5.3). Strandfontein WWTW holds, on average, the majority of Southern Pochard
(WCV score = 0.64). Coupled with the WCV scores from the other sites in the Western
Cape that supported the species (Tables 5.2 and 7.3), the overall WCV score totals 1.32
and placed the conservation value of Southern Pochard more in a regional context than
at site level. Maclean and Harrison (1997) describe a July–December peak of Southern
Pochard into the Western Cape and suggest possible movements between summer
rainfall and winter rainfall areas. This study confirms the seasonal occurrence of this
species in the Western Cape, particularly in the winter rainfall region.
Daily Energy Intake (DEI)
Figure 5.12 shows the Daily Energy Intake (DEI) across all 30 wetland sites for
summer and winter. A total of 17 sites show no or little variation in summer and winter
DEI values. More energy is extracted from nine sites in summer, while only four sites
show greater winter than summer DEI values (Langebaan Lagoon, Berg River Estuary,
Wilderness estuarine system and Bot River Estuary).
Most energy is extracted from Strandfontein WWTW, Wadrif Saltpan and De
Hoop Vlei in summer, while the top three sites in winter are Berg River Estuary,
Langebaan Lagoon and De Hoop Vlei (Figure 5.12, Table 5.1). It is interesting that De
Hoop Vlei has similar DEI values for summer and winter (Table 5.1). Decreases in
Egyptian Goose, Cape Shoveler and Southern Pochard and Greater Flamingo in winter
is compensated by increases in Little Grebe, Red-knobbed Coot, Lesser Flamingo and
Spur-winged Goose which results in energy consumption being equal during both
seasons. In contrast, Langebaan Lagoon’s waterbird biomass is doubled in winter
(Table 5.1). This is mainly due to a 6-fold increase of Greater Flamingos which then
increases the DEI of the waterbird community in the lagoon. The abundance of larger,
heavier birds, such as flamingos, has greater impact on the system than many smaller
bodied, lighter birds like Curlew Sandpipers and Little Stints which dominate the
lagoon during summer.
Wadrif Saltpan displays the greatest variation between summer and winter DEI;
the site goes from a summer DEI value of 12266 MJ/day to 2327 MJ/day in winter, a
decrease of 9 939 MJ/day (Figure 5.12, Table 5.1). Other sites showing large summer-

202
winter differences in energy consumption included Verlorenvlei (a decrease of 4986
MJ/day in winter), Voëlvlei Dam (4889 MJ/day), Theewaterskloof Dam (4427 MJ/day)
and Strandfontein WWTW (4175 MJ/day) (Table 5.3).
What role does DEI play in terms of waterbird ecology? Williams (2003) described
how the energy flow through a waterbird community aids in nutrient mixing and
recycling which effectively determines the health of a wetland system to support a suite
of waterbirds. He goes on to state, that, for example, a large flock of Flamingos feeding
and defecating in a wetland are able to constantly mix nutrients in the water which
stimulates plant and macro-invertebrate productivity. Large flocks of waterbirds moving
around in the landscape and utilising different wetlands therefore aid in keeping
nutrients in wetland systems well mixed which in turn provide good feeding and
breeding opportunities. Sites that lose a large proportion of their waterbird communities
from one season to the next are probably more subject to water quality issues than sites
where there is a constant arrival of waterbirds, particularly from different feeding
guilds. The Red-knobbed Coot at the Bot River Estuary are estimated to remove and
recycle as much as 10% of the submerged macrophytes annually through feeding and
nest-building (Stewart and Bally 1985), a function that would not be cost-effective if
removal of Potamogeton and Ruppia beds had to done mechanically.
Consequently, sites such as Voëlvlei Dam which supports large numbers of
Egyptian Goose during summer results in very high DEI values but overall the site has
little conservation value. Similarly sites like Droëvlei Dam and Theewaterskloof Dam
where large concentrations of certain species (notably ducks and geese which gather to
moult after breeding) also have skewed seasonal DEI values (Table 5.3). Thus, some
sites become important in supplying vital nutrients at a certain time of year or provide
suitable habitat requirements in a species’ annual cycle but they have little conservation
value from an abundance perspective. Are these sites less significant or important than
those sites which support conservation worthy species? I would argue not, emphasizing
that all sites play some or other role in a regional context, whether they function as stop-
over sites, breeding sites or year-round refuges for waterbirds.
Regional importance of wetlands for waterbirds in the Western Cape
The above results show, in terms of WCV scores, Strandfontein WWTW, Langebaan
lagoon and the Berg River estuary are the most important sites in the Western Cape;
seasonally Strandfontein WWTW is the most important site in summer and the Berg
River estuary in winter (Figure 5.11). In context, these three sites contribute 49.7 % to
the conservation value of all sites in the Western Cape to waterbirds. This highlights

203
not only the regional importance of the Western Cape for waterbirds but also the global
significance of the region in meeting global population thresholds.
With large numbers of Palearctic shorebirds present during summer and
Langebaan Lagoon and Berg River Estuary are well-known shorebird localities
(Underhill 1987, Velásquez et al.1991). However, resident species are the main
contributors to Strandfontein WWTW’s high conservation value, and not Palearctic
species. The main species driving this are, in descending order of mean abundance,
Cape Cormorant, Kelp Gull, Hartlaub's Gull and Greater Flamingo. However based on
the 1% thresholds, and translated in the WCV score, Hartlaub’s Gull (3.7%), Pied
Avocet (3.4%), Cape Shoveler (2.23%), Kelp Gull (1.65%) and Greater Flamingo (1.5%)
are considered of greater conservation importance (Table 7.2).
Strandfontein WWTW is also well known breeding locality for many resident
waterbirds (Ashkenazi 2001) which most likely contributed to the high DEI value
(13 376 MJ/day) during summer. Thus waterbirds have a large impact on the food
resources available at the works. The reason for this is that Strandfontein supported
larger numbers of heavier species (waterfowl, cormorants and gulls, all of which breed
at the works) compared with the smaller bodied shorebirds which dominated at
Langebaan Lagoon; so although Langebaan Lagoon supported double the numbers of
birds, on average, in summer, in terms of biomass the birds had less impact on the
wetland. The Berg River estuary is primarily used as a feeding site by both resident
and Palearctic shorebirds during summer and most likely explains its lower DEI value
compared with Langebaan Lagoon and Strandfontein WWTW.
Based on this and the fact that species richness is at its maximum in summer, I
propose that Strandfontein WWTW be considered as the most important waterbird site
in the Western Cape. The interesting aspect of this is that the works is only c. 400 ha in
size, and is located within the Cape Town metropole (Figure 1.5, Chapter 1). This is
highlighted when compared with the larger natural systems of Langebaan Lagoon
(c. 4500 ha) and Berg River Estuary (c. 7300 ha) (Figure 5.11). This places
responsibility on the provincial and local authorities to ensure its long-term survival as
an important waterbird locality in the Western Cape. It is certainly eligible for Ramsar
status with the site supporting 1% of the global population of seven waterbird species.
Currently the site is unprotected but the local authority (City of Cape Town) is
proposing official local protection for the site through a revision of its protected area
status policy within the Cape Town metropole (C. Dorse pers. comm.). Once the site is
afforded formal conservation status, application to Ramsar can be undertaken.
Although Ramsar status does not afford any legal protection of the site, it will elevate

204
the site to being of global importance and not just at local or regional levels. Globally,
waste-water treatment works are well known waterbird sites and usually offer a mosaic
of favourable habitats to waterbirds (Fuller and Glue 1980). Eutrophic conditions year-
round also provide a fairly constant food supply aiding utilisation by waterbirds as
prime foraging and breeding localities (Kalejta-Summers et al. 2000, Ashkenazi 2001,
Appendix A).
It is also interesting that it is not always species that dominate numerically at a
site that have high 1% levels. Reed Cormorant and Egyptian Goose are, for example,
species that occur in large numbers at numerous sites but rarely reach 1% levels. What
this means is that these species make small contributions to the WCV score at a site
even though in a South African context they occur relatively abundantly. Global
thresholds are set based on population estimates for subspecies or bio-geographical
populations which are subject to change every four years when population estimates
are revised (Wetlands International 2006). Thus, species that have a small WCV scores
in a particular year may, due to taxonomic or bio-geographic revisions of the global
population, contribute more to a WCV score further down the line. WCV scores could
therefore change on a four-yearly cycle. This would have implication for wetland site
managers and conservation authorities who manage the sites. Other species which
show similar patterns are Curlew Sandpiper.
In contrast, Pied Avocet, Cape Shoveler and Caspian Tern are examples of
species that make greater contributions from the 1% perspective rather than having
large populations. In these cases global populations are relatively small due to
restricted ranges and/or intrinsic population limiting factors (Baker 2006). Thus,
numbers of these species at a site, although they do not seem excessively high,
regularly reach global thresholds due to the threshold level being set relatively low as a
result of global populations being small. These species therefore are of conservation
importance at site level.
It is clear from this study that threshold levels and the WCV score and not solely
numerical abundance label a site as being of conservation value. Historically, the latter
together with rare or threatened waterbirds were considered as the primary motivating
factor for identifying sites of conservation importance (Sjizz 1972). However, with the
introduction of the 1% species threshold levels in 1972 more emphasis was placed on
the contribution a local population was making to the overall population to determine
its conservation value (Sjizz 1972). It should be borne in mind that the conservation
value of a site may change seasonally in response to changing conditions and waterbird
annual cycles and movement patterns. This highlights the need for regular seasonal

205
long-term monitoring of waterbirds at wetlands in order to identify temporal changes in
abundance and associated 1% threshold levels. This would aid conservation managers
in determining appropriate management action at the site.
The application of the 1% criterion has enabled over 1900 wetlands globally to be
designated as wetlands of international importance (Ramsar 2010). In Europe, and
much of the northern hemisphere, wetlands are more permanent and waterbirds more
constant and predictable in number, compared with southern Africa. For the latter,
wetlands are largely ephemeral in nature and waterbird numbers can fluctuate widely
between seasons. Hence, the 0.5% criterion was introduced to designate IBAs at a sub-
regional level (Barnes 1998, Chapter 3) and assign some importance to sites. Since
many sub-Saharan waterbird species populations remain unknown or constitute large
region-wide estimates, sites that support important numbers of species at a regional
(provincial) level will never reach these thresholds and will never be recognised as
important at a global scale. They do, however, have significance at provincial and/or
national level and it is my opinion that they should be recognised as making important
contributions. The conservation value of a site, through application of the Waterbird
Conservation Value score as used in this thesis, provides a tool for rapidly assessing the
overall importance of species based on numerical abundance. This tool can easily be
applied and extended and applied to long-term waterbird datasets in South Africa to
assess sites on national basis. The development of a national ‘1%’ or equivalent
threshold should also be considered in order to assess national importance of sites, and
not just at a sub-regional or global level.

206
References
Ashkenazi S 2001. Long-term trends in the breeding populations of waterbirds (1951–1985) at a sewage treatment plant. Ostrich 72: 10–19.
Baker AJ 2006. Population declines and the risk of extinction in waders: genetic and ecological consequences of small population. In: Boere GC, Galbraith CA and Stroud DA (eds). Waterbirds around the world. The Stationery Office, Edinburgh, UK pp. 668–671.
Barnes KN (ed.) 1998. Important Bird Areas of Southern Africa. BirdLife South Africa, Johannesburg.
Barnes KN (ed.) 2000. The Eskom Red Data Book of Birds of South Africa, Lesotho and Swaziland.
Bohninggaese K, Taper ML and Brown JH 1994. Avian community dynamics are discordant in space and time. Oikos 70: 121–126.
Boshoff AF, Palmer NG and Piper SE 1991a. Spatial and temporal abundance patterns of waterbirds in the southern Cape Province. Part 1: Diving and surface predators. Ostrich 62: 159–177.
Boshoff AF, Palmer NG and Piper SE 1991b. Spatial and temporal abundance patterns of waterbirds in the southern Cape Province. Part 2: Waterfowl. Ostrich 62: 178–196.
Boshoff AF, Palmer NG and Piper SE. 1991c. Spatial and temporal abundance patterns of waterbirds in the southern Cape Province. Part 3: Wading birds. Ostrich 62: 197–214.
Boshoff AF and Piper SE 1993. An ordination study of the waterbird community of a coastal wetland, southern Cape Province. South African Journal of Wildlife Research 23: 17–25.
Briggs SV and Lawler WG 1991. Management of Murray-Darling wetlands for waterbirds. In: Conservation in management of the River Murray System – making conservation count. Proceedings of the third fenner conference on environment, Canberra, South Australian Department of Environment and Planning and Australian Academy of Science.
Collins SL and Glen SM 1991. Importance of spatial and temporal dynamics in species regional abundance and distribution. Ecology 72: 654–664.
Crawford RJM 1997a. Hartlaub’s Gull Larus hartlaubii. In: Harrison JA, Allan DG, Underhill LG, Herremans M, Tree AJ, Parker V and Brown CJ (eds) The Atlas of Southern African Birds, vol. 1: Non-passerines. pp 466–467. BirdLife South Africa, Johannesburg.
Crawford RJM 1997b. Swift Tern Sterna bergii. In: Harrison JA, Allan DG, Underhill LG, Herremans M, Tree AJ, Parker V and Brown CJ (eds) The Atlas of Southern African Birds, vol. 1: Non-passerines. pp 470–471. BirdLife South Africa, Johannesburg.
Dean WRJ and Underhill LG 1997. Blacknecked Grebe Podiceps nigricollis. In: Harrison JA, Allan DG, Underhill LG, Herremans M, Tree AJ, Parker V and Brown CJ (eds) The Atlas of Southern African Birds, vol. 1: Non-passerines. pp 10–11. BirdLife South Africa, Johannesburg.
De Ponte Machado M 2010. Population dynamics of Great White Pelicans in southern Africa: causative factors and influence on other seabirds. Unpublished PhD thesis, University of Cape Town.
Fuller RJ and Glue DE 1980. Sewage works as bird habitats in Britain. Biological Conservation 17: 165–181.
Flather CH and Sauer JR 1996. Using landscape ecology to test hypotheses about large-scale abundance patterns in migratory birds. Ecology 77: 28–35.

207
Greenacre MJ 1984. Theory and application of correspondence analysis. Academic Press, London.
Hockey PAR, Dean WRJ and Ryan PG (eds) 2005. Roberts birds of southern Africa – 7th ediition. The Trustees of the John Voelcker Bird Book Fund, Cape Town.
Kalejta-Summers B, McCarthy M and Underhill LG 2001. Long-term trends, seasonal abundance and energy consumption of waterbirds at Strandfontein, Western Cape, South Africa, 1953–1993. Ostrich 72: 80–95.
Maclean GL 1997a. South African Shelduck. Tadorna cana In: Harrison JA, Allan DG, Underhill LG, Herremans M, Tree AJ, Parker V and Brown CJ (eds) The Atlas of Southern African Birds, vol. 1: Non-passerines. pp 124–125. BirdLife South Africa, Johannesburg.
Maclean GL 1997b. Egyptian Goose Alopochen aegyptiacus In: Harrison JA, Allan DG, Underhill LG, Herremans M, Tree AJ, Parker V and Brown CJ (eds) The Atlas of Southern African Birds, vol. 1: Non-passerines. pp 122–123. BirdLife South Africa, Johannesburg.
Maclean GL 1997c. Maccoa Duck Oxyura maccoa In: Harrison JA, Allan DG, Underhill LG, Herremans M, Tree AJ, Parker V and Brown CJ (eds) The Atlas of Southern African Birds, vol. 1: Non-passerines. pp 148–149. BirdLife South Africa, Johannesburg.
Maclean GL and Harrison JA 1997. Southern Pochard Netta erythrophthama In: Harrison JA, Allan DG, Underhill LG, Herremans M, Tree AJ, Parker V and Brown CJ (eds) The Atlas of Southern African Birds, vol. 1: Non-passerines. pp 138–139. BirdLife South Africa, Johannesburg.
Nagy KA 1987. Field metabolic rate and food requirement scaling in mammals and birds. Ecological Monographs 57: 111–128.
R Development Core Team 2012. R: A language and environment for statistical computing. R Foundation for Statistical Computing, Vienna, Austria. ISBN 3-900051-07-0, URL http://www.R-project.org/.
Ramsar 2010. http://www.ramsar.org. Accessed 15 December 2010.
Robertson HG 1981. Annual summer and winter fluctuations of Palearctic and resident waders (Charadrii) at Langebaan Lagoon, South Africa, 1975–1979. In: Cooper J. (ed.) Proceedings of the symposium on birds of the sea and shore, 1979, Cape Town: African Seabird Group: 335–345.
Roshier DA, Robertson AI, Kingsford RT and Green DG 2001. Continental-scale interactions with temporary resources may explain the paradox of large populations of desert waterbirds in Australia. Landscape Ecology 16: 547–556.
Siegfried WR 1967. Trapping and ringing of Egyptian Geese and African Shelduck at Vogelvlei, Cape. Ostrich 38: 173–185.
Sjizz J 1972. Some suggested criteria for determining the international importance of wetlands in the Western Palearctic. In: Carp E. (ed.) Proceedings of the international conference on conservation of wetlands and waterfowl, Ramsar, Iran. IWRB, Slimbridge, UK. pp. 101–119.
Stewart BA and Bally R 1985. The ecological role of the Red-knobbed Coot Fulica cristata Gmelin at the Bot River Estuary, South Africa. Transactions of the Royal Society of South Africa 45: 419‒426.
Taylor PB 1997. Red-knobbed Coot Fulica cristata. In: Harrison JA, Allan DG, Underhill LG, Herremans M, Tree AJ, Parker V and Brown CJ (eds) The Atlas of Southern African Birds, vol. 1: Non-passerines. pp 342–343. BirdLife South Africa, Johannesburg.

208
Tree AJ 1997. Avocet Recurvirostra avosetta. In: Harrison JA, Allan DG, Underhill LG, Herremans M, Tree AJ, Parker V and Brown CJ (eds) The Atlas of Southern African Birds, vol. 1: Non-passerines. pp 434–435. BirdLife South Africa, Johannesburg.
Underhill LG 1987. Waders (Charadrii) and other waterbirds at Langebaan Lagoon, South Africa, 1975–1986. Ostrich 58: 145–155.
Underhill LG and Peisach M 1985. Correspondence analysis and its application in multielemental trace analysis. Journal of Trace and Microprobe Techniques 3: 41–65.
Velasquez C, Kaletja B and Hockey PAR 1991. Seasonal abundance, habitat selection, and energy consumption of waterbirds at the Berg River Estuary. Ostrich 62: 109–123.
Wetlands International 2006. Waterbird Population Estimates – Fourth Edition. Wetlands International Global Series No. 12, Wageningen, The Netherlands.
Whitfield AK 2000. Available scientific information on individual South African estuarine systems. Report to the Water Research Commission. WRC Report No. 577/3/00. 217 pp.
Whitfield AK, Allanson BR and Heinecken TJE. 1983. Swartvlei (CMS11). In: Heydorn AEF and Grindley JR (eds). Estuaries of the Cape. Part II. Synopses of available information on individual systems. Report No. 22. CSIR Research Report 421: 1–62.
Williams AJ 2003 Crop, crap and stir: the impact of waterbirds on wetlands. Bird Numbers 12(1): 6–8.
Williams AJ and Velasquez C 1997. Greater Flamingo Phoenicopterus ruber. In: Harrison JA, Allan DG, Underhill LG, Herremans M, Tree AJ, Parker V and Brown CJ (eds) The Atlas of Southern African Birds, vol. 1: Non-passerines. pp 112–113. BirdLife South Africa, Johannesburg.

Table 5.1 Summary of summer and winter abundance, biomass, Field Metabolic Rate (FMR), Daily Energy Intake (DEI) and Waterbird Conservation Value (WCV) score at 30 wetlands in the Western Cape. Sites ranked based on WCV score for summer and winter.
Rank Site code
Summer
Rank Site code
Winter
Mean no. birds
Mean biomass
(kg)
FMR (MJ/day)
DEI (MJ/day)
No. spp at 1% level
WCV score
Mean no.
birds
Mean biomass
(kg)
FMR (MJ/day)
DEI (MJ/day)
No. spp at 1% level
WCV score
1 st 12806 12641 10147 13736 7 19.75 1 bg 9652 12048 9188 13217 5 15.16
2 lb 27524 5974 7221 9174 6 16.92 2 lb 11315 14484 9948 12840 4 13.83
3 bg 10298 8794 6656 8903 4 13.01 3 st 7643 9032 7122 9561 4 11.68
4 DH 5710 7940 7006 11600 1 7.27 4 DH 5203 7583 6866 11508 1 7.02
5 BT 4558 4952 3887 5829 2 6.72 5 wt 6514 4777 4696 7755 1 6.44
6 ve 3828 6561 4768 8152 1 6.00 6 ve 1916 3305 2191 3166 1 5.30
7 wt 5946 4709 4517 7493 2 5.68 7 ws 8101 6000 5937 10076 0 4.57
8 rv 4419 4348 3300 5247 1 5.41 8 BT 5265 4693 4166 6690 0 4.53
9 RP 3197 3151 2442 3512 1 4.56 9 rv 2407 2716 2085 3100 0 4.36
10 kn 4550 1845 1939 2658 0 3.99 10 wa 2548 2235 1741 2327 1 4.13
11 ws 2124 1827 1477 2055 1 3.92 11 kn 2670 2183 2010 2640 1 3.61
12 wa 5070 9933 7024 12266 0 3.23 12 PA 1650 1299 1123 1673 0 3.22
13 vv 3756 5881 3972 6169 1 2.92 13 RP 1534 1761 1368 1980 0 3.07
14 kl 2401 1781 1701 2757 0 2.63 14 kb 936 700 662 844 0 2.41
15 PA 2821 2148 1798 2785 0 2.59 15 ol 1020 828 703 968 0 2.14
16 rd 2430 3182 2342 3697 1 2.47 16 wv 1421 950 929 1445 0 1.93
17 kb 1163 724 709 916 0 1.95 17 kl 2018 1497 1483 2513 0 1.78 18 th 5581 3996 4027 6812 0 1.85 18 jk 832 987 788 1088 0 1.27
19 ol 1267 746 539 686 0 1.80 19 zv 1010 955 833 1350 0 1.15
20 jk 1340 746 738 1036 0 1.67 20 th 1355 1924 1472 2385 0 1.05
21 DV 1935 1267 1120 1775 0 1.53 21 DV 791 705 607 983 0 1.00
22 zv 1287 1225 1076 1818 0 1.42 22 dm 229 282 191 248 0 0.94
23 wv 858 535 544 847 0 1.18 23 dp 410 311 284 388 0 0.77
24 br 901 665 596 821 0 1.10 24 br 486 576 461 664 0 0.75
25 dm 1038 232 295 373 0 1.09 25 rd 364 382 312 493 0 0.66
26 rn 726 1009 724 955 0 0.95 26 mc 381 239 245 367 0 0.58
27 dp 455 229 232 305 0 0.82 27 rn 406 503 399 528 0 0.42
28 mc 565 257 276 413 0 0.73 28 gb 145 133 116 151 0 0.38
29 gb 312 186 191 247 0 0.65 29 bw 392 323 294 416 0 0.34
30 bw 593 355 337 462 0 0.41 30 vv 571 1025 736 1280 0 0.29
209

Table 5.2 Summer Waterbird Conservation Value (WCV) scores and species making major contributions to the score for 30 wetland sites in the Western Cape. Values based on mean abundance. Values in bold represent species that reached 1% threshold levels and those in italics 0.5% threshold levels. Species whose WCV score was zero is represented with a dash (–).
Species
Rank Site Cap
e S
hov
eler
Yel
low
-bil
led
Du
ck
Sou
th A
fric
an S
held
uck
Egy
ptia
n G
oose
Gre
at C
rest
ed G
rebe
Wh
ite-
bres
ated
C
orm
oran
t
Cap
e C
orm
oran
t
Gre
at W
hit
e P
elic
an
Bla
ck-w
inge
d S
tilt
Pie
d A
voce
t
Gre
ater
Fla
min
go
Afr
ican
Bla
ck
Oys
terc
atch
er
Wh
ite
Fro
nted
Plo
ver
Red
-bil
led
Tea
l
Gre
y P
love
r
San
derl
ing
Cu
rlew
San
dpip
er
Kel
p G
ull
Har
tlau
b's
Gu
ll
Sw
ift
tern
Cas
pian
Ter
n
Oth
er
WCV score
1 Strandfontein WWTW 2.23 0.20 0.03 0.10 0.10 1.55 0.99 0.27 1.07 3.44 1.46 0.19 – – – – 0.02 1.65 3.60 0.57 0.26 2.01 19.75 2 Langebaan Lagoon – 0.07 0.04 0.01 – 0.14 0.10 0.19 0.14 0.24 0.73 0.40 1.21 1.68 1.34 1.09 5.06 0.39 1.65 0.58 0.69 1.17 16.92 3 Berg River Estuary 0.09 0.25 0.27 – 0.09 1.59 0.45 0.39 0.94 0.37 1.16 0.03 0.04 – 0.05 0.01 0.86 0.43 1.39 0.36 2.43 1.82 13.01 4 De Hoop Vlei 2.11 0.65 0.14 0.22 0.59 0.48 – 0.11 0.36 0.12 0.28 – 0.02 – – 0.01 0.10 0.02 – 0.01 0.35 1.70 7.27 5 Bot River Estuary 0.31 0.30 – 0.05 1.21 0.49 – 0.17 0.21 0.01 0.60 0.01 0.08 – – – 0.01 0.27 0.70 0.31 1.24 0.75 6.72 6 Verlorenvlei 0.17 0.09 0.52 0.32 0.45 0.75 – 0.92 0.21 1.10 0.01 – – – – – 0.06 0.08 0.29 – 0.61 0.42 6.00 7 Wilderness Estuarine system 1.59 0.77 – 0.08 1.45 0.38 – – 0.16 0.02 0.01 – – – – – – 0.03 – – 0.09 1.08 5.68 8 Rietvlei 0.35 0.12 0.01 0.32 0.04 0.44 – 0.28 0.26 0.92 0.05 0.17 – – – 0.03 0.09 0.07 1.49 0.01 0.25 0.51 5.41 9 Rocher Pan 0.85 0.05 0.06 0.01 0.01 1.18 – 0.02 0.49 0.20 0.52 0.08 0.01 – – – 0.13 0.10 0.15 0.02 0.04 0.63 4.56
10 Knysna Lagoon 0.27 0.14 – 0.06 – 0.14 0.02 – 0.27 0.12 – 0.96 0.01 – 0.14 – 0.60 0.50 – 0.24 0.13 0.39 3.99 11 Swartvlei Estuarine system 1.56 0.26 – 0.01 0.51 0.20 – – 0.12 0.02 – 0.03 0.01 – – – 0.02 0.04 – – 0.50 0.65 3.92 12 Wadrif Saltpan 0.32 0.08 0.50 0.02 0.01 0.01 – 0.01 0.33 0.52 0.32 – 0.10 – – 0.01 0.08 – 0.03 0.04 0.01 0.85 3.23 13 Voëlvlei Dam – – 0.94 1.26 0.01 0.06 – – – – – – – – – – – – 0.02 – 0.45 0.16 2.92 14 Kleinriviersvlei 0.24 0.10 – 0.01 0.04 0.27 – – 0.07 – 0.08 0.59 0.09 – – – 0.01 0.08 0.33 0.08 0.40 0.25 2.63 15 Paarl WWTW 0.17 0.03 – 0.13 0.02 0.23 – 0.03 0.33 0.05 0.04 – – – – – – – 0.83 – – 0.73 2.59 16 Radyn Dam 0.07 0.07 1.16 0.21 0.06 0.08 – 0.10 0.05 0.07 0.01 – – – – – 0.01 – – – – 0.59 2.47 17 Keurbooms River Estuary – – – 0.01 – 0.12 0.01 – – – – 0.29 0.09 – 0.05 – 0.04 0.49 – 0.71 0.02 0.12 1.95 18 Theewaterskloof Dam 0.03 0.15 – 0.75 0.01 0.45 – – – – – – – – – – – 0.03 0.02 – 0.01 0.41 1.85 19 Olifants River Mouth – – 0.02 – – 0.20 – 0.23 0.01 0.20 0.01 0.05 0.18 – 0.02 0.03 0.16 0.04 0.12 0.30 0.10 0.14 1.80 20 Jakkalsvlei 0.25 0.01 0.03 0.01 0.01 0.03 – – 0.09 – 0.05 0.01 – – – – – 0.25 0.27 0.33 0.02 0.30 1.67 21 Droëvlei Dam 0.21 0.10 0.02 0.08 0.06 0.02 – 0.03 0.08 0.14 0.03 – – – – – 0.03 – – – – 0.73 1.53 22 Zandvlei Estuary 0.02 0.01 – 0.07 0.28 0.05 – 0.01 0.05 0.13 – – – – – – – 0.02 0.26 – 0.38 0.15 1.42 23 Wildevoëlvlei 0.14 0.07 – 0.01 0.03 0.07 – – 0.11 0.13 – – – – – – – – 0.26 – 0.01 0.35 1.18 24 Breede River Estuary – 0.04 0.15 0.02 – 0.10 – – 0.01 0.03 – 0.08 0.06 – 0.02 – 0.01 0.29 – 0.04 0.06 0.17 1.10 25 De Mond Estuary – – – – – 0.21 – – – – – 0.09 0.15 – 0.01 0.03 0.04 0.04 – 0.04 0.29 0.19 1.09 26 Rondevlei 0.04 0.03 0.01 0.01 0.08 0.11 – 0.17 0.01 – – – – – – – – – 0.08 – 0.18 0.23 0.95 27 Diep River Estuary 0.01 0.01 – – – 0.13 – – 0.01 – – 0.01 – – – – 0.01 0.07 0.34 0.08 0.08 0.07 0.82 28 Macasser WWTW 0.05 0.05 – 0.01 – 0.01 – – 0.10 – – 0.01 – – – – – – 0.43 0.02 0.01 0.05 0.73 29 Great Brak River Estuary 0.01 0.02 – – – 0.04 – – 0.01 – – 0.15 – – – – – 0.04 – 0.31 0.04 0.03 0.65 30 Beaufort West WWTW 0.06 0.01 0.04 – – 0.01 – – 0.07 0.03 – – – – – – – – – – – 0.19 0.42
Total 1.15 3.68 3.94 3.78 5.06 9.54 1.57 2.93 5.56 7.86 5.36 3.15 2.05 1.68 1.63 1.21 7.34 4.93 12.26 4.05 8.65 16.84

Table 5.3 Winter Waterbird Conservation Value (WCV) scores and species making major contributions to the score for 30 wetland sites in the Western Cape. Values based on mean abundance. Values in bold represent species that reached 1% threshold levels and those in italics 0.5% threshold levels. Species whose CV score was zero is represented with a dash (–).
Rank Site
Species
Cap
e S
hov
eler
Yel
low
-bil
led
Du
ck
Sou
ther
n P
och
ard
Mac
coa
Du
ck
Bla
ck-n
ecke
d G
rebe
Gre
at C
rest
ed G
rebe
Lit
tle
Gre
be
Wh
ite-
brea
sted
Cor
mor
ant
Cap
e C
orm
oran
t
Red
-kn
obbe
d C
oot
Bla
ck-w
inge
d S
tilt
Gre
ater
Fla
min
go
Les
ser
Fla
min
go
Afr
ican
Bla
ck
Oys
terc
atch
er
Wh
ite-
fron
ted
Plo
ver
Ru
ddy
Tu
rnst
one
Har
tlau
b's
Gu
ll
Kel
p G
ull
Sw
ift
Ter
n
Cas
pian
Ter
n
Oth
er
WCV score
1 Berg River Estuary 0.28 0.13 0.02 0.13 2.64 0.03 0.03 0.70 0.66 0.25 1.65 1.53 1.52 0.07 0.14 – 1.45 0.71 0.61 0.94 1.68 15.16 2 Langebaan Lagoon 0.02 0.03 – – – – – 0.25 0.04 – 0.42 4.19 0.54 0.72 1.04 0.51 2.56 0.52 0.07 1.27 1.65 13.83 3 Strandfontein WWTW 0.74 0.06 0.64 0.81 2.02 0.02 0.48 1.02 1.06 0.08 0.49 0.85 – 0.19 – – 0.90 1.33 0.05 0.02 0.90 11.68 4 De Hoop Vlei 1.49 0.53 0.15 0.50 0.44 0.51 0.16 0.71 – 0.76 0.31 0.18 0.19 – 0.04 – – 0.04 – 0.47 0.54 7.02 5 Wilderness Estuary 0.43 0.44 0.29 0.91 0.34 1.55 0.60 0.82 0.04 0.52 0.05 – – – – – – 0.03 – 0.03 0.39 6.44 6 Verlorenvlei 0.12 0.06 0.01 0.01 – 0.57 0.04 2.09 – 0.05 0.19 0.07 0.02 0.01 – – 0.07 0.05 0.01 0.93 1.01 5.30 7 Swartvlei Estuarine system 0.88 0.29 0.01 – – 0.50 0.41 0.59 0.01 0.83 0.28 0.07 – 0.03 – – – 0.05 – 0.33 0.28 4.57 8 Bot River Estuary 0.34 0.30 0.04 0.01 0.14 0.70 0.12 – 0.02 0.40 0.09 0.25 – – 0.12 – 0.44 0.26 0.23 0.53 0.53 4.53 9 Rietvlei 0.52 0.20 0.01 – – 0.13 0.02 0.58 – 0.07 0.47 0.08 0.01 0.15 – – 1.00 0.22 0.01 0.20 0.69 4.36
10 Wadrif Saltpan 0.09 – – 0.01 0.26 – 0.01 0.01 – – 0.19 0.57 0.24 0.07 0.07 – 0.54 0.01 1.66 0.01 0.39 4.13 11 Knysna Lagoon 0.16 0.11 – – – – 0.01 0.36 0.14 – 0.42 – – 1.02 0.04 – – 0.65 0.03 0.13 0.55 3.61 12 Paarl WWTW 0.12 0.03 0.02 0.13 0.13 0.01 0.16 0.38 – 0.01 0.83 0.02 0.05 – – – 0.99 – – – 0.32 3.22 13 Rocher Pan 0.45 0.03 – 0.05 0.40 0.02 0.02 0.48 – 0.06 0.25 0.31 0.02 0.19 0.01 – 0.27 0.07 0.15 0.16 0.12 3.07 14 Keurbooms River Estuary – – – – 0.04 – 0.05 0.21 0.01 – 0.02 – – 0.29 0.13 – – 0.43 0.99 0.11 0.12 2.41 15 Olifants River Mouth 0.02 0.01 – – – – – 0.20 – 0.01 0.06 0.07 0.10 0.08 0.29 – 0.28 0.22 0.41 0.13 0.26 2.14 16 Wildevoëlvlei 0.20 0.06 0.03 0.12 0.07 0.04 0.23 0.29 – 0.07 0.13 – – – – – 0.42 – – 0.09 0.19 1.93 17 Kleinriviersvlei 0.15 0.08 – – – 0.01 – 0.22 – 0.21 0.04 – – 0.50 0.06 – 0.14 0.05 0.10 0.15 0.07 1.78 18 Jakkalsvlei 0.06 0.01 – 0.02 0.12 – 0.01 0.02 – 0.02 0.06 0.14 0.07 0.03 – – 0.10 0.51 0.05 – 0.04 1.27 19 Zandvlei Estuary 0.03 0.01 – – – 0.26 0.03 0.18 0.01 0.06 0.06 – – – – – 0.18 0.02 – 0.08 0.22 1.15 20 Theewaterskloof Dam 0.01 0.23 0.03 – – 0.02 0.01 0.26 – 0.01 – – – – – – – 0.03 – – 0.44 1.05 21 Droëvlei Dam 0.15 0.06 0.01 0.32 0.07 0.02 0.04 0.02 – 0.03 0.05 0.04 0.08 – – – – – – – 0.11 1.00 22 De Mond Estuary 0.01 – – – – – – 0.23 0.01 – – – – 0.07 0.17 – – 0.04 0.03 0.25 0.13 0.94 23 Diep River Estuary 0.04 0.02 – – – – – 0.12 – – 0.03 – – 0.01 – – 0.25 0.14 – 0.05 0.09 0.77 24 Breede River Estuary 0.02 0.07 – – – – – 0.21 0.03 – 0.01 – – 0.06 0.05 – – 0.09 0.07 0.05 0.11 0.75 25 Radyn Dam 0.05 0.02 – 0.27 0.09 0.01 0.02 0.03 – 0.01 0.03 0.01 – – – – – – – – 0.10 0.66 26 Macasser WWTW 0.04 0.06 0.04 – – – 0.01 – – 0.01 0.12 – – – – – 0.22 0.04 – – 0.05 0.58 27 Rondevlei 0.03 0.02 0.01 – – 0.03 0.01 0.08 – – – 0.01 – – – – 0.03 0.01 – 0.05 0.14 0.42 28 Great Brak River Estuary 0.01 0.01 – – – 0.01 0.01 0.10 – – 0.04 – – 0.04 0.01 – – 0.04 0.09 – 0.02 0.38 29 Beaufort West WWTW 0.05 0.04 0.01 0.02 0.02 – 0.02 – – 0.01 0.04 – – – – – – – – – 0.14 0.34 30 Voëlvlei Dam – – – – – – – 0.04 – 0.01 0.01 – – – – – – 0.01 – 0.05 0.18 0.29
Total 6.51 2.91 1.32 3.31 6.78 4.44 2.50 10.18 2.03 3.48 6.34 8.39 2.84 3.53 2.17 0.51 9.84 5.57 4.56 6.03 11.46

Figure 5.1 Plots of 30 wetland sites in the Western Cape during (a) summer and (b) winter based on correspondence analysis and categorised according to wetland type. The plots represent the first principal plane of the correspondence analysis. For (a) the horizontal axis represents the first principal dimension and accounts for 27.1% of the inertia, and the vertical axis represents the second principal dimension and accounts for 19.2% of the inertia. For (b) the horizontal axis accounts for 26.2% of the inertia, and the vertical axis accounts for 17.0% of the inertia. Legend codes: clk = coastal lake, eby = estuarine bay, est = estuary, fdm = farm dam, fwp = freshwater pan, sdm = state dam, spn = saltpan and sw = sewage works, For site labels refer to Table 5.1.
-1.0 -0.5 0.0 0.5
-0.8
-0.6
-0.4
-0.2
0.0
0.2
0.4
0.6
Axis 1
Axi
s 2
clkebyestfdmfw psdmspnsw
bw
bg
BT
br
DH
hn
dp
DV
gb
jk
kb
kl
kn
lbmc
ol
PA
rd
rv
RP
rn
st
th
ve
vv
w a
w s
w t
w v
zv
-1.0 -0.5 0.0 0.5
-0.5
0.0
0.5
Axis 1
Axi
s 2
clkebyestfdmfw psdmspnsw
bw
bg
BTbr
DH
hn
dp
DV
gb
jk
kb
kl
kn
lb
mc
ol
PA
rd
rv
RP
rn
st
th
vevv
w a
w s
w t
w v
zv
(a) (b)
212

Figure 5.2 Plots of 30 wetland sites in the Western Cape during (a) summer and (b) winter based on correspondence analysis and categorised according to wetland location. The plots represent the first principal plane of the correspondence analysis. For (a) the horizontal axis represents the first principal dimension and accounts for 27.1% of the inertia, and the vertical axis represents the second principal dimension and accounts for 19.2% of the inertia. For (b) the horizontal axis accounts for 26.2% of the inertia, and the vertical axis accounts for 17.0% of the inertia. Legend labels: cst = coastal, in = inland. For site labels refer to Table 5.3.
-1.0 -0.5 0.0 0.5
-0.8
-0.6
-0.4
-0.2
0.0
0.2
0.4
0.6
Axis 1
Axi
s 2
cstin
bw
bg
BT
br
DH
hn
dp
DV
gb
jk
kb
kl
kn
lbmc
ol
PA
rd
rv
RP
rn
st
th
ve
vv
w a
w s
w t
w v
zv
-1.0 -0.5 0.0 0.5
-0.5
0.0
0.5
Axis 1
Axi
s 2
cstin
bw
bg
BTbr
DH
hn
dp
DV
gb
jk
kb
kl
kn
lb
mc
ol
PA
rd
rv
RP
rn
st
th
vevv
w a
w s
w t
w v
zv
(a) (b)

Figure 5.3 Plots of 30 wetland sites in the Western Cape during (a) summer and (b) winter based on correspondence analysis and categorised according to estuarine bio-region (Whitfield 2000). The plots represent the first principal plane of the correspondence analysis. For (a) the horizontal axis represents the first principal dimension and accounts for 27.1% of the inertia, and the vertical axis represents the second principal dimension and accounts for 19.2% of the inertia. For (b) the horizontal axis accounts for 26.2% of the inertia, and the vertical axis accounts for 17.0% of the inertia. Legend labels; ct = cool temperate, wt = warm temperate. For site labels refer to Table 5.3.
-1.0 -0.5 0.0
-0.4
-0.2
0.0
0.2
0.4
0.6
0.8
Axis 1
Axi
s 2
ctw t
bg
BTbr
hn
dp
gb
kb
kl
kn
lb ol
ve
zv
-1.0 -0.5 0.0 0.5
-0.4
-0.2
0.0
0.2
0.4
0.6
0.8
Axis 1
Axi
s 2
ctw t
bg
BT
br
hn
dp
gbkb
kl
kn
lb
ol
ve
zv
(b) (a)
214

Figure 5.4 Plots of 30 wetland sites in the Western Cape during (a) summer and (b) winter based on correspondence analysis and categorised according to inundation pattern (see Whitfield 2000). The plots represent the first principal plane of the correspondence analysis. For (a) the horizontal axis represents the first principal dimension and accounts for 27.1% of the inertia, and the vertical axis represents the second principal dimension and accounts for 19.2% of the inertia. For (b) the horizontal axis accounts for 26.2% of the inertia, and the vertical axis accounts for 17.0% of the inertia. Legend labels: epo = estuary, permanently open, eto = estuary, temporarily open, pi = permanently inundated and ti = temporarily inundated. For site labels refer to Table 5.3.
-1.0 -0.5 0.0 0.5
-0.8
-0.6
-0.4
-0.2
0.0
0.2
0.4
0.6
Axis 1
Axi
s 2
epoetopiti
bw
bg
BT
br
DH
hn
dp
DV
gb
jk
kb
kl
kn
lbmc
ol
PA
rd
rv
RP
rn
st
th
ve
vv
w a
w s
w t
w v
zv
-1.0 -0.5 0.0 0.5
-0.5
0.0
0.5
Axis 1
Axi
s 2
epoetopiti
bw
bg
BTbr
DH
hn
dp
DV
gb
jk
kb
kl
kn
lb
mc
ol
PA
rd
rv
RP
rn
st
th
vevv
w a
w s
w t
w v
zv
(a) (b)

Figure 5.5 Plots of 30 wetland sites in the Western Cape during (a) summer and (b) winter based on correspondence analysis and categorised according to conservation status of each site. The plots represent the first principal plane of the correspondence analysis. For (a) the horizontal axis represents the first principal dimension and accounts for 27.1% of the inertia, and the vertical axis represents the second principal dimension and accounts for 19.2% of the inertia. For (b) the horizontal axis accounts for 26.2% of the inertia, and the vertical axis accounts for 17.0% of the inertia. Legend labels: pp = partly protected, pr = protected, up = unprotected. For site labels refer to Table 5.3.
-1.0 -0.5 0.0 0.5
-0.8
-0.6
-0.4
-0.2
0.0
0.2
0.4
0.6
Axis 1
Axi
s 2
ppprup
bw
bg
BT
br
DH
hn
dp
DV
gb
jk
kb
kl
kn
lbmc
ol
PA
rd
rv
RP
rn
st
th
ve
vv
w a
w s
w t
w v
zv
-1.0 -0.5 0.0 0.5
-0.5
0.0
0.5
Axis 1
Axi
s 2
ppprup
bw
bg
BTbr
DH
hn
dp
DV
gb
jk
kb
kl
kn
lb
mc
ol
PA
rd
rv
RP
rn
st
th
vevv
w a
w s
w t
w v
zv
(a) (b)
216

Figure 5.6 Plots of 71 waterbird species from 30 sites in the Western Cape during (a) summer and (b) winter based on correspondence analysis and categorised according to species group. The plots represent the first principal plane of the correspondence analysis. For (a) the horizontal axis represents the first principal dimension and accounts for 30.3% of the inertia, and the vertical axis represents the second principal dimension and accounts for 14.6% of the inertia. For (b) the horizontal axis accounts for 25.3% of the inertia, and the vertical axis accounts for 15.4% of the inertia. Legend labels: Crm = Cormorants and darter, Flm = Flamingo, Gul = Gull, Kfs = Kingfisher, Pel = Pelican, Rap = Raptor, Shr = Shorebird, Trn = Tern, Wad = Wader, Wfl = Waterfowl. For site labels refer to Appendix 5.1.
-1.5 -1.0 -0.5 0.0 0.5
-1.0
-0.5
0.0
0.5
1.0
Axis 1
Axi
s 2
Crm Flm Gul Kf s Pel Rap Shr Trn Wad Wf l
12
3
45
6
78
9
10
11
12
13
14
15
16
17
18
19
20
21
22
23
24
2526
27
28
29
30
31
32
3334
35
36
37
38
39
40
41
42
43
4445
46
47
48
49
50
51
52
53
54
55 56
57
58
59
60
61
62
63
64
65
66
67
68
69
70
71
-2.0 -1.5 -1.0 -0.5 0.0 0.5
-1.0
-0.5
0.0
0.5
1.0
Axis 1
Axi
s 2
Crm Flm Gul Kf s Pel Rap Shr Trn Wad Wf l
1
2
3
4
5
6
78
9
10
11
12
13
14
15 1617
18
19
20
21
22
23
24
25
26
27
28
29
30
31
32
33
34
35
36
37
38
39
40
41
42
43
44
45
4647
48
49
5051
52
53
54
5556
57
58
59
60
61
62
63
64
65
66
67
68
69
70
71
(a) (b)

Figure 5.7 Plots of 71 waterbird species from 30 sites in the Western Cape during (a) summer and (b) winter based on correspondence analysis and categorised according to occurrence status. The plots represent the first principal plane of the correspondence analysis. For (a) the horizontal axis represents the first principal dimension and accounts for 30.3% of the inertia, and the vertical axis represents the second principal dimension and accounts for 14.6% of the inertia. For (b) the horizontal axis accounts for 25.3% of the inertia, and the vertical axis accounts for 15.4% of the inertia. Legend labels: Pal. = Palearctic migrants, Res. = residents. For site labels refer to Appendix 5.1.
-2.0 -1.5 -1.0 -0.5 0.0 0.5
-1.0
-0.5
0.0
0.5
1.0
Axis 1
Axi
s 2
Pal.Res.
1
2
3
4
5
6
78
9
10
11
12
13
14
15 1617
18
19
20
21
22
23
24
25
26
27
28
29
30
31
32
33
34
35
36
37
38
39
40
41
42
43
44
45
4647
48
49
5051
52
53
54
5556
57
58
59
60
61
62
63
64
65
66
67
68
69
70
71
-1.5 -1.0 -0.5 0.0 0.5
-1.0
-0.5
0.0
0.5
1.0
Axis 1
Axi
s 2
Pal.Res.
12
3
45
6
78
9
10
11
12
13
14
15
16
17
18
19
20
21
22
23
24
2526
27
28
29
30
31
32
3334
35
36
37
38
39
40
41
42
43
4445
46
47
48
49
50
51
52
53
54
55 56
57
58
59
60
61
62
63
64
65
66
67
68
69
70
71
(b) (a)
218

Figure 5.8 Plots of 71 waterbird species from 30 sites in the Western Cape during (a) summer and (b) winter based on correspondence analysis and categorised according to feeding guild. The plots represent the first principal plane of the correspondence analysis. For (a) the horizontal axis represents the first principal dimension and accounts for 30.3% of the inertia, and the vertical axis represents the second principal dimension and accounts for 14.6% of the inertia. For (b) the horizontal axis accounts for 25.3% of the inertia, and the vertical axis accounts for 15.4% of the inertia. Legend labels: Crn = Carnivore, Hrb. = Herbivore, Ivt. = Invertebrate feeder, Pis. = Piscivore. For site labels refer to Appendix 5.1.
-2.0 -1.5 -1.0 -0.5 0.0 0.5
-1.0
-0.5
0.0
0.5
1.0
Axis 1
Axi
s 2
CrnHrbIv tPis
1
2
3
4
5
6
78
9
10
11
12
13
14
15 1617
18
19
20
21
22
23
24
25
26
27
28
29
30
31
32
33
34
35
36
37
38
39
40
41
42
43
44
45
4647
48
49
5051
52
53
54
5556
57
58
59
60
61
62
63
64
65
66
67
68
69
70
71
-1.5 -1.0 -0.5 0.0 0.5
-1.0
-0.5
0.0
0.5
1.0
Axis 1
Axi
s 2
Crn.Hrb.Iv t.Pis.
12
3
45
6
78
9
10
11
12
13
14
15
16
17
18
19
20
21
22
23
24
2526
27
28
29
30
31
32
3334
35
36
37
38
39
40
41
42
43
4445
46
47
48
49
50
51
52
53
54
55 56
57
58
59
60
61
62
63
64
65
66
67
68
69
70
71
(b) (a)

220
Figure 5.9 Waterbird Conservation Value (WCV) scores for 30 wetland sites in the Western Cape during summer. Species compositions based on Table 5.2. Results based on the mean abundance of each species at each site and sorted in ascending order (left to right) of the inertia on the first axis of the correspondence analysis. For wetland site abbreviations see Table 5.3, and for legend species abbreviations see Table 5.3.
Figure 5.10 Waterbird Conservation Value (WCV) scores for 30 wetland sites in the Western Cape during winter. Species compositions based on Table 5.2. Results based on the mean abundance of each species at each site and sorted in ascending order (left to right) of the inertia on the first axis of the correspondence analysis. For wetland site abbreviations see Table 5.3 and for legend species abbreviations see Table 5.3.
0
2
4
6
8
10
12
14
16
18
20
22
dm kb lb ol kn br gb kl dp bg BT jk ws rv st wa
RP
DH
VE vv th zv rn wt
mc
DV wv
bw rd PA
WC
V s
core
Wetland site
HG CS WBC CT
PA CSP BWS GF
GCG KG ST SAS
EG YD ABO GWP
WFP RT GP CC
SL Other
0
2
4
6
8
10
12
14
16
lb dm kb ol br kn ws kl bg gb jk RP dp BT
DH vv rv
DV st th wa zv rd P
A mc rn wv
we
bw wt
WC
V s
core
Wetland site
WBC HG GF BNGCS BWS CT KGST GCG ABO RCMD YD LF LGWFP CC SP RTOther
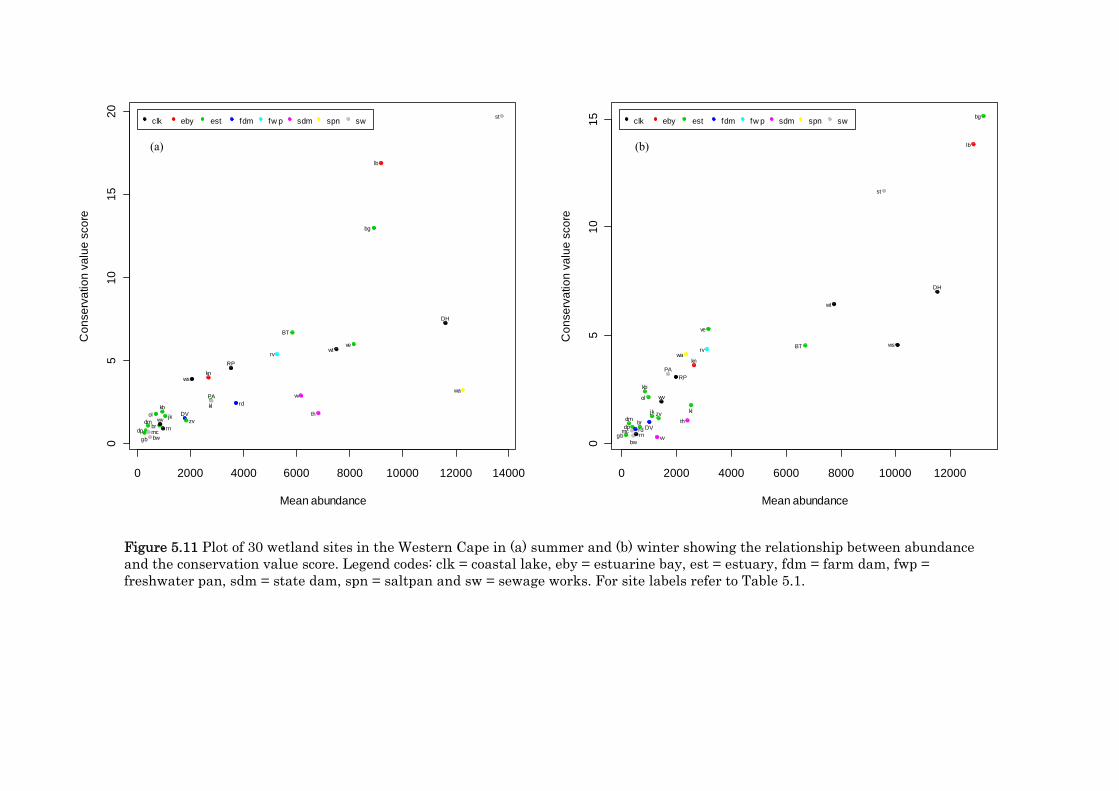
Figure 5.11 Plot of 30 wetland sites in the Western Cape in (a) summer and (b) winter showing the relationship between abundance and the conservation value score. Legend codes: clk = coastal lake, eby = estuarine bay, est = estuary, fdm = farm dam, fwp = freshwater pan, sdm = state dam, spn = saltpan and sw = sewage works. For site labels refer to Table 5.1.
0 2000 4000 6000 8000 10000 12000
05
10
15
Mean abundance
Co
nse
rva
tion
va
lue
sco
re
clk eby est fdm fw p sdm spn sw
bw
bg
BT
br
DH
dmdp DV
gb
jk
kb
kl
kn
lb
mc
ol
PA
rd
rv
RP
rn
st
th
ve
vv
wa
ws
wt
wv
zv
(b)
0 2000 4000 6000 8000 10000 12000 14000
05
10
15
20
Mean abundance
Co
nse
rva
tion
va
lue
sco
re
clk eby est fdm fw p sdm spn sw
bw
bg
BT
br
DH
dm
dp
DV
gb
jk
kb kl
kn
lb
mc
ol
PArd
rv
RP
rn
st
th
ve
vvwa
ws
wt
wv zv
(a)

222
Figure 5.12 DEI values for 30 wetland sites in the Western Cape in summer (dark bars) and winter (grey bars). See text for calculation of DEI values. For site codes refer to Table 5.1.
0
2000
4000
6000
8000
10000
12000
14000
hn kb lb ol kn br gb kl dp bg BT jk ws rv st wa
RP
DH ve vv th zv rn wt
mc
DV wv
bw rd PA
DE
I (M
J/da
y)
Site

223
Appendix 5.1 List of 71 waterbird species used in the correspondence analyses (CA). The Ref. no. corresponds to the number used in the CA plots. Species with abbreviations should be used together with Figures 5.9 and 5.10.
Ref. no. Species Abbr. Ref. no. Species Abbr.
1 African Snipe 37 Little Egret 2 African Black Oystercatcher ABO 38 Little Grebe LG 3 African Darter 39 Little Stint 4 African Marsh-Harrier 40 Maccoa Duck MD 5 African Sacred Ibis 41 Malachite Kingfisher 6 African Spoonbill 42 Marsh Sandpiper 7 Black-crowned Night-Heron 43 Pied Avocet PA 8 Black-headed Heron 44 Pied Kingfisher 9 Black-necked Grebe BNG 45 Purple Heron
10 Blacksmith Lapwing 46 Red-billed Teal 11 Black-winged Stilt BWS 47 Red-knobbed Coot RC 12 Cape Cormorant CC 48 Reed Cormorant 13 Cape Shoveler CS 49 Ruff 14 Cape Teal 50 Sanderling SL 15 Caspian Tern CT 51 Sandwich Tern 16 Cattle Egret 52 South African Shelduck SAS 17 Common Greenshank 53 Southern Pochard SP 18 Common Moorhen 54 Spur-winged Goose 19 Common Ringed Plover 55 Swift Tern ST 20 Common Sandpiper 56 Three-banded Plover 21 Common Tern 57 Water Thick-knee 22 Curlew Sandpiper CSP 58 White-breasted Cormorant WBC 23 Egyptian Goose EG 59 White-fronted Plover WFP 24 Eurasian Curlew 60 White-winged Tern 25 Grey Plover GP 61 Wood Sandpiper 26 Glossy Ibis 62 Yellow-billed Egret 27 Great Crested Grebe GCG 63 Yellow-billed Duck YD 28 Great White Pelican GWP 64 African Purple Swamphen 29 Greater Flamingo GF 65 Bar-tailed Godwit 30 Grey Heron 66 Common Whimbrel 31 Grey-headed Gull 67 Giant Kingfisher 32 Hadeda Ibis 68 Great Egret 33 Hartlaub's Gull HG 69 Osprey 34 Kelp Gull KG 70 Ruddy Turnstone RT 35 Kittlitz's Plover 71 Whiskered Tern 36 Lesser Flamingo LF

225
Chapter 6
Synthesis and recommendations

226

227
Conservation importance – the Waterbird Conservation Value score
Nowadays it is becoming increasingly important to develop rapid conservation
assessment tools in biodiversity conservation in order to prioritise research and
conservation needs. Wetlands are also under increasing threat from development and
their ecological importance often goes unnoticed. One example of such a tool is the Alerts
System developed in the United Kingdom (Austin et al. 2006). This system, through
regular census data, provides a standardised method for identifying the direction and
size of changes in waterbird numbers at various spatial and temporal scales.
Kuijken (2006) traced the development of concepts in waterbird conservation;
these started to take root from the 1930s, resulting in the initiation of the “International
Wildfowl Inquiry” in 1937. Kuijken (2006) described several series of meetings over a
period of four decades which culminated in the Ramsar Convention; the final text was
agreed upon on 2 February1971, the date now commemorated annually as “World
Wetlands Day”. The Ramsar Convention (full title: “The Convention on the
Conservation of Wetlands of International Importance especially as Waterfowl Habitat”)
introduced the 1% criterion (see Chapter 2) which allowed wetlands to be designated as
internationally important based on a threshold level of 1% of the estimated global or bio-
geographical population; waterbird population estimates are now readily available and
have been based on census data through the International Waterbird Census programme
of Wetlands International (Gillesen et al. 2002) in which South Africa participates
through the African Waterbird Census programme (Diagana et al. 2006). This threshold
level was deemed to be biologically and ecologically significant. The application of the
criterion can be used fairly quickly and has allowed rapid assessments to be made of the
global importance of wetlands.
From the waterbird perspective, the 1% threshold has remained the key tool in
determining the conservation status of wetlands for four decades. It is therefore with
some trepidation that the Waterbird Conservation Value (WCV) score, developed in
Chapters 2 and 3 of this thesis, is introduced. This new measure should not be viewed as
a competitor to the 1% threshold approach, but should rather be seen as a natural
extension of this concept. It makes use of the 1% threshold levels to provide a cumulative
score which can be used to rapidly assess the waterbird conservation importance at the
site. It considers the contributions of all species to evaluating the importance of a site,
not only those that exceed the 1% threshold. I therefore recommend that the WCV scores
be adopted in addition to the traditional approach to assist in the ranking of the
importance of wetlands, not only in South Africa, but throughout the world. This tool can
be used to help prioritise wetlands of international importance in a country, and will aid

228
biodiversity conservation planning at national level. Importantly, changes to the site
WCV scores on an annual basis will allow regular assessments to be made on a
continuous scale. A substantial decrease in the score could then act as an ‘alert’ for (a)
monitoring changes in certain species populations, notably threatened or endemic
species and (b) providing the relevant managing authority at the site to investigate
possible causes for such declines. The tool will also be useful in assisting climate change
studies for monitoring changes in bird populations (de Villiers 2009). The shortcoming of
the traditional approach of simply counting the number of species that reach the
1% threshold at a site is that it is rather insensitive to the changes in abundance of
waterbirds, only changing when the abundance of a species either increases above, or
decreases below, the threshold.
Waterbird censuses and conservation implications
The counting and monitoring of waterbird populations at wetlands allows researchers
and managers to describe the diversity and abundance of waterbirds at site-level. The
data can further be used to assess aspects such as seasonality, identification of
threatened species, identification of sites supporting significant numbers of birds, energy
consumption and, where long-term monitoring, for periods of a decade or longer has
occurred, population trends. At larger spatial scales, these data can be used to look at
patterns of distribution and abundance and relative importance of wetlands in a regional
context and assess conservation priorities for waterbirds.
In this thesis, I included the above aspects to investigate and assess the regional
importance of wetlands for waterbirds in the winter rainfall region. From the five site
assessments (Chapters 3 and 4 and Appendices A–D) the following aspects emerged:
The WCV score is a useful tool to assess regional importance of wetlands and
allows rapid assessment of priority species within a defined region.
The uses of visual analytics (colour-coded histograms and radar plots) are a useful
and convenient way of displaying the overall conservation importance of sites.
The WCV score can be used in detailed site studies to assess specific site issues.
For example the conservation priorities of the opening and closure of the mouth of
the Bot River estuary can be assessed through this method (Chapter 4)
Conservation value of a site is not necessarily based on large abundance values
for species. Using the WCV score, the ratio of abundance (a count) to the 1%
threshold level is more significant. Because the denominator (1% level) for certain
species is high, ratios will be small even when large numbers of birds are present.

229
Thus species with large numbers relative to their 1% level will have higher
conservation priority and site significance.
Natural wetlands, Rocher Pan, De Hoop Vlei and Bot River estuary supported
more birds and had greater conservation value than man-made wetlands; the
mean WCV scores during summer were almost double those of Paarl WWTW and
Droëvlei Dam (Table 3.1). This phenomenon is well known and widely accepted
(Tourenq et al. 2001, Ma et al. 2004, Paracuellos and Tellería 2004, Raeside et al.
2007) and highlights the importance of natural wetland systems for waterbirds in
the WRR.
Although artificial wetlands (Paarl WWTW and Droëvlei Dam) supported fewer
numbers of birds and had less conservation significance (i.e lower WCV scores)
than the natural wetlands, they did play a role in offering suitable alternative
habitats to waterbirds (Fuller and Glue 1980). Consequently they also
contributed to maintaining regional and global (e.g. White-winged Tern)
waterbird populations in the WRR (Gibbs 1993).
Wetland inundation and hydrological changes impact on the way in which
waterbirds utilise sites. A seasonal wetland such as Rocher Pan (Appendix C)
supports waterbirds for a certain period of time but as the wetland dries up they
need to search out more permanent wetlands. Bot River Estuary (Chapter 4) and
De Hoop Vlei (Appendix D) can support birds all year round but changes in
water-levels and salinities impact on changes to the waterbird communities that
use these sites.
Patterns of mean abundance for most other species were variable and it was
difficult to discern movement patterns between sites based on the census data
provided. This is largely due to the unpredictable nature of environmental
conditions at South African wetlands; this was evident when assessing responses
of birds at the Bot River estuary (Chapter 4) and Rocher Pan (Appendix C).
Red-knobbed Coot showed preference for larger, natural waterbodies. It was the
most abundant species at the Bot River Estuary, De Hoop Vlei and Rocher Pan.
These birds generally occur in large congregations, particularly when not
breeding, and therefore require large waterbodies with sufficient aquatic plant
material. Although Red-knobbed Coot is not uncommon or under threat, the fact
that it has large populations in the Western Cape does infer that safeguarding
these sites is important for this species.

230
Chapter 5 elucidated further on the results of the five site analyses and
considered associations between 30 wetlands in the Western Cape. In summary, this
chapter concluded that:
There were strong associations between wetlands of the same type. Estuaries or
estuarine bays that were permanently open to the sea (e.g. De Mond, Langebaan
Lagoon, Berg River estuary, Knysna Lagoon), supported increased shorebird
populations particularly Palearctic migrants during summer. Freshwater
wetlands (e.g. Paarl Waste Water Treatment Works, Droëvlei Dam, Radyn Dam,
Wildevoëlvlei) were dominated by waterfowl-wader communities.
Wetland conservation status did not seem to play an important role in
determining waterbird conservation importance. This infers that waterbirds
selected sites based on the physical characteristics of the wetland.
Waterbird Conservation Value (WCV) scores were generally higher at larger
wetlands than smaller sites; large sites were able to support larger species
populations and therefore had greater conservation value.
Daily Energy Intake was greatest at large sites which support larger populations
of waterbirds than smaller sites; however this can vary seasonally and for
wetland type. For example, at Langebaan Lagoon large numbers of migrant
shorebirds remove most of the energy from the wetland during summer a time of
high productivity; in winter when the majority of the migrants were absent,
flamingo populations increased; with higher biomass values higher DEI values
were recorded during winter than summer; the same applied to the Berg River
estuary which had higher DEI values in winter compared with summer.
Strandfontein WWTW, Langebaan Lagoon and Berg River Estuary emerged as
the top three sites in the Western Cape for waterbird conservation (Table 6.1);
this was in terms of making significant contributions to global and regional
waterbird populations. These sites should be conserved at all costs.
Further research and recommendations
What will shape the monitoring and conservation of waterbirds in South Africa, and in
particular the winter rainfall region of the Western Cape, into the future? It is clear from
this thesis how different sites were surveyed under different counting protocols and how
the data were assessed based on these protocols. It was also evident that changes in the
occurrence and seasonal abundance vary spatially and temporally and that certain sites
do support more conservation worthy species than others.
231
However, how do we incorporate these and other variables to ensure waterbird
monitoring delivers the right kind of information and that the right kind of analyses are
undertaken? There are four main issues that scientists, researches and managers need
to consider when considering managing future waterbird populations in the winter
rainfall region of South Africa:
(a) Improved census data for population estimates
(b) Impacts of climate and environmental change
(c) Site characteristics and management
(d) Landscape conservation and management
These issues are explored further in the following sections. (a) Improved census data for population estimates
One thread running through this thesis has been the concept of deriving a Waterbird
Conservation Value score as an additional method to assess wetland importance
(Chapters 2 and 3). Because the calculation of the score is based on the 1% threshold,
which are derived from population estimates, the resultant scores are dependent on the
population estimates (Chapter 2). These estimates and 1% thresholds are provided in
‘Waterbird Population Estimates’ (Wetlands International 2006) using data sourced from
the International Waterbird Census (IWC) programme. CWAC supplies South African
waterbird census data to the IWC and 1% thresholds are sourced for South African
waterbirds.
The 1% thresholds cannot be applied consistently across all waterbird groups
(Wetlands International 2006). This is because population data are often not available or
are unreliable. For certain species groups (e.g Anatidae, Rallidae, some Scolopacidae)
Wetlands International maintains that population estimates are unknown or are based
on best-guess estimates because species are difficult to survey or occur in small numbers.
In these cases 1% threshold levels are not assigned due to the lack of or poor quality of
census data.
Often population estimates for species are based on a single population within a
large geographic region. Within Africa, for example the 1% threshold for Goliath Heron
is 3000 given for a single sub-Saharan population (Wetlands International 2006). In
South Africa this threshold would never be reached for this species – the highest count
for Goliath Heron at a single wetland in South Africa is 161 (CWAC, unpublished data,
Animal Demography Unit). Such a count would generally reflect a large proportion of the
‘national population’ but loses its significance in the African context. As such, this site is

232
not recognised as being important for this species. This begs the question of whether
some population estimates are reliable or even bias to certain regions within a species
range where densities are higher. Similar scenarios exist for other South African species
which have sub-Saharan populations: Hamerkop, 1% threshold is 10 000, Black Heron,
1 000 and Blacksmith Lapwing, 10 000. Where subspecies have been described for a
species, population estimates for these subspecies (or sub-populations) tend to be more
reliable and 1% thresholds more realistic. At these sub-species scales WCV scores will
then have more meaningful conservation outcomes. Globally there are 546 waterbird
populations (either species or sub-species) whose population sizes are unknown or
uncertain; 52 of these populations occur in Africa (Wetlands International 2006).
Based on the above, there is a need to develop strategies to improve census
techniques and monitoring of waterbird populations in Africa, and South Africa, to
provide improved population estimates. In turn this would enable a more robust
application of the 1% threshold and WCV score and better conservation planning. In
addition, there is an urgent need to develop and formalise national and provincial
waterbird thresholds in South Africa. The CWAC data currently has a 20-year dataset
from which initial population estimates could be derived. Setting national and provincial
thresholds would allow for a more focussed approach and have greater relevance to
national and local waterbird conservation initiatives in the region and within the
Western Cape. Consequently, increased responsibility would then be placed on regional
or national conservation bodies to ensure adequate protection of sites for species.
(b) Impacts of climate and environmental change
With large parts of the Western Cape, and winter rainfall region, predicted to become
hotter and drier with more erratic rainfall particularly along the West Coast (Simmons
et al. 2004, Midgley et al. 2005), changes to seasonal rainfall and therefore landscape
elements are likely to occur. Ephemeral wetlands or at least those which show
substantial drying during the dry season, are likely to stay drier for longer, and
therefore have direct impacts on waterbird abundance at particular sites. From this
thesis Rocher Pan and Droëvlei Dam are strong candidates in this category. De Hoop
Vlei and Bot River Estuary may receive less inflow and increased water-level
fluctuations may occur along with increased evaporation associated with slighter higher
summer temperatures and strong prevailing winds. Paarl WWTW may be the least
impacted site mainly due to the nature of the treatment works where there is a constant
supply of water to the maturation dams.

233
Since rainfall is considered to be a primary proximal factor to which waterbirds
respond (Winterbottom and Rowan 1962, Immelman 1970, Burbridge and Fuller 1982,
Whitehead and Saalfeld 2000 and Roshier et al. 2002) and that reflect varying patterns
of waterbird abundance, distribution and timing of breeding, it is important to consider
it here in more detail. Tyson (1986) states that in the southern hemisphere, El Niño
Southern Oscillations (ENSO) cause increased rainfall variability and prolonged
droughts in arid and semi-arid environments; similarly La Niña events result in
prolonged wet periods. El Niño events have become more frequent in the last 20–30
years in Africa and Asia that have resulted in more frequent and prolonged droughts
occurring (Finlayson et al. 2006). These events are also experienced in South America
and have impacted bird populations (e.g. Schlatter et al. 2002). Animal and plant
communities in these areas need to respond and/or adapt to these changing wet–dry
cycles, particularly during long drought periods (Dean et al. 2009). As most of the
winter-rainfall region is considered a dry, semi-arid environment (Tyson 1986, Schulze
1997), and with the rainfall and temperature changes forecast for the region, longer dry
spells with less prolonged rain is bound to impact on waterbirds, and other biotic
communities. For waterbirds, the changes are likely to impact generally on all aspects of
their ecology although changes to populations, foraging areas (especially at coastal
wetlands), timing of breeding and migratory/movement patterns may be worse affected
(Schlatter et al. 2002, Finlayson et al. 2006); for the latter favoured roosting, feeding or
moulting sites may no longer hold water for any length of time which could alter
selection of sites for these activities. It is unsure exactly how these changes will take
place, especially within African and South African ecosystems (de Villiers 2009), and
why there is a need to conduct appropriate scientific studies and research to monitor
responses to this change. Trends in bird distribution and populations may well be driven
by climate change, but these do not operate independently; aspects such as land-use and
landscape changes need to be considered as complimentary causative factors. de Villiers
(2009) and Finlayson et al. (2006) concur that ongoing monitoring and compilation of
long-term bird datasets and bird inventories provide immensely valuable data to begin
to look at detecting changes, which may vary from species to species.
For waterbirds in South Africa, CWAC is providing this kind of data and showed
that Curlew Sandpiper numbers have declined by as much as 40% at Langebaan Lagoon
over three decades (Harebottle and Underhill 2006). Through counts of first-year birds at
non-breeding sites in South Africa during the peak austral winter (June–July), breeding
success can be monitored and overall population changes measured for this species; long-
distance migrant shorebirds are likely to be the first casualties of climate change in the

234
Siberian tundra (Zöckler 2002, de Villiers 2009). This provides evidence of the success
and importance of programmes like CWAC and a call for it to continue on an on-going
basis into the future.
Environmental modelling to aid data interpretation
Where rainfall was considered in the site analyses, there were indications that wetness
(cumulative rainfall over time) may be an important factor influencing occurrence of
species at some sites. Modelling the response of species to regional wetness would be a
useful future research output and would complement similar studies carried out in
Australia by Chambers et al. (2005) and Chambers and Lyon (2006). This modelling
becomes particularly relevant when considering the impacts of future climate change
shifts in the region (see above). Consequently, I strongly recommend that existing and
adaptive modelling techniques be considered and applied for future analyses, and
perhaps using longer time-series data. Aspects of the models, such as improving the
quality of the rainfall and salinity data, and including other climatic variables (e.g.
temperature) and site variables (e.g. water-level, volume of water), needs to be
considered to improve the power of the models, as these factors may have impacted on
the outcome of the initial results. This modelling may have the desired impact of
predicting which wetlands may be most impacted and which species most affected by
shifts in rainfall patterns. In the same winter rainfall region in which I worked,
Oschadleus (2005) found that the initiation of moult in weavers was correlated to the
end of the wet season, while other studies (Gentilli and Bekle 1983, Woodall 1985) have
found strong links between rainfall and inundation and other climatic variables.
(c) Site characteristics and management
Changes at landscape or global levels and their impacts are difficult to assess in the
medium-short term. However, the physical characteristics of the wetland site and any
changes are likely to be assessed more rapidly in the short-term, and often it is these
short-term impacts which have immediate consequences for waterbirds. Although some
site information is collected for CWAC, it is often done on a casual or ad hoc basis. For
interpretation of waterbird surveys to be done properly more systematic collection of site
data is required, particularly of water-quality and food abundance. Some of the results in
this thesis have used such data (e.g. salinity and water-level data, Chapter 4) and it has
aided in drawing better conclusions than if this data was not available.
There is a need for holistic wetland management particularly for critical and
important sites where waterbirds occur. For sites that fall within protected areas
management plans should include regular surveys of aquatic plants at the wetland, both

235
of submerged macrophytes (e.g. Potamogeton spp. and Ruppia spp.) and emergent
vegetation (reeds and sedges). These are important site attributes for waterbirds,
particularly waterfowl, which make use of the plants as a food source and nesting
material (e.g. Red-knobbed Coot which is an important wetland species in the winter
rainfall region).
(d) Landscape conservation and management
An increasing number of waterbird and wetland researchers and managers are becoming
aware of the landscape approach to conserve these habitats (Flather and Sauer 1996,
Haig et al. 1998, Erwin 2002, Tori et al. 2002, Chambers and Loyn 2006, Dodman and
Diagana 2006). They cannot be looked at in isolation, especially for waterbirds which are
highly mobile. Large-scale and long-distance movements occur between sites (Oatley and
Prŷs-Jones 1986, Underhill et al. 1999) and as such conservation of species and
populations needs to take place at levels that cross biomes and often political
boundaries. Wetlands serve different purposes – where one site provides a safe place to
breed another site provides good foraging opportunities; when one site dries up another
site provides permanent water as a safe refuge. Niemuth and Solberg (2003) found that
water availability determined shifts in waterbird distributions rather than responses at
local level, again emphasising a broader landscape approach to wetland and waterbird
conservation ecology.
The regional analyses undertaken in this thesis has provided insights into how
different wetlands in different parts of a climatic region often support varying waterbird
populations; conservation value assessments were also carried out to determine
important sites and priority species. Annual survival of waterbirds invariably depends
on the availability of different wetland types, different hydrological processes, varying
wetland productivity and connectivity between wetlands at landscape level (Haig et al.
1998, Paracuellos and Telleria 2004, Traut and Hostetler 2004, Taft and Haig 2006,
Paracuellos 2006, Lank and Nebel 2006). This concept and approach to waterbird
conservation has long been recognised in South Africa (Siegfried 1970, Zaloumis and
Milstein 1975) but no formal policies or co-operative agreements exists between
provinces or even neighbouring countries in order to ensure commitment to this. This is
something that needs to be considered in the near future.
Taking this further to the global level, where the landscape approach becomes
important in terms of long-distance migrants, agreements such as the African-Eurasian
Waterbird Agreement (AEWA), a multi-national agreement under the Convention on
Migratory Species (CMS) (Boere and Lenten 1997) help provide measures and access to

236
resources to conserve migratory waterbirds and their habitats at an international level.
South Africa is a signatory to the CMS and AEWA and therefore has committed itself to
implement activities in this regard. These agreements could aid in setting up national
policies and action plans (Zaloumis 1993, Arinaitwe 1995) and possibly a waterbirds
alert system as has been devised in the United Kingdom (Austin et al. 2006).
As part of the landscape approach, monitoring of movements of waterbirds within
the landscape or further afield is crucial; this helps researchers, managers and policy
makers better understand how waterbirds use the landscape and which sites are more
important than others (e.g. Stroud et al. 2006). In addition, it complements CWAC data,
providing a more holistic, integrated approach to monitoring and managing waterbird
populations in South Africa.
There is a lack of information on waterbird movements in South Africa at every
scale except those of long-distance inter-continental migrants, whose annual movements,
in at least broad terms, are relatively well understood (Underhill et al. 1999). However,
the movements of waterbirds within Africa, southern Africa, South Africa and within the
winter rainfall region of the Western Cape are poorly understood (Underhill et al. 1999).
It seems to me that the poorest understanding is on the smallest scale. One of the
original goals at the outset of this thesis was to test the idea that waterbird counts
would help us understand regular seasonal movements of waterbirds between wetlands
of the Western Cape. I had hoped that increases at wetlands in one region would be
compensated for annually by increases at wetlands in another region. In analyses not
presented within the body of this thesis, but implicit in the results, I failed to find any
patterns. At a regional scale of the Western Cape, it seems difficult for census
information to discern regular movements of waterbirds and linkages between wetlands.
Within this region, site-level information is probably best treated as providing
information within the scale of the site.
A long established method of discerning patterns of waterbird movements is by
ringing (e.g. Siegfried 1967, Oatley and Prŷs-Jones 1986, Little et al. 1995, Petrie and
Rogers 1997). Underhill et al. (1999) provided a summary of waterbird ringing recoveries
in southern Africa. They concluded that many resident waterbirds displayed dispersal or
movements but generally no movement or migratory patterns were discernible. One of
their recommendations to solve this problem was to establish colour ringing schemes,
with individually marked engraved rings, to supplement the traditional recovery data.
In response to this, Harebottle and Gibbs (2006) established such a long-term waterbird
ringing programme in the Western Cape. The programme aimed to study dispersal and
movements of colonial waterbirds, in particular African Sacred Ibis. Although the

237
database generated by this programme has not yet been analysed, it is abundantly clear
that this project is not going to solve the problem of uncovering patterns of waterbird
movement in the Western Cape (unpubl. data). It will however provide the data
resources for estimates of survival rates using capture-mark-recapture modelling.
A country-wide, long-term coordinated waterbird ringing programme would
certainly meet the need to monitor movements and survival of waterbird species in the
Western Cape and elsewhere in South Africa. These activities, which could be
coordinated through the African Waterbird Ringing Scheme (AFRING, see Harebottle et
al. 2005) could focus on waterfowl and waders, two groups which already have been
subjects of previous or ongoing ringing programmes in the Western Cape (Harebottle
2005, Harebottle and Gibbs 2006).
During the analyses period of this thesis, new technologies have emerged and the
problem of understanding waterbird movements and linkages between sites is now
tractable, though expensive. The development of GPS data loggers small enough to be
attached to a waterbird has the potential to revolutionize our knowledge of the details of
waterbird movements within the Western Cape. In the ocean adjacent to my study area,
these data loggers have been attached to seabirds of similar sizes to the waterbirds; the
information retrieved from the GPS loggers applied to Bank Cormorants Phalacrocorax
neglectus (Ludynia 2010a), African Penguins Spheniscus demersus (Petersen 2006,
Ludynia 2010b) and Cape Gannets Morus capensis (Mullers et al. 2009) has not only
provided critical information about the biology of these species, it has also generated
recommendations essential for their conservation.

238
Concluding remarks
The mosaic of wetlands described in this thesis and the intra- and inter-abundance,
seasonality and conservation value of species all highlight the collective role that these
wetland sites play in supporting waterbird populations in the winter rainfall region.
Waterbirds are habitat-dependent organisms; their occurrence and abundance rely on
the quantity and quality of habitat that is available. Consequently, they are highly
adaptive and mobile and respond to changing site, landscape or environmental
conditions, often rapidly (Simmons et al. 1999, Hermann et al. 2004, Robledano and
Pagán 2006, Celdrán and Aymerich 2010). Some species are nomadic (e.g. Pied Avocet
and Black-winged Stilt) wandering around the landscape in short bursts in search of
favourable sites. Ultimately, they are a complex and diverse group of birds with varying
life histories and survival strategies which makes monitoring their populations often
challenging, particularly at landscape and global levels.
Physical changes at site level or within the landscape, changes waterbird
communities at various spatial scales, and coupled with regular phenological factors
(annual moult migrations) alter the dynamics of populations at local, regional and even
global scales. As such, the inter-connectivity and management of key wetland sites is
critical to the long-term conservation of waterbirds and their habitats (Haig et al. 1998,
Roshier et al. 2001), and why ongoing, long-term monitoring and regular conservation
value assessments are crucial in further understanding how and why waterbirds use
wetlands, not only in the winter rainfall region but at wider spatial and tighter temporal
scales.

239
References
Arinaitwe J 1995. Waterbirds in Uganda: towards the development of a national action plan. In: van Essem J (ed.) Determining priorities for waterbird and wetland conservation. Proceedings of Workshop 4 of the International Conference on Wetlands and Development held in Kula Lumpur, Malaysia, 9–13 October 1995. Wetlands International, Kuala Lumpur. pp.95–105.
Austin GE, Maclean IMD, Atkinson PW and Rehfisch MM 2006. The UK Waterbirds Alerts System. In: Boere GC, Galbraith CA and Stroud DA (eds). Waterbirds around the world. The Stationery Office, Edinburgh, UK pp. 711–716.
Boere GC and Lenten B 1997. The African-Eurasian Waterbird Agreement: a technical agreement under the Bonn Convention. In: van Essem J (ed.) Determining priorities for waterbird and wetland conservation. Proceedings of Workshop 4 of the International Conference on Wetlands and Development held in Kula Lumpur, Malaysia, 9–13 October 1995. Wetlands International, Kuala Lumpur. pp.47–56.
Burbidge AA and Fuller PJ 1982. Banded stilt breeding at Lake Barlee,Western Australia. Emu 82: 212–216.
Celdrán PF and Aymerich FR 2010. Structure and distribution of the waterbird community in the Mar Menor Coastal Lagoon (SE Spain) and relationships with environmental gradients. Waterbirds 33: 479–493.
Chambers LE, Hughes L and Weston MA 2005. Climate change and its impact on Australia’s avifauna. Emu 105: 1–20.
Chambers LE and Loyn RH 2006. The influence of climate variability on numbers of three waterbird species in Western Port, Victoria, 1973–2002. International Journal of Biometeorology 50: 292–304.
Dean WRJ, Barnard PB and Anderson MD 2009. When to stay, when to go: trade-offs for southern African arid-zone birds in times of drought. South African Journal of Science 105: 24–28.
De Villiers MS (ed). 2009. Birds and environmental change; building an early warning system in South Africa. SANBI, Pretoria.
Diagana CH, Dodman T and Sylla SI 2006. The African Waterbird Census (1991–2004): fourteen years of waterbird surveys in Africa. In: Boere GC, Galbraith CA and Stroud DA (eds). Waterbirds around the world. The Stationery Office, Edinburgh, UK pp. 457–458.
Dodman T and Diagana CH 2006. Conservation dilemmas for intra-African migratory waterbirds. In: Boere GC, Galbraith CA and Stroud DA (eds). Waterbirds around the world. The Stationery Office, Edinburgh, UK pp. 218–223.
Erwin, RM 2002. Integrated management of waterbirds: beyond the conventional. Waterbirds 25 (Special publication 2): 5–12.
Finlayson CM, Gita H, Bellio M, van Dam R and Taylor I. 2006. Climate variability and change and other pressures on wetlands and waterbids: impacts and adaptation.In: Boere GC, Galbraith CA and Stroud DA (eds). Waterbirds around the world. The Stationery Office, Edinburgh, UK pp. 88–97.
Fuller RJ and Glue DE 1980. Sewage works as bird habitats in Britain. Biological Conservation 17: 165–181.
Flather CH and Sauer JR 1996. Using landscape ecology to test hypotheses about large-scale abundance patterns in migratory birds. Ecology 77: 28–35.
Gentilli J and Bekle H 1983. Modelling a climatically pulsating population: Grey Teal in south-western Australia. Journal of Biogeography 10: 75–96.
Gibbs JP 1993. The importance of small wetlands for the persistence of local populations of wetland-associated animals. Wetlands 13: 25–31.

240
Gilissen N, Haanstra L, Delany S, Boere G and Hagemeijer W 2002. Numbers and distribution of wintering waterbirds in the western Palearctic and southwest Asia in 1997,1998 and 1999. Results from the International Waterbird census. Wetlands International Global Series No. 11, Wageningen, The Netherlands.
Haig SM, Melmahn DW and Oring LW 1998. Avian movements and landscape connectivity in landscape conservation. Conservation Biology 12: 749–758.
Harebottle DM 2005. The value of colour-ringing: the case of a Yellow-billed Egret Egretta intermedia in the southwestern Cape. Afring News 34: 20.
Harebottle DM, Jackson C and Oschadleus HD 2005. Wader ringing in coastal Kenya - results and overview from the first AFRING waterbird ringing course. Wader Study Group Bulletin 106: 55–57.
Harebottle DM and Gibbs D 2006. At what age do African Sacred Ibis breed? Promerops 265: 13.
Harebottle DM and Underhill LG 2006. The Arctic connection: monitoring coastal waders in South Africa, a case study. In Boere GC, Galbraith CA and Stroud DA (eds). Waterbirds Around the World. The Stationary Office, Edinburgh: 138–139.
Harrison JA, Williams AJ, MacIver M 2010. Breeding site selection by colonial waterbirds given various combinations of constructed or natural alternatives over a 10-year period. Ostrich 81: 197–203.
Hermann E, Anderson MD and Seaman M 2004. Occurrence and abundance of waterbirds at an ephemeral pan in the Northern Cape Province, South Africa. Ostrich 75: 275–284.
Immelman K. 1970 Environmental factors controlling reproduction in African and Australian birds–a comparison. Ostrich Supplement 8: 193–204.
Kuijken E 2006. A short history of waterbird conservation. In: Boere GC, Galbraith CA and Stroud DA (eds) Waterbirds Around the World. The Stationery Office, Edinburgh, UK. pp. 52–59.
Lank DB and Nebel S. 2006. Cross-cutting research on a flyway scale – beyond monitoring. In: Boere GC, Galbraith CA and Stroud DA (eds). Waterbirds around the world. The Stationery Office, Edinburgh, UK pp. 107–112.
Little RM, Vester KC and Crowe TM. 1995. Temporal and spatial pattersn of breeding activity of 12 duck species (Anatidae) in the Cape Provinces, South Africa, and their implications for conservation. South African Journal of Wildlife Research 25: 17–22.
Ludynia K, Jones R, Kemper J, Garthe S and Underhill LG 2010a. Foraging behaviour of Bank Cormorants in Namibia: implications for conservation. Endangered Species Research 12: 31–40.
Ludynia K, Roux J-P, Jones R, Kemper J and Underhill LG 2010b. Surviving off junk: low-energy prey dominates the diet of African Penguins Spheniscus demersus at Mercury Island, Namibia, between 1996 and 2009. African Journal of Marine Science 32: 563–572.
Ma Z, Li B, Zhao B, Jing K, Tang S and Chen J 2004. Are artificial wetlands good alternatives to natural wetlands for waterbirds? – A case study on Chongming Island, China. Biodiversity and Conservation 13: 333–350.
Midgley GF, Chapman RA, Hewitson B, Johnston P, De Wit M, Ziervogel G, Mukheibir P, Van Niekerk L, Tadross M, Van Wilgen BW, Kgope B, Morant PD, Theron A, Scholes RJ and Forsyth GG 2005. A Status Quo, Vulnerability and Adaptation Assessment of the Physical and Socio-economic Effects of Climate Change in the Western Cape. CSIR, Stellenbosch.
Mullers RHE, Navarro RA, Daan S, Tinbergen JM and Meijer HAJ 2009. Energetic costs of foraging in breeding Cape Gannets Morus capensis. Marine Ecology Progress Series 393: 161–171.
Niemuth ND and Solberg JW 2003. Response of waterbirds to number of wetlands in the prairie pothole region of North Dakota, U.S.A. Waterbirds 26: 233–238.

241
Oatley TB and Prŷs-Jones RP 1986. A comparative analysis of movements of southern African waterfowl based on ringing recoveries. South African Journal of Wildlife Research 16: 1–6.
Oschadleus HD 2005. Moult in southern African Weavers Ploceidae. Unpublished PhD thesis. University of Cape Town.
Paracuellos M 2006. How can habitat selection affect the use of a wetland complex by waterbirds? Biodiversity and Conservation 15: 4569–4582.
Paracuellos M and Tellería JL 2004. Factors affecting the distribution of a waterbird community: the role of habitat configuration and bird abundance. Waterbirds 27: 446–453.
Petersen SL, Ryan PG and Grémillet D 2006. Is food availability limiting African Penguins Spheniscus demersus at Boulders? A comparison of foraging effort at mainland and island colonies. Ibis 148: 14–26.
Petrie SA and Rogers KH 1997. Satellite tracking of White-faced Whistling Ducks in a semi-arid region of South Africa. Journal of Wildlife Management 64: 1208–1213.
Raeside AA, Petrie SA and Nudds TD 2007. Waterfowl abundance and diversity in relation to season, wetland characteristics and land-use in semi-arid South Africa. African Zoology 42: 80–90.
Robledano F and Pagán I 2006. Waterbirds as indicators of agricultural intensification: Local response to effluents in the Mar Menor Lagoon, southeast Spain. Journal of Ornithology 147 suppl. 238.
Roshier DA, Robertson AI, Kingsford RT and Green DG 2001. Continental-scale interactions with temporary resources may explain the paradox of large populations of desert waterbirds in Australia. Landscape Ecology 16: 547–556.
Roshier DA, Robertson AI and Kingsford RT 2002. Responses of waterbirds to flooding in an arid region of Australia and implications for conservation. Biological Conservation 106: 399–411.
Schlatter RP, Navarro RA and Corti P 2002. Effects of El Niño Southern Oscillation on numbers of Black-necked Swans at Río Cruces Sanctuary, Chile. Waterbirds 25 (Special Publication 1): 114–122.
Schulze RE 1997. Climate. In: Cowling RM, Richardson DM and Pierce SM (eds) Vegetation of Southern Africa. Cambridge University Press, Cambridge. pp. 21–42.
Siegfried WR 1967. Trapping and ringing of Egyptian Geese and African Shelduck at Vogelvlei, Cape. Ostrich 38: 173–185.
Siegfried WR 1970. Wildfowl distribution, conservation and research in southern Africa. Wildfowl 21: 89–98.
Simmons RE, Barnard P and Jamieson IG 1999. What precipitates influxes of wetland birds to ephemeral pans in arid landscapes? Observations from Namibia. Ostrich 70: 145–148.
Simmons R, Barnard P, Dean WRJ, Midgley GF, Thuiller W and Hughes G 2004. Climate change and birds: perspectives and prospects from southern Africa. Ostrich 75: 295–308.
Stroud DA, Boere GC, Galbraith CA and Thompson D. 2006. Waterbird conservation in a new millennium-where from and where to? In: Boere GC, Galbraith CA and Stroud DA (eds). Waterbirds around the world. The Stationery Office, Edinburgh, UK pp. 29–39.
Taft OW and Haig SM 2006. Importance of wetland landscape structure to shorebirds wintering in an agricultural valley. Landscape Ecology 21: 169–184.
Tourenq C, Bennetts CE, Kowalski H, Vialet E, Lucchesi JL, Kayser Y and Isenmann P 2001. Are ricefields a good alternative to natural marshes for waterbird communities in the Camargue, southern France? Biological Conservation 100: 335–343.
Traut AH and Hostetler ME 2004. Urban lakes and waterbirds: Effects of shoreline development on avian distribution. Landscape and Urban Planning 69: 69–85.

242
Tori GM, McLeod S, McKnight K, Moorman T and Reid FA 2002. Wetland conservation and Ducks Unlimited: real world approaches to multispecies management. Waterbirds (Special Publication 2): 115–121.
Tyson PD 1986. Climatic Change and Variability in Southern Africa. Oxford University Press, Cape Town.
Underhill LG 1987. Waders (Charadrii) and other waterbirds at Langebaan Lagoon, South Africa, 1975–1986. Ostrich 58: 145–155.
Underhill LG, Tree AJ, Oschadleus HD and Parker V 1999. Review of Ring Recoveries of Waterbirds in Southern Africa. Avian Demography Unit, University of Cape Town, Cape Town.
Wetlands International 2006. Waterbird Population Estimates, 4th edition. Wetlands International Global Series 12. Wetlands International, Wageningen.
Whitehead PJ and Saalfeld K 2000. Nesting phenology of magpie geese (Anseranas semipalmata) in monsoonal northern Australia: responses to antecedent rainfall. Journal of Zoology 251: 495–508.
Woodhall PF 1985. Waterbird populations in the Brisbane region, 1972–83, and correlates with rainfall and water heights. Australian Wildlife Research 12: 495–506.
Winterbottom JM and Rowan MK 1962. Effect of rainfall on breeding of birds in arid areas. Ostrich 33: 77–78.
Zaloumis EA 1993. Towards a conservation action plan for waterbirds in southern Africa. In: Moser M, prentice RC and van Essem J (eds). Waterfowl and wetland conservation in the 1990s – a global perspective. International Waterfowl Research Bureau Special Publication No. 26, Slimbridge.
Zaloumis EA and Milstein P le S 1975. The conservation of wetland habitats for waterfowl in southern Africa. Supplement to African Wildlife 29(1).
Zöckler C 2002. Declining Ruff Philomachus pugnax populations: a response to global warming? Wader Study Group Bulletin 97: 19–29.

243
APPENDICES

244

245
Appendix A
Waterbirds at Paarl Waste Water Treatment Works,
South Africa, 1994–2004: seasonality, trends and
conservation importance

246

247
Abstract
The numbers of waterbirds at Paarl Waste Water Treatment Works, South Africa were
counted monthly from May 1994 to April 2004. Seventy-two waterbird species were
recorded, of which 33 species (46%) were recorded breeding. Mean summer and winter
counts were 2 822 ± 504 and 1 651 ± 251 birds, respectively. Summer peaks were driven
primarily by large numbers of White-winged Terns (mean summer count = 858 or 34% of
total count). Resident species dominated from December to April, whereas Palearctic
migrants peaked from December to March. Ducks and geese had greatest numbers from
December to April and resident waders and grebes peaked from April to July. Flamingos
peaked in October and November with another small peak in June. Gulls and terns had
two peaks, one in November–March, driven by migrant White-winged Terns, the other in
July and August, driven by abundance of resident Hartlaub’s Gulls. White-winged Terns
showed the greatest decline (82%) of all species. Influx of Little Grebe and Red-billed
Teal during winter showed a positive correlation with rainfall, while Egyptian Goose,
Yellow-billed Duck and Cape Shoveler numbers declined as winter and spring rainfall
increased. Paarl Waste Water Treatment Works ranked as the second-most important
wastewater treatment works for waterbirds in the Cape Town metropole. It supported
globally and regionally important numbers of nine species and qualifies as a global
and/or subregional Important Bird Area and Ramsar Site.
Plate A.1 View looking northwards from the bird hide overlooking pond B (see Figure A.1)

248
Introduction
Globally, and particularly in urbanised areas, human activity has caused the loss of
substantial areas of natural wetlands. The establishment of artificial wetlands provides
partial compensation for such losses (Masero 2003, Ma et al. 2004). The largest artificial
wetlands in many metropolitan areas are ‘wastewater treatment works’ (WWTW),
initially created as sewage works with adjacent settling ponds but now often retained for
flood attenuation. WWTW are shallow (mean depths usually less than 3 m), nutrient
enriched, and are sustained as permanent wetlands with water levels that are more
stable than those of natural wetlands. These features make WWTW attractive to
waterbirds (e.g. Fuller and Glue 1980, Hamilton et al. 2005), many species of which
occur in numbers that are of conservation importance (e.g. Kalejta-Summers et al.
2001b, Hamilton et al. 2004).
The Paarl Waste Water Treatment Works (hereafter termed Paarl WWTW) is
located in the interior regions of the winter rainfall region (WRR) in South Africa; the
latter is described in detail in Chapter 1. Within the WRR many small, shallow wetlands
become inundated following winter rains. These dry out during the summer and
waterbirds that exploit them are forced to move to larger, permanent wetlands (cf.
Winterbottom 1960, Kingsford and Norman 2002, Williams et al. 2002). However, most
of the region’s large natural wetlands are also ephemeral and either dry out annually
(e.g. Rocher Pan (Appendix C) or, for various reasons, undergo hydrological and/or
vegetational changes on an irregular, interannual basis (e.g. Jakkalsvlei, Bot River
Estuary (Chapter 4) and De Hoop Vlei (Appendix D)).
There have been substantial changes to wetlands within the WRR during the
past 200 years. Marshy areas have been drained for agriculture, reservoirs have been
built in mountainous areas to service towns and to supply water for irrigation, human-
related changes in water flow have altered the dynamics of estuary/lake wetlands (e.g.
Bot River Estuary; van Niekerk et al. 2005; Chapter 4) and, increasingly, groundwater
extraction is threatening shallow ephemeral wetlands (e.g. Wadrif Saltpan; Williams et
al. 2002). In the light of the continued degradation of the region’s natural wetland
habitats, artificial wetlands, especially the larger WWTW, have become increasingly
important in sustaining regional populations of waterbirds (e.g. Cape Flats WWTW;
Ashkenazi 2001, Kalejta-Summers et al. 2001b).
The number of waterbirds at the Paarl WWTW has been counted monthly since
May 1994 and here I analyse the results for the 10-year period 1994–2004. No previous
analyses of waterbirds have been undertaken at this locality. The aims of the study were
(1) to highlight the importance of Paarl WWTW for particular waterbird species relative

249
to their numbers on global (Ramsar threshold), subregional (IBA threshold), provincial
(Western Cape Province, South Africa) and local (Greater Cape Town Metropolitan Area,
hereafter termed Cape Town metropole) levels; (2) to emphasise the importance of an
artificial wetland for biodiversity conservation and as partial compensation for the
earlier regional losses of natural wetlands and floodplains, especially so in metropolitan
areas; and (3) to provide insights into the needs and movements of waterbirds at
regional, annually ephemeral or irregularly ephemeral wetlands by assessing the
seasonal pattern of use of species at this stable water-level wetland.
Study area
Paarl WWTW (33°40′ S, 18°58′ E) is situated between the towns of Paarl and Wellington,
c. 50 km east of Cape Town. It is bordered to the west by the Berg River and to the east
by the Cape Town–Johannesburg railway line, and lies within the WRR of the Western
Cape (Figure A.1). The works are located on the eastern boundary of the Cape Town
metropole, defined here as the area within a 50 km radius of Cape Town (Figure A.1).
The treatment works is located next to an industrial area and the Mbekweni informal
settlement; the latter was established during 1996. Paarl WWTW was constructed in the
1930s and has subsequently expanded intermittently in size and thus sewage-handling
capacity. Settling and maturation ponds were added in the 1960s and were modified in
1979 when islets were constructed on three of the maturation ponds. After 1992, when a
sludge treatment plant was opened, the maturation ponds were decommissioned and
treated effluent was discharged directly into the Berg River, bypassing the maturation
ponds. However, if the river rises above the effluent outlets and prevents discharge,
effluent is diverted to the maturation ponds. These occurrences are irregular and of
short duration, but can result in nutrient renewal.
Aquatic habitats at Paarl WWTW consist of an aeration pond (2.2 ha), final
effluent pond (3.8 ha), waste sludge pond (4.2 ha), five maturation ponds (58.1 ha) and a
network of furrows (Figure Ab). The aeration, effluent and sludge ponds are all steep
sided and are c. 3.5 m deep. The maturation ponds (A1, A, B, C and D) range in size from
3.0 ha (Pond A1) to 28 ha (Pond C), are up to 2 m deep and comprise mainly open water
with fringing emergent vegetation (mainly Bullrush Typha capensis); these ponds have
been officially designated as the Paarl WWTW Bird Sanctuary (see Figure A.1b, Plate
A.1) and received about 5 000 visitors in 2004 (C Morkel pers. comm.). Small trees (Port
Jacskon Acacia saligna, Eucalyptus spp. and Olea spp.) grow on the islets and some are
used for breeding by ardeids, cormorants and African Darter. The maturation ponds

250
support two freshwater fish species: Carp Cyprinus spp. and Tilapia Oreochromis
mossambicus, the latter introduced in the late 1980s.
Methods
Counts of waterbirds were carried out monthly between May 1994 and April 2004.
Between May 1994 and October 2000 counting was done in the afternoon (1500–1730).
From November 2000 to April 2004 surveys were done in the morning (0900–1130). For
most species of waterbirds this change would have had minimal effect because, although
birds move between different areas within the site, few birds move into or away from
Paarl WWTW during the day (AJ Williams and Y Weiss pers. obs.). Counts were
recorded for individual ponds and furrows but for the purpose of this analysis counts
have been pooled.
Waterbirds and waterbird groups are defined in Chapter 1 and species are drawn
from the list provided in Appendix 1.3 of Chapter 1 and based on Hockey et al.(2005).
Data analyses were restricted to those species which were recorded on more than 25% of
counts and in numbers that exceeded 10 individuals. These species described most of the
variability at the wetland and revealed discernable patterns and trends. In some cases
species have been included that do not meet these criteria as they show interesting
patterns. For the analyses I focused on the resident species since little is known about
their patterns of occurrence and movements.
Overall abundance, seasonality, and inter-annual variation analyses were
undertaken. Overall abundance was assessed using basic statistics (mean, standard
deviation, minimum, maximum). Seasonal analyses were based on the occurrence status
of species (resident or migrant), and carried out for individual species, species groups
and feeding guilds (where applicable) (Appendix 1.3). Linear regression models were
used to test for statistically significant trends and only species showing significant
positive or negative trends are displayed graphically.
The conservation importance of Paarl WWTW was assessed based on the
Waterbird Conservation Value (WCV) score described in Chapter 2. Scores were
computed and interpretations made based on methods outlined in Chapter 2; values of
10 or more were interpreted as being of conservation significance for the site but this
was carefully interpreted on the basis of the number of species that reached or surpassed
the 1% threshold level. In addition, an overall site score was calculated which was based
on the computation of the minimum, lower quartile, median, upper quartile and
minimum. Both monthly and site WCV scores were calculated from surveys during the

251
study period. Where a 1% level was not available this value was omitted from the
calculation.
In addition to the WCV scores, I assessed sub-regional importance and used the
0.5% index based on the sub-regional IBA thresholds in Barnes (1998) (Appendix 1.4,
Chapter 1). To gauge the site’s significance at a provincial and local level I computed the
percentage that the maximum count of each species contributed to the Western Cape
and Cape Town metropole population estimates; only species comprising 5% or more for
either or both population thresholds were deemed important. These population estimates
were generated from the CWAC dataset (Animal Demography Unit, unpubl. data) for the
period 1992–2006 and based on the sum of the maxima of each species across all
wetlands in the Western Cape that were surveyed for CWAC (Appendix 1.4, Chapter 1).
A subset of these sites were then selected to calculate the populations estimates for
species in the Cape Town metropole.
The relationship between seasonal rainfall and waterbird abundance for species
and for groups of months was also examined. I correlated the sums of monthly rainfall
totals with the sums of the count for the selected waterbird species over the same period;
all linear regressions were based on a sample size of 10, unless otherwise indicated.
Rainfall data were obtained from the South African Weather Service’s recording station
located 4 km south of Paarl WWTW.
Breeding records obtained incidentally during the counts were used to describe
the seasonality of species breeding at the works, and included the species breeding on
the islets. A species was confirmed breeding if eggs or young were seen in a nest, an
adult bird was observed incubating, or, in the case of species using hidden nests,
precocial young (e.g. ducklings) were seen with adults. Results are expressed as the
number of breeding pairs per month.
Results and species-level discussion
Species richness and overall abundance
During the 10-year study period, 80 summer and 40 winter surveys were conducted.
Seventy-five species of waterbirds were recorded, of which 20 (27%) were recorded in
25% or less of all the surveys (Table A.1). The mean number of species recorded was
similar in summer (38) and winter (36). The mean number of waterbirds was 74%
greater during summer (2 967.6 ± 504.4) than during winter (1 700.9 ± 250.5)
(Table A.2). This difference was due primarily to three species — the Egyptian Goose,
White-winged Tern and Hartlaub’s Gull — which together formed 56% of the number of
waterbirds in summer. In winter, five species formed, on average, 58% of the total

252
population. These species were Hartlaub’s Gull, Egyptian Goose, Black-winged Stilt and
Little Grebe. The mean number of waterbirds counted per month ranged between 1380
in September and 3532 in January. The highest single count was of 5364 birds in
January 1995.
Resident waterbirds
Generally, numbers of resident species increased from September–December, peaked
from January to April and decreased between May and August (Figure A.2). In summer,
Egyptian Goose, Hartlaub’s Gull and African Sacred Ibis were numerically dominant
accounting for 24%, 13% and 7%, respectively, of the resident waterbird population
(Table A.2). Hartlaub’s Gull, Egyptian Goose, Black-winged Stilt and Little Grebe were
the most abundant resident species during winter comprising 18%, 13%, 12% and 10%,
respectively, of all waterbirds (Table A.2).
Waterfowl
The Egyptian Goose was numerically the dominant waterbird species at Paarl WWTW.
Within the WRR this species breeds mainly in August–September (Hockey et al. 1989)
when spring grass is available for their goslings. Numbers of geese at Paarl WWTW
increased in December/ January and remained high (maximum 1341 in January 2001)
until the onset of winter rains when there was a rapid dispersal away from the site
(Figure A.3), presumably to recently filled ephemeral wetlands and farmlands (Maclean
1997a). The maximum number of breeding records was five broods seen in September
(Table A.3). The number of geese using Paarl WWTW increased significantly through the
10-year period in both summer and winter (summer r = 0.75, p < 0.05; winter r = 0.86,
p < 0.01; Figure A.4), and the numbers during the summer counts doubled over the
decade. Spur-winged Goose, far less numerous (x = 7, maximum 118; Table A.2), also
showed a statistically significant increase (r = 0.79, p < 0.01) in numbers during the
summer months at Paarl WWTW (Figure A.4); numbers increased from an average of
four birds from 1994–1998 to 16 from 1999–2003.
Cape Shoveler (x = 50, maximum 235) was the most abundant duck at Paarl
WWTW (Table A.2). It showed a strong seasonal pattern; numbers peaked from October–
December and declined from February–June (Figure A.3). This species showed a
significant downward trend (r = –0.63, p < 0.05) during summer (Figure A.4). Yellow-
billed Duck (x = 33, maximum 121) numbers peaked during late summer (March–April)
and remained relatively constant throughout the rest of the year (Figure A.3). Winter
populations increased from a mean of ten birds during 1994–1996 to 35 birds between

253
1997–2003. Red-billed Teal (x = 29, maximum 151) numbers peaked during winter
(June–July). Summer populations showed a significant decline (r = –0.65, p < 0.05) with
large fluctuations displayed during winter. The number of Cape Teal (x = 22, maximum
85) tended to peak in late summer (February–April), although the maximum count for
this species was recorded in June. Population levels remained relatively constant during
summer and winter (x = 21 birds), except from winter 1997 to summer 1999 when
averages of 35 birds were recorded. Maccoa Duck usually occurred in small numbers
(<15 birds; Table A.2) but did exhibit sporadic peaks in January 1995 (71 birds),
February 1995 (56 birds) and June 2003 (215 birds). Significant downward trends
(r = –0.83, p < 0.01) during summer were evident for this species (Figure A.4). Southern
Pochard occurred mainly from mid-winter (July) to early summer (November) (Figure
A.3); a peak of 148 was recorded in October (Table A.2). A single pair bred at Paarl
WWTW during September (Table A.3). Numbers in the summer-rainfall region increase
in November and breeding occurs there between November and February (Maclean and
Harrison 1997). Between December and June less than 10 birds, on average, occurred at
Paarl WWTW (Figure A.3) suggesting that at least some pochards are migratory. The
number of pochards at Paarl WWTW dropped markedly from peak counts of 148 and 80
in 1994 and 1995, respectively, to peaks of less than 50 birds thereafter.
Numbers of Red-knobbed Coot peaked in October– November (Figure A.3;
maximum 260) and Common Moorhen from February to April (maximum 163).
Significant downward trends during summer were evident for both Common Moorhen
(r < –0.81, p < 0.01) and Red-knobbed Coot (r < –0.63, p < 0.05); declining winter trends
were evident only for Common Moorhen (r = –0.89, p < 0.01) (Figure A.4).
Little Grebe (maximum 433) was more abundant at Paarl WWTW during winter
(x = 170) than summer (x = 109; Figure A.3). Peak breeding occurs in mid-summer
(November– January) in the WRR (Hockey et al. 1989) and their winter influx could be
related to pre-breeding flocking in which pair formation begins prior to the start of
spring breeding (del Hoyo et al. 1992). Since numbers generally declined from November
to January (Figure 3) it suggests that Little Grebes disperse from Paarl WWTW and
possibly move to summer-rainfall areas when flooding of ephemeral pans occurs during
this time (Dean 1997). In the absence of ringing recoveries in southern Africa
(D Oschadleus in litt.), the pattern of occurrence of the Little Grebe at Paarl WWTW
seems to suggest that it undertakes regular movements within southern Africa.
Numbers of Black-necked Grebe, maximum 131 in June 1995, peaked from June
to September, and generally fewer than 10 birds were present in other months
(Figure A.3). A winter influx of Black-necked Grebes to the winter-rainfall wetlands is

254
well established (Boshoff et al. 1991, Dean and Underhill 1997). Prior to and during the
first two years of the surveys, Black-necked Grebes bred at the Vlakkeland ponds, 3 km
to the north-east of Paarl WWTW (GB Tong pers. comm.) and in 1994 eggs were noted at
this wetland during August, September and November. These Vlakkeland ponds were
constructed in 1964 and used as final maturation ponds for effluent water from Paarl
WWTW. After the construction of the activated sludge pond (E1) they were drained in
1995. Black-necked Grebes breed from October to November in the WRR (Dean and
Underhill 1997), a time when numbers at Paarl WWTW are usually low (less than10
birds on average). In light of the absence of breeding records from the works, Black-
necked Grebes most likely found other breeding localities during this time; the closest
known breeding locality to Paarl WWTW is Strandfontein Waste Water Treatment
Works (Ashkenazi 2001), 60 km south west of Paarl.
Seasonal variation of waterfowl at Paarl Waste Water Treatment Works
The influx and peak abundance of Egyptian Goose, Spur-winged Goose, Yellow-billed
Duck and Cape Shoveler during spring and summer indicates their need for a post-
breeding, dry-season refuge. Although some birds used the works for breeding (Table
A.3), the general decrease in their numbers during winter and spring indicated that
most birds bred elsewhere, utilising temporary wetlands that filled during the winter.
Following breeding, as temporary water bodies dried out, the permanent water provided
by Paarl WWTW acted as a refuge for these species (Maclean 1997a, b, c). For Egyptian
and Spur-winged Goose, the works was also used as a moulting site (DMH pers. obs), the
deep water ponds providing the safe habitat required for them to moult. Cape Teal,
Maccoa Duck, Red-knobbed Coot and Common Moorhen showed no clear seasonal
patterns but exhibited periods during which numbers peaked (usually during summer)
suggesting they were mostly sedentary species with only sporadic movements.
Little Grebe and Red-billed Teal were the only waterfowl species that showed
strong winter peaks. Breeding peaks for Red-billed Teal in the WRR occurs from August
to October (Maclean 1997d) and winter influxes probably reflected prenuptial flocking
associated with peak rainfall in the WRR. In contrast, winter peaks for Little Grebe
confirmed large-scale immigration into Paarl WWTW after breeding. The decline in
numbers of most waterfowl in early winter coincided with the onset of winter rain,
particularly for Yellow-billed Duck and Cape Shoveler (see below).
Relationship with rainfall
In southern Africa, waterfowl occurrence patterns are usually related to the species’
annual cycle and rainfall (Rowan 1963, Siegfried 1965a, b, Heÿl 1993, Little et al. 1995).

255
At Paarl WWTW, the occurrence of several waterfowl species varied according to rainfall
patterns. For Egyptian Goose, patterns varied between years; when the total rainfall
between May and July was high (i.e. early onset of winter rain) the dispersal from Paarl
WWTW was earlier than in years when the onset of winter rains was late
(r = –0.84, p < 0.05; Figure A.5). Similarly, the return of geese to Paarl WWTW was
earlier when the immediate postbreeding period was relatively dry and later when it was
wet (r = 0.65, p < 0.05), presumably because increased grazing available for the geese
after wetter winters enabled them to delay their return to Paarl WWTW. Cape Shoveler
tended to disperse earlier than other ducks and showed a strong correlation
(r = –0.63, p < 0.05) with the amount of rainfall during winter (June–August); numbers
were higher and birds remained longer at Paarl WWTW during years in which winter
rains were lower, than in years in which rainfall was higher and birds dispersed
earlier (Figure A.5).
Yellow-billed Duck dispersed later than Cape Shoveler, and this species tended to
be present at the wetland in early summer (September–November), particularly when
rainfall was higher (r = –0.81, p < 0.001; Figure 5). In the WRR, both species breed from
July to December (Hockey et al. 1989), and their dispersal is most likely linked to their
movement to breed at temporary wetlands that were inundated during winter. The
timing of the movement is triggered by the extent of rainfall during winter, and this
proximate factor stimulates the birds’ physiological condition to breed (Winterbottom
and Rowan 1962, Halse and Jaensch 1989). Like Cape Shoveler, Red-billed Teal showed
a strong correlation (r = 0.86, p < 0.001) with rainfall during winter (June–August).
However, this relationship was related to influxes to, and not dispersal from, Paarl
WWTW; increased abundance occurred earlier in years that had wetter winters
(Figure A.5).
Increases in the numbers of Little Grebe showed the strongest correlation
(r = 0.83, p < 0.001) with late winter (July–September) rains; more birds arrived during
this period when rainfall was higher (Figure A.5). This result suggests that birds move
in from surrounding flooded landscapes at a time when most of the ducks have dispersed
and probably allows the Little Grebe to occupy an almost vacant ‘open water’ niche at
Paarl WWTW. These results showed that rainfall influences the arrival and/or dispersal
of waterfowl at Paarl WWTW and support Maclean’s (1976) and Little et al.’s (1995)
hypothesis that the timing of breeding in southern African ducks is in response to
rainfall.
The link with rainfall variability helps explain both the seasonal occurrence of
these species at the works and the interannual variations in occurrence, and

256
demonstrates that environmental cues play an important role in the ecology of waterfowl
populations, even at a local scale (Braithwaite and Stewart 1975). Kingsford (1989) and
Lawler and Briggs (1991) similarly found that rainfall events initiated breeding and
influenced movements in Maned Ducks Chenonetta jubata in eastern Australia, and
Halse and Jaensch (1989) demonstrated that rainfall acts as the most important
proximate cue for waterbird breeding in south-western Australia, an area climatically
similar to the WRR.
Colonial breeders
Paarl WWTW supported 13 species of colonially breeding waterbirds, including 10 at the
heronry on the islet in pond D (Table A.3). These we divided into three groups, namely
cormorants and darter, large wading birds and gulls.
Cormorants and darter
This group comprised three species: White-breasted Cormorant, Reed Cormorant and
African Darter. White-breasted Cormorants predominated during winter (Figure A.3)
with a maximum of 93 recorded in June 2002; numbers declined between October and
January. They initially (from 1988) bred on large Eucalyptus spp. trees overhanging
pond D on the western shoreline, though some birds used the heronry on the islet in
pond D (Y Weiss pers. comm.). The shoreline colony came under progressively increasing
human disturbance by wood-cutters from the Mbekweni informal settlement. These
birds, together with the birds that attempted to breed in the heronry, moved to pond A
where they bred on dead Pinus and Acacia trees erected by management on an islet in
the pond (AJ Williams pers. comm.). The maximum number of concurrent active nests
was 40 (Table A.3). Nest sites were occupied throughout the year — probably indicating
a shortage of suitable sites in the region — but most breeding occurred between May and
July. Winter breeding is characteristic of this species across sub-Saharan Africa
(Childress and Bennun 2001, VL Ward and AJ Williams unpubl. data). Reed Cormorants
were most abundant from October to January (Figure A.3) with a maximum of 183
recorded in January 1995. Similarly, African Darters occurred mainly from November to
February (Figure A.3), with a maximum of 89 recorded in January 2000. Both species
bred in trees (Eucalyptus spp.) on the islet in pond D between October and February,
with with maxima of 49 nests for Reed Cormorants and 26 nests for African Darters
(Table A.3). Numbers of both species declined during winter (Figure A.3) indicative of
postbreeding dispersal. Reed Cormorants showed significantly downward trends during
summer (r = –0.65, p < 0.05).

257
Large wading birds
Eight species of waders bred on trees on the islet in pond D (maximum observed nest
counts are given): Cattle Egret (132 nests), African Sacred Ibis (63 nests), Black-headed
Heron (21 nests), Grey Heron (19 nests), Yellow-billed Egret (12 nests), Little Egret
(12 nests), Black-crowned Night-heron (12 nests) and African Spoonbill (8 nests) (Table
A.3). The time of nest initiation and breeding was staggered; Black-headed Heron, Grey
Heron and African Spoonbill began breeding in July/August, Black-crowned Night-Heron
in August/September, Yellow-billed Egret in September, Cattle Egret in October and
Little Egret and African Sacred Ibis in November. Breeding for all species was completed
by February. Over the 10 years, there were statistically significant increasing trends in
numbers for African Spoonbill in summer (r = 0.77, p < 0.01) and Cattle Egret in winter
(r = 0.74, p < 0.05).
Gulls
The number of Hartlaub’s Gulls was highest between July and September, while Grey-
headed Gulls peaked between May and December (Figure A.3). Hartlaub’s Gulls
(x = 274 birds) were present throughout the year but Grey-headed Gulls (x = 20 birds)
were virtually absent from Paarl WWTW between January and April (Figure A.3). I
suggest that the latter are intra-African migrants (see above). Both species showed
significant (r = –0.77, p < 0.01) decreasing trends in winter (Figure 4). The maximum
recorded number of Hartlaub’s Gull nests in any one year was 10 (Table A.3); a similar
number (c. 10 pairs, AJ Williams pers. comm.) have bred at the Wellington WWTW,
c. 4 km away. Paarl WWTW is one of the 15 recorded Grey-headed Gull breeding
localities in the WRR (Brooke et al. 1999; DMH pers. obs.) with a maximum of 35 nests
in 1997 (Table A.3). The Grey-headed Gulls bred near emergent vegetation, whereas the
Hartlaub’s Gulls bred at more exposed terrestrial sites (DMH pers. obs.). There was no
evidence of mixed pairs (i.e. males and females pairing from the two species) as is known
for some coastal localities (Sinclair 1977, Williams 1989).
Flamingos
Numbers of Greater and Lesser Flamingos, with maxima of 267 and 1200, respectively,
showed wide fluctuations; both species were most abundant from October to November
(Figure A.3). The Lesser Flamingo was the only intra-African migrant species for which
numbers declined significantly during the study (r = –0.75, p < 0.05; Figure A.4); no
birds were recorded after October 1999. This reflected major changes in pools at the

258
Wellington leather tannery (8 km north of Paarl WWTW) where Spirulina-dominated
pools formerly supported feeding Lesser Flamingos (Spottiswoode and Underhill 1994,
AJ Williams pers. comm.) that then roosted at Paarl WWTW.
Shorebirds
Five resident species of shorebirds occurred at Paarl WWTW. Black-winged Stilt were
most numerous during the winter (Figure A.2) with a maximum count of 527 in May
2001. These winter influxes were probably related to birds congregating after breeding
(Table A.3) and rainfall. From March to May increases in abundance were correlated
(r = 0.65, p < 0.05) with the timing of rainfall; birds arrived earlier in years with higher
rainfall than in drier autumns. Summer populations remained stable from 1994/95 to
2001/02, but showed signs of a decline from 2002/03 to 2003/04; winter populations
fluctuated widely (Figure A.4). Most gathered round the aeration ponds (i.e. pond 1;
Figure A.1) where they apparently fed on sewage-fly larvae (Psychodidae), a resource
also utilised by White-winged Terns. A maximum of five pairs bred at Paarl WWTW in
early summer (Table A.3); decreases in August–September suggested that most stilts
dispersed to breed at other ephemeral wetlands at the end of the winter rains.
Blacksmith Lapwing, maximum 327 in January 2004, were most numerous
during the summer (x = 80 birds), peaking in January (Figure A.3). There was a
significant upward trend in summer numbers during the study period (r = 0.72, p < 0.05,
Figure A.4). Some bred at Paarl WWTW (maximum four pairs in July/August), but based
on the decrease in numbers during winter and their known winter breeding peaks in the
WRR (Hockey et al. 1989) it appears as if most birds disperse to alternative feeding and
breeding areas during this time. Within the works, the Blacksmith Lapwings preferred
the irrigated lawns around the sewage treatment plant. Paarl WWTW is one of only two
sites in the Western Cape (the other being Rietvlei Wetland Reserve [Kalejta-Summers
et al. 2001a]) that supports more than 300 Blacksmith Lapwings; this figure represents
6% of the estimated provincial population and 13% of the Cape Town metropole
population (Table A.4, Figure 1.5, Chapter1). The species has undergone a large range
expansion and population increase in the Western Cape since it was first recorded
breeding in this province in 1947 (Underhill 2004).
Water Thick-knee (x = 6 birds, maximum 22 birds in March 2002) were most
numerous during early winter (April–June). Their numbers showed significant upward
trends in both summer (r = 0.88, p < 0.01) and winter (r = 0.77, p < 0.01) during the
study period but numbers were small. This increase is probably due to the availability of
suitable habitat (bare, stony ground with short grass) at Paarl WWTW. They bred at the

259
works (a nest in September; Table A.3). Three-banded Plover (maximum 85 in
September 1995) and Kittlitz’s Plover (maximum 75 in April 1999) peaked in abundance
during winter (May–August) (Table A.2, Figure A.3). The winter increases suggest
immigration from outside of Paarl WWTW. Both species bred in small numbers at the
works during spring and summer (Table A.3), but juvenile recruitment did not account
for the influxes recorded during winter. Although the abundance of Three-banded
Plovers was generally higher in winter, their numbers in winter declined (r = –0.87,
p < 0.01) during the study period (Figure A.4). Numbers of Kittlitz’s Plover increased
from less than 10 to more than 25 birds between 1998 and 2002 in both summer and
winter, but showed declines after winter 2002 (Figure A.4).
Pied Avocets, maximum 218 in December 1997, were most numerous between
November and February. Fewer than four birds occurred in other months. None bred at
Paarl WWTW but the peak occurrence there followed spring breeding (Hockey et al.
1989). This species showed sporadic peaks during the summers of 1997/98 and 2000/01
with less than 10 birds recorded in other years. This irregular occurrence at Paarl
WWTW reflected the known nomadic tendencies of the Pied Avocet in southern Africa,
which Tree (1997) ascribed to responses to rainfall patterns across the subcontinent.
Great White Pelican
This species was an irregular visitor, occurring on 33% of the counts. Overall, five
pelicans, on average, were recorded during the study with a maximum of 147 recorded
during April 2003. Numbers declined after 1997. The mean summer count was 11 from
1994–1997 and decreased to three from 1998–2003; similarly, mean winter counts
decreased from seven birds from 1994–1997 to one from 1998–2003. These seasonal
declines are probably related to a change in feeding sites. The Western Cape population
of Great White Pelicans has doubled from the 1990s to 2000s and this increase seems to
be associated with an increased reliance by the pelicans on chicken waste from local
poultry farms that are utilised by pig farms (Williams and Borello 1997, De Ponte
Machado and Hofmeyr 2004).
Palearctic migrants
Eight species of Palearctic migrants occurred at Paarl WWTW (Tables A.1 and A.2),
mainly between late August and April; few birds remained during the austral winter
(Figure A.2) (Summers et al. 1995). White-winged Terns formed the majority (93%) of
Palearctic migrants. The other Palearctic migrants were shorebirds, which occurred in

260
small numbers (e.g. Little Stint, maximum 157, Curlew Sandpiper, maximum 57; Table
A.2).
Numbers of Palearctic migrants peaked in October and in March, coincident with
the main arrival and departure months for most Palearctic shorebirds in South Africa
(Harrison et al. 1997). The main factor limiting the number of Palearctic shorebirds at
Paarl WWTW was the near absence of exposed unvegetated shoreline habitat, which is
restricted due to the stone embankments of the maturation ponds. Swanepoel et al.
(2006) found a similar trend at Theewaterskloof Dam, a large man-made reservoir
situated about 40 km south-east of Paarl WWTW. For White-winged Terns arrival
commenced in late August, which is consistent with bird atlas data (Williams and
Underhill 1997). Numbers increased rapidly during September, reached their peak in
January, and remained high until March (Figure A.3); departure was mainly in April.
There was a significant downward trend in the numbers of White-winged Terns
(r = –0.97, p < 0.001, Figure A.4); peak numbers declined from 2796 in January 1995 to
499 in January 2004, a decline of 82%. A possible cause of the lower numbers recorded
might be the change from afternoon counts, when more birds sit in roosts, to morning
counts when the terns are most active and difficult to count. However, the decrease
during the six-year period of afternoon counts was also significant (r = –0.89, p < 0.05).
Kaletja-Summers et al. (2001b) similarly reported a decline in the numbers of White-
winged Terns at the Cape Flats WWTW from the 1970s to the 1990s. Declines in
breeding success have also been reported in the species’ European breeding range
(Tomiałojć and van der Winden 1997) and this probably reflects the declines in numbers
at Paarl WWTW. These declines reflect the predicted changes in global populations for
migrants in relation to climate change. In a review of the impact of global climate change
on bird migration, Berthold (1999) predicted that, for long-distance migrants, population
declines would first be observed at the southern extremes of the non-breeding ranges.
The data presented here and from Kaletja-Summers et al. (2001b) show that
White-winged Tern populations in the Western Cape were consistent with this
prediction. The White-winged Tern is therefore a candidate species for intensive
monitoring in relation to current global change issues. The peak number (2 796) of
White-winged Terns during the study period was the sixth largest on record in South
Africa (Coordinated Waterbird Counts, Animal Demography Unit, unpubl. data). In
January 1994, before the study period, an estimated 5 100 White-winged Terns were
recorded at Paarl WWTW (Y Weiss pers. obs.), which is the second largest count for this
species at any locality in South Africa (Coordinated Waterbird Counts, Animal
Demography Unit, unpubl. data). Within the Western Cape province and the Cape Town

261
metropole, Paarl WWTW ranked second to the Cape Flats WWTW and together these
two sites supported the largest concentrations of White-winged Terns in South Africa
(Taylor et al. 1999).
Waterbird Conservation Value (WCV) scores
The monthly WCV scores for Paarl WWTW between May 1994 and April 2004 are shown
in Figure A.6. Inter-annual fluctuations were evident and no pattern was discernable;
although peaks tended to occur more in winter (June–July) than in summer. No scores
10 were observed. The median summer and winter scores were 2.6 and 3.0
respectively. The month with the highest average score was May (6.2).
Nine species made significant contributions to the WCV score (Figure A.6). Of
these, Hartlaub’s Gull and Black-winged Stilt had the largest scores during the study
period; 3.5 and 2.3 respectively. Pied Avocet occurrence was erratic and only scored high
in December 1997 with a value of 1.15. Lesser Flamingo was only abundant from
1994–1999; it scored 2.0 in October 1995. All other species had maximum scores less
than 1 during the study period and made negligible contributions to the WCV score.
General discussion
Variation in occurrence of resident species
The variation in abundance and occurrence exhibited by certain species reflected the
complexity of their status in the WRR. For example, flamingos breeding in the WRR is
an exceptional event (see Uys et al. 1963) while others (e.g. Black-necked Grebe,
Southern Pochard, Pied Avocet and Grey-headed Gull) breed mainly in the summer-
rainfall areas (Harrison et al. 1997). Great Crested Grebe, Cape Shoveler and Red-
knobbed Coot are considered mainly resident in the WRR and have substantial breeding
populations in this region (Hockey et al. 1989, Ashkenazi 2001). However, their seasonal
pattern of occurrence at Paarl WWTW suggests that they move seasonally out of the
WRR. Confusingly, interregional movements by these species (Great-crested Grebe, Cape
Shoveler and Red-knobbed Coot), while annual in some (e.g. Southern Pochard), vary
considerably in relation to wetland conditions in either the winter- and/or summer-
rainfall areas. When winter rains are low in the WRR there are limited resources for
waterbirds, many of which may then undertake additional local movements in search of
suitable habitat. Precipitation in summer-rainfall areas, especially semi-arid regions,
varies in timing and amount (Cowling et al. 1997). These variations affect the numbers
of birds that breed successfully and therefore impact the annual extent of interregional
movement. In drought periods, when most pans in the summer-rainfall areas fail to
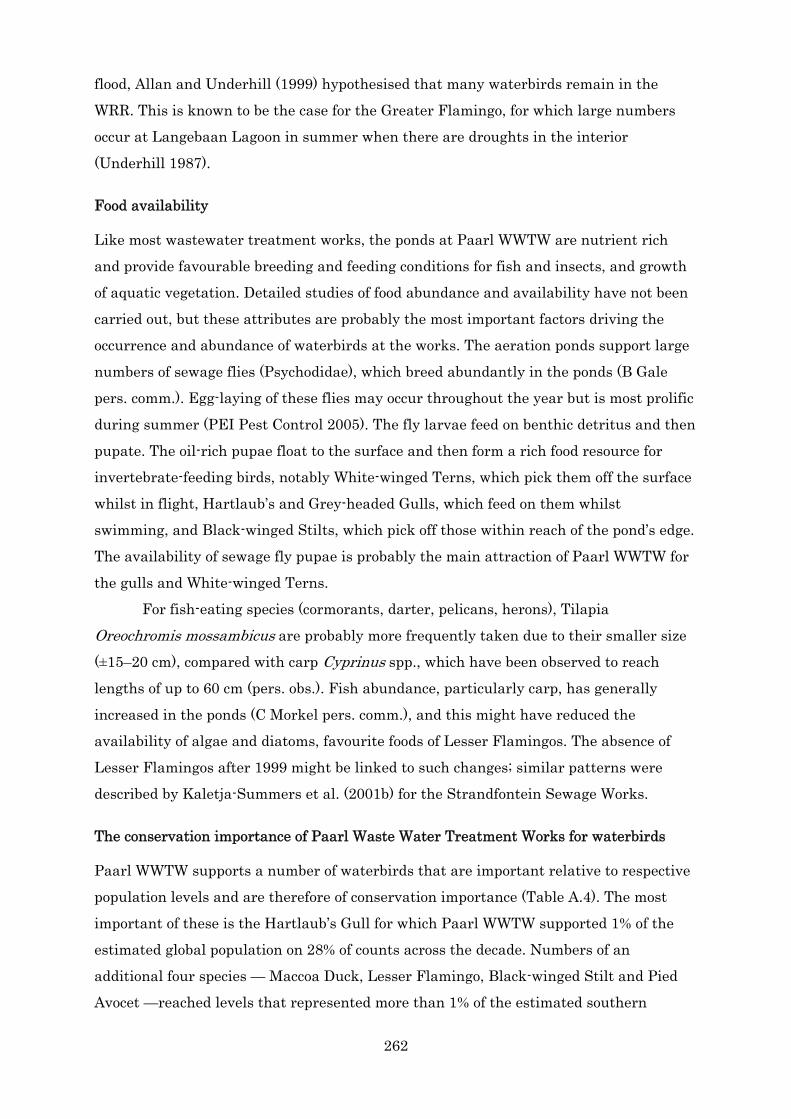
262
flood, Allan and Underhill (1999) hypothesised that many waterbirds remain in the
WRR. This is known to be the case for the Greater Flamingo, for which large numbers
occur at Langebaan Lagoon in summer when there are droughts in the interior
(Underhill 1987).
Food availability
Like most wastewater treatment works, the ponds at Paarl WWTW are nutrient rich
and provide favourable breeding and feeding conditions for fish and insects, and growth
of aquatic vegetation. Detailed studies of food abundance and availability have not been
carried out, but these attributes are probably the most important factors driving the
occurrence and abundance of waterbirds at the works. The aeration ponds support large
numbers of sewage flies (Psychodidae), which breed abundantly in the ponds (B Gale
pers. comm.). Egg-laying of these flies may occur throughout the year but is most prolific
during summer (PEI Pest Control 2005). The fly larvae feed on benthic detritus and then
pupate. The oil-rich pupae float to the surface and then form a rich food resource for
invertebrate-feeding birds, notably White-winged Terns, which pick them off the surface
whilst in flight, Hartlaub’s and Grey-headed Gulls, which feed on them whilst
swimming, and Black-winged Stilts, which pick off those within reach of the pond’s edge.
The availability of sewage fly pupae is probably the main attraction of Paarl WWTW for
the gulls and White-winged Terns.
For fish-eating species (cormorants, darter, pelicans, herons), Tilapia
Oreochromis mossambicus are probably more frequently taken due to their smaller size
(±15–20 cm), compared with carp Cyprinus spp., which have been observed to reach
lengths of up to 60 cm (pers. obs.). Fish abundance, particularly carp, has generally
increased in the ponds (C Morkel pers. comm.), and this might have reduced the
availability of algae and diatoms, favourite foods of Lesser Flamingos. The absence of
Lesser Flamingos after 1999 might be linked to such changes; similar patterns were
described by Kaletja-Summers et al. (2001b) for the Strandfontein Sewage Works.
The conservation importance of Paarl Waste Water Treatment Works for waterbirds
Paarl WWTW supports a number of waterbirds that are important relative to respective
population levels and are therefore of conservation importance (Table A.4). The most
important of these is the Hartlaub’s Gull for which Paarl WWTW supported 1% of the
estimated global population on 28% of counts across the decade. Numbers of an
additional four species — Maccoa Duck, Lesser Flamingo, Black-winged Stilt and Pied
Avocet —reached levels that represented more than 1% of the estimated southern

263
African populations (Wetlands International 2006). Paarl WWTW also supported
provincially important populations of Grey-headed Gull and White-faced Duck (Table
A.4). In terms of species maxima, Paarl WWTW ranks as the fourth most important site
for waterbird abundance within Cape Town metropole and 14th among Western Cape
wetlands, where all major wetlands are surveyed (Table A.5). Four species of Red Data
waterbirds occurred at the wetland during the decade. These were the ‘vulnerable’
African Marsh Harrier and the ‘near-threatened’ Great White Pelican, and Greater and
Lesser Flamingos (Barnes 2000); the last species is also globally threatened. There is
suitable habitat for African Marsh Harriers at Paarl WWTW but evidently not on a
sufficient scale to sustain a regular population, and this species has decreased during
the 10-year study period. Great White Pelicans use Paarl WWTW as an occasional roost
but their occurrence there is erratic.
The two flamingo species formerly occurred more frequently at Paarl WWTW, but
numbers have fallen and occurrence is more erratic since the closure of a Spirulina-
producing pond at a tannery in Wellington (4 km away), which formerly provided a food
resource for flamingos that then roosted at Paarl WWTW. In November 1997 (Y Weiss
pers. comm.) 30 nest mounds were constructed by Lesser Flamingos on the island in
front of the bird hide at pond B. This is the furthest south that Lesser Flamingos have
been recorded nest building in southern Africa (Williams and Velásquez 1997). Wetland
connectivity is an important landscape consideration for most waterbirds (Haig et al.
1998) as many species move around locally or regionally in search of optimal feeding
and/or breeding sites. In the metropolitan context, exchange and movement between
Paarl WWTW and other urban sites can therefore be assumed to take place. Recent
colour-ringing studies have shown that African Sacred Ibis and African Spoonbill move
between Paarl WWTW and other wetlands around Cape Town (DMH unpubl. data),
providing evidence of exchange of birds (and genetic material) between local populations
and inter-connectivity between sites within the Cape Town metropole. To what extent
these and other waterbirds move between these sites requires further investigation;
additional ringing studies will be needed to assess this.
Importance of Paarl Waste Water Treatment Works as a breeding site
Paarl WWTW is important within the Cape Town metropole as a breeding locality for a
number of waterbirds. In particular, the >300 nests in the ‘heronry’ represent the fourth
largest breeding locality in the metropole after Robben Island (Underhill et al. 2007),
Rondevlei (D Gibbs pers. comm.) and Intaka Island (Harrison 2005). This study
recorded the largest number of nests for Hartlaub’s and Grey-headed Gull in the WRR,

264
and highlights the importance of Paarl WWTW as a major inland breeding site for both
species in the region. Paarl WWTW was the first recorded inland breeding locality for
the Hartlaub’s Gull, which was previously known to be an exclusive coastal breeding
species (Crawford 1997). Grey-headed Gulls are generally more uncommon than
Hartlaub’s Gulls in the WRR; the breeding population at Paarl WWTW could therefore
act as an important recruitment site for this species in the region. No interbreeding
between Hartlaub’s and Grey-headed gulls has been recorded at Paarl WWTW, although
hybridization between these species has been reported from elsewhere in the WRR
(Sinclair 1977,Williams 1989).
It is important that the breeding status of waterbirds at the works be sustained
into the future. During 2004 some of the large trees on the island in Pond D were
beginning to collapse (pers. obs.). To counteract natural degradation on the island we
suggest erection of one or a few artificial breeding ‘platforms’ of the type used
successfully at Intaka Island, Cape Town (Harrison et al. 2001, Harrison 2005, Harrison
et al. 2010).
Conservation priorities
The decade of counting has shown that Paarl WWTW is a valuable wetland for resident
southern African waterbirds, including local migrants such as Greater and Lesser
Flamingos. Its importance is through its provision of a dry-season refuge, particularly for
resident waterfowl species, when most ephemeral wetlands dry out. Man-made or
artificially created wetlands have become increasingly important to waterfowl,
particularly as places of refuge, as natural wetlands have disappeared (Owen and Black
1990).
In addition, Paarl WWTW provides safe breeding sites for colonial breeding
species. The diversity of birds supported and attractive viewing conditions has made the
treatment works a popular bird-watching locality (Petersen and Tripp 1995, Weiss 1996,
2004). As an urban wetland, Paarl WWTW is subject to numerous socioeconomic
impacts. During the decade of counting, the Mbekweni informal settlement developed
just to the east of the railway line (Figure A.1). People from this settlement have easy
access to Paarl WWTW via an underpass. Although there have been incidents of
vandalism at the works and illegal fishing occurs in some of the ponds, people from the
settlement do not seem to pose any major disturbance to the waterbirds. Changes in
hydrology (e.g. the draining and refilling of pond 3) and wastewater treatment have had
greater impacts on waterbird populations. This supports findings by Velásquez (1992)
who found that habitat changes and water-level fluctuations at artificial salt-pans were
more important in determining occurrence and abundance of shorebirds than human

265
disturbance. The numbers of nine species (Hartlaub’s Gull, Maccoa Duck, Black-winged
Stilt, Lesser Flamingo, White-breasted Cormorant, Pied Avocet, Cape Shoveler, Black-
necked Grebe and Great White Pelican) qualify the site for Ramsar and Important Bird
Area (IBA) status (Table A.4, Wetlands International 2006). These global conservation
initiatives aim to prioritise important global and regional wetland and bird conservation
sites for biodiversity conservation (Barnes 1998, Fishpool and Evans 2001). The
designation of Paarl WWTW as a Ramsar and/or IBA site will improve the conservation
status of the site and secure the long-term preservation of the wetland for southern
African waterbirds.
Management actions and recommendations
Currently, Paarl WWTW Sewage Works is administered by the Civil Engineering
Services Department of the Drakenstein Municipality (Weiss 2004), which oversees
management and operation of the sewage works. An advisory committee was established
in 1994 to assist with the management of the bird sanctuary area. The committee
recommended initiation of monthly counting and drew up a management plan for the
Bird Sanctuary (maturation ponds) area. Actions since 1994 have included: the erection
of four bird hides and an information kiosk; provision of rafts to encourage bird breeding
(failed); erection of dead pine trees (successfully used for breeding by White-breasted
Cormorants); the creation of a breeding embankment for kingfishers (successful but
subsequently damaged by a photographer); and a bird ringing programme (Weiss 1996,
Harebottle 2005, G Scholtz pers. comm.).
Other issues that need to be considered in relation to management of the site
include burning (incorporating reedbed management, Worrall et al. 1997), impact of
human disturbance, occurrence and impact of invasive aquatic plants (e.g. water lettuce
Pistia stratiotes) and development of the heronry. At present, the bird sanctuary area is
not formally protected and, given the area’s demonstrated conservation value, greater
legal protection (e.g. nature reserve status) is recommended to secure the long-term
future of the sanctuary. Waterbirds are currently monitored monthly by members of the
Paarl WWTW Monitoring Group. In addition, water-level and quality, aquatic and
emergent vegetation and invertebrate and fish populations should be monitored;
manipulation of pond water-levels needs consideration as a management option as this
could attract more wading and shore birds (Velásquez 1992, Colwell and Taft 2000).
These factors are important because they affect habitat changes and food availability,
which aid in interpreting and understanding changes in waterbird abundance and
occurrence.

266
References
Allan DG and Underhill LG 1999. The significance of South Africa’s wetlands for birds. In: Taylor PB, Navarro RA, Wren-Sargent M, Harrison JA and Kieswetter SL (eds) TOTAL CWAC report: Coordinated Waterbird Counts in South Africa, 1992–1997. pp 10–17. Avian Demography Unit, University of Cape Town, Cape Town.
Ashkenazi S 2001. Long-term trends in the breeding populations of waterbirds (1951–1985) at a sewage treatment plant. Ostrich 72: 10–19.
Barnes KN (ed.) 1998. Important Bird Areas of Southern Africa. BirdLife South Africa, Johannesburg.
Barnes KN (ed.) 2000. The Eskom Red Data Book of Birds of South Africa, Lesotho and Swaziland. BirdLife South Africa, Johannesburg.
Berthold P 1999. Patterns of avian migration in light of current global “greenhouse effects”: a central European perspective. In: Bell BD, Cossee RO, Flux JEC, Heather BD, Hitchmough RA, Robertson CJR and Williams MJ (eds) Acta XX Congressus Internationalis Ornithologica, vol. 2. pp 780–786. New Zealand Ornithological Congress Trust Board, Wellington.
Boshoff AF, Vernon CJ and Piper SE 1991. Spatial and temporal abundance patterns of waterbirds in the southern Cape Province. Part 2: waterfowl. Ostrich 62: 178–196
Braithwaite LW and Stewart DA 1975. Dynamics of water bird populations on the Alice Springs Sewage Farm, N.T. Australian Wildlife Research 2: 85–90.
Brooke RK, Allan DG, Cooper J, Cyrus DP, Dean WRJ, Dyer BM, Martin AP and Taylor RH 1999. Breeding distribution, population size and conservation of the Greyheaded Gull Larus cirrocephalus in southern Africa. Ostrich 70: 157–163.
Childress RB and Bennun LA 2001. White-breasted Cormorant, Phalacrocorax carbo, breeding season timing and its control factors at a seasonally constant Kenyan lake. Ostrich 72: 149–158.
Colwell MA and Taft OW 2000. Waterbird communities in managed wetlands of varying water depth. Waterbirds 23: 45–55.
Cowling RM, Richardson DM and Pierce SM (eds) 1997. Vegetation of Southern Africa. Cambridge University Press, Cambridge.
Crawford, RJM 1997. Hartlaub’s Gull Larus hartlaubii. In: Harrison JA, Allan DG, Underhill LG, Herremans M, Tree AJ, Parker V and Brown CJ (eds) The Atlas of Southern African Birds, vol. 1: Non-passerines. pp 462–463. BirdLife South Africa, Johannesburg.
Dean WRJ 1997. Dabchick Tachybaptus ruficollis. In: Harrison JA, Allan DG, Underhill LG, Herremans M, Tree AJ, Parker V and Brown CJ (eds) The Atlas of Southern African Birds, vol. 1: Non-passerines. pp 6–7. BirdLife South Africa, Johannesburg.
Dean WRJ and Underhill LG 1997. Blacknecked Grebe Podiceps nigricollis. In: Harrison JA, Allan DG, Underhill LG, Herremans M, Tree AJ, Parker V and Brown CJ (eds) The Atlas of Southern African Birds, vol. 1: Non-passerines. pp 10–11. BirdLife South Africa, Johannesburg.
del Hoyo J, Elliot A and Sargatal J 1992. Handbook of the Birds of the World, vol. 1. Lynx Edicions, Barcelona.
De Ponte Machado M and Hofmeyr JH 2004. Great White Pelicans Pelecanus onocrotalus: waterbirds or farm birds. Bird Numbers 13(1): 11–13.
Fishpool LDC and Evans MI (eds) 2001. Important Bird Areas in Africa and Associated Islands: Priority Sites for Conservation. BirdLife Conservation Series 11. BirdLife International, Newbury and Cambridge.
Fuller RJ and Glue DE 1980. Sewage works as bird habitats in Britain. Biological Conservation 17: 165–181.
Haig SM, Mehlman DW and Oring LW 1998. Avian movements and wetland connectivity in landscape conservation. Conservation Biology 12: 749–758.

267
Halse SA and Jaensch RP 1989. Breeding seasons of waterbirds in south-western Australia – the importance of rainfall. Emu 89: 232–249.
Hamilton AJ, Taylor IR and Rogers P 2004. Seasonal and diurnal patterns in abundance of waterbirds at a waste stabilization pond, Victoria. Corella 28: 43–54.
Hamilton AJ, Robinson W, Taylor IR and Wilson BP 2005. The ecology of sewage treatment gradients in relation to their use by waterbirds. Hydrobiologia 534: 91–108.
Harebottle DM 2005. The value of colour-ringing: the case of a Yellow-billed Egret Egretta intermedia in the southwestern Cape. Afring News 34: 20.
Harrison JA, Allan DG, Underhill LG, Herremans M, Tree AJ, Parker V and Brown CJ (eds) 1997. The Atlas of Southern African Birds, vol. 1: Non-passerines. BirdLife South Africa, Johannesburg.
Harrison JA, McIver M and Weyers M 2001. Weyers Islands: a successful design for constructed heronries. Bird Numbers 12(2): 40–43.
Harrison JA 2005. Sticks ’n stones: building for birds. Africa – Birds & Birding 10(2): 52–59.
Harrison JA, Williams AJ, MacIver M 2010. Breeding site selection by colonial waterbirds given various combinations of constructed or natural alternatives over a 10-year period. Ostrich 81: 197–203.
Heÿl CW 1993. Breeding periodicity of ducks in the southwestern Cape. Internal report. Cape Nature Conservation.
Hockey PAR, Ryan PG and Dean WRJ (eds) 2005. Roberts’ Birds of Southern Africa, 7th edition. Trustees of the John Voelcker Bird Book Fund, Cape Town.
Hockey PAR, Underhill LG, Neatherway M and Ryan PG 1989. Atlas of the Birds of the Southwestern Cape. Cape Bird Club, Cape Town.
Kalejta-Summers B, Allan DG and Longrigg DG 2001a. Long-term trends, seasonal abundance and energy consumption of waterbirds at Rietvlei, Western Cape, South Africa, 1950–1997. Ostrich 72: 63–79.
Kalejta-Summers B, McCarthy M and Underhill LG 2001b. Long-term trends, seasonal abundance and energy consumption of waterbirds at Strandfontein, Western Cape, South Africa, 1953–1993. Ostrich 72: 80–95.
Kingsford RT 1989. The effect of drought on duckling survival of Maned Ducks. Australian Wildlife Research 16: 405–412.
Kingsford RT and Norman FI 2002. Australian waterbirds – products of the continent’s ecology. Emu 102: 47–69.
Lawler W and Briggs SV 1991. Breeding of Maned Duck and other waterbirds on ephemeral wetlands in north-western New South Wales. Corella 15: 65–76.
Little RM, Vester KC and Crowe TM 1995. Temporal and spatial patterns of breeding activity of 12 duck species (Anatidae) in the Cape Provinces, South Africa, and their implications for hunting seasons. South African Journal of Wildlife Research 25: 17–22.
Ma Z, Li B, Zhao B, Jing K, Tang S and Chen J 2004. Are artificial wetlands good alternatives to natural wetlands for waterbirds? A case study on Chongming Island, China. Biodiversity and Conservation 13: 333–350.
Maclean GL 1976. Factors governing breeding of African birds in non-arid habitats. In: Frith HJ and Calaby JH (eds). Proceedings of the 16th International Ornithological Congress, Canberra, 12-17 August 1976. pp. 259–271.
Maclean GL 1997a. Egyptian Goose Alopochen aegyptiacus. In: Harrison JA, Allan DG, Underhill LG, Herremans M, Tree AJ, Parker V and Brown CJ (eds) The Atlas of Southern African Birds, vol. 1: Non-passerines. pp 122–123. BirdLife South Africa, Johannesburg.
Maclean GL 1997b. Yellowbilled Duck Anas undulata. In: Harrison JA, Allan DG, Underhill LG, Herremans M, Tree AJ, Parker V and Brown CJ (eds) The Atlas of Southern African Birds, vol. 1: Non-passerines. pp 126–127. BirdLife South Africa, Johannesburg.

268
Maclean GL 1997c. Cape Shoveller Anas smithii. In: Harrison JA, Allan DG, Underhill LG, Herremans M, Tree AJ, Parker V and Brown CJ (eds) The Atlas of Southern African Birds, vol. 1: Non-passerines. pp 136–137. BirdLife South Africa, Johannesburg Ostrich 2008, 79(2): 147–163.
Maclean GL 1997d. Redbilled Teal Anas platyrynchos. In: Harrison JA, Allan DG, Underhill LG, Herremans M, Tree AJ, Parker V and Brown CJ (eds) The Atlas of Southern African Birds, vol. 1: Non-passerines. pp 134–135. BirdLife South Africa, Johannesburg.
Maclean GL and Harrison JA 1997. Southern Pochard Netta erythrorhynca. In: Harrison JA, Allan DG, Underhill LG, Herremans M, Tree AJ, Parker V and Brown CJ (eds) The Atlas of Southern African Birds, vol. 1: Non-passerines. pp 138–139. BirdLife South Africa, Johannesburg.
Masero JA 2003. Assessing alternative anthropogenic habitats for conserving waterbirds: Salinas as buffer areas against the impact of natural habitat loss for shorebirds. Biodiversity and Conservation 12: 1157–1173.
Owen M and Black JM 1990. Waterfowl Ecology. Blackie and Son, London.
PEI Pest Control 2005. Moth/Drain/Filter/Sewage Fly or Psychodid. Available at: http://www.peipestcontrol.com [accessed 15 April 2007].
Petersen W and Tripp M (eds) 1995. Birds of the Southwestern Cape and Where to Watch Them. Southern Birds 20. BirdLife South Africa and Cape Bird Club, Cape Town.
Rowan MK 1963. The Yellowbilled Duck Anus [sic] undulata Dubois in southern Africa. Ostrich Supplement 5: 1–56.
Siegfried WR 1965a. Duck nesting in the Cape Peninsula area. Ostrich 36: 82–83.
Siegfried WR 1965b. The Cape Shoveller Anas smithii (Hartert) in southern Africa. Ostrich 39: 61–75.
Sinclair I 1977. Interbreeding of Greyheaded and Hartlaub’s Gulls. Bokmakierie 29: 70–71.
Spottiswoode CN and Underhill LG 1994. Lesser Flamingos at Wellington. Promerops 216: 12.
Summers RW, Underhill LG and Prŷs-Jones RP 1995. Does delayed return migration of young waders to their breeding grounds indicate the risk of migration? Ardea 83: 351–357.
Swanepoel D, Underhill LG, Harebottle DM, Wheeler M and Williams AJ 2006. Waterbirds at Theewaterskloof Dam, Western Cape, South Africa. Ostrich 77: 170–174.
Taylor PB, Navarro RA, Wren-Sargent M, Harrison JA and Kieswetter SL (eds) 1999. TOTAL CWAC Report: Coordinated Waterbird Counts in South Africa, 1992–1997. Avian Demography Unit, University of Cape Town, Cape Town.
Tomiałojć L and van der Winden J 1997. White-winged Black Tern Chlidonias leucopterus. In: Hagemeijer WJM and Blair MJ (eds) The EBCC Atlas of European Breeding Birds. pp 366–367. T and AD Poyser, London.
Tree AJ 1997. Avocet Recurvirostra avosetta. In: Harrison JA, Allan DG, Underhill LG, Herremans M, Tree AJ, Parker V and Brown CJ (eds) The Atlas of Southern African Birds, vol. 1: Non-passerines. pp 434–435. BirdLife South Africa, Johannesburg.
Underhill LG 1987. Waders (Charadrii) and other waterbirds at Langebaan Lagoon, South Africa, 1975–1986. Ostrich 58: 145–155.
Underhill LG 2004. Sixty-five years of Blacksmith Plovers in the Western Cape. Bird Numbers 13(2): 28–29.
Underhill LG, Crawford RJM, Harebottle DM and Tjørve KMC 2007. The development of the heronry on Robben Island, Western Cape, South Africa, 1980–2005. In: S Kirkman (ed). Final report of the BCLME (Benguela Current Large Marine Ecosystem) project on top predators as biological indicators of ecosystem change in the BCLME. Chapter 27. pp. 217-221.
Uys CJ, Broekhuysen GJ, Martin J and MacLeod JG 1963. Observations on the breeding of the Greater Flamingo Phoenicopterus ruber Linneaus in the Bredasdorp District, South Africa. Ostrich 34: 129–146.

269
van Niekerk L, van der Merwe JH and Huizinga P 2005. Hydrodynamics of the Bot River Estuary revisited. Water SA 31: 73–85.
Velasquez CR 1992. Managing artificial saltpans as a waterbird habitat: species’ responses to water level manipulation. Colonial Waterbirds 15: 43–55.
Weiss Y 1996. Rough diamond – Paarl Bird Sanctuary. Africa – Birds & Birding 1(5): 60–63.
Weiss Y 2004. Paarl Bird Sanctuary: 10 years on. Africa – Birds & Birding 9(2): 38–45.
Wetlands International 2006. Waterbird Population Estimates – Fourth Edition. Wetlands International Global Series No. 12, Wageningen, The Netherlands.
Williams AJ 1989. Courtship feeding and copulation by Hartlaub’s Gulls Larus hartlaubii and probable Hartlaub’s × Greyheaded Gull. L. cirrocephalus hybrids. Cormorant 17: 73–76.
Williams AJ, Heÿl C, Shaw K and Harebottle DM 2002. Waterbird counters rewarded: the case of Wadrif wetland. Bird Numbers 11(1): 18–22.
Williams AJ and Underhill LG 1997. Whitewinged Tern Chlidonias leucopterus. In: Harrison JA, Allan DG, Underhill LG, Herremans M, Tree AJ, Parker V and Brown CJ (eds) The Atlas of Southern African Birds, vol. 1: Non-passerines. pp 484–485. BirdLife South Africa, Johannesburg.
Williams AJ and Borello WD 1997. White Pelican Pelecanus onocrotalus. In: Harrison JA, Allan DG, Underhill LG, Herremans M, Tree AJ, Parker V and Brown CJ (eds) The Atlas of Southern African Birds, vol. 1: Non-passerines. pp 24–25. BirdLife South Africa, Johannesburg.
Williams AJ and Velasquez C 1997. Lesser Flamingo Phoeniconaias minor. In: Harrison JA, Allan DG, Underhill LG, Herremans M, Tree AJ, Parker V and Brown CJ (eds) The Atlas of Southern African Birds, vol. 1: Non-passerines. pp 114–115. BirdLife South Africa, Johannesburg.
Winterbottom JM 1960. Report on the Cape Bird Club Vlei Counts 1952–1958. Ostrich 31: 135–168.
Winterbottom JM and Rowan MK 1962. Effect of rianfall on breeding of birds in arid areas. The Ostrich 33: 77–78.
Worrall P, Peberdy KJ and Millett NC 1997. Constructed wetlands and nature conservation. Water Science and Technology 35: 205–213.

270
Table A.1 Maximum count of waterbird species recorded in 25% of the 120 monthly surveys at Paarl Waste Water Treatment Works from May 1994–April 2004.
Species Max. count Date(s) of maximum count
Fulvous Duck 1 Oct./Nov. 1998, Nov. 2001
South African Shelduck 11 Oct. 1997
Hottentot Teal 2 Jun. 1998
Comb Duck 2 Oct. 1994, Oct./Nov. 1999
Mallard 2 Apr. 2001
Great Egret 1 May 1997, Mar. 2003
Goliath Heron 1 Mar. 1999, Jun./Aug. 1999
Squacco Heron 1 Jun./Aug. 1999, Jul. 2003
Hamerkop 1 May 1994, Mar. 1995, Aug. 1995, Apr 1996, Oct.1997, Jun. 1999, Aug. 2000
African Marsh Harrier 2 Jan. 1996, Jun. 1998, May 1999, Apr./May 2004
Osprey 1 Jan. 2000
African Rail 1 Apr. 1995, Mar./Apr. 2001, Jun. 2001, Mar. 2002, Apr. 2004
African Crake 3 Sep. 1997
American Purple Gallinule 1 Jul./Aug. 2000, Nov./Dec. 2000
African Jacana 1 Oct. 1996, Sep. 2001,
Ruff 4 Mar. 2000
Marsh Sandpiper 3 Mar. 1995, Nov. 1995
Greater Painted Snipe 5 Jan. 2003
Kelp Gull 21 Jul. 1997
Whiskered Tern 2 Jun. 2001

271
Table A.2 Seasonal abundance of 55 waterbird species that occurred in > 25% of all counts at Paarl Waste Water Treatment Works from May 1994 to April 2004. Species grouped according to regional guilds and sorted in descending order of frequency of occurrence and overall mean abundance.
Species Summer Winter
Mean ± S.D. Min-Max1 Mean ± S.D. Min-Max1
Residents Waterfowl Yellow-billed Duck 31.3 ± 6.7 2–121 30.3 ± 14.3 0-116 Egyptian Goose 463.9 ± 252 0–1341 216.2 ± 252.3 16-1052 Cape Teal 21.5 ± 6.7 0–83 22.6 ± 7.6 2–85 Red-billed Teal 25.2 ± 5.7 0–65 33.5 ± 11.3 2–151 Cape Shoveler 58.4 ± 30.7 0–237 41.6 ± 14.7 0–138 White–backed Duck 2.2 ± 1.5 0–21 1.1 ± 1.4 0–21 Maccoa Duck 10.9 ± 3.9 0–71 13.5 ± 9.3 0–235 African Black Duck 2.4 ± 0.7 0–9 3.6 ± 1.2 0–9 Spur–winged Goose 11.9 ± 12.3 0–118 1.9 ± 2.3 0–31 Southern Pochard 10.9 ± 13.4 0–148 11.1 ± 7.8 0–50 Common Moorhen 35.5 ± 13.3 8–163 39.1 ± 9.2 7–105 Red–knobbed Coot 116.4 ± 35.4 24–296 93.4 ± 9.4 32–243 Little Grebe 96.9 ± 67.5 19–334 162.1 ± 90.1 0–433 Black–necked Grebe 4.9 ± 3.5 0–46 19.3 ± 12.6 0–131 Great Crested Grebe 1.6 ± 0.6 0–5 0.5 ± 0.4 0–7 White–faced Duck 5 ± 1.8 0–33 6.4 ± 3.7 0–58Sub–total 898.2 ± 261.3 284–1747 695.6 ± 326.3 204–1853
Cormorants and darter Reed Cormorant 35.7 ± 20.2 0–183 15.9 ± 6.5 3–73 African Darter 36.9 ± 10.9 0–89 14.3 ± 5.2 0–41 White–breasted Cormorant 27.1 ± 8.5 2–74 45.9 ± 13.5 10–93Sub–total 99.5 ± 18.5 4-272 76 ± 6.6 25-153
Pelicans Great White Pelican 6.9 ± 4.8 0–52 6.2 ± 9.9 0–147
Flamingos Greater Flamingo 31.3 ± 24.2 0–267 17.7 ± 11.7 0–172 Lesser Flamingo 114.6 ± 97.2 0–1200 32.3 ± 42.3 0–751Sub–total 145.8 ± 121.3 0–1210 50 ± 53.9 0–751
Waders Pied Avocet 8.8 ± 8.4 0–218 2.2 ± 1.3 0–15 African Sacred Ibis 131.6 ± 21.2 23–673 67.7 ± 12.4 0–195 Hadeda Ibis 3.1 ± 1.3 0–17 6.4 ± 2.4 0–25 Water Thick–knee 4.3 ± 1.1 0–22 6.7 ± 1.4 0–21 African Spoonbill 2.5 ± 2.7 0–44 3.4 ± 1.1 0–23 Little Bittern 0.4 ± 0.2 0–2 0.4 ± 0.2 0–2 Black–crowned Night–heron 9.8 ± 5.4 0–44 13.3 ± 5.3 0–42 Grey Heron 8.4 ± 4.8 0–27 9.5 ± 5.5 0–35 Black–headed Heron 4.1 ± 1.8 0–24 5.1 ± 2.9 0–35 Purple Heron 0.7 ± 0.5 0–6 0.9 ± 0.5 0–4 Little Egret 1.9 ± 1.1 0–16 1.4 ± 0.6 0–8 Yellow–billed Egret 1.1 ± 0.8 0–7 1.3 ± 0.9 0–19 Glossy Ibis 0.4 ± 0.3 0–4 1.3 ± 0.7 0–9 Cattle Egret 110.4 ± 37.3 29–270 74.1 ± 23.8 14–218Sub–total 578.4 ± 42.2 100–944 293 ± 20.7 62–379

272
Table A.2 contd
Species Summer Winter
Mean ± S.D. Min-Max1 Mean ± S.D. Min-Max1
Raptors African Fish Eagle 0.5 ± 0.4 0–2 0.4 ± 0.4 0–3
Rallids African Purple Gallinule 2.9 ± 0.5 0–10 3 ± 0.9 0–10 Black Crake 0.8 ± 0.3 0–4 1.4 ± 0.8 0–10Sub–total 3.7 ± 0.7 0–11 4.3 ± 1.6 0–16
Shorebirds Blacksmith Plover 89.3 ± 20.9 16–327 43 ± 12.2 0–113 Black–winged Stilt 75.3 ± 13.1 0–232 190.7 ± 70.5 0–527 Three–banded Plover 15.9 ± 4.6 0–39 23.2 ± 11.8 0–85 Kittlitz's Plover 12.2 ± 3.9 0–44 22.8 ± 3.8 0–75 African Snipe 0.9 ± 0.9 0–13 1.6 ± 1.8 0–12Sub–total 193.4 ± 23.1 42–398 281.2 ± 84.9 70–605
Gulls Hartlaub's Gull 250.4 ± 39.1 11–689 297.6 ± 116.5 0–1058 Grey–headed Gull 16.3 ± 11.9 0–273 23.7 ± 7.3 0–130Sub–total 266.7 ± 49.5 11–826 321.3 ± 121.1 0–1188
Palearctic migrants Shorebirds Common Sandpiper 7.5 ± 2.3 0–32 1.8 ± 2.7 0–20 Little Stint 50.4 ± 10.8 0–157 7.1 ± 11.3 0–100 Common Greenshank 0.9 ± 0.4 0–3 0.2 ± 0.2 0–3 Wood Sandpiper 1.1 ± 0.9 0–15 0.2 ± 0.2 0–2 Curlew Sandpiper 2.6 ± 2.6 0–57 0.2 ± 0.2 0–3Sub–total 62.3 ± 10.5 0–185 9.3 ± 12.5 0–104
Terns White–winged Tern 858.2 ± 386.5 4–2796 13.9 ± 20 0–123
Total residents 2047.2 ± 143.8 787–3064 1677.7 ± 247.9 783–2710
Total Palearctic migrants 920.4 ± 379.1 22–2913 23.2 ± 32.2 0–177
Overall total 2967.6 ± 504.4 809–5269 1700.9 ± 250.5 787–2728
1 The sub-total values here reflect the minimum/ maximum number for the group profile as a whole and not the sum of individual minima/maxima for each species which would represent estimated min./max. carrying capacity and not actual min./max. numbers reflected by the dataset

273
Table A.3 Maximum number of pairs of 33 solitary and colonially breeding waterbirds recorded breeding at Paarl Waste Water Treatment Works from May 1994 to April 2004. Records based on confirmed sightings of eggs and/or chicks. For selected species, the month(s) in which the maximum number of pairs was recorded in any given year is given in parentheses. Species order based on month when first rains begin (i.e. April). WRR = Winter rainfall region.
Solitary breeders Colonial breeders
Species Max. pairs
Breeding season in
WRR1 Species Max.
pairs
Breeding season in
WRR1 Red-billed Teal 1 (Apr) Aug–Dec Grey-headed Gull 35 (May) Apr
Black Crake 1 (Apr) Mar–Dec Hartlaub’s Gull 10 (Jun) Feb–Sep
Blacksmith Lapwing 4 (Jul/Aug) Jul–Dec Pond A heronry
Southern Pochard 1 (Sep) Jul–Mar White-breasted Cormorant 40 (May) Aug–Apr
Cape Shoveler 2 (Sep/Oct) Jul–Dec Pond D heronry
Egyptian Goose 5 (Sep) Jun–Feb Black-headed Heron 21 (Jul) Jul–Jan
Water Thick-knee 1 (Sep) Sep–Dec Black-crowned Night–Heron 12 (Aug) Aug–Jan
Black-winged Stilt 5 (Sep) Aug–Dec African Spoonbill 8 (Aug) Jul–Dec
Kittlitz’s Plover 12 (Sep) Aug–Feb Grey Heron 19 (Aug) Jul–Jan
Three-banded Plover 1 (Sep;Feb) Aug–Mar Yellow-billed Egret 12 (Sep) Aug–Dec
Yellow-billed Duck 2 (Oct/Nov) Jul–Dec Cattle Egret 132 (Oct) Aug–Feb
African Purple Gallinule 3 (Nov) Aug–Feb Reed Cormorant 49 (Oct) Jul–Jan
Common Moorhen 3 (Nov) Aug–Mar African Sacred Ibis 63 (Nov) Aug–Jan
Red-knobbed Coot 9 (Nov) Jul–Feb African Darter 26 (Nov) Aug–Feb
Malachite Kingfisher 1 (Nov) Aug–Dec Little Egret 12 (Nov) Aug–Dec
Cape Teal 1 (Nov) Aug–Apr
Great Crested Grebe 1 (Dec) Aug–Mar
Maccoa Duck 2 (Dec) Oct–Apr
Little Grebe 4 (Jan) Sep–Mar
White-faced Duck 1 (Jan/Feb) Dec–Feb
Total 118 Total 439
Overall total: 557
1 Dates sourced from Hockey et al. (1989).

274
Table A.4 Species of conservation importance at Paarl Waste Water Treatment Works based on maximum counts from a 120 surveys from May 1994 to April 2004. Species are sorted in descending order of global, regional and provincial importance. Only species with estimated proportions of more than 5% of Western Cape and/or Cape Town metropole populations are shown. Number in parentheses represents the number of times the threshold level was reached and/or surpassed. Species in bold are included in the South African Red Data book (Barnes 2000). NT = Near–threatened, V = Vulnerable.
Species Max. count
Population level
Global1 (Ramsar 1%)
Sub–regional2 (IBA 0.5%)
Western Cape3
Cape Town metropole3
Hartlaub’s Gull 1058 3.5% (43) 7.0% (78) 6% 10%
Maccoa Duck 235 2.4% (1) 4.7% (4) 14% 31%
Black-winged Stilt 527 2.3% (18) 4.6% (35) 7% 24%
Lesser Flamingo (NT) 1200 2% (5) 4% (9) 13% 50%
White-breasted Cormorant 163 1.4% (1) 2.7% (15) <5% 6%
Pied Avocet 218 1.1% (1) – 2% 6%
Cape Shoveler 333 – 2.2% (5) 3% 8%
Black-necked Grebe 131 _ 1.8 (4) <5% 10%
Great White Pelican (NT) 147 – 1.47% (1) <5% 12%
Grey-headed Gull 273 – – 29% 77%
White-faced Duck 58 – – 19% 30%
White-winged Tern 2796 – – 15% 18%
Black-crowned Night-Heron 44 – – 8% 16%
Common Moorhen 163 – – 7% 14%
African Sacred Ibis 673 – – 7% 14%
Water Thick-knee 22 – – 7% 20%
Yellow-billed Egret 19 – – 6% 13%
Blacksmith Lapwing 327 – – 6% 13%
Little Grebe 433 – – 5% 13%
Common Sandpiper 32 – – – 23%
Three-banded Plover 85 – – – 21%
Egyptian Goose 1341 – – – 15%
Hadeda Ibis 25 – – – 12%*
African Spoonbill 44 – – – 12%
Wood Sandpiper 15 – – – 11%
Reed Cormorant 183 – – – 10%
African Marsh Harrier (V) 2 – – – 5%
1 Figures represent the percentage of the estimated global* or Southern African# population based on the maximum count. Number in parentheses represents the number of counts which met or surpassed the 1% threshold level. Calculated from Wetlands International (2006). 2 Figures represent the number of counts which met or surpassed the Sub-regional IBA level (0.5% threshold) for southern Africa (Barnes 1998) but did not surpass the 1% global threshold level. 3 Value represents the percentage of the estimated provincial population and based on the maximum count. Estimates sourced and calculated from Coordinated Waterbird Counts, Avian Demography Unit, unpublished data (2006)

275
Table A.5 Ranking of 30 wetland sites in the Western Cape Province during summer (S) and winter (W) based on sum of maximum counts for each species from Coordinated Waterbird Counts (unpublished data, University of Cape Town). Data based on six-monthly data only (i.e. mid-summer and mi-winter surveys only). Where additional published sources are available these are mentioned but only as additional information. Sites in bold refer to the sites discussed in this thesis.
Rank Locality S W Source/Remarks
1 Langebaan Lagoon 90173 34772
2 Strandfontein WWTW* 89122 33740 104 340 based on Kaletja–Summers 20011
3 De Hoop Vlei 42825 46593 this thesis, based on monthly counts
4 Berg River Estuary 44600 38803
5 Rocher Pan 35846 17874 this thesis, based on monthly counts
6 Bot River Estuary 32127 27998 this thesis, based on monthly counts
7 Swartvlei Estuarine System 12352 19227
8 Rietvlei * 15567 8337
9 Verlorenvlei 15509 7376
10 Wilderness Estuarine System 13850 13850
11 Wadrif Saltpan 13457 23330
12 Jakkalsvlei 12825 5454
13 Theewaterskloof Dam 12130 3917 Swanepoel et al. 2007; updated to include data until 2009
14 Paarl WWTW* 11023 7067 this thesis, also Harebottle et al. 2008
15 Voelvlei Dam 10399 2105
16 Knysna Estuary 10334 5249
17 Klein River Estuary 8859 9764 Harebottle 2010
18 Radyn Dam 8525 1693
19 Droëvlei Dam 7444 4857 this thesis, based on monthly counts
20 Heuningnes River Estuary 7237 1213
21 Olifants River Mouth 4425 4115
22 Zandvlei Estuary* 3999 3610
23 Keurbooms River Estuary 3691 2787
24 Wildevoelvlei* 3565 2834
25 Breede River Estuary 3518 1811
26 Beaufort West WWTW 3214 1869
27 Rondevlei* 3210 2505
28 Diep River Estuary* 2975 1541
29 Macasser WWTW* 1662 1178
30 Great Brak Estuary 1108 545
1 these analyses based on monthly seasonal means
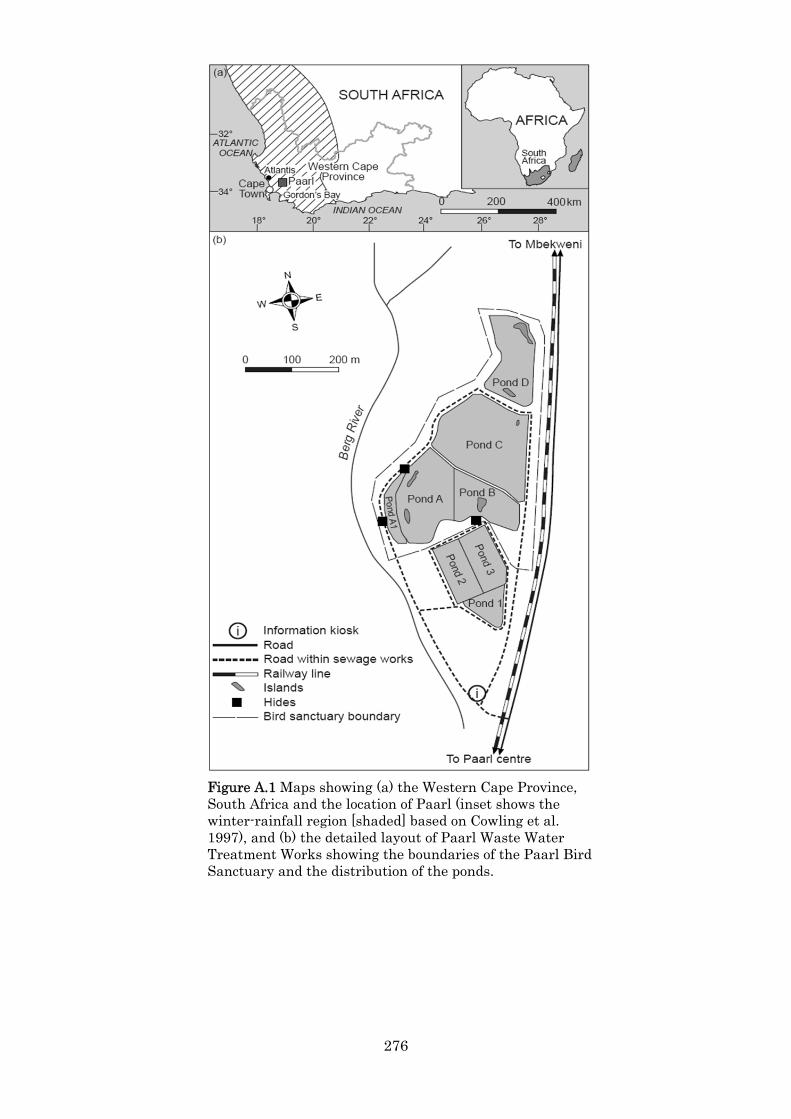
276
Figure A.1 Maps showing (a) the Western Cape Province, South Africa and the location of Paarl (inset shows the winter-rainfall region [shaded] based on Cowling et al. 1997), and (b) the detailed layout of Paarl Waste Water Treatment Works showing the boundaries of the Paarl Bird Sanctuary and the distribution of the ponds.

277
Figure A.2 Mean (grey bars) and maximum (black bars) monthly number of all waterbirds, residents and Palearctic migrants at Paarl Waste Water Treatment Works from May 1994 to April 2004.
0
2000
4000
6000
8000 All waterbirds
0
1000
2000
3000
4000
5000
6000 Residents
0
500
1000
1500
2000
2500
3000
Mea
n n
o. o
f b
irds
Palearctic migrants
0
200
400
600
800Resident shorebirds
0
50
100
150
200
Month
Palearctic shorebirds

Figure A.3 Mean monthly abundance of 25 waterbirds at Paarl Bird Sanctuary from May 1994–April 2004.
0
100
200
300Little Grebe
0
500
1000
1500White-winged
Tern
0
10
20
30
40
50Black-necked Grebe
0
20
40
60
80
Mea
n no
. of
bir
ds
Greater Flamingo
0
200
400
600
800 EgyptianGoose
0
20
40 Spur-winged Goose
0
20
40
60 Yellow-billed Duck
0
50
100
150Cape Shoveller
0
20
40
60Reed Cormorant
0
50
100
150
200
250Lesser Flamingo
0
50
100
150
200Red-knobbed Coot
0
10
20
30
40 Southern Pochard
0
20
40
60 African Darter
0
10
20
30
40 Grey-headed Gull
0
100
200
300
400
500Hartlaub's Gull
0
100
200
300
400 Black-winged Stilt
0
50
100
150 Blacksmith Lapwing
0
10
20
30
40Three-banded
Plover
0
20
40
60
80 White-breastedCormorant
0
10
20
30
40
50
60
70 Little Stint

279
Figure A.4 Mean annual summer (black circle) and/or winter (black square) population trends of seven waterbird species at Paarl Waste Water Treatment Works from April 1994 to May 2004. Regression lines are shown for summer (–· –) and winter (– –) where appropriate.
y = -85.248x + 1122.3R² = 0.9405
0
200
400
600
800
1000
1200White-winged Tern
y = -27.539x + 238.65R² = 0.5599
y = -18.447x + 147.28R² = 0.3335
0
50
100
150
200
250
300
350 Lesser Flamingo
y = 42.487x + 210.48R² = 0.5574
0
100
200
300
400
500
600
700
800Egyptian Goose
y = 2.1038x - 1.8833R² = 0.6207
0
5
10
15
20
25
Year
Spur-winged Goose
y = 3.4561x + 21.217R² = 0.6855
y = 6.1629x + 45.117R² = 0.5186
0
20
40
60
80
100
120 BlacksmithLapwing
y = -3.7568x + 37.675R² = 0.2254
y = -5.1455x + 54.15R² = 0.515
0
20
40
60
80
100Grey-headed Gull
y = -41.738x + 538.18R² = 0.523
0
100
200
300
400
500
600
700
Year
Hartlaub's GullMea
n n
o. o
f bi
rds

280
Figure A.5 Relationship between rainfall and abundance of selected waterfowl at Paarl Waste Water Treatment Works. The figures represent cumulative totals for the periods indicated. Refer to text for r values.
y = -0.3745x + 640.78R² = 0.1917
0
200
400
600
800
0 200 400 600 800
Egyptian Goose: May-Jul
y = 0.2681x - 17.156R² = 0.7329
0
50
100
150
200
250
300
0 200 400 600 800 1000
Red-billed Teal: Jun-Aug
y = -0.2951x + 128.79R² = 0.657
0
20
40
60
80
100
120
140
0 100 200 300 400
Yellow-billed Duck: Sep-Nov
y = -0.2128x + 217.37R² = 0.3936
0
50
100
150
200
250
0 200 400 600 800 1000
Rain (mm)
Cape Shoveler: Jun-Aug
y = 0.3615x + 105.31R² = 0.6963
0
100
200
300
400
500
0 200 400 600 800 1000
Rain (mm)
Little Grebe: Jul-Sep
y = -4.5729x + 1401.4R² = 0.4239
0
500
1000
1500
0 50 100 150 200 250 300
Mea
n n
o. o
f b
irds
Egyptian Goose: Oct-Dec

281
Figure A.6 Monthly Waterbird Conservation Value (WCV) scores for Paarl WWTW from May 1994–April 2004. Relative contributions of species reaching 0.5% or 1% threshold levels are shown.
0
1
2
3
4
5
6
7M
ay-9
4
Aug
-94
Nov
-94
Feb
-95
May
-95
Aug
-95
Nov
-95
Feb
-96
May
-96
Aug
-96
Nov
-96
Feb
-97
May
-97
Aug
-97
Nov
-97
Feb
-98
May
-98
Aug
-98
Nov
-98
Feb
-99
May
-99
Aug
-99
Nov
-99
Feb
-00
May
-00
Aug
-00
Nov
-00
Feb
-01
May
-01
Aug
-01
Nov
-01
Feb
-02
May
-02
Aug
-02
Nov
-02
Feb
-03
May
-03
Aug
-03
Nov
-03
Feb
-04
WC
V s
core
Survey date
Hartlaub's Gull Black-winged StiltLesser Flamingo Maccoa DuckPied Avocet White-breasted CormorantCape Shoveler Black-necked GrebeGreat White Pelican Other

283
Appendix B
Long-term waterbird trends at a South African farm
dam in the winter rainfall region: Droëvlei Dam,
Western Cape, 1982–2006

284

285
Abstract
The total extent of water in the thousands of farm dams in the winter rainfall region of
southern Africa is now far greater than that in all the region’s natural permanent wetlands
yet the role played by farm dams in terms of waterbird support is poorly known. Waterbird
abundance and seasonality was therefore assessed at Droëvlei Dam, a 14 ha farm dam near
Malmesbury, South Africa for two periods: 1982–1990 and 1995–2006. Surveys during
1982–1990 recorded 50 species of waterbirds with mean summer counts of 1 935 ± 973 birds
and mean winter counts of 791.8 ± 476.4 birds. The 1995–2006 surveys recorded 47 species;
mean summer counts of 2 245 ± 1 847 birds revealed a five-fold difference compared with
winter counts 437 ± 533 birds. Overall abundance was strongly seasonal with higher
numbers in summer than winter. Waterfowl dominated the waterbird community during
both periods (46% and 69% respectively) and used the site as a breeding and moulting site,
and dry season refuge. Egyptian Goose was the most abundant species which also showed a
57% increase in numbers at the dam during the two census periods. A total of three species
surpassed the global 1% threshold levels during both census periods: Maccoa Duck, Pied
Avocet and Great White Pelican. The role of farm dams are discussed in a general context
and aspects relating to landowner management are discussed in relation to conservation of
wetlands on private land.
Plate B.1 Droëvlei Dam looking west from the main road (R304). Photo: DM Harebottle.

286
Introduction
In a country with highly seasonal and unpredictable rainfall, South Africa has few
permanent natural inland waterbodies (Cowan 1995, Davies and Day 1998, Taylor et al.
1999). Almost all permanent waterbodies are artificial impoundments or large reservoirs
(Cowan and van Riet 1998, Davidson and Delany 2000). There are over 500 medium-large
reservoirs (i.e. with a wall equal to or higher than 15 m from base to crest and usually
kilometres long) in South Africa (Davies and Day 1998) constructed by 1986, most of which
provide potable water to towns and cities, and farming communities. Their total capacity
amounts to 52% of annual run-off (Davidson and Delany 2000). With a large agricultural
sector in South Africa, many private farm dams have been built to irrigate croplands and/or
provide drinking water to stock. These smaller impoundments (a few hectares in size and
with walls usually less than 5 m in height) possibly number tens of thousands but it is
unclear as to their exact number (Taylor et al. 1999). In the Western Cape it is estimated
that there about 4000 farm reservoirs storing in excess of 100 million cubic meters of water
(Davies and Day 1998). In the winter rainfall region, the total water storage capacity of
farm dams exceeds all permanent natural wetlands in the region (DWAF 1986, Davies and
Day 1998)
Magnall (1999) stated that anthropogenic transformations in ecosystem processes
have received little conservation attention and that this provides an obstacle to effective
biodiversity conservation in South Africa. He added that there is a general lack of
knowledge of the biological importance of artificial waterbodies and that this needs to be
carried out in parallel to the conservation of natural wetland s in order to determine their
roles as alternative refuges for biodiversity.
There are few studies dealing with the importance of farm dams for waterbird
conservation (Davidson and Delany 2000), particularly in southern Africa (see Skead &
Dean 1977, Guillet and Crowe 1986, Taylor et al. 1999). The only major study has been that
of Froneman et al. (2001) who dealt with the importance of structural and habitat
parameters of farm reservoirs in agricultural landscapes in defining and supporting
different communities of waterbirds. Other waterbird studies that have been carried out at
artificial waterbodies include Allan et al. (1996) who conducted baseline surveys during the
construction of Mohale Dam in Lesotho and Swanepoel et al. (2006) who highlighted the
poor conservation role of a large impoundment in the Western Cape.
In this paper I present an analysis of the data obtained from long-term waterbird
monitoring at Droëvlei Dam, a farm dam in the Malmesbury district of the Western Cape.
The focus of the paper looks at the comparison of monthly surveys with six monthly surveys

287
and describes waterbird abundance and patterns of occurrence. Causes of population
fluctuation are briefly assessed. The paper ends with a look at the importance of the dam
for waterbirds in the region and a discussion of the role of farm dams in waterbird
conservation in the WRR.
Study site
Droëvlei Dam (33°38’S, 18°43’E) is a private farm dam situated 20 km south of
Malmesbury, South Africa. It is situated on the farm ‘Droëvlei’ (meaning ‘dry wetland or
marsh’) close to the R304, a main road that links Malmesbury with the northern suburbs of
Cape Town (Figure B.1, Plate 4.1). The Malmesbury district is an expansive agricultural
area where intensive wheat cultivation takes place; large (> 50 ha) farms are scattered
throughout the landscape. Some grape and olive farming occurs but at less intensive scales
as the wheat farming. There are some broiler farms located close to Droëvlei Farm.
The farm lies within the winter rainfall region of South Africa; this region is
described in detail by Harebottle et al. (2008) and in Chapter 1. Malmesbury, the nearest
weather station records an average of 520 mm of rain annually of which 80% falls during
the local winter months of April to September.
The dam has an earth wall; it ranges in area between 4–14 ha depending on water
levels (Figure B.1). The dam receives inflow from a stream which arises in the Paardeberg
mountain about 10 km to the west of the dam. Flow usually begins in late April or May and
inflow continues until about October. Water is lost from the dam by evaporation, by spill-
over and by use during the dry season for irrigation purposes. During drought periods the
dam dries out totally in some years. In the dry season the dam separates into two distinct
waterbodies; for example, in March 1988 the western portion covered 8 ha and the eastern
portion 1.5 ha. The dam wall was raised in 1986 between February and April. A bulldozer
was used and there was a high degree of human disturbance during this period. Additional
alterations were noted during surveys in March 1987 and January 1988.
Fennel-leaved pondweed Potamogeton pectinatus is the dominant aquatic plant in
the dam and surface emergent fronds may cover up to 90% of the dam surface towards the
end of the dry season.
Methods
Surveys of waterbirds were carried out during two periods: monthly from November 1982 to
May 1990 and six-monthly from July 1995 to February 2006; the former formed part of the
Southern African Waterfowl Census (SAWC, see Chapter 1) The six-monthly surveys

288
incorporated mid-summer and mid-winter surveys as part of the Coordinated Waterbird
Counts (CWAC) programme of the Animal Demography Unit, University of Cape Town.
The surveys during for both periods were conducted primarily in the morning
(between 0900 and 1100), and usually in the first two weeks of the survey month. For the
CWAC surveys mid-winter surveys were carried out in July while summer surveys were
conducted in either January or February. Observers varied during both survey periods and
results of surveys were submitted using standardized census forms. Surveys from 1982 to
1990 initially comprised only surveys of anatids, grebes, Red-knobbed Coot, Great White
Pelican, Greater Flamingo and Lesser Flamingo. From September 1985 the surveys
included all waterbirds. The CWAC surveys included surveys of all waterbird species.
Species were divided into southern African residents and Palearctic migrants (see
Chapter 1). Seasonality, abundance and trend analyses follows closely that of Appendix A.
Overall waterbird abundance and diversity was assessed for the period September 1985–
May 1990 when all waterbird species were surveyed. Trend analyses for the anatids,
grebes, Red-knobbed Coot, Great White Pelican, Greater Flamingo and Lesser Flamingo
were based on the surveys from November 1982 to May 1990; inter-annual variation for all
other species were based on the period September 1985–May 1990.
Results
Overall abundance and species richness
SAWC surveys
A total of 91 monthly surveys was carried out between November 1982 and May 1990, and
included 47 summer surveys and 44 winter surveys. Fifty species of waterbirds were
surveyed. Fourteen species were counted on all 91 surveys, while an additional 36 species
were counted on 57 surveys from September 1985, the latter incorporating 30 summer
surveys and 27 winter surveys (Table B.1). For the latter, 20 species (40%) were recorded in
25% or less of all the surveys and in numbers that did not, on average, exceed 10
individuals (Table B.1).
Overall, numbers of waterbirds at Droëvlei Dam ranged between 201 (September
1989) and 3 577 (February 1989) from September 1985 to May 1990. Mean summer counts
were two-fold higher (1 935 ± 973 birds) than mean winter counts (791.8 ± 476.4 birds). The
mean number of waterbirds counted per month ranged between 319 in August and 2 646 in
February.
Overall, the summer surveys were dominated by five species which made up 59% of
all waterbirds at the site: namely Egyptian Goose (17%), Ruff (15%), White-winged Tern

289
(10%), Little Stint (9%) and Red-knobbed Coot (8%). The winter surveys were dominated by
Red-knobbed Coot (24%), Egyptian Goose (9%), Cape Shoveler (8%), Yellow-billed Duck
(8%) and Little Grebe (7%).
CWAC surveys
A total of 22 surveys was conducted which incorporated 11 mid-summer and 11 mid-winter
surveys. Overall 47 species were recorded (Table B.1); 24 (51%) species were recorded in
less than 25% of surveys and in numbers that did not exceed a mean of 10 individuals
(Table B.1).
Mean summer counts (2 245 ± 1 847 birds ) revealed a five-fold difference when
compared with mean winter counts (437 ± 533 birds) although the variation displayed by
the standard deviations remained similar. The highest and lowest summer counts were
3346 and 100 waterbirds in January 1999 and February 2006 respectively; in winter the
highest and lowest counts were 684 and 206 counted in July 2000 and July 2005
respectively.
Egyptian Goose dominated the summer surveys, which, on average, comprised 64%
of all waterbirds; Blacksmith Lapwing and Great White Pelican were the only other species
that were numerical abundant contributing 6% each to the overall summer waterbird
population. In winter, Red-knobbed Coot (11%), Kittlitz’s Plover (10%), Cape Shoveler
(10%), Red-billed Teal (9%), Yellow-billed Duck (8%) and Blacksmith Lapwing (6%)
comprised more than half of the waterbirds at the dam.
Resident species
Overall, the number of resident waterbirds increased in early summer (OctoberDecember),
peaked during late summer (JanuaryMarch) and declined by over 50% during the winter
months (Figure B.2, Table B.1); summer populations averaged 1123 ± 361 and the mean
winter population was 567 ± 286.
Waterfowl dominated the resident avifauna and comprised 76% and 81% of the total
resident species in summer and winter respectively. Within this group, Egyptian Goose
comprised, on average, 29%, Red-knobbed Coot 14% and Yellow-billed Duck 9% of the
summer population, while Red-knobbed Coot, Egyptian Goose and Cape Shoveler
constituted 27%, 11% and 9% respectively to the winter population.
Shorebirds were the second most dominant group and comprised 16% and 11% of the
summer and winter waterbird population respectively at the dam. Blacksmith Lapwing and
Kittlitz’s Plover were the most abundant shorebirds during summer and winter and
comprised 10% and 5%, and 5% and 4% respectively of this group (Table B.1). Greater

290
Flamingo was the only wader that contributed significantly to the resident waterbird
population, comprising 4% of the total winter population (Table B.1).
Waterfowl
Ducks and geese
For SAWC, Egyptian Goose showed a strong seasonal pattern of occurrence; numbers
peaked in late summer (FebruaryMarch, max. 902 in April 1990) with a sharp decline in
May and fewer than six birds on average from June to September. Similarly, Spur-winged
Goose showed a strong seasonal pattern; numbers increased during late summer
(March–April) and peaked at the start of winter (max. 182 in April 1985) and then declined
dramatically from MayNovember (Figure B.4) with numbers less than 5 birds during this
seventh-month period. The CWAC surveys showed a four-fold increase in mean number of
birds during summer, and a five-fold decrease during winter (Table B.1).
Yellow-billed Duck had marked dry season peaks. Numbers, on average, increased
at the onset of summer, peaked from February to April with most birds occurring in March
(max. 541 in March 1985) and then declined during winter; overall less than 50 birds were
present at the dam from JulyNovember (Figure B.4). Surveys during CWAC showed both
summer and winter declines compared with SAWC; means of 8.5 birds during summer and
33.5 birds during winter represented 11-fold and two-fold changes compared with summer
and winter surveys from SAWC (Table B.1).
Numbers of Cape Shoveler fluctuated on a monthly basis and showed no strong
seasonal pattern. Maximum numbers generally occurred between October and March
(max. 217 in October 1985); July and August were the only months that had counts below
50 birds (Figure B.4). CWAC showed mean counts of 7.9 and 43.3 during summer and
winter respectively; the summer mean represented an almost eight-fold decrease in the
number of birds since SAWC, and abundance patterns in winter were similar to those
during SAWC (Table B.1).
Maccoa Duck showed erratic seasonal occurrence. On average, numbers tended to
decline in late summer (FebruaryMarch) and increased during winter into early summer
(max. 115 in May 1990) (Figure B.4). Mean summer and winter surveys for CWAC showed
a 10-fold and 7-fold decreases in numbers respectively (Table B.1).
A weak seasonal pattern was displayed by Southern Pochard; numbers peaked in
mid-summer (max. 99 in December 1982) and declined sharply towards the end of summer
(Figure B.4). Numbers remained low (< 5 birds) during winter but sporadic occurrences
tended to occur during June and August. Southern Pochard numbers declined drastically

291
during CWAC with mean summer surveys showing an almost 100% decline; no birds were
recorded during winter compared with SAWC (Table B.1).
Cape Teal showed a clear dominance during the dry summer period and a decline
during winter, although numbers did fluctuate during the summer. Numbers generally
peaked from FebruaryApril (max. 189 in April 1990) with less than 20 birds between
MayAugust (Figure B.4). On average, 50% fewer birds were present during the summer
CWAC than the SAWC surveys; winter showed similar declines with up to 40% fewer teals
during winter than the SAWC surveys (Table B.1). In terms of trends in abundance, the
Cape Teal showed significant upward trends for summer (r = 0.92, p < 0.01) but not for
winter (Figure B.7).
Red-billed Teal was regularly recorded in small numbers (mean 16 birds). Numbers
peaked in mid-summer (maximum of 124 recorded in December 1998) and tended to decline
during the winter (Figure B.4). CWAC revealed an almost 50% increase in the mean
number of birds during summer, and mean winter surveys showed a four-fold increase
(Table B.1). SAWC showed significant increases in numbers of this species during summer
(r = 0.71, p < 0.05) and winter (r = 0.71, p < 0.05) (Figure B.7)
Red-knobbed Coot
Numbers of Red-knobbed Coot remained fairly constant throughout the year
(mean 247 birds) and showed no clear seasonality; numbers tended to increase in early
winter (max. 710 in May 1986), and decline in late winter (Figure B.4). They showed
significant downward trends during summer (r = –0.77, p < 0.01) and winter
(r = –0.92, p < 0.01) (Figure B.7). These declines were reflected during the CWAC surveys;
mean summer surveys declined by up to 95% and the average winter surveys showed a five-
fold decrease since the SAWC (Table B.1).
Grebes
Only the Black-necked and Little Grebes occurred in numbers large enough to make
inferences about the occurrence at Droëvlei Dam. Black-necked Grebes showed greater
abundance in summer (mean 20 birds) than in winter (mean 10.7 birds) during SAWC
(Table B.1). Numbers generally peaked in December with decreasing number of birds from
January–March. A maximum of 148 birds was recorded in November 1985. For CWAC, low
numbers of birds were recorded with a mean summer count of 1.5 birds and a mean winter
count of 2.5 birds, which represented declines of over 95% since SAWC. The summer
maximum count of six birds is a 96% drop from the 148 birds recorded during SAWC;

292
winter shows similar trends (Table B.1). A similar pattern emerges for the Little Grebe.
The species showed a strong late-summer seasonal peak during SAWC, although overall
summer and winter means differ only marginally (Figure B.4). In terms of trends, larger
numbers of birds, on average, were seen during SAWC than during CWAC during both
summer and winter (Table B.1). There was a 97% reduction in numbers between the two
survey periods.
Reasons for both species’ declines at the dam could probably be explained by
variations in food abundance caused by changes to the water quality and periods of
inundation. Water-levels during summer at the dam during CWAC were low (M Delport
pers. comm.) which resulted in shallow open-water which was not suited to these species
diving feeding habits.
Reed Cormorant
Reed Cormorant occurrence showed strong seasonality from 1985–1990; numbers peaked
during the dry season (January–March; max. 143 in February 1990) with few birds present
during the wetter months (May–November) (Figure B.5). This pattern suggests
considerable movement to and from Droëvlei Dam on an inter-annual basis. The CWAC
surveys showed larger numbers, on average, during winter than during summer (Table B.1)
with decreased abundances since the SAWC surveys.
Flamingos and other large wading birds
Greater Flamingo showed no strong seasonal pattern of occurrence at Droëvlei Dam. On
average, numbers fluctuated throughout the year (mean 26 birds) with peaks between
March and July (max. 214 in April 1987) (Figure B.6). Fewer than 20 birds were recorded
between August and November. Numbers during CWAC showed similar seasonal
abundances (Table B.1). In contrast, Lesser Flamingo abundance was strongly seasonal
with early winter peaks between April and June (max. 315 in June 1986) (Figure B.5).
Surveys conducted during CWAC revealed zero birds during summer and a winter mean of
13 birds. Lesser Flamingo showed significant population declines during SAWC for summer
(r = –0.73, p < 0.05) and winter (r = –0.70, p < 0.05) (Figure B.5).
Other large wading birds were generally uncommon at the dam and occurred in
small numbers. African Sacred Ibis occurred in small numbers during SAWC; the CWAC
surveys showed an increase in the abundance of this species during both summer and
winter (Table B.1); Glossy Ibis showed a similar pattern but only during summer. Cattle

293
Egret and African Spoonbill peaked in relatively large numbers during SAWC, but both
occurred in smaller numbers during CWAC (Table B.1).
Gulls
The only gull to occur frequently was Kelp Gull; it was mostly recorded during CWAC
surveys. The SAWC surveys showed few birds with a maximum of 11 birds recorded in July
1986. Overall, mean summer and winter counts both recorded < 2 birds. The mean summer
and winter counts for CWAC were 15.1 and 16.6 respectively with a maximum of 107 birds
recorded in February 2004.
Shorebirds
Blacksmith Lapwing and Kittlitz’s Plover showed strong seasonality during SAWC; both
species dominated during late summer (December–February) with peak numbers during
January (Figure B.5, Table B.1). Maximum counts of 274 lapwings and 288 plovers were
recorded during January 1987. CWAC surveys during summer suggested that mean
abundance of Blacksmith Lapwings decreased. More Kittlitz’s Plovers seem to be present in
recent times (Table B.1).
Black-winged Stilt showed some seasonality (Figure B.5). On average 19.5 and
11.1 birds were recorded during summer and winter during SAWC; results from CWAC
suggested that summer counts declined between the two periods (Table B.1). Maximum
counts of 53 in April 1989 and 52 in January 1989 showed that peak occurrence can occur
in summer or in early part of winter and within the same annual cycle.
Monthly occurrence of Pied Avocet during SAWC showed no strong seasonal
preference although peaks tended to occur from DecemberMarch (Figure B.5). A maximum
of 193 were recorded in April 1987; mean summer and winter counts were 26.5 and 10.4
birds respectively. Declines occurred during winter but with small resurgences. The CWAC
surveys showed reduced mean summer counts (16 birds) but similar winter means (10.3)
compared with the SWAC surveys. The maximum count occurred during summer (60 birds
recorded in February 2003).
Breeding was recorded in three species during SAWC and occurred at low densities
(three pairs or fewer; Table B.3); Blacksmith Lapwing bred in July, August and February,
Black-winged Stilt in July, August and October, and Kittlitz’s Plover in July, August and
January.

294
Great White Pelican
This species was an irregular visitor to Droëvlei Dam during SAWC and showed summer
peaks (Figure B.5). Although peak numbers of 52 and 51 birds were recorded in March
1990 and December 1985, fewer than six birds were recorded on average during summer or
winter (Table B.1). Pelicans were largely absent between April and November. CWAC
showed larger summer means (126.8 birds) than winter means (12.5 birds). The peak count
of 400 birds was recorded in February 2003.
Palearctic migrants
During SAWC, 10 Palearctic migrant species occurred at Droëvlei Dam (Table 1). Birds
arrived in September, peaked during January and February and departed in April; few
birds remained during the austral winter (Figure B.3c). Ruff, Little Stint and Curlew
Sandpiper together constituted 73% of Palearctic migrants, and White-winged Tern 26%.
Little Stint numbers peaked from December–February (max. 920 in February 1989),
Ruff peaked from January–March (max. 837 birds in February 1989) and Curlew
Sandpiper numbers peaked in October (max. 365 birds in October 1987) (Figure B.5). The
latter did exhibit more variation during the summer months. White-winged Terns
increased in November, peaked in mid-summer (max. 590 birds counted in February 1990)
and then departed by the end of April (Figure B.5). Overall, mean summer counts for
CWAC showed lower abundances for Ruff, Little Stint, Curlew Sandpiper and White-
winged Tern, although the largest flock for White-winged Tern (700 birds in January 2000)
was recorded during this period (Table B.1)
The conservation importance of Droëvlei Dam for waterbirds
Droëvlei Dam supported a number of waterbird species that are important relative to
respective population thresholds (Table B.4). During SAWC surveys, Maccoa Duck and Pied
Avocet surpassed 1% of their estimated global populations on at least one occasion (Table
B.4, Wetlands International 2006). Six species reached southern African IBA thresholds
(Barnes 1998): Black-necked Grebe, Maccoa Duck, Cape Shoveler, Yellow-billed Duck,
Lesser Flamingo and Pied Avocet reached levels that represented more than 0.5% of their
estimated southern African populations. When considering the CWAC data, only the Great
White Pelican surpassed the 1% threshold level. Neither Maccoa Duck nor Pied Avocet,
which reached 1% levels during SAWC, reached these levels during CWAC. Egyptian
Goose, Great White Pelican and Cape Shoveler were the only three species that reached or

295
surpassed sub-regional IBA levels; the Cape Shoveler was the only species that reached
0.5% levels during both survey periods.
The SAWC surveys had three species whose maximum counts contributed to more
than 10% of the estimated Western Cape population: White-winged Tern (17%), Maccoa
Duck (14%) and Ruff (14%) (Table B.4). The CWAC surveys showed some changes to this:
White-winged Tern remained top and showed a slight increase, to 20%, but Great White
Pelican increased from 2% to 15% and Egyptian Goose from 3% to10%; Ruff declined to 6%
and Maccoa Duck to 3%. Pied Avocet, Yellow-billed Duck, Spur-winged Goose and Little
Stint also showed decreases (Table B.4). CWAC surveys could have missed peak
occurrences during non-surveyed months and therefore occurrence at the site could be
under-estimated. Consequently, these comparisons should be interpreted cautiously.
Three Red Data species were recorded at Droëvlei Dam: Lesser Flamingo (Near-
threatened), Greater Flamingo (Near-threatened) and Great White Pelican (Near-
threatened) (Barnes 2000). The Lesser Flamingo was the only species to occur at regionally
significant levels but this occurred only once (Table B.4). Both flamingo species showed
declines towards the end of the 1980s; the Lesser Flamingo was not recorded after the
winter of 1987 and Greater Flamingo was recorded in low numbers. The CWAC surveys
recorded both species but at lower overall mean numbers during summer and winter than
during the SAWC surveys, suggesting that the flamingos have returned to the dam.
Although Palearctic shorebirds did not occur in any globally significant numbers
during SAWC or CWAC, their occurrence at Droëvlei Dam does suggest that it provides
suitable alternate habitat during the austral summer. Curlew Sandpipers tend to use the
site early on in the season (October, Figure B.5) and numbers of Little Stint and Ruff
peaked towards the end of summer suggesting that they use the dam prior to their autumn
migration. During this period the dam was at its lowest water levels which probably
accounts for their occurrence at these times.
Waterbird Conservation Value (WCV) score
The monthly waterbird conservation value scores (WCV) scores for Droëvlei Dam between
November 1982–May1990 (SAWC surveys) are shown in Figure B.8. The WCV scores after
September 1985 incorporated all waterbirds while those prior to this date included only the
19 focal species surveyed by SAWC. The September 1985–May1990 data should be seen as
the standard, overall WCV scores; the pre-1985 data are included mainly for comparative
purposes for the species concerned.
Overall, scores were relatively small with most values below 3.0 (compare with
Chapters 2 and 3). Seven surveys had values of 2.0 or more, and January 1987 revealed the

296
largest index (2.97). Although inter-annual fluctuations were evident, generally summer
scores were higher reflecting larger populations of waterbirds during this time. This is
supported by the seasonal abundance data presented in this paper. There was a drop-off in
numbers into winter, and usually August and September had the lowest scores.
For the six species that reached 1% or 0.5% threshold levels (see above, Table B.4),
their annual occurrence patterns are shown colour coded in Figure B.8. It is noticeable the
amount of monthly and inter-annual variation between the species. Maccoa Duck, for
example, contributes fairly regularly to the scores from January 1985 and then is absent
from January 1989–July 1989 with a strong resurgence from October 1989. Prior to
September 1985, a similar pattern seems to be evident (Figure B.8). Pied Avocet is erratic
in its occurrence and has two periods (January 1987 and January 1989) during which it
occurs in large numbers. Black-necked Grebe also occurred erratically and seemed to have
been more abundant early on in the surveys (i.e. September–December 1985) than during
later surveys. Yellow-billed Duck and Cape Shoveler occurred almost throughout the study
period with periods of abundance and then periods of scarcity. At times, the two species
abundance mirrored each other (e.g. February–May1986, January–May 1998) but also
times when one species was more abundant than the other (e.g. February–March 1985,
September–November 1985, April–June 1987 and March–April 1990). Lesser Flamingo also
occurred irregularly but when it did it did make large contributions to the WCV score at the
dam (e.g. May–June 1983, March 1984 and June 1986).
On some occasions (January–February 1986, January 1987, January 1989 and
March–April 1990) the WCV score for ‘Other’ species was larger (often exceeding the 1%
level) than for either or combination of the conservation important species. The proportion
they contributed to the overall index was substantial and highlighted the cumulative value
of species that are deemed not to be conservation worthy species. This then emphasized the
overall value of the WCV score as an important conservation tool that encompasses not only
species that occur proportionately in high abundance, but also species that occur in
relatively small numbers, but cumulatively are valuable (see Chapter 2).
Figure B.9 shows the relationship between the monthly WCV score and the total
monthly counts from September 1985–May 1990. Although the relationship is relatively
strong, that as abundance increases so the WCV score increases, there are times when
large numbers of birds (> 2 500 birds) result in low WCV scores There are also times when
abundance is low (c. 1 000–1 700 birds) but the WCV score is high which translates to more
species having a proportionately higher number of birds in relation to their 1% threshold
levels and hence having a larger WCV score. It can be argued that it is at these times that

297
the site has a higher waterbird conservation value than when the site supports a greater
abundance of birds.
Discussion
Seasonal variation of waterfowl
Patterns of waterfowl occurrence and abundance at Droëvlei Dam varied but seven of the
11 species (Egyptian Goose, Spur-winged Goose, Yellow-billed Duck, Cape Teal, Red-billed
Teal, Southern Pochard and South African Shelduck) showed summer peaks, indicating the
importance of the dam as a dry-season refuge. Cape Shoveler and Maccoa Duck were the
only species to show no clear seasonal pattern and with larger winter numbers than any
other of the Anatidae (Figure B.4).
Three species of ducks were recorded moulting at the dam during SAWC (Table B.2).
Cape Shoveler and Cape Teal start to moult in October with larger numbers of shovelers
(max. 32 birds in Oct. 1985) compared with the teals. The moulting period for the Cape
Shoveler ended in December whereas some Cape Teals moulted through to January. Peak
number of moulting birds for Cape Teal occurred in December (max. 11 birds in Dec. 1989).
Numbers of moulting Egyptian Geese peaked in December (max. 10 birds in Dec. 1989) and
this was also the month in which moulting started in this species (Table B.2); most
Egyptian Geese finished their moult in February. Based on the seasonal abundance for
these species (Table B.1), it is clear that only a small percentage of these three species
actually moult at the site, but it nevertheless indicated the safe refuge the dam provided for
moulting waterfowl. No moulting data was provided for CWAC so no trend comparisons
could be drawn between the two survey periods.
Ten species of waterfowl used Droëvlei Dam for breeding with most breeding activity
taking place from September to January (Table B.3). The ducks and geese bred mainly from
September to December and the three grebe species (Little, Black-necked and Great
Crested) bred from December to April. Red-knobbed Coot was the only species recorded
breeding during winter; the grebes, ducks and geese were largely absent during the winter
months. Paarl Waste Water Treatment Works showed winter influx of Little Grebe
(Harebottle 2008, Appendix A) and it is probable that at least a proportion of the population
may come from Droëvlei Dam following breeding as the site is less than 30 km away. The
decline in numbers of most waterfowl in early winter coincided with the onset of winter
rain (Figure B.8) and suggests that as temporary water bodies fill in the surrounding
landscape most birds move to these areas to breed (Little 1995, Harebottle 2008). This
relationship was strongest for Yellow-billed Duck, Egyptian Goose and Cape Teal.

298
How important is Droëvlei Dam for waterbirds?
The largest single count of waterbirds at Droëvlei Dam was 3 576 birds which in the
context of farm dams is relatively high (Table B.1). It is representative of a large number of
farm dams, large and small, scattered across the agricultural regions of the winter rainfall
region. Cumulatively, these dams account for a large number of waterbirds. It is therefore
of interest to consider the service functions for waterbirds which can be performed by farm
dams such as Droëvlei Dam. This wetland, and others like it, variably fulfilled four
important requirements for several species of waterbirds: safety from predators and
disturbance, food, breeding habitat and moulting refuge.
Many of the waterbirds that used Droëvlei Dam made little or no use of food in the
wetland. The pelicans and Kelp Gulls primarily used the dam for roosting as they foraged
away from the dam at nearby municipal refuse dumps. For the geese, and many ducks, it
was a safe day-time refuge between nocturnal forays to forage at alternative sites and
habitats. It was safe because the most threatening predators and causes of disturbance are
terrestrial animals, including humans, which are deterred by water and especially deep
water. Given the effective safety the dam offers, waterbirds can roost, forage for food if this
is available, breed if there is suitable nesting habitat, or undertake their annual moult
during which they may become less efficient fliers or, in the case of waterfowl, may become
totally flightless.
Waterbirds are adapted to dynamic natural habitats that may change radically on an intra-
as well as inter-annual basis for example the flooding and drying out of shallow seasonal
wetlands, or the changes in floodplain conditions of major rivers. Accordingly most
waterbirds must regularly carry out reconnaissance of the state of regional wetlands to
establish where conditions are suitable for safety and feeding. In the course of these
reconnaissances they may stop over at different wetlands for short periods. Such
reconnaissance visits are the likely cause of the intra-seasonal fluctuations in the numbers
of waterbird species at Droëvlei Dam and of the irregular occurrences of some of the less
numerous waterbird species. For example, nomadic specie such Pied Avocets and Black-
winged Stilts (Tree 1997a, b) showed winter resurgences at Droëvlei which suggested that
these species move unpredictably between wetlands.
Seasonal changes occur in the physical state of the dam and in the needs of
particular species or groups of species that use this wetland. In the case of the birds these
need consideration at local, regional and global levels. On the global level Palearctic
shorebirds, which breed in northern Eurasia, pass their contra-nuptial period in warmer
climates to avoid the severe boreal winter. Nine of these shorebird species, and the White-
winged Tern which breeds on seasonal wetlands in south-central Eurasia (Tomiałojć and

299
van der Winden 1997), have been recorded at Droëvlei; their occurrence at the dam is
primarily or solely during the austral summer. The terns feed largely on aquatic insects
whose numbers are highest in this season and the more numerous of the shorebirds forage
in the shallow waters or exposed waterlogged soils of the dam as the water level draws
down through the mid to late summer.
Several of the resident southern African species are also (mainly) non-breeding
visitors to the winter rainfall region. These include the two flamingos and the African
Pochard (Hockey et al. 1989). All three species breed in the summer rainfall regions of
southern Africa and when seasonal wetlands in the summer rainfall region dry out they
move to wetlands either at the coast, in the case of flamingos, or, in the case of all three
species, to wetlands in the winter rainfall region.
Regionally resident waterbirds have differing reasons for seasonal changes in their
use of Droëvlei Dam some of which are readily understandable, others which are not. The
two species of goose leave the wetland at the start of the winter rains. Presumably they
then disperse to graze on newly sprouting grasses. They do not return to the dam until the
regional spring, after they have bred, and at least some moult at the dam. The ten species
of regionally resident ducks that occur at Droëvlei Dam have similar seasonal needs. After
seasonal rains have raised ground water levels to the extent that low lying areas flood,
most of these ducks disperse to forage and breed at these seasonal shallow wetlands. Such
wetlands, because they normally dry out annually, have no fish and without competition
from fish there is a higher density of aquatic invertebrates and seeds for the ducks to feed
on. Also because these wetlands are shallow they are suitable for ducklings, which in these
precocial species must feed themselves and to do so need to be able to dabble down or dive
to the benthos where food is most concentrated. As the shallow wetlands dry out through
the early summer these ducks move to more permanent waterbodies such as Droëvlei Dam
where the adult birds undergo their annual flightless moult. For the Reed Cormorant its
late summer peak at Droëvlei suggests a post-breeding influx; the dam does not provide
suitable breeding conditions for colonial nesting birds (M Delport pers.comm.). Reed
Cormorants breed from July–January in the south-western Cape (Hockey et al. 1989) and
dispersion to non-breeding sites probably takes place soon after the end of the breeding
season.
Regional population changes
Several waterbird species have undergone appreciable changes in their status at Droëvlei
Dam over the 18-year study period, some experiencing substantial decrease in numbers

300
others a marked increase. None of these changes can be attributed to any change at the
wetland.
The regional population of Kelp Gulls has increased over the past decades, probably
because the provision of food at municipal waste dumps enables more young birds to
survive (Steele and Hockey 1990) and because this species is no longer confined to offshore
islands but now breeds at several mainland localities. There has been a concomitant
increase in the occurrence of this gull at inland localities (Swanepoel et al. 2006). The
population of the Great White Pelican has also increased in part through better protection
of the single regional breeding colony at Dassen Island (Williams and Borello 1997), but
also because this species has taken to foraging on waste at pig and poultry farms as well as
at municipal dumps (Crawford et al. 1995, de Ponte Machado 2010). Presumably both
species have been increasingly attracted to the region around Droëvlei Dam by the
availability of waste products and use the dam as a resting place. The increase in numbers
at Droëvlei Dam between SAWC and CWAC was consistent with the regional population
trend.
The regional populations of both species of goose have been increasing over the past
decades in part due to a decrease in hunting pressure (Magnall 1999, Magnall and Crowe
2001). Most of the species that have decreased markedly across the 23 years are migrants
and, in the absence of any obvious regional reasons for their decrease, it is assumed that
they are affected by factors either in their breeding regions or en route between breeding
and contra-nuptial areas.
The role of farm dams in waterbird conservation
The primary purpose of farm dams is water storage for crop irrigation and/or as drinking
provision for stock. These dams are usually earthen and deep maximizing storage capacity
while minimizing construction and maintenance costs. Deep dams provide good habitat for
waterfowl and other open-water species (e.g. grebes and coot). Larger dams seem to be
exploited more often by waterbirds providing more space and resource partitioning allowing
larger numbers and greater species richness (Davidson and Delany 2000, Froneman et al.
2001). They also provide ideal refuges as moulting sites and with few natural deep
wetlands in the Western Cape (see Davies and Day 1998), most waterfowl in the Western
Cape use artificial sites as summer or moulting refuges (Siegfried 1967, Kaletja-Summers
et al. 2001a,b; Harebottle et al. 2008). This highlights the importance of artificial sites in
providing suitable habitat and conditions for waterfowl.
Historically, at least before the first large state dams were built in South Africa
(c. 1930s, Davies and Day 1998), waterfowl and other waterbird populations in the WRR

301
would have had to move significant distances after breeding to find suitable large
waterbodies at which to moult. These migrations would have been annual and some
probably involved long-distance movements to summer rainfall regions (Davidson and
Delany 2000). As an increased number of impoundments and farm dams were constructed
in the WRR the need to move to distant moult sites became retracted and shorter moult
migrations were undertaken. Although current migration patterns are still poorly
understood for many waterfowl species (Underhill et al. 1999), it is probable, through the
provision of these artificial wetlands, that some species have altered their migratory
patterns and routes in the last five to six decades. Davidson and Delany (2000) suggested
that the creation of year-round habitat can lead to changed seasonal pattern of movements,
particularly for open-water species (incl. grebes, ducks and geese). In some cases they may
now remain at their breeding sites to moult (e.g. Strandfontein Sewage Works; Kaletja-
Summers 2001b).
While there are thousands of farm dams scattered around the WRR, and many the
size of Droëvlei Dam, the use of and inter-connectivity between these farms dams by
waterbirds is poorly understood. They have undoubtedly provided suitable alternative
habitats to the larger, historically well-known and well-used wetland sites in the region and
may afford certain species better feeding, breeding or moulting opportunities. For example,
Radyn Dam (33°18’S, 18°45’E) a 3.5-ha farm dam 20 km north of Malmesbury supports up
to 1 750 South African Shelduck regularly during summer (CWAC unpubl. data). Many
farm dams have vegetated islands and these have become common breeding sites for
colonial breeders such as herons, egrets and ibises (B de Kock pers. comm., F Ellmore pers.
comm.).
Connectivity between farm dams and other larger permanent wetlands does occur
(e.g. regular movement of Egyptian Goose flocks flying between Rietvlei Wetland Reserve
and Droëvlei Dam; DMH pers obs; AJ Williams pers. comm.), but as at farm dams, this
connectivity is not well understood (Haig et al. 1988). Waterbirds are largely opportunistic
in their behaviour and will utilize any suitable habitat they find and consequently move
around in response to environmental conditions (Little et al. 1995, Davidson and Delany
2000). Some species (e.g. South African Shelduck, Cape Shoveler), however, have preferred
moult or post-breeding refuge sites and these are used regularly (Siegfried 1967). This
seasonal use of different sites highlights the importance of these sites in the species’ annual
cycle and the need to establish conservation measures at a regional level. Since Droëvlei
Dam supports large numbers of Egyptian Goose, many of which moult there, more
intensive population monitoring (including colour-banding) could be encouraged in order to
track changes in abundance, movements and survival.

302
Management actions and recommendations
Ideally Droëvlei Dam, and other similar farm dams, should be managed in ways to offer
viable habitat for waterfowl populations, particularly for Egyptian Goose; this species, and
other Anatidae, primarily use the dam for moulting and as a non-breeding refuge. Although
numbers of Egyptian Goose are on the increase in the Western Cape and regarded as a pest
species by farmers (Magnall and Crowe 2001), the species should be afforded some
protection. It is a huntable species in the Western Cape (K.A. Shaw pers. comm.) and
should population numbers exceed carrying capacity (i.e. it reaches pest status),
sustainable and regulated hunting could be carried out in order to control numbers. In
2011, the daily bag limit per licensed hunter was 10 for Egyptian Geese (Province of the
Western Cape 2010).
As a privately owned dam and site which supports important numbers of waterfowl
species (Table B.1) the long-term protection of Droëvlei Dam needs to be considered.
Froneman et al. (2001) suggested that proper management and landowner cooperation is
important to secure farm ponds as viable waterbird habitat and conservation in the long-
term. The ‘Stewardship programme’ administered by CapeNature (van Niekerk 2004,
CapeNature 2009) which empowers landowners to commit to conservation practices on
their property may be one solution in ensuring the long-term sustainability of the site.
Similar initiatives have been implemented in The Netherlands (Van Paasen 1991) and
Australia (Barrett 2000) where integrated approaches have been used to encourage bird
conservation on farmlands.
Further research and monitoring is imperative to better understand the inter-
connectivity and use of farm dams by waterbirds. Ongoing waterbird surveys at Droëvlei
Dam and at other surrounding farm dams would add value to CWAC particularly in a more
regional context. Increased ringing studies to mark individuals particularly of waterfowl
species should be conducted in order to ascertain immigration and emigration from
Droëvlei Dam and to gauge use of the landscape on an annual basis.

303
References
Allan DG, Barnes KN, Jenkins AR and Whittington PA 1996. Baseline biological survey, fauna and flora, Lesotho Highlands Water vproject phase 1B Mohale Dam – Birds. ADU research report No. 18.
Barnes KN (ed.) 1998. Important Bird Areas of southern Africa. BirdLife South Africa, Johannesburg.
Barnes KN (ed.) 2000. The Eskom Red Data book of birds of South Africa, Lesotho and Swaziland, BirdLife South Africa, Johannesburg.
Barret G 2000. Birds on farms: ecological management for agricultural sustainability. Supplement to Wingspan 10(4), December 2000. Birds Australia, Melbourne.
CapeNature 2009. Conservation in landowner’s hands–how can you make a contribution to conservation? Internal brochure, Western Cape Nature Conservation Board, Cape Town.
Cowan GI 1995. Wetland regions of South Africa. In: Cowan GI (ed.) Wetlands of South Africa. Department of Environmental Affairs and Tourism, Pretoria. pp. 21–31.
Cowan GI and van Riet W 1998. A directory of South African wetlands. Department of Environmental Affairs & Tourism, Pretoria.
Crawford RJM, Cooper J and Dyer BM 1995. Conservation of an increasing population of Great White Pelicans Pelecanus onocrotalus in South Africa’s Western Cape. South African Journal Marine Science 15: 33–42.
Davidson N and Delany S 2000. Biodiversity impacts of large dams: Waterbirds. In: Berkamp G, McCartney M, Dugan P, McNeely J and Acreman, M. Dams, ecosystem functions and environmental restoration, Thematic Review II.1 Prepared as an input to the World Commission on Dams, Cape Town, http:// www.dams.org.
Davies B and Day J 1998. Vanishing waters. UCT Press, Cape Town. De Ponte Machado M 2010. Population dynamics of Great White Pelicans in southern Africa:
causative factors and influence on other seabirds. Unpubl. PhD thesis, University of Cape Town.
DWAF 1986. Management of the water resources of the Republic of South Africa. Department of Water Affairs, Government Printers, Pretoria.
Froneman A, Mangnall MJ, Little RM and Crowe TM 2001. Waterbird assemblages and associated habitat characteristics of farm ponds in the Western Cape. Biodiversity and Conservation 10: 251–270.
Guillet A and Crowe TM 1986. A preliminary investigation of patterns of distribution and species richness of southern African waterbirds. South African Journal of Wildlife research 16: 65–81.
Haig SM, Melmahn DW and Oring LW 1998. Avian movements and landscape connectivity in landscape conservation. Conservation Biology 12: 749–758.
Hockey PAR, Underhill LG, Neatherway M and Ryan PG 1989. Atlas of the birds of the southwestern Cape. Cape Bird Club, Cape Town.
Hockey PAR, Dean WRJ and Ryan PG (eds) 2005. Roberts’ birds of southern Africa. Trustees of the John Voelcker Bird Book Fund.
Harebottle DM, Williams AJ, Weiss Y and Tong G 2008. Waterbirds at Paarl Waste Water Treatment Works, South Africa, 1994–2004: seasonality, trends and conservation importance. Ostrich 79: 147–163.
Kalejta-Summers B, Allan DG and Longrigg DG 2001a. Long-term trends, seasonal abundance and energy consumption of waterbirds at Rietvlei, Western Cape, South Africa, 1950–1997. Ostrich 72: 63–79.
Kalejta-Summers B, McCarthy M and Underhill LG 2001b. Long-term trends, seasonal abundance and energy consumption of waterbirds at Strandfontein, Western Cape, South Africa, 1953–1993. Ostrich 72: 80–95.
Little RM, Vester KC and Crowe TM 1995. Temporal and spatial patterns of breeding activity of 12 duck species (Anatidae) in the Cape Provinces, South Africa, and their implications for hunting seasons. South African Journal of Wildlife Research 25: 17–22.

304
Magnall MJ 1999. The role of farm dams in conserving waterbirds in the Western Cape. South African Wetlands. Newsletter on Activities Relating to the Ramsar Convention in South Africa 10: 11–13.
Mangnall MJ and Crowe TM 2001. Managing Egyptian Geese on the croplands of the Agulhas Plain, Western Cape, South Africa. South African Journal of Wildlife Research 31: 25–34.
Province of the Western Cape 2010. Western Cape Province: hunting seasons, daily bag limits and hunting by the use of prohibited hunting methods. Provincial Gazette Extraordinary 6805: 1–5.
Siegfried WR 1967. Trapping and ringing of Egyptian Geese and African Shelduck at Vogelvlei, Cape. Ostrich 38: 173–185.
Skead DM and Dean WRJ 1977. Status of the Barberspan avifauna, 1971–1975. Ostrich Suppl. 12: 3–42.
Steele WK and Hockey PAR 1990. Population size, distribution and dispersal of Kelp Gulls in the southwestern Cape, South Africa. Ostrich 61: 97–106.
Swanepoel D, Underhill LG, Harebottle DM, Wheeler MJ and Williams AJ 2006. Waterbirds at the Theewaterskloof Dam, Western Cape, South Africa,1993–2005. Ostrich 77: 170–174.
Tomiałojć L and van der Winden J 1997. White-winged Black Tern Chlidonias leucopterus. In: Hagemeijer EJM and Blair MJ (eds.). The EBCC atlas of European breeding birds: their distribution and abundance. pp. 366–367. T & AD Poyser, London.
Taylor PB, Navarro RA, Wren-Sargent M, Harrison JA and Kieswetter SL (eds) 1999. TOTAL CWAC Report: Coordinated Waterbird Counts in South Africa,1992–1997. Avian Demography Unit, University of Cape Town, Cape Town.
Tree AJ 1997a. Blackwinged Stilt Himantopus himantopus. In: The atlas of southern African birds. Vol. 1: Non-passerines. Harrison JA, Allan DG, Underhill LG, Herremans M, Tree AJ, Parker V and Brown CJ (eds), pp. 436–437, BirdLife South Africa, Johannesburg.
Tree AJ 1997b. Avocet Recurvirostra avosetta. In: The atlas of southern African birds. Vol. 1: Non-passerines. Harrison JA, Allan DG, Underhill LG, Herremans M, Tree AJ, Parker V and Brown CJ (eds), pp. 434–435 BirdLife South Africa, Johannesburg.
Underhill LG, Tree AJ, Oschadleus HD and Parker V. 1999. Review of ring recoveries of waterbirds in southern Africa. Avian Demography Unit, University of Cape Town, Cape Town.
Van Niekerk A 2004. Taking stewardship to the people. South African Country Life, February 2004: 84–86.
Van Paasen AG 1991. Integrating management measures: a case study to achieve coexistence between cost-effective agriculture and waterfowl. In: Van Roomen M and Madsen J (eds) Waterfowl and agriculture: review and future perspective of the crop damage conflict in Europe. IWRB Special Publication No. 21 pp. 61–70. Wageningen, The Netherlands.
Wetlands International 2006. Waterbird Population Estimates – Fourth Edition. Wetlands International Global Series No. 12, Wageningen, The Netherlands.
Williams AJ and Borello WD 1997. White Pelican Pelicanus onocrotalus. In: The atlas of southern African birds. Vol. 1: Non-passerines. Harrison JA, Allan DG, Underhill LG, Herremans M, Tree AJ, Parker V and Brown CJ (eds), pp.24–25, BirdLife South Africa, Johannesburg.

Table B.1 Summary of waterbird surveys for Droëvlei Dam from 1982–1990 (Southern African Waterfowl Census = SAWC) and 1995–2006 (Coordinated Waterbird Counts = CWAC). Species marked with an asterisk were recorded on fewer than 25% of surveys during SAWC or CWAC respectively.
Species
SAWC (1982–1990) CWAC (1995–2006)
Summer Winter Summer Winter
Mean ( S.D.) Min-Max1 Mean ( S.D.) Min-Max Mean ( S.D.) Min-Max Mean ( S.D.) Min-Max
Residents Waterfowl Egyptian Goose 282 ± 199.3 2–882 72.3 ± 146 0–902 1453 ± 836.8 3–2600 14.5 ± 12.1 3–48
Red-knobbed Coot 236.5 ± 14 16–540 257 ± 39 3–710 9.3 ± 14.6 0–38 47 ± 36.9 5–115
Yellow-billed Duck 100.9 ± 73.4 6–541 56.5 ± 59.7 1–323 4.1 ± 5.9 0–15 33.6 ± 43.6 3–156
Cape Shoveler 74.5 ± 16.7 19–217 53.4 ± 12.5 6–167 8 ± 11.9 0–41 43.3 ± 58.7 0–200
Little Grebe 45.4 ± 29.2 0–151 40.9 ± 30.8 0–155 1.8 ± 2 0–4 11.3 ± 14.8 0–48
Cape Teal 42.9 ± 9.7 0–128 20.7 ± 13.6 0–189 18 ± 26.1 0–77 13.1 ± 14 1–45
Maccoa Duck 32.3 ± 11.3 0–111 32.3 ± 6.2 0–115 4.5 ± 5.6 0–14 5 ± 8.8 0–26
Red-billed Teal 20.6 ± 9.4 0–124 10.5 ± 2.9 0–58 37.6 ± 49.4 0–110 38.8 ± 40.2 2–114
Black-necked Grebe 20.1 ± 17.3 0–148 10.8 ± 6.6 0–77 1.5 ± 2.3 0–6 2.5 ± 3.7 0–9
Southern Pochard* 13.3 ± 12 0–99 4.7 ± 4.8 0–69 0.4 ± 0.9 0–2 – –
South African Shelduck* 8.2 ± 6.7 0–60 1.5 ± 2.4 0–27 1.4 ± 2.3 0–6 0.8 ± 1.4 0–4
Spur-winged Goose* 6.1 ± 7 0–92 5.4 ± 11.4 0–182 15.3 ± 21.6 0–56 5 ± 5 1–18
Great Crested Grebe* 5.6 ± 1.6 0–21 2.2 ± 1.4 0–9 0.9 ± 1.2 0–3 0.7 ± 1.3 0–4
Hottentot Teal* – – 0.1 ± 0.1 0–1 – – – –
Sub–total: 887.8 ± 263.9 332–1768 567.8 ± 243.8 164–1675 1555.2 ± 979.7 3–2972 215 ± 239.9 15–787
Pelicans –
Great White Pelican 5.6 ± 4.7 0–52 1.3 ± 1.4 0–16 130.1 ± 142.5 0–400 12.5 ± 27.1 0–93
Flamingos –
Greater Flamingo 24.1 ± 7.6 0–146 27.1 ± 11 0–214 16.7 ± 31.6 0–100 22.9 ± 30.8 0–109
Lesser Flamingo* 10.9 ± 13 0–242 45.4 ± 37.8 0–315 – – 13 ± 39 0–130
Sub–total: 35 ± 20.6 0–148 72.4 ± 48.7 0–440 16.7 ± 31.6 0–100 35.8 ± 69.8 0–239
Cormorants and darter
Reed Cormorant 23.7 ± 21 0–143 3.4 ± 4.4 0–26 4 ± 7.1 0–24 9.9 ± 17.5 0–61
305

Table B.1 contd.
Species SAWC (1982–1990) CWAC (1995–2006)
Summer Winter Summer Winter
Mean ( S.D.) Min–Max Mean ( S.D.) Min–Max Mean ( S.D.) Min–Max Mean ( S.D.) Min–Max White-breasted Cormorant* 3 ± 2.8 0–18 2.1 ± 1.7 0–13 2.5 ± 2.3 0–6 6.2 ± 10.3 0–28 African Darter* 0.2 ± 0.2 0–2 0.1 ± 0.2 0–1 1 ± 1.5 0–4 2.1 ± 2.6 0–7
Sub–total: 26.8 ± 23.9 0–156 5.6 ± 6.2 0–27 7.4 ± 10.8 0–34 18.1 ± 30.3 0–96 Shorebirds Blacksmith Lapwing 107.1 ± 67.7 1–274 25.3 ± 30.2 4–209 131.1 ± 78.3 2–229 25.5 ± 11.8 5–41 Kittlitz's Plover 54.7 ± 55.8 0–288 21.1 ± 13.1 0–145 101.2 ± 89 0–339 44.5 ± 41.9 2–134 Pied Avocet 26.6 ± 17.4 0–193 10.4 ± 9.9 0–88 16 ± 22.9 0–60 10.3 ± 13.4 0–45 Black-winged Stilt* 19.5 ± 7.7 0–52 11.2 ± 10.4 0–53 13.4 ± 17.2 0–45 13.8 ± 15.6 2–57 Three-banded Plover* 0.7 ± 0.5 0–4 6.3 ± 5.7 0–35 2.6 ± 3.1 0–8 15.2 ± 17.1 5–65 African Snipe* 0.2 ± 0.4 0–4 – – 0.7 ± 2.2 0–7 0.7 ± 1.6 0–5
Sub–total: 208.6 ± 149.3 3–708 74.1 ± 69.2 5–378 264.8 ± 212.4 2–688 109.8 ± 101.1 14–347 Gulls Kelp Gull* 0.3 ± 0.6 0–6 1.3 ± 1.4 0–11 14.3 ± 31.5 0–107 16.7 ± 22.8 0–82 Hartlaub's Gull* 0.2 ± 0.2 0–1 0.2 ± 0.4 0–3 – – – – Grey-headed Gull* 0.1 ± 0.2 0–2 0.1 ± 0.2 0–2 – – – –
Sub–total: 0.5 ± 0.9 0–6 1.6 ± 1.8 0–11 14.3 ± 31.5 0–107 16.7 ± 22.8 0–82 Waders African Spoonbill 4.1 ± 4.5 0–41 0.9 ± 1.1 0–7 2.6 ± 3 0–7 0.7 ± 0.7 0–2 African Sacred Ibis 1.3 ± 0.5 0–6 0.6 ± 0.5 0–4 8 ± 6.1 0–18 20.6 ± 24 3–81 Grey Heron 1.3 ± 0.4 0–4 1 ± 0.4 0–3 2.2 ± 1.8 0–5 1.2 ± 1 0–3 Cattle Egret* 2.8 ± 4.2 0–26 0.1 ± 0.1 0–1 0.9 ± 1.3 0–3 2.8 ± 4.7 0–16 Yellow–billed Egret* 0.7 ± 0.6 0–6 0.1 ± 0.1 0–1 – – 0.2 ± 0.5 0–1 Little Egret* 0.5 ± 0.9 0–11 – – 1 ± 1.7 0–4 – – Glossy Ibis* 0.3 ± 0.4 0–4 0 ± 0 0–16 3.9 ± 12.7 0–42 – – Black-headed Heron* 0.2 ± 0.4 0–3 0.1 ± 0.1 0–1 0.7 ± 0.9 0–2 0.9 ± 1 0–3 Black–crowned Night–heron* 0.1 ± 0.2 0–2 0.1 ± 0.2 0–1 – – 0.1 ± 0.4 0–1 Hamerkop* 0.1 ± 0.2 0–1 0.1 ± 0.1 0–1 0.2 ± 0.7 0–2 0.3 ± 1 0–3 Great White Egret* 0.1 ± 0.1 0–1 – – 0.3 ± 1 0–3 – – Hadeda Ibis*
Sub–total: 11.2 ± 12.1 0–46 2.6 ± 2.4 0–9 19.3 ± 28.7 0–86 26.5 ± 32.9 3–110
306

Table B.1 contd
Species
SAWC (1982–1990) CWAC (1995–2006)
Summer Winter Summer Winter
Mean ( S.D.) Min–Max Mean ( S.D.) Min–Max Mean ( S.D.) Min–Max Mean ( S.D.) Min–Max
Palearctic migrants
Shorebirds
Ruff 292.6 ± 214.5 0–920 11 ± 24.3 0–139 108.6 ± 138.2 0–400 – –
Little Stint 174 ± 100 0–837 16.9 ± 36.6 0–218 36.8 ± 35 0–91 0.6 ± 1.6 0–5
Curlew Sandpiper 86.3 ± 47.5 0–365 13.3 ± 11.4 0–112 17.2 ± 15.6 0–46 2.9 ± 8.1 0–27
Common Ringed Plover* 5.5 ± 2.9 0–18 0.6 ± 1.4 0–8 7.5 ± 7.4 0–25 0 ± 0 0–0
Common Sandpiper* 2 ± 4.9 0–59 0 ± 0 0–0 0.8 ± 1.6 0–5 – –
Common Greenshank* 1 ± 1.1 0–5 0.2 ± 0.4 0–3 0.4 ± 0.7 0–2 0.1 ± 0.4 0–1
Wood Sandpiper* 0.2 ± 0.3 0–3 – –
Grey Plover* 0.1 ± 0.1 0–1 – –
Marsh Sandpiper* 0.6 ± 1.3 0–4 – –
Sub–total: 561.5 ± 370.9 0–1871 41.8 ± 73.9 0–370 171.6 ± 199.6 0–573 3.5 ± 9.9 0–33
Terns White-winged Tern 198.4 ± 127.6 0–590 25.1 ± 34 0–227 66.4 ± 210.3 0–700 – –
Sub total: Residents 1175.2 ± 475 542–2827 725.2 ± 373.2 190–2465 2007.6 ± 1436.8 5–4387 434 ± 523.6 32–1754
Sub–total: Palearctic migrants 759.9 ± 498.4 3–3789 66.8 ± 107.8 0–740 238 ± 409.9 0–1273 3.5 ± 9.9 0–33
Total waterbirds 1935 ± 973.4 332–5701 791.9 ± 481 227–3002 2245.5 ± 1846.6 5–5660 437.5 ± 533.4 32–1787
1 The sub-total values here reflect the minimum/ maximum number for the group profile as a whole and not the sum of individual minima/maxima for each species which would represent estimated min./max. carrying capaicty and not actual min./max. numbers reflected by the dataset
307

308
Table B.2 Total monthly numbers of moulting birds of three waterfowl species at Droëvlei Dam from 1982–1990.
Species Month Total Sep. Oct. Nov. Dec. Jan. Feb. Mar Apr. May Jun. Jul. Aug.
Cape Shoveler – 32 5 1 0 0 – – – – – – 38 Cape Teal – 4 1 11 2 0 – – – – – – 18 Egyptian Goose – 0 0 10 9 3 – – – – – – 22
Total – 36 6 22 11 3 – – – – – – 78
Table B.3 Monthly maximum numbers of breeding pairs of 13 resident waterbird species at Droëvlei Dam from 1982–1990.
Species Month
Total Sep. Oct. Nov. Dec. Jan. Feb. Mar. Apr. May Jun. Jul. Aug.
Cape Shoveler 2 5 2 1 – – – – – – – – 10 Yellow-billed Duck 1 2 2 2 – – – – – – – – 7 Cape Teal 1 2 1 1 – – 1 – – – – – 6 Red-billed Teal 1 3 1 – – – – – – – – – 5 Egyptian Goose – 1 1 3 2 1 1 – – – – – 9 Spur-winged Goose – – 1 2 – – – – – – – – 3 Little Grebe – – – – 10 – – – – – – – 10 Black-necked Grebe – – – 29 – – – – – – – – 29 Great Crested Grebe – – – 4 7 – 2 – – – – – 13 Red-knobbed Coot 13 15 12 4 1 3 1 – 4 – 14 7 74
Sub-total waterfowl 18 28 20 46 20 4 5 – 4 – 14 7 166
Blacksmith Lapwing – – – – – 3 – – – – 3 3 9 Black-winged Stilt – 1 – – – – – – – – 1 1 3 Kittlitz's Plover – – – 2 1 – – – – – 4 2 9
Sub-total shorebirds – 1 – 2 1 3 – – – – 8 6 21
Total 18 29 20 48 21 7 5 – 4 – 22 13 187

309
Table B.4 Species of conservation importance at Droëvlei Dam. Global, regional and provincial population thresholds are shown for SAWC and CWAC and based on maximum counts for each species from 113 surveys from May 1982–April 2006. Species are sorted in descending order of global, regional and provincial importance. Species names are taken from Hockey et al. (2005). Species in bold are included in the South African Red Data book (Barnes 2000).
Species Max. count
Threshold level
Global1 IBA2 Western Cape3
SAWC CWAC SAWC CWAC SAWC CWAC SAWC CWAC Maccoa Duck 115 26 1.2% (2) – 18 – 14% 3%Pied Avocet 193 60 1.0% (1) – 3 – 4% 1%Great White Pelican (NT) 52 400 – 2.0% (1) – 6 2% 15%Egyptian Goose 902 2600 – – – 5 3% 10%Cape Shoveler 217 200 – – 2 1 3% 3%Black-necked Grebe 148 9 – – 2 – 5% – Lesser Flamingo (NT) 315 130 – – 1 – 5% 2%Yellow-billed Duck 541 156 – – 1 – 4% 1%White-winged Tern 590 700 – – – – 17% 20%Ruff 920 400 – – – – 14% 6%Blacksmith Lapwing 274 229 – – – – 8% 7%Southern Pochard 99 2 – – – – 6% – Little Stint 837 91 – – – – 6% 1%Kittlitz’s Plover 288 339 – – – – 5% 6%Spur-winged Goose 182 56 – – – – 4% 1%Cape Teal 189 77 – – – – 4% 2%Red-billed Teal 124 114 – – – – 3% 3%Little Grebe 155 48 – – – – 3% 1%Reed Cormorant 143 61 – – – – 2% 1%Greater Flamingo (NT) 214 109 – – – – 1% 1%Black-winged Stilt 53 57 – – – – 1% 1%Red-knobbed Coot 710 115 – – – – 1% – Curlew Sandpiper 365 46 – – – – 1% – South African Shelduck 60 6 – – – – 1% –
1 Calculated from Wetlands International (2006). Figures represent the percentage of the estimated global population based on the maximum count. Number in parentheses represents the number of counts on which the 1% threshold level was met or surpassed. 2 Figures represent the number of counts which met or surpassed the Sub-regional IBA level (0.5% threshold) for southern Africa (Barnes 1998) but did not surpass the 1% global threshold level. 3 Value represents the % of estimated provincial population and based on the maximum count. Sourced from Coordinated Waterbird Counts, Animal Demography Unit, unpublished data (2006)

310
Figure B.1 Droëvlei Dam showing surrounding farmland boundaries and other waterbodies.

311
Figure B.2. Mean seasonal abundance of residents (black bars) and Palearctic migrant waterbirds (grey bars) at Droëvlei Dam from (a) 1985–1990 and (b) 1995–2006. The 1985–1990 data are based on monthly surveys and the 1985–1990 data are based on six-monthly counts with mid-summer representing January and mid-winter July. Numbers above each bar represent actual mean counts.
2007.5
434.0
237.9
6.90
500
1000
1500
2000
2500
Mid-summer Mid-winter
Mea
n no
. of
bird
s
Season
1187
10
1361
430
0
200
400
600
800
1000
1200
1400
1600
Sep Oct Nov Dec Jan Feb Mar Apr May Jun Jul Aug
Mea
n no
. of
bird
s
Month
(a)
(b)

312
Figure B.3 Mean seasonal abundance of the major waterbird groups at Droëvlei Dam based on monthly seasonal data from 1985–1990 (a, b and c), and on six-monthly data from 1995–2006 (d, e and f). Figures above bars in (a), (b) and (c) indicate the corresponding value to the mid-summer and mid-winter of the six-monthly surveys.
876.0
327.8
381.8
36.8
0
200
400
600
800
1000
1200 Waterfowl
Shorebirds
842.0
1.8
345.4
8.3
0
200
400
600
800
1000
Month
Pal. shorebirds
White-winged Tern63.4
60.3
12.2
4.0
0
20
40
60
80
Mea
n no
. of
bird
s
Waders Cormorants Great White Pelican
(b)
(c)
1555.2
214.9264.7109.7
0
500
1000
1500
2000
Mid-summer Mid-winter
Waterfowl Res. shorebirds
130.1
12.519.3
26.514.3 16.6
020406080
100120140
Mid-summer Mid-winter
Great White Pelican
Waders
Kelp Gull
(e)
171.5
3.5
66.4
0.00
50
100
150
200
Mid-summer Mid-winter
Season
Pal. shorebirds
White-winged Tern
(f)
(d) (a)

Figure B.4 Mean monthly abundance of 12 waterfowl species at Droëvlei Dam based on monthly survey data from 1983–1990.
0
50
100
150
200 Red-knobbed Coot
0
50
100 Cape Shoveler
0
50
100
150
200 Yellow-billed Duck
0
10
20
30
40
50
Month
Maccoa Duck
0
200
400
600
800
Month
Egyptian Goose
0
20
40
60 Red-billed Teal
0
50
100 Cape Teal
0
50
100 Little Grebe
0
10
20
30
40
50
60
Month
Black-necked Grebe
0
10
20
30Spur-winged Goose
0
20
40Southern Pochard
0
10
20 South African Shelduck
Mea
nno
.of
bird
s
313
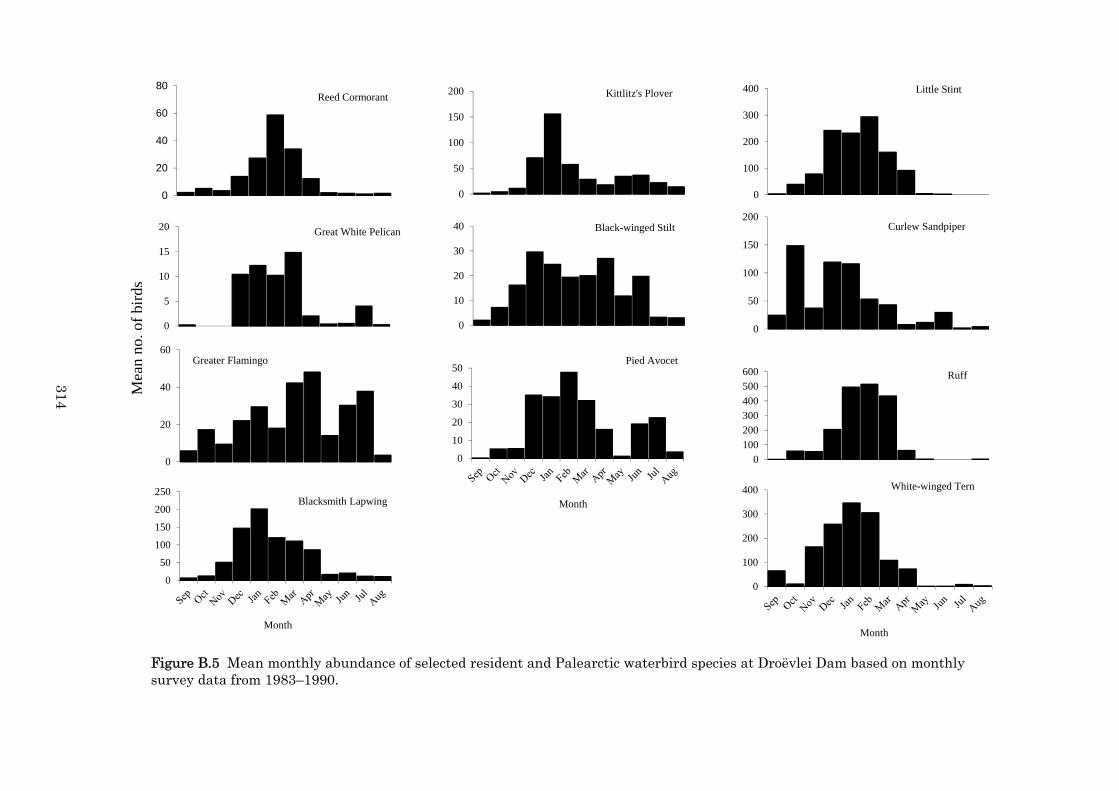
Figure B.5 Mean monthly abundance of selected resident and Palearctic waterbird species at Droëvlei Dam based on monthly survey data from 1983–1990.
0
20
40
60
80Reed Cormorant
0
5
10
15
20 Great White Pelican
0
50
100
150
200
250
Month
Blacksmith Lapwing
0
20
40
60Greater Flamingo
0
50
100
150
200 Kittlitz's Plover
0
10
20
30
40 Black-winged Stilt
0
10
20
30
40
50
Month
Pied Avocet
0
50
100
150
200Curlew Sandpiper
0
100
200
300
400 Little Stint
0100200300400500600 Ruff
0
100
200
300
400
Month
White-winged Tern
Mea
nno
.of
bird
s
314

Figure B.6 Inter-annual mean seasonal abundance of selected resident and Palearctic waterbird species at Droëvlei Dam based on (a–d) monthly survey data from 1982–1990.
0
20
40
60 Red-billed Teal
0
20
40
60
80
100
120
Year
Cape Teal
0
200
400
600 Red-knobbed Coot
0
50
100
150Lesser Flamingo
0
5
10
15
20 Three-banded Plover
0
50
100
150
200 Blacksmith Lapwing
0
5
10
15 Great Crested Grebe
0
20
40
60
80 Pied Avocet
0
20
40
60
80
Year
Kittlitz's Plover
0
10
20
30
40Black-winged Stilt
0
20
40
60
80
100 Little Grebe
0
10
20
30
40
50
60
Year
Little Stint
Mea
nno
.of
bird
s
315

316
Figure B.7 Relationship between rainfall and the mean monthly abundance of five waterfowl species at Droëvlei Dam, 1985–1990.
0
5
10
15
20
25
30
35
40
45
0
100
200
300
400
500
600
700
Mea
n ra
infa
ll (
mm
)
Mea
n n
o. o
f bi
rds
Month
Cape Shoveler Yellow-billed DuckCape Teal Egyptian GooseRainfall

317
Figure B.8 Monthly Waterbird Conservation Value (WCV) scores at Droëvlei Dam from November 1982–May1990. The dotted line indicates the date (September 1985) from which all waterbird species were included in the calculation of the score.
Figure B.9 Relationship between abundance and the Waterbird Conservation Value (WCV) score at Droëvlei Dam between September 1985 and May 1990.
0.0
0.5
1.0
1.5
2.0
2.5
3.0
3.5
Nov
-82
Jan
-83
Mar
-83
May
-83
Jul-
83S
ep-8
3N
ov-8
3Ja
n-8
4M
ar-8
4M
ay-8
4Ju
l-84
Sep
-84
Nov
-84
Jan
-85
Mar
-85
May
-85
Jul-
85S
ep-8
5N
ov-8
5Ja
n-8
6M
ar-8
6M
ay-8
6Ju
l-86
Sep
-86
Nov
-86
Jan
-87
Mar
-87
May
-87
Jul-
87S
ep-8
7N
ov-8
7Ja
n-8
8M
ar-8
8M
ay-8
8Ju
l-88
Sep
-88
Nov
-88
Jan
-89
Mar
-89
May
-89
Jul-
89S
ep-8
9N
ov-8
9Ja
n-9
0M
ar-9
0M
ay-9
0
WC
V s
core
Month
Maccoa DuckPied AvocetBlack-necked GrebeCape ShovelerYellow-billed DuckLesser FlamingoOther
y = 0.0004x + 0.7652R² = 0.4448
0
0.5
1
1.5
2
2.5
3
3.5
0 1000 2000 3000 4000
WC
V s
core
No. of birds

319
Appendix C
Seasonality, trends and conservation status of
waterbirds at an arid west coastal wetland in
South Africa: Rocher Pan, 1979–2004

320

321
Abstract
An analysis of the waterbirds at Rocher Pan, a seasonal west coast wetland in South Africa,
was carried out from 1979–2004. A total of 78 waterbird species (60 resident species and
18 migrant species) were recorded and up to 8 239 individuals were surveyed during this
period. Occurrence patterns were strongly seasonal and mirrored the yearly seasonal
rainfall and inundation pattern – mean summer abundance was 3 197 ± 2 731 birds and
mean winter abundance 1 531 ± 1 714 birds. Waterfowl (ducks, geese, grebes, coot and
moorhen) dominated the waterbird community and on average, they comprised 41.9% and
54.3% of the summer and winter waterbird abundance. Egyptian Goose and South African
Shelduck were the only resident species that showed significant population increases
during summer. Black-necked Grebe showed declining populations during winter.
Palearctic migrants comprised about 20% of the waterbird community during summer. A
total of 14 species surpassed the global 1% threshold levels; Cape Shoveler and Hartlaub’s
Gull dominated this group. Seven threatened species were recorded of which the Greater
and Lesser Flamingo were the most important. The site qualifies for Ramsar and Important
Bird Area (IBA) status. Aspects relating to rainfall, climate change and biological impacts
on the wetland are also discussed.
Plate C.1 View looking north over Rocher Pan from where the Papkuils River enters the pan. The fynbos vegetation around the margins of the waterbody can be seen in the foreground. The white dots in the water represent Greater Flamingos. Photo: DM Harebottle

322
Introduction
The western coastal plain of South Africa falls within the western coastal slope region and
is divided into a Mediterranean zone and an arid zone (Cowan 1995, Chapter 1). The
boundary dividing the zones lies south of the Olifants River estuary (Figure 1.4, Chapter 1).
The arid zone to the north has sparse vegetation cover and generally experiences a warm
and dry climate throughout the year with rain falling during the winter (June–August).
The Orange River estuary and Olifants River floodplain are the only extensive wetlands in
the region, interspersed with small coastal pans and salt-marshes that are flooded by
erratic and infrequent rainfall (Cowan 1995).
The Mediterranean zone lies to the south of the Olifants River estuary and although
it has hot dry summers, winters are generally cooler and wetter. There are more extensive
natural wetlands in this zone, including: Jakkalsvlei, Verlorenvlei, Rocher Pan, Berg River
estuary and Langebaan Lagoon (Figure 1.4, Chapter 1). The Clanwilliam Dam is the only
large impoundment in this region. Rocher Pan lies close to the boundary of the two zones
(Figure 1.1). The Pan is an extinct estuary which is now one of two seasonal lakes in this
region, the other being Wadrif Saltpan (Williams et al. 2002).
Rocher Pan was proclaimed a nature reserve in 1967 (Wessels 1997) primarily to
provide a sanctuary for waterfowl and in particular the Cape Shoveler (du Preez 1992), a
species endemic to southern Africa (Hockey et al. 2005). The species was known to occur at
Rocher Pan regularly in globally significant numbers (Siegfried 1965) and the pan was
regarded as being one of a few sites in southern Africa that was important to the ecology
and conservation of the species (Heÿl 1985).
The first documented waterbird surveys at Rocher Pan were conducted by Brand
(1961) who largely focused on waterfowl and breeding productivity. Shorebird surveys were
carried out at Rocher Pan by Summers et al. (1976) as part of a larger wader survey of the
Western Cape and some anecdotal information and ad hoc counts exist in unpublished
reports (e.g. Coetzer et al. 1985, Underhill and Cooper 1982) but these have been far from
comprehensive. In 1979 systematic surveys were initiated to provide primarily information
on waterfowl abundance as part of a provincial programme to set hunting quotas and bag
limits (Heÿl et al.1993). The waterbird data from these surveys remain largely unpublished
and to date, there has been no review of the overall occurrence, abundance and
conservation importance of waterbirds at the pan.
In this paper, I describe the status and abundance of waterbirds at Rocher Pan
based on surveys conducted from 1979–2004 and assess the impact of rainfall on patterns of
occurrence and abundance of a number of focal species. I also review the conservation value

323
of the site for waterbirds and assess the critical importance of the site for Cape Shoveler
since the proclamation of the reserve.
Study area
Rocher Pan (32°36’S, 18°18’E) is situated about 150 km north of Cape Town and 12 km
from Dwarskersbos. It is located behind a ridge of coastal dunes about 500 m from the
ocean at an altitude of about 3 m.a.s.l. (Wessels 1997) (Figure C.1). The waterbody is fed by
two main inlets: the Papkuils River in the south, and the Sout River, further to the north.
The Papkuils River which has its source in the mountains east of Aurora, 25 km to the east,
passes through mainly arable land where wheat is grown. The pan has no outlet. Originally
the waterbody was connected to the sea before the mouth of the Papkuils River was
diverted and closed off by a local farmer in the mid-1800s to provide freshwater for
livestock, and has remained in this freshwater-state for over 150 years (Coetzer 1981).
Additional inundation occurs directly from rainfall and smaller local inlets.
When full, the pan is approximately 6.5 km long and 0.4 km wide and covers a
surface area of approximately 110 ha; the mean depth is 0.5 m with a maximum depth of
c. 2 m in the southern part of the pan (Coetzer 1981). Up to 20 small (< 1 ha) vegetated
islands occur in the pan when it is fully inundated; three islands were initially constructed
in 1968 to encourage breeding of waterfowl with the last island being formed in 1977 (du
Preez 1992). Most of the vegetation on the islands consists of Atriplex numularia
(Oumansoutbos), and A. bolusii (Soutbos). Sarcocornia natalensis (Brakbos) was planted on
a few islands in 1974. Juncus acutus (Spiny Rush) spread naturally and is regularly cut-
back (du Preez 1992)
The majority of the pan is incorporated into the Rocher Pan Nature Reserve; a small
portion (c. 10ha) extends beyond the northern boundary of the reserve into private
farmland. The reserve is 914ha in area and is administered by CapeNature (du Preez
1992). The nature reserve falls in the West Strandveld Bioregion (Mucina and Rutherford
2006), and the vegetation comprises mainly dune thicket with the Eragrostis cyperoides
(sedge grass) Chrysanthemoides monilifera (Bietoubos) and Willdenowia striata being
dominant species. The adjacent ocean stretch was proclaimed a marine reserve in 1988 (du
Preez 1992).
The pan is located in the north-western region of the winter-rainfall region (WRR) of
South Africa and is situated close to the desert and semi-desert climatic zone (Figures 1.1
and 1.4, Chapter 1). The area receives on average 230 mm of rain per annum (du Preez
1992). The pan usually fills during the start of the rainy season in May and June, July and
August are the wettest three months. Water-levels recede during the drier summer months

324
when inflow is reduced, precipitation is low and evaporation levels are high. The pan
usually dries out between February–March each year depending on the amount of
inundation during the previous winter rainfall (Coetzer 1981, du Preez 1992) and during
very wet years it does not dry up completely before the next rainfall season (Coetzer 1985).
The water in the pan is predominantly fresh but can become brackish during periods of low-
water levels when salinities tend to increase (Coetzer 1981).
The dominant aquatic macrophytes are Potamogeton pectinatus and Chara
globularis which occur throughout the greater part of the pan but do vary in density
relative to salinity levels. The floor of the pan is dominated by two species: Salicornia
meyeriana and Sporobolus virginicus. Emergent vegetation occur mainly around the fringes
of the waterbody and are dominated by Juncus acutus, Scirpus maritimus with some large
scattered patches of Phragmites australis, the latter an invader species (Wheeler 1998).
Methods
Waterbird surveys were conducted almost monthly from June 1979 to July 2004. Surveys
were carried out mostly in the morning or early afternoon and lasted between 2–3 hours.
Although observers varied during different periods throughout the survey period, the
routes used by observers remained consistent which reduced observer bias. Species
coverage varied between the periods. Nineteen species (pelicans, flamingos, ducks, geese
and coots) were counted regularly from June 1979–August 1985 (Table 1) while an
additional 50 species, constituting a broader definition of waterbirds, were regularly
counted from September 1985–July 2004 .
Waterbirds are defined in Chapter 1 and vernacular names follow those given in
Hockey et al. (2005). Species were divided into southern African residents and Palearctic
migrants (Appendix 1.2, Chapter1). Seasonality, abundance and trend analyses follows
closely that of Appendix A. Overall waterbird abundance and diversity was assessed for the
period September 1985–July 2004 when all waterbird species were surveyed. Trend
analyses for the anatids, grebes, Red-knobbed Coot, Great White Pelican, Greater Flamingo
and Lesser Flamingo were based on the surveys from April 1979–July 2004; inter-annual
variation for all other species were based on the period June 1985 – July 2004. Emphasis is
placed on the 16 species counted during the SAWC due to the duration and consistency of
the surveys which reflected more meaningful seasonal patterns and aided interpretation of
long-term trends.
The conservation importance of Rocher Pan was assessed based on the Waterbird
Conservation Value (WCV) score (Chapter 2). Methods for the calculation of this score are
described in Chapter 2 (see Methods). Scores were calculated for each month between

325
1985–2004 when all waterbirds were surveyed at the pan. An overall score for the entire
site was also calculated. To assess sub-regional importance the 0.5% index was used based
on the sub-regional IBA thresholds in Barnes (1998). The proportion of counts for species
comprising 5% or more of the estimated Western Cape population were also computed to
gauge the site’s significance at a provincial level.
Results
Overall waterbird abundance and richness
A total of 273 surveys was carried out between June 1979 and July 2004 and covered a total
of 78 species. Of these, 16 species were surveyed during the whole study period, while an
additional 62 were surveyed from September 1985–July 2004 (n = 201 surveys) (Table C.1).
Of the 273 surveys, 141 surveys were carried out in summer, and 132 during winter, while
105 summer surveys and 96 winter surveys constituted the 1985–2004 period.
Numbers of waterbirds at Rocher Pan ranged between 0 and 13 708 (November
1994). The mean summer count was double (3 197 ± 2 731 birds) that in winter
(1 531.3 ± 1 714 birds) (Table C.1). Species richness was higher in summer (x = 58) than in
winter (x = 44); November on average held the most species (n = 67) and May the least
number (n = 37). The mean number of waterbirds counted per month ranged between 101
in April and 3 234 in November.
Overall, the summer surveys were dominated by seven species which made up more
than 70% of all waterbirds at the site: Red-knobbed Coot (21%), Curlew Sandpiper (14%),
Greater Flamingo (11%), Cape Shoveler (9%), unidentified Palearctic shorebirds (8%), Little
Stint (5%) and White-breasted Cormorant (4%). The winter surveys were dominated by
Red-knobbed Coot (31%), Greater Flamingo (15%), Cape Shoveler (10%), Hartlaub’s Gull
(5%) and Black-necked Grebe (4%) which made up 65% of all waterbirds at the site during
winter.
The overall annual pattern of occurrence of waterbirds was strongly seasonal at the
pan; abundance of waterbirds increased from June (x = 835) and peaked during November
(x = 5 993). Numbers then generally declined from January with the lowest numbers of
birds recorded during April (x = 161). Over a period of five months there is an almost
40–fold decline in the number of waterbirds at the pan (Figure C.2).
Waterfowl (ducks, geese, grebes, coot and moorhen) dominated the waterbird
community. On average, they comprised 41.9% and 54.3% of the summer and winter
waterbird abundance (Table C.1). The guild showed marked seasonality. Numbers peaked
in October (x = 2 842) and November (x = 2 692) with sharp declines from December–April
before showing increases from June onwards (Figure C.3). Palearctic shorebirds comprised

326
23.7% of the waterbirds during summer and dominated the entire shorebird community
from October–March (Figure C.3).
Overall, numbers of resident shorebirds were higher in summer (x = 243 ± 225) than
in winter (x = 111 ± 109) (Table C.1). Abundance peaked in October (x = 423) and decreased
until January with a small resurgence in February (Figure C.3). Small numbers
(< 50 birds) occurred monthly from April to August and then increased from July–
September (90–285 birds, Figure C.3). This group contributed 7% to the total waterbird
community in both summer and winter.
Flamingos and waders both showed seasonal occurrence with most birds occurring
from September–December (Figure C.3). Resident gulls showed less pronounced seasonality
with relatively stable numbers from June–November (x = 175 birds); March and April were
the only months when numbers declined substantially (Figure C.3). Resident terns
generally occurred in small numbers (Table C.1) and were most abundant in June–August
with most birds occurring in August (x = 91). Palearctic terns peaked in September
(x = 191) and occurred in varying numbers until March (x = 7).
Residents versus migrants
Residents comprised 60 species, the remaining 18 species being Palearctic migrants. On
average there were double the number of resident birds than Palearctic migrants during
summer; only February and March showed a near-equal ratio of the two groups (Figure
C.2). Most migrants departed in April and residents dominated during winter, although
some over-wintering Palearctic migrants were present during the winter period
(Figures C.2 and C.3).
Ducks and geese
The anatidae was one of the dominant groups at Rocher Pan and comprised, on average,
38% and 54% of the waterbird community during summer and winter respectively. When
considering only the resident waterbirds these figures rose to 56% and 57% respectively.
Egyptian Goose numbers peaked in November (maximum 660 in November 1994).
Numbers then decreased from December with generally fewer than five recorded from
February to May; numbers increased from June (Figure C.4).
Numbers of Cape Shoveler showed annual peaks from October–November. From
1990–1995 peak numbers exceeded 1 000 birds with a maximum of 1 610 birds recorded in
October 1990. Yellow-billed Ducks started increasing in abundance in June and numbers
peaked in October (maximum 1 131 in October 1991). They were generally absent from the
pan March–May (Figure C.4). South African Shelduck numbers increased during late

327
winter and early summer and numbers peaked in October (285 in October 1992). Numbers
remained stable from October–January and declined by 50% in February; less than five
birds on average were present in March and April. Red-billed Teal and Cape Teal showed
similar abundance patterns with highest numbers present from September–December.
Overall, Cape Teal numbers peaked in October (1 069 in October 1990) and numbers of
Red-billed Teal usually peaked in November, but had a maximum of 836 in October 1990.
Grebes
The Little Grebe and Black-necked Grebe showed similar patterns of occurrence; both, on
average, increased from June–August, peaked in September and then decreased from
November –December. They were absent from the pan from January–May (Figure C.4).
Black-necked Grebes were generally more abundant than Little Grebes; during peak
occurrence times (August–October), there were generally twice as many Black-necked
Grebes as Little Grebes. Maximum numbers were of 661 Black-necked Grebes recorded in
September 1990 and Little Grebe numbers reached their maximum (298) in November1995.
Red-knobbed Coot
Red-knobbed Coot, like most of the ducks, increased in late winter (July–August). Numbers
then peaked from September–November; with a maximum of 6 259 birds in November
1992. From November–December there was a 48% reduction in numbers of coot with a
further 61% reduction from December–January (Figure C.4). They were virtually absent
from the pan between February and May with small numbers (< 15 birds) being recorded,
on average, during March and April.
White-breasted Cormorant
The White-breasted Cormorant was the only phalacrocoracid that occurred in numbers at
Rocher Pan. Their pattern of occurrence resembled that of most other waterbirds; numbers
increased in late winter (August–September) then doubled during October and peaked in
December/January, with a maximum of 772 in January 1989). A rapid exodus then took
place and birds left Rocher Pan from February and started returning in May and June
(Figure C.5).
Waders
Four species are considered here. African Sacred Ibis occurred mainly between August and
December; numbers generally peaked in September–October, with a maximum of 578 in
August 1993, and less than 15 birds were recorded from January–July (Figure C.5).

328
Contrastingly, Glossy Ibis occurred from October to January with peaks in December, with
a maximum of 130 in December 1997. Fewer than two birds, on average, were recorded
from January–September (Figure C.6).
Both Greater Flamingo and Lesser Flamingo occurred throughout the year; the
Greater Flamingo occurred in larger numbers (Figure C.5). Greater Flamingos started
arriving in June and peaked in September–October, with a maximum of 4 239 in October
1995. Numbers declined by 50% each month between November–January and the species
was mostly absent from February–June, with fewer than 50 birds, on average, being
recorded (Figure C.5). Lesser Flamingos, on the other hand, started arriving in August and
increased thereafter, with two peaks: one in October and one in February (max. 1 082 in
October 1995). They were present from March–July in low numbers (< 30 birds on average)
(Figure C.5).
Resident gulls and terns
Kelp Gull, Hartlaub’s Gull and Swift Tern dominated this group, with Kelp and Hartlaub’s
Gull comprising 95% of all resident larids at Rocher Pan. Overall the group showed higher
abundance in winter (164.6 ± 124) than summer (118.7 ± 87) and numbers peaked June–
August (mean 279 birds in August) (Table C.1, Figure C.5). Kelp Gull tended to dominate in
summer (mean 67.8, max. 953 in January 1989) and Hartlaub’s Gull in winter (mean 82.4,
max. 571 in July 2002) (Table C.1, Figure C.6). Hartlaub’s Gull also showed a stronger
seasonal pattern of occurrence while Kelp Gull numbers fluctuated throughout the year
although numbers of both species tended to decline during March and April (Figure C.5).
Swift Tern was the only tern species that occurred in large numbers and showed any
real pattern of occurrence. They occurred mainly in winter (mean 29.4 ± 30.5) with less
than five birds on average during summer. Numbers peaked from June–August (max. 435
in August 1995) with mean counts of 80 birds being recorded during August. Less than
20 birds were present during the remaining months of the year (Figure C.5).
Resident shorebirds
This group was dominated by Black-winged Stilt and Kittlitz’s Plover; each species
contributed 71% and 83% to the resident shorebird population in summer and winter
respectively. Black-winged Stilt numbers peaked in October, with a maximum of 868 in
October 1994, and most birds departed by January (Figure C.6); from January to July less
than 30 birds on average were recorded each month with March and April recording less
than 5 birds. In contrast, numbers of Kittlitz’s Plover peaked from January–March

329
(max. 368 in February 1995). Numbers then stabilized from April–December and averaged
25 birds per month (Figure C.6).
Other species that occurred in numbers large enough to allow meaningful
interpretations were Pied Avocet, Blacksmith Lapwing and African Black Oystercatcher.
Pied Avocet numbers were larger in summer (mean 37.6 ± 23.2) than winter
(mean 1.1 ± 1.2) and peaked from December–February, with a maximum of 715 in
December 1995. They were largely absent between April and September (Figure C.6).
Blacksmith Lapwing tended to more abundant in summer (21.5 ± 13) than winter (13.1 ± 9)
and numbers peaked from October–December, with a maximum of 147 in October 1990;
fewer than five birds on average occurred between March and May (Figure C.6).
African Black Oystercatcher were more abundant during winter (10.2 ± 4.6) than
summer (4.2. ± 3.2) and peaked from June–September, with a maximum of 33 in June
1998. There were fewer than five birds on average from December to April (Figure C.6).
Palearctic shorebirds
This group showed the normal annual pattern of Palearctic migrants with large numbers
during summer and few birds during the winter; summer means of 1 048.2 ± 825 were
recorded compared with 52.9 ± 100 during winter (Table C.1, Figure C.6). Of the 18 species
recorded, four dominated this group: Curlew Sandpiper (63%), Little Stint (23%), Ruff
(10%) and Marsh Sandpiper (3%) (Table C.1). Overall, birds started arriving in September
and had departed by April (Figure C.6).
All four species peaked from October–December; Curlew Sandpiper (max. 5012 in
November 1995), Little Stint (1 243 in November 1993), Ruff (max. 600 in December 1987)
and Marsh Sandpiper (max. 276 in December 1995). Little Stint showed the greatest
stability with about 200 birds present from November–February. All four species had small
numbers (< 20 birds) during the winter period (Figure C.6).
Palearctic terns
Three species were recorded at Rocher Pan during the austral summer:- White-winged
Tern, Common Tern and Sandwich Tern. White-winged Tern was the most abundant
(x = 48, Table C.1). Their numbers peaked in September (max. 1662 in September 1998)
but showed some fluctuations in abundance from September–December; a small number
( c. 20 birds) were recorded from June–August (Figure C.7). Common Tern and Sandwich
Tern both occurred in small numbers during summer (x < 10 birds), although a maximum
of 163 Common Terns were recorded in October 1986). The majority of Common Terns had
left Rocher Pan by December, and some birds (< 5) were observed during winter months

330
(Figure 6). Numbers of Sandwich Terns were small (< 5 birds/month) but interestingly most
records occurred from June–August.
Inter-annual variation in abundance and trends
Residents
Trends are presented for 22 species: 10 waterfowl species, five shorebird species, Greater
Flamingo, Lesser Flamingo, Hartlaub’s Gull, Kelp Gull, African Sacred Ibis, White-
breasted Cormorant, and Swift Tern (Figures C.7, C.8, C.9 and C.10). Other species are
omitted as they occurred in too small numbers for any meaningful interpretation to be
made.
For waterfowl, significant increases in summer populations were evident for
Egyptian Goose (r = 0.45, p < 0.05) and South African Shelduck (r = 0.47, p < 0.01). Black-
necked Grebe was the only waterfowl species to show significant declines in both summer
(r = –0.49, p < 0.01) and winter (r = –0.41, p < 0.05). The remainder showed large annual
fluctuations and no real trends were evident (Figure C.7). Interestingly, some species
tended to peak simultaneously (e.g. South African Shelduck, Cape Shoveler and Red-
knobbed Coot in 1992/93, Red-billed Teal and Cape Teal in 1990/91, and Cape Shoveler and
Egyptian Goose in 1995/96; Figure C.7).
Both flamingo species showed considerable inter-annual fluctuations. Greater
Flamingo numbers at the pan tended to remain stable overall and numbers only peaked
during the summer of 1995/96 (mean of 1 484 birds). No definite trend could be described.
Lesser Flamingo had more frequent peaks (1979/80, 1992/93, 1995/96 and 1998/99)
although these were smaller (< 250 birds) compared with Greater Flamingo (Figure C.8).
Interestingly the annual winter fluctuation for Greater Flamingo mirrors that of the
summer pattern, while for Lesser Flamingo there is a contrasting pattern with a weak
declining trend.
Inter-annual populations of Kelp Gull and Hartlaub’s Gull during summer both
revealed declining trends; Kelp Gull showed the strongest decline (r = –0.62, p < 0.001) over
Hartlaub’s Gull (r = –0.41, p < 0.05) (Figure C.8). Swift Tern showed no trend as inter-
annual abundance revealed large fluctuations.
Summer and winter populations of White-breasted Cormorant and African Sacred
Ibis fluctuated throughout the 18 year period. No trends were evident.
For shorebirds, the African Black Oystercatcher showed significant declines in
summer (r = –0.56, p < 0.01) and winter (r = –0.64, p < 0.001) (Figure C.9). The only other

331
shorebird that showed a significant trend was Kittlitz’s Plover with a significant downward
winter trend (r = –0.48, p < 0.01) (Figure C.9).
Palearctic migrants
Among the shorebirds inter-annual patterns were highly variable and no definite trends
were discernable. Of the five shorebirds considered, Common Greenshank was the only
species to show some evidence of increasing numbers during the study period
(r = 0.61, p < 0.001), but numbers of birds were low (< 20 birds) (Figure C.9). Marsh
Sandpiper and Curlew Sandpiper, were the only species that showed strong peaks during
1991/92 with small fluctuations during other years, while Ruff and Little Stint showed
more frequent peaks with main peaks occurring during 1983/84 and 1989/90 respectively.
Annual occurrence and abundance at Rocher Pan fluctuated considerably for both
White-winged Tern and Common Tern (Figure C.10). The terns tended to peak in
alternative years or every other year and resulted in them being almost mutually exclusive
at the pan. Common Tern have not been recorded or have been recorded in small numbers
(< 5 birds) since the summer of 1990/91 and suggests a downward trend at the pan.
Similarly, White-winged Terns have been recorded in fewer numbers (< 30 birds) since the
summer of 1994/95 (Figure C.10).
Waterbird Conservation Value (WCV) scores
The monthly WCV scores for Rocher Pan between September 1995 and July 2004 are
shown in Figure C.11. Inter-annual fluctuations were evident although the general pattern
tended to suggest a steady rise in certain populations from May–September followed by a
drop-off in numbers from December to March. Of all the surveys, 16 had scores of 10 or
more, while only three counts (September 1990, October 1990 and October 1995) scored
higher than 15. The median summer and winter scores were 5.2 and 2.6 respectively. From
September 1990 to November 1995 at least one month each year scored 10 or higher; these
months usually encompassed September, October and/or November. In contrast, from
December 1995 to June 2001 no month surpassed a score greater than 10. From July 2001
to July 2004, only one month (August 2001) scored greater than 10 and only two months
scored between 5–10.
A total of 14 species constituted those species that reached or surpassed the 1%
threshold levels (Table C.2). Cape Shoveler and Hartlaub’s Gull were the only species to
have globally and regionally important numbers, their 1% indices supporting more than
double the 1% threshold levels. The remainder all reached levels that represented more
than 1% of the estimated southern African populations (Wetlands International 2006).

332
Seven species – White-breasted Cormorant, Caspian Tern, Greater Flamingo, Black-necked
Grebe, Black-winged Stilt, Pied Avocet and Swift Tern – occurred at levels that surpassed
at least double the 1% threshold for southern Africa. Not all of these species occurred
regularly at these levels – only White-breasted Cormorant (27%), Cape Shoveler (25%),
Greater Flamingo (15%) and Black-winged Stilt (14%) were counted at these levels on more
than 10% of the counts. In terms of South Africa’s Western Cape Province, Rocher Pan
supports up to one-third of the Caspian Tern population, while Greater Flamingo, Black-
necked Grebe and Cape Shoveler represented about 20% of their estimated provincial
populations (Table C.2).
The relationship between the monthly WCV scores and (a) the number of species
reaching or surpassing the 1% threshold levels, and (b) total number of birds are shown in
Figures C.12a and C.12b respectively. These showed that although large scores ( 10) are
usually associated with greater number of species reaching 1% threshold levels and/or
larger number of birds, this was not always the case. On two occasions – January 1993 and
August 2001 – WCV scores 10 occurred with a minimum of two species, while in August
2001 a score of 13.8 was recorded when a little over 1 000 birds were recorded. It is also
interesting to note that although some counts did not contain species at 1% levels, the
cumulative WCV score was above 1.
In terms of species maxima, Rocher Pan ranks as the fifth most important site for
waterbird abundance among Western Cape wetlands in summer, where all major wetlands
are surveyed (Coordinated Waterbird Counts, Animal Demography Unit, unpubl. data;
Table A.5, Appendix A).
Threatened species
Rocher Pan supported seven Red Data species: African Marsh Harrier (Vulnerable) and six
Near-threatened species – Greater Flamingo, Lesser Flamingo, Cape Cormorant, Great
White Pelican, African Black Oystercatcher, Black Stork and Caspian Tern (Barnes 2000).
The flamingos use the pan on an annual basis, the Greater more so than the Lesser, but
nevertheless highlights the importance of this site in the species’ critical site network
within southern Africa (Simmons 1996, 2000, African-Eurasian Waterbird Agreement
2000). The Cape Cormorant, Great White Pelican and African Black Oystercatcher
probably only make use of the site for feeding and/or roosting, while the Black Stork and
African Marsh Harrier are probably rare, but annual, visitors to the pan (Table C.1).

333
Discussion
Seasonality and abundance
The results clearly show that the overall annual pattern of occurrence of waterbirds was
strongly seasonal at Rocher Pan and mirrored the yearly seasonal rainfall and inundation
pattern. The pan fills via increased inflow as a result of winter rains which tend to peak in
July (Figure C.2). Numbers of waterbirds started to increase from August with maximum
numbers occurring during October–November. This indicates that the pan starts to fill
about one month after peak rains and that there is almost a three month delay before peak
abundance occurs. Coetzer (1985) does indicated that depending on the level of rainfall and
period of inundation it can take up to two months before most of the pan fills. The pan the
starts to dry out from January onwards when inflow is nil or negligible and hot summer
temperatures and strong south-easterly winds lead to high evaporation levels. By late
March and through April the pan is usually dry or only has small pools of shallow water,
the latter if late inundation occurs. Waterbird abundance drops rapidly during this period
(December–March) and by April most waterbirds have moved off.
The seasonal, ephemeral nature of the pan is a key element of the wetland and
defines how waterbirds, notably resident species, use the site. There are progressive stages
in the pan’s condition that favour some waterbirds over others. Thus, waterfowl prefer the
pan when it is fully inundated (September–November), a time when it is largely unsuitable
for shorebirds (see Figures C.5 and C.6). As it dries down from December onwards, so it
becomes progressively less attractive to waterfowl and more attractive to shorebirds and
waders; species such as Kittlitz’s Plover, Pied Avocet, Blacksmith Lapwing, Greater
Flamingo and Lesser Flamingo were more abundant making use of the remaining
shallower standing water and exposed shoreline and mud-flats. When completely dry in
April (and sometimes early May, Coetser 1985), the dried surface of the pan is used by
species such as Kittlitz’s Plover which become increasingly abundant (Figure C.6), and by
gulls and terns as day roosts (AJ Williams pers. comm.).
During the draw-down phase adult waterfowl have to leave the pan well before it
dries out as they undergo a month-long flightless post-breeding moult when they have to be
at waterbodies that are permanent or at least remain reliably flooded and through a period
of post-moult recovery. Heÿl et al (1993) found that for the Cape Shoveler in the winter-
rainfall region numbers remained relatively high two months after their peak abundance
and suggested this related to a period when birds recovered their body condition following
their moult period.

334
Thus, it seems plausible that the period of inundation can determine the extent to
which waterfowl utilize the site for breeding and moulting. In years of good rainfall and/or
with late inundation the pan becomes optimal as a breeding and post-breeding moult and
refuge site but in years of low rainfall and/or early inundation, drying is likely to occur
sooner which could impact the way in which birds use the site as a breeding site and/or
moult refuge. For the latter, fewer birds may choose to breed at the pan and finding
alternative sites at which to breed becomes imperative. The fluctuations and variability
seen in the inter-annual seasonal abundance of all the waterfowl species provides some
support for this, with certain years accommodating more birds than others (e.g. Red-
knobbed Coot, Maccoa Duck, South African Shelduck, Cape Shoveler and Little Grebe in
1992/93 and Cape Teal and Black-necked Grebe in 1987/88). These peaks tend to suggest
preferences for certain inundation regimes, the former being subject to high inflow
resulting in primarily longer freshwater inundation and the latter probably from low- or
reduced flow periods causing more saline conditions to develop. The inter-annual rainfall at
Elandsbaai weather station tends to suggest that this was the case in the respective years.
But this station monitors coastal rain about 35 km to the north of Rocher Pan and would
not accurately capture the variability in inflow in the Papkuils River. However, it seems
clear that proximal factors such as rainfall and inundation patterns determine the seasonal
occurrence of ducks and geese at Rocher Pan.
Inter-annual variation, emigration and immigration
Most species showed no clear trend and fluctuations between years tended to be the rule
rather than the exception. Some species did tend to show some increases: Egyptian Goose
and South African Shelduck were the only resident species whose numbers, on average,
have shown increases over the 23 years. Common Greenshank and Little Stint were the
only Palearctic species tended to show increases over the study period, although the
Common Greenshank occurred in small numbers (< 10 birds) and the trend may not relate
to a true increase.
As an ephemeral system emigration and immigration occurs at pivotal points during
the year. As the pan fills at the start of the winter rainfall season (June–July) primary
productivity starts to increase (Coetzer 1981) which attracts mostly waterfowl and gulls to
the pan (Figure C.3). Resident shorebirds tend to be largely absent due to the high water-
levels and lack of shoreline during this period. By October and November peak abundance
occurs and includes large numbers of waders, flamingos and Palearctic shorebirds. From
January–April, during the dry spell when production in the pan is low and water-levels
recede, most waterbirds, and notably the waterfowl, emigrate to find permanent, deep

335
water. Thus, Rocher Pan exhibits a constant annual influx-exodus cycle. This cycle, as
evidenced by the inter-annual abundances, is never static and arrival and departure times
will depend on the inundation patterns from one year to the next. The Berg River Estuary
and Verlorenvlei are possible emigration localities for Rocher Pan’s waterbirds as they lie
in close (< 30 km) proximity to the pan and provide optimal habitats when the pan dries up.
How site-faithful some species are to Rocher Pan is unknown but it is assumed that at least
a large proportion of the breeding waterfowl and possibly gulls and terns return to the pan
every year.
The pan could support nomadic wetland birds that make use of temporary wetlands
in the arid zone further north and immigration could contribute to smaller influxes. It is
well established that to breed, flamingos need flooding of large pans in Botswana and
northern Namibia and are forced to alternative, mainly coastal wetlands when the interior
pans dry out (Williams and Velásquez 1997). Any temporary influxes of waterbirds from
areas to the north of Rocher Pan would be dependent on the amount and frequency of
rainfall in the arid zone. Other nomadic species such as the Pied Avocet and Black-winged
Stilt are known to move around in response to changing conditions at wetlands or through
their wandering movements in the landscape and may only return to Rocher Pan in large
numbers in certain years (Figure C.6). Nevertheless, these immigration events highlight
the inter-connectivity between sites and macro-use of landscape by waterbirds in this part
of the winter-rainfall region. Ringing studies could elucidate this interconnectivity.
Relationship of wetness to occurrence of waterbirds at Rocher Pan
Overall, the seasonal abundance and inter-annual variation of waterbirds at Rocher Pan
can be seen in light of two intrinsic factors, water-level fluctuations at the pan and regional
rainfall. Because water-level fluctuations in the pan are dependent on rainfall in the
catchment and direct rainfall, there should be a relationship between accumulative rainfall
(wetness) and waterbird occurrence at the pan. Thus besides the actual seasonality of
rainfall which will determine the months in which inundation is likely to occur, the actual
response to this inundation is what is being defined here.
This relationship could be modeled for each species using generalised linear models
with log-link functions with seasonality and wetness as explanatory variables. Similar
studies were carried out by Chambers and Loyn (2006) in Australia who found positive
relationships between seasonal patterns of abundance of Black Swan Cygnus atratus,
White-faced Heron Egretta novaehollandiae and Grey Teal Anas gracilis with local climatic
variables such as streamflow and regional rainfall as well as broader climatic influences
such as the Southern Oscillation Index. They discovered time-lag responses for each species

336
based largely on stream flow variability and highlighted that waterfowl, in particular,
respond to climatic events at broader landscape or even continental scales, and require
habitats in widely different places and different times for different purposes. There is a
need to conduct similar waterbird–climatic studies in South Africa to determine exactly
how waterbirds respond to local and regional climatic patterns particularly in light of
wetland seasonality and rainfall regimes between the winter and summer rainfall regions
in South Africa.
Impacts of climate change
If the response to annual wetness is a primary factor governing how waterbirds, in general,
use Rocher Pan, then long-term climate change needs to be considered. Climate change
models for the Western Cape Province predict that the climate will be warmer and drier
with a drying trend from west to east (Midgley et al. 2005). In addition, winter rainfall
patterns are predicted to weaken with rainfall becoming more irregular but rainfall events
more intense. These changes will have profound impacts on the wetland avifauna in the
region particularly in the way waterbirds use certain sites. With changes to inflow
periodicity, Rocher Pan could remain drier for longer periods and have short burst of
productivity and this will impact on the occurrence of and use by waterbirds at the site. In
the long-term, the larger and more permanent wetlands in the region, such as Verlorenvlei,
Berg River Estuary and Langebaan Lagoon, could see influxes of waterbirds and become
more important refuges for species that once utilized more temporary sites such as Rocher
Pan. Continued long-term monitoring and more detailed climate change analyses are
recommended for future assessment of the site’s importance as a regional waterbird refuge.
Importance of Rocher Pan for waterbirds
The waterbird survey data presented here clearly demonstrated that Rocher Pan has more
significance for resident African species than Palearctic migrants. Of the 14 species that
had globally significant populations, 13 species were African residents; the only Palearctic
species was the Curlew Sandpiper (see Table C.2). Although Palearctic migrants do not
generally occur in significant numbers the site does offer these species a feeding and
roosting refuge along the East Atlantic Flyway, particularly on arrival
(September– October) and when water-levels recede (December–February).
Breeding birds
I did not assess breeding status in this chapter as I did not have access to the breeding
data. However, Heÿl et al. (1993) summarized waterfowl breeding outputs and recorded

337
nine duck species breeding at the pan (Table C.1): Cape Shoveler, Cape Teal and Egyptian
Goose were the most numerous in terms of duckling broods produced. The peak abundance
of waterfowl at the pan corresponds to the time when breeding birds would be nesting and
raising broods. The islands that form in the dam during inundation plus the vegetated
margins of the pan provide safe breeding sites for waterfowl and coupled with increased
food abundance during this period makes Rocher Pan an ideal locality for waterfowl to
breed. There are no fish in the pan or lower reaches of the Papkuils River (R van der Walt
in litt.) mainly due to the pan drying out in most years (du Preez 1992); there are however
fish (Galaxias and Sandelia spp.) in the middle and upper reaches of the river (L Jacobs in
litt.). The pan does support fairly high numbers of frogs (mainly Platanna) (du Preez 1992)
and waterfowl and other species will make use of this food resource when it becomes
available (AJ Williams in litt.). Without competition from fish there is more amphibian food
(tadpoles and froglets) for the ducklings and the pan is safer for adult waterfowl to raise
their broods. When considering the surrounding arid landscape, most of it comprises
cultivated farmland, with limited natural vegetation and a few small natural wetlands
linked to the Papkuils and Sout drainage systems. Consequently, Rocher Pan is the only
large, viable wetland that can support relatively large numbers of waterbirds for any length
of time during the year and why many waterfowl breed at the pan during periods of
inundation. As such it plays a crucial ecological role for a suite of species within a defined
region of the winter rainfall region (Zaloumis and Milstein 1975). One of the main reasons
for proclaiming the nature reserve was to establish and conserve the pan as a waterfowl
breeding sanctuary, particularly for Cape Shoveler, and based on the results from this
study it is strongly recommended that this continues.
Other species that are known to breed at the pan include African Sacred Ibis, and
small numbers of Kelp Gull which breed on the islands; White-breasted Cormorants also
collect nesting material from the pan and transfer it to their nesting colony in isolated trees
500 m south of the pan (AJ Williams in litt.).
One also needs to consider the impacts of predation which at relatively natural
wetlands such as Rocher Pan may be more pronounced than it is in permanent intra-urban
wetlands such as Strandfontein Waste Water Treatment Works and Paarl Waste Water
Treatment Works. Located within a nature reserve a range of potential predators exists for
waterbirds, including African Fish Eagle, African Marsh Harrier and Pied Crows among
birds, and probably Caracal Felis caracal, African Wild Cat Felis silvestris, and mongoose
and even jackal among medium sized mammals. However, with the exception of the bird
predators, mammalian predators are strongly geared to the terrestrial habitats and prey in
the reserve and are likely to avoid the waterbody and its wetter peripheries (where the

338
ducks mostly breed). Fortunately, because of its ephemerality, and distance from other
permanent freshwater there are unlikely to be Water Mongoose Atilax paludinosus.
Identification of nest predators and their impact on breeding success of waterfowl forms
part of the nature reserve’s management plan (du Preez 1992) but it is unknown if this is
carried out regularly. If not, it would be strongly recommended for reserve staff to prioritise
this activity in future.
Use by seabirds and other coastal birds
The close proximity of Rocher Pan to the coast (< 500 m) allows seabirds and other coastal
species to access the pan easily. Sandwich and Common Terns were not abundant at
Rocher Pan and these species probably used the pan as a roosting and bathing site. There is
likely to be some tidal and weather influences on the use of the pan by seabirds. When the
tide is high or bad weather pushes waves high up the beach, birds which might normally
roost and/or forage along the beach will move onto the pan as a better and safer alternative.
In contrast, White-winged Terns were the most abundant migrant tern. Their
occurrence at the pan would relate to benefiting from the expected abundant food supply in
the system in early spring and summer when aquatic chironomid and other aquatic larvae
would be pupating and emerging from the water column (Appendix A). High macronutrient
influx occurs soon after inundation in May/June with subsequent increases in the following
months of zooplankton communities, notably Cladocerans (Daphnia spp.) (Coetzer 1985);
the latter would form a large proportion of the aquatic chironomid larvae’s diet before
pupating.
Of the resident terns, the Swift Tern was the only abundant species but like the
Palearctic terns, possibly only used the site as a roosting refuge. Their numbers peaked
during winter, a few months prior to the influx of Palearctic terns, but did occur in small
numbers during the rest of the year. Their occurrence probably relates to post-breeding
dispersal of adults and juveniles from their breeding sites which were occupied during
February–March; 80% of the South African breeding population breeds at islands between
Cape Town and Saldanha Bay (Crawford 1997), the latter about 80 km south of Rocher
Pan. Caspian Terns were most frequently present in August with smaller numbers
throughout the year. Their occurrence, like the Swift Terns, probably relates to post-
breeding dispersal and in the absence of fish in the pan makes use of the islands in the pan
for roosting rather than feeding in the pan.
African Black Oystercatchers are generally found in coastal rocky habitats, but they
do occasionally use wetlands near the coast (Martin 1997, pers obs.). Most birds were
recorded at Rocher Pan from June–September (with some birds at other times of the year).

339
A small population breeds on the adjacent stretch of sandy beach and it is likely that these
birds use the pan for bathing and as a safe roosting place (AJ Williams in litt.). It is
probable that small influxes occur from dispersing juveniles most of which would have
fledged between January and April (Hockey 1983).
Bio-impacts of waterbirds on the pan ecosystem
With the large numbers of waterfowl and other waterbirds that use Rocher Pan, one needs
to consider their direct impacts on the ecosystem. Williams (2003) suggested that nutrient
turnover is an important aspect in wetland ecosystems especially where waterbirds feature
as the main faunal component. Initially as the pan fills, detritus forms from the deposition
of organic material (Coetzer 1981). Zooplankton then feed on the detritus and aquatic
invertebrates feed on the zooplankton. Waterbirds make use of the rich aquatic
invertebrate community and return nutrients back to the waterbody via their faeces. This
increasingly enriches the water as it dries down. Seabirds and waterfowl such as Egyptian
Goose forage away from the pan but drop faeces there whilst roosting so there is a net input
of nutrients to the system. How important such inputs are to the vegetation has not been
established but may be substantial.
Impacts can be taken to the broader landscape level. As an ephemeral system, plant
use is curtailed in Rocher Pan by the changing conditions which preclude most of the
upland (terrestrial) plants of the area and lead to dominance by specialist azonal wetland
plant species (e.g. Potamogeton spp). To spread between disparate and generally well
separated waterbodies, especially in this part of the winter rainfall region, these plants
produce large amounts of seed. This provides food for waterbirds, especially dabbling ducks
(Yellow-billed Duck, Cape Teal, Red-billed Teal) and the ducks transport viable seeds
between wetlands.
Conservation importance
Waterbird Conservation Value (WCV) scores
In assessing the importance of Rocher Pan for waterbirds in the winter-rainfall region and
the arid west coast of the Western Cape further discussion on the WCV score is needed. The
fundamental value of the score lies in its ability to assess each species’ contribution to the
overall conservation importance of the site, independent of other variables such as energy
consumption. This means that while a species may not reach global population threshold
levels it contributes to the overall conservation value of the site when seen at the
community level. Thus, populations of species at a site which have higher cumulative 1%
scores would signify that site of higher conservation value than a site which has lower

340
scores. The WCV score thus reflects the usage of a site in terms of the number of birds
present, such that the more individuals using it per species the greater the value it
represents to them. For Rocher Pan, 20 of the 64 species surveyed revealed that the site
held importance for their populations both at a global and sub-regional scale (Table C.2).
Their use of the site, however, varied across years although general patterns were evident:
specific species tended to peak at the same time of year (e.g. Black-necked Grebe and Black-
winged Stilt in September/October, White-breasted Cormorant in December/January and
Pied Avocet in December/February). These inter-annual WCVS fluctuations, coupled with
rainfall and in situ site characteristics, will then influence when the site is of prime
importance for the waterbird community as a whole and for individual species. It is
interesting to note that while some species meet globally or biogeographically significant
thresholds, others meet more local thresholds; seventeen species (Table C.2) at Rocher Pan
comprised population levels that strongly suggest they make valuable contributions to the
species population in the province. This then infers that they make up an important
component of waterbird populations in the winter-rainfall region.
Importance of waterfowl at Rocher Pan
As mentioned above, waterfowl constitute an important component of the waterbird
community at Rocher Pan and nine species occurred at important threshold levels during
this study. For Cape Shoveler, the site’s original icon species, the data did show that the
site was used regularly by a significant part of the southern African population and that
the site therefore continued to be favoured by this species. The suitable water-levels and
availability of aquatic invertebrates following inundation no doubt are strong selection
factors for the shoveler in using Rocher Pan. No other wetland sites along the west coast
support numbers of Cape Shoveler at the levels recorded at Rocher Pan (Coordinated
Waterbird Counts, Animal Demography Unit, unpubl. data), highlighting the importance of
this site for the species in South Africa. The site becomes of even greater international
importance for the species when it is considered that it is endemic to southern Africa
(Siegfried 1965, Hockey et al. 2005). Other waterfowl, Yellow-billed Duck and Great
Crested Grebe, did occur at globally significant levels but these levels were not maintained
on a regular basis suggesting that they only use Rocher Pan when other sites become sub-
optimal or when there is an abundance of suitable foraging prey. This suggests that birds
may ‘monitor’ the conditions at Rocher Pan and make seasonal use of a short-term foraging
resource.
At a sub-regional level (Barnes 1998), populations of Red-knobbed Coot, Cape Teal,
South African Shelduck and Maccoa Duck are important at Rocher Pan but with only single

341
counts at these levels (see Table 2) it does suggest they make use of other wetland sites in
the region on a more regular basis. Fulvous Duck, Southern Pochard and White-backed
Duck are rare ducks in the Western Cape with low populations (Hockey et al. 1989) but do
occur in fairly good numbers at Rocher Pan making the site of conservation importance to
these species.
For other waterbirds, the site held importance for resident shorebirds (Pied Avocet,
Black-winged Stilt, Greater Flamingo and Lesser Flamingo). As the pan begins to dry out
from October, water-levels drop making it attractive for these species to use it for foraging.
Black-winged Stilts were regular visitors to Rocher Pan, while Pied Avocet, and Greater
and Lesser Flamingo, less so, and suggests that the stilts use Rocher Pan as preferred site
while the avocets and flamingos use other regional wetlands before arriving at the pan.
This is probably related to inundation levels at the pan and other surrounding wetlands
from year to year.
Whether waterbirds use Rocher Pan regularly or not, the availability of suitable
wetlands, at all stages in their annual cycle, is critical to the long-term survival of their
populations in the region. Consequently, conservation authorities in the province have a
responsibility to ensure that conservation targets are reached for these species, including
the provision of suitable sites. Based on this, it is therefore strongly recommended that the
current conservation status of the site (i.e. provincial nature reserve), continues in the long-
term in order to safe-guard it as a sanctuary for the Cape Shoveler, and other waterfowl
(Siegfried 1970).
The site qualifies for Ramsar and Important Bird Area (IBA) status based on the
species listed in Table 2. These global conservation initiatives aim to prioritise important
global and regional wetland and bird conservation sites for biodiversity conservation
(Barnes 1998, Fishpool and Evans 2001). The designation of Rocher Pan as a Ramsar
and/or IBA site will greatly enhance the conservation status of the site and secure the long-
term preservation of this wetland for waterbirds in the winter-rainfall region.
342
References
African-Eurasian Waterbird Agreement 2000. Report on the conservation status of migratory waterbirds in the agreement area. Technical Series No. 1. The Netherlands.
Barnes KN (ed.) 1998. Important Bird Areas of Southern Africa. BirdLife South Africa, Johannesburg.
Barnes KN (ed.) 2000. The Eskom Red Data book of birds of South Africa, Lesotho and Swaziland, BirdLife South Africa, Johannesburg.
Brand DJ 1961. A comparative study of the Cape Teal (Anas capensis) and Cape Shoveller (Spatula capensis), with special reference to breeding biology, development and food requirements. Unpublished Ph.D thesis, University of South Africa.
Chambers LE and Loyn RH 2006. The influence of climate variability on numbers of three waterbird species in Western Port, Victoria, 1973–2002. International Journal of Biometeorology 50: 292–304.
Coetzer A 1981. Some limnological observations of a temporary west coast pan in southern Africa: Rocher Pan. Hydrobiologia 78: 161–167.
Coetzer AH 1985. Succession in zooplankton and hydrophytes of a seasonal water (Rocher Pan), on the West Coast of South Africa. Department of Nature and Environmental Conservation, Cape Provincial Administration, Final report, November 1985.
Coetzer AH, Heÿl CW and le Roux A 1985. Rocherpan conservation project. Cape Nature Conservation. 96 pp.
Cowan G (ed.) 1995. Wetlands of South Africa. Department of Environmental Affairs and Tourism, Pretoria.
Crawford RJM 1997. Swift Tern Sterna bergii.In: Harrison JA, Allan DG, Underhill LG, Herremans M, Tree AJ, Parker V and Brown CJ (eds) The Atlas of Southern African Birds, vol. 1: Non-passerines. pp 470–471. BirdLife South Africa, Johannesburg.
Du Preez D 1992 Rocherpan Natuurreservaat Bestuurplan. Cape Nature Conservation CapeNature, Cape Town.
Fishpool LDC and Evans MI (eds) 2001. Important Bird Areas in Africa and Associated Islands: Priority Sites for Conservation. BirdLife Conservation Series No. 11. Newbury and Cambridge, United Kingdom: BirdLife International.
Heÿl CW, Anderson MD, Loubser DI and Scott HA 1993 Duck population monitoring in the Cape Province. Internal Report No. 12. Cape Nature Conservation, Cape Town.
Heÿl CW 1985 Bewaaringsfunksies en – doelwitte vir Rocherpan. In: Rocherpanbewaringsprojek. Internal report. CapeNature.
Hockey PAR 1983. The distribution, population size, movements and conservation of the black oystercatcher Haematopus moquini. Biological Conservation 25: 23–262.
Hockey PAR, Dean WRJ and Ryan PG 2005. Roberts’ birds of southern Africa. 7th edition. John Voelcker Bird Book Fund. Johannesburg.
Hockey PAR, Underhill LG, Neatherway M and Ryan PG 1989. Atlas of the birds of the southwestern Cape. Cape Bird Club, Cape Town.
Martin AP 1997. African Black Oystercatcher Haemotopus moquini. In: Harrison JA, Allan DG, Underhill LG, Herremans M, Tree AJ, Parker V and Brown CJ (eds) The Atlas of Southern African Birds, vol. 1: Non-passerines. pp 374–375. BirdLife South Africa, Johannesburg.
Midgley GF, Chapman RA, Hewitson B, Johnston P, de Wit M, Ziervogel G, Mukheibir P, van Niekerk L, Tadross M, van Wilgen BW, Kgope B, Morant PD, Theron A, Scholes RJ and Forsyth GG 2005. A Status Quo, Vulnerability and Adaptation Assessment of the Physical and Socio-economic Effects of Climate Change in the Western Cape. Report to the Western Cape Government, Cape Town, South Africa. CSIR Report No. ENV-S-C 2005-073, Stellenbosch.
Mucina L and Rutherford MC (eds) 2006. The Vegetation of South Africa, Lesotho and Swaziland. Strelitzia 19. South African National Biodiversity Institute, Pretoria.

343
Siegfried WR 1965. The Cape Shoveller Anas smithii (Hartert) in southern Africa. Ostrich 36: 155–198.
Siegfried WR 1970. Wildfowl distribution, conservation and research in southern Africa. Wildfowl 21: 89–93.
Simmons RE 1996. Populations declines, viable breeding areas and management options for Flamingos in southern Africa. Conservation Biology 10: 504–514.
Simmons RE 2000. Declines and movements of Lesser Flamingos in Africa. Waterbirds 23: 40–46.
Summers RW, Pringle JS and Cooper J 1976. The status of coastal waders in the south-western Cape, South Africa. Report on the summer 1975/76 ornithological survey of coastal wetlands and shorelines of the south-western Cape by the Western Cape Study Group.
Underhill LG and Cooper J 1982. Counts of waterbirds at coastal wetlands in southern Africa 1978–1981. Percy Fitzpatrick Institute of African Ornithology, University of Cape Town.
Wessels NGL 1997. Rocherpan Nature Reserve: Management Plan. Cape Nature Conservation, Cape Town.
Wetlands International 2006. Waterbird Population Estimates – Fourth Edition. Wetlands International Global Series No. 12, Wageningen, The Netherlands.
Wheeler MJ 1998. An ecological study on Rocherpan. Unpublished Nature Conservation Diploma report. Cape Peninsula University of Technology, Cape Town.
Williams AJ, Heÿl C, Shaw K and Harebottle DM 2002. Waterbird counters rewarded: the case of Wadrif wetland. Bird Numbers 11(1): 18–22.
Williams AJ 2003. Crop, crap and stir: the impact of waterbirds on wetlands. Bird Numbers 12(1): 6–8.
Williams AJ and Velásquez C. 1997. Greater Flamingo Phoenicopterus ruber. In: Harrison JA, Allan DG, Underhill LG, Herremans M, Tree AJ, Parker V and Brown CJ (eds) The Atlas of Southern African Birds, vol. 1: Non-passerines. pp 112–113. BirdLife South Africa, Johannesburg.
Woodall PF 1985. Waterbird populations in the Brisbane Region, 1972-83, and correlates with rainfall and water heights. Australian Wildlife Research 12: 495–506.
Zaloumis EA and Milstein P le S 1975. The conservation of wetland habitats for waterfowl in southern Africa. Supplement to African Wildlife 29.
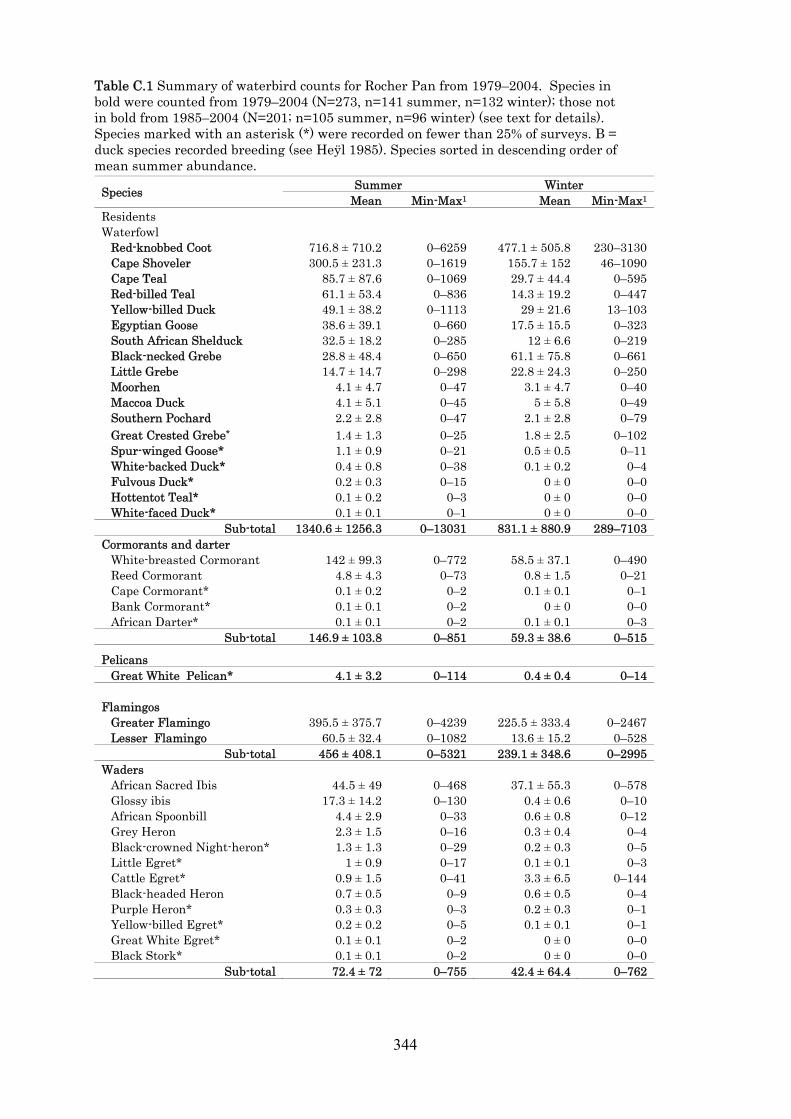
344
Table C.1 Summary of waterbird counts for Rocher Pan from 1979–2004. Species in bold were counted from 1979–2004 (N=273, n=141 summer, n=132 winter); those not in bold from 1985–2004 (N=201; n=105 summer, n=96 winter) (see text for details). Species marked with an asterisk (*) were recorded on fewer than 25% of surveys. B = duck species recorded breeding (see Heÿl 1985). Species sorted in descending order of mean summer abundance.
Species Summer Winter
Mean Min-Max1 Mean Min-Max1 Residents Waterfowl Red-knobbed Coot 716.8 ± 710.2 0–6259 477.1 ± 505.8 230–3130 Cape Shoveler 300.5 ± 231.3 0–1619 155.7 ± 152 46–1090 Cape Teal 85.7 ± 87.6 0–1069 29.7 ± 44.4 0–595 Red-billed Teal 61.1 ± 53.4 0–836 14.3 ± 19.2 0–447 Yellow-billed Duck 49.1 ± 38.2 0–1113 29 ± 21.6 13–103 Egyptian Goose 38.6 ± 39.1 0–660 17.5 ± 15.5 0–323 South African Shelduck 32.5 ± 18.2 0–285 12 ± 6.6 0–219 Black-necked Grebe 28.8 ± 48.4 0–650 61.1 ± 75.8 0–661 Little Grebe 14.7 ± 14.7 0–298 22.8 ± 24.3 0–250 Moorhen 4.1 ± 4.7 0–47 3.1 ± 4.7 0–40 Maccoa Duck 4.1 ± 5.1 0–45 5 ± 5.8 0–49 Southern Pochard 2.2 ± 2.8 0–47 2.1 ± 2.8 0–79 Great Crested Grebe* 1.4 ± 1.3 0–25 1.8 ± 2.5 0–102 Spur-winged Goose* 1.1 ± 0.9 0–21 0.5 ± 0.5 0–11 White-backed Duck* 0.4 ± 0.8 0–38 0.1 ± 0.2 0–4 Fulvous Duck* 0.2 ± 0.3 0–15 0 ± 0 0–0 Hottentot Teal* 0.1 ± 0.2 0–3 0 ± 0 0–0 White-faced Duck* 0.1 ± 0.1 0–1 0 ± 0 0–0
Sub-total 1340.6 ± 1256.3 0–13031 831.1 ± 880.9 289–7103 Cormorants and darter White-breasted Cormorant 142 ± 99.3 0–772 58.5 ± 37.1 0–490 Reed Cormorant 4.8 ± 4.3 0–73 0.8 ± 1.5 0–21 Cape Cormorant* 0.1 ± 0.2 0–2 0.1 ± 0.1 0–1 Bank Cormorant* 0.1 ± 0.1 0–2 0 ± 0 0–0 African Darter* 0.1 ± 0.1 0–2 0.1 ± 0.1 0–3
Sub-total 146.9 ± 103.8 0–851 59.3 ± 38.6 0–515
Pelicans Great White Pelican* 4.1 ± 3.2 0–114 0.4 ± 0.4 0–14
Flamingos Greater Flamingo 395.5 ± 375.7 0–4239 225.5 ± 333.4 0–2467 Lesser Flamingo 60.5 ± 32.4 0–1082 13.6 ± 15.2 0–528
Sub-total 456 ± 408.1 0–5321 239.1 ± 348.6 0–2995 Waders African Sacred Ibis 44.5 ± 49 0–468 37.1 ± 55.3 0–578 Glossy ibis 17.3 ± 14.2 0–130 0.4 ± 0.6 0–10 African Spoonbill 4.4 ± 2.9 0–33 0.6 ± 0.8 0–12 Grey Heron 2.3 ± 1.5 0–16 0.3 ± 0.4 0–4 Black-crowned Night-heron* 1.3 ± 1.3 0–29 0.2 ± 0.3 0–5 Little Egret* 1 ± 0.9 0–17 0.1 ± 0.1 0–3 Cattle Egret* 0.9 ± 1.5 0–41 3.3 ± 6.5 0–144 Black-headed Heron 0.7 ± 0.5 0–9 0.6 ± 0.5 0–4 Purple Heron* 0.3 ± 0.3 0–3 0.2 ± 0.3 0–1 Yellow-billed Egret* 0.2 ± 0.2 0–5 0.1 ± 0.1 0–1 Great White Egret* 0.1 ± 0.1 0–2 0 ± 0 0–0 Black Stork* 0.1 ± 0.1 0–2 0 ± 0 0–0
Sub-total 72.4 ± 72 0–755 42.4 ± 64.4 0–762

345
Table C.1 contd
Species Summer Winter
Mean Min-Max1 Mean Min-Max1 Shorebirds Blackwinged Stilt 113.6 ± 139.8 0–868 58.3 ± 85.5 0–497 Kittlitz's Plover 60.6 ± 43 0–368 25.6 ± 5.4 0–208 Pied Avocet 37.7 ± 23.2 0–715 1.1 ± 1.2 0–43 Blacksmith Lapwing 21.5 ± 13 0–147 13.3 ± 9.1 0–75 African Black Oystercatcher 4.3 ± 3.2 0–27 10.4 ± 4.7 0–33 Three–banded Plover 2.9 ± 1.2 0–37 2.3 ± 3.5 0–121 Whitefronted Plover* 2.4 ± 1.6 0–80 1.1 ± 1 0–17 African Snipe* 0.3 ± 0.5 0–22 0 ± 0 0–0 Chestnut–banded Plover* 0.2 ± 0.3 0–5 0.1 ± 0.1 0–3 Painted Snipe* 0.1 ± 0.1 0–2 0.1 ± 0.1 0–1
Sub–total 243.2 ± 225.6 0–2271 111.9 ± 110.2 0–998 Raptors African Marsh Harrier* 0.2 ± 0.2 0–2 0.1 ± 0.2 0–2 African Fish Eagle* 0 ± 0 0–0 0.1 ± 0.1 0–1
Sub–total 0.2 ± 0.2 0–2 0.1 ± 0.1 0–2 Rallids Purple Gallinule* 0.1 ± 0.1 0–2 0.1 ± 0.1 – African Rail* 0.1 ± 0.1 0–2 0.1 ± 0.1 0–2 Black Crake* 0.1 ± 0.1 0–2 0 ± 0 0–2 African Jacana* 0 ± 0 0–0 0 ± 0 0–0
Sub–total 0.2 ± 0.2 0–4 0.1 ± 0.1 0–1 Gulls Kelp Gull 67.9 ± 39.4 0–953 50.6 ± 33.5 0–391 Hartlaub's Gull 45.6 ± 41.1 0–305 83.5 ± 56.7 0–571 Greyheaded Gull* 0.3 ± 0.3 0–10 0.4 ± 0.3 0–7
Sub–total 113.7 ± 80.7 0–1268 134.5 ± 90.4 0–969 Terns 0 ± 0 0 ± 0 Whiskered Tern* 0.8 ± 1.2 0–44 0.1 ± 0.1 0–1 Swift Tern 3.7 ± 4.6 0–108 29.9 ± 30.8 0–435 Caspian Tern* 0.7 ± 0.6 0–17 2.5 ± 4.3 0–180
Sub–total 5.1 ± 6.2 0–169 32.3 ± 35 0–616
Palearctic migrants Shorebirds Curlew Sandpiper 480 ± 372.8 0–5012 16.4 ± 23.5 0–409 Little Stint 176.1 ± 79.7 0–1243 6.9 ± 9.5 0–124 Ruff 78.4 ± 49.2 0–600 16 ± 35.7 0–247 Marsh Sandpiper 19.1 ± 16.3 0–276 0.5 ± 0.8 0–17 Common Greenshank 3.4 ± 2.5 0–52 0.3 ± 0.3 0–9 Common Ringed Plover 3 ± 1.8 0–32 0.3 ± 0.5 0–7 Wood Sandpiper* 0.8 ± 0.4 0–6 0.1 ± 0.1 0–4 Sanderling* 0.5 ± 1.2 0–49 0 ± 0 0–0 Common Sandpiper* 0.2 ± 0.4 0–6 0.1 ± 0.1 0–2 Ruddy Turnstone* 0.2 ± 0.3 0–7 0.1 ± 0.1 0–1 Grey Plover* 0.1 ± 0.1 0–5 0 ± 0 0–0 Bartailed Godwit* 0.1 ± 0.1 0–4 0 ± 0 0–0 Common Whimbrel* 0.1 ± 0.1 0–3 0 ± 0 0–0 Eurasian Curlew* 0.1 ± 0.1 0–3 0.1 ± 0.1 0–2 Terek Sandpiper* 0.1 ± 0.1 0–1 0.1 ± 0.1 0–1
Sub–total 716.8 ± 710.2 0–7299 477.1 ± 505.8 0–823

346
Table C.1 contd
Species Summer Winter
Mean Min–Max1 Mean Min–Max1 Terns Whitewinged Tern 47.8 ± 43.2 0–683 37.1 ± 71.9 0–1662 Common Tern* 5.9 ± 7.3 0–163 2.9 ± 2.9 0–95 Sandwich Tern* 0.2 ± 0.2 0–8 0.6 ± 0.6 0–24
Sub–total 53.7 ± 50.7 0–854 40.5 ± 75.3 0–1781
Sub–total: residents 2381.9 ± 2155.9 0–18521 1450.6 ± 1568.5 289–13978
Sub–total: Palearctic migrants 815.2 ± 575.1 0–7109 80.7 ± 145.5 0–2654
Total waterbirds 3197.1 ± 2731.0 0–13708 1531.3 ± 1714.0 289–8498
1 The sub-total values here reflect the minimum/ maximum number for the group profile as a whole and not the sum of individual minima/maxima for each species which would represent estimated min./max. carrying capaicty and not actual min./max. numbers reflected by the dataset

347
Table C.2. Species of conservation importance at Rocher Pan based on maximum counts from 201 surveys from June 1979 to July 2004. Species are sorted in descending order of global, sub-regional IBA and provincial. Species in bold are included in the South African Red Data book (Barnes 2000); NT = Near-threatened. Species names are taken from Hockey et al. (2005).
Species Max. count
Threshold/population level
Global1 IBA2 Western Cape3
Caspian Tern 180 12% (3) 3 32%White-breasted Cormorant 772 6.43% (57) 48 15%Greater Flamingo (NT) 4231 5.58% (44) 35 21%Cape Shoveler 1619 4.63% (67) 58 19%Black-necked Grebe 661 4.41% (17) 17 20%Black-winged Stilt 868 3.77% (29) 22 17%Pied Avocet 715 2.50% (5) 7 14.%Swift Tern 435 2.18% (4) 4 7%Hartlaub’s Gull 571 1.90% (5) 22 7%Lesser Flamingo (NT) 1082 1.80% (2) 11 16%Curlew Sandpiper 5012 1.52% (3) 3 9%Kelp Gull 953 1.36% (1) 7 7%Yellow-billed Duck 1113 1.10% (1) 1 7%Great Crested Grebe 102 1.02% (1) – 7%African Black Oystercatcher (NT) 33 – 8 5%Red-knobbed Coot 6259 – 1 8%Cape Teal 1069 – 1 2%Great White Pelican (NT) 114 – 1 3%South African Shelduck 285 – 1 2%Maccoa Duck 49 – 1 5%White-winged Tern 1662 – – 48%Fulvous Duck 15 – – 47%Red-billed Teal 836 – – 32%Marsh Sandpiper 276 – – 20%African Snipe 22 – – 15%Glossy Ibis 130 – – 13%African Sacred Ibis` 578 – – 13%Black-crowned Night-heron 29 – – 10%Ruff 600 – – 9%Little Stint 1243 – – 9%Three-banded Plover 121 – – 7%Kittlitz’s Plover 368 – – 7%Little Grebe 298 – – 6%White-backed Duck 38 – – 5%Whiskered Tern 44 – – 5%Southern Pochard 79 – – 5%White-fronted Plover 80 – – 5%
1 Calculated from Wetlands International (2006). Figures represent the percentage of the estimated global population based on the maximum count. Number in parentheses represents the number of counts which met or surpassed the 1% threshold level.
2 Figures represent the number of counts which met or surpassed the Sub-regional IBA level (0.5% threshold) for southern Africa (Barnes 1998) but did not surpass the 1% global threshold level.
3 Value represents the % of estimated provincial population and based on the maximum count. Sourced from Coordinated Waterbird Counts, Avian Demography Unit, unpublished data (2006)

348
Figure C.1 Rocher Pan Nature Reserve (lightly stippled) and Marine Reserve (intermediate stipple). The Rocher Pan wetland is shaded in grey.

349
Figure C.2 Mean monthly abundance of all waterbirds at Rocher Pan between 1979–2004. Dark bars = resident species, grey bars = Palearctic species. Mean monthly rainfall is also shown (---) and based on rainfall data from Elandsbaai rainfall station between 1994–2004.
Figure C.3 Mean monthly abundance of nine waterbird guilds at Rocher Pan from 1979–
2004.
0
500
1000
1500
2000
2500
3000
3500Waterfowl
Cormorants and darter
0
200
400
600
800
1000
1200
1400
Month
FlamingosWaders
0
5
10
15
20
25
30
35
40
0
1000
2000
3000
4000
5000
6000
7000
Mea
n ra
infa
ll (
mm
)
Mea
n no
. of
bir
ds
Month
Mea
n n
o. o
f bi
rds
0
100
200
300
400
500
Sep Oct Nov Dec Jan Feb Mar Apr May Jun Jul Aug
Month
Gulls
Palearctic terns
Resident terns
0
500
1000
1500
2000
2500Palearctic shorebirdsResident shorebirds

350
1979– 2004.
Figure C.4 Mean monthly abundance of eight waterfowl species at Rocher Pan from 1979–2004.
Mea
n n
o. o
f bi
rds
0
10
20
30
40
50
60South African Shelduck
0
500
1000
1500
2000 Red-knobbed Coot
0
200
400
600
800Cape Shoveler
0
50
100
150
200
250Cape Teal
0
50
100
150 Red-billed Teal
0
20
40
60
80
100
120Egyptian Goose
0
50
100
150
200
Sep Oct Nov Dec Jan Feb Mar Apr May Jun Jul Aug
Month
Black-necked Grebe
0
10
20
30
40
50
60
Month
Little Grebe

351
Figure C.5 Mean monthly abundance of eight waterbird species at Rocher Pan from 1979 –
2004.
0
100
200
300 White-breastedCormorant
0
50
100
150African Sacred Ibis
0
500
1000
1500 Greater FlamingoLesser Flamingo
0
50
100
150
200
Month
Hartlaub's Gull Kelp Gull
Mea
n n
o. o
f bi
rds
0
10
20
30
40
Month
Glossy Ibis
0
50
100Swift Tern

352
Figure C.6 Mean monthly abundance of selected resident shorebirds and Palearctic
shorebirds at Rocher Pan from 1979–2004.
0
100
200
300
400Blackwinged Stilt
0
20
40
60
80Pied Avocet
0
50
100
150 Kittlitz's Plover
0
10
20
30
40 Blacksmith Lapwing
0
5
10
15
Month
African BlackOystercatcher
0
500
1000
1500
2000
Month
Curlew SandpiperLittle StintRuff
Mea
n n
o. o
f bi
rds

Figure C.7 Summer (solid line) and winter (dashed line) inter-annual variation and trends in abundance of 10 waterfowl species at
Rocher Pan from 1979–2004.
0500
10001500200025003000
Year
Red-knobbed Coot
0
5
10
15
20Maccoa Duck
0
20
40
60
80Little Grebe
0
50
100
150
200
250
Year
Black-necked Grebe
0
200
400
600
800
Year
Cape Shoveler
0
50
100 South AfricanShelduck
0
100
200
300 Yellow-billedDuck
0
50
100
150Egyptian Goose
0
100
200
300
400Cape Teal
0
100
200
300
400 Red-billed Teal
Mea
n n
o. o
f bi
rds
353

Figure C.8 Inter-annual variation and summer (–) and winter (---) trends in abundance of six waterbird species at Rocher Pan from 1985–2004.
0
500
1000
1500
2000Greater Flamingo
0
50
100
150
200
250
300
Mea
n no
. of
bird
s
Lesser Flamingo
050
100150200250300350
Year
White-breasted Cormorant
0
50
100
150
200
250
300 Kelp Gull
0
50
100
150
200
250
300 Hartlaub's Gull
0
50
100
150
200
250
Year
African Sacred Ibis
354

Figure C.9 Inter-annual variation and summer (–) and winter (---) trends in abundance of selected resident and Palearctic shorebirds at Rocher
Pan from 1987–2004.
0
5
10
15
20
25
30 African Black Oystercatcher
0
10
20
30
40
50 Blacksmith Lapwing
0
50
100
150 Kittlitz's Plover
0
50
100
150
200
250
Mea
n no
. of
bird
s
Pied Avocet
0
500
1000
1500
2000 Curlew Sandpiper
0
100
200
300
400
500
Year
Little Stint
0
50
100
150
200
250
Year
Ruff
0
50
100
150
200
250
300
Year
Black-winged Stilt

356
Figure C.10 Inter-annual variation and summer (–) and winter (---) trends in abundance of Swift Tern and White-winged Tern at Rocher Pan from 1987–2004.
0
20
40
60
80
100
120
140
160Swift Tern
020406080
100120140160180200
Year
White-winged TernMea
n n
o. o
f bi
rds

357
Figure C.11 Monthly Waterbird Conservation Value (WCV) scores for Rocher Pan from September 1985–June 2004. Relative contributions of species reaching 0.5% or 1% threshold levels are shown.
0
2
4
6
8
10
12
14
16
18
20
Sep
-85
Apr
-86
Nov
-86
Jun-
87
Jan-
88
Aug
-88
Mar
-89
Oct
-89
May
-90
Dec
-90
Jul-
91
Feb
-92
Sep
-92
Apr
-93
Nov
-93
Jun-
94
Jan-
95
Aug
-95
Mar
-96
Oct
-96
May
-97
Dec
-97
Jul-
98
Feb
-99
Sep
-99
Apr
-00
Nov
-00
Jun-
01
Jan-
02
Aug
-02
Mar
-03
Oct
-03
May
-04
WC
V s
core
Date
Black-necked Grebe Blackwinged Stilt Cape ShovelerWhite-breasted Cormorant Caspian Tern Curlew SandpiperGreater Flamingo Lesser Flamingo Hartlaub's GullGreat Crested Grebe Kelp Gull Pied AvocetSwift Tern Yellow-billed Duck Other

358
Figure C.12 The relationship between (a) the Waterbird Conservation Value (WCV) score and the number of species reaching their 1% levels and (b) the WCV score and the total count of waterbirds at Rocher Pan . Both plots cover all surveys from September 1985-July 2004 (n = 215).
y = 0.0012x + 0.9933R² = 0.7797
0
2
4
6
8
10
12
14
16
18
20
0 2000 4000 6000 8000 10000 12000 14000
WC
V s
core
Total no. of birds
y = 2.6079x + 1.321R² = 0.823
02468
101214161820
0 1 2 3 4 5
WC
V s
core
No. of species reaching 1% levels
(b)
(a)

359
Appendix D
Waterbirds at De Hoop Vlei, a coastal lake in South Africa,
1979–2009: an assessment of its Ramsar status

360

361
Abstract
Waterbird abundance and seasonality was assessed at De Hoop Vlei, a coastal lake located
on the Agulhas Plain, South Africa from 1979–2009. A total of 83 waterbird species (65
resident species and 18 migrant species) was recorded and mean abundance was similar in
summer (5 710.2 ± 909.6) and winter (5 203.9 ± 534.3). A maximum of 16 338 birds was
counted in January 1990. Overall, mean abundance peaked from November–January with
a decline in February and a winter peak in May. Small numbers of Palearctic migrants
were recorded. Overall mean abundance of waterbirds declined by 43% over the three
decade study period (1980s–2000s). Egyptian Goose, Spur-winged Goose, Cape Teal and
Great White Pelican showed at least a 40% increase since the 1980s, while Cape Shoveler,
Southern Pochard, Red-billed Teal, Maccoa Duck, Red-knobbed Coot, Greater Flamingo and
Lesser Flamingo decreased by more than 50% between the 1980s and the 2000s. The
wetland supported 16 waterbird species which held globally important numbers of birds
and 12 threatened species, the most important being Greater Flamingo, Lesser Flamingo
and Great White Pelican. It plays an important ecological role as a dry season and moult
refuge for regional waterfowl populations. Changes to the waterbird populations at the lake
are discussed in light hydrological changes at the lake and future climate change
predictions. The sites Ramsar status is also reviewed and recommendations proposed.
Plate D.1 De Hoop Vlei looking northwards from
De Mond. Photo: M Wheeler

362
Introduction
South Africa has few natural lakes (Hart 1995, Davies and Day 1998). Most are confined to
the coastal region and are well represented in the eastern (e.g. Lake St Lucia complex,
Lake Sibayi and Kosi Bay complex) and southern (e.g. Wilderness Lakes complex) parts of
the country (Allanson 1981). In the south-western region a number of coastal wetlands
occur (e.g. Soetendalsvlei, Cape Flats vleis) but they are less extensive than the eastern and
southern systems.
De Hoop Vlei is one of a few coastal lakes in the winter rainfall region (WRR) of the
Western Cape, South Africa (Chapter 1) (Uys and Macleod 1967, Noble and Hemens 1978).
It is located on the eastern portion of the Agulhas Plain, a 153 000 ha area of low-lying,
rolling coastal plains (Corberia and Conradie 2010); the area forms the southern most
region of the African continent (Figure 1.4, Chapter 1). The other major coastal lake is
Verlorenvlei situated on the west coast of the WRR (Figure 1.4, Chapter 1). The Agulhas
Plain falls within the larger 300 000 ha Overberg Wheatbelt agricultural district where
intensive commercial cereal and crop farming takes place (Barnes 1998). As such, much of
the natural landscape in the region has been transformed into wheat pastures and crop
fields although a fair amount of natural fynbos vegetation does occur along the coast
(Barnes 1998). De Hoop Vlei was one of two registered with the Ramsar Convention as a
Wetland of International Importance at the time the convention came into force in 1972
(Cowan 1995, Ramsar 2010).
There are few waterbird population studies for coastal wetlands in the Western
Cape (e.g. Summers et al. 1976, Heÿl and Currie 1985, Underhill 1987, Kaletja-Summers et
al. 2001a, b) and limited information has been published for De Hoop Vlei. Uys and
Macleod (1967) provided the first indications of the status of some waterbirds, while Uys
(1983) and Heÿl (1988) summarized the importance of the lake for waterbirds. Although
surveys of waterbirds have been undertaken as part of regular monitoring activities since
1979, these data have not been analysed in detail. This chapter provides a full analysis of
the occurrence and abundance of waterbirds at the lake, reviews the Ramsar status of the
site and provides conservation recommendations.
Study area
De Hoop Vlei (34°31’S, 20°23’E) is situated c. 50 km north-east of Cape Agulhas, the most
southerly point of Africa. The lake falls within the 34 000 ha De Hoop Nature Reserve and
forms its western boundary. Adjacent to the western shoreline and nature reserve
boundary is the Overberg Missile Test Range. This stretches from Waenhuiskrans, near

363
Bredasdorp to the western edge of the nature reserve, an area of about 250 km2. The
property is owned by Armscor (Armaments Corporation of South Africa Ltd). The test site
facility was established in 1983 (Greig 1984) and testing of missile-guidance systems occurs
regularly (KA Shaw in litt.).
The lake comprises a long, narrow waterbody fed by the Sout and Potteberg Rivers
in the north; in the south it is separated from the sea by a 2.5 km-wide vegetated dunefield
(Figure D.1). The upper reaches of the Sout River are bordered by 30 m-high limestone
cliffs through which the river winds before entering the lake. These cliffs persist on the
eastern margin of the lake reaching nearly as far as Die Mond in the south and results in a
near-vertical shoreline which is unsuitable for most waterbirds (Plate 6.1); only a small
section south-east of Die Mond contains any shelving shoreline suitable for wading birds. In
contrast, the western margin comprises more coastal plain, with sandy shores interspersed
with loose-lying limestone rocks. Most waterbirds favour the sandy western shore;
relatively fewer birds found on the eastern bank (Uys 1983, M Wheeler pers. comm.).
When full, the lake is approximately 18 km long and 0.5 km wide with a surface
area of 750 ha (Figure D.1). Most of the water enters the lake via the Sout River, and its
tributary the Potteberg River, which drain the wheat farming area in the Bredasdorp
district. Both rivers are non-perennial and flow during the rainy season (April–September).
The lake usually fills during the peak of the winter rains, June, July and August being the
wettest three months. During inundation the lake is largely eutrophic as a result of
agriculture run-off into the system and high primary productivity in the waterbody. The
water in the lake is predominantly brackish with a pH of 9.2 (Uys and Macleod 1967) and
salinity averages c. 5 parts per thousand (p.p.t.) (Uys 1983) Water-levels recede rapidly
during the dry summer months when precipitation is low and evaporation levels high;
levels can change from 7.0 m.a.s.l in October to less than 0.5 m.a.s.l. in February. During
this period salinity increases and can change from 3 p.p.t. to 60 p.p.t. within a period of two
months (DJ Coetzee in litt.). When water-levels recede, an island forms in the southern half
of the lake, opposite the De Hoop homestead (Figure D.1) and attracts many waterbirds,
particularly roosting ducks (M Wheeler pers. comm.). The island is dominated by couch
grass Cynodon dactylon. The lake sometimes dries out completely (Uys 1983, AJ Williams
in litt.) when extreme drought conditions persist.
Historically, reed- and sedge-beds were almost completely absent from the shoreline
(Uys 1983) but stands of emergent vegetation are present on the eastern shoreline and in
areas around freshwater springs (Ramsar 2010). These stands are dominated by
Phragmites australis and Juncus kraussi. The dominant aquatic macrophyte is

364
Potamogeton pectinatus (Fennel-leaved pondweed) which occurs throughout most of the
lake but varies in density according to salinities and herbicide run-off from adjacent
agricultural activities. The edges of the lake comprise mainly riverine bush dominated by
the milkwood tree Calvaria inermis. The surrounding vegetation is made up primarily of
coastal fynbos, composed of various species of Leucodendron, Protea, ericas and
restionaceous grasses. On the edge of the western shoreline there are dense stands of exotic
rooikrans Acacia cyclops.
The lake is located near the eastern border of the WRR (Figure 1.2, Chapter 1). The
region receives on average 380 mm of rain per annum. The WRR is described in detail in
Chapter 1.
Methods
Waterbird surveys were carried out at De Hoop Vlei from April 1979 until January 2009.
Survey frequencies varied during this period: from April 1979 to May 1990 surveys were
made monthly, between May 1990 and January 1995 every four months, between January
1995 and January 2000 every six months, from January 2000 to April 2005 mainly at
monthly intervals (with some gaps) and from March 2006 to January 2009 at six monthly
intervals. The surveys carried out at six-monthly intervals represented mid-summer
(January/February) and mid-winter (July/August) surveys. When they were done quarterly,
the two additional surveys each year were carried in autumn (April) and in spring
(September).
The gaps and discontinuities in the surveys, particularly after May 1990, stem from
lack of resources and manpower to cover the site on a regular basis. The monthly surveys
made during the 1980s formed part of the Southern African Waterfowl Census (SAWC)
programme (Chapter 1). A total of 16 species were surveyed from the start of the
programme (April 1979) but this was extended to include all waterbird species from April
1984 onwards.
Surveys generally took place in the morning starting at 0700 during the summer
and 0800 during the winter and lasted 3–4 hours. They were conducted from the western
edge starting at Die Mond in the south-east to as far north as Eselkamp in the north-west,
depending on the water-level in the lake. Seven monitoring points were used (Figure D.1)
and birds counted using 16×50 and 8×30 binoculars and a 16–50× telescope. When water
levels rose and the northern half of the lake filled, sections from Eselkamp northwards
were covered on foot and birds counted en route.
Species were divided into southern African residents and Palearctic migrants and
grouped into three feeding guilds (Appendix 1.2, Chapter 1): herbivores, piscivores and

365
invertebrate feeders. Seasonality, abundance and trend analyses follows closely that of
Appendix A (see Methods). Overall waterbird abundance and diversity was assessed for the
period April 1979 –January 2009 when all waterbird species were surveyed. Generalised
linear models (GLMs) were used in trend analyses for the anatids, grebes, Red-knobbed
Coot, Great White Pelican, Greater Flamingo and Lesser Flamingo and based on the
surveys from April 1979–May 1990; trends for all other species were based on the period
June 1985–January 1990. Emphasis is placed on the 16 species counted during the SAWC
due to the duration and consistency of the surveys which reflected more meaningful
seasonal patterns and aided interpretation of long-term trends. This group also constituted
all of the species whose populations were used in designating the lake as a Ramsar site,
and provided a basis for assessing the lake’s Ramsar status over the last 30 years.
To demonstrate the global and regional conservation importance of De Hoop Vlei for
waterbirds the Waterbird Conservation Value (WCV) score was used. Methods for the
calculation of this score are described in Chapter 2 (see Methods). Regional (Western Cape)
importance of species’ populations at De Hoop Vlei were assessed using census data from
CWAC (unpubl. data, Appendix 1.3, Chapter 1).
Results
Overall waterbird abundance and species richness
A total of 215 surveys (April 1979–January 2009) was carried out which comprised 107
summer surveys and 108 winter surveys. Of the 215 surveys, the initial 62 (April 1979–
May 1984) included up to 18 waterbird species (Table D.1), while the following 153 surveys
(June 1984–January 2009) incorporated all waterbird species present at the site; the latter
comprised 77 summer surveys and 76 winter surveys.
A total of 83 waterbird species were recorded at De Hoop Vlei (Table D.1). African
residents comprised 65 species (78%) and Palearctic migrants 18 species (22%). Considering
surveys since June 1984 when all waterbirds were censused, 44 species were recorded in
less than 25% of the surveys (Table D.1). The mean and maximum number of species
recorded in summer and winter were similar (summer x = 29 and max. = 45, winter x = 27
and max. = 44).
On average, 5 710.2 ± 909.6 waterbirds were recorded during summer and
5 203.9 ± 534.3 during winter (Table D.1). The month with the largest average count of
waterbirds was January (6 679 birds) while the month with the lowest average count was
April (4 169 birds). The highest summer count was in December 1982 (19 149 birds) and the
highest winter count was 28 418 in May 1979. Of the regional guilds, resident species

366
dominated numerically in both summer and winter, accounting for 90% of all birds during
the summer and 99% during the winter (Table D.1). Waterfowl dominated the wetland
avifauna and comprised, on average, 83% and 87% of the total number of waterbirds during
summer and winter respectively (Table D.1).
Seasonal variation in abundance
Overall, waterbird numbers did not reveal a strong seasonal pattern of occurrence.
Abundance showed an increase from September–December and then stabilised from
January–August; a peak in May was evident (Figure D.2). The abundance of some
waterbird species showed marked seasonal change and these are reported below for
resident species and Palearctic migrants.
Residents
Overall, the waterbird avifauna at the lake was dominated by residents. Abundance peaked
from November–December with a decline in January and a winter peak in May (Figure
D.2). Waterfowl
Waterfowl dominated this guild during summer and winter, comprising 80% and 86% of all
waterbirds at the lake respectively. Consequently, the patterns of occurrence of species in
this guild were the primary driving factors of waterbird populations at the lake. Within this
guild, ducks and geese revealed a strong seasonal pattern; numbers increased in summer
(with a peak in February) followed by a decline in numbers from April–September. Red-
knobbed Coot was the dominant species in the guild, and accounted for 45% and 58% of all
waterbirds during summer and winter respectively (Table D.1); its pattern of occurrence
strongly mirrored that of all resident waterbirds (Figure D.3).
Of the waterfowl, five species (Egyptian Goose, Spur-winged Goose, Southern
Pochard, Yellow-billed Duck and Maccoa Duck) exhibited clear seasonal patterns; Egyptian
Goose peaked from January–March, Spur-winged Goose from March–May, Southern
Pochard from November–December, Yellow-billed Duck from February–May and Maccoa
Duck from May–July (Figure D.4).
Egyptian Goose was most abundant during late summer (February; mean 680.7
birds) with a maximum count of 3 175 in February 1988 (Table D.1). Numbers declined
rapidly from April and from August–November the lake population of Egyptian Goose
averaged less than 250 birds. Influxes to the lake started in December but by January most
of the birds had arrived (Figure D.4).

367
Most Southern Pochards occurred in early summer. On average, 149 birds were
recorded during December with a maximum count of 988 birds in November 1986 (Table
D.1). Numbers declined sharply after January with less than 120 birds/month recorded
from February to July. Maximum counts did show that up to 451 birds were present during
this period.
Maccoa Duck was the only duck that showed winter peaks; most birds were present
during May (mean 70 birds) with a maximum count of 875 in July 1979 (Table D.1).
Numbers declined from October and the species was virtually absent from the lake during
summer (mean of 5 birds/month from September to March).
No clear seasonal patterns were discernable for Cape Teal, Red-billed Teal, South
African Shelduck and Red-knobbed Coot; Cape Teal and South African Shelduck exhibited
the most erratic occurrence pattern of all the waterfowl species (Figure D.4). For five
species (Common Moorhen, White-faced Duck, Fulvous Duck, Hottentot Teal and White-
backed Duck), numbers were too small (mean <10 birds per month) to determine a
meaningful seasonal patterns of occurrence.
The three grebe species showed variable patterns of seasonality. Black-necked Grebe
showed two peaks: one in early summer (from November–December) and one in early
winter (from May–June) (Figure D.5. On average, both peaks supported similar numbers of
birds with 181 birds present during November and 177 birds during June (Table D.1).
Numbers of Black-necked Grebe were at their smallest from January to March. Little
Grebe were more abundant in winter, with peak numbers from July–August (Table 1;
Figure D.5). A maximum of 675 birds was recorded in August 1988. No seasonal pattern of
occurrence was evident for Great Crested Grebe; numbers remained relatively stable
between summer and winter although they fluctuated throughout the year (Table D.1;
Figure D.5).
Cormorants and darter
Reed Cormorant and White-breasted Cormorant showed a weak seasonal pattern, with
higher abundance, on average, during winter (May–September) (Figure D.5); maxima of
584 and 455 were recorded in March 1987 and September 1987 respectively. African Darter
occurred in numbers that average less than 10 birds but exhibited winter dominance;
numbers, on average, peaked in July; a maximum of 169 was recorded in April 1987.
368
Great White Pelican
Great White Pelican was more abundant during late summer through to early winter
(January–June, x= 35 birds/month) (Figure D.3). From July–December an average of 10
birds was recorded per month. A maximum of 435 birds was recorded in January 2001.
Resident shorebirds
Overall, resident shorebirds did not show any clear seasonal patterns of abundance and
numbers fluctuated throughout the year (Figure D.3). Their numbers were small (x = 132
birds/month) and they constituted a tiny proportion in both summer (1.6%) and winter
(1.5%) waterbird populations at the lake (Table D.1). They did dominate shorebird
populations during winter when most of the migrant shorebirds had departed (Figure D.3).
Black-winged Stilt, Pied Avocet and Blacksmith Lapwing were the most abundant
resident shorebirds throughout the year. They accounted for 61%, 17% and 13% of this
group in summer, and 56%, 15% and 16% in winter, respectively (Table D.1, Figure D.6).
None of the three species showed any strong evidence of seasonality; they occurred
throughout the year but numbers fluctuated and peaks occurred erratically (Figure D.6);
April was usually the month with smallest counts. White-fronted, Kittlitz’s and Three-
banded Plovers occurred in too small numbers (mean < 10 birds) for seasonality to be
determined (Table D.1).
Waders
Greater and Lesser Flamingos showed clear but contrasting seasonal occurrence patterns.
On average, Greater Flamingos were more abundant from August–January, with peaks in
November, while Lesser Flamingos numbers were largest from April–August with peaks in
May (Figure D.6). The maximum number of Greater Flamingos was 2 454 birds recorded in
November 1984. For Lesser Flamingos, a maximum of 1 715 individuals was counted in
October 1984 (Table D.1).
No seasonal abundance was evident for Grey Heron which, on average, showed
relatively stable numbers throughout the year. However, maximum counts showed that
more birds may be present between December and March (Figure D.6). African Spoonbill
numbers showed a late summer (March) peak (x = 75) with numbers increasing from
December (Figure D.6; a maximum of 368 birds was recorded in April 1987. African Sacred
Ibis was more abundant during summer than winter with a strong February peak (x = 95)
(Figure D.6); the maximum count was 499 birds in February 1985.
Little Egret was most abundant from February–March; numbers peaked in March
(x = 44), but this species did exhibit influxes during winter (Figure D.6); up to 217 birds

369
(Table D.1) were recorded in July 1988. Yellow-billed Egret exhibited a strong pattern of
seasonal occurrence being most abundant during autumn April/May; numbers did fluctuate
throughout the rest of the year; a maximum of 72 birds was recorded at the lake (Table
D.1). Numbers for Water Thick-knee, Great Egret, Hadeda Ibis, Glossy Ibis and Hamerkop
were too small (mean < 5 birds per month) for clear seasonal patterns to be determined.
The only abundant gull at the lake was Kelp Gull. Although this species showed no
clear seasonal patterns of abundance, Abundance was largest during the winter months
(April to September) with peaks in September (Figure D.5); a maximum of 206 birds was
recorded in September 1987. The other two gull species recorded at the lake, Hartlaub’s
Gull and Grey-headed Gull occurred in small numbers (mean < 10 birds/month) with Grey-
headed Gull being the more abundant (Table D.1). Although numbers of birds were small,
the data suggested that Hartlaub’s Gull occurred mainly during summer.
Palearctic migrants
Migratory Palearctic species showed obvious seasonal abundance, occurring mainly during
the summer months (September–April), with some birds remaining during the winter
(Figure D.2). White-winged Terns and Curlew Sandpipers dominated this guild and
comprised 46% and 36% of all Palearctic migrants respectively at the lake during the
summer (Table D.1).
Migrant shorebirds peaked from December–January and were generally more
abundant than resident shorebirds from October–January (Figure D.2, Table D.4). The
most numerous migratory shorebirds were Curlew Sandpiper, Little Stint and Common
Greenshank (Table D.1). Curlew Sandpiper numbers peaked from December–January;
Little Stint numbers showed no obvious peaks and remained stable throughout the summer
although their numbers fluctuated monthly (Figure D.8). Common Greenshanks occurred
in greatest numbers from November–December and decreased rapidly after January
(Figure D.8).
Numbers of White-winged Terns peaked in October with numbers gradually
decreasing until April (Figure D.8). On average, 143 birds were counted during the summer
surveys, with a maximum of 891 being counted in October 1985. Birds usually arrived in
small numbers in September; most birds had departed by April.
Eight other Palearctic shorebirds were recorded. Their numbers were too small
(summer mean <1) to warrant any further discussion.
370
Feeding guilds
Of the three feeding guilds, herbivores dominated during winter and summer, and mirrored
the overall annual waterbird patterns at the lake (Figure D.9). Invertebrate feeders were
the next numerous guild and dominated from October–February with fewer during winter.
The piscivores were the least numerous guild and although numbers did fluctuate during
the year, they were more abundant during winter and early summer (May–September)
(Figure D.9).
Inter-annual variation in abundance
Overall, there was a decreasing number of waterbirds across the monitoring period at the
lake (Figure D.10a). Resident species showed a significant downward summer trend
(r = –0.48, p < 0.05) while winter populations showed greater fluctuations (Figure D.10).
Mean summer populations declined from 8 739 in the 1980s to 4 391 in the 2000s, a
decrease of 49%; winter populations declined by 48% (Figure D.10). The Palearctic migrants
also showed a significant declining trend in their summer populations (r = –0.57, p < 0.01).
Resident species
Waterfowl
Of the waterfowl, only Egyptian Goose showed any evidence of an increase in the number of
birds at the lake. Significant positive trends were noted during summer (r = 0.54, p < 0.01).
Numbers fluctuated during summer and peaks to occur every 5–6 years, however there was
a two year gap between peaks in 1993–1995 (Figure D.11). Populations of Southern
Pochard, Cape Shoveler, Red-knobbed Coot, Yellow-billed Duck and South African
Shelduck decreased at the lake. Numbers of Southern Pochard declined from an average of
249 birds in the summer months of the 1980s to 13 during the 2000s, a decrease of almost
95% (Figure D.11); this trend was significant (r = –0.74, p < 0.001). Since 2002, less than
five birds have been seen at the lake during any one year. Like Egyptian Goose, numbers of
pochard fluctuated between years and peaks tended to occur every four years. Cape
Shoveler numbers fluctuated from 1979–1998; thereafter they showed a steady decline
(Figure D.11). The species revealed both significant summer (r = –0.53, p < 0.01) and winter
(r = –0.42, p < 0.05) downward trends. Numbers of Red-knobbed Coot prior to 1983
averaged c. 10 000 birds but showed a sharp decline after 1983 (Figure D.11). From 1983 to
1995 numbers fluctuated below 8 000 before another decline in 1996. After this, populations
were never more than 2 000 birds. Their summer and winter populations showed

371
significant downward trends (r = –0.75, p < 0.001 and r =–0.66, p < 0.001, respectively).
Yellow-billed Duck showed more irregular inter-annual fluctuations both during summer
and winter (Figure D.11); their summer population showed a significant declining trend in
abundance (r = –0.51, p < 0.01). South African Shelduck numbers during summer declined
significantly (r = –0.59, p < 0.01); winter numbers were generally small and showed two
sporadic peaks, one in 1998 and the other in 2002 (Figure D.11). Other waterfowl species
showed variable inter-annual fluctuations and trends in their populations could not be
assessed.
There were significant downward trends for the Greater Flamingo during summer
(r = –0.52, p < 0.01) and winter (r = –0.42, p < 0.05). Lesser Flamingos showed similar
trends which were more significant during winter (r = –0.51, p < 0.01) than during summer
(r = –0.45, p < 0.05). Greater Flamingos showed slightly more seasonal variability between
years than Lesser Flamingo; both species were almost absent from the lake after 1985
(Figure D.11).
Black-necked and Little Grebes showed significant declining trends at the lake
(Figure D.12). Black-necked Grebe showed declines in summer (r = –0.41, p < 0.05) and in
winter (r = –0.47, p < 0.05) while Little Grebe displayed a decreasing trend in summer
(r = –0.44, p < 0.05). Little Grebe showed greater inter-annual fluctuations than Black-
necked Grebe. Great Crested Grebe revealed a strong fluctuating annual pattern of
occurrence with summer and winter peaks at regular intervals; however from 1997–2004
numbers decreased to below 50 birds with a resurgence from 2005 (Figure D.12). No trend
was evident for this species.
Numbers of Great White Pelican peaked at irregular intervals from 1979–1998 with
numbers averaging below 60 birds. In 2000 and 2001 a large influx occurred and summer
means of 72 and 167 birds were recorded after which numbers fluctuated annually. The
trend, although not statistically significant, suggested that more Great White Pelicans were
using the lake in 2000–2009 than in the earlier period.
The only additional species that showed evidence of declining trends were Kelp Gull
and Grey Heron. Both Kelp Gull (r = –0.41, p < 0.05).and Grey Heron (r = –0.45, p < 0.05)
showed decreasing trends in summer.
Palearctic migrants
Overall, Palearctic migrant species declined at De Hoop Vlei between 1979 and 2009
(r = –0.57, p < 0.01). Large fluctuations occurred annually. The summer of 1992 produced
the largest mean count (2 596 birds) (Figure D.10). However, from 1993–2003 less than

372
100 shorebirds, on average, were recorded with a small peak in 2004/05. Generally, fewer
Palearctic migrants, most of which comprised shorebirds, made use of the lake after 1993.
Curlew Sandpiper (r = –0.57, p < 0.01), Common Greenshank (r = –0.44, p < 0.05) and Little
Stint (r = –0.40, p < 0.05), which dominated the migrant shorebird population, all showed
significant declines. Curlew Sandpiper and Little Stint showed similar annual patterns
from 1987–1993 (Figure D.13). White-winged Tern showed a strong declining trend
(r = –0.66, p <0.001) and few occurred after 1992 (Figure D.13)
Feeding guilds
Of the three feeding guilds, the invertebrate feeders revealed a strong and significant
declining summer trend (r = –0.90, p < 0.001; Figure D.14). Their numbers peaked from
1984–1991 (average of 2 499 birds), but then decreased to 931 birds during the 2000s, a
decline of 63%. Winter populations showed a similar pattern (Figure D.14). The decline in
numbers of Greater Flamingo and shorebirds over the study period contributed to the
reduction in numbers of invertebrate feeders at the lake.
Herbivores showed large inter-annual fluctuations. The overall trend was downward
although it was not as large as that of the invertebrate feeders. The average between
1998–2008 was 3 126 birds compared with 4 508 for 13-year period 1984–1997. The decline
in the Red-knobbed Coot population contributed to this guild’s steady decrease at the lake.
The piscivorous guild showed two peaks (1987–88 and 2006–08), almost 20 years
apart, and were interspersed with smaller fluctuations. The peaks were attributed to large
influxes of Great Crested Grebe, Reed Cormorant and White-breasted Cormorant during
these times.
Trends per decade
Waterbird populations declined by almost 50% in both summer and winter over the 30-year
period 1980–2000s (Table D.3). In spite of this overall reduction in waterbird abundance,
four species, Egyptian Goose, Spur-winged Goose, Cape Teal and Great White Pelican
showed increases between decades; overall they have shown at least a 40% increase in at
least one of the seasons of the year since the 1980s (Table D.3).
Cape Shoveler, Southern Pochard, Red-billed Teal, Maccoa Duck, Red-knobbed Coot,
Greater Flamingo and Lesser Flamingo decreased by more than 50% between the 1980s
and the 2000s.These species also displayed decreases in each decade (Table D.3).

373
Waterbird Conservation Value (WCV) scores
Figure D.15 shows the WCVSs for each count from July 1984–January 2009. Scores
fluctuated between and within years although certain peak years were evident
(e.g. 1986–87 and 1989–90 and 2007) (Figure 7a). Of the 153 surveys, 148 (96%) scored
greater than 1, while 84 surveys (54%) scored greater than 5. Six counts (4%) scored greater
than 15 (Figure 7a), with five of these between July 1987 and Dec 1987, and the sixth count
in August 2007. Sixteen species occurred at levels equal or greater to the global 1%
threshold level (Table D.2).
Patterns of change are evident in term of species composition during the 25 year
period. During 1984, Cape Shoveler, Yellow-billed Duck, Maccoa Duck, Red-knobbed Coot
and Greater Flamingo were the most abundant and occurred regularly in numbers greater
than the 1% threshold. From 1985–1992, the most abundant species included Cape
Shoveler, Great Crested Grebe and Black-necked Grebe and to a lesser degree Caspian
Tern. The 15-year period 1994–2009 revealed further changes with Caspian Tern, Great
White Pelican and White-breasted Cormorant showing increased numbers at the lake.
During this period there was a noticeable decline in the numbers of Cape Shoveler, Red-
knobbed Coot and Yellow-billed Duck (Figure 7a).
Figures D.16a and D.16b show the relationship between the monthly 1% indices and
the number of species reaching or surpassing the 1% threshold levels and total waterbird
abundance respectively. This showed that although large indices ( 10) were usually
associated with greater number of species reaching 1% threshold levels or larger numbers
of waterbirds, this was not always the case; they can result from the occurrence of a small
number (< 3) of species or lower overall count totals (< 5 000 birds/month); combined this
occurred on three occasions: October 1986, February 2005, and July 2008. The February
2005 survey combined a low monthly count (2 080 birds) with a single species, Caspian
Tern, contributing 8.47 to the overall scoring of 10.26 for that month. Although some
surveys did not contain a single species reaching the 1% levels, the cumulative 1% index
was always larger than 1.
Threatened species
De Hoop Vlei supported 12 species in threat categories (Barnes 2000): two Vulnerable
species – African Marsh Harrier and Striped Flufftail, and 10 Near-threatened species –
Black Harrier, Greater Flamingo, Lesser Flamingo, Cape Cormorant, Crowned Cormorant,
Great White Pelican, Black Stork, Yellow-billed Stork, Greater Painted Snipe (Barnes
2000). The flamingos and pelican were the only species to use the wetland on a regular

374
basis and in noteworthy numbers (Table D.1); the flamingos have become irregular visitors
since 1986 (Figure D.11). The remainder of the species are probably rare, but annual,
visitors to the lake (Table D.1).
Discussion
Seasonality, abundance and trends
The results demonstrated that De Hoop Vlei is an important wetland for resident
waterbirds and less important for Palearctic migrant (Figure D.3). Resident waterbirds
were numerically more abundant and on average outnumbered migrants 20:1 during the
summer (September–March) when migrants were present. Heÿl (1988) suggested that
overall waterbird numbers peaked at two-to five-year intervals. Results from this study for
the period 1984–1995 suggested that these peaks do exist but from 1996–2009 were less
evident (Figure D.10).
Waterfowl dominated the entire waterbird community at the lake (Figure D.3). Red-
knobbed Coot was the most abundant species (Figure D.5); its dominance at the lake
strongly reflected and influenced the overall occurrence pattern for all resident species and
particularly the waterfowl group (Figure D.3). Uys and Macleod (1967) found the species to
be present year-round with August–October peaks; data here reflected a November–
December and a May peak (Figure D.5). Because the coot relied primarily on pond weed
Potamogeton for both food and breeding material their occurrence is strongly linked to the
abundance and availability of this macrophyte (Stewart and Bally 1985). Large numbers
breed at the lake (Uys and Macleod 1967, CapeNature unpubl. data).
The strong seasonal pattern exhibited by the ducks and geese (Anatidae) (Figure
D.4) confirmed Uys and Macleod’s (1967) and Heÿl’s (1988) summer peaks for this group.
Egyptian Goose, Yellow-billed Duck and Cape Shoveler were the next most abundant
species in this group and their monthly pattern of occurrence reported in this study was
similar to those of Uys and Macleod (1967). Spur-winged Goose were largely absent at De
Hoop Vlei in the 1950s; flocks up to 50 birds were reported in the early 1960s (Uys and
Macleod 1967). During this study, the species occurred annually with flocks of up to 500 in
late summer and early winter (Table D.1). Patterns of occurrence for Cape Teal, Red-billed
Teal and South African Shelduck remained largely unchanged, although this study showed
an April peak for shelduck compared with the January–February peak reported by Uys and
Macleod (1967). Maccoa Duck had a stronger preference for the winter season at the lake
compared with the regular year-round occurrence reported by Uys and Macleod (1967).

375
Generally, occurrence patterns of ducks and geese at the lake remained largely unchanged
since the 1960s (Uys and Macleod 1967).
Although seasonal patterns of occurrence remained the same for most waterfowl,
populations of many species declined over the study period. Red-knobbed Coot, Yellow-
billed Duck, Cape Shoveler, South African Shelduck, Maccoa Duck and Southern Pochard
all showed declines at the lake. These species were once common and abundant at the lake;
the Cape Shoveler and Yellow-billed Duck were the two species motivated the Ramsar
application in 1975 (Ramsar 2010).
While most waterfowl species decreased, notable increases in Egyptian Goose
populations were evident. Populations of this species have increased throughout the
Overberg (Magnall 1999, Magnall and Crowe 2001, CWAC unpubl. data, SABAP2 unpubl.
data). At a site such as De Hoop Vlei long-term monitoring programmes enable the
detection in changes of waterbirds, and notably congregatory species. Similar patterns have
been noted at two other moult refuges for Egyptian Goose: Theewaterskloof Dam
(Swanepoel et al. 2006) and at Dassen Island (Underhill et al. 2000). Their occurrence at
the lake was presumably linked to the availability of food in the surrounding agricultural
area. De Hoop Vlei falls within the Overberg wheat belt and harvesting at the end of the
year (November–December) results in many grain-spilled stubble fields (Uys1983) and
many waterfowl (notably Egyptian Goose) utilize the food resource and use the lake as a
safe roosting refuge (Magnall and Crowe 2001). Similarly, farming activities have probably
led to an increase in Spur-winged Goose numbers in the Overberg and not as a direct result
of changing conditions at the lake itself.
Palearctic migrants at De Hoop Vlei did not contribute significantly to the overall
waterbird population. Their fluctuating summer patterns suggested that they use the site
as a temporary, staging site. Migrant shorebirds generally return to the same sites year
after year (e.g. Elliott et. al. 1976). Thus, the years in which large numbers of Palearctic
migrants occurred at De Hoop Vlei might follow a good breeding season in the northern
hemisphere. Reproductive success of several Palearctic shorebirds is linked to lemming
cycles in the tundra and display approximately three-year cycles (Underhill et al. 1987).
Several studies of the abundance of Palearctic shorebirds in the Western Cape have
noted declines, both at localities which held small numbers of shorebirds and at sites such
as Langebaan Lagoon, which hold large numbers (Underhill et al. 2001, Venter et al. 2002,
Harebottle and Underhill 2006, Harebottle et al. 2006). If overall shorebird numbers
decrease as a result of global climate change (for example the warming of the breeding
areas in the tundra), then the overall smaller population will be accommodated at wetlands

376
farther north, with decreases being most severe at the southernmost wetlands (Underhill
2003). De Hoop Vlei is the southernmost large wetland in Africa, at the end of the wader
flyways from Eurasia. It is therefore more likely that the decreases in the numbers of
Palearctic migrants at the lake are driven by factors occurring on the breeding grounds and
migration routes rather than factors linked to habitat change at De Hoop Vlei.
Feeding guilds
Overall, herbivores and piscivores showed no well-defined seasonality with numbers
fluctuating throughout the year. Invertebrate feeders were more abundant in summer than
during the winter (Figure D.9), but this was mainly due to the influx of Palearctic migrants
from October–March. The increase in herbivore populations from September–February is
due to the increase in ducks and geese to the lake. The dominant herbivores were Egyptian
Goose and Red-knobbed Coot during this period. Because Egyptian Goose generally feed at
neighbouring crop fields during this time (Uys 1983), their input into the system was
through defecation; these nutrients impact the water column and shoreline vegetation. Red-
knobbed Coot feed at the lake and make direct impacts to the lake’s nutrients through
consumption of the aquatic plants and defecation in the water column.
The fairly large proportion of invertebrate feeders during winter was due to the
seasonal abundance of Little Grebe and Cape Shoveler, rather than a reflection of high
numbers of resident shorebirds or waders. During late winter and early parts of summer
(August–November), when water-levels were high (3–4 m) shoreline availability decreased
forcing shorebirds to find alternative shallow wetlands elsewhere, and leave the lake. This
leaves open-water species to then feed on the invertebrates in the water that start to
flourish as the macrophytic biomass increases due to increased freshwater and nutrient
input (see Davies and Day 1998).
All three guilds showed regular inter-annual fluctuations during summer and
winter; invertebrate feeders were the only guild to exhibit long-term declines (Figure D.14).
The summer declines were associated with the decrease in Palearctic shorebird numbers
(Figure D.13), together with the observed declines in abundance of Cape Shoveler, Black-
necked Grebe, Little Grebe and Greater Flamingo (Figures D.11 and D.12). Winter declines
were less striking because there was greater inter-annual variation. Both open water and
shoreline species were impacted indicating changes in the food source rather than a
habitat-induced change; there was little or no change to the major habitats at De Hoop Vlei
(K.A. Shaw pers. comm.). Zooplankton formed the bulk of the diet for species in this guild;
studies by Coetzee (1986) showed that the lake had a rich plankton community which
consisted mainly of copepods and ostracods. He stated that this was the primary reason for

377
the lake’s rich waterbird community, but that the availability of these micro-organisms is
dependent on salinity and water-level fluctuations.
Piscivores showed two striking winter peaks: one in the mid-1980s and then a larger
influx in the mid-2000s (Figure D.14). During both these peaks the numbers of White-
breasted Cormorant, Reed Cormorant and Great Crested Grebe increased. Scott and
Hamman’s (1988) study of fish found that Cape Kurper Sandelia capensis and Mozambique
Tilapia Oreochromis mossambicus are the most common fish species, the former occurring
naturally and the latter introduced in 1958. Other freshwater species were introduced (e.g.
Smallmouth Bass Micropterus dolomieu and Largemouth Bass M. punctulatus) but did not
survive (Scott and Hamman 1988). The tilapia adapt well to high salinities (Scott and
Hamman 1988) and are therefore available throughout the year, especially during summer
when salinities increase during dry-down conditions. The Cape Kurper is less tolerant to
high water salinity but survives in pools from freshwater fountains in northern sections of
the lake (Scott and Hamman 1988) and as the lake fills after the first winter rains the fish
spawn and recruit to the lake system during winter and early summer. The winter peaks
exhibited by the cormorants and Great Crested Grebe could well reflect years in which fish
recruitment was high and when fish numbers declined in summer so did the number of
fish-eating species at the lake.
Herbivore numbers showed the greatest amount of inter-annual variation although
there is a tendency for a downward trend. This trend was linked to the decline in Red-
knobbed Coots, Yellow-billed Duck and Southern Pochard (Figure D.11), the most abundant
of the herbivores that fed at the lake. The increase in Egyptian Goose contributed to the
increased variability of numbers in this guild; however they do not forage much at the lake
(see above), so their influence on the herbivorous waterbird populations should be
interpreted with care.
Environmental impacts on waterbirds at De Hoop Vlei
Overall, there are considerable fluctuations in the yearly abundance of certain waterbird
species and feeding guilds. The changing hydrological conditions at the lake from one year
to the next play a major role in determining waterbird occurrence and abundance at the
lake. Depending on inundation patterns, and extreme events such as floods and droughts,
water-levels and salinities can fluctuate widely annually (Coetzee 1983, Scott and Hamman
1988, A Scott in litt.). During the hot and windy summer months evaporation results in
salinities reaching up 58 p.p.t.; during winter, inflow from the winter rainfall raises water-
levels and salinities are reduced to 4 p.p.t. (Heÿl 1988, Coetzee 1986). These proximal
factors impact on the physio-chemical properties of the water in the lake which then impact

378
on aquatic plant growth and production of zooplankton and other micro-organisms. The net
cumulative effect will then determine how waterbirds use the lake. Results from census
work, such as undertaken here, are then able to produce a broad indication of the state of a
wetland based on the status of the waterbird community over a period of time. A lack of
suitable long-term quantitative data for these ecological variables prevented comparative
analyses to be carried out for this paper; such analyses would assist in interpreting
waterbird abundance and occurrence and make more informed recommendations. This is
something that should be considered for future monitoring and reporting mechanisms.
Is there any evidence that rainfall has any influence on the occurrence of waterbirds
at the lake? Uys and Macleod (1967) found that local flood events impact on movements of
waterbirds in and out of De Hoop Vlei. In September 1957, during a flood event caused by
unusually heavy winter rains, the lake overflowed and large areas to the west of the lake
were extensively inundated and remained flooded for up to two years. The water took three
years to recede and many large pools and pans were formed in this period. During the
inundation period large numbers of waterbirds including Great Crested Grebe, Little Grebe
Egyptian Goose, Cape Shoveler, Yellow-billed Duck, South African Shelduck, Red-knobbed
Coot, Pied Avocet and Black-winged Stilt moved to the flooded area where they also bred.
African Spoonbill, White-breasted Cormorant, Reed Cormorant and African Darter also
moved from the lake and soon established heronries in the flooded vegetation. Some species
such as Maccoa Duck and Grey Heron however remained on the lake during this period.
Resident shorebirds such as Kittlitz’s Plover, White-fronted Plover and Chestnut-banded
Plover occurred in fairly large numbers in the inundated area during the drying phase but
were largely absent when the flooding took place due to the lack of any shoreline. Few
Blacksmith Lapwings were recorded on the Agulhas Plain and in the De Hoop Vlei in the
1960s (Uys and Macleod 1967); their numbers have since increased across the Western
Cape (Underhill 2004).
Thus, birds will take advantage of temporarily flooded adjacent landscapes should
they become available even though water-levels at De Hoop Vlei are high and able to
support large numbers of waterbirds. These extreme flooding events are rare (Heÿl 1988)
but during the late 1980s and early 1990s when high rainfall resulted in partial flooding of
adjacent areas, waterbirds have been recorded feeding and breeding in these temporary
inundated areas (A. Scott in litt.). The availability of suitable temporary habitat induced by
flooding does therefore suggest that extreme rainfall events act as a catalyst for movements
of waterbirds and impacts on the waterbird community at the lake, even though this is
temporary. Waterbirds use these flooded areas due to the sudden availability and increased

379
abundance of food, particularly invertebrates that arise due to the flooding. During flooding
events, deeper water in the lake would limit benthic foragers and they would make use of
shallower flooded areas elsewhere in the landscape to feed. Shoreline availability would
also be reduced at the lake during this time and many of the shorebirds and waders would
then move to adjacent areas of shallower water. In addition, it is possible that the
availability of food is lower in the lake during these periods; dilution of the water column
can result in lower productivity of macro-invertebrates (Davies and Day 1998). This
decrease in food in the lake could further encourage birds to move to adjacent wetlands
under these conditions. The lake does not offer many breeding opportunities (M Wheeler
pers. comm.) and the creation of wet grassland and islands allows ducks and colonial
breeders such as ibises, spoonbills and cormorants to breed locally (Uys and MacLeod
(1967).
Inundation patterns at the lake change on an annual basis depending on the amount
of rainfall and inflow into the system. In years of higher than average winter rainfall,
higher water-levels persist during summer and, although water-levels recede, more
waterbirds remain during this period (A. Scott in litt.). In contrast, in years with below
average winter rainfall, and in drier summers, water-levels at the lake recede quicker. The
lake dries up almost completely annually (AJ Williams in litt.). As the lake dries and water-
levels recede to form small pools of water, open-water species need to find an alternative
refuges (see below). Under these extreme drying conditions, brought on by lower annual
rainfall, the lake becomes more suitable for some shorebirds and waders, but most
waterbirds would need to move and seek alternative wetlands.
Thus the composition and abundance and of waterbirds at De Hoop Vlei is
determined by the state or condition of the lake on an annual basis. Waterbirds will use the
lake for the same purpose year after year, but as reported here, their numbers vary
depending on the conditions present. The amount of rainfall, coupled with the frequency
and amount of inundation at the lake, are important proximal factors in this regard.
Given that climate change forecasts predict drier winters with fewer and less
intense rainfall events for the southwestern Cape Province (Midgley et al. 2005) impacts on
waterbirds and the general ecology of De Hoop Vlei are likely to occur. Less frequent
inundation would result in zooplankton, plant and fish communities declining and this
would directly impact on the way in which waterbird populations use the lake. Waterbirds
could undertake more frequent movements (particularly for open-water species) to other
wetlands in the region as conditions at the lake deteriorate more rapidly than usual The
cumulative effect of the predicted changes to regional climate would not only affect De Hoop

380
Vlei but other coastal wetlands in the region. With the drastic declines observed in some
species and feeding guilds at the lake (see Results section) could we already see the start of
such climate-induced changes or are these changes just a response to natural variability in
wetlands? It seems likely, based on these waterbird declines, that the lake may be at a
stage where, due to increasing variability in its ecology (e.g. more frequent dry-downs
occurring due to precipitation being more erratic), it is unable to sustain the large
waterfowl populations it once did and why the observed declines have occurred. Further
ongoing monitoring of the lakes’s fish fauna and macrophytic biomass, plus water quality
measurements is encouraged to assess the long-term impacts of climate change on the
systems ecology. The impact of phosphates and sulphates (fertilizers etc.) entering the
system from agricultural run-off should not be ignored and should also be considered as
part of a long-term monitoring programme at the site. Some eutrophication is usually
beneficial to wetland systems stimulating growth of plankton and aquatic plants but
excessive and regular nutrient enrichment could lead to deterioration in water quality and
reduction in primary productivity in the lake and this impacts at higher trophic levels in
the system (Davies and Day 1998).
Role of De Hoop Vlei in a regional context
De Hoop Vlei is one of the largest, natural permanent wetlands in the southeastern section
of the winter rainfall region. When full, the lake is relatively deep (c. 8 m), but water-levels
vary depending on flood conditions (Coetzee 1986). Because deeper water deters most
waterbirds from feeding optimally (Ntiamoa-Baidu 1998, Colwell and Taft 2000), it is the
amount and extent of open, mostly shallow water which attracts large numbers of
waterfowl to the lake, particularly during the dry season (November–February) (Figures
D.4 and D.5) when surrounding ephemeral wetlands dry out.
But how does De Hoop Vlei compare with other regional wetlands in terms of
waterfowl abundance? The only other large wetland systems located close to the lake are
Soetendalsvlei (34°43’S, 19°58’E) and the Brëëde River Estuary (34°24’S, 20°49’E).
Soetendalsvlei is a large (c. 2 500ha) freshwater lake which lies 50km to the southwest of
De Hoop Vlei, and about 10 km north of Cape Agulhas, the southernmost point in Africa.
The lake is shallow (c. 2–3 m, LG Underhill pers. comm.) and consists largely of open water
and dense reed and sedge islands and beds along the margins. The site is known for large
waterfowl populations (M.Tripp pers. comm.) but few surveys have been carried out (CWAC
unpubl. data). These surveys, which cover a subset of the lake, have recorded the following
waterfowl with maxima exceeding 50 individuals during mid-summer (January/February):
Egyptian Goose (maximum 503), Spur-winged Goose (251) and Yellow-billed Duck (180)

381
(CWAC unpubl. data). In contrast, the Breede River estuary, located 40 km to the east of
De Hoop Vlei, is an open estuary which has typical estuarine habitats comprising mud and
sand flats near the mouth, and deeper, less saline water with vegetated banks further
upstream. The main section surveyed for waterbirds is approx. 850ha and the mean depth
is about 3.0m (Carter 1983). Three waterfowl species have been recorded and with maxima
of more than 50 individuals; Egyptian Goose (379), South African Shelduck (291) and
Yellow-billed Duck (135) (CWAC unpubl. data). Numbers of waterfowl are expected to be
lower in the estuary due to regular saline conditions as a result of tidal influences but,
nevertheless, the estuary compares favourably with De Hoop Vlei and Soetendalsvlei. Thus,
although nearby wetlands of comparable size, or larger in the case of Soetendalsvlei,
support waterfowl populations they do not support nearly the same numbers as recorded at
De Hoop Vlei. As such, the lake is the primary waterfowl locality in this area of the winter
rainfall region and emphasizes the valuable role it plays in this regional context.
The lake is also used as a moulting site by Cape Shoveler and Egyptian Goose – up
to 1216 and 1332 birds have been recorded at the lake respectively (Ramsar 2010). With no
moult information available from Soetendalsvlei or Breede River Estuary, the moult data
from De Hoop Vlei suggests that it is probably the primary moulting site for some
waterfowl species in the region. De Hoop does support some breeding species (notably Red-
knobbed Coot and Great Crested Grebe) but it generally is not considered an important
breeding locality within the region (Uys 1983).
The lake acts as a refuge for non-breeding waterbirds from the summer rainfall
region and, possibly the year-round rainfall region. Uys (1983) proposed that when drought
conditions persist in the interior of South Africa, waterfowl in particular, would move to
coastal wetlands. There are ringing recoveries for Egyptian Goose, Cape Shoveler, South
African Shelduck and Red-billed Teal from the Agulhas Plain region of birds ringed at
Barberspan Bird Sanctuary in the North-West Province (Underhill et al. 1999), a direct
distance of nearly 1000 km. In addition, there are three long-distance (> 1 000 km)
recoveries of Cape Shoveler from wetlands in the north-east of South Africa of birds ringed
near Bredasdorp providing further evidence of a north-south movement (Underhill et al.
1999). Yellow-billed Ducks ringed in the Wilderness Lakes area, near Knysna on the south
coast, show westward movement and some birds have been recovered in the Agulhas Plain
region, a distance of over 300km. However, like the Barberspan recoveries, how regular
these movements are and what proportion of the population undertake these movements
still needs to be assessed and more intensive ringing studies will be needed to assess
whether inter-rainfall region movement occurs regularly.

382
It is also possible that De Hoop Vlei could absorb Red-knobbed Coot populations
from the Bot and Klein River estuaries when they are breached (see Chapter 4, CWAC
unpubl. data). Between January and August 2004 the numbers of Red-knobbed Coot at De
Hoop Vlei increased from 822 to 3 285, a four-fold increase (Figure D.11). This influx
followed the breaching events at both the Bot and Klein River estuaries in August 2003
when approximately 15 000 coots were present on both estuaries prior to them being
breached. When breached, coots leave the estuaries en masse as the wetlands become
unfavorable due to high salinities under open-mouth conditions. Underhill et al. (1999)
showed eastward movement of Red-knobbed Coot from Cape Town wetlands, with one
recovery close to De Hoop Vlei. Although no ringing recoveries exist directly between Bot
River and Klein River estuaries and De Hoop Vlei the it seems possible, based on the above,
that some birds may disperse to De Hoop Vlei. The lake is about 150 km from both
estuaries, a distance which can be covered by these birds which are strong nocturnal flyers
(del Hoyo et al. 1996). There are three recoveries of coots ringed in Cape Town and found on
the Agulhas Plain and Wilderness lakes (Underhill et al. 1999) which provides some
evidence that coots do undertake eastward movements in the Western Cape province.
Review of the Ramsar criteria
De Hoop Vlei, together with Barberspan in the North West Province, was one of two
wetlands designated as South Africa’s first Ramsar sites in 1975, i.e. wetlands of
international importance (Cowan 1995). Criteria for designation were based on the site
(a) containing representative, rare or unique wetland types, (b) regularly supporting 20 000
or more waterbirds and (c) regularly supporting 1% of the individuals in a population of one
species or subspecies of waterbird (Ramsar 2010). The main focus of the initial Ramsar
application for De Hoop Vlei related to the lake’s abundance of waterbirds, notably
waterfowl for which the Cape Shoveler and Yellow-billed Duck fulfilled the 1% population
threshold criteria. The last update to the Ramsar information sheet was undertaken in
1998 (Ramsar 2010) when the populations thresholds were reviewed and based on maxima
the Cape Shoveler population was estimated to represent 7% of the global population and
the Yellow-billed Duck 15%. The Red-knobbed Coot was also reported to occur regularly in
numbers above 10 000. The current study provides additional data (from 1990–2009) and
an opportunity to review the lake’s Ramsar status.
Overall, total waterbird numbers showed a general decline between 1984 and 2009.
On only one occasion (January 1990) did the total count exceeded 20 000 birds. Although
numbers fluctuated due to changing conditions at the lake, fewer than 15 000 waterbirds
383
were counted after 1993 (Figure D.10a) and mean abundance of waterbirds over the three
decades (1980s–2000s) decreased by 43% (Table D.3).
Populations of Cape Shoveler and Yellow-billed Duck showed large decreases
between 1980s and 2000s (Table D.3), and did not occur as abundantly in the1980s
compared with the 2000s (Figure D.9). Cape Shoveler and Yellow-billed Duck occurred at
1% levels in the 2000s even though populations had declined since the 1980s. Numbers of
Red-knobbed Coot last exceeded 10 000 birds in 1983 and showed 93% population declines
over the three-decade study period (Figure D.11)
In addition, the conservation value score (Figure D.15) showed that there was been a
shift in the species composition from the 1980s to the 2000s; a system dominated by ducks
and coot in the 1980s was dominated by piscivores (cormorants, terns and grebes) in the
2000s. Does this suggest that De Hoop is no longer playing an important role for waterfowl
species and could this potentially impact on its Ramsar status? During the study period,
the lake may well have been undergoing ecological changes. However, at the end of the
study period, the lake still appeared able to support large numbers of waterfowl and other
waterbirds (Table D.2) and its Ramsar status did not seem threatened. However, should
conditions at the lake deteriorate and fewer species reach the 1% threshold then its Ramsar
status could be downgraded to the Montreux Record. Ramsar sites on the Montreux Record
require affirmative action by the relevant management and conservation authority (in this
case CapeNature) to improve conditions so as to restore the ecological character of the site
in order to upgrade it back to full Ramsar status (Ramsar 2010).
The site was also designated an Important Bird Area (Site SA119, Barnes 1998,
Fishpool and Evans 2001). Based on the data presented here (Table D.2) its IBA status was
secure.
Waterbird conservation issues and future research recommendations
This study highlighted the importance of De Hoop Vlei as an important waterbird locality
in the winter rainfall region, albeit numbers of certain species were declining. From a
conservation perspective the lake benefited from its incorporation into the De Hoop Nature
Reserve, proclaimed in 1957. It afforded waterbirds protection from threats such as
recreational activities (boating and fishing), disturbance from cattle and feral dogs and
cats, and hunting, commonly present at unprotected wetland sites (e.g. Anderson et al.
2003). The adjacent missile testing facility did pose a threat in terms of noise disturbance,
but testing was carried out occasionally (AJ Williams in litt.). Since the missile testing
range was constructed in 1984 waterbird numbers have fluctuated but generally have not
led to a total abandonment of the site suggesting that it has not been a major threat to the

384
lake’s waterbird community. In fact, the site has indirectly afforded the lake some
protection as there are fewer visitor disturbances on the western shoreline.
A conservation management plan was in place for the De Hoop Nature Reserve,
including the lake, and is scheduled to be updated every five years (K.A. Shaw in litt.).
Consequently, the conservation status of waterbirds remained favourable at the site based
on the land tenure and proposed conservation plans and actions of the conservation
authority. Possibly the greatest threat to waterbirds at the lake is the changing
hydrological conditions, which are linked directly to activities in the catchment region.
Water abstraction for crop irrigation and spread of alien invasive plants such as Rooikrans
Acacia cyclops and Port Jackson Acacia saligna reduce run-off into the lake. Coupled with
impacts of climate change, long-term changes to the lake’s ecology could impact on the
occurrence and abundance of waterbirds in the future; this needs to be closely monitored
through the continuation of regular waterbird surveys
At the end of the study period, the monitoring of waterbirds was taking place by
means of quarterly surveys in January, April, July and October, and were being conducted
by staff of CapeNature. This survey frequency took account of the limited resources
available to survey the waterbirds on a more regular basis, given the size of De Hoop Vlei
and the difficulty of gaining access to some of the survey points. The monthly census data
in this study (1979–1990) highlighted the seasonal and inter-annual value of data collected
at this frequency to understanding the patterns of waterbird abundance. Count intervals
longer than three months cannot be interpreted as well as monthly data, particularly in
terms of determining seasonality and peak abundance. Consequently, for a site as
important as De Hoop Vlei, I made the recommendation to CapeNature that the
reinstatement of monthly surveys should be considered. This goal could be achieved by
intensive staff training of staff. The benefits of having monthly surveys would enable the
impact of perturbations, for example climate changes, to be assessed. The existence of the
excellent baseline survey data, which was analysed for this paper, would increase the value
of ongoing monthly surveys. The particular significance of De Hoop Vlei is that it is the
southernmost large wetland in Africa, situated close to Cape Agulhas
The long-term waterbird survey datasets existed for the site, one shortcoming of this
analysis was the lack of a continuous record of physical and ecological data (e.g. water-
levels, salinities, turbidity, and biomass of lake flora and fauna). This made it difficult to
make meaningful interpretations of the status waterbird occurrence at the lake. A more
systematic and integrated monitoring programme (IMP) would be needed at De Hoop Vlei
to better understand the inter-relationships between the lake and its biota. This integrated

385
approach has been identified as a critical way forward in managing wetlands for waterbirds
both in the United States (Parsons et al. 2002, Erwin 2002) and in the United Kingdom
(Kershaw et al. 2001), the latter focusing on Anatidae. Such an approach would lead to
improved scientific data collation and hence more effective management of the site for
waterbirds.
One way to coordinate an IMP would be to establish De Hoop Vlei as a bird
observatory. Bird observatories have been established around the world where their
primary purpose is to conduct long-term monitoring of bird populations and migration
(Chambers 2005, Knudsen et al. 2007, http://www.birdobscouncil.org.uk/). They are usually
located on defined or prime migration routes. Because of its southernmost position in Africa
and its role in supporting regular numbers of Palearctic waterbird species (notably
shorebirds), De Hoop has the potential to play a useful role in intensively monitoring
changes in migrant waterbird populations, especially in an era of rapid climate and
environmental change (Chambers 2005). Besides migrant species, more intensive
monitoring of local resident waterbirds is recommended. This would lead to an improved
understanding of the occurrence and movements of resident species, especially in a regional
context. Provincial nature conservation agencies, like CapeNature, have responsibilities to
conserve and manage local indigenous avifauna and should feature prominently in their
their biodiversity policies. To date no bird observatory has been established in South Africa
and although funding and personnel resources will be required, a strategy should be put in
place by provincial and national authorities to start developing such a proposal.

386
References
Allanson BR 1981. The coastal lakes of southern Africa. In: Day JH (ed.) Estuarine Ecology – with Particular Reference to Southern Africa. pp. 331–344. A.A. Balkema, Cape Town.
Anderson MA, Kolberg H, Anderson PC, Dini J and Abrahams A 2003. Waterbird populations at the Orange River Mouth from 1980–2001: a re-assessment of its Ramsar status. Ostrich 74: 159–172.
Barnes KN (ed.) 1998. Important Bird Areas of Southern Africa. BirdLife South Africa, Johannesburg.
Barnes KN (ed.) 2000. The Eskom Red Data book of birds of South Africa, Lesotho and Swaziland, BirdLife South Africa, Johannesburg.
Boshoff AF, Vernon CJ and Piper SE 1991. Spatial and temporal abundance patterns of waterbirds in the southern Cape Province. Part 2. Waterfowl. Ostrich 62: 178–196.
Carter RA 1983. Report No. 21: Bree (CSW22). In: Estuaries of the Cape. Part 2. Synopses of available information on individual systems. Heydorn AEF and Grindley JR (eds). CSIR Research Report No. 420: 59 pp.
Chambers LE 2005. Migration dates at Eyre Bird Observatory: links with climate change? Climate Research 29: 157–165.
Coetzee DJ 1986. Zooplankton and some environmental conditions in De Hoop Vlei, a southern Cape coastal lake. Bontebok 5: 10–16.
Corberia MC and Conradie B 2010. Nature-based tourism in the Agulhas Plain: a vehicle for integrated biodiversity conservation and sustainable economic development. Centre for Social Sciences Research, Working Paper No. 280, University of Cape Town.
Cowan GI (ed.) 1995. Wetlands of South Africa. Department of Environmental Affairs and Tourism, Pretoria.
Colwell MA and Taft OW 2000. Waterbird communities in managed wetlands of varying water depth Waterbirds 23: 45–55.
Davies B and Day J 1998. Vanishing Waters. University of Cape Town Press, Cape Town. del Hoyo J, Elliot A and Sargatal J (eds) 1996. Handbook of Birds of the World Vol. 3. Hoatzin
to Auks. Lynx Edicions, Barcelona. Elliott CCH, Waltner M, Underhill LG, Pringle JS and Dick WJA 1976. The migration system
of of the Curlew Sandpiper Calidris ferruginea in Africa. Ostrich 47: 191–213. Erwin RM 2002. Integrated management of waterbirds: beyond the conventional. Waterbirds 25
(Special publication 2): 5–12. Fishpool LDC and Evans MI (eds) 2001. Important Bird Areas in Africa and Associated Islands:
Priority Sites for Conservation. BirdLife Conservation Series No. 11. Newbury and Cambridge, United Kingdom: BirdLife International.
Greig JC 1984. De Hoop 1984 –doublethink or sensible compromise. Editorial. African Wildlife 37(6): 210.
Harebottle DM and Underhill LG 2006. The Arctic connection: monitoring coastal waders in South Africa, a case study. In Boere GC, Galbraith CA and Stroud DA (eds). Waterbirds Around the World. The Stationary Office, Edinburgh: 138–139.
Harebottle DM, Navarro RA, Underhill LG and Waltner M 2006. Trends in numbers of migrant waders (Charadrii) at Langebaan Lagoon, South Africa, 1975–2003. In: Boere GC, Galbraith CA and Stroud DA (eds). Waterbirds Around the World. The Stationary Office, Edinburgh: 376–378.
Hart RC 1995. South African coastal lakes. In: Cowan (ed.) Wetlands of South Africa. Department of Environmental Affairs and Tourism, Pretoria. pp. 103–130.
Heÿl CW and Currie MH 1985. Variations in the use of the Bot River Estuary by water-birds. Transactions of the Royal Society of South Africa 45: 397–417.
Heÿl CW 1988. Variations in waterbird numbers from some wetlands in the south-western Cape. In: Macdonald IAW and Crawford RJM (eds.) Long-term data series relating to South Africa’s renewable natual resources. South African National Scientific Programmes Report No. 157: 162–165.

387
Kaletja-Summers B, Allan DG and Longrigg DG 2001a. Long-term trends, seasonal abundance and energy consumption of waterbirds at Rietvlei, Western Cape, South Africa, 1950–1997. Ostrich 72: 63–79.
Kaletja-Summers B, McCarthy M and Underhill LG 2001b. Long-term trends, seasonal abundance and energy consumption of waterbirds at Strandfontein, Western Cape, South Africa, 1953–1993. Ostrich 72: 80–95.
Kershaw M, Hearn RD and Cranswick PA 2001. The role of ringing in integrated population monitoring of Anatidae in the United Kingdom. Ardea 89 Special issue: 209–220.
Knudsen E, Lindén A, Ergon T, Jonzén N, Vik JO, Knape J, Røer JE and Stenseth NC 2007. Characterizing bird migration phenology using data from standardized monitoring at bird observatories. Climate Research 35: 59–77.
Magnall MJ 1999. The role of farm dams in conserving waterbirds in the Western Cape. South African Wetlands. Newsletter on Activities Relating to the Ramsar Convention in South Africa 10: 11–13.
Mangnall MJ and Crowe TM 2001. Managing Egyptian Geese on the croplands of the Agulhas Plain, Western Cape, South Africa. South African Journal of Wildlife Research 31: 25–34.
Midgley GF, Chapman RA, Hewitson B, Johnston P, de Wit M, Ziervogel G, Mukheibir P, van Niekerk L, Tadross M, van Wilgen BW, Kgope B, Moran PD, Theron A, Scholes RJ and Forsyth GG 2005. A Status Quo, Vulnerability and Adaptation Assessment of the Physical and Socio-economic Effects of Climate Change in the Western Cape. Report to the Western Cape Government, Cape Town, South Africa. CSIR Report No. ENV-S-C 2005-073, Stellenbosch.
Noble RG and Hemens J 1978. Inland water ecosystems in South Africa – a review of research needs. South African National Scientific Programmes Report 34: 1–150.
Ntiamoa-Baidu Y, Piersma T, Wiersma P, Poot M, Battley P and Gordon C 1998, Water depth selection, daily feeding routines and diets of waterbirds in coastal lagoons in Ghana. Ibis 140: 89–103.
Parsons KC, Brown SC, Erwin RM and Czech HA 2002. Introduction: Managing wetlands for waterbirds: Integrated approaches. Waterbirds 25 (Special publication 2): 1–4.
RAMSAR 2010. De Hoop Vlei. Ramsar Information Sheet. http://www.ramsar.org. Scott HA and Hamman KCD 1988. Recent fish records from De Hoop Vlei, a southern Cape
coastal lake. Bontebok 6: 30–33. Stewart BA and Bally R 1985. The ecological role of the red-knobbed coot Fulica cristata Gmelin
at the Bot River Estuary, South Africa. Transactions of the Royal Society of South Africa 45: 419–426.
Summers RW, Pringle JS and Cooper J 1976. The status of coastal waders in the south-western Cape, South Africa. Report on the summer 1975/76 ornithological survey of coastal wetlands and shorelines of the south-western Cape. Western Cape Wader Study Group, Cape Town.
Swanepoel D, Underhill LG, Wheeler M, Harebottle DM and Williams AJ 2006. Waterbirds at Theewaterskloof Dam, Western Cape, South Africa. Ostrich 77: 170–174.
Underhill LG 1987. Waders (Charadrii) and other waterbirds at Langebaan Lagoon, South Africa, 1975–1986. Ostrich 58: 145–155.
Underhill LG 2004. Sixty-five years of Blacksmith Plovers in the Western Cape. Bird Numbers 13(2): 28–29.
Underhill LG 2003. Monitoring the Arctic at the foot of Table Mountain. Arctic Bulletin 4: 15. Underhill LG, Tree AJ, Oschadleus HD and Parker V 1999. Review of ring recoveries of
waterbirds in southern Africa. Avian Demography Unit, University of Cape Town, Cape Town.
Underhill LG, Kemper J, Whittington PA and Wolfaardt AC 2000. Egyptian Geese Alopochen aegyptiacus moulting on Dassen Island, South Africa. Marine Ornithology 28: 121–122.
Underhill LG, Whittington PA and Calf KM 2001. Shoreline birds of Robben Island, Western Cape, South Africa. Wader Study Group Bulletin 96: 37–39.

388
Uys CJ 1983. Portrait of a fynbos habitat extraordinary: De Hoop Vlei. African Wildlife 37(1): 5–8.
Uys CJ and Macleod JGR 1967. The birds of the De Hoop vlei region, Bredasdorp, and the effect, of the 1957 inundation over a 10-year period (1957–1966), on the distribution of species, bird numbers and breeding. Ostrich 38: 233–254.
Venter A, Underhill LG, Whittington PA and Dyer BM 2002. Waders (Charadrii) and other shorebirds of Dyer Island, Western Cape, South Africa. Wader Study Group Bulletin 98: 20–24.
Wetlands International. 2006. Waterbird Population Estimates – Third Edition. Wetlands International Global Series No. 12, Wageningen, The Netherlands.

389
Table D.1 Summary of waterbird surveys for De Hoop Vlei from 1979–2009. Species in bold were counted from 1979–2004 (N=215, n=107 summer, n=108 winter); those not in bold from 1985–2004 (N=153; n=79 summer, n=79 winter) (see text for details). Species marked with an asterisk (*) were recorded on fewer than 25% of surveys. Species sorted in descending order of mean summer abundance per guild.
Species Summer Winter
Mean ± S.D. Min-Max1 Mean ± S.D. Min-Max1
Residents Waterfowl Red-knobbed Coot 4775.2 ± 838.7 0–14400 5962.6 ± 782.7 0–24200 Cape Shoveler 680.7 ± 175.6 0–3004 532.4 ± 23.2 0–2174 Egyptian Goose 647.7 ± 482.6 0–3175 341 ± 123.6 0–2113 Yellow-billed Duck 632 ± 448.9 0–4626 503.9 ± 198.1 0–3114 Southern Pochard 149 ± 118.5 0–988 63 ± 65.3 0–789 Little Grebe 120.5 ± 33.4 0–597 170.8 ± 36.6 0–675 South African Shelduck 71.9 ± 35.3 0–478 19.8 ± 13.7 0–896 Great Crested Grebe 57.7 ± 9.1 0–276 49.1 ± 9.5 0–319 Black-necked Grebe 54.7 ± 36.9 0–806 73.8 ± 45.9 0–581 Cape Teal 35.5 ± 12.1 0–472 32 ± 4.4 0–163 Spur-winged Goose 33.9 ± 30.1 0–545 60.6 ± 33 0–696 Red-billed Teal 27.2 ± 18.1 0–540 21.3 ± 9.5 0–604 Maccoa Duck 12.1 ± 13.7 0–127 59.3 ± 10.2 0–895 Common Moorhen* 1.7 ± 1.6 0–52 1.2 ± 0.8 0–13 White-backed Duck* 0.4 ± 0.4 0–11 0.2 ± 0.3 0–13 White-faced Duck* 0.3 ± 0.6 0–30 0.2 ± 0.3 0–8 Fulvous Duck* 0.1 ± 0.1 0–3 0.1 ± 0.1 0–1 Hottentot Teal* – – 0.2 ± 0.3 0–8
Sub-total 4692.5 ± 665 0–14934 4675.8 ± 463.9 0–12950
Pelicans Great White Pelican 26.8 ± 23.4 0–435 27.3 ± 16.2 0–296
Cormorants and darter White-breasted Cormorant 63.6 ± 23.5 0–433 87.3 ± 7.1 0–506 Reed Cormorant 38.4 ± 18.4 0–584 76.7 ± 17.1 0–434 African Darter 4.3 ± 3.2 0–28 9.6 ± 4.4 0–169 Crowned Cormorant* 2.4 ± 2.8 0–99 1.2 ± 1.7 0–18 Cape Cormorant* 2.1 ± 4.7 0–157 1.2 ± 1 0–20
Sub-total 110.6 ± 45.4 0–690 175.8 ± 23.6 0–1109
Shorebirds Black-winged Stilt 76.5 ± 26.4 0–370 79.9 ± 25.6 0–304 Pied Avocet 20.5 ± 8.7 0–199 22.1 ± 7.3 0–173 Blacksmith Lapwing 17 ± 6.2 0–237 24.2 ± 4.1 0–130 Kittlitz’s Plover 4 ± 1.7 0–36 7.7 ± 1.5 0–71 Three-banded Plover 3.3 ± 2.4 0–78 3 ± 2.1 0–39 White-fronted Plover 2.7 ± 4.3 0–140 9.1 ± 3.1 0–69 Water Thick-knee 1.6 ± 0.9 0–10 1.4 ± 0.7 0–16 African Snipe* 0.2 ± 0.3 0–9 _ _
Greater Painted-snipe* 0.1 ± 0.1 0–1 _ _
Sub-total 125.4 ± 35.3 0–414 147.1 ± 22.9 0–457

390
Table D.1 contd
Species Summer Winter
Mean ± S.D. Min-Max Mean ± S.D. Min-Max
Waders African Spoonbill 38.5 ± 22.4 0–253 36.8 ± 8.9 0–368 African Sacred Ibis 38.4 ± 27.4 0–499 20.4 ± 17.2 0–474 Grey Heron 34.9 ± 6.5 0–188 31.8 ± 5.4 0–206 Little Egret 21.2 ± 12.7 0–148 20.1 ± 7.3 0–217 Cattle Egret 17.4 ± 8.7 0–174 8.4 ± 6 0–189 Yellow-billed Egret 6.8 ± 4.8 0–54 6.6 ± 4.4 0–72 Black-crowned Night-Heron* 3.4 ± 3.9 0–39 8.7 ± 2.2 0–161 Great Egret* 2.7 ± 1.5 0–37 0.7 ± 0.5 0–32 Glossy Ibis* 2.1 ± 2.7 0–33 1.5 ± 1 0–21 Black-headed Heron* 0.8 ± 0.8 0–13 0.5 ± 0.5 0–11 Hamerkop 0.7 ± 0.4 0–15 1.5 ± 0.4 0–10 Black Egret* 0.5 ± 0.8 0–15 0.5 ± 0.9 0–15 Hadeda Ibis* 0.5 ± 0.5 0–6 0.5 ± 0.3 0–11 Purple Heron* 0.3 ± 0.3 0–5 0.7 ± 0.2 0–9 Black Stork* 0.2 ± 0.1 0–2 0.2 ± 0.1 0–2 Little Bittern* 0.1 ± 0.2 0–3 0 ± 0 – Yellow-billed Stork* 0.1 ± 0.2 0–3 0 ± 0 –
Sub-total 167.9 ± 60.3 0–976 138.3 ± 16.3 0–1038
Flamingos Greater Flamingo 193.5 ± 98 0–2454 138.3 ± 97.6 0–1473 Lesser Flamingo* 51.2 ± 42.7 0–1715 118.9 ± 30.3 0–1715
Sub-total 244.6 ± 100.0 0–2482 257.2 ± 90.0 0–1875
Rallids Striped Flufftail* 0.1 ± 0.1 0–1 – – African Rail* – – 0.1 ± 0.1 0–1 African Purple Swamphen* 0.1 ± 0.1 0–1 0.1 ± 0.1 0–1 African Jacana* – – 0.1 ± 0.1 0–1
Sub-total 0 ± 0 0–1 0.1 ± 0.1 0–1
Gulls Kelp Gull 19.1 ± 9.3 0–62 28.8 ± 4.4 0–206 Grey-headed Gull 2.7 ± 1 0–29 2.9 ± 1.3 0–26 Hartlaub’s Gull* 0.2 ± 0.2 0–8 0.1 ± 0.1 0–3
Sub-total 22 ± 8.9 0–68 31.7 ± 3.3 0–234
Terns Whiskered Tern* 8.9 ± 22.2 0–427 – – Caspian Tern 6.2 ± 5.2 0–127 6.1 ± 5 0–82 Swift Tern* 1 ± 2.6 0–160 – –
Sub-total 16 ± 24.5 0–433 6.1 ± 5 0–82
Raptors African Fish Eagle 1.7 ± 0.5 0–7 1.7 ± 0.5 0–12 African Marsh-Harrier* 0.3 ± 0.3 0–9 0.1 ± 0.1 0–1 Black Harrier* 0.1 ± 0.1 0–1 0.1 ± 0.1 0–1
Sub-total 2 ± 0.6 0–16 1.8 ± 0.6 0–12

391
Table D.1 contd
Species Summer Winter
Mean ± S.D. Min-Max Mean ± S.D. Min-Max
Palearctic migrants
Shorebirds Curlew Sandpiper 273.9 ± 140 0–2466. 25.2 ± 9.1 0–507 Little Stint 123.1 ± 54.7 0–1043 13.3 ± 4.7 0–352 Common Greenshank 13.2 ± 10.2 0–110 3.9 ± 7 0–122 Ruff* 8.8 ± 4.8 0–132 0.7 ± 1.3 0–120 Marsh Sandpiper* 7.5 ± 8.3 0–179 1.7 ± 3.3 0–370 Sanderling* 6.5 ± 9.6 0–316 2 ± 3.9 0–92 Common Ringed Plover* 2.6 ± 4.2 0–140 0.2 ± 0.3 0–9 Grey Plover* 0.8 ± 2 0–45 0.1 ± 0.2 0–3 Wood Sandpiper* 0.2 ± 0.4 0–13 – – Bar-tailed Godwit* 0.1 ± 0.3 0–10 0.1 ± 0.1 0–1 Ruddy Turnstone* 0.1 ± 0.2 0–2 – – Red Knot* 0.1 ± 0.1 0–1 0.1 ± 0.2 0–3 Eurasian Curlew* 0.1 ± 0.1 0–1 – – Common Sandpiper* 0.1 ± 0.1 0–3 0.2 ± 0.4 0–8
Sub-total 436.5 ± 198.7 0–3180 46.9 ± 17 0–904
Terns White-winged Tern 143.1 ± 60.4 0–891 0.1 ± 0.1 0–400 Common Tern* 1.4 ± 2.4 0–71 – – Sandwich Tern* 0.1 ± 0.2 0–10 – –
Sub-total 144.5 ± 60.4 0–891 0.1 ± 0.1 0–400
Raptors Osprey* 0.1 ± 0.1 0–2 – 0–1
Sub-total: residents 5129.3 ± 685.3 0 –14972 5157.1 ± 525.2 2–13774
Sub-total: Palearctic migrants 581 ± 248.8 0 –3830 46.9 ± 17 0– 988
Total : all waterbirds 5710.2 ± 909.6 0 –16338 5203.9 ± 534.3 7–13792
1 The sub-total values here reflect the minimum/ maximum number for the group profile as a whole and not the sum of individual minima/maxima for each species which would represent estimated min./max. carrying capacity and not actual min./max. numbers reflected by the dataset

392
Table D.2 Species of conservation importance at De Hoop Vlei based on maximum counts from 215 surveys. Ramsar 1% levels, sub-regional IBA levels and provincial (Western Cape) thresholds are given. Species are sorted in descending order of the global 1% threshold level. Species in bold are included in the South African Red Data book (Barnes 2000).
Species Max. count Threshold
Ramsar 1% 1
IBA 0.5%2
Western Cape3
Maccoa Duck 895 9% (14) 17 105% Cape Shoveler* 3004 8.6% (135) 173 37% Greater Flamingo 2454 3.2% (18) 30 13% Lesser Flamingo 1715 2.9% (7) 17 26% Caspian Tern 127 8.5% (16) 27 23% Black-necked Grebe 806 5.4%(18) 28 25% Yellow-billed Duck 4626 4.6% (43) 89 33% Whiskered Tern 427 4.3% (4) 7 52% White-breasted Cormorant 506 4.2% (30) 49 10% Great Crested Grebe 319 3.2% (35) 63 24% Red-knobbed Coot 24200 2.4% (42) 86 33% Great White Pelican 435 2.2% (4) 11 13% Southern Pochard 988 2% (10) 38 59% South African Shelduck* 896 1.8% (1) 10 9% Black-winged Stilt 370 1.6% (13) 38 8% Pied Avocet 199 1.1% (1) 9 4% Egyptian Goose 3175 – 17 10% Spur-winged Goose 696 – 8 15% Little Grebe 675 – 6 14% White-fronted Plover 140 – 1 9% Curlew Sandpiper 1732 – 1 3% Black Egret 15 – – 300% Black-crowned Night-Heron 161 – – 57% Great Egret 37 – – 44% Whitefaced Duck 30 – – 26% Marsh Sandpiper 370 – – 26% White-winged Tern 891 – – 26% Grey Heron 206 – – 18% African Spoonbill 368 – – 18% Red-billed Teal 604 – – 15% Little Egret 217 – – 14% African Sacred Ibis 499 – – 11% Reed Cormorant 584 – – 10% Cape Teal 472 – – 9% Fulvous Duck 3 – – 9% African Darter 169 – – 9% Hottentot Teal 8 – – 7% Little Stint 700 – – 5% White-backed Duck 13 – – 2%
1 Figures represent the percentage of the estimated global* or Southern African# population based on the maximum count. Number in parentheses represents the number of surveys which met or surpassed the 1% threshold level. Calculated from Wetlands International (2006).
2 Figures represent the number of surveys which met or surpassed the Sub-regional IBA level (0.5% threshold) for southern Africa (Barnes 1998) but did not surpass the 1% global threshold level.
3 Value represents the percentage of the estimated provincial population and based on the maximum count. Estimates sourced and calculated from Coordinated Waterbird Counts, Animal Demography Unit, unpublished data (2006)

393
Table D.3 Comparison of mean abundance of 14 waterbirds and total waterbird population at De Hoop Vlei during three decades (1980s, 1990s and 2000s) and the percentage change between decades.
Species Season
Mean abundance % change
Decade Decade
1980s 1990s 2000s 1980s–1990s
1990s–2000s
1980s–2000s
Cape Shoveler S 918.2 822.3 288.0 –10.44% –64.98% –68.64%
W 612.5 510.2 251.1 –16.71% –50.78% –59.00%
Cape Teal S 30.3 38.0 59.1 25.34% 55.46% 94.85%
W 34.2 43.0 25.8 25.57% –0.04% –24.71%
Egyptian Goose S 711.4 1016.9 1541.0 42.94% –51.54% –116.61%
W 266.7 598.9 371.2 124.58% –38.03% 39.18%
Maccoa Duck S 6.6 1.8 2.4 –72.88% 31.69% –64.28%
W 93.0 8.5 16.9 –90.81% 98.16% –81.80%
Red-billed Teal S 23.3 101.0 6.6 332.36% –93.51% –71.92%
W 16.0 40.4 10.5 152.21% –73.94% –34.28%
Red-knobbed Coot S 6502.0 2397.4 1123.5 –63.13% –53.14% –82.72%
W 8044.0 2787.9 1777.8 –65.34% –36.23% –77.90%
South African Shelduck S 91.0 15.4 35.9 –83.07% 133.04% –60.56%
W 16.7 65.7 15.7 292.82% –76.13% –6.24%
Southern Pochard S 237.3 69.7 13.1 –70.65% –81.18% –94.47%
W 85.8 42.6 48.9 –50.28% 14.62% –43.01%
Spur-winged Goose S 25.3 36.8 94.9 45.24% 158.10% 274.86%
W 68.6 68.2 35.2 –0.56% –48.35% –48.63%
Yellow-billed Duck S 810.6 497.4 327.7 –38.64% –34.12% –59.58%
W 610.3 655.2 181.8 7.37% –72.25% –70.20%
Great White Pelican S 5.6 9.0 49.0 60.98% 444.44% 776.42%
W 17.5 12.7 44.9 –27.59% 254.24% 156.49%
Greater Flamingo S 311.5 52.8 12.7 –83.05% –76.01% –95.93%
W 192.8 7.1 48.0 –96.31% 576.26% –75.08%
Lesser Flamingo S 48.5 1.1 0.3 –97.83% –68.25% –99.31%
W 177.5 1.8 22.0 –98.98% 1111.44% –87.63%
All waterbirds S 8203 6104 4370 –25.59% –28.41% –46.73%
W 6998.2 5443.1 3646.5 –22.22% –33.01% –47.89%

394
Figure D.1 Map of De Hoop Vlei showing the location of the De Hoop farmstead (now the nature reserve offices), some of the major bays and the points (1–7) at which surveys were undertaken. The hatched area represents the milkwood dominated riverine bush (modified from Uys and Macleod 1967, Coetzee 1986). Inset shows the location of the lake in relation to De Hoop Nature Reserve. Map sourced from Uys (1983).

395
Figure D.2 Mean and median monthly rainfall from the Cape Agulhas region from 1980–2009. Figures based on data from De Mond rainfall station.
Figure D.3 Mean monthly abundance of all waterbirds at De Hoop Vlei from 1979–2004. Data is separated into resident species, Palearctic migrants and waterfowl to show relative contributions to monthly abundance.
0
10
20
30
40
50
60
70
80
Sep Oct Nov Dec Jan Feb Mar Apr May Jun Jul Aug
Rai
nfal
l (m
m)
Month
Mean
Median
0
2000
4000
6000
8000
10000
12000
Sep Oct Nov Dec Jan Feb Mar Apr May Jun Jul Aug
Mea
n no
. of
bird
s
Month
Resident waterbirds Waterfowl Palearctic migrants

396
Figure D.4 Mean monthly abundance of eleven waterbird guilds at De Hoop Vlei from 1979–2004. Waterfowl have been separated into ducks and geese, and grebes to show individual patterns.
0
200
400
600
800
1000 Migrant shorebirdsResident shorebirds
0
200
400
600 Waders Flamingos
0
50
100
150
200
250
300
Month
Migrant ternsResident gullsResident terns
0
50
100
150
200
250
300
350
400Grebes
0
1000
2000
3000
4000 Ducks and geese
0
100
200
300 Cormorants and darter
0
10
20
30
40
50
60
Month
Great White Pelican
Mea
n n
o. o
f bi
rds

397
Figure D.5 Mean monthly abundance of 10 waterfowl species at De Hoop Vlei from 1979–2004.
0
100
200
300
400Southern Pochard
0
200
400
600
800
1000 Cape Shoveler
0
20
40
60
80 Cape Teal
0
500
1000
1500 Egyptian Goose
01020304050607080
Month
Maccoa Duck
0
20
40
60
80 Red-billed Teal
0
50
100
150 South AfricanShelduck
0
500
1000
1500 Yellow-billed Duck
0
50
100
150
Mea
n no
. of
bird
s
Spur-winged Goose
0
2000
4000
6000
8000
10000
12000
Month
Red-knobbed Coot

398
Figure D.6 Mean monthly abundance of three grebe species, two cormorant species and Kelp Gull at De Hoop Vlei from 1979–2004.
0
50
100
150Black-necked Grebe
01020304050607080
Month
Great Crested Grebe
0
50
100
150
200
250
Mea
n no
. of
bird
s
Little Grebe
0
50
100
150 White-breasted Cormorant
0
50
100
150 Reed Cormorant
05
10152025303540
Month
Kelp Gull

Figure D.7 Mean monthly abundance of selected resident shorebirds and waders at De Hoop Vlei from 1979–2004.
0
100
200
300
400
500
Mea
n no
. of
bird
s
Greater Flamingo Lesser Flamingo
0
50
100
150
Mea
n no
. of
bird
s
Black-winged Stilt
0
20
40
60
80
100 African Sacred Ibis
0
10
20
30
40 Cattle Egret
0
10
20
30
40Blacksmith Lapwing
0
10
20
30
40
50 Grey Heron
399

400
Figure D.8 Mean monthly abundance of selected Palearctic migrant waterbirds at De Hoop Vlei from 1979–2004.
0
50
100
150
200
250
Month
White-winged Tern
0
50
100
150
200
250
Mea
n no
. of
bird
s
Little Stint
0
100
200
300
400
500Curlew Sandpiper

401
Figure D.9 Mean monthly abundance of piscivorous, herbivorous and invertebrate feeding waterbirds at De Hoop Vlei from 1979–2004.
0
50
100
150
200
250
300
350Piscivores
0
1000
2000
3000
4000
5000
Mea
n no
. of
bird
s
Herbivores
0
500
1000
1500
2000
2500
Month
Invertebrate feeders

402
Figure D.10 (a) Total no of waterbirds counted at De Hoop Vlei from 1984–2008. Summer (solid line) and winter (dashed line) inter-annual variation and trends in mean abundance of (b) resident and (c) Palearctic migrant waterbirds at De Hoop Vlei from 1984–2008. Regression lines are shown for summer where appropriate.
y = -188.42x + 8044R² = 0.2283
0
3000
6000
9000
12000
15000 Residents(b)
y = -57.212x + 1364R² = 0.3298
0
500
1000
1500
2000
2500
3000
1984
1986
1988
1990
1992
1994
1996
1998
2000
2002
2004
2006
2008
Year
Palearctic migrants(c)
Mea
n n
o. o
f bi
rds
0
5
10
15
20
25Ju
n-84
Jun-
86
Jun-
88
Jun-
90
Jun-
92
Jun-
94
Jun-
96
Jun-
98
Jun-
00
Jun-
02
Jun-
04
Jun-
06
Jun-
08
Tot
al n
o. o
f bi
rds
(tho
usan
ds)
All waterbirds(a)

Figure D.11 Inter-annual variation and trends in mean abundance of flamingos, pelicans and waterfowl at De Hoop Vlei from 1979–2008. Solid lines =summer, dashed line = winter. Regression lines are shown for summer where appropriate.
y = -16.994x + 399.05R² = 0.2655
0
500
1000
1500Greater Flamingo
y = -24.215x + 936.62R² = 0.2625
0
500
1000
1500
2000
2500Yellow-billed Duck
0
200
400
600South African Shelduck
0100200300400500600700800
Year
Maccoa Duck
0
50
100
150
200
Year
Great White Pelican
y = 48.212x + 314.85R² = 0.2952
0
1000
2000
3000
4000 Egyptian Goose
y = -11.339x + 289.9R² = 0.5511
0
200
400
600 Southern Pochard
0
500
1000
Mea
n no
. of
bird
s
Lesser Flamingo
y = -351x + 9918.5R² = 0.4391
-5000
0
5000
10000
15000
20000
Year
Red-knobbed Coot
403

404
Figure D.12 Inter-annual variation in mean abundance of four resident waterbirds at De Hoop Vlei from 1984–2008. Regression lines are shown for summer where appropriate.
Mea
n n
o. o
f bi
rds
0
100
200
300
400 Black-necked Grebe
y = -6.2563x + 171.63R² = 0.1958
0
100
200
300
400
500Little Grebe
0
50
100
150 Grey Heron
0
20
40
60
80
100
120
Year
Kelp Gull
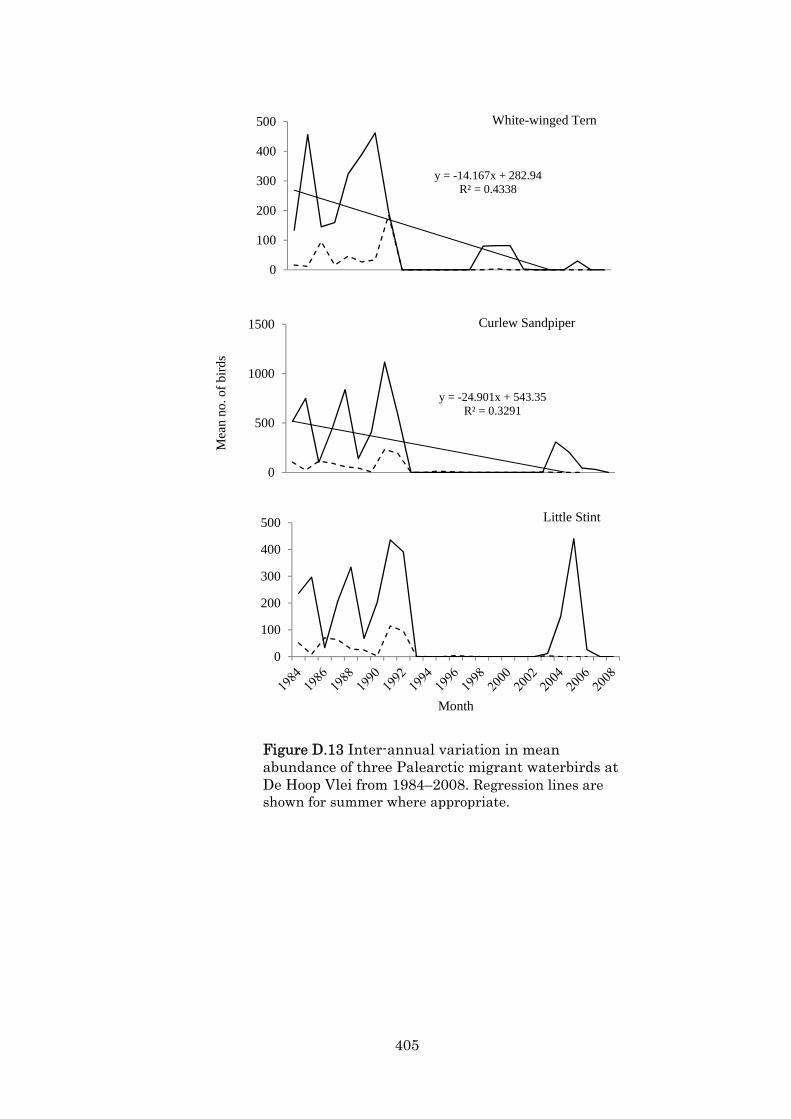
405
Figure D.13 Inter-annual variation in mean abundance of three Palearctic migrant waterbirds at De Hoop Vlei from 1984–2008. Regression lines are shown for summer where appropriate.
y = -14.167x + 282.94R² = 0.4338
0
100
200
300
400
500 White-winged Tern
y = -24.901x + 543.35R² = 0.3291
0
500
1000
1500
Mea
n no
. of
bird
s
Curlew Sandpiper
0
100
200
300
400
500
Month
Little Stint

406
Figure D.14 Inter-annual variation in mean abundance of three major waterbird feeding guilds at De Hoop Vlei from 1984–2008. Regression lines are shown for summer.
y = -125.97x + 5735.4R² = 0.1485
0
2000
4000
6000
8000
10000
12000 Herbivores
y = 0.8044x + 171.08R² = 0.0016
0
500
1000
1500
Mea
n no
. of
bird
s
Piscivores
y = -121.52x + 3498.3R² = 0.8048
0
1000
2000
3000
4000
Year
Invertebrate feeders

407
Figure D.15 Monthly Waterbird Conservation Value (WCV) scores for De Hoop Vlei from June 1984–January 2009. Relative contributions of species reaching 0.5% or 1%
0
2
4
6
8
10
12
14
16
18
WC
V s
core
Date
Cape Shoveler Yellow-billed Duck Red-knobbed CootWhite-breasted Cormorant Great Crested Grebe Caspian TernMaccoa Duck Black-necked Grebe Black-winged StiltSouthern Pochard Greater Flamingo Great White PelicanPied Avocet Whiskered Tern Crowned CormorantOther

408
threshold levels are shown.
Figure D.16 The relationship between (a) the Waterbird Conservation Value (WCV) score and the number of species reaching their 1% levels and (b) the WCV score and the total count of waterbirds at De Hoop Vlei. Both plots cover all surveys from July 1984–January 2009 (n = 201).
y = 0.0004x + 2.792R² = 0.4174
0
2
4
6
8
10
12
14
16
18
0 5000 10000 15000 20000 25000 30000 35000
WC
V s
core
Total count
(b)
y = 2.4607x + 2.0367R² = 0.8014
0
2
4
6
8
10
12
14
16
18
0 1 2 3 4 5 6 7
WC
V s
core
No. of species reaching 1% threshold
(a)