Embed Size (px)
Citation preview

Citizen Survey for the Sycamore Park
District Questions on full range of usage, customer
satisfaction, priorities, and funding issues
Questions based on site visit to Sycamore and meetings with Park Board, staff, citizen stakeholders and citizen focus groups
Goal of 400 completed surveys. Actually completed 451 surveys. Results have 95% level of confidence with margin of error of +/-4.6%.

Good Representation By AGES
Under 5 years10%
5-9 years8%
10-14 years8%15-19 years
9%20-24 years
4%
25-34 years8%
35-44 years13%
45-54 years14%
55-64 years13%
65-74 years7%
75+ years5%
by percentage of household occupants
Q25. Demographics: Ages of People in Household
Source: Leisure Vision/ETC Institute (June 2011)

Sycamore Park District Today
Sycamore Park District “Community Vision” for the Future”
Funding for the “Community Vision”

OK
CA
AZ
COUT
WA
GA
CTMD
OH
MI
SD
IAMO MO
IL
TN
KS
VA
MS
Benchmarking Comparisons to National and Illinois Clients
ETC Institute- More than 600 Parks and Recreation Assessment Surveys in 46 States
VT ME
KYIN
MNWI
MA
SC
AR
AL
NV
MT
TX
FL
NYPANEWY
ORND

Leisure Vision Illinois Clients Include:
Wheeling Park Dist. Champaign Park Dist. Mundelein Park Dist. Schaumburg Park Dist. Elk Grove Park Dist. Highland Park District City of Rock Island Geneva Park District Winnetka Park Dist. Gurnee Park Dist. River Trails Park Dist. Hoffman Estates
Deerfield Park Dist. Lindenhurst Park Dist. Carol Stream Park Dist. Urbana Park Dist. Downers Grove Park Dist. Lisle Park Dist Freeport Park Dist. Northbrook Park District Park District of Oak Park Des Plaines Park Dist. Glenview Park District Sugar Grove Park Dist. Lake Bluff Park District

Household type (with children and without) Age of respondents Gender Program participation YMCA membership Level of satisfaction with value received Amount of additional taxes willing to pay Voting

Usage of the Parks is High
Trails and Playgrounds are Most Used Facilities
Over 80% of Households Rate Conditions of Parks as Excellent or Good
Opportunities Exist to Increase Program Participation
22% of Households are Members of the YMCA
Usage of the Hopkins and Sycamore Pools Are Fairly Equal

65%
43%
32%
18%
18%
12%
12%
12%
12%
10%
9%
9%
5%
3%
3%
3%
18%
Sycamore Community Park
Sycamore Park Sports Complex
Sycamore Lake Rotary Park
Wetzel Park
Charlie Laing Memorial Park
Kiwanis Prairie Park
Founders Park
Kiwanis East Park
Leon D. Larson Park
Elmer & Stanley Larson Playground
Old Mill Park
Parkside Preserve
Boynton Park
Brother's Park
Chief Black Partridge Nature Preserve
Emil Cassier Park
None, do not use any parks
0% 20% 40% 60% 80%
by percentage of respondents (multiple choices could be made)
Source: Leisure Vision/ETC Institute (June 2011)
Q1. Sycamore Park District Parks That Households Have Used During the Past Year
Usage ratings are significantly higher than
national benchmark of 72%
and Ilinois benchmark of 77%

5%
68%
39%
30%
15%
13%
9%
8%
8%
8%
7%
6%
6%
3%
3%
2%
1%
Sycamore Community Park
Sycamore Park Sports Complex
Sycamore Lake Rotary Park
Charlie Laing Memorial Park
Wetzel Park
Leon D. Larson Park
Founders Park
Kiwanis East Park
Old Mill Park
Kiwanis Prairie Park
Parkside Preserve
Elmer & Stanley Larson Playground
Boynton Park
Brother's Park
Chief Black Partridge Nature Preserve
Emil Cassier Park
None, do not use any parks
0% 20% 40% 60% 80%
Most Often 2nd Most Often 3rd Most Often
Q2. Parks That Respondent Households Used the Most During the Past Year
Source: Leisure Vision/ETC Institute (June 2011)
by percentage of respondents who selected the item as one of their top three choices
For both households with
and without children the Sycamore
Community Park is the Park visited the
most often.

54%
49%
47%
34%
27%
27%
26%
25%
21%
20%
15%
12%
11%
10%
6%
5%
2%
Walking trails
Playgrounds
Shelters and picnic areas
18 hole golf course
Natural areas
Baseball fields
Swimming pool
Soccer fields
Softball fields
Climbing structures
Community Center
Tennis courts
Wading pool
Basketball courts
Football fields
Other
None
0% 20% 40% 60%
by percentage of respondents (multiple choices could be made)
Source: Leisure Vision/ETC Institute (June 2011)
Q3. Recreation Facilities That Households Have Used or Visited in Sycamore Park District Parks During the Past Year
For households with young children ONLY under 10, playgrounds
is the facility visited the most often. For
households ONLY with children 10 to 19 and ALL households with only adults walking
trails are the facilities used or visited the most
often
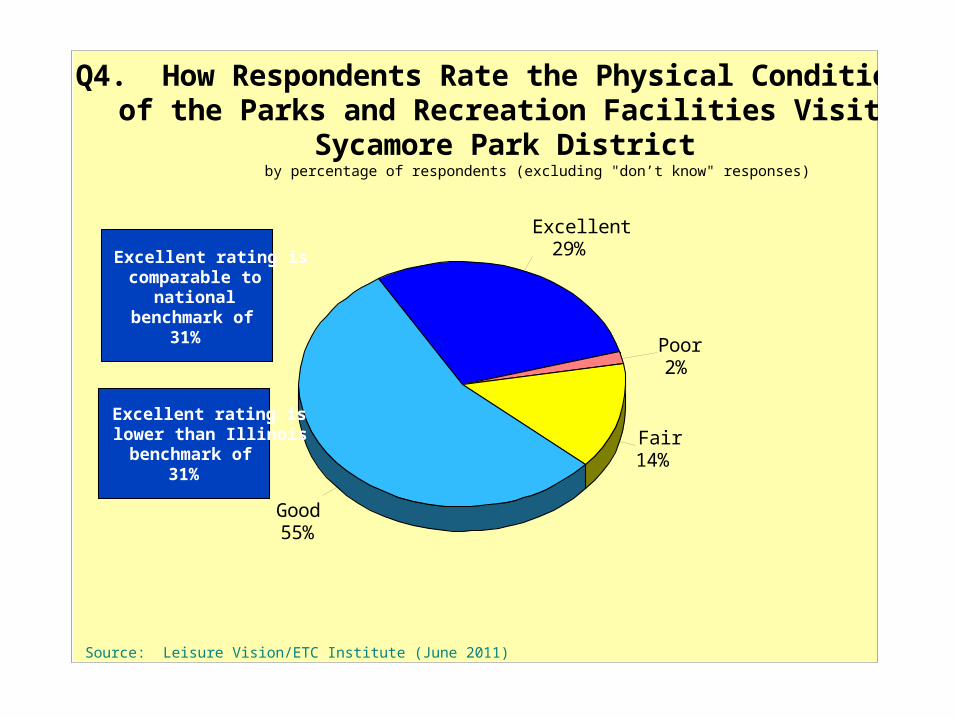
Excellent29%
Good55%
Fair14%
Poor2%
Q4. How Respondents Rate the Physical Condition of All of the Parks and Recreation Facilities Visited in the
Sycamore Park Districtby percentage of respondents (excluding "don’t know" responses)
Source: Leisure Vision/ETC Institute (June 2011)
Excellent rating is comparable to
national benchmark of
31%
Excellent rating is lower than Illinois
benchmark of 31%

Yes35%
No65%
Q5. Whether Respondent Households Participated In Any Recreation or Sports Programs Offered by the
Sycamore Park District During the Past Yearby percentage of respondents (excluding "don’t know” responses)
Source: Leisure Vision/ETC Institute (June 2011)
Participation in programs is higher than
national benchmark of
30%
Participation in programs is lower
than Illinois benchmark of
39%
43% of households who are members of the Kishwaukee
YMCA participate in programs

53%
51%
22%
18%
Households with children 10 and under
Households with children 10-19 (none under 10)
Households with adults 20-54 (none under 20)
Households with adults 55+
0% 20% 40% 60% 80% 100%Source: Leisure Vision/ETC Institute (June 2011)
Household Type
Q5. Whether Respondent Households Participated In Any Recreation or Sports Programs Offered by the
Sycamore Park District During the Past Year

Yes35%
No 65%
Excellent25%
Good62%
Fair12%
Poor1%
Q5a. How Would You Rate the Overall Quality of the Recreation or Sports Programs that You and Members of Your Household Have Participated
In?
by percentage of respondents (excluding "don’t know" responses)
Q5. Whether Respondent Households Participated In Any Recreation or Sports Programs Offered by the
Sycamore Park District During the Past Year
Source: Leisure Vision/ETC Institute (June 2011)
Excellent ratings are lower than
national benchmark of 34%
and Illinois benchmark of 37%
Quality of indoor facilities has
impact on participation and program quality

77%
39%
31%
28%
20%
18%
9%
8%
7%
7%
3%
1%
Sycamore Park District Brochure
Newspaper articles
From friends and neighbors
Sycamore Park District Web-site
Park District newsletters
Flyers distributed at school
Flyers at Park District facilities
E-mail Blasts
Conversations with Park District staff
Radio
Presentations by Park District staff
Cable access television
0% 20% 40% 60% 80% 100%
by percentage of respondents (multiple choices could be made)
Source: Leisure Vision/ETC Institute (June 2011)
Q6. ALL the Ways Respondents Learn About Sycamore Park District Programs and Activities
Usage of Park District Brochure
higher than national
benchmark of 53% and comparable
with Illinois benchmark of 76%

17%
16%
11%
10%
9%
8%
8%
7%
6%
5%
4%
4%
2%
2%
2%
2%
1%
1%
16%
Program times not convenient
Fees are too high
Program or facility not offered
Do not know locations of facilities
Use services of other agencies
Lack of quality programs
Facilities not well maintained
Don't know what is being offered
Use facilities in other communities
Facilities lack the right equipment
Poor customer service by staff
Facility operating hours not convenient
Lack of parking by facilities/parks
Too far from residence
Not accessible for people with disabilities
Registration for programs is difficult
Class full
Security is insufficient
Other
0% 10% 20% 30% 40%
by percentage of respondents (multiple choices could be made)
Source: Leisure Vision/ETC Institute (June 2011)
Q7. ALL the Reasons that Prevent Respondent Households From Using Parks, Recreation, Golf Course, Aquatics and Sports Facilities or Programs of the Sycamore Park District More Often
Program fees are too high
comparable to Illinois benchmark of 18% and higher
than national benchmark of 12%

Yes22%
No78%
Q8. Whether Members of Respondent Household Are Members of the Kishwaukee YMCA?
by percentage of respondents (excluding "don’t know" responses)
Source: Leisure Vision/ETC Institute (June 2011)
33% of households with
children are members of the
YMCA
Only 9% of households with
no children and all adults 55 years of age or older are members of the
YMCA
Only 16% of households with
no children and all adults 20-54 years
of age are members of the
YMCA

Yes27%
No73%
Q12. Whether Respondent Households Used the Hopkins Pool in DeKalb During the Past Year
by percentage of respondents (excluding "don’t know" responses)
Source: Leisure Vision/ETC Institute (June 2011)
42% of households with children under
10 and 46% of households with
children 11-19 used the Hopkins
Pool
20% of households with no children
and all adults 20-54 and 6% of
households with no children and all adults 55 and over used the Hopkins
Pool

Yes26%
No74%
Q13. Whether Respondent Households Used the Sycamore Pool During the Past Year
by percentage of respondents (excluding "don’t know” responses)
Source: Leisure Vision/ETC Institute (June 2011)
42% of households with children under
10 and 40% of households with
children 11-19 used the Sycamore
Pool
18% of households with no children
and all adults 20-54 and 9% of
households with no children and all adults 55 and over used the Sycamore
Pool

Yes26%
No 74%
1-2 times23%
3-5 times22%
6-10 times26%
11-20 times16%
21 times13%
Q13. How many times have you or members of your household used the Sycamore Pool during
the past year?
by percentage of respondents (excluding "don’t know" responses)
Source: Leisure Vision/ETC Institute (June 2011)
Q13. Whether Respondent Households Used the Sycamore Pool During the Past Year

30%
16%
15%
12%
5%
46%
Members of household don't swim
Pool is old/in poor condition
Pool doesn't have play features we like
Fees are too high
We use the Hopkins Pool
Other
0% 20% 40% 60%
Q13a. ALL the Reasons Respondent Households Have NOT Used the Sycamore Pool
Source: Leisure Vision/ETC Institute (June 2011)
by percentage of respondents who indicated that they had not use the Sycamore Pool during the past year (multiple choices could be made)

37%
24%
22%
20%
20%
19%
13%
37%
37%
38%
29%
26%
22%
20%
17%
25%
31%
38%
39%
45%
43%
8%
9%
8%
8%
7%
10%
17%
2%
5%
2%
5%
8%
5%
7%
PDs efforts to keep residents informed
Image of the PD in the community
Quality of services provided by PD
Leadership provided by the Park Board
Leadership provided by PD Executive Director
Responsiveness of PD staff to requests
Level of public involvement in PD decision-making
0% 20% 40% 60% 80% 100%
Very Satisfied Somewhat Satisfied Neutral
Somewhat Dissatisfied Very Dissatisfied
Q11. Satisfaction with Various Services Provided by the Sycamore Park District
Source: Leisure Vision/ETC Institute (June 2011)
by percentage of respondents

Q24. Satisfaction With the Overall Value Respondent Households Receive From the Sycamore Park District
by percentage of respondents
Very Satisfied14%
Somewhat Satisfied36%
Neutral26%
Somewhat Dissatisfied10%
Very Dissatisfied4%
Don't Know10%
Source: Leisure Vision/ETC Institute (June 2011)
50% of respondents are
very or somewhat satisfied with 14% very or somewhat dissatisfied. The
remainder indicated neutral or
don’t know
Very satisfied is lower than national benchmark of 26%
and Illinois benchmnark of
30%.
Neutral is higher than national
benchmark of 19% and Illinois
benchmnark of 17%.

Major Findings-Community’s Vision for the Future System Walking and biking trails are the facilities that households
have the most need for and are most important to households.
Outdoor swimming pools are most important to households with young children. An 18 hole golf course is most important for households with no children and all adults 55 and over.
A new outdoor swimming pool with features most desired by household respondents would substantially increase usage.
Over 80% of households would use an indoor community center with the features that are most important to them.

67%57%
55%53%
52%43%
42%41%40%
37%35%
34%27%
24%23%
22%21%21%21%
20%13%
12%9%
Walking and biking trailsLarge community parksNature center and trails
Greenspace and natural areasSmall neighborhood parks
Playground equipmentIndoor fitness/exercise facilities
Outdoor swimming pools18 hole golf course
Indoor running/walking trackSled Hill Toboggan Run
Indoor swimming pools/leisure poolIndoor lap lanes for exercise swimming
Youth baseball/softball fieldsOutdoor ice rink
Youth soccer fieldsOutdoor basketball courts
Indoor senior centerIndoor basketball/volleyball courts
Outdoor tennis courtsSkateboarding parkAdult softball fields
Youth football fields
0% 20% 40% 60% 80%
Q9. Households That Have a Need for Various Parks and Recreation Facilities
Source: Leisure Vision/ETC Institute (June 2011)
by percentage of respondents (multiple choices could be made)
Respondent Households Have a Need for a Wide Range of Outdoor and Indoor Parks
and Facilities

4,3923,778
3,6273,501
3,4552,802
2,7562,6902,664
2,4662,328
2,2161,787
1,5761,517
1,4511,3781,3781,378
1,319844
765567
Walking and biking trailsLarge community parksNature center and trails
Greenspace and natural areasSmall neighborhood parks
Playground equipmentIndoor fitness/exercise facilities
Outdoor swimming pools18 hole golf course
Indoor running/walking trackSled Hill Toboggan Run
Indoor swimming pools/leisure poolIndoor lap lanes for exercise swimming
Youth baseball/softball fieldsOutdoor ice rink
Youth soccer fieldsOutdoor basketball courts
Indoor senior centerIndoor basketball/volleyball courts
Outdoor tennis courtsSkateboarding parkAdult softball fields
Youth football fields
0 1,000 2,000 3,000 4,000 5,000
Q9a. Estimated Number of Households in the Sycamore Park District That Have a Need for Various Parks and Recreation Facilities
Source: Leisure Vision/ETC Institute (June 2011)
by number of households based on 6,594 households in Sycamore

Q9b. How Well Parks and Recreation Facilities in the Sycamore Park District Meet the Needs of Households
by percentage of respondents with a need for parks/facilities
Source: Leisure Vision/ETC Institute (June 2011)
62%
46%
51%
39%
36%
10%
7%
8%
3%
25%
38%
28%
38%
40%
10%
10%
4%
7%
9%
13%
13%
19%
20%
20%
12%
9%
17%
1%
1%
5%
2%
4%
25%
10%
17%
24%
3%
2%
3%
2%
35%
62%
62%
49%
Youth soccer fields
Youth baseball/softball fields
18 hole golf course
Playground equipment
Large community parks
Indoor fitness/exercise facilities
Indoor swimming pools/leisure pool
Indoor lap lanes for exercise swimming
Indoor running/walking track
0% 20% 40% 60% 80% 100%
100% Meets Needs 75% Meets Needs 50% Meets Needs 25% Meets Needs 0% Meets Needs
This chart shows some examples of how well the parks and recreation facilities in the
Sycamore Park District meet the needs of those households who have needs for each facility, i.e. 50% of playgrounds have needs for playgrounds and 77% indicated their needs are 100% or 75%
met

Source: Leisure Vision/ETC Institute (June 2011)
Q9c. Estimated Number of Households in the Sycamore Park District Whose Needs for Parks and Recreation Facilities
Are Only Being 50% Met or Lessby number of households based on 6,594 households in Sycamore
914
2,2662,262
2,2272,205
2,0931,850
1,6811,573
1,4291,208
1,1051,104
873784
644641629
543261258248
190
Walking and biking trailsNature center and trails
Indoor running/walking trackIndoor fitness/exercise facilities
Sled Hill Toboggan RunIndoor swimming pools/leisure pool
Outdoor swimming poolsIndoor lap lanes for exercise swimming
Outdoor ice rinkGreenspace and natural areas
Small neighborhood parksIndoor basketball/volleyball courts
Large community parksOutdoor tennis courts
Indoor senior centerPlayground equipment
Outdoor basketball courtsSkateboarding park18 hole golf courseAdult softball fields
Youth baseball/softball fieldsYouth football fieldsYouth soccer fields
0 1,000 2,000 3,000 4,000
50% Meets Needs 25% Meet Needs 0% Meets Needs
Calculated by multiplying the number of households
having needs by the percentage of households
whose needs are being 50% met or less.
Unmet needs exist for a wide range of outdoor and indoor parks and facilities

15%
3%
49%23%
22%20%20%
18%17%
16%15%15%
14%13%
10%10%9%
7%7%
5%4%4%3%
1%3%
Walking and biking trailsSmall neighborhood parks
Outdoor swimming pools18 hole golf course
Nature center and trailsPlayground equipment
Large community parksIndoor fitness/exercise facilities
Indoor running/walking trackGreenspace and natural areas
Youth baseball/softball fieldsIndoor swimming pools/leisure pool
Sled Hill Toboggan RunYouth soccer fields
Indoor lap lanes for exercise swimmingIndoor senior center
Outdoor ice rinkOutdoor tennis courts
Indoor basketball/volleyball courtsAdult softball fields
Outdoor basketball courtsSkateboarding parkYouth football fields
OtherNone Chosen
0% 10% 20% 30% 40% 50%
Most Important 2nd Most Important 3rd Most Important 4th Most Important
Q10. Parks and Recreation Facilities That Are Most Important to Households
Source: Leisure Vision/ETC Institute (June 2011)
by percentage of respondents who selected the item as one of their top four choices
Outdoor swimming pools most important for
households with children under 10
Walking and biking trails most important for
households with children 10-19 and households
without children and only adults 20-54
18 hole golf course most important for households without children and only
adults 55 and older

49%
43%
43%
40%
39%
37%
35%
33%
31%
20%
27%
Deck area
Concessions area
Bath house
Zero depth entry into wave pool
Large water slides
Water sprays for small children
Small water slides
Wading pool
Diving board
Other
None
0% 20% 40% 60% 80%
Q14. ALL the Aquatic Features Respondent Households Would Use At a New Sycamore Swimming Pool
Source: Leisure Vision/ETC Institute (June 2011)
by percentage of respondents (multiple choices could be made)
Over 90% of households with youth under 10
indicated at least one feature
Over 50% of households with no children and all
adults 55 and over indicated at least one
feature

39%
34%
32%
31%
23%
23%
22%
22%
15%
14%
10%
Deck area
Zero depth entry into wave pool
Large water slides
Small water slides
Bath house
Water sprays for small children
Concessions area
Diving board
Wading pool
Other
None
0% 10% 20% 30% 40% 50%
Most Important 2nd Most Important 3rd Most Important 4th Most Important
Q15. Which FOUR Aquatic Features Respondent Households Indicated Are Most Important to Their Household
Source: Leisure Vision/ETC Institute (June 2011)
by percentage of respondents who selected the item as one of their top four choices

0 times35%
1-9 times23%
10-20 times27%
21+ times15%
Q16. Approximate Number Of Times Per Year Respondent Household Would Visit Swimming Pool If the Sycamore Park District Built a New Swimming Pool
With Aquatic Features Most Important to Householdby percentage of respondents
Source: Leisure Vision/ETC Institute (June 2011)
65% of respondent households would
use a new swimming pool
with aquatic features most
important to their household

61%
42%
35%
31%
29%
25%
24%
23%
22%
22%
18%
16%
15%
9%
7%
7%
5%
16%
Walking/jogging track
Weight room/cardio equip. area
Aerobics/fitness/dance class space
Leisure pool
Lanes for lap swimming
Space for meetings/parties/banquets
Warm water for therapeutic purposes
Rock climbing/bouldering wall
Senior adult space
Multi-court gymnasium
Swim lesson area
Arts and crafts room
Teen center
Preschool program space
Classroom space
25 meter competition pool
Other
None
0% 20% 40% 60% 80%
Q17. ALL the Potential Indoor Programming Spaces Respondent Households Would Use If the Sycamore Park
District Developed New INDOOR Programming Spaces
Source: Leisure Vision/ETC Institute (June 2011)
by percentage of respondents (multiple choices could be made)
84% of respondents households would use at
least one feature
92% of respondent households who are
members of the YMCA would use at least one
feature

21%
49%
26%
22%
20%
17%
12%
12%
9%
8%
8%
7%
7%
6%
3%
2%
2%
3%
Walking/jogging track
Weight room/cardio equip. area
Aerobics/fitness/dance class space
Leisure pool
Lanes for lap swimming
Warm water for therapeutic purposes
Senior adult space
Multi-court gymnasium
Rock climbing/bouldering wall
Space for meetings/parties/banquets
Swim lesson area
Arts and crafts room
Teen center
Preschool program space
25 meter competition pool
Classroom space
Other
None
0% 10% 20% 30% 40% 50%
Most Often 2nd Most Often 3rd Most Often
Q18. Which THREE Indoor Spaces Respondent Households Indicated They Would Use the MOST OFTEN
Source: Leisure Vision/ETC Institute (June 2011)
by percentage of respondents who selected the item as one of their top three choices
By a large margin, respondent households
indicating they would vote in favor
of a tax increase favor the
walking/jogging track as the space they would use the
most often

Major Findings-Funding for the “Community Vision” Respondent households are supportive of partnering efforts,
particularly with the Sycamore School District.
Build a new Indoor Community Center, Improve Existing Parks, Develop Additional Walking/Biking Trails, and Build a New Sycamore Pool are Actions Respondent Households Would Be Most Willing to Fund With Park District Tax Dollars
58% of Respondent Households Would Pay Some Level of Tax Increase to Build and Operate the Types of Outdoor and Indoor Parks, Trails, Aquatics, Sports and Recreation Facilities Most Important to Their Household.
56% of Respondent Households Would Vote in Favor or Might Vote in Favor of Some Level of Tax Increase to Build and Operate the Types of Outdoor and Indoor Parks, Trails, Aquatics, Sports and Recreation Facilities Most Important to Their Household. 25% Would Vote Against and the Remaining 19% are Not Sure.

52%
32%
30%
22%
25%
28%
28%
30%
15%
24%
26%
27%
9%
16%
15%
21%
Sycamore School District 427
Kishwaukee YMCA
Kishwaukee Community Hospital
DeKalb Park District
0% 20% 40% 60% 80% 100%
Very Important Somewhat Important Not Sure Not Important
Q19. How Important Respondents Think It Is for the Sycamore Park District to Partner with Various
Organizations in Providing Parks & Recreation Services
Source: Leisure Vision/ETC Institute (June 2011)
by percentage of respondents

43%
44%
47%
39%
25%
26%
18%
17%
14%
37%
30%
25%
25%
36%
32%
23%
23%
25%
15%
19%
15%
19%
28%
25%
30%
37%
31%
5%
7%
14%
18%
12%
17%
29%
23%
31%
Improve existing parks
Develop additional walking/biking trails
Build new indoor community center
Build new Sycamore Pool
Improve existing sports fields
Develop additional neighborhood parks
Improve Sycamore Golf Course
Build new sports fields
Improve existing golf clubhouse
0% 20% 40% 60% 80% 100%
Very Important Somewhat Important Not Sure Not Important
Q20. Respondent Level of Support of Actions that the Sycamore Park District Could Take to Improve the Parks
and Recreation System
Source: Leisure Vision/ETC Institute (June 2011)
by percentage of respondents

20%
52%
43%
42%
42%
25%
20%
16%
12%
12%
9%
Build new indoor community center
Improve existing parks
Develop additional walking/biking trails
Build new Sycamore Pool
Develop additional neighborhood parks
Improve existing sports fields
Improve Sycamore Golf Course
Improve existing golf clubhouse
Build new sports fields
Other
None
0% 20% 40% 60%
Most Willing 2nd Most Willing 3rd Most Willing
4th Most Willing
Q21. Which FOUR of the Actions Respondents Would Be Most Willing to Fund with Park District Tax Dollars
Source: Leisure Vision/ETC Institute (June 2011)
by percentage of respondents who selected the item as one of their top four choices
Building a New Indoor Community Center and Build New Sycamore
Pool are the Actions
Respondents Would be Most Willing to Fund
with Park District Tax Dollars

$35+ per month4%
$30 per month2%
$25 per month10%
$20 per month14%
$15 per month28%
Nothing42%
Q22. The MAXIMUM Amount Respondents Indicated they Would Be Willing to Pay PER MONTH In Additional Property Taxes to Build
and Operate the Types of Parks, Trails, Aquatics, Sports and Recreation Facilities Most Important to Their Household
by percentage of respondents
Source: Leisure Vision/ETC Institute (June 2011)

Vote in favor31%
Might vote in favor25%
Not sure19%
Vote against25%
Q23. How Respondents Indicated they Would Vote If a Tax Increase they Indicated they Would Be Willing to Support Was Included In a Future Vote and the Funds From the Tax Were to Be Used to Pay to Construct & Operate the Types of Parks, Trails, Aquatics, Sports,
and Recreation Facilities Their Household Most Prefersby percentage of respondents (excluding those who didn’t give a response)
Source: Leisure Vision/ETC Institute (June 2011)
Of Respondent Households Who Indicated “Vote in Favor” Build New
Sycamore Pool Was the Most
Supported Project

Need more info11%
36%
5%
48%
Q23a. What Is the Major Reason You Indicated that You are “Not Sure” or Would “Vote Against”
by percentage of respondents who indicated that they would vote “not sure" or would “vote against” (excluding "don’t know” responses)
Source: Leisure Vision/ETC Institute (June 2011)
I don’t support any tax increase
I would support a lesser tax increase
The timing with the economy isn’t right


Under 5 years10%
5-9 years8%
10-14 years8%15-19 years
9%20-24 years
4%
25-34 years8%
35-44 years13%
45-54 years14%
55-64 years13%
65-74 years7%
75+ years5%
by percentage of household occupants
Q25. Demographics: Ages of People in Household
Source: Leisure Vision/ETC Institute (June 2011)

Under 3514%
35 to 4421%
45 to 5424%
55 to 6418%
65+23%
Q26. Demographics: Age of Respondentsby percentage of respondents
Source: Leisure Vision/ETC Institute (June 2011)

Male44%
Female56%
Q27. Demographics: Genderby percentage of respondents
Source: Leisure Vision/ETC Institute (June 2011)