Embed Size (px)
Citation preview
Ciner Resources LPInvestor Presentation
August 2021
2
Safe Harbor Statement
This investor presentation contains forward-looking statements. Statements other than statements of historical facts included in this investor presentation that address activities, events or developments that Ciner Resources LP (the “Partnership”, “we”, “us”, “our” or “CINR”) expects, believes or anticipates will or may occur in the future are forward-looking statements. Forward-looking statements include all statements that are not historical facts and in some cases may be identified by the use of forward-looking terminology such as the words “believe,” “expect,” “plan,” “intend,” “seek,” “anticipate,” “estimate,” “predict,” “forecast,” “project,” “potential,” “continue,” “may,” “will,” “could,” “should” or the negative of these terms or similar expressions. Such statements are based only on the Partnership’s current beliefs, expectations and assumptions regarding the future of the Partnership’s business, projections, anticipated events and trends, the economy and other future conditions. Because forward-looking statements relate to the future, they are subject to inherent uncertainties, risks and changes in circumstances that are difficult to predict and many of which are outside of the Partnership’s control. The Partnership’s actual results and financial condition may differ materially from those implied or expressed by these forward-looking statements. Consequently, you are cautioned not to place undue reliance on any forward-looking statement because no forward-looking statement can be guaranteed. Factors that could cause the Partnership’s actual results to differ materially from the results contemplated by such forward-looking statements include: changes in general economic conditions, the Partnership’s ability to meet its expected quarterly distributions, changes in the Partnership’s relationships with its customers, including American Natural Soda Ash Corp. (“ANSAC”), the demand for soda ash and the opportunities for the Partnership to increase its volume sold, the development of glass and glass making product alternatives, changes in soda ash prices, operating hazards, unplanned maintenance outages at the Partnership’s production facility, construction costs or capital expenditures exceeding estimated or budgeted costs or expenditures, the effects of government regulation, tax position, and other risks incidental to the mining and processing of trona ore, and shipment of soda ash, the impact of a cybersecurity event, the impact of our agreement to exit ANSAC effective as of December 31, 2020, and our transition to the utilization of Ciner Group’s global distribution network for some of our export operations beginning on January 1, 2021, our ability to reinstate our distributions, and the impact of the ongoing COVID-19 pandemic, including the impact of government orders on our employees and operations, as well as the other factors discussed in the Partnership’s Annual Report on Form 10-K for the year ended December 31, 2020, and subsequent reports filed with the United States Securities and Exchange Commission. All forward-looking statements included in this investor presentation are expressly qualified in their entirety by such cautionary statements. Unless required by law, the Partnership undertakes no duty and does not intend to update the forward-looking statements made herein to reflect new information or events or circumstances occurring after this investor presentation. All forward-looking statements speak only as of the date made.
This presentation includes certain market data that has been obtained through the Partnership’s own research, surveys or from studies conducted by third parties and industry or general publications. Industry or general publications and surveys or studies conducted by third parties generally state that they have obtained information from sources believed to be reliable, but do not guarantee the accuracy and completeness of such information. While the Partnership believes that each of these surveys, studies and publications is reliable, the Partnership has not independently verified such data, and the Partnership makes no representation as to the accuracy of such information.
Non-GAAP Financial Measures:
This presentation includes non-GAAP financial measures such as Adjusted EBITDA (also referred to as “Adj. EBITDA”). Investors should recognize that this non-GAAP measure might not be comparable to similarly titled measures of other companies. This measure should be considered in addition to, and not as a substitute for or superior to, any measure of performance, cash flows or liquidity prepared in accordance with GAAP. A reconciliation of this measure to our most directly comparable financial measures calculated and presented in accordance with GAAP is provided in the appendix to this presentation.

3
Ciner Resources LPAt A Glance
Ciner Resources LP – At A Glance
$MM Q2 2021 2020 2019
Revenue $120.7 $392.2 $522.8
Adj. EBITDA $16.3 $61.6 $135.4
▪ Master Limited Partnership (NYSE:CINR)
▪ One of the largest and lowest cost producers of natural soda ash in the world
– Soda ash, an essential raw material used in the production of glass, chemicals and detergents, is a well-structured global industry with steadily growing demand of 2.0% – 3.0% annually, or 2+ million short tons per year
▪ ~2.75 million short tons annual soda ash production capacity
▪ 50+ years of trona mining reserves¹
▪ 489 full-time employees¹
(1) As of December 31, 2020
4
Ciner Resources LP
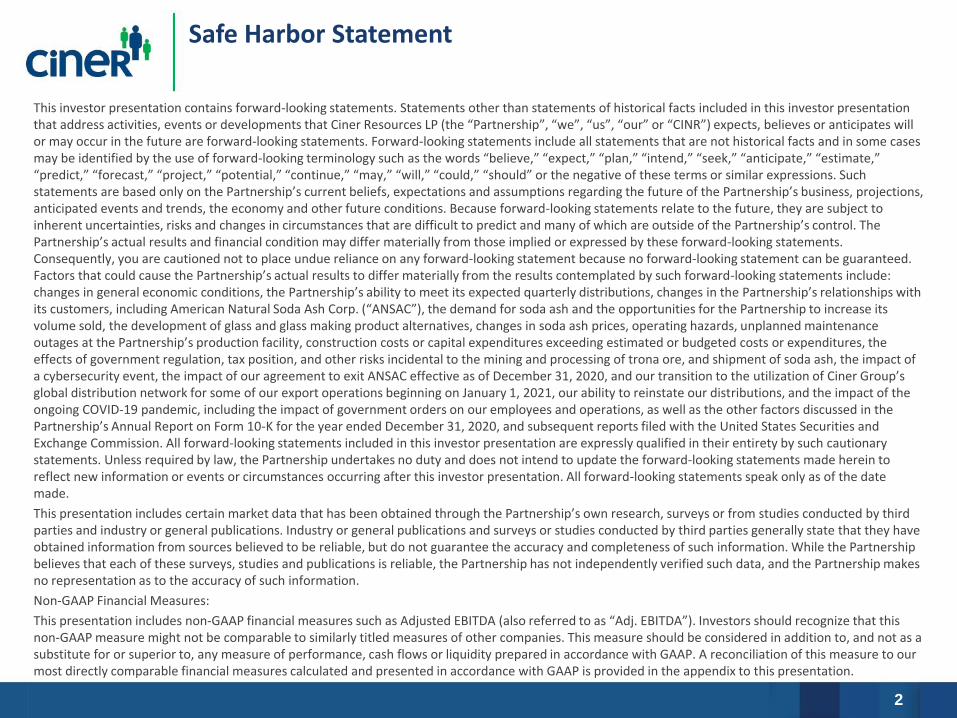
▪ Naturally-occurring trona resource has substantially lower production cost than synthetic production
▪ ~90% of the world’s natural reserves are located in Green River, Wyoming
▪ Environmentally-friendly production process
▪ Low-input production process doesn’t require secondary chemicals
Competitive Advantages
Natural Soda Ash
▪ Operational advantages compared to other US trona-based producers
▪ High-return expansion opportunities
▪ Stable domestic customer relationships
▪ Experienced management and operational teams
▪ Marketing and logistics synergies with global parent company (WE Soda)
Other Competitive Strengths
5
1.0x
1.8x 1.9x
2.3x
US Trona European
Solvay
China
Solvay
China Hou
Ciner Resources LPCompetitive Advantages (cont.)
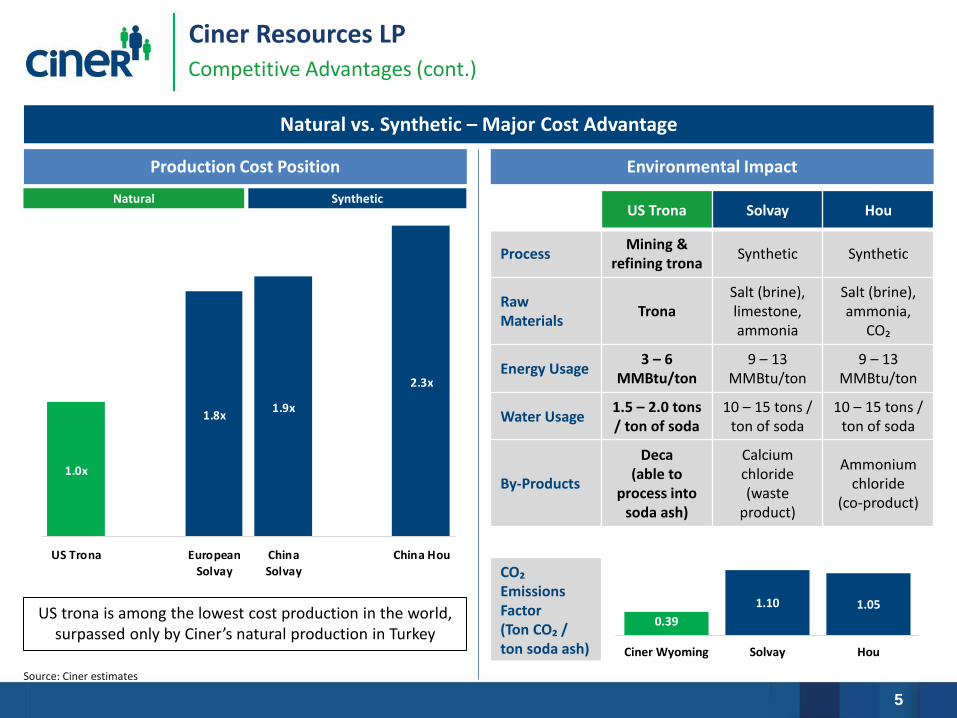
Natural vs. Synthetic – Major Cost Advantage
Production Cost Position
Natural Synthetic
Environmental Impact
US Trona Solvay Hou
ProcessMining &
refining tronaSynthetic Synthetic
Raw Materials
TronaSalt (brine), limestone, ammonia
Salt (brine), ammonia,
CO₂
Energy Usage3 – 6
MMBtu/ton9 – 13
MMBtu/ton9 – 13
MMBtu/ton
Water Usage1.5 – 2.0 tons / ton of soda
10 – 15 tons / ton of soda
10 – 15 tons / ton of soda
By-Products
Deca(able to
process into soda ash)
Calcium chloride (waste
product)
Ammonium chloride
(co-product)
0.39
1.10 1.05
Ciner Wyoming Solvay Hou
CO₂ Emissions Factor(Ton CO₂ / ton soda ash)
Source: Ciner estimates
US trona is among the lowest cost production in the world, surpassed only by Ciner’s natural production in Turkey
6
Ciner Resources LPCiner Wyoming Operations
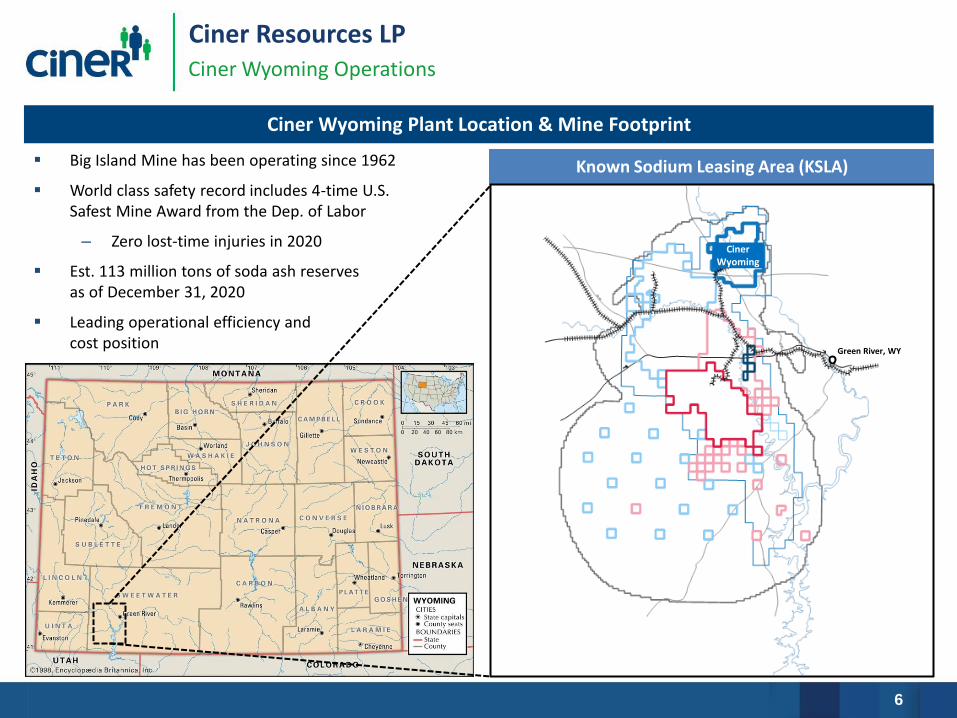
Ciner Wyoming Plant Location & Mine Footprint
Ciner Wyoming
Known Sodium Leasing Area (KSLA)
Green River, WY
▪ Big Island Mine has been operating since 1962
▪ World class safety record includes 4-time U.S. Safest Mine Award from the Dep. of Labor
– Zero lost-time injuries in 2020
▪ Est. 113 million tons of soda ash reserves as of December 31, 2020
▪ Leading operational efficiency and cost position
7
Pro
du
ctio
n C
ost
/To
n
Production (Tons)
Ciner Resources LPCiner Wyoming Operations (cont.)
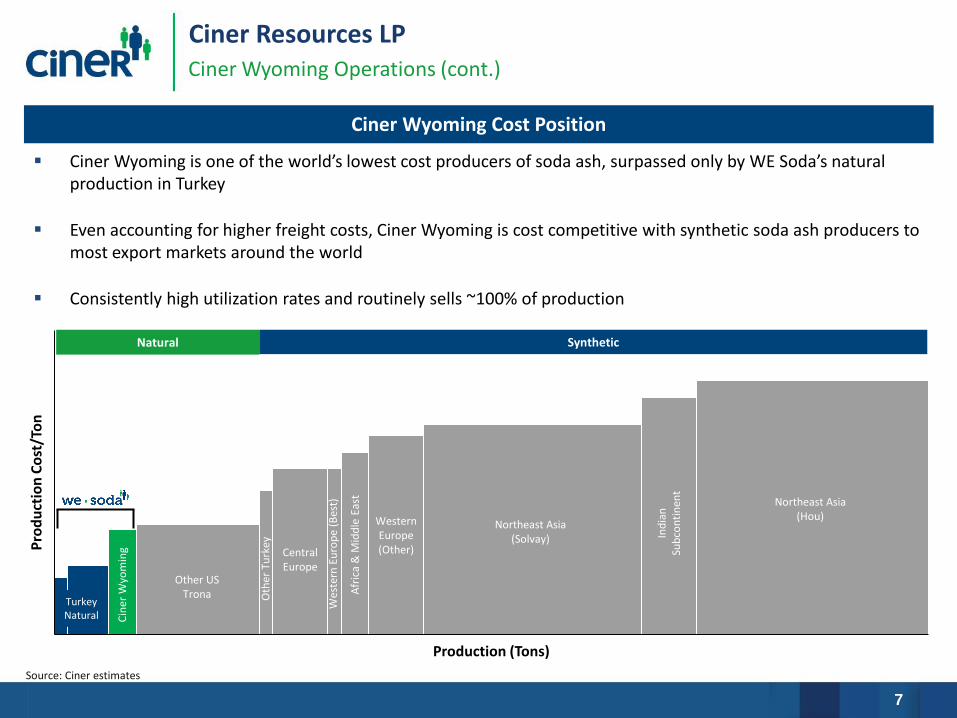
Ciner Wyoming Cost Position
▪ Ciner Wyoming is one of the world’s lowest cost producers of soda ash, surpassed only by WE Soda’s natural production in Turkey
▪ Even accounting for higher freight costs, Ciner Wyoming is cost competitive with synthetic soda ash producers to most export markets around the world
▪ Consistently high utilization rates and routinely sells ~100% of production
Turkey Natural
Other US Trona
Cin
er W
yom
ing Central
Europe
Oth
er T
urk
ey
Wes
tern
Eu
rop
e (B
est)
Afr
ica
& M
idd
le E
ast
Western Europe (Other)
Ind
ian
Su
bco
nti
nen
t
Northeast Asia (Hou)
Northeast Asia (Solvay)
Source: Ciner estimates
Natural Synthetic
8
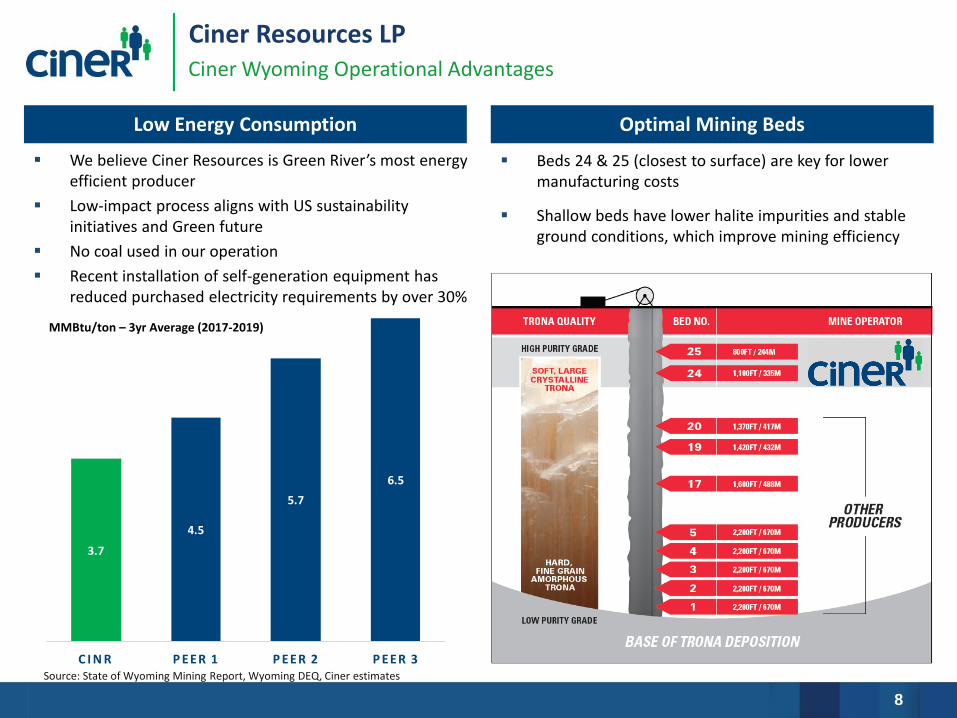
3.7
4.5
5.7
6.5
C I N R P EER 1 P EER 2 P EER 3
Ciner Resources LP
▪ We believe Ciner Resources is Green River’s most energy efficient producer
▪ Low-impact process aligns with US sustainability initiatives and Green future
▪ No coal used in our operation
▪ Recent installation of self-generation equipment has reduced purchased electricity requirements by over 30%
Ciner Wyoming Operational Advantages
Low Energy Consumption Optimal Mining Beds
MMBtu/ton – 3yr Average (2017-2019)
▪ Beds 24 & 25 (closest to surface) are key for lower manufacturing costs
▪ Shallow beds have lower halite impurities and stable ground conditions, which improve mining efficiency
Source: State of Wyoming Mining Report, Wyoming DEQ, Ciner estimates
9
Ciner Resources LPCiner Wyoming Operational Advantages (cont.)
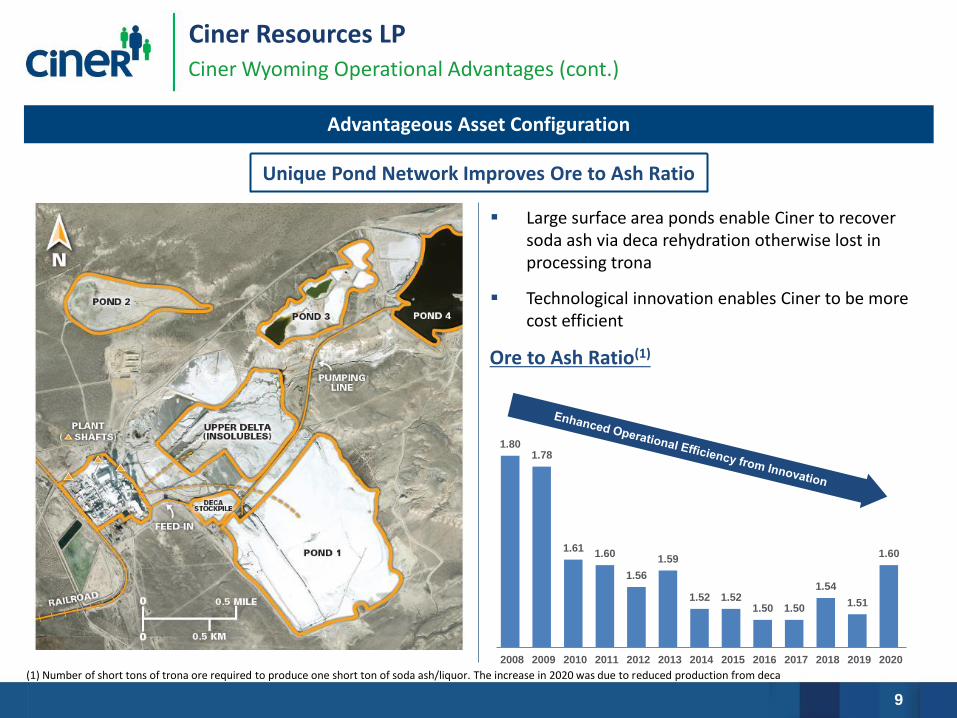
Unique Pond Network Improves Ore to Ash Ratio
▪ Large surface area ponds enable Ciner to recover soda ash via deca rehydration otherwise lost in processing trona
▪ Technological innovation enables Ciner to be more cost efficient
Ore to Ash Ratio(1)
1.801.78
1.611.60
1.56
1.59
1.52 1.521.50 1.50
1.54
1.51
1.60
2008 2009 2010 2011 2012 2013 2014 2015 2016 2017 2018 2019 2020
(1) Number of short tons of trona ore required to produce one short ton of soda ash/liquor. The increase in 2020 was due to reduced production from deca
Advantageous Asset Configuration
10
Ciner Resources LPSynergies with Parent Company
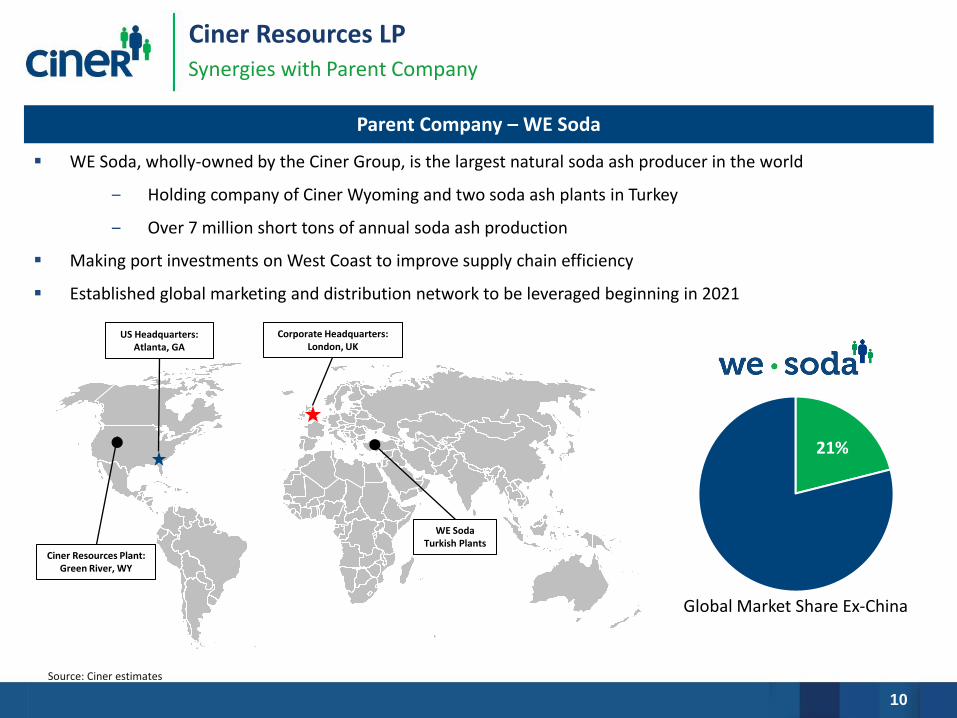
Parent Company – WE Soda
▪ WE Soda, wholly-owned by the Ciner Group, is the largest natural soda ash producer in the world
‒ Holding company of Ciner Wyoming and two soda ash plants in Turkey
‒ Over 7 million short tons of annual soda ash production
▪ Making port investments on West Coast to improve supply chain efficiency
▪ Established global marketing and distribution network to be leveraged beginning in 2021
21%
Global Market Share Ex-China
Corporate Headquarters: London, UK
US Headquarters: Atlanta, GA
Ciner Resources Plant: Green River, WY
WE Soda Turkish Plants
Source: Ciner estimates
11
Ciner Resources LPSynergies with Parent Company (cont.)
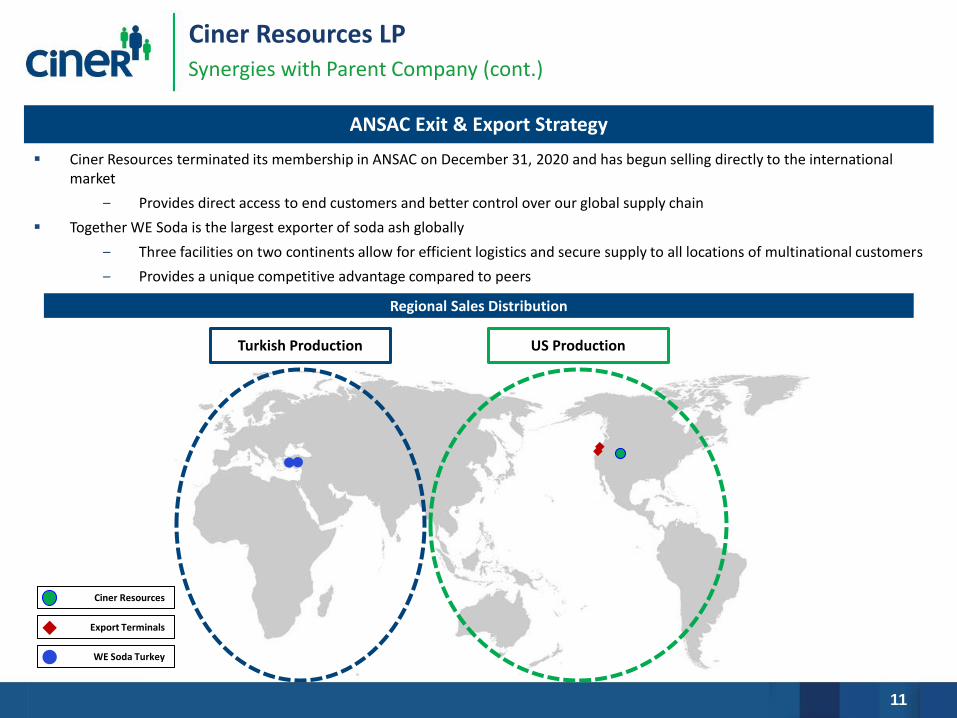
ANSAC Exit & Export Strategy
▪ Ciner Resources terminated its membership in ANSAC on December 31, 2020 and has begun selling directly to the international market
‒ Provides direct access to end customers and better control over our global supply chain
▪ Together WE Soda is the largest exporter of soda ash globally
‒ Three facilities on two continents allow for efficient logistics and secure supply to all locations of multinational customers
‒ Provides a unique competitive advantage compared to peers
WE Soda Turkey
Export Terminals
Ciner Resources
Turkish Production US Production
Regional Sales Distribution
12
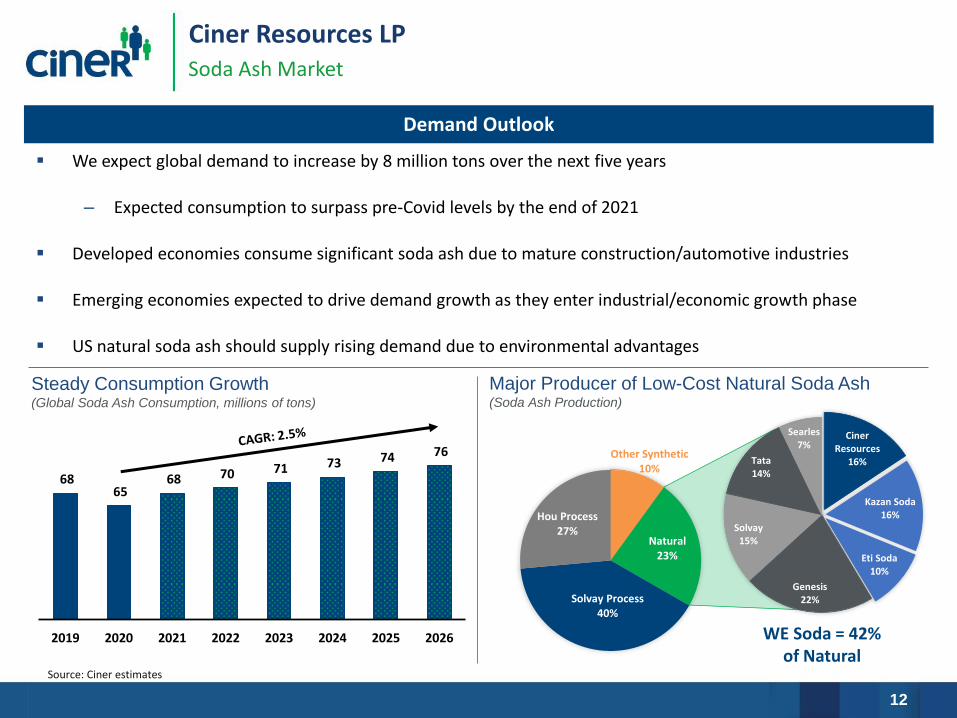
68 65
68 70 71 73 74 76
2019 2020 2021 2022 2023 2024 2025 2026
Ciner Resources LPSoda Ash Market
Steady Consumption Growth (Global Soda Ash Consumption, millions of tons)
Source: Ciner estimates
Major Producer of Low-Cost Natural Soda Ash(Soda Ash Production)
Other Synthetic10%
Natural23%
Solvay Process40%
Hou Process27%
WE Soda = 42% of Natural
Ciner Resources
16%
Kazan Soda16%
Eti Soda10%
Genesis22%
Solvay15%
Tata14%
Searles7%
▪ We expect global demand to increase by 8 million tons over the next five years
– Expected consumption to surpass pre-Covid levels by the end of 2021
▪ Developed economies consume significant soda ash due to mature construction/automotive industries
▪ Emerging economies expected to drive demand growth as they enter industrial/economic growth phase
▪ US natural soda ash should supply rising demand due to environmental advantages
Demand Outlook

13
$37.6
$31.8
$22.4
$2.8
$14.6
$21.8
$15.7 $16.3
709 695 664
426
540 591
720
650
0
100
200
300
400
500
600
700
800
$0
$10
$20
$30
$40
$50
Q3-19 Q4-19 Q1-20 Q2-20 Q3-20 Q4-20 Q1-21 Q2-21
Sale
s V
olu
me
(0
00
ST)
Ad
just
ed
EB
ITD
A (
$M
)
Ciner Resources LPImpact of COVID-19 & Growth Plans
▪ COVID-19 pandemic had significant negative impact on soda ash market, in contrast to historically stable results
– Exacerbated an oversupplied export market entering 2020, which drove pricing down
▪ Prudent cash management strategy required to ensure liquidity while navigating downturn
– Achieved $18M of operating cost savings in 2020
– Revised capital expenditure schedule
▪ Expect to refinance credit facility in 2H-2021
▪ Continue to target conservative capital structure
▪ Resumption of distribution will depend on market recovery, cash flow coverage, and capex schedule
COVID-19 Impact
Green River Expansion Project
Focus on Liquidity & Access to Capital
▪ Transformative growth project will provide long-term sustainable production
– 1 million ton new production facility
– Optimizes existing assets & modernizes systems
– Offsets ~200k ton production decline due to deca depletion
– Lowers overall cost of production per ton
▪ 2021 focus on desktop studies and value engineering
14
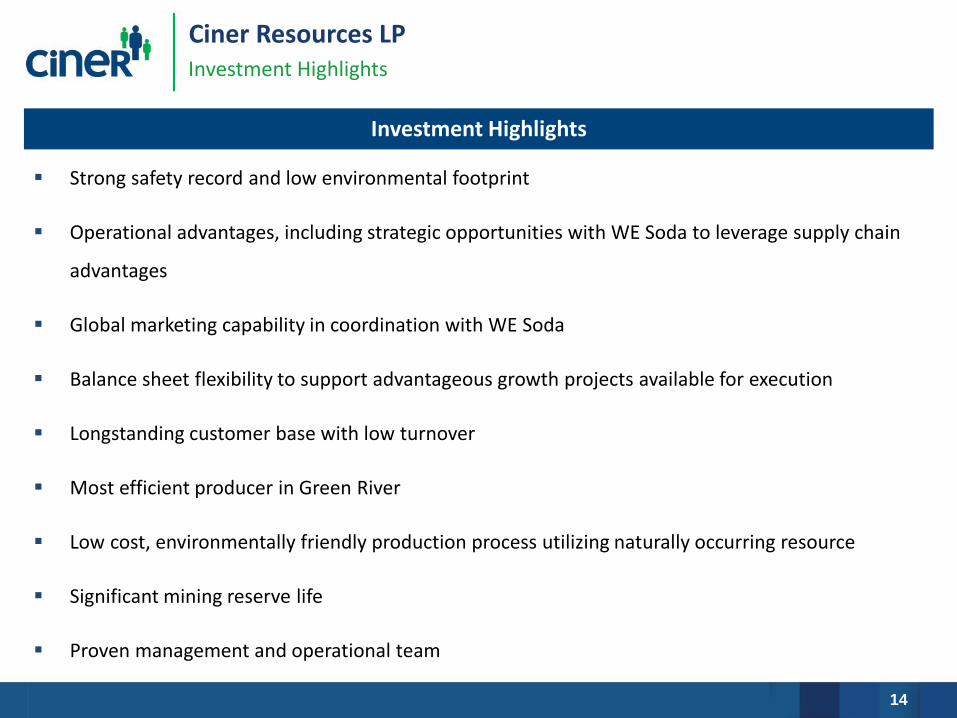
Ciner Resources LPInvestment Highlights
▪ Strong safety record and low environmental footprint
▪ Operational advantages, including strategic opportunities with WE Soda to leverage supply chain
advantages
▪ Global marketing capability in coordination with WE Soda
▪ Balance sheet flexibility to support advantageous growth projects available for execution
▪ Longstanding customer base with low turnover
▪ Most efficient producer in Green River
▪ Low cost, environmentally friendly production process utilizing naturally occurring resource
▪ Significant mining reserve life
▪ Proven management and operational team
Investment Highlights
Appendix
16
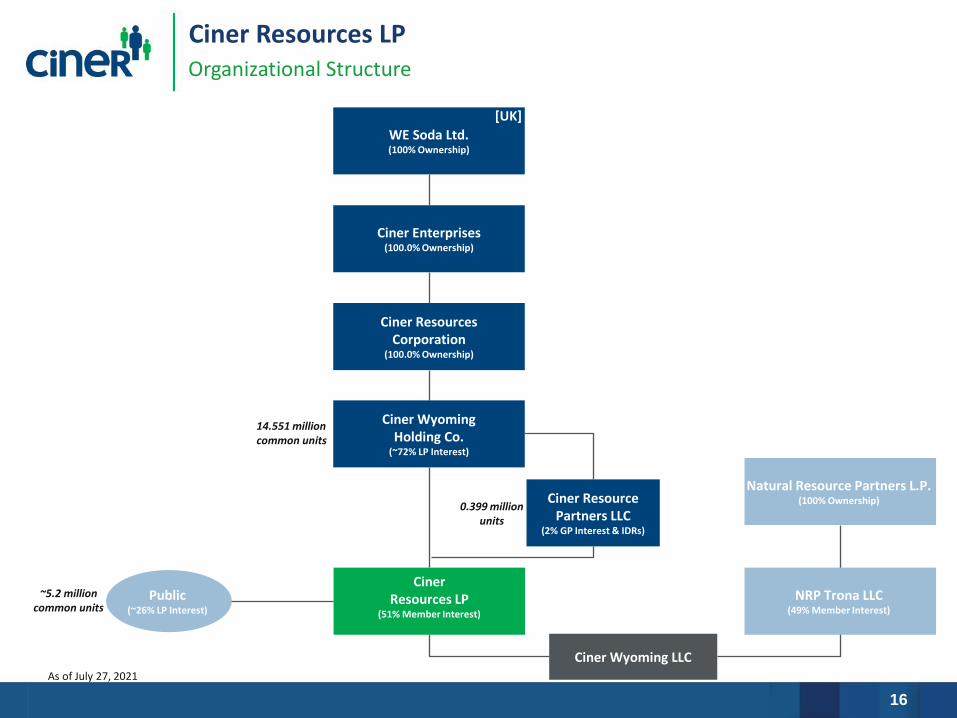
Ciner Resources LPOrganizational Structure
Ciner Resource Partners LLC
(2% GP Interest & IDRs)
Public (~26% LP Interest)
Ciner ResourcesCorporation
(100.0% Ownership)
Ciner Wyoming Holding Co.
(~72% LP Interest)
Ciner Wyoming LLC
Natural Resource Partners L.P.(100% Ownership)
0.399 million units
~5.2 millioncommon units
14.551 million common units
Ciner Resources LP
(51% Member Interest)
NRP Trona LLC(49% Member Interest)
Ciner Enterprises(100.0% Ownership)
WE Soda Ltd.(100% Ownership)
[UK]
As of July 27, 2021
17
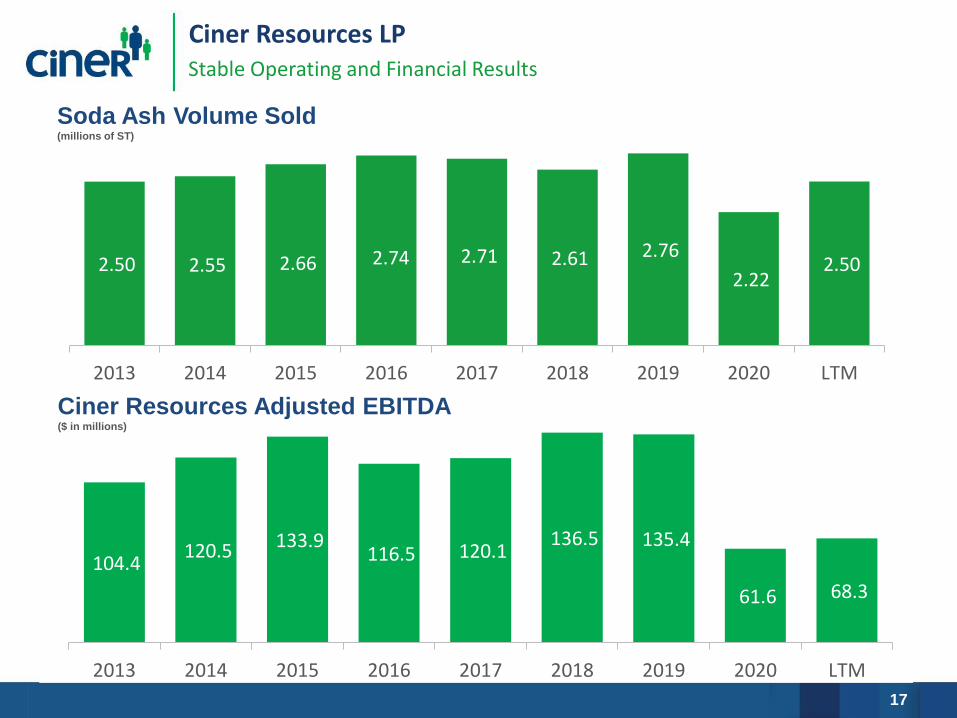
104.4 120.5 133.9
116.5 120.1 136.5 135.4
61.6 68.3
2013 2014 2015 2016 2017 2018 2019 2020 LTM
2.50 2.55 2.66 2.74 2.71 2.61 2.76
2.22 2.50
2013 2014 2015 2016 2017 2018 2019 2020 LTM
Ciner Resources LPStable Operating and Financial Results
Soda Ash Volume Sold (millions of ST)
Ciner Resources Adjusted EBITDA($ in millions)

18
Ciner Resources LPMarket Multiple Calculation
To properly account for the market value of the 49% minority interest in our Ciner Wyoming facility, we “gross up” the minority interest based on the trading value of CINR’s equity, as shown below:
$104$121
$134$117 $120
$137 $135
$62 $68
8.7x
9.3x
7.2x
10.5x9.2x
8.6x
5.9x
10.2x10.4x
0.0x
2.0x
4.0x
6.0x
8.0x
10.0x
12.0x
$0
$20
$40
$60
$80
$100
$120
$140
$160
FY-2013 FY-2014 FY-2015 FY-2016 FY-2017 FY-2018 FY-2019 FY-2020 LTM
EV /
EB
ITD
A M
ult
iple
CIN
R E
BIT
DA
($
M)
Market Capitalization & Enterprise ValueAs of June 30, 2021
Total Units Outstanding 20.2
Unit Price (6/30/2021) $14.50
Total Equity Value (100% CINR) $292.6
Implied Equity Value (51% Ciner Wyoming) $292.6
Plus: Minority Interest (49% Ciner Wyoming)¹ 281.1
Adjusted Equity Value (100% Ciner Wyoming) $573.7
Plus: Net Debt 133.6
Adjusted Enterprise Value $707.3
LTM Adj. EBITDA Multiple
$68.3 10.4x
(1) Calculated as Total CINR Equity Value / 51% * 49%
Enterprise Value/EBITDA
CINR Enterprise Value Calculation

19
Ciner Resources LPNon-GAAP Reconciliation
Ciner Resources LP
We define Adjusted EBITDA as net income (loss) plus net interest expense, income tax, depreciation and amortization, equity-based compensation and certain other expenses that are non-cash charges or that we
consider not to be indicative of ongoing operations. Adjusted EBITDA is a non-GAAP supplemental financial measure that management and external users of our consolidated financial statements, such as industry
analysts, investors, lenders and rating agencies, may use to assess:
• our operating performance as compared to other publicly traded partnerships in our industry, without regard to historical cost basis or, in the case of Adjusted EBITDA, financing methods;
• the ability of our assets to generate sufficient cash flow to make distributions to our unitholders;
• our ability to incur and service debt and fund capital expenditures; and
• the viability of capital expenditure projects and the returns on investment of various investment opportunities.
We believe that the presentation of Adjusted EBITDA, distributable cash flow and distribution coverage ratio provide useful information to investors in assessing our financial condition and results of operations. The
GAAP measures most directly comparable to Adjusted EBITDA are net income and net cash provided by operating activities. Our non-GAAP financial measures of Adjusted EBITDA should not be considered as
alternatives to GAAP net income, operating income, net cash provided by operating activities, or any other measure of financial performance or liquidity presented in accordance with GAAP. Adjusted EBITDA has
important limitations as analytical tools because it excludes some, but not all items that affect net income and net cash provided by operating activities. Investors should not consider Adjusted EBITDA in isolation or
as a substitute for analysis of our results as reported under GAAP. Because Adjusted EBITDA may be defined differently by other companies, including those in our industry, our definition of Adjusted EBITDA may
not be comparable to similarly titled measures of other companies, thereby diminishing its utility.
Non-GAAP Financial Measures
Quarter Ended 6/30/2021 Quarter Ended 6/30/2020
Net Income (Loss) $6.8 ($5.4)
Add:
Depreciation, depletion and amortization 7.7 6.5
Interest expense, net 1.5 1.4
Equity-based compensation, net of forfeitures 0.3 0.3
Adjusted EBITDA 16.3 2.8
Less: Adjusted EBITDA attributable to non-controlling interest 8.3 1.7
Adjusted EBITDA Attributable to Ciner Resources LP $8.0 $1.1

20
Ciner Resources LPNon-GAAP Reconciliation
Ciner Resources LP
Year Ended 12/31/2020 Year Ended 12/31/2019
Net Income $26.9 $101.6
Add:
Depreciation, depletion and amortization 28.8 26.9
Interest expense, net 5.2 5.5
Impairment and loss on disposal of assets, net ‒ 0.6
Equity Based Compensation 0.7 0.8
Adjusted EBITDA 61.6 135.4
Less: Adjusted EBITDA attributable to non-controlling interest 31.5 67.9
Adjusted EBITDA Attributable to Ciner Resources LP $30.1 $67.5
Non-GAAP Financial Measures
We define Adjusted EBITDA as net income (loss) plus net interest expense, income tax, depreciation and amortization, equity-based compensation and certain other expenses that are non-cash charges or that we
consider not to be indicative of ongoing operations. Adjusted EBITDA is a non-GAAP supplemental financial measure that management and external users of our consolidated financial statements, such as industry
analysts, investors, lenders and rating agencies, may use to assess:
• our operating performance as compared to other publicly traded partnerships in our industry, without regard to historical cost basis or, in the case of Adjusted EBITDA, financing methods;
• the ability of our assets to generate sufficient cash flow to make distributions to our unitholders;
• our ability to incur and service debt and fund capital expenditures; and
• the viability of capital expenditure projects and the returns on investment of various investment opportunities.
We believe that the presentation of Adjusted EBITDA, distributable cash flow and distribution coverage ratio provide useful information to investors in assessing our financial condition and results of operations. The
GAAP measures most directly comparable to Adjusted EBITDA are net income and net cash provided by operating activities. Our non-GAAP financial measures of Adjusted EBITDA should not be considered as
alternatives to GAAP net income, operating income, net cash provided by operating activities, or any other measure of financial performance or liquidity presented in accordance with GAAP. Adjusted EBITDA has
important limitations as analytical tools because it excludes some, but not all items that affect net income and net cash provided by operating activities. Investors should not consider Adjusted EBITDA in isolation or
as a substitute for analysis of our results as reported under GAAP. Because Adjusted EBITDA may be defined differently by other companies, including those in our industry, our definition of Adjusted EBITDA may
not be comparable to similarly titled measures of other companies, thereby diminishing its utility.

21
Ciner Resources LPCapital Structure
($ in millions)Facility
Size
Available
Liquidity
Ciner Wyoming Credit Facility 225.0 115.0
Available LiquidityCapitalization – Ciner Resources
($ in millions)As of
June 30, 2021
Cash and Cash Equivalents $2.5
Short Term Debt $3.0
Long Term Debt
Equipment Financing $23.0
Ciner Wyoming Revolving Credit Facility 110.0
Total Long Term Debt $133.0
Total Equity $320.8
Total Capitalization $459.3

22
Ciner Resources LPNon-GAAP Reconciliation Coverage Ratio
The following table presents a reconciliation of the non-GAAP financial measures of Adjusted EBITDA to GAAP financial measure of net income for the periods presented:

23
Ciner Resources LPIDR Structure
Marginal Percentage
Distribution per Unit
Range
Interest in Distributions (expressed as % of MQD)
LP Share GP Share From To
Initial Split 98% 2% 0% -- 115%
2nd Split 85% 15% 115% -- 125%
3rd Split 75% 25% 125% -- 150%
4th Split 50% 50% 150% -- above
CINR IDR Structure