Embed Size (px)
Citation preview
Quarterly Investor UpdateSprague Resources LP
March 14, 2018
Safe Harbor
2
Quarterly Investor Update: This presentation contains unaudited quarterly results which should not be taken as an indication of the results of operations
to be reported for any subsequent period or for the full fiscal year.
Forward-Looking Statements: Any statements about future expectations, plans and prospects for Sprague Resources LP or about Sprague Resources
LP’s future expectations, beliefs, goals, plans or prospects, constitute forward-looking statements within the meaning of Section 21E of the Securities
Exchange Act of 1934. Any statements that are not statements of historical fact (including statements containing the words “believes,” “plans,”
“anticipates,” “expects,” “estimates” and similar expressions) should also be considered forward-looking statements. These forward-looking statements
involve risks and uncertainties and other factors that are difficult to predict and many of which are beyond management’s control. Although Sprague
believes that the assumptions underlying these statements are reasonable, investors are cautioned that such forward-looking statements are inherently
uncertain and involve risks that may affect our business prospects and performance causing actual results to differ from those discussed in the foregoing
release. Such risks and uncertainties include, by way of example and not of limitation: increased competition for our products or services; adverse weather
conditions; changes in supply or demand for our products or services; nonperformance by major customers or suppliers; changes in operating conditions
and costs; changes in the level of environmental remediation spending; potential equipment malfunction and unexpected capital expenditures; our ability to
complete organic growth and acquisition projects; our ability to integrate acquired assets; potential labor issues; the legislative or regulatory environment;
terminal construction/repair delays; political and economic conditions; and, the impact of security risks including terrorism, international hostilities and
cyber-risk. These are not all of the important factors that could cause actual results to differ materially from those expressed in forward looking statements.
Other applicable risks and uncertainties have been described more fully in Sprague’s most recent Annual Report on Form 10-K filed with the U.S.
Securities and Exchange Commission (“SEC”) on March 14, 2018 and in the Partnership's subsequent Form 10-Q, Form 8-K and other documents filed
with the SEC. Sprague undertakes no obligation and does not intend to update any forward-looking statements to reflect new information or future events.
You are cautioned not to place undue reliance on these forward-looking statements, which speak only as of the date of this
press release.
Non-GAAP Measures: In this presentation, and in statements we make in connection with this presentation, we refer to certain historical and forward
looking financial measures not prepared in accordance with U.S. generally accepted accounting principles, or GAAP. Non-GAAP measures include
adjusted gross margin, EBITDA, adjusted EBITDA, distributable cash flow, distribution coverage ratio, permanent leverage ratio, and liquidity. For more
information on the non-GAAP measures used in this presentation, including definitions and reconciliations with comparable GAAP financial measures,
please refer to the Non-GAAP Measures in the Appendix at the end of this presentation.
Sprague Overview
3
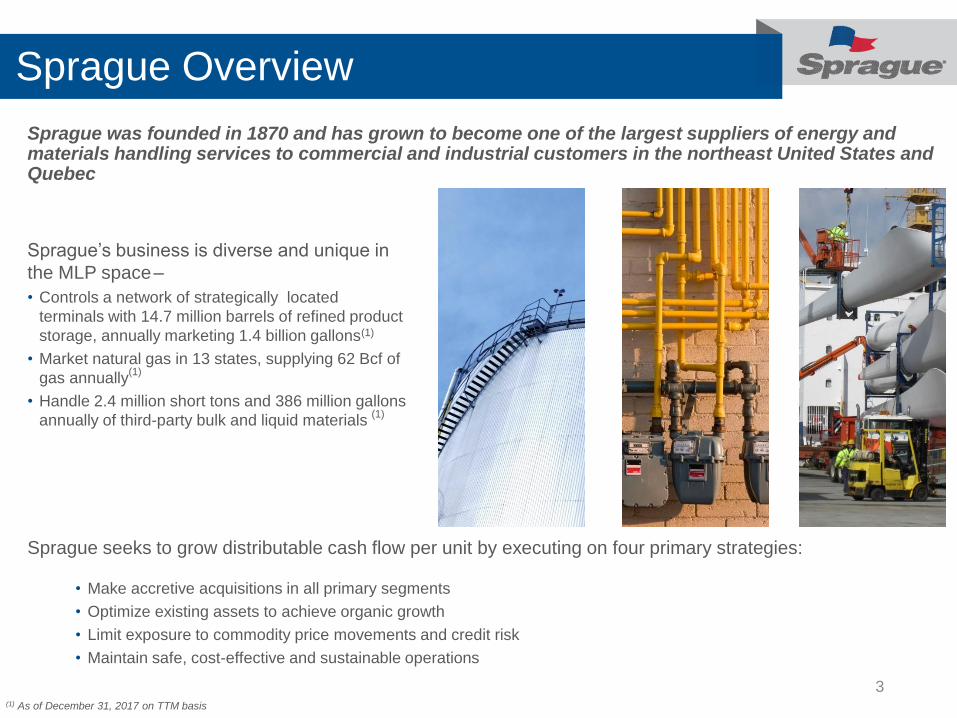
Sprague was founded in 1870 and has grown to become one of the largest suppliers of energy and materials handling services to commercial and industrial customers in the northeast United States and Quebec
Sprague’s business is diverse and unique in
the MLP space–
• Controls a network of strategically located
terminals with 14.7 million barrels of refined product
storage, annually marketing 1.4 billion gallons(1)
• Market natural gas in 13 states, supplying 62 Bcf of
gas annually(1)
• Handle 2.4 million short tons and 386 million gallons
annually of third-party bulk and liquid materials (1)
(1) As of December 31, 2017 on TTM basis
Sprague seeks to grow distributable cash flow per unit by executing on four primary strategies:
• Make accretive acquisitions in all primary segments
• Optimize existing assets to achieve organic growth
• Limit exposure to commodity price movements and credit risk
• Maintain safe, cost-effective and sustainable operations
Key Considerations
4
Terminaling, Logistics
and Marketing
Expertise
Contract-Based
Income with Upside
Potential
Financial Strength
Visible Growth
Prospects
(1) As of December 31, 2017 on a TTM basis. See Appendix for presentation of the most comparable GAAP financial measure and Non-GAAP reconciliations
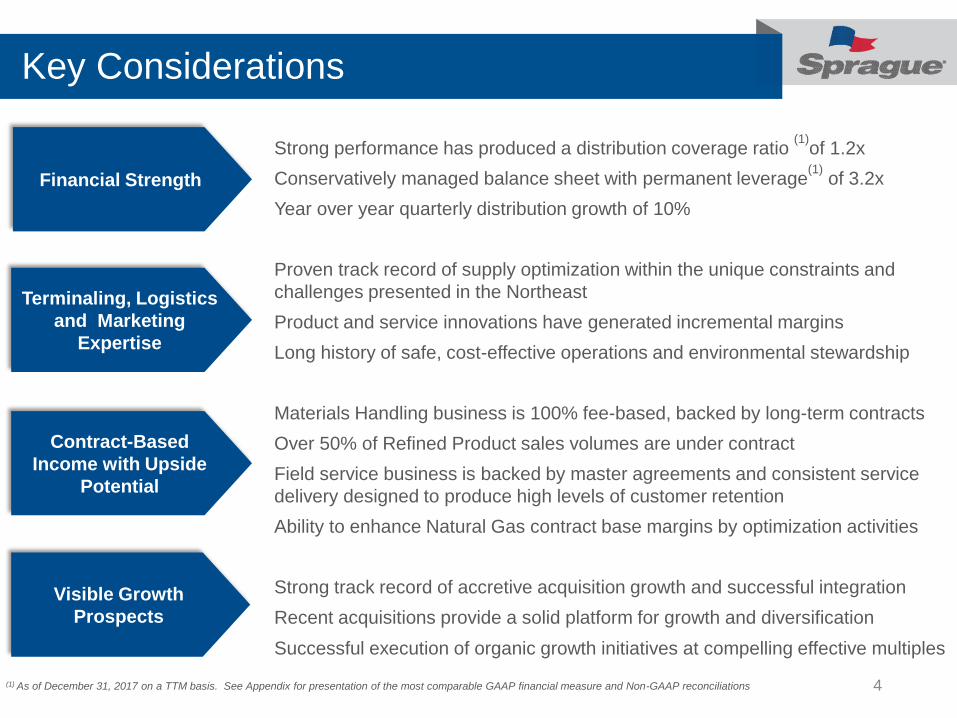
Strong performance has produced a distribution coverage ratio (1)
of 1.2x
Conservatively managed balance sheet with permanent leverage(1)
of 3.2x
Year over year quarterly distribution growth of 10%
Proven track record of supply optimization within the unique constraints and
challenges presented in the Northeast
Product and service innovations have generated incremental margins
Long history of safe, cost-effective operations and environmental stewardship
Materials Handling business is 100% fee-based, backed by long-term contracts
Over 50% of Refined Product sales volumes are under contract
Field service business is backed by master agreements and consistent service
delivery designed to produce high levels of customer retention
Ability to enhance Natural Gas contract base margins by optimization activities
Strong track record of accretive acquisition growth and successful integration
Recent acquisitions provide a solid platform for growth and diversification
Successful execution of organic growth initiatives at compelling effective multiples
Sprague’s History of Growth
5
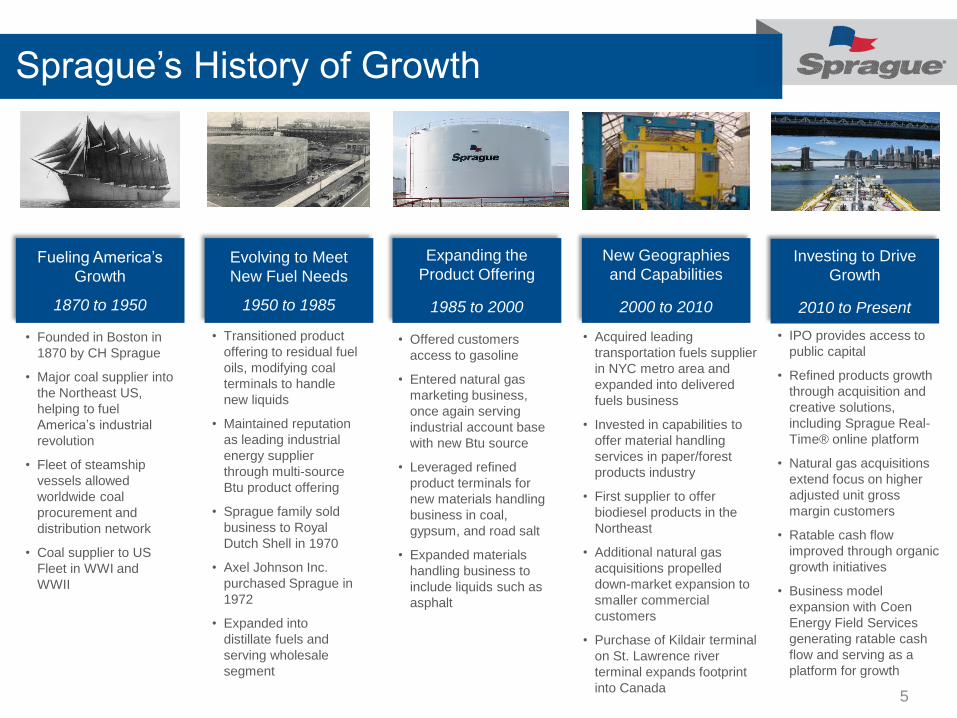
Investing to Drive
Growth
2010 to Present
• Acquired leading
transportation fuels supplier
in NYC metro area and
expanded into delivered
fuels business
• Invested in capabilities to
offer material handling
services in paper/forest
products industry
• First supplier to offer
biodiesel products in the
Northeast
• Additional natural gas
acquisitions propelled
down-market expansion to
smaller commercial
customers
• Purchase of Kildair terminal
on St. Lawrence river
terminal expands footprint
into Canada
• Transitioned product
offering to residual fuel
oils, modifying coal
terminals to handle
new liquids
• Maintained reputation
as leading industrial
energy supplier
through multi-source
Btu product offering
• Sprague family sold
business to Royal
Dutch Shell in 1970
• Axel Johnson Inc.
purchased Sprague in
1972
• Expanded into
distillate fuels and
serving wholesale
segment
• Offered customers
access to gasoline
• Entered natural gas
marketing business,
once again serving
industrial account base
with new Btu source
• Leveraged refined
product terminals for
new materials handling
business in coal,
gypsum, and road salt
• Expanded materials
handling business to
include liquids such as
asphalt
• Founded in Boston in
1870 by CH Sprague
• Major coal supplier into
the Northeast US,
helping to fuel
America’s industrial
revolution
• Fleet of steamship
vessels allowed
worldwide coal
procurement and
distribution network
• Coal supplier to US
Fleet in WWI and
WWII
Fueling America’s
Growth
1870 to 1950
Evolving to Meet
New Fuel Needs
1950 to 1985
Expanding the
Product Offering
1985 to 2000
New Geographies
and Capabilities
2000 to 2010
• IPO provides access to
public capital
• Refined products growth
through acquisition and
creative solutions,
including Sprague Real-
Time® online platform
• Natural gas acquisitions
extend focus on higher
adjusted unit gross
margin customers
• Ratable cash flow
improved through organic
growth initiatives
• Business model
expansion with Coen
Energy Field Services
generating ratable cash
flow and serving as a
platform for growth
Sprague Acquisition History
6
2013 2014 2015 2016 2017
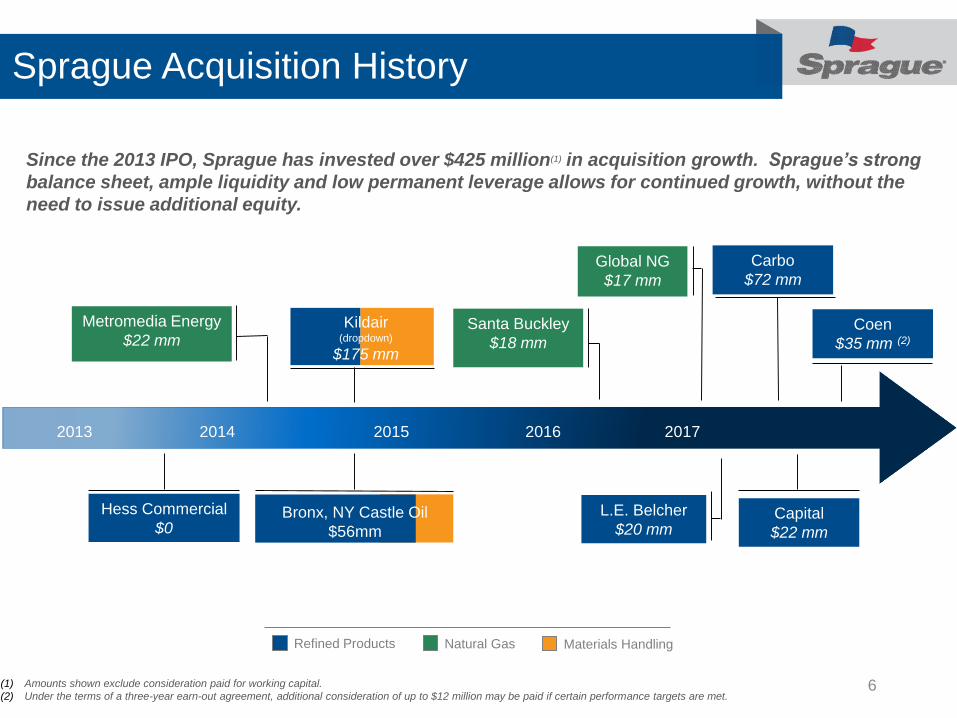
Since the 2013 IPO, Sprague has invested over $425 million(1) in acquisition growth. Sprague’s strong
balance sheet, ample liquidity and low permanent leverage allows for continued growth, without the
need to issue additional equity.
Refined Products Natural Gas Materials Handling
Metromedia Energy
$22 mm
Hess Commercial
$0
Kildair(dropdown)
$175 mm
(1) Amounts shown exclude consideration paid for working capital.
(2) Under the terms of a three-year earn-out agreement, additional consideration of up to $12 million may be paid if certain performance targets are met.
Santa Buckley
$18 mm
Global NG
$17 mm
L.E. Belcher
$20 mm
Carbo
$72 mm
Capital
$22 mm
Bronx, NY Castle Oil
$56mm
Coen
$35 mm (2)
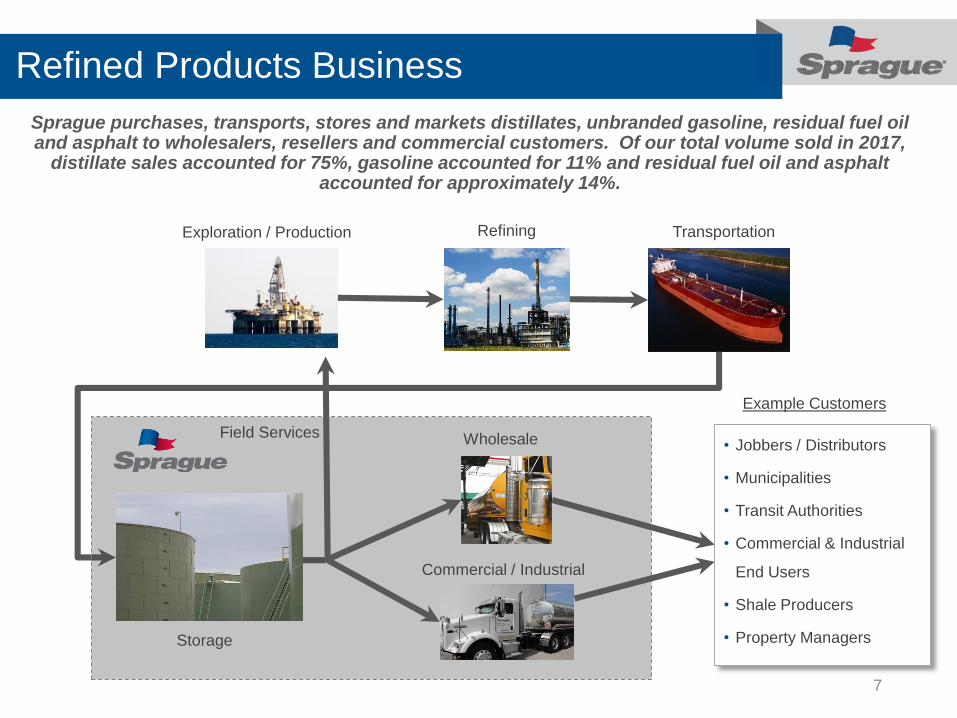
Refined Products Business
7
Sprague purchases, transports, stores and markets distillates, unbranded gasoline, residual fuel oil and asphalt to wholesalers, resellers and commercial customers. Of our total volume sold in 2017,
distillate sales accounted for 75%, gasoline accounted for 11% and residual fuel oil and asphalt accounted for approximately 14%.
Storage
Exploration / Production Refining Transportation
Example Customers
• Jobbers / Distributors
• Municipalities
• Transit Authorities
• Commercial & Industrial
End Users
• Shale Producers
• Property Managers
Commercial / Industrial
WholesaleField Services
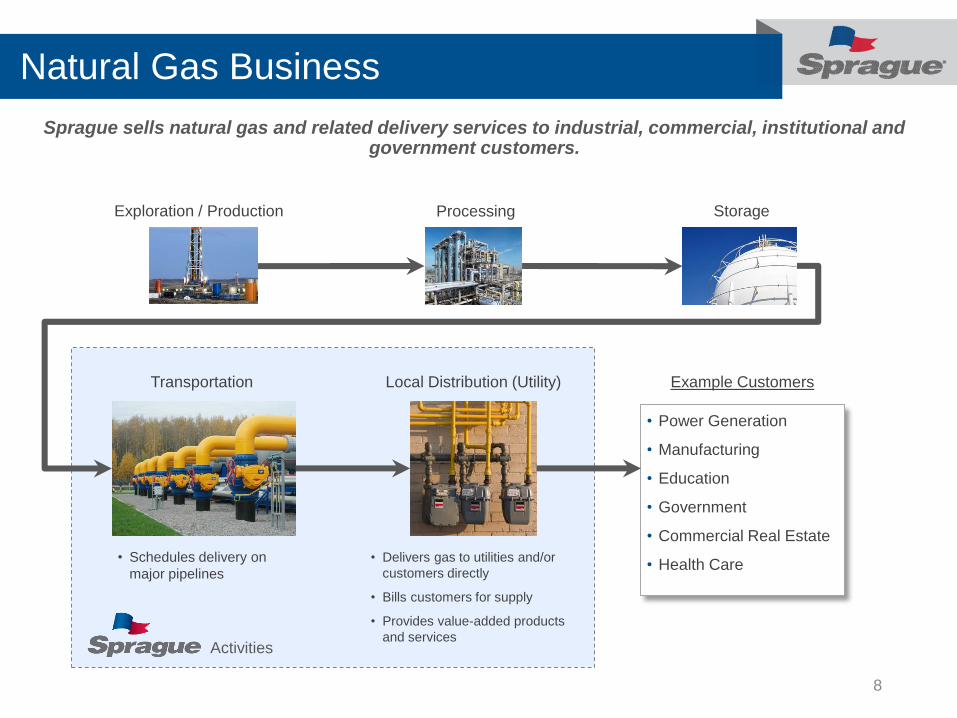
Natural Gas Business
8
• Power Generation
• Manufacturing
• Education
• Government
• Commercial Real Estate
• Health Care
Exploration / Production Processing
Transportation
Storage
Local Distribution (Utility) Example Customers
• Schedules delivery on
major pipelines
• Delivers gas to utilities and/or
customers directly
• Bills customers for supply
• Provides value-added products
and servicesActivities
Sprague sells natural gas and related delivery services to industrial, commercial, institutional and government customers.
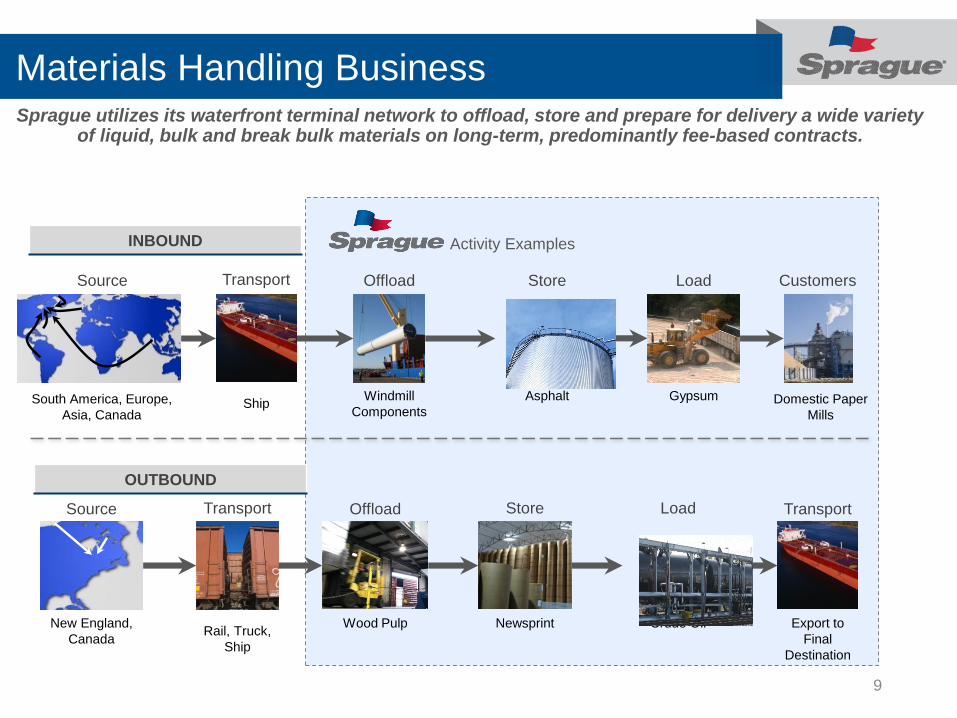
Materials Handling Business
9
Offload
Wood Pulp
Offload
Windmill
Components
Store
Asphalt
Rail, Truck,
Ship
Store
Newsprint
Source
New England,
Canada
Source
South America, Europe,
Asia, Canada
Customers
Domestic Paper
Mills
Transport
Ship
Transport
Export to
Final
Destination
Load
Crude Oil
Load
Gypsum
Transport
Activity ExamplesINBOUND
OUTBOUND
Sprague utilizes its waterfront terminal network to offload, store and prepare for delivery a wide variety of liquid, bulk and break bulk materials on long-term, predominantly fee-based contracts.
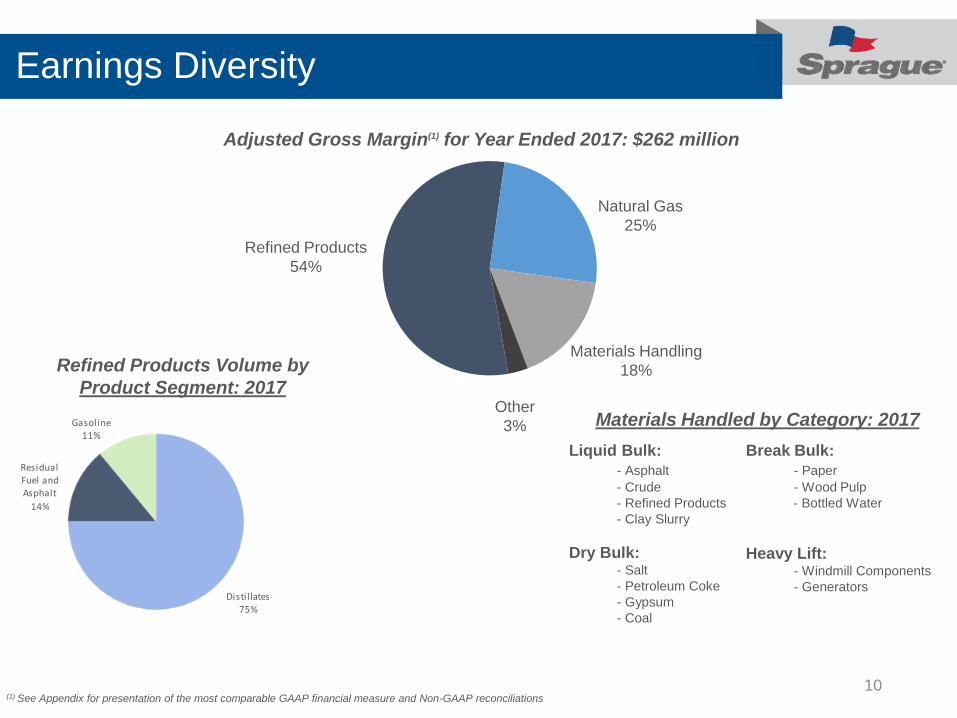
Earnings Diversity
10
Distil lates 75%
Gasoline 11%
Residual Fuel and Asphalt
14%
Adjusted Gross Margin(1) for Year Ended 2017: $262 million
Refined Products Volume by
Product Segment: 2017
Materials Handled by Category: 2017
Refined Products
54%
Natural Gas
25%
Materials Handling
18%
Other
3%
Liquid Bulk:
- Asphalt
- Crude
- Refined Products
- Clay Slurry
Dry Bulk:- Salt
- Petroleum Coke
- Gypsum
- Coal
Break Bulk:
- Paper
- Wood Pulp
- Bottled Water
Heavy Lift:- Windmill Components
- Generators
(1) See Appendix for presentation of the most comparable GAAP financial measure and Non-GAAP reconciliations
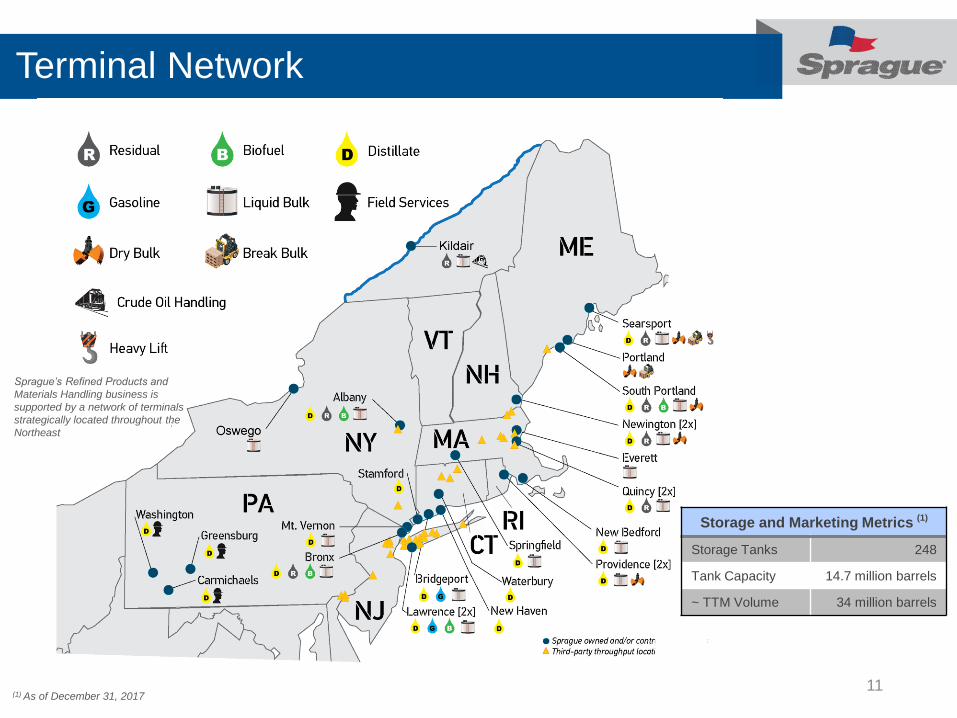
Terminal Network
11(1) As of December 31, 2017
Storage and Marketing Metrics (1)
Storage Tanks 248
Tank Capacity 14.7 million barrels
~ TTM Volume 34 million barrels
Sprague’s Refined Products and
Materials Handling business is
supported by a network of terminals
strategically located throughout the
Northeast
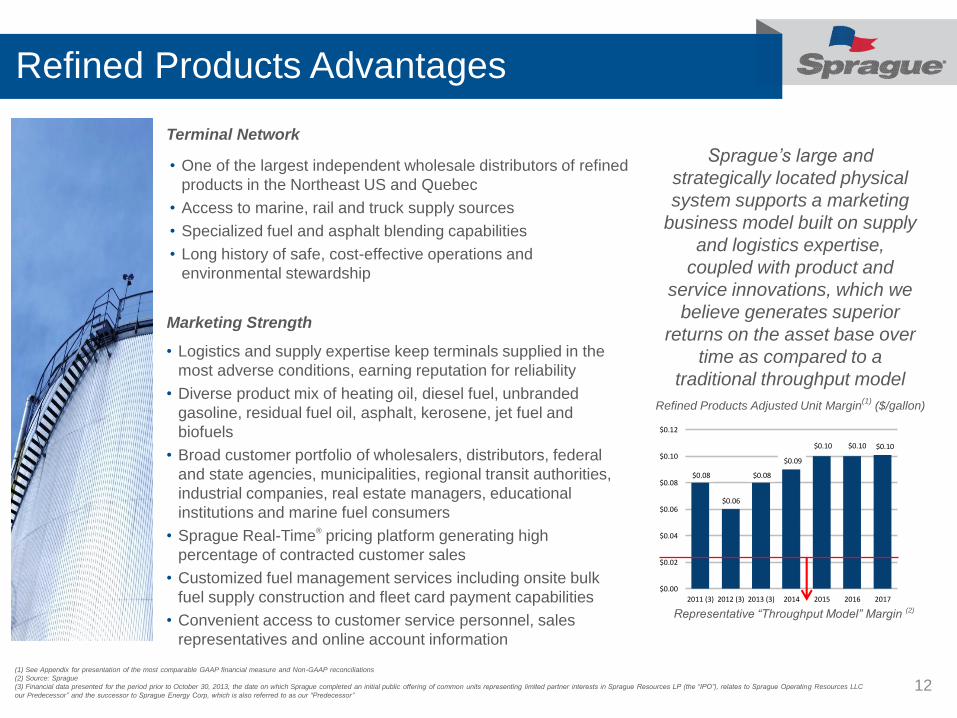
Refined Products Advantages
12
$0.08
$0.06
$0.08
$0.09
$0.10 $0.10 $0.10
$0.00
$0.02
$0.04
$0.06
$0.08
$0.10
$0.12
2011 (3) 2012 (3) 2013 (3) 2014 2015 2016 2017
• One of the largest independent wholesale distributors of refined
products in the Northeast US and Quebec
• Access to marine, rail and truck supply sources
• Specialized fuel and asphalt blending capabilities
• Long history of safe, cost-effective operations and
environmental stewardship
Terminal Network
Marketing Strength
• Logistics and supply expertise keep terminals supplied in the
most adverse conditions, earning reputation for reliability
• Diverse product mix of heating oil, diesel fuel, unbranded
gasoline, residual fuel oil, asphalt, kerosene, jet fuel and
biofuels
• Broad customer portfolio of wholesalers, distributors, federal
and state agencies, municipalities, regional transit authorities,
industrial companies, real estate managers, educational
institutions and marine fuel consumers
• Sprague Real-Time®
pricing platform generating high
percentage of contracted customer sales
• Customized fuel management services including onsite bulk
fuel supply construction and fleet card payment capabilities
• Convenient access to customer service personnel, sales
representatives and online account information
Refined Products Adjusted Unit Margin(1)
($/gallon)
Representative “Throughput Model” Margin (2)
Sprague’s large and
strategically located physical
system supports a marketing
business model built on supply
and logistics expertise,
coupled with product and
service innovations, which we
believe generates superior
returns on the asset base over
time as compared to a
traditional throughput model
(1) See Appendix for presentation of the most comparable GAAP financial measure and Non-GAAP reconciliations
(2) Source: Sprague
(3) Financial data presented for the period prior to October 30, 2013, the date on which Sprague completed an initial public offering of common units representing limited partner interests in Sprague Resources LP (the “IPO”), relates to Sprague Operating Resources LLC
our Predecessor” and the successor to Sprague Energy Corp, which is also referred to as our “Predecessor”
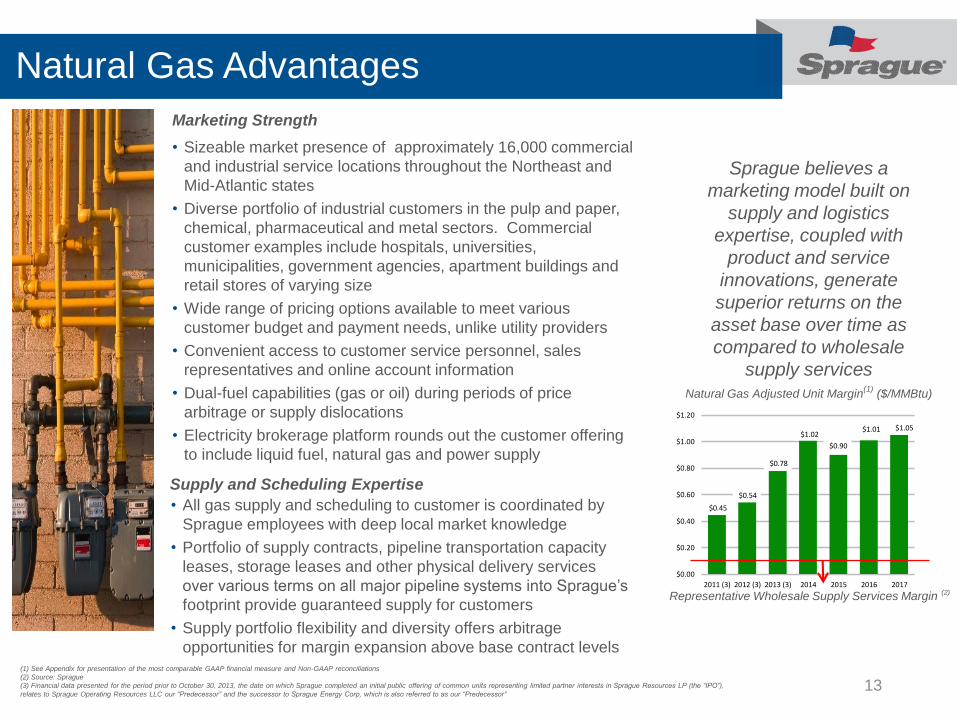
Natural Gas Advantages
13
$0.45
$0.54
$0.78
$1.02
$0.90
$1.01 $1.05
$0.00
$0.20
$0.40
$0.60
$0.80
$1.00
$1.20
2011 (3) 2012 (3) 2013 (3) 2014 2015 2016 2017
• Sizeable market presence of approximately 16,000 commercial
and industrial service locations throughout the Northeast and
Mid-Atlantic states
• Diverse portfolio of industrial customers in the pulp and paper,
chemical, pharmaceutical and metal sectors. Commercial
customer examples include hospitals, universities,
municipalities, government agencies, apartment buildings and
retail stores of varying size
• Wide range of pricing options available to meet various
customer budget and payment needs, unlike utility providers
• Convenient access to customer service personnel, sales
representatives and online account information
• Dual-fuel capabilities (gas or oil) during periods of price
arbitrage or supply dislocations
• Electricity brokerage platform rounds out the customer offering
to include liquid fuel, natural gas and power supply
Marketing Strength
Supply and Scheduling Expertise
• All gas supply and scheduling to customer is coordinated by
Sprague employees with deep local market knowledge
• Portfolio of supply contracts, pipeline transportation capacity
leases, storage leases and other physical delivery services
over various terms on all major pipeline systems into Sprague’s
footprint provide guaranteed supply for customers
• Supply portfolio flexibility and diversity offers arbitrage
opportunities for margin expansion above base contract levels
Sprague believes a
marketing model built on
supply and logistics
expertise, coupled with
product and service
innovations, generate
superior returns on the
asset base over time as
compared to wholesale
supply services
Natural Gas Adjusted Unit Margin(1)
($/MMBtu)
Representative Wholesale Supply Services Margin (2)
(1) See Appendix for presentation of the most comparable GAAP financial measure and Non-GAAP reconciliations
(2) Source: Sprague
(3) Financial data presented for the period prior to October 30, 2013, the date on which Sprague completed an initial public offering of common units representing limited partner interests in Sprague Resources LP (the “IPO”),
relates to Sprague Operating Resources LLC our “Predecessor” and the successor to Sprague Energy Corp, which is also referred to as our “Predecessor”
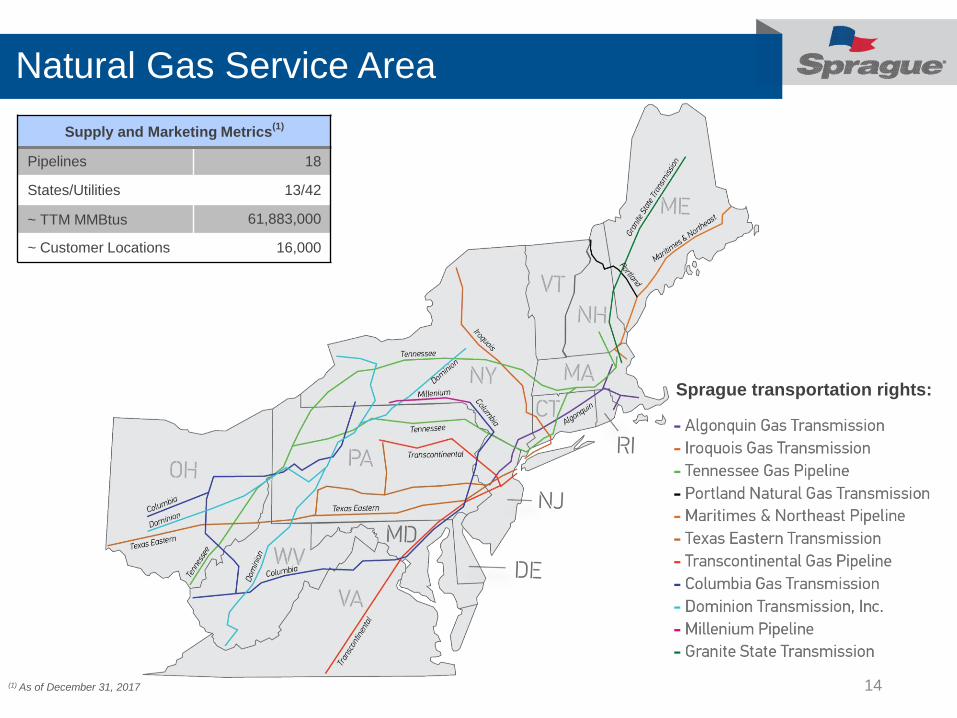
Natural Gas Service Area
14
Sprague transportation rights:
(1) As of December 31, 2017
Supply and Marketing Metrics(1)
Pipelines 18
States/Utilities 13/42
~ TTM MMBtus 61,883,000
~ Customer Locations 16,000
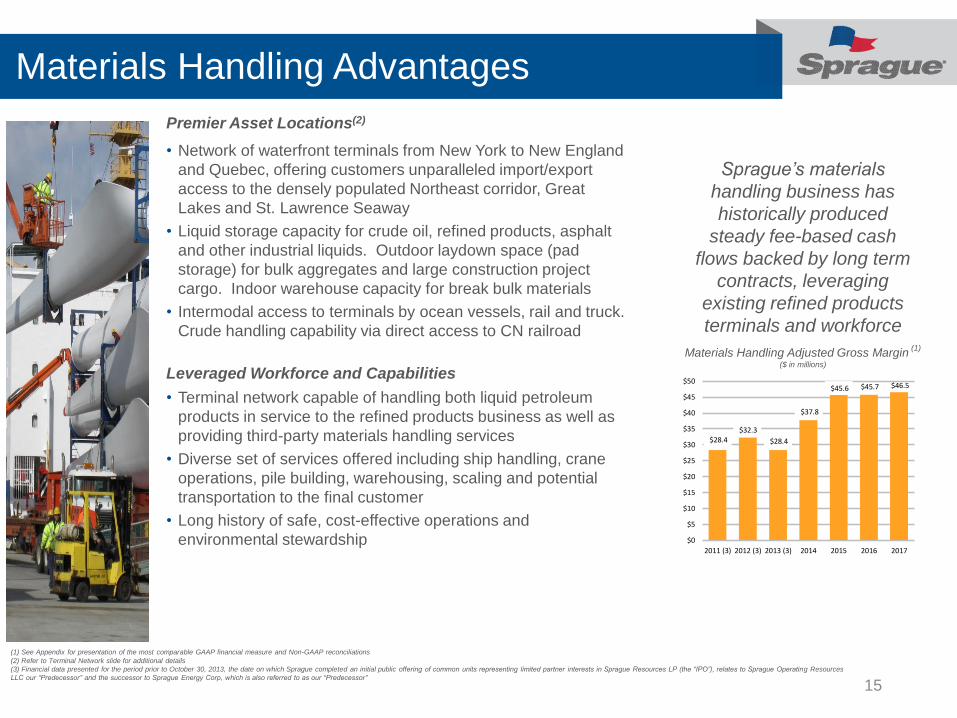
Materials Handling Advantages
15
Sprague’s materials
handling business has
historically produced
steady fee-based cash
flows backed by long term
contracts, leveraging
existing refined products
terminals and workforce
Materials Handling Adjusted Gross Margin(1)
($ in millions)
• Network of waterfront terminals from New York to New England
and Quebec, offering customers unparalleled import/export
access to the densely populated Northeast corridor, Great
Lakes and St. Lawrence Seaway
• Liquid storage capacity for crude oil, refined products, asphalt
and other industrial liquids. Outdoor laydown space (pad
storage) for bulk aggregates and large construction project
cargo. Indoor warehouse capacity for break bulk materials
• Intermodal access to terminals by ocean vessels, rail and truck.
Crude handling capability via direct access to CN railroad
Premier Asset Locations(2)
Leveraged Workforce and Capabilities
• Terminal network capable of handling both liquid petroleum
products in service to the refined products business as well as
providing third-party materials handling services
• Diverse set of services offered including ship handling, crane
operations, pile building, warehousing, scaling and potential
transportation to the final customer
• Long history of safe, cost-effective operations and
environmental stewardship
$28.4 $32.3
$28.4
$37.8
$45.6 $45.7 $46.5
$0
$5
$10
$15
$20
$25
$30
$35
$40
$45
$50
2011 (3) 2012 (3) 2013 (3) 2014 2015 2016 2017
(1) See Appendix for presentation of the most comparable GAAP financial measure and Non-GAAP reconciliations
(2) Refer to Terminal Network slide for additional details
(3) Financial data presented for the period prior to October 30, 2013, the date on which Sprague completed an initial public offering of common units representing limited partner interests in Sprague Resources LP (the “IPO”), relates to Sprague Operating Resources
LLC our “Predecessor” and the successor to Sprague Energy Corp, which is also referred to as our “Predecessor”
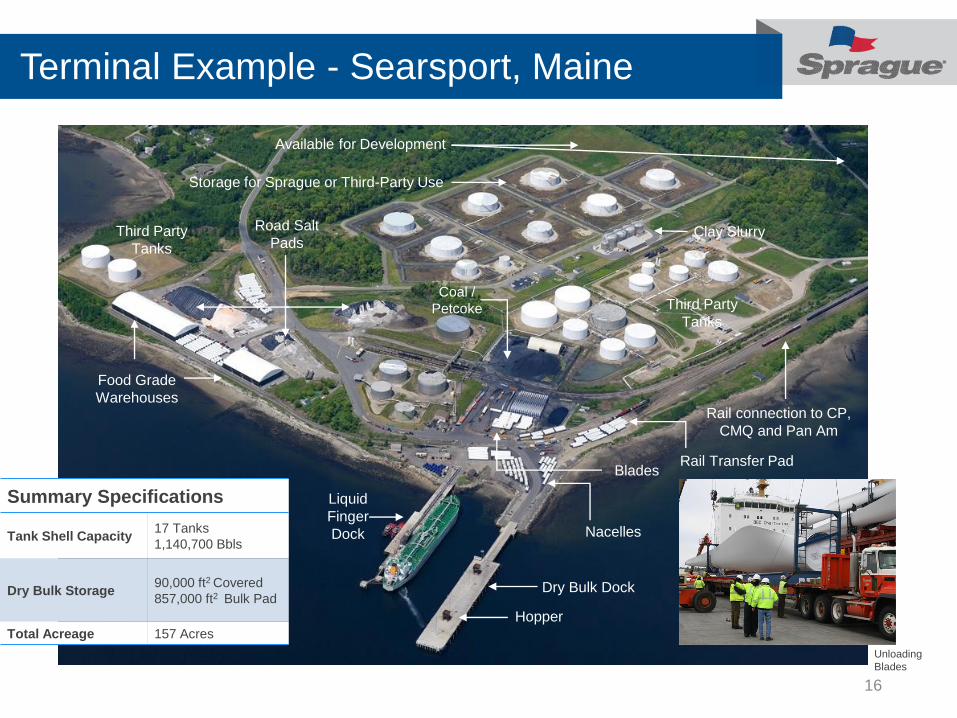
Terminal Example - Searsport, Maine
16
Liquid Finger
Dock
Rail Transfer Pad
Nacelles
Road Salt
PadsClay Slurry
Rail connection to CP,
CMQ and Pan Am
Liquid
Finger
Dock
Dry Bulk Dock
Food Grade
Warehouses
Available for Development
Blades
Hopper
Coal /
Petcoke Third Party
Tanks
Third Party
Tanks
Storage for Sprague or Third-Party Use
Summary Specifications
Tank Shell Capacity17 Tanks
1,140,700 Bbls
Dry Bulk Storage90,000 ft2 Covered
857,000 ft2 Bulk Pad
Total Acreage 157 Acres
Unloading
Blades
L.E. Belcher Terminal – Refined Products
17
Terms
• On 2/1/2017, Sprague completed the purchase of the Springfield, MA refined product terminal assets and associated
wholesale/commercial fuels businesses of L.E. Belcher, Inc.
• Purchase price of $20 million(2) in cash, funded with cash on hand and credit facility borrowings
Asset overview
• Two distillate terminals and one distillate storage facility in Springfield, MA with 283,000 barrels of combined capacity
• Largest distillate storage capacity in key I-91 corridor market
• Pipeline supplied terminals from New Haven harbor, offering opportunity to leverage Sprague’s logistics expertise
• Wholesale and commercial businesses will extend and strengthen Sprague brand in core Northeast market through
proprietary distillate marketing opportunities
• Assets and associated businesses expected to generate approximately $3 to $4 million in adjusted EBITDA(1) annually
(1) See Appendix for presentation of the most comparable GAAP financial measure and Non-GAAP reconciliations (2) Excludes consideration paid for working capital
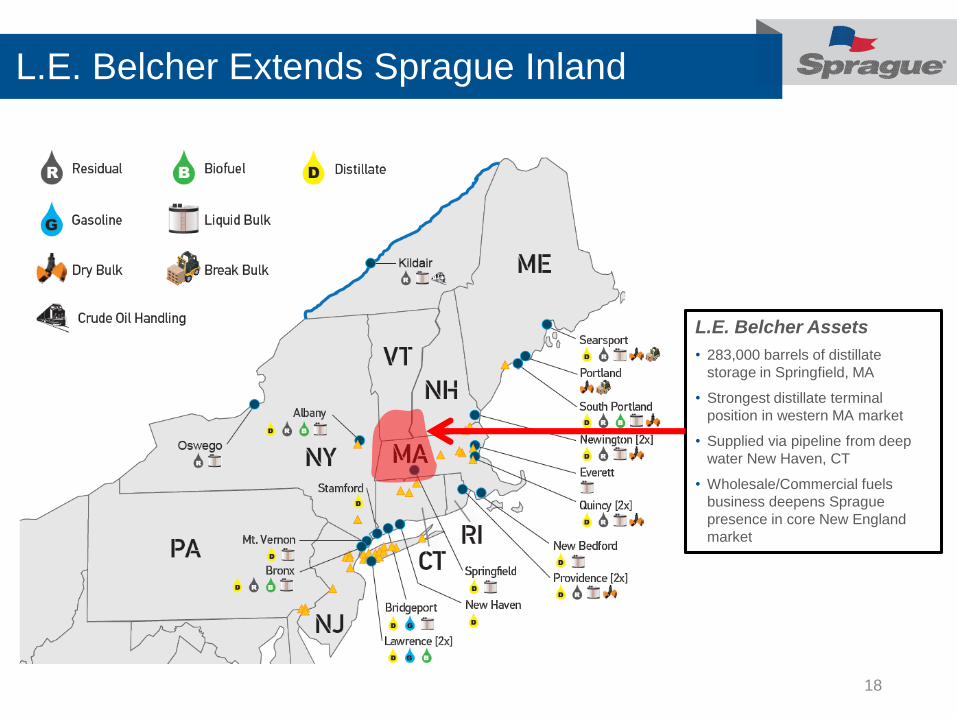
L.E. Belcher Extends Sprague Inland
18
(3)
L.E. Belcher Assets
• 283,000 barrels of distillate
storage in Springfield, MA
• Strongest distillate terminal
position in western MA market
• Supplied via pipeline from deep
water New Haven, CT
• Wholesale/Commercial fuels
business deepens Sprague
presence in core New England
market
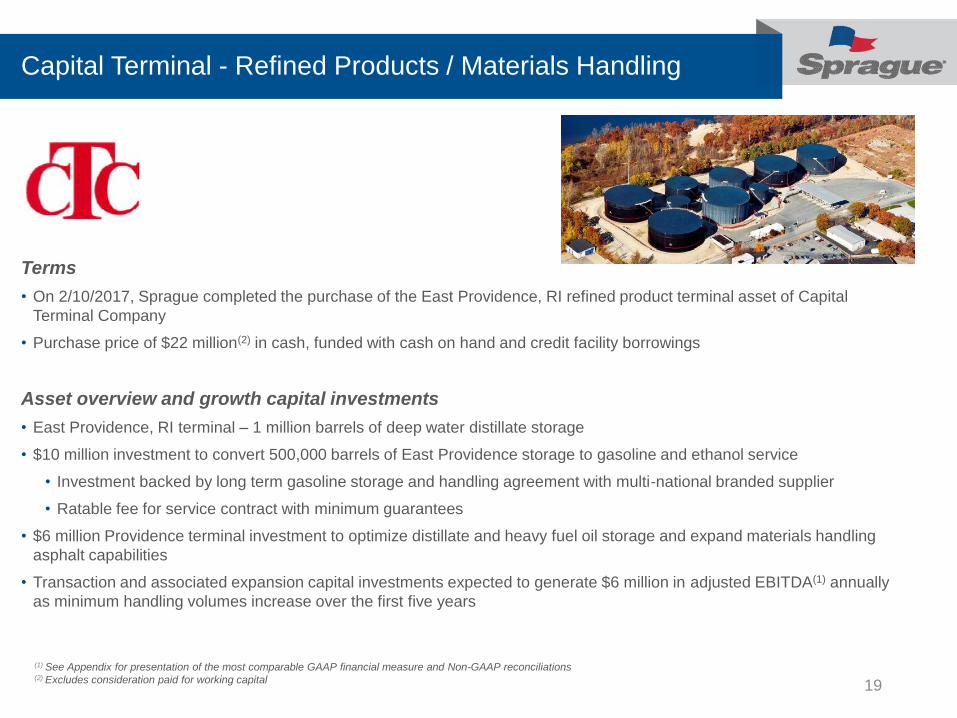
Capital Terminal - Refined Products / Materials Handling
19
Terms
• On 2/10/2017, Sprague completed the purchase of the East Providence, RI refined product terminal asset of Capital
Terminal Company
• Purchase price of $22 million(2) in cash, funded with cash on hand and credit facility borrowings
Asset overview and growth capital investments
• East Providence, RI terminal – 1 million barrels of deep water distillate storage
• $10 million investment to convert 500,000 barrels of East Providence storage to gasoline and ethanol service
• Investment backed by long term gasoline storage and handling agreement with multi-national branded supplier
• Ratable fee for service contract with minimum guarantees
• $6 million Providence terminal investment to optimize distillate and heavy fuel oil storage and expand materials handling
asphalt capabilities
• Transaction and associated expansion capital investments expected to generate $6 million in adjusted EBITDA(1) annually
as minimum handling volumes increase over the first five years
(1) See Appendix for presentation of the most comparable GAAP financial measure and Non-GAAP reconciliations (2) Excludes consideration paid for working capital
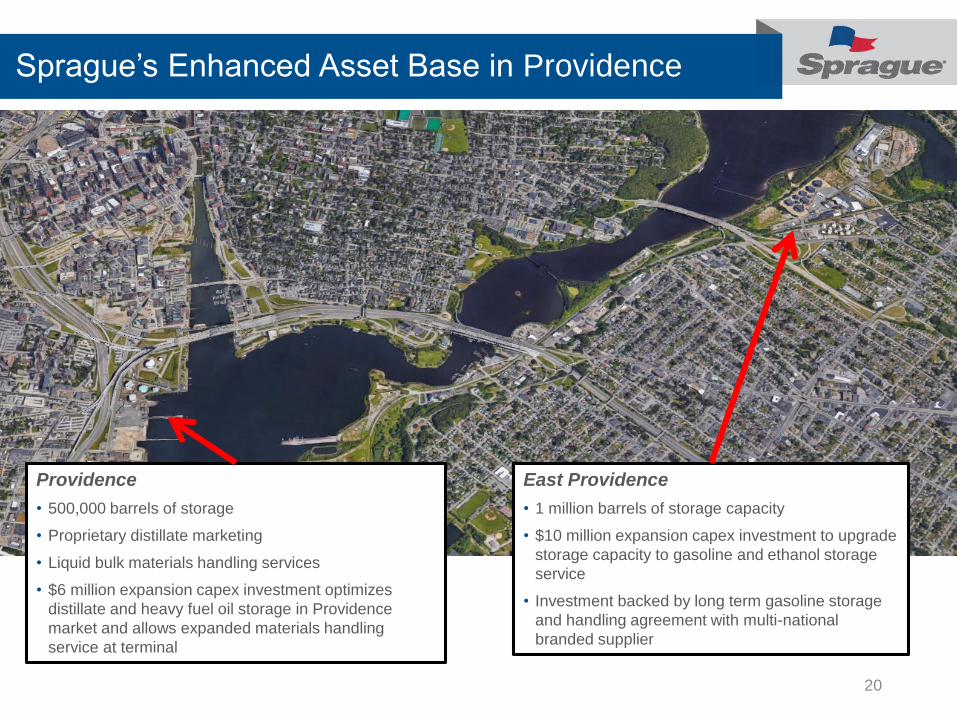
Sprague’s Enhanced Asset Base in Providence
20
Providence
• 500,000 barrels of storage
• Proprietary distillate marketing
• Liquid bulk materials handling services
• $6 million expansion capex investment optimizes
distillate and heavy fuel oil storage in Providence
market and allows expanded materials handling
service at terminal
East Providence
• 1 million barrels of storage capacity
• $10 million expansion capex investment to upgrade
storage capacity to gasoline and ethanol storage
service
• Investment backed by long term gasoline storage
and handling agreement with multi-national
branded supplier
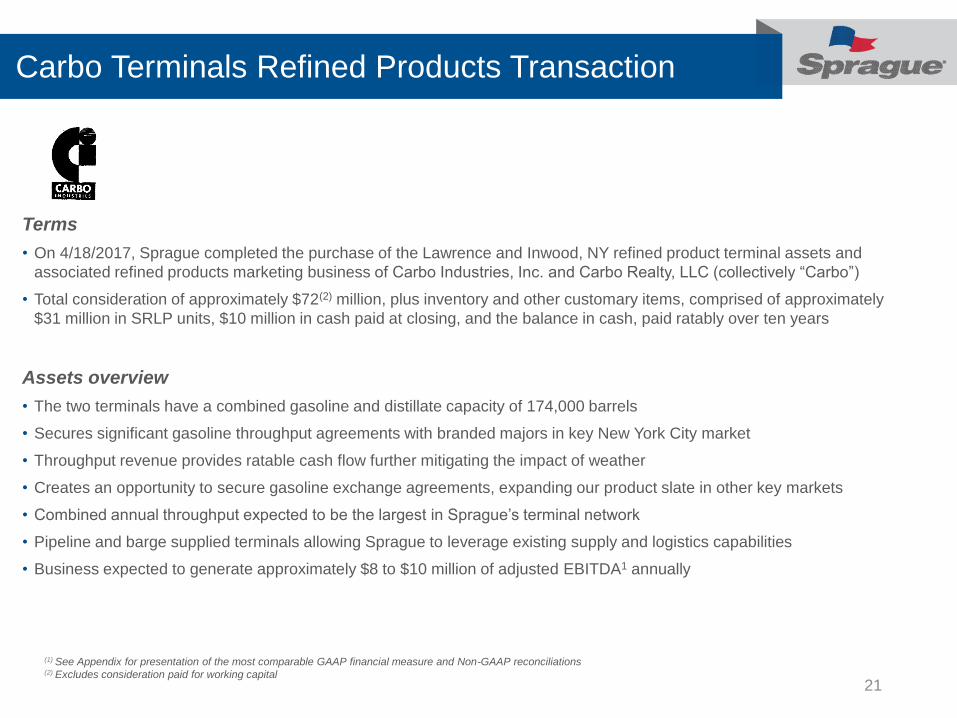
Carbo Terminals Refined Products Transaction
21
Terms
• On 4/18/2017, Sprague completed the purchase of the Lawrence and Inwood, NY refined product terminal assets and
associated refined products marketing business of Carbo Industries, Inc. and Carbo Realty, LLC (collectively “Carbo”)
• Total consideration of approximately $72(2) million, plus inventory and other customary items, comprised of approximately
$31 million in SRLP units, $10 million in cash paid at closing, and the balance in cash, paid ratably over ten years
Assets overview
• The two terminals have a combined gasoline and distillate capacity of 174,000 barrels
• Secures significant gasoline throughput agreements with branded majors in key New York City market
• Throughput revenue provides ratable cash flow further mitigating the impact of weather
• Creates an opportunity to secure gasoline exchange agreements, expanding our product slate in other key markets
• Combined annual throughput expected to be the largest in Sprague’s terminal network
• Pipeline and barge supplied terminals allowing Sprague to leverage existing supply and logistics capabilities
• Business expected to generate approximately $8 to $10 million of adjusted EBITDA1 annually
(1) See Appendix for presentation of the most comparable GAAP financial measure and Non-GAAP reconciliations (2) Excludes consideration paid for working capital
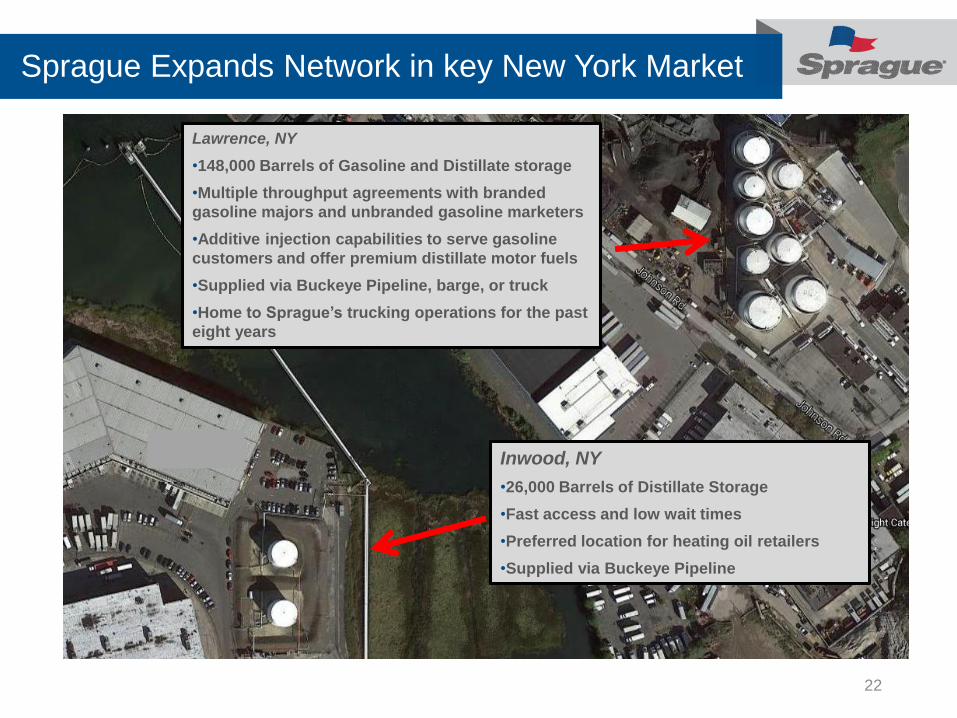
Sprague Expands Network in key New York Market
22
Inwood, NY
•26,000 Barrels of Distillate Storage
•Fast access and low wait times
•Preferred location for heating oil retailers
•Supplied via Buckeye Pipeline
Lawrence, NY
•148,000 Barrels of Gasoline and Distillate storage
•Multiple throughput agreements with branded
gasoline majors and unbranded gasoline marketers
•Additive injection capabilities to serve gasoline
customers and offer premium distillate motor fuels
•Supplied via Buckeye Pipeline, barge, or truck
•Home to Sprague’s trucking operations for the past
eight years
Coen Energy Transaction
Terms
• On 10/1/2017 Sprague completed the purchase of the membership interests of Coen Energy, LLC and Coen Transport
LLC and certain assets of other Coen entities (collectively, “Coen Energy”).
• Consideration of approximately $35 million in cash, plus payments for inventory and other customary items. Under the
terms of a three-year earn-out agreement, additional consideration of up to $12 million may be paid if certain performance
targets are met.
Business overview
• Expands Sprague’s Refined Products footprint in Pennsylvania, Ohio and West Virginia by providing energy products and
related services to Energy Field Services, Commercial, and Residential customers.
• Continues Sprague’s ongoing transformation toward a balanced revenue model with ratable cash flow. The peak summer
seasonal demand of Coen’s Energy Field Services business, which supports Marcellus and Utica shale drilling activity,
balances the winter heating demand of the Commercial and Residential customer base.
• Expected to generate approximately $8 to $9 million of adjusted EBITDA1 annually and expected to be immediately
accretive to unitholders.
1See Non-GAAP Financial Measures at the end of this presentation 23
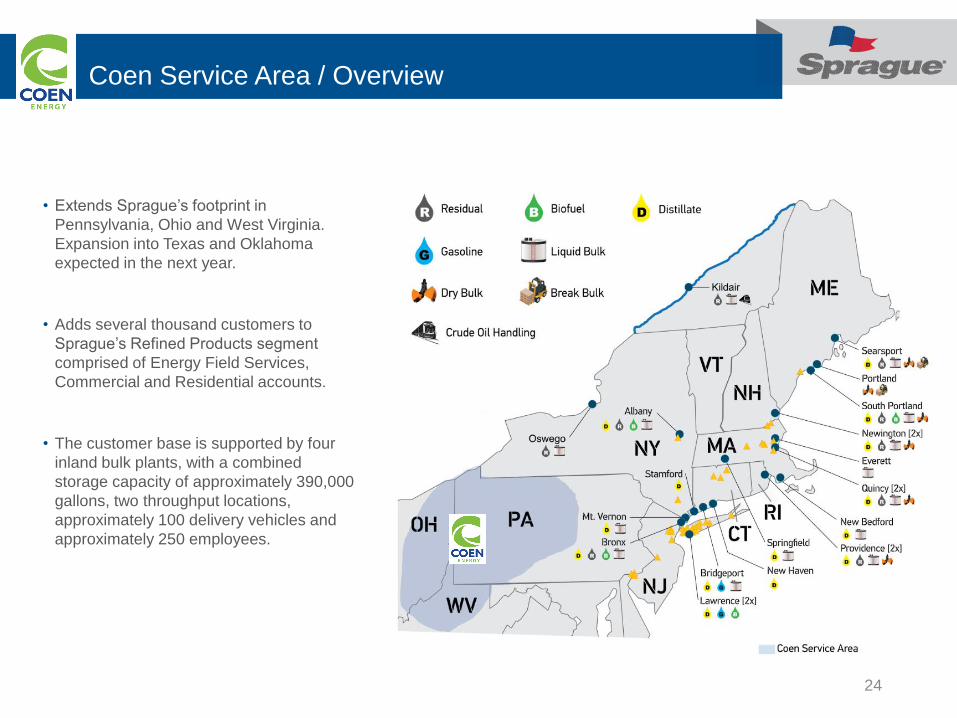
Coen Service Area / Overview
• Extends Sprague’s footprint in
Pennsylvania, Ohio and West Virginia.
Expansion into Texas and Oklahoma
expected in the next year.
• Adds several thousand customers to
Sprague’s Refined Products segment
comprised of Energy Field Services,
Commercial and Residential accounts.
• The customer base is supported by four
inland bulk plants, with a combined
storage capacity of approximately 390,000
gallons, two throughput locations,
approximately 100 delivery vehicles and
approximately 250 employees.
24
Natural Gas – Acquisition Growth
25
Terms
• On 2/1/2017, Sprague completed the purchase of the natural gas marketing and electricity brokering business assets of
subsidiaries of Global Partners LP (NYSE: GLP)
• $17 million(2) total cash purchase price, funded with cash on hand and credit facility borrowings
Assets overview
• Global’s natural gas and electricity businesses consist of supply agreements to approximately 4,000 commercial, industrial,
municipal and institutional customer locations across six states (NY, NJ, MA, RI, NH, ME) within Sprague’s current footprint
• Acquired portfolio of customer supply contracts represents approximately 8 Bcf of annual natural gas demand
• Electricity brokerage contracts represent nearly 1 billion kWh of annual demand
• Deepens Sprague’s penetration of core market footprint and customer base
• Leverages Sprague’s gas supply and scheduling expertise, offering more opportunities for improved economics through
optimization
• Expected annual adjusted EBITDA(1) run rate of $3 million
• Purchase financed through existing acquisition facility liquidity
(1) See Appendix for presentation of the most comparable GAAP financial measure and Non-GAAP reconciliations (2) Excludes consideration paid for working capital
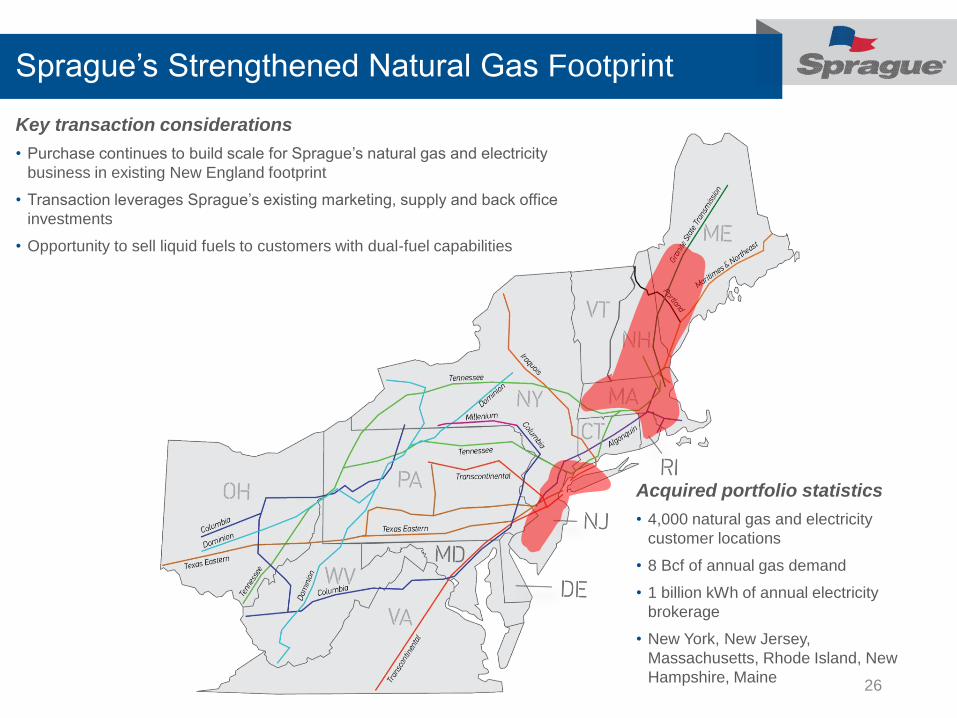
Sprague’s Strengthened Natural Gas Footprint
26
Key transaction considerations
• Purchase continues to build scale for Sprague’s natural gas and electricity
business in existing New England footprint
• Transaction leverages Sprague’s existing marketing, supply and back office
investments
• Opportunity to sell liquid fuels to customers with dual-fuel capabilities
Acquired portfolio statistics
• 4,000 natural gas and electricity
customer locations
• 8 Bcf of annual gas demand
• 1 billion kWh of annual electricity
brokerage
• New York, New Jersey,
Massachusetts, Rhode Island, New
Hampshire, Maine
Organic Growth – Asset Optimization Strategy
27
Sprague is generating attractive multiples through organic growth initiatives that capture incremental returns from existing
assets, increase ratable cash flow, and are backed by multi-year contracts with take or pay minimums:
River Road Terminal
• $5.5 million expansion capital project to convert distillate tanks to asphalt storage
• $800,000 expansion capital project to upgrade dock capabilities and expand service offering
• Completed Q2 2017
Providence Terminal Expansion
• Terminal optimization opportunity created by the acquisition of the Capital Terminal in East Providence
• $6 million expansion capital project to convert distillate and heavy fuel oil capacity to asphalt storage
• Completed Q3 2017
East Providence Terminal Expansion
• $10 million expansion capital project converting excess distillate storage to support gasoline throughput
• Completion targeted for Q4 2017
Sprague Resources LP (SRLP) Overview
28
$0.6375
$0.36
$0.41
$0.46
$0.51
$0.56
$0.61
1Q'14
2Q'14
3Q'14
4Q'14
1Q'15
2Q'15
3Q'15
4Q'15
1Q'16
2Q'16
3Q'16
4Q'16
1Q'17
2Q'17
3Q'17
4Q'17
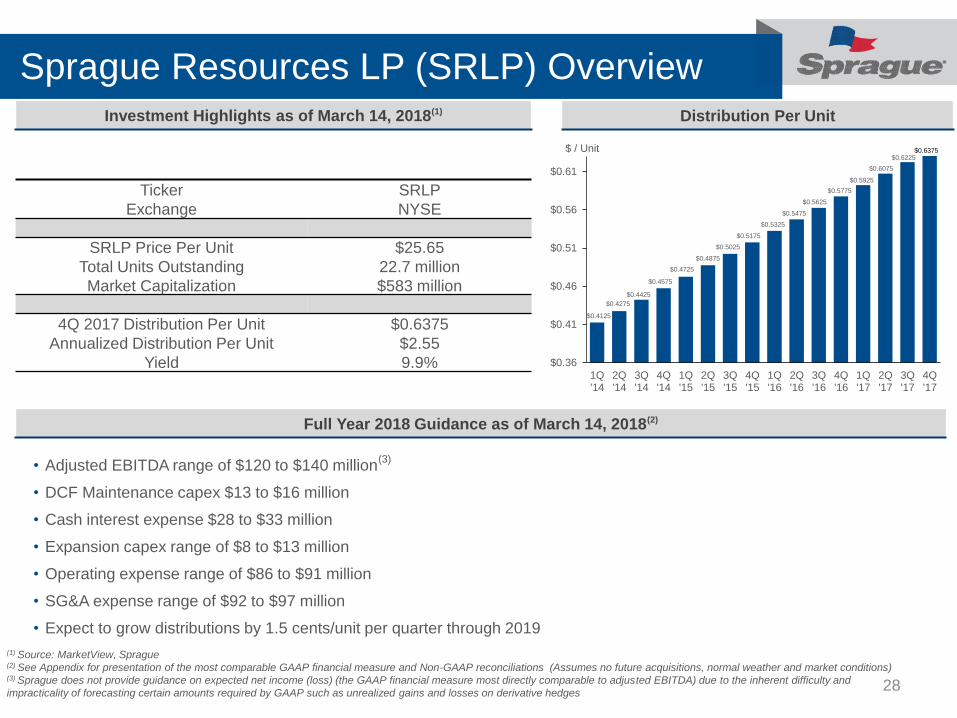
Distribution Per UnitInvestment Highlights as of March 14, 2018(1)
Ticker SRLP
Exchange NYSE
SRLP Price Per Unit $25.65
Total Units Outstanding 22.7 million
Market Capitalization $583 million
4Q 2017 Distribution Per Unit $0.6375
Annualized Distribution Per Unit $2.55
Yield 9.9%
• Adjusted EBITDA range of $120 to $140 million(3)
• DCF Maintenance capex $13 to $16 million
• Cash interest expense $28 to $33 million
• Expansion capex range of $8 to $13 million
• Operating expense range of $86 to $91 million
• SG&A expense range of $92 to $97 million
• Expect to grow distributions by 1.5 cents/unit per quarter through 2019
Full Year 2018 Guidance as of March 14, 2018(2)
$ / Unit
$0.4275
$0.4425
$0.4575
$0.4725
$0.4875
$0.5025
$0.4125
$0.5175
(1) Source: MarketView, Sprague(2) See Appendix for presentation of the most comparable GAAP financial measure and Non-GAAP reconciliations (Assumes no future acquisitions, normal weather and market conditions)(3) Sprague does not provide guidance on expected net income (loss) (the GAAP financial measure most directly comparable to adjusted EBITDA) due to the inherent difficulty and
impracticality of forecasting certain amounts required by GAAP such as unrealized gains and losses on derivative hedges
$0.5325
$0.5475
$0.5625
$0.5775
$0.5925
$0.6075
$0.6225
Financial Strengths
29
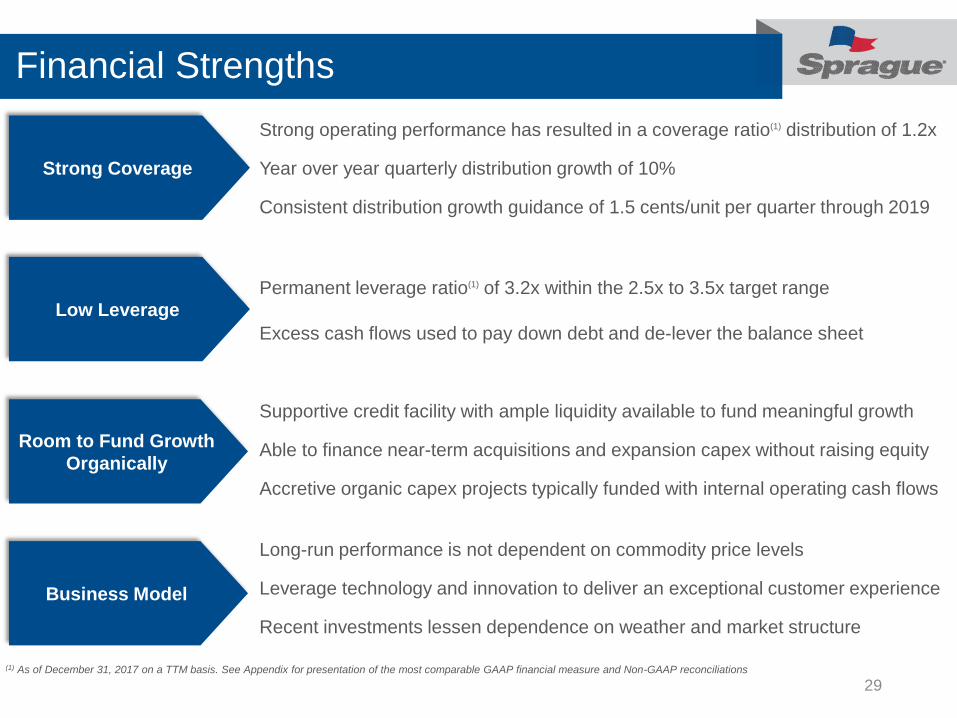
Strong operating performance has resulted in a coverage ratio(1) distribution of 1.2x
Year over year quarterly distribution growth of 10%
Consistent distribution growth guidance of 1.5 cents/unit per quarter through 2019
Permanent leverage ratio(1) of 3.2x within the 2.5x to 3.5x target range
Excess cash flows used to pay down debt and de-lever the balance sheet
Supportive credit facility with ample liquidity available to fund meaningful growth
Able to finance near-term acquisitions and expansion capex without raising equity
Accretive organic capex projects typically funded with internal operating cash flows
Long-run performance is not dependent on commodity price levels
Leverage technology and innovation to deliver an exceptional customer experience
Recent investments lessen dependence on weather and market structure
Low Leverage
Strong Coverage
Business Model
Room to Fund Growth
Organically
(1) As of December 31, 2017 on a TTM basis. See Appendix for presentation of the most comparable GAAP financial measure and Non-GAAP reconciliations
Financial Performance
30
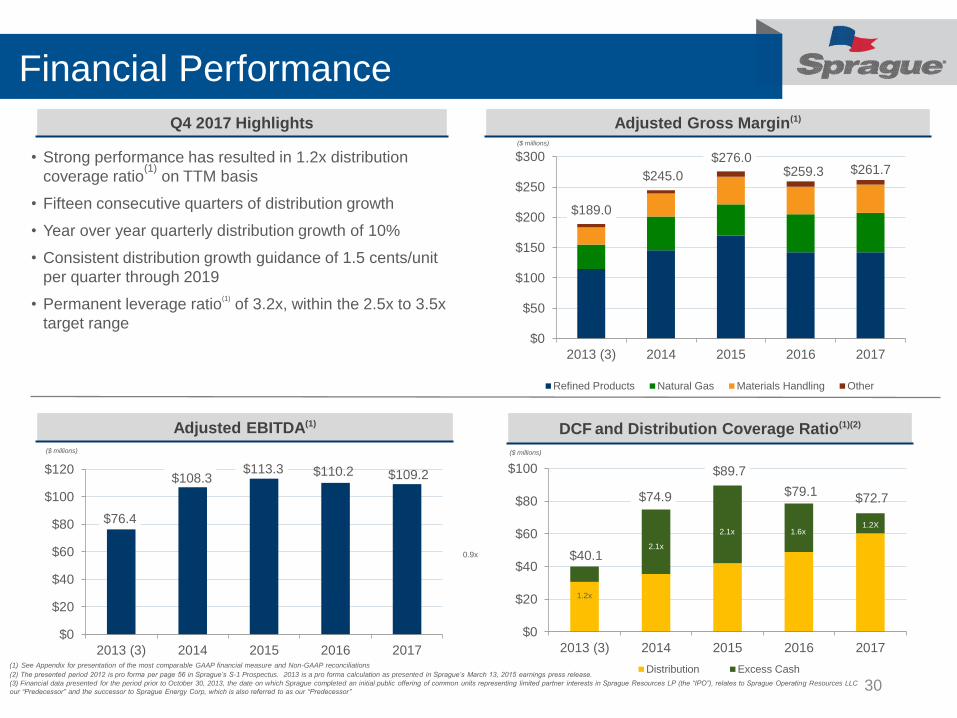
$40.1
$74.9
$89.7
$79.1 $72.7
1.2X
$0
$20
$40
$60
$80
$100
2013 (3) 2014 2015 2016 2017
Distribution Excess Cash
$189.0
$245.0
$276.0 $259.3 $261.7
$0
$50
$100
$150
$200
$250
$300
2013 (3) 2014 2015 2016 2017
Refined Products Natural Gas Materials Handling Other
$76.4
$108.3 $113.3 $110.2 $109.2
$0
$20
$40
$60
$80
$100
$120
2013 (3) 2014 2015 2016 2017
Adjusted EBITDA(1)
Q4 2017 Highlights Adjusted Gross Margin(1)
DCF and Distribution Coverage Ratio(1)(2)
($ millions)
($ millions) ($ millions)
0.9x
1.2x
2.1x
2.1x
1.6x
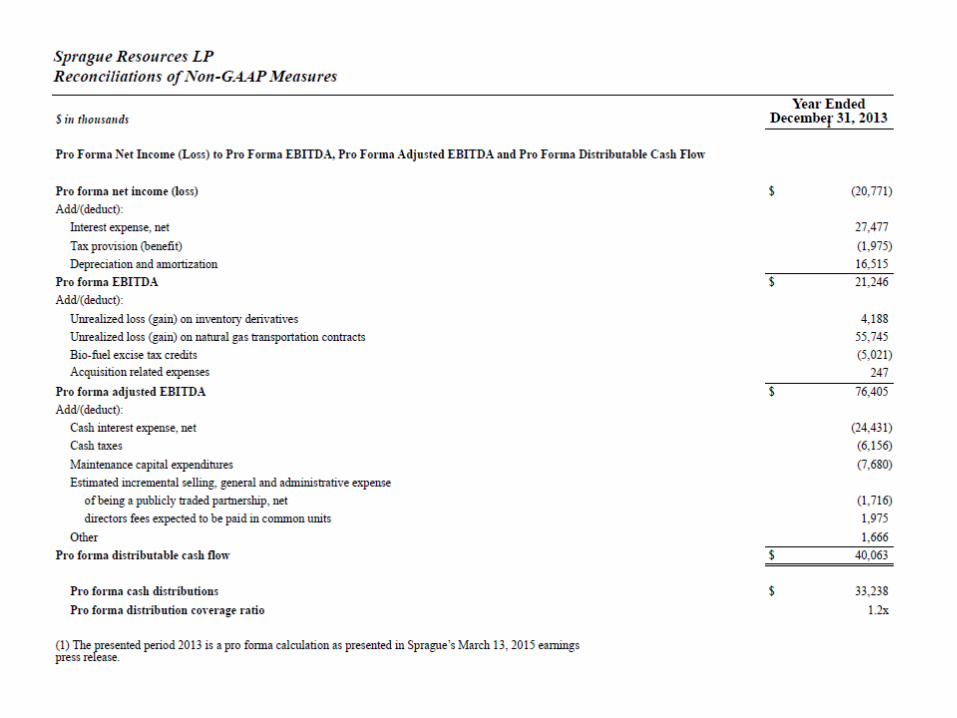
(1) See Appendix for presentation of the most comparable GAAP financial measure and Non-GAAP reconciliations
(2) The presented period 2012 is pro forma per page 56 in Sprague’s S-1 Prospectus. 2013 is a pro forma calculation as presented in Sprague’s March 13, 2015 earnings press release.
(3) Financial data presented for the period prior to October 30, 2013, the date on which Sprague completed an initial public offering of common units representing limited partner interests in Sprague Resources LP (the “IPO”), relates to Sprague Operating Resources LLC
our “Predecessor” and the successor to Sprague Energy Corp, which is also referred to as our “Predecessor”
• Strong performance has resulted in 1.2x distribution
coverage ratio(1)
on TTM basis
• Fifteen consecutive quarters of distribution growth
• Year over year quarterly distribution growth of 10%
• Consistent distribution growth guidance of 1.5 cents/unit
per quarter through 2019
• Permanent leverage ratio(1)
of 3.2x, within the 2.5x to 3.5x
target range
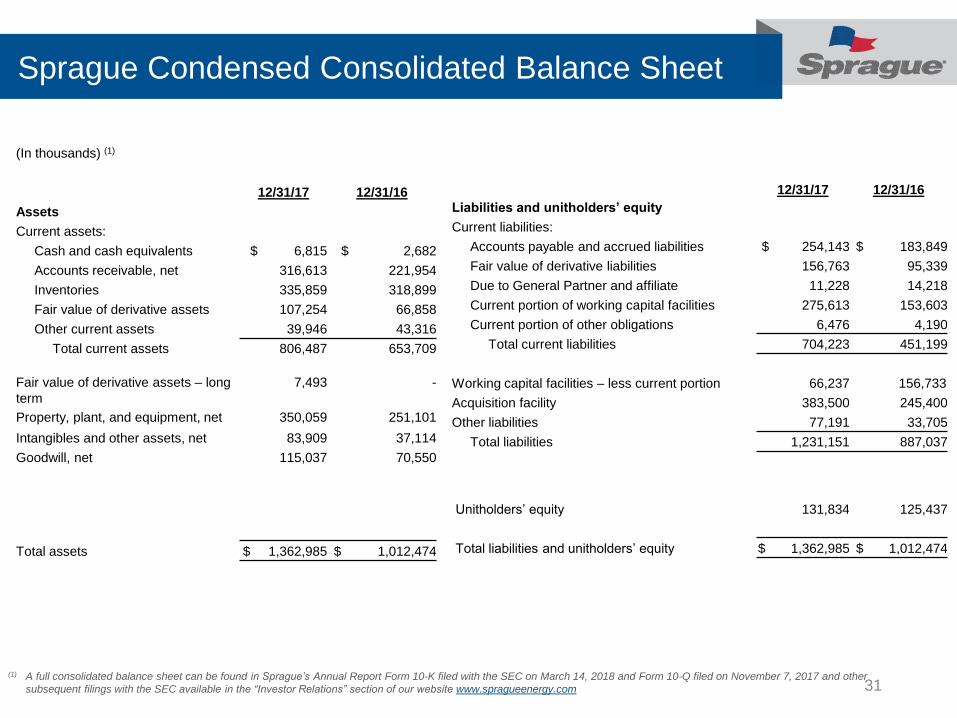
Sprague Condensed Consolidated Balance Sheet
31
(In thousands) (1)
12/31/17 12/31/16
Assets
Current assets:
Cash and cash equivalents $ 6,815 $ 2,682
Accounts receivable, net 316,613 221,954
Inventories 335,859 318,899
Fair value of derivative assets 107,254 66,858
Other current assets 39,946 43,316
Total current assets 806,487 653,709
Fair value of derivative assets – long
term
7,493 -
Property, plant, and equipment, net 350,059 251,101
Intangibles and other assets, net 83,909 37,114
Goodwill, net 115,037 70,550
Total assets $ 1,362,985 $ 1,012,474
12/31/17 12/31/16
Liabilities and unitholders’ equity
Current liabilities:
Accounts payable and accrued liabilities $ 254,143 $ 183,849
Fair value of derivative liabilities 156,763 95,339
Due to General Partner and affiliate 11,228 14,218
Current portion of working capital facilities 275,613 153,603
Current portion of other obligations 6,476 4,190
Total current liabilities 704,223 451,199
Working capital facilities – less current portion 66,237 156,733
Acquisition facility 383,500 245,400
Other liabilities 77,191 33,705
Total liabilities 1,231,151 887,037
Unitholders’ equity 131,834 125,437
Total liabilities and unitholders’ equity $ 1,362,985 $ 1,012,474
(1) A full consolidated balance sheet can be found in Sprague’s Annual Report Form 10-K filed with the SEC on March 14, 2018 and Form 10-Q filed on November 7, 2017 and other
subsequent filings with the SEC available in the “Investor Relations” section of our website www.spragueenergy.com
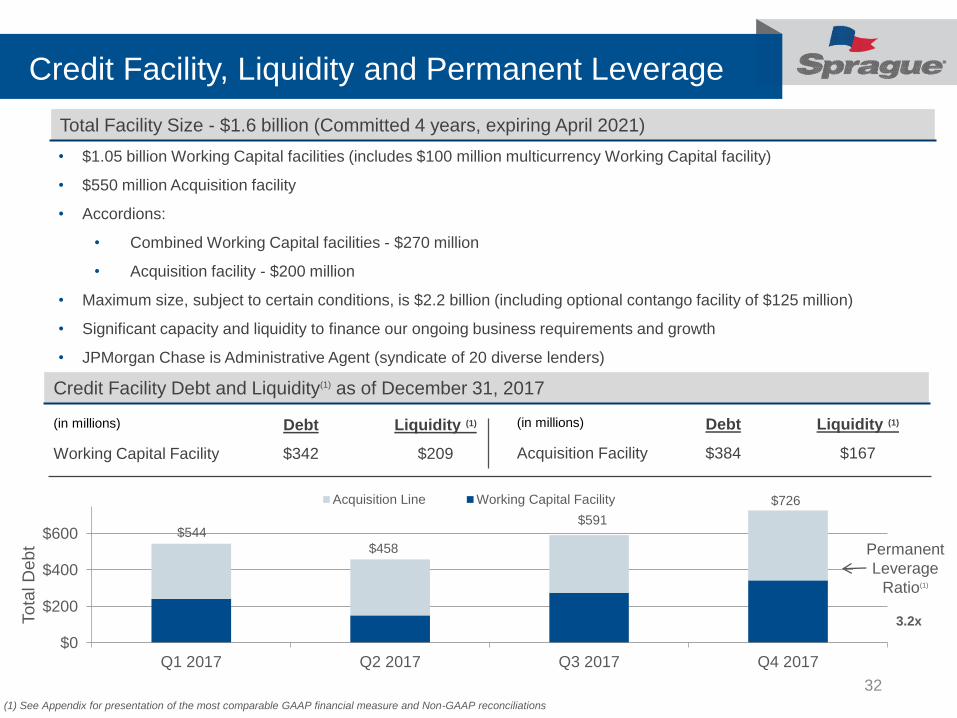
Credit Facility, Liquidity and Permanent Leverage
32
$0
$200
$400
$600
Q1 2017 Q2 2017 Q3 2017 Q4 2017
Acquisition Line Working Capital Facility $726
(in millions) Debt Liquidity (1)
Acquisition Facility $384 $167
(in millions) Debt Liquidity (1)
Working Capital Facility $342 $209
Total Facility Size - $1.6 billion (Committed 4 years, expiring April 2021)
Credit Facility Debt and Liquidity(1) as of December 31, 2017
Tota
l D
ebt Permanent
Leverage
Ratio(1)
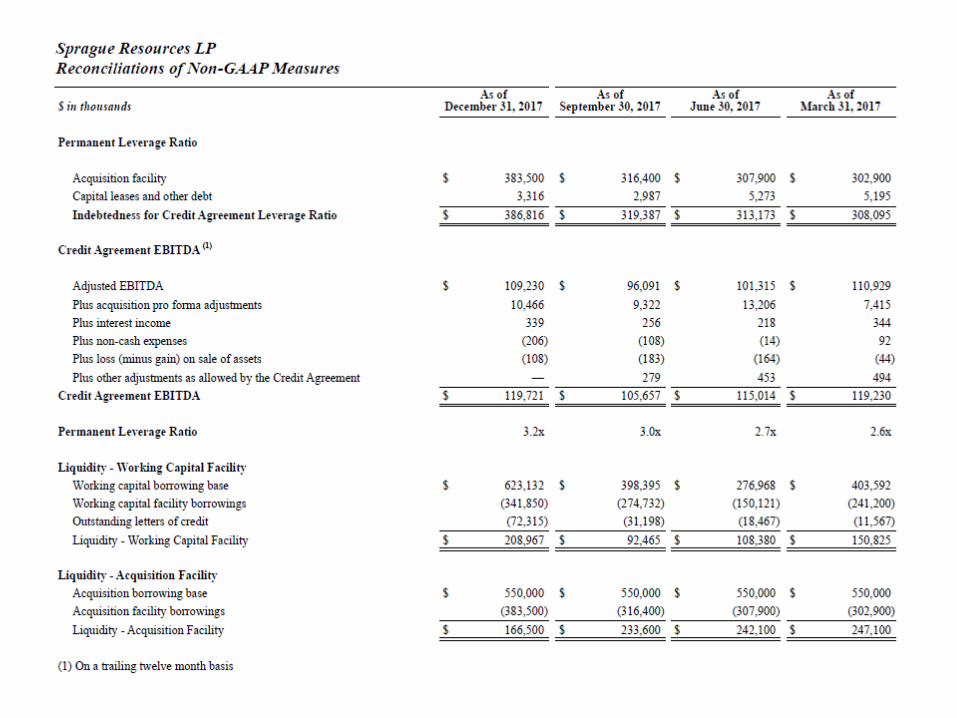
(1) See Appendix for presentation of the most comparable GAAP financial measure and Non-GAAP reconciliations
$591
3.2x
$544
• $1.05 billion Working Capital facilities (includes $100 million multicurrency Working Capital facility)
• $550 million Acquisition facility
• Accordions:
• Combined Working Capital facilities - $270 million
• Acquisition facility - $200 million
• Maximum size, subject to certain conditions, is $2.2 billion (including optional contango facility of $125 million)
• Significant capacity and liquidity to finance our ongoing business requirements and growth
• JPMorgan Chase is Administrative Agent (syndicate of 20 diverse lenders)
$458
Confidential: Not For Distribution
Appendix

Summary Unaudited Financial Data
34
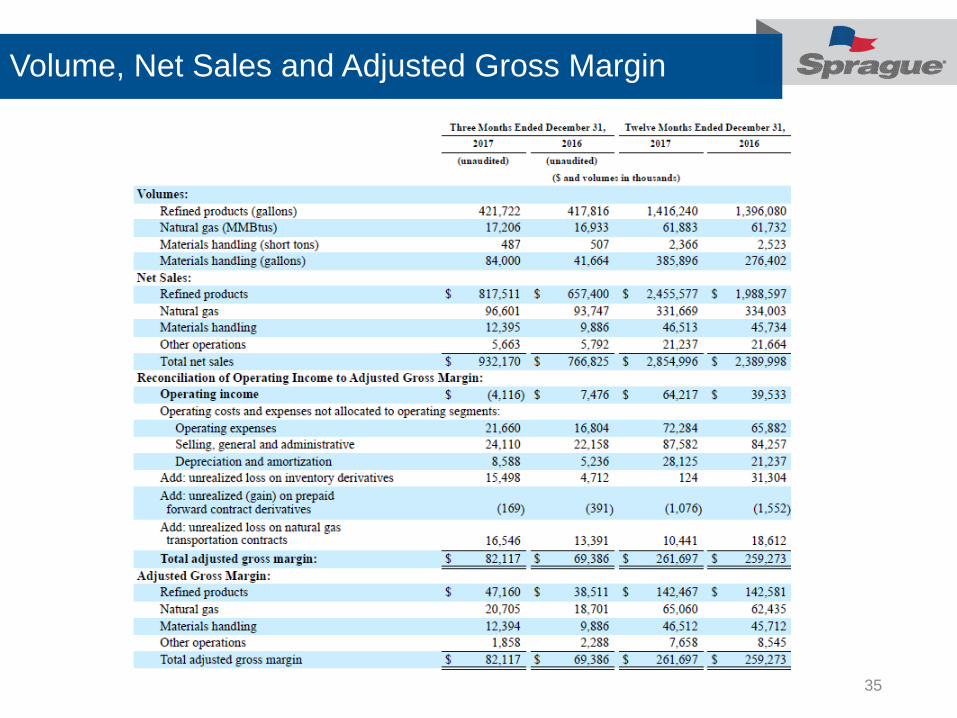
Volume, Net Sales and Adjusted Gross Margin
35
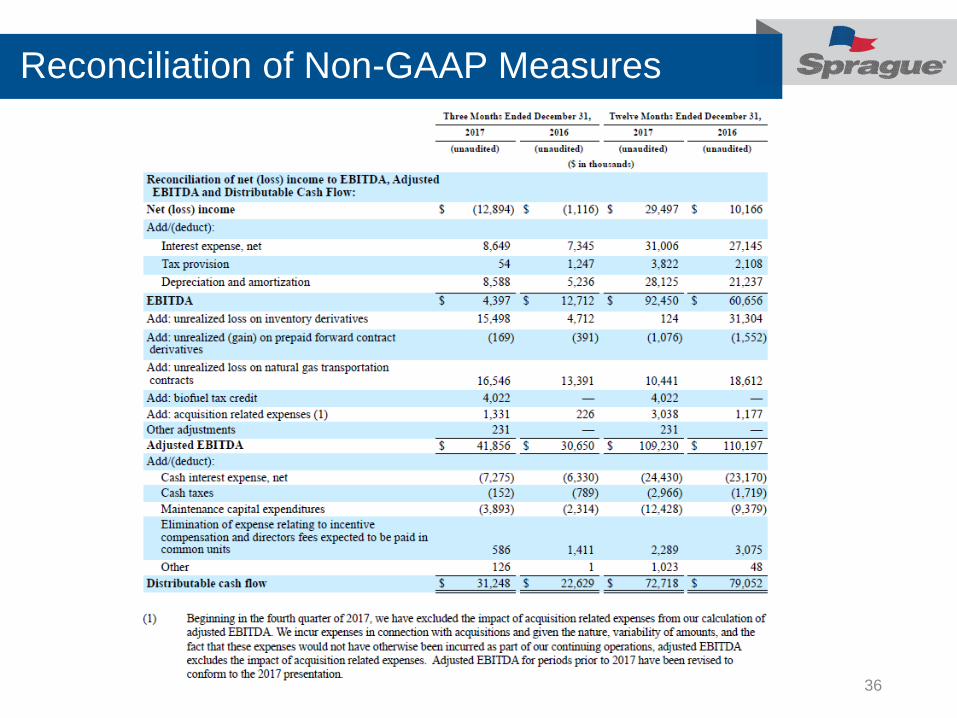
Reconciliation of Non-GAAP Measures
36