Embed Size (px)
Citation preview
Order Code RL34659
China’s Greenhouse Gas Emissions and Mitigation Policies
September 10, 2008
Jane A. LeggettSpecialist in Environmental and Energy Policy
Resources, Science, and Industry Division
Jeffrey LoganSpecialist in Energy Policy
Resources, Science, and Industry Division
Anna MackeyIntern
Resources, Science, and Industry Division
China’s Greenhouse Gas Emissions and Mitigation Policies
Summary
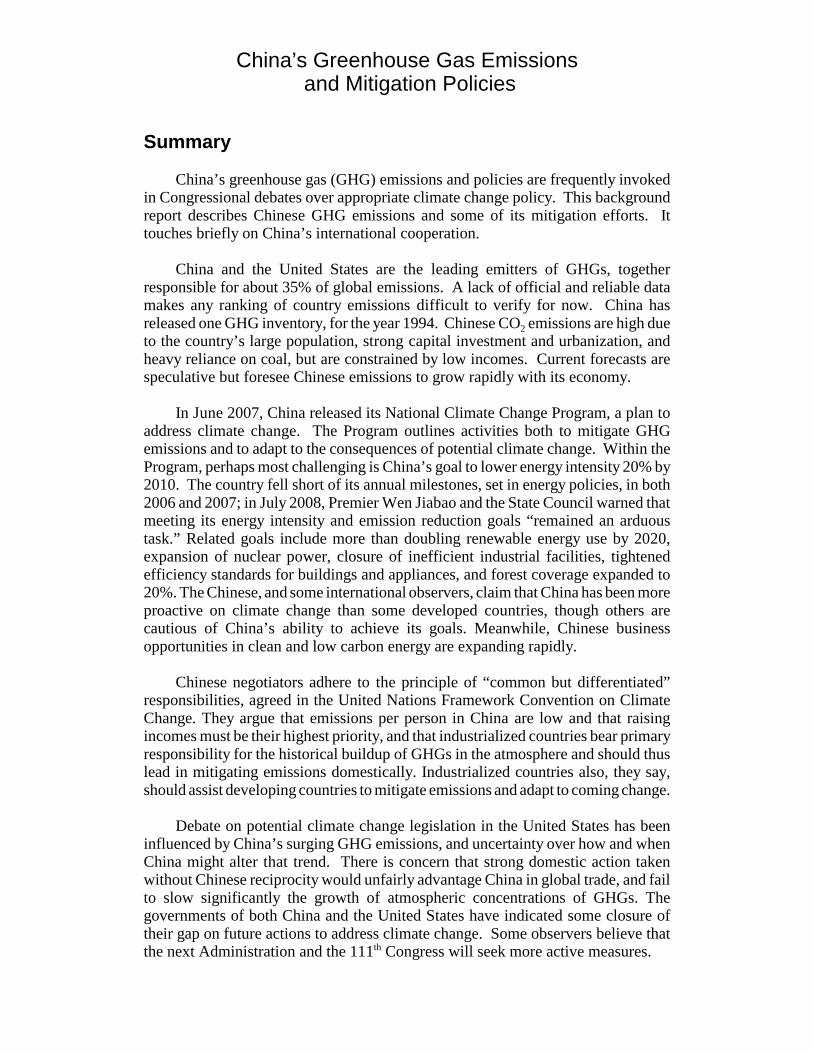
China’s greenhouse gas (GHG) emissions and policies are frequently invokedin Congressional debates over appropriate climate change policy. This backgroundreport describes Chinese GHG emissions and some of its mitigation efforts. Ittouches briefly on China’s international cooperation.
China and the United States are the leading emitters of GHGs, togetherresponsible for about 35% of global emissions. A lack of official and reliable datamakes any ranking of country emissions difficult to verify for now. China hasreleased one GHG inventory, for the year 1994. Chinese CO2 emissions are high dueto the country’s large population, strong capital investment and urbanization, andheavy reliance on coal, but are constrained by low incomes. Current forecasts arespeculative but foresee Chinese emissions to grow rapidly with its economy.
In June 2007, China released its National Climate Change Program, a plan toaddress climate change. The Program outlines activities both to mitigate GHGemissions and to adapt to the consequences of potential climate change. Within theProgram, perhaps most challenging is China’s goal to lower energy intensity 20% by2010. The country fell short of its annual milestones, set in energy policies, in both2006 and 2007; in July 2008, Premier Wen Jiabao and the State Council warned thatmeeting its energy intensity and emission reduction goals “remained an arduoustask.” Related goals include more than doubling renewable energy use by 2020,expansion of nuclear power, closure of inefficient industrial facilities, tightenedefficiency standards for buildings and appliances, and forest coverage expanded to20%. The Chinese, and some international observers, claim that China has been moreproactive on climate change than some developed countries, though others arecautious of China’s ability to achieve its goals. Meanwhile, Chinese businessopportunities in clean and low carbon energy are expanding rapidly.
Chinese negotiators adhere to the principle of “common but differentiated”responsibilities, agreed in the United Nations Framework Convention on ClimateChange. They argue that emissions per person in China are low and that raisingincomes must be their highest priority, and that industrialized countries bear primaryresponsibility for the historical buildup of GHGs in the atmosphere and should thuslead in mitigating emissions domestically. Industrialized countries also, they say,should assist developing countries to mitigate emissions and adapt to coming change.
Debate on potential climate change legislation in the United States has beeninfluenced by China’s surging GHG emissions, and uncertainty over how and whenChina might alter that trend. There is concern that strong domestic action takenwithout Chinese reciprocity would unfairly advantage China in global trade, and failto slow significantly the growth of atmospheric concentrations of GHGs. Thegovernments of both China and the United States have indicated some closure oftheir gap on future actions to address climate change. Some observers believe thatthe next Administration and the 111th Congress will seek more active measures.
Contents
Introduction: China and Climate Change . . . . . . . . . . . . . . . . . . . . . . . . . . . . 1China in Context . . . . . . . . . . . . . . . . . . . . . . . . . . . . . . . . . . . . . . . . . . . . . . 3
China’s Energy Sector . . . . . . . . . . . . . . . . . . . . . . . . . . . . . . . . . . . . . . 4China’s National Greenhouse Gas Emissions . . . . . . . . . . . . . . . . . . . . . . . . 5
GHG per capita . . . . . . . . . . . . . . . . . . . . . . . . . . . . . . . . . . . . . . . . . . . 9GHG Productivity or Intensity . . . . . . . . . . . . . . . . . . . . . . . . . . . . . . . . 9China’s Contribution to GHG Concentrations . . . . . . . . . . . . . . . . . . . 12GHG Emissions Due to Exports (Embedded Emissions) . . . . . . . . . . 14Recent Rates of Growth of China’s GHG Emissions . . . . . . . . . . . . . 15GHG Projections . . . . . . . . . . . . . . . . . . . . . . . . . . . . . . . . . . . . . . . . . 17Sectoral GHG Emissions . . . . . . . . . . . . . . . . . . . . . . . . . . . . . . . . . . . 18
China’s Domestic Policies to Mitigate GHG Emissions . . . . . . . . . . . . . . . 18Enacted Domestic Programs in China . . . . . . . . . . . . . . . . . . . . . . . . . 19
China’s Role in International Cooperation to Curtail GHG Emissions . . . . 24China’s View: Developed Countries Should Lead . . . . . . . . . . . . . . . 25An Alternative View: China Must Commit As Well . . . . . . . . . . . . . . 26
Conclusions . . . . . . . . . . . . . . . . . . . . . . . . . . . . . . . . . . . . . . . . . . . . . . . . . 26Appendix. Selected Measures to Mitigate GHG Emissions in China . . . . . 27
List of Figures
Figure 1. Comparison of Estimations of GHG Emissions in China for 2004 and 2005 . . . . . . . . . . . . . . . . . . . . . . . . . . . . . . . . . . . . . . . . . . . . . 7
Figure 2. Top GHG Emitters in 2005 . . . . . . . . . . . . . . . . . . . . . . . . . . . . . . . . . . 8Figure 3. Estimated Per Capita GHG Emissions in 2005 . . . . . . . . . . . . . . . . . . . 9Figure 4. Estimated GHG Intensities in 2005 . . . . . . . . . . . . . . . . . . . . . . . . . . . 10Figure 5. Relative Contributions to Climate Change in 2000
Under Alternative Assumptions . . . . . . . . . . . . . . . . . . . . . . . . . . . . . . . . . . 14Figure 6. One Estimate of CO2 Emissions Associated with
Imported and Exported Products in 2007 . . . . . . . . . . . . . . . . . . . . . . . . . . 15Figure 7. One Estimate of Factors Driving Recent Growth
of GHG Emissions in China . . . . . . . . . . . . . . . . . . . . . . . . . . . . . . . . . . . . 16Figure 8. GHG Emissions By Source Types in China in 2005 . . . . . . . . . . . . . . 18
List of Tables
Table 1. Selected Statistics for China and the United States in 2005 . . . . . . . . . . 4Table A-1. Mitigation of GHG Emissions in China: Selected Measures
and Mitigation Targets, Expected GHG Reductions, and Reported Progress . . . . . . . . . . . . . . . . . . . . . . . . . . . . . . . . . . . . . . . . . 27
1 Most of the research for this report and the initial draft were prepared by Anna Mackey,Intern in the Resources, Science, and Industry Division of CRS, during the summer of 2008.2 See W. Chandler, Breaking the Suicide Pact: U.S.-China Cooperation on Climate Change,Carnegie Endowment for International Peace, March 2008.3 See CRS Report RL33534, China’s Economic Conditions, by Wayne M. Morrison.
China’s Greenhouse Gas Emissions and Mitigation Policies
Introduction: China and Climate Change1
China stands front and center in the congressional debate on climate change, dueto that nation’s contribution to global emissions and competitiveness in global trade.With its large population, rapidly expanding economy, and heavy reliance on coal,China now shares the lead in global greenhouse gas (GHG) emissions with theUnited States. China’s GHG emissions are expected to continue growing in the yearsahead based on projections of continuing rapid economic growth. Experts generallyagree that emissions in all major countries must be abated in order to stabilize growthof atmospheric concentrations of GHG that leads to climate change.
In the United States, critics of mandatory, domestic GHG controls (withoutreciprocal Chinese action) argue they would increase the costs of U.S. goods relativeto those from China, thus harming competitiveness of certain U.S. industries. To thedegree that production might decrease here and increase in China as a result, reducedemissions in the United States might be offset by higher emissions there (called“leakage”). This could exacerbate trade tensions between the United States andChina, and not appreciably reduce the risk of climate change. So, unless China takessignificant simultaneous action with the United States, some analysts contend, it isnot in U.S. interests to do so here.
Proponents of U.S. climate leadership, on the other hand, note the need fordeveloped countries to act first due to historical contributions to current GHGconcentrations and greater economic capabilities. Only if the United States and otherindustrialized emitters act first, they argue, can the developing countries beencouraged to do their part; industrialized countries must demonstrate to China andother large developing countries that emissions can be reduced without unacceptableeconomic losses. This, in their perspective, is the only way to break the standoff thatsome claim the two nations face.2
Between 1979 and 2007, the Chinese economy grew at an average annual rateof 9.8%.3 Hundreds of millions of Chinese have improved their standards of living.
CRS-2
4 See CRS Report RL34314, China’s Holdings of U.S. Securities: Implications for the U.S.Economy, by Wayne Morrison and Marc Labonte.5 S. Chen and M. Ravallion, “China is Poorer Than We Thought, but No Less Successful inthe Fight Against Poverty,” Policy Research Working Paper, WPS-4621, World Bank, May2008, Table 2.6 See CRS Report RL33416, Social Unrest in China, by Thomas Lum.7 World Bank. 2007. Cost of Pollution in China: Economic Estimates of Physical Damages.Washington DC. 8 Garrett Hardin, “The Tragedy of the Commons,” Science 162:1243-1248, 1968.
The country held $1.5 trillion in foreign exchange reserves by the end of 20074,leading some to claim that China was no longer a developing country. Despite thisprogress, a recent World Bank report estimated that up to 200 million people inChina lived on less than $1.25 a day in 2005.5 Eradicating poverty and raisingincomes toward the global average remains a high priority for China.
Historically, China has often put economic growth ahead of the environment.Many Chinese policymakers now realize, however, they can no longer afford anunbalanced approach, especially in the wealthier regions of the country.Environmental pollution has become so bad in places that social and politicalstability are at risk. Officially recognized “public order disturbances” grew from58,000 in 2003 to 87,000 in 2005, many due to environmental pollution and land-takings stemming from government corruption.6 The World Bank, working with theChinese government and other experts, in 2007 estimated that the cost of outdoor airand water pollution to China’s economy totalled around US$100 billion annually, or5.8% of China’s GDP.7 Related to such findings, the Chinese government putenvironmental protection into its 11th Five Year Plan (2006-2010) as a high priority.Chinese central government officials have over the past decade pursued acombination of measures to control air, water, and soil pollution, and are strugglingto build a “recycling” industrialized economy to ease environmental pressures. Theseefforts have met with mixed success. Even when national officials genuinely wantto encourage a better environment, local officials may have different priorities inmind. As will be reflected further in this report, one important question is the degreeto which national goals and measures will be achieved.
Controlling local and regional pollutants like oxides of sulfur and nitrogen,particulates, and mercury is difficult because of the different priorities of local andcentral government officials and insufficient enforcement. Controlling GHGemissions in China is even harder. For traditional pollutants, both mitigation costsand impacts are local or regional; averaged nationally, polluters will pay the cost oneway or another. But with GHG emissions, mitigation costs may be local, whileclimate impacts are global. So, without shared international action, this can lead toa “tragedy of the commons” phenomenon8 where free riders emit more than theymight otherwise.
Over the past five years or so, China has demonstrated an increasing realizationthat it has ownership in the outcomes of a warming world. As China grows —potentially enormously, it recognizes that it too will bear the potential costs of

CRS-3
9 The National Climate Change Program, released in 2007, identifies many potentialimpacts of climate change on China. Additional examples of recent publications outliningsuch costs include A. Thomson, R. Izaurralde, N. Rosenberg, and X. He, “Climate ChangeImpacts on Agriculture and Soil Carbon Sequestration Potential in the Huang-Hai Plain ofChina,” Agriculture Ecosystems & Environment 114 (2-4): 195-209, 2006; X. Wang, F.Chen, and Z. Dong, “The Relative Role of Climatic and Human Factors in Desertificationin Semiarid China,” Global Environmental Change – Human and Policy Dimensions 16 (1):48-57, 2006; X. Zhang, and W. Liu, “Simulating Potential Response of Hydrology, SoilErosion, and Crop Productivity to Climate Change in Changwu Tablel and Region on theLoess Plateau of China,” Agricultural and Forest Meteorology 131 (3-4): 127-142, 2005.10 For more on China’s “wait and see” climate policy, see J. Lewis, M. Cummings, and J.Logan, “Understanding the Climate Challenge in China,” Oil, Gas and Energy LawIntelligence, May 2008, [http://www.gasandoil.com/ogel/samples/toc.asp?key=29].11 In mid-2008, the U.S. dollar bought about 6.8 Chinese yuan, also known as the renminbi(RMB). This exchange rate has declined from 8.2 RMB/$ in 2005.12 A. Keidel, “China’s Economic Rise — Fact and Fiction,” Carnegie Endowment forInternational Peace, July 2008, p. 5-6.
increasing storm intensity, rising sea levels, shifting water availability andagricultural productivity, as well as changing disease migration.9
Given the act of balancing economic growth with environmental protection,international relations with domestic politics, and equity with the declared need foraction, China, apparently like the United States, maintains a “wait and see” climatepolicy.10
This report lays a groundwork for consideration of expectations of China in thecontext of climate change as a global challenge. It first provides a brief comparisonof China’s economy and energy sector with those of the United States. The reportthen assesses the limited information available on GHG emissions in China. Next,it summarizes some of the best described elements of China’s strategy to mitigate itsGHG emissions. Finally, a brief section identifies key points on China’s status ininternational cooperation.
China in Context
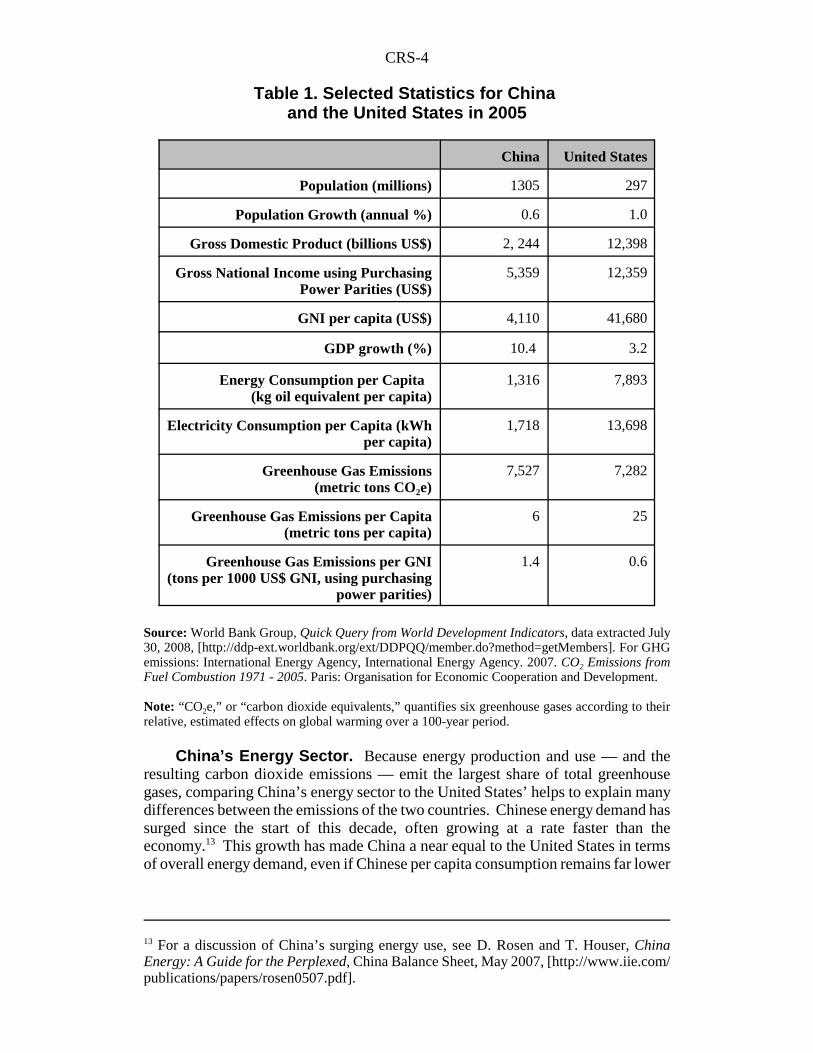
Table 1 provides selected statistics from 2005 to allow comparison betweenChina and the United States. While China’s population is approximately four timeslarger than that of the United States, its economy, as measured using nominalexchange rates,11 was only about one-sixth as large. Conversion of currencies usingpurchasing power parities instead of exchange rates (see Text Box, p. 11) results ina Chinese economy about half as large as that of the United States.12
CRS-4
13 For a discussion of China’s surging energy use, see D. Rosen and T. Houser, ChinaEnergy: A Guide for the Perplexed, China Balance Sheet, May 2007, [http://www.iie.com/publications/papers/rosen0507.pdf].
Table 1. Selected Statistics for China and the United States in 2005
China United States
Population (millions) 1305 297
Population Growth (annual %) 0.6 1.0
Gross Domestic Product (billions US$) 2, 244 12,398
Gross National Income using PurchasingPower Parities (US$)
5,359 12,359
GNI per capita (US$) 4,110 41,680
GDP growth (%) 10.4 3.2
Energy Consumption per Capita (kg oil equivalent per capita)
1,316 7,893
Electricity Consumption per Capita (kWhper capita)
1,718 13,698
Greenhouse Gas Emissions(metric tons CO2e)
7,527 7,282
Greenhouse Gas Emissions per Capita(metric tons per capita)
6 25
Greenhouse Gas Emissions per GNI(tons per 1000 US$ GNI, using purchasing
power parities)
1.4 0.6
Source: World Bank Group, Quick Query from World Development Indicators, data extracted July30, 2008, [http://ddp-ext.worldbank.org/ext/DDPQQ/member.do?method=getMembers]. For GHGemissions: International Energy Agency, International Energy Agency. 2007. CO2 Emissions fromFuel Combustion 1971 - 2005. Paris: Organisation for Economic Cooperation and Development.
Note: “CO2e,” or “carbon dioxide equivalents,” quantifies six greenhouse gases according to theirrelative, estimated effects on global warming over a 100-year period.
China’s Energy Sector. Because energy production and use — and theresulting carbon dioxide emissions — emit the largest share of total greenhousegases, comparing China’s energy sector to the United States’ helps to explain manydifferences between the emissions of the two countries. Chinese energy demand hassurged since the start of this decade, often growing at a rate faster than theeconomy.13 This growth has made China a near equal to the United States in termsof overall energy demand, even if Chinese per capita consumption remains far lower

CRS-5
14 These data are from the BP Statistical Review of World Energy 2008, available at[http://www.bp.com].15 Estimates of GHG emissions in China are uncertain, in part because of underlyinguncertainties in official energy and economic data. Such data issues are more pronouncedwhen considering data over time (for example, regarding changes in coal data over the pastdecade) or in comparison to other countries, where levels of uncertainty may be less.16 The Netherlands Environmental Assessment Agency was the first organization to statethat Chinese carbon dioxide emissions, the main greenhouse gas, exceeded those of theUnited States starting in 2006. Since then, other organizations have made similarstatements. See E. Rosenthal, “China Increases Lead as Biggest Carbon Dioxide Emitter,”New York Times, June 14, 2008.17 The People’s Republic of China Initial National Communications on Climate Change,Office of National Coordination Committee on Climate Change, 2007, available at[http://www.ccchina.gov.cn/en/index.asp].18 Like some other developing countries, China has resisted proposals in international
(continued...)
(at 1.3, compared to 7.9, metric tons of oil equivalent per capita in 2005 — seeTable 1).
In 2007, the United States used petroleum for 40% of its total energy needs,with coal and natural gas each contributing about 25%, and nuclear and hydroelectriccontributing another 10%. In China, however, coal provided 70% of total energy,with petroleum contributing 20%, gas 3%, and hydroelectric and nuclear theremaining 7%.14,15 China now consumes about twice as much coal each year as theUnited States, even though its total energy demand in 2007 was about 21% less,according to British Petroleum (BP) data. The next biggest differences betweenChina and the United States in energy structure — besides China’s greater relianceon coal — are China’s limited quantities of domestic natural gas and fewer nuclearpower plants.
China’s National Greenhouse Gas Emissions
China’s greenhouse gas emissions have become a point of polemics in U.S.debate over appropriate domestic climate change policy, especially regarding the“fairness” of whether the United States government should commit legally togreenhouse gas reductions before or simultaneously with the government of China.A variety of perspectives — and supporting data — are put forward in such debates.This section reviews available data and, along with Table 1, describes how estimatesof GHG in absolute terms, relative to population or economic production, orassociated with exports to other countries, may enter into policy consideration. It alsoassesses arguments that countries’ contributions to atmospheric concentrations, ortheir emissions related to exports to consuming nations, should play a role indeciding equitable shares of global GHG reduction efforts.
By most estimates, China is now, or soon will be, the largest emitter ofgreenhouse gases (GHG) globally.16 The most recent — and only — official GHGinventory published by the government of China was for the year 1994.17,18 At that
CRS-6
18 (...continued)negotiations under the United Nations Framework Convention on Climate Change(UNFCCC) that developing countries submit annual GHG inventories to the Conference ofthe Parties. 19 MMTCO2e means “million metric tons of carbon dioxide equivalent,” which is anaggregate of all greenhouse gases with each gas weighted by its effect on climate changecompared to CO2. 20 “China: Backgrounder: Current GHG Emissions in China, Xinhua, June 4, 2007,[http://www.chinaview.cn].21 For background information on GHGs, see CRS Report RL34513, Climate Change:Current Issues and Policy Tools, by Jane A. Leggett.22 IEA Database on CO2 Emissions from Fuel Combustion, 1971-2005, IEA, 2007.Contrary to the title, this series of publications contains estimates of all 6 greenhouse gases.
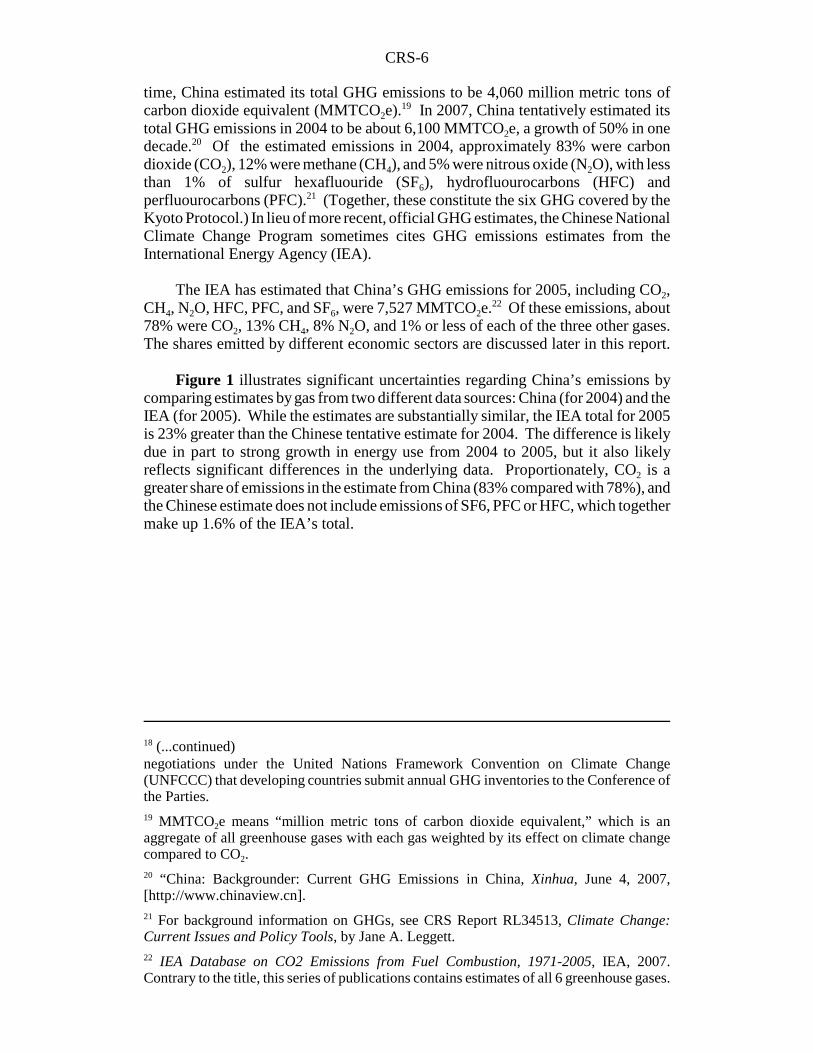
time, China estimated its total GHG emissions to be 4,060 million metric tons ofcarbon dioxide equivalent (MMTCO2e).19 In 2007, China tentatively estimated itstotal GHG emissions in 2004 to be about 6,100 MMTCO2e, a growth of 50% in onedecade.20 Of the estimated emissions in 2004, approximately 83% were carbondioxide (CO2), 12% were methane (CH4), and 5% were nitrous oxide (N2O), with lessthan 1% of sulfur hexafluouride (SF6), hydrofluourocarbons (HFC) andperfluourocarbons (PFC).21 (Together, these constitute the six GHG covered by theKyoto Protocol.) In lieu of more recent, official GHG estimates, the Chinese NationalClimate Change Program sometimes cites GHG emissions estimates from theInternational Energy Agency (IEA).
The IEA has estimated that China’s GHG emissions for 2005, including CO2,CH4, N2O, HFC, PFC, and SF6, were 7,527 MMTCO2e.22 Of these emissions, about78% were CO2, 13% CH4, 8% N2O, and 1% or less of each of the three other gases.The shares emitted by different economic sectors are discussed later in this report.
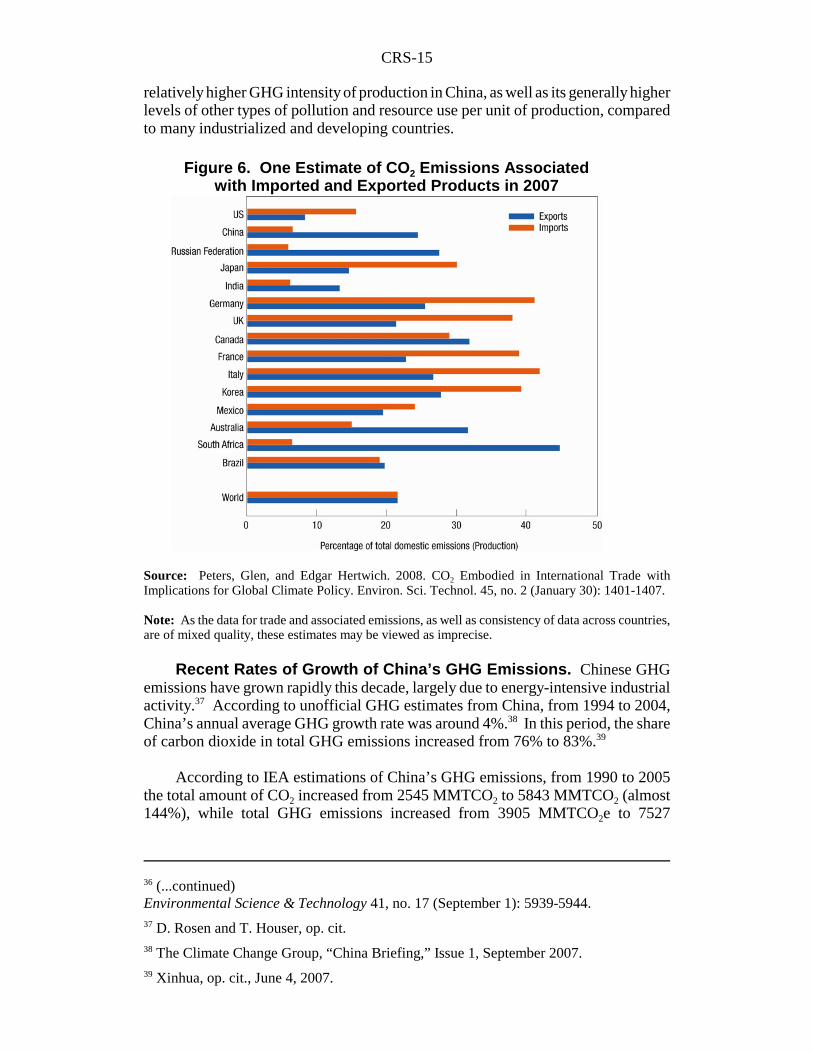
Figure 1 illustrates significant uncertainties regarding China’s emissions bycomparing estimates by gas from two different data sources: China (for 2004) and theIEA (for 2005). While the estimates are substantially similar, the IEA total for 2005is 23% greater than the Chinese tentative estimate for 2004. The difference is likelydue in part to strong growth in energy use from 2004 to 2005, but it also likelyreflects significant differences in the underlying data. Proportionately, CO2 is agreater share of emissions in the estimate from China (83% compared with 78%), andthe Chinese estimate does not include emissions of SF6, PFC or HFC, which togethermake up 1.6% of the IEA’s total.

CRS-7
23 China published this document in June 2007 to outline its plan to address climate changeand show its determination to mitigate emissions. The official document is available at[http://english.gov.cn/2007-06/04/content_635624.htm].24 National Development and Reform Commission (NDRC), “China’s National ClimateChange Program,” p. 10.25 According to IEA’s most recent estimates for 2005, China’s emissions were 7,484MMTCO2e and the United States’ emissions were 7,282 MMTCO2e. All of the other listed
(continued...)
Source: CRS figure with estimates from IEA database (extracted January 8, 2008) and Xinhua (June4, 2008).
According to China’s National Climate Change Program,23 China offset aportion of its GHG emissions with removals (sequestration) by forests: “from 1980to 2005, a total of 3.06 billion tons of CO2 were absorbed by afforestation, a total of1.62 million tons of CO2 were absorbed by forest management, and 430 million tonsof CO2 from deforestation were saved.”24 Removals of CO2 from the atmosphere byland use, land use change and forestry are much more uncertain in all countries thanemissions by human activities.
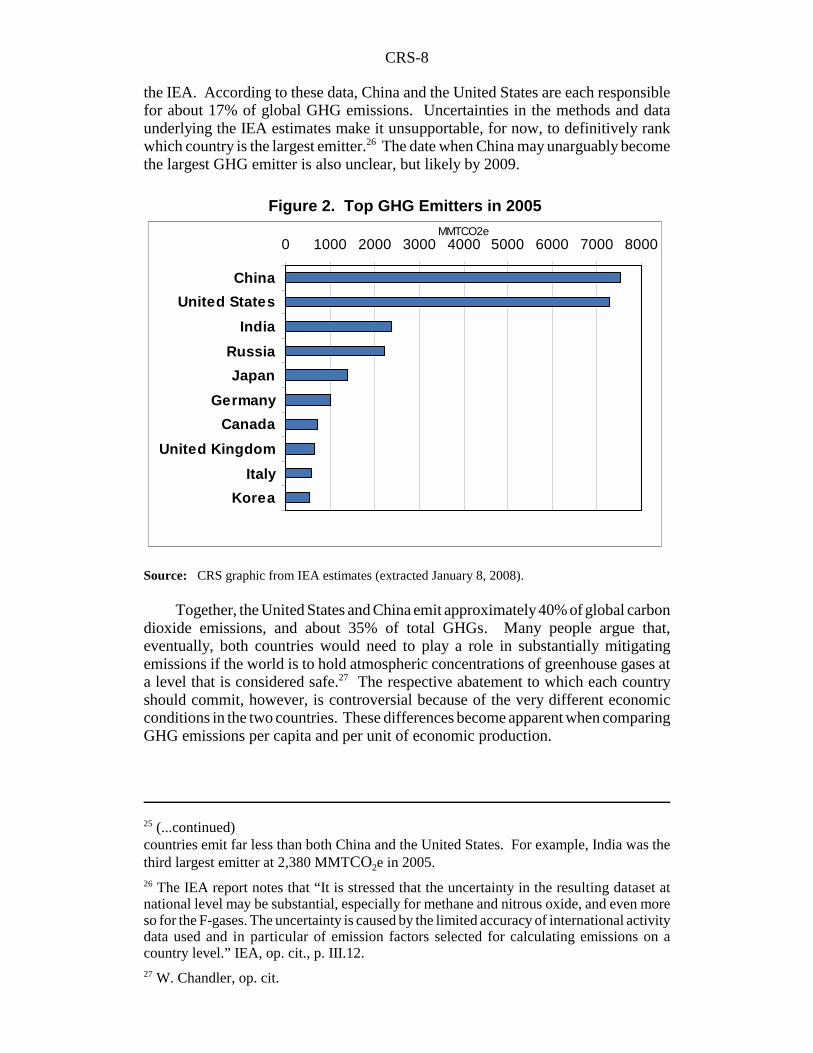
According to IEA data, China and the United States are approximately tied asthe leading global emitters of GHG emissions, both at more than 7 billion metrictonnes per year.25 Figure 2 ranks the world’s leading GHG emitters, using data from
0
1000
2000
3000
4000
5000
6000
7000
8000
China's TentativeEstimates for 2004
IEA Estimates for2005
MM
TCO
2e
SF6
PFC
HFC
N2O
CH4
CO2
Figure 1. Comparison of Estimations of GHG Emissions in China for2004 and 2005
CRS-8
25 (...continued)countries emit far less than both China and the United States. For example, India was thethird largest emitter at 2,380 MMTCO2e in 2005. 26 The IEA report notes that “It is stressed that the uncertainty in the resulting dataset atnational level may be substantial, especially for methane and nitrous oxide, and even moreso for the F-gases. The uncertainty is caused by the limited accuracy of international activitydata used and in particular of emission factors selected for calculating emissions on acountry level.” IEA, op. cit., p. III.12.27 W. Chandler, op. cit.
0 1000 2000 3000 4000 5000 6000 7000 8000
China
United States
India
Russia
Japan
Germany
Canada
United Kingdom
Italy
Korea
MMTCO2e
Figure 2. Top GHG Emitters in 2005
the IEA. According to these data, China and the United States are each responsiblefor about 17% of global GHG emissions. Uncertainties in the methods and dataunderlying the IEA estimates make it unsupportable, for now, to definitively rankwhich country is the largest emitter.26 The date when China may unarguably becomethe largest GHG emitter is also unclear, but likely by 2009.
Source: CRS graphic from IEA estimates (extracted January 8, 2008).
Together, the United States and China emit approximately 40% of global carbondioxide emissions, and about 35% of total GHGs. Many people argue that,eventually, both countries would need to play a role in substantially mitigatingemissions if the world is to hold atmospheric concentrations of greenhouse gases ata level that is considered safe.27 The respective abatement to which each countryshould commit, however, is controversial because of the very different economicconditions in the two countries. These differences become apparent when comparingGHG emissions per capita and per unit of economic production.
CRS-9
28 There has been substantial literature internationally concerning “contraction andconvergence” of emissions per capita. See, for example, [http://www.gci.org.uk/contconv/cc.html].
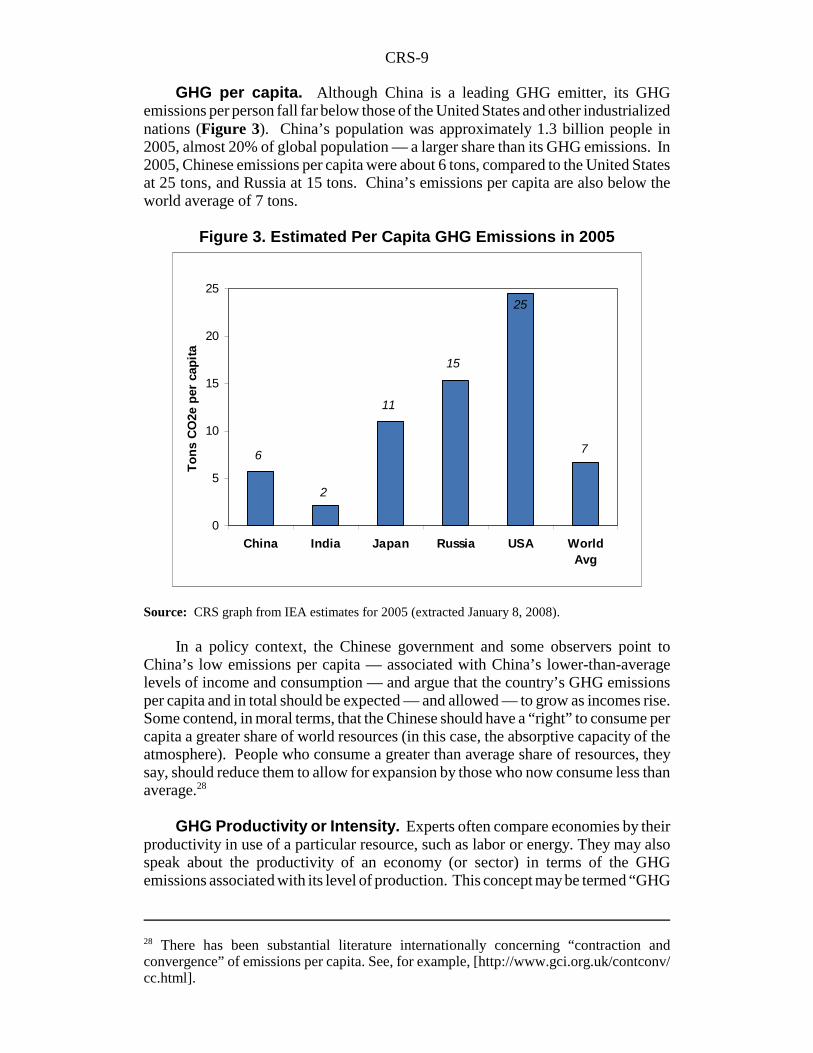
GHG per capita. Although China is a leading GHG emitter, its GHGemissions per person fall far below those of the United States and other industrializednations (Figure 3). China’s population was approximately 1.3 billion people in2005, almost 20% of global population — a larger share than its GHG emissions. In2005, Chinese emissions per capita were about 6 tons, compared to the United Statesat 25 tons, and Russia at 15 tons. China’s emissions per capita are also below theworld average of 7 tons.
Source: CRS graph from IEA estimates for 2005 (extracted January 8, 2008).
In a policy context, the Chinese government and some observers point toChina’s low emissions per capita — associated with China’s lower-than-averagelevels of income and consumption — and argue that the country’s GHG emissionsper capita and in total should be expected — and allowed — to grow as incomes rise.Some contend, in moral terms, that the Chinese should have a “right” to consume percapita a greater share of world resources (in this case, the absorptive capacity of theatmosphere). People who consume a greater than average share of resources, theysay, should reduce them to allow for expansion by those who now consume less thanaverage.28
GHG Productivity or Intensity. Experts often compare economies by theirproductivity in use of a particular resource, such as labor or energy. They may alsospeak about the productivity of an economy (or sector) in terms of the GHGemissions associated with its level of production. This concept may be termed “GHG
7
25
15
11
2
6
0
5
10
15
20
25
China India Japan Russia USA WorldAvg
To
ns
CO
2e p
er c
apit
a
Figure 3. Estimated Per Capita GHG Emissions in 2005

CRS-10
29 According to the World Bank, “GNI is the sum of value added by all resident producersplus any product taxes (less subsidies) not included in the valuation of output plus netreceipts of primary income (compensation of employees and property income) from abroad.”
productivity” or “GHG intensity.” The lower a GHG intensity number for aneconomy, the more efficient that economy is in terms of its GHG emissions per unitof production, typically measured as gross domestic product (GDP) or gross nationalincome (GNI).29 Some experts — and President George W. Bush — have proposedsetting international GHG emission control targets in terms of the rate ofimprovement of GHG/GDP, also called “GHG intensity targets.” They believe thatthis form of GHG target would not penalize economic growth, among other reasons.
Source: CRS graph from IEA estimates for 2005 (extracted January 8, 2008) and World Bankeconomic Gross National Income data (extracted September 10, 2008).
Though China’s emissions per capita are lower than most developed nations,China’s GHG intensity remains higher than most nations (Figure 4) and well abovethe world average of about 0.78 tons of GHG per billion U.S. dollars of GrossNational Income using purchasing power parities (GNIppp) to convert currencies toUS dollars (see Text Box). China’s emissions are about 1.40 million MMTCO2e perbillion U.S. dollars of GNIppp — nearly twice the world average. Russia is slightlybelow China by these estimates at 1.33 MMTCO2e per billion U.S. dollars of GNIppp.followed by India at 0.98 MMTCO2e. The United States, like most high incomecountries with large service sectors has a GHG intensity of about 0.59MMTCO2e/GNIppp.
Figure 4. Estimated GHG Intensities in 2005
CRS-11
30 Fisher-Vanden, Karen, and Mun S. Ho. 2006. Technology, Development, and theEnvironment, under review, [http://www.dartmouth.edu/~kfv/Paperspub.htm].31 CRS estimates using IEA and World Bank data.32 Some view Chinese energy and economic statistics with caution. “Energy Consumptionper Unit of GDP Continues to Fall,” Xinhua, July 15, 2008.
The overall level of economic activity and industrialization are importantdeterminants of GHG emissions. Since China is trying to increase its nationalincome, its emissions are also expected to increase. China and other developingcountries give high priority to eradicating poverty and raising the incomes (incomeper capita) of their populations toward those of industrialized nations. Consequently,these countries contend in GHG negotiations that addressing climate change must beof lesser priority, while wealthier countries take the lead in reducing their GHGemissions.
Some experts argue that economies that are less GHG-efficient (with higherGHG intensity), such as China, must have greater opportunity and responsibility toimprove those efficiencies. Some of these experts may argue that advancing growthof developing economies would naturally lead to less GHG emissions (based onsome, but disputed, analysis that emission intensities of economies naturally declineas incomes rise). Others have found that rapidly advancing technologies in use mayimprove GHG intensity but result in greater GHG emissions overall because of themacroeconomic expansion and consumption they could stimulate.30
Though total GHG emissions have grown in China, its GHG emissions intensityhas substantially fallen in recent decades, though not consistently. In the last fewyears, aggressive energy efficiency policies have contributed to this decline, and willbe discussed further in the domestic policy section. Using IEA’s GHG emissionestimates and the World Bank’s World Development Indicators, China’s GHGintensity fell more than two-thirds from 1990 to 2005 (whether calculated by GDPusing exchange rates or GNI using purchasing power parities). For the same period,the world average emissions intensity dropped 43%, while the United States’ GHGintensity declined by 48%.31 As a measure of the progress of its national policy, theNational Bureau of Statistics, the National Development and Reform Commission(NDRC), and the National Energy Administration said in a statement that the energyconsumption for every 10,000 yuan of GDP for 2007 was 1.6 tons of coal equivalent,falling by 3.7% from the year 2006.32
CRS-12
Measurement of Economic Activity Affects Cross-Country Comparisons
How economic activity is measured influences the comparison of GHGintensities across countries. The exchange rate between the Chinese currency and theU.S. dollar influence how this number is reported, for example. The Chinese RMBhas strengthened roughly 20% in comparison to the dollar since it began a “managedfloat” in July 2005,a resulting in a relative increase in China’s estimated GDP andtherefore lowering of Chinese GHG intensity.b Many analysts believe that usingpurchasing power parity (PPP) — like several estimates in this CRS report — ratherthan currency exchange rates, is a better way to compare GHG intensities acrosscountries with different economic structures and conditions.
Economists have attempted to factor-in national price differentials by using apurchasing power parity (PPP) measurement. The PPP converts foreign currenciesinto a common currency (usually the U.S. dollar) on the basis of the actual purchasingpower of those currencies (based on surveys of the prices of various goods andservices) in each respective country. In other words, the PPP data attempt to determinehow much local currency (yuan, for example) would be needed to purchase acomparable level of goods and services in the United States per U.S. dollar.
However, Purchasing Power Parities are estimated as well; a World Bankrevision of its PPPs in December 2007 reduced estimates of the size of China’seconomy by about 40% for 2005.c This relative reduction of the size of Chineseeconomy, while estimates of GHG emissions remained constant, raised CRS’calculation of China’s GHG intensity for 2005 from 0.98 to 1.40 — raising itsubstantially relative to other countries (for which the world average remained thesame). a. B. Naughton, Summer 2008. “The Inflation Battle: Juggling Three Swords,” ChinaLeadership Monitor, [http://www.hoover.org/publications/clm/issues/20100644.html]. b. CRS Report RS22808, How Large is China’s Economy? Does it Matter?, by Wayne M.Morrison and Michael F. Martin. c. [http://www.imf.org/external/pubs/ft/survey/so/2008/RES018A.htm].
China’s Contribution to GHG Concentrations. Internationally, 192countries — including the United States — have joined the 1992 United NationsFramework Convention on Climate Change (UNFCCC) to stabilize “greenhouse gasconcentrations in the atmosphere at a level that would prevent dangerousanthropogenic interference with the climate system” (Art. 2). In the UNFCCC,governments agreed to a principle of “common but differentiated responsibilities”among countries. This principle is at the core of debate about how to share amongcountries the challenge of stabilizing GHG concentrations. In the negotiations leadingto the Kyoto Protocol, the Brazilian delegation proposed that the effort to reduceGHG emissions might be shared globally, with commitments from developingcountries not beginning until their contributions to present or future GHGconcentrations in the atmosphere reach those of the historical contributions ofindustrialized countries (“the Brazil Proposal”).
Thus, much analysis and political discussion about appropriate responsibilitiesamong countries for mitigating emissions has revolved around how much eachcountry has contributed to the accumulation of GHG in the atmosphere (i.e., GHG
CRS-13
33 Although Figure 5 comes from B. Muller, et al., Differentiating (Historic)Responsibilities for Climate Change — Summary Report (October 2007), a better referencefor the analysis is Den Elzen, Michel. 2007. Report of the Ad Hoc Group on Modeling andAssessment of Contributions to Climate Change (MATCH). April 7, 2007, [http://www.match-info.net/].34 See CRS Report RL33826, Climate Change: The Kyoto Protocol, Bali “Action Plan,” andInternational Actions, by Susan Fletcher and Larry Parker, for further discussion ofinternational negotiations to mitigate GHG.
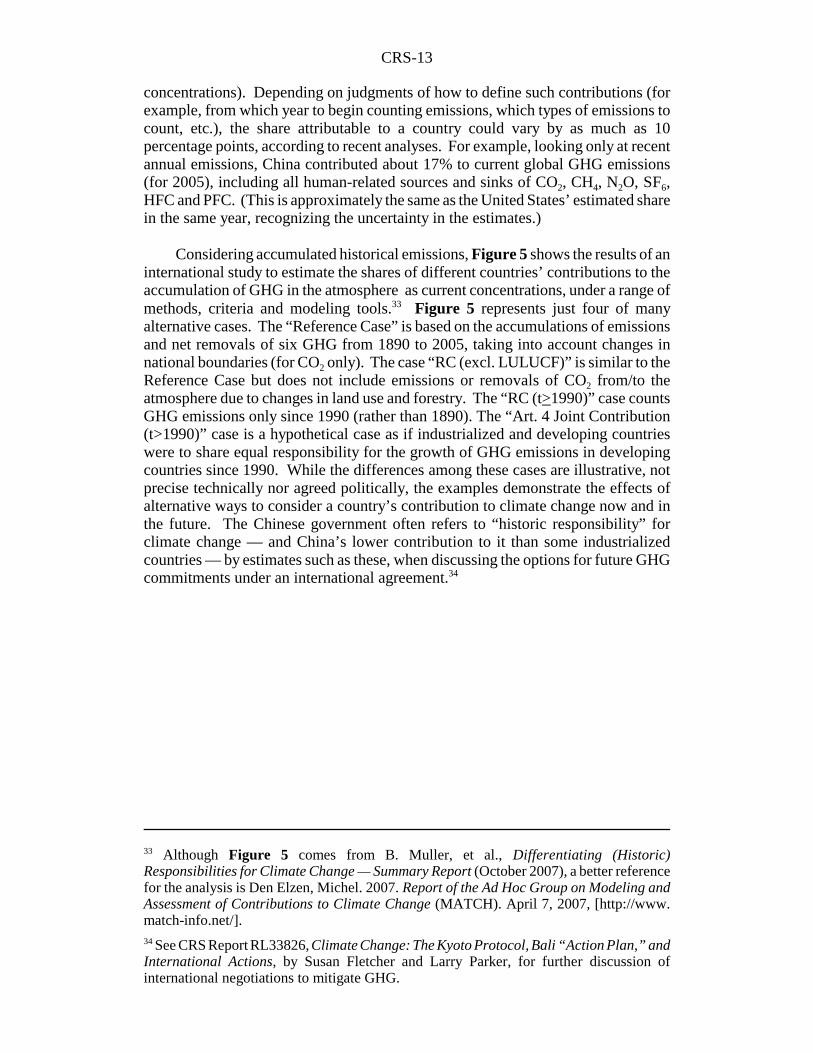
concentrations). Depending on judgments of how to define such contributions (forexample, from which year to begin counting emissions, which types of emissions tocount, etc.), the share attributable to a country could vary by as much as 10percentage points, according to recent analyses. For example, looking only at recentannual emissions, China contributed about 17% to current global GHG emissions(for 2005), including all human-related sources and sinks of CO2, CH4, N2O, SF6,HFC and PFC. (This is approximately the same as the United States’ estimated sharein the same year, recognizing the uncertainty in the estimates.)
Considering accumulated historical emissions, Figure 5 shows the results of aninternational study to estimate the shares of different countries’ contributions to theaccumulation of GHG in the atmosphere as current concentrations, under a range ofmethods, criteria and modeling tools.33 Figure 5 represents just four of manyalternative cases. The “Reference Case” is based on the accumulations of emissionsand net removals of six GHG from 1890 to 2005, taking into account changes innational boundaries (for CO2 only). The case “RC (excl. LULUCF)” is similar to theReference Case but does not include emissions or removals of CO2 from/to theatmosphere due to changes in land use and forestry. The “RC (t>1990)” case countsGHG emissions only since 1990 (rather than 1890). The “Art. 4 Joint Contribution(t>1990)” case is a hypothetical case as if industrialized and developing countrieswere to share equal responsibility for the growth of GHG emissions in developingcountries since 1990. While the differences among these cases are illustrative, notprecise technically nor agreed politically, the examples demonstrate the effects ofalternative ways to consider a country’s contribution to climate change now and inthe future. The Chinese government often refers to “historic responsibility” forclimate change — and China’s lower contribution to it than some industrializedcountries — by estimates such as these, when discussing the options for future GHGcommitments under an international agreement.34
CRS-14
35 Weber, Christopher L., Glen P. Peters, Dabo Guan, and Klaus Hubacek. “TheContribution of Chinese Exports to Climate Change.” Energy Policy. doi:10.1016/j.enpol.2008.06.009. 36 Peters, G.P., C.L. Weber, D. Guan, and K. Hubacek. 2007. “China’s Growing CO2
Emissions — A Race between Increasing Consumption and Efficiency Gains.”(continued...)
Source: Muller et al.
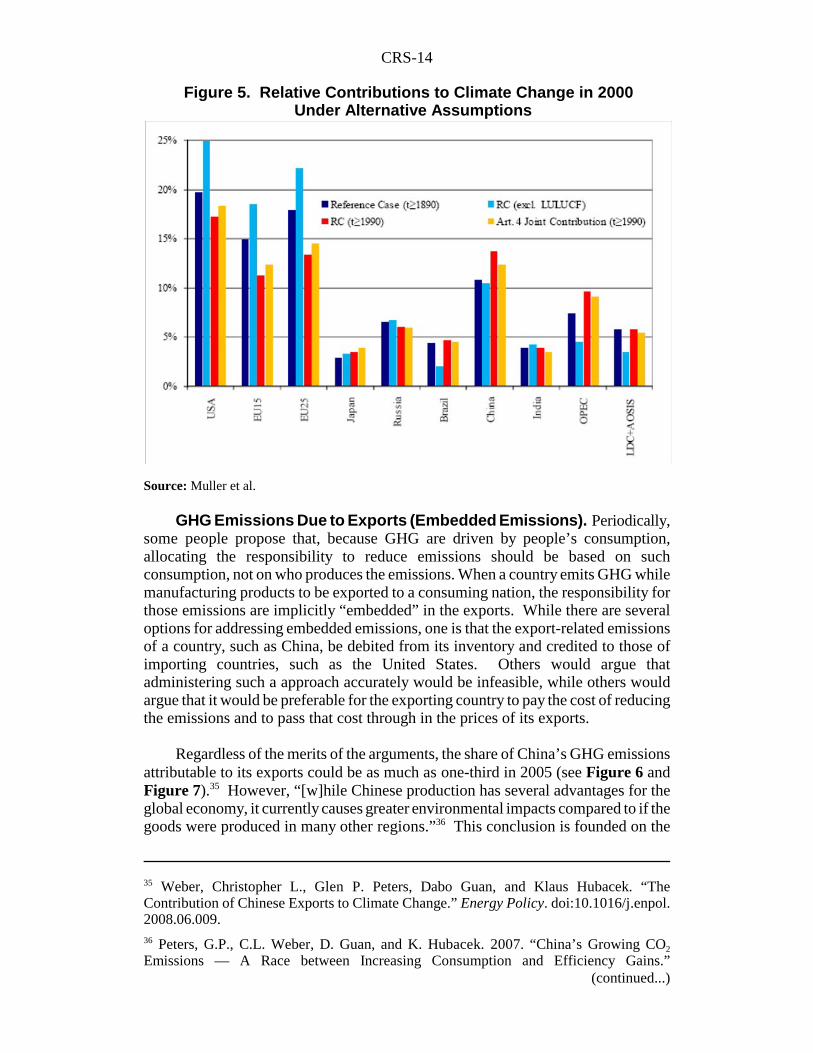
GHG Emissions Due to Exports (Embedded Emissions). Periodically,some people propose that, because GHG are driven by people’s consumption,allocating the responsibility to reduce emissions should be based on suchconsumption, not on who produces the emissions. When a country emits GHG whilemanufacturing products to be exported to a consuming nation, the responsibility forthose emissions are implicitly “embedded” in the exports. While there are severaloptions for addressing embedded emissions, one is that the export-related emissionsof a country, such as China, be debited from its inventory and credited to those ofimporting countries, such as the United States. Others would argue thatadministering such a approach accurately would be infeasible, while others wouldargue that it would be preferable for the exporting country to pay the cost of reducingthe emissions and to pass that cost through in the prices of its exports.
Regardless of the merits of the arguments, the share of China’s GHG emissionsattributable to its exports could be as much as one-third in 2005 (see Figure 6 andFigure 7).35 However, “[w]hile Chinese production has several advantages for theglobal economy, it currently causes greater environmental impacts compared to if thegoods were produced in many other regions.”36 This conclusion is founded on the
Figure 5. Relative Contributions to Climate Change in 2000 Under Alternative Assumptions
CRS-15
36 (...continued)Environmental Science & Technology 41, no. 17 (September 1): 5939-5944.37 D. Rosen and T. Houser, op. cit.38 The Climate Change Group, “China Briefing,” Issue 1, September 2007.39 Xinhua, op. cit., June 4, 2007.
relatively higher GHG intensity of production in China, as well as its generally higherlevels of other types of pollution and resource use per unit of production, comparedto many industrialized and developing countries.
Source: Peters, Glen, and Edgar Hertwich. 2008. CO2 Embodied in International Trade withImplications for Global Climate Policy. Environ. Sci. Technol. 45, no. 2 (January 30): 1401-1407.
Note: As the data for trade and associated emissions, as well as consistency of data across countries,are of mixed quality, these estimates may be viewed as imprecise.
Recent Rates of Growth of China’s GHG Emissions. Chinese GHGemissions have grown rapidly this decade, largely due to energy-intensive industrialactivity.37 According to unofficial GHG estimates from China, from 1994 to 2004,China’s annual average GHG growth rate was around 4%.38 In this period, the shareof carbon dioxide in total GHG emissions increased from 76% to 83%.39
According to IEA estimations of China’s GHG emissions, from 1990 to 2005the total amount of CO2 increased from 2545 MMTCO2 to 5843 MMTCO2 (almost144%), while total GHG emissions increased from 3905 MMTCO2e to 7527
Figure 6. One Estimate of CO2 Emissions Associatedwith Imported and Exported Products in 2007

CRS-16
40 International Energy Agency, op. cit., data extracted July 8, 2008.41 According to report released by the Netherlands Environmental Assessment Agency,[http://www.mongabay.com].42 Weber, Christopher L., Glen P. Peters, Dabo Guan, and Klaus Hubacek. 2008. “TheContribution of Chinese Exports to Climate Change.” Energy Policy. doi:10.1016/j.enpol.2008.06.009.43 Population growth rates taken from United Nations, World Population Prospects: The2006 Revision, 2007; and Central Intelligence Agency, The World Factbook: China, July2008, [https://www.cia.gov/library/publications/the-world-factbook/geos/ch.html].
MMTCO2e (152%).40 China’s increasing carbon dioxide emissions — up 8% from2006 to 2007 — accounted for two-thirds of the growth in all global CO2 emissionsin 2007.41
Figure 7 provides one estimate of the economic activities that have been drivingrecent growth of Chinese GHG emissions. It concludes that the emissions associatedwith exports have grown rapidly in the past few years, but most growth has been dueto capital investment (construction of buildings, roads, etc.) and increasedconsumption by growing population and — especially — incomes.42
China exercises strong policies to slow population growth; the growth ofpopulation in 2005 was approximately 0.6%, down from an average rate of about1.1% in the 1990s and 1.4% in the 1980s,43 helping to diminish the correspondinggrowth of national GHG emissions. China’s population policies are clearly not
Figure 7. One Estimate of Factors Driving Recent Growth of GHG Emissions in China
CRS-17
44 According to Gao Guangsheng of the NDRC, Chinese carbon dioxide emissions wouldhave been 1.3 billion tons higher in 2005 had the country not implemented family planningpolicies in the 1970s, [http://www.pewclimate.org/docUploads/Gao%20Guangsheng.pdf].Some people find family planning and other methods of birth control immoral. Regardlessof moral viewpoint, slowing population growth is likely to contributing to GHG mitigation.45 National Bureau of Statistics, China Statistical Yearbook 2007.46 People’s Republic of China, Initial National Communication on Climate Change, 2004.47 China Climate Change Info-Net. 2008. Low Carbon, High Hopes. August 11,[http://www.ccchina.gov.cn/en/NewsInfo.asp?NewsId=13798].48 Energy Information Administration, International Energy Outlook 2008, Table A.10, U.S.DOE, June 2008.49 See IEA, World Energy Outlook 2007: Focus on China and India, November 2007.
aimed at mitigating GHG emissions, but observers note that without them emissionswould have increased substantially.44
China reports that from 1991 to 2005, its real GDP grew at an average annualrate of 10.2% while its annual rate of energy growth was 5.6%.45 Much of theimprovement came from economic restructuring and energy efficiencyimprovements. China’s emissions growth is also driven heavily by increasedconsumption of electricity generated from coal.
GHG Projections. China’s emissions are widely projected to continue risingrapidly for at least the near future. The trajectory of future Chinese emissionsdepends on many variables, some of which are impossible to predict, includingtechnological breakthroughs, economic growth, and developments in internationalnegotiations. According to the Chinese Initial National Communication on ClimateChange,46
[t]he principal factors affecting China’s future GHG emissions are: populationgrowth and increasing urbanization, the changes in the pattern of economicdevelopment and consumption, the expansion in people’s daily necessities, theadjustment in economic structure and technological progress, and the changes inforestry and ecological preservation and construction.
While many envision continued strong growth, there is also the possibility thatChinese emissions will decline, perhaps due to social and political upheaval thatresults in economic slowdown. There are also Chinese officials who envision halfor more of China’s energy coming from nuclear and renewable energy sources by2050.47
Given “business as usual,” the U.S. Energy Information Administrationforecasts an average growth rate in Chinese carbon dioxide emissions of 3.3% peryear between 2005 and 2030.48 This trajectory would put Chinese carbon dioxideemissions at just over 12 billion metric tons in 2030, nearly twice the level of theUnited States that year at 6.9 billion metric tons. Forecasts of Chinese emissions bythe IEA are similar, although slightly lower than the EIA’s.49
CRS-18
50 Pew Center on Global Climate Change, “Climate Change Mitigation Measures in thePeople’s Republic of China,” p. 1, April 2007.
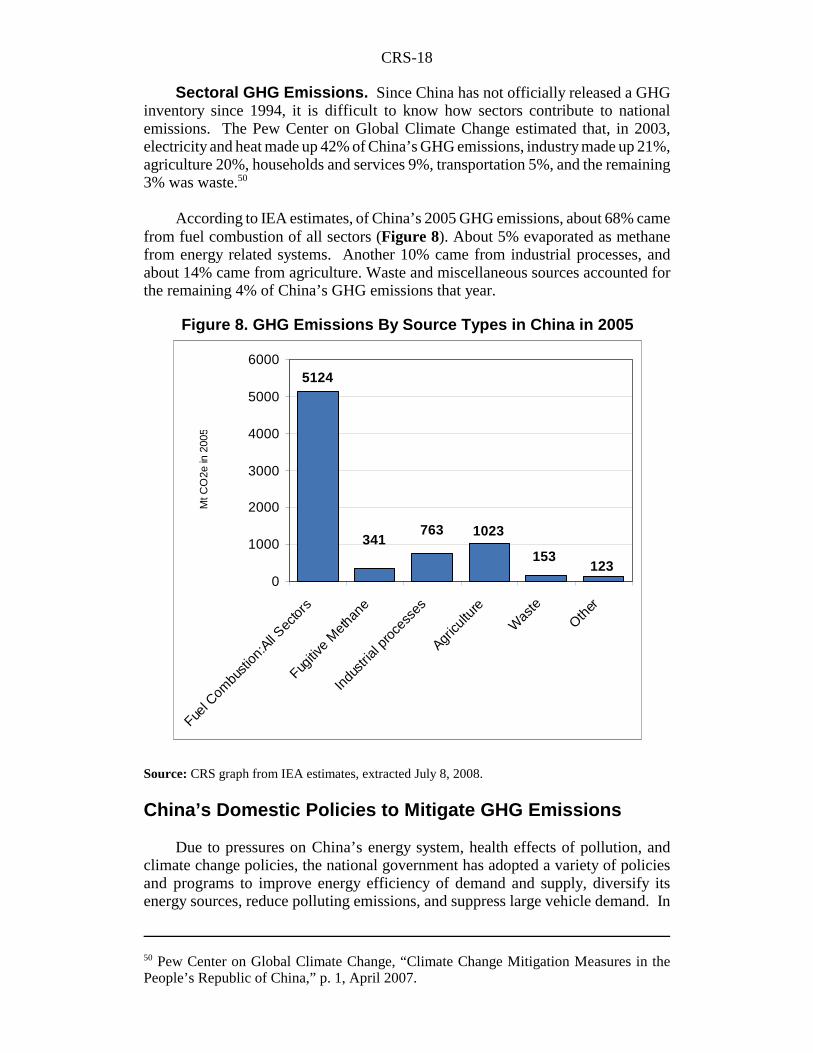
Sectoral GHG Emissions. Since China has not officially released a GHGinventory since 1994, it is difficult to know how sectors contribute to nationalemissions. The Pew Center on Global Climate Change estimated that, in 2003,electricity and heat made up 42% of China’s GHG emissions, industry made up 21%,agriculture 20%, households and services 9%, transportation 5%, and the remaining3% was waste.50
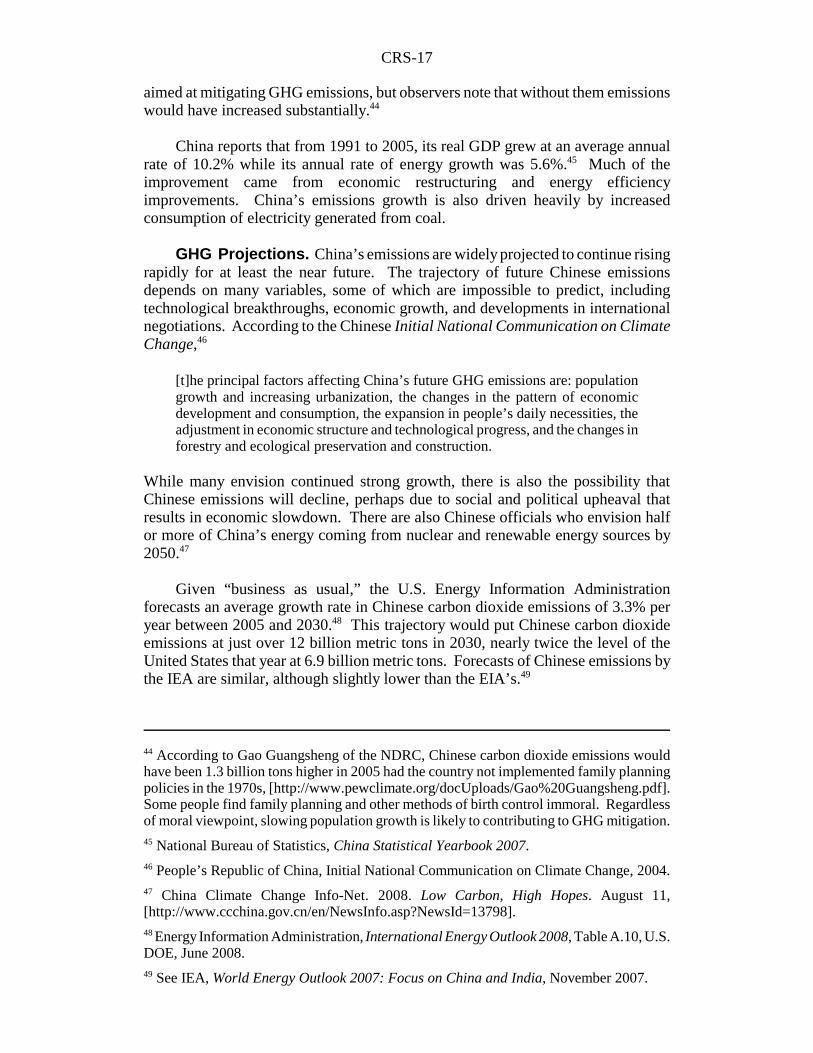
According to IEA estimates, of China’s 2005 GHG emissions, about 68% camefrom fuel combustion of all sectors (Figure 8). About 5% evaporated as methanefrom energy related systems. Another 10% came from industrial processes, andabout 14% came from agriculture. Waste and miscellaneous sources accounted forthe remaining 4% of China’s GHG emissions that year.
Source: CRS graph from IEA estimates, extracted July 8, 2008.
China’s Domestic Policies to Mitigate GHG Emissions
Due to pressures on China’s energy system, health effects of pollution, andclimate change policies, the national government has adopted a variety of policiesand programs to improve energy efficiency of demand and supply, diversify itsenergy sources, reduce polluting emissions, and suppress large vehicle demand. In
5124
341763 1023
153123
0
1000
2000
3000
4000
5000
6000
Fuel C
ombu
stion
:All S
ector
s
Fugitiv
e M
ethan
e
Indu
strial
pro
cess
es
Agricu
lture
Was
teOth
er
Mt C
O2e
in 2
005
Figure 8. GHG Emissions By Source Types in China in 2005
CRS-19
51 Jiang Xufeng. 2008. China Takes Responsible Attitude to Climate Change andEnvironmental Protection. Xinhua, April 13, English edition. Estimate uses currencyexchange rates.52 The China Sustainable Energy Program, op. cit., [http://www.efchina.org].53 R. Shen, “China May Hit Energy Use Target for First Time in 08,” Reuters, February 25,2008.
June 2007, China released its first national strategy on climate change. The plan,called China’s National Climate Change Program, promises to improve energyefficiency and expand low-carbon energy supply, but rejects any mandatory caps ongreenhouse gas emissions. The report also states that China is taking a responsibleattitude towards climate change, and contends that some measures taken by China aremore proactive than those of some developed countries. Many of the policies havebeen laid out as well by the Renewable Energy Law of 2005; the EnergyConservation Law of 2008; the Medium- and Long-Term Development Plan forRenewable Energy issued by the National Development and Reform Commission(NDRC); and by the Several Opinions Regarding Acceleration of Shutting downSmall Thermal Power Generating Units jointly issued by the NDRC and the StateEnergy Office, and the 11th Five-Year Program (2006-2010).
In support of these programs, the government reports that it is raising spendingon energy efficiency and greenhouse gas emission reduction programs to US$6.1billion in 2008, up from US$3.5 billion in 2007.51
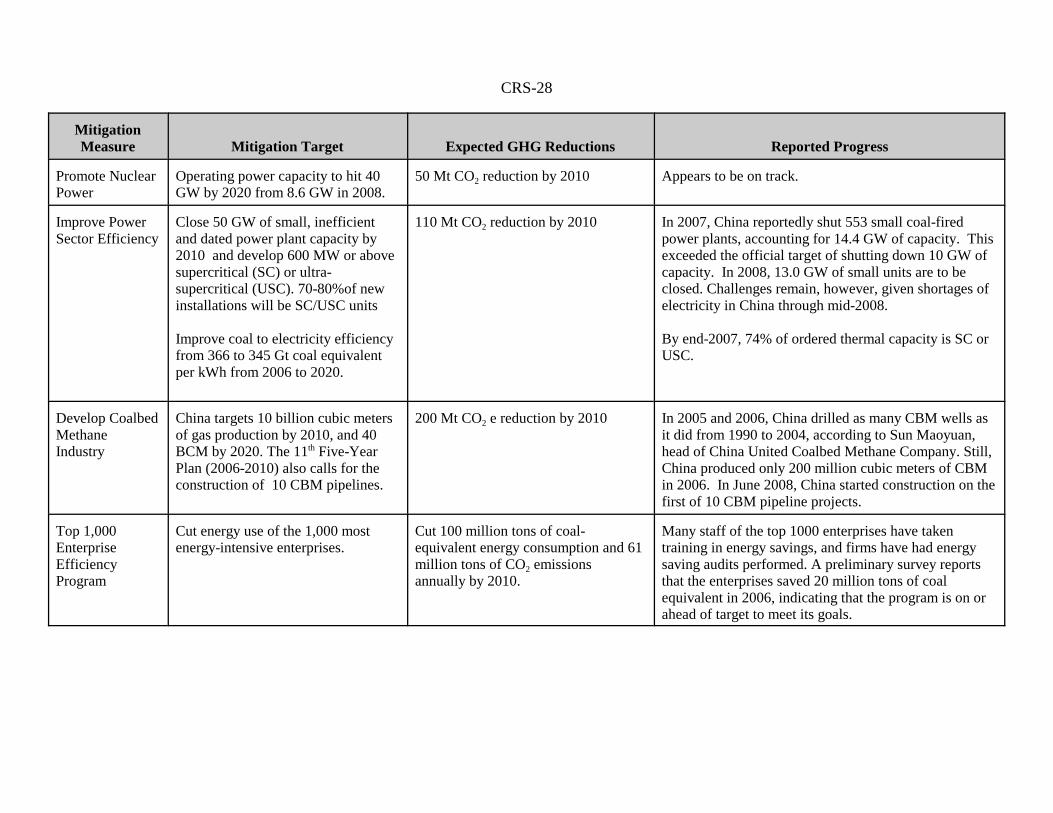
Enacted Domestic Programs in China. Out of the 52 policies andmeasures stated in China’s National Climate Change Program to address climatechange, ten are quantitatively described; these are outlined in Table A-1 of theAppendix to this CRS report. Some information in the table comes from more recentannouncements in China. Brief descriptions of each of the mitigation measures isprovided below. (Estimates of GHG emissions reduced, unless otherwise noted,come from Chinese press releases, and the baseline from which the reductions arecalculated has not been provided.)
An Economy-Wide Energy Efficiency Target. China has set aneconomy-wide energy efficiency target that mandates a 20% reduction in energyintensity (energy use per unit of GDP) between 2005 and 2010. This sets upmilestones of 4% reductions in each year, against which the Chinese government hasbeen measuring performance. The expected greenhouse gas emissions reductionwould be 700 million tons of CO2 by 2010 compared to the business-as-usualbaseline. Progress reports indicate that, in 2006 energy consumption fell 1.23% from2005 levels, short of the 4% annual goal.52 In 2007, preliminary results show aroughly 3% decline.53 Meeting this goal will thus be enormously challenging forChina. Reportedly, China raised its electricity tariffs by about 5% in June 2008 andagain in July 2008, seemingly in line with China’s visible high level attention to itsenergy challenge.
The Renewable Energy Law. Effective since February 2005, China’sRenewable Energy Law (RE Law) has set the world’s most aggressive and legally
CRS-20
54 The China Sustainable Energy Program, “Fact Sheet: China Emerging as New Leader inClean Energy Policies,” [http://www.efchina.org].55 NDRC, China’s National Climate Change Program, p. 31.56 Global Wind Energy Council, Global Wind 2007 Report, April 2008, p. 12. Other reportshave stated that China may become the world’s largest turbine manufacturer by 2009.57 China Climate Change Info-Net. August 11, 2008. Low Carbon, High Hopes, [http://www.ccchina.gov.cn/en/NewsInfo.asp?NewsId=13798].58 Howard, Steve, and Changhua Wu. 2008. China’s Clean Revolution. The Climate Group.
binding target for expanding the use of renewable energy. The law mandates that16% of all energy is to come from wind, biomass, solar, and hydro-power energy by2020. When the RE Law was enacted, only 7% of China’s energy came fromrenewable sources.54 Wind, solar, geothermal, and tidal energy are expected toreduce 60 Mt CO2 by 2010. Bio-energy is expected to create a 30 Mt CO2e reductionby 2010, and hydroelectricity development is expected to reduce emissions by 500Mt CO2.
55 The Global Wind Energy Council predicts China will become the world’slargest wind turbine market by 2010,56 adding to China’s top-standing in solar hotwater use, and a rapidly growing photovoltaic sector. Over the longer term, someofficials have expressed a vision that, by 2050, nuclear power and renewable energymay exceed half the country’s energy production.57
Becoming a major producer and exporter of “clean” technology appears to bea component of China’s overall strategy of “sustainable development.” By 2008,China was the second leading manufacturer of solar photo-voltaic technology, afterJapan; by 2009, China is expected to lead in manufacture of wind turbines. China“is also taking the lead in solar water heaters, energy efficient home appliances, andrechargeable batteries.”58 According to a recent report by the Climate Change Group,based in Britain, “it is precisely [China’s] ability to manufacture technology in largevolumes and at competitive prices that will enable it to dominate the world’srenewable technology market.”
While investment in “green energy” has become a Chinese government priorityand is attracting billions of dollars annually of private capital, some observers havenoted substantial challenges to China’s plans:
Although green energy is drawing more and more attention in China, thedevelopment of the industry is still faced with many difficulties, for instance,uncompleted policy system, excessive reliance of the enterprise(s) on thegovernment for development and relatively unsophisticated technologies andequipment. To be specific, the difficulties are manifested in the followingaspects: 1) there are few professional research institutions under the governmentand its ability to promote extensive use of green energy in the society is yet to beimproved; 2) there are few self-developed technologies, especially high-endtechnologies and most technologies remain in the simulation stage; 3) theindustry is in severe lack of technical professionals and there is urgent need forconservation and training of technical talents; 4) some industry facilities can notmeet the needs of the industry, for instance, poor quality and severe lack of
CRS-21
59 [http://www.zero2ipo.com.hk/china_this_week/detail.asp?id=7164].60 NDRC, op. cit., p. 32.61 Reuters, “China’s Nuclear Power Expansion ‘Faster Than Planned,’” Xinhua, March 8,2008.62 NDRC, China’s National Climate Change Program, p. 32.63 “China to Shut Coal Power Stations This Year Amid Coal Crisis,” International Mining,February 6, 2008. 64 The Power-Technology.com website has more information on this technology in China:[http://www.power-technology.com/projects/yuhuancoal/].65 For example, Jianxiong Mao. 2008. “Status and Development of China’s Electric Power.”Presented at Asia Clean Energy Forum, June 2008. Manila, Philippines.
equipment co-exist. All of these have jointly restricted the development of thegreen energy industry.59
Promoting Nuclear Power. One of China’s main concerns is to activelypromote the development of nuclear power as part of its national energy strategy. In2008, the National Energy Administration raised its target to 5% of installed capacityby 2020, a percentage point higher than the goal set in 2007. China intends toconstruct nuclear power stations in coastal regions, “unify technology approaches,”adopt advanced technology, construct large-scale nuclear power stations, advanceinternational cooperation, and promote technology transfer. China’s mitigation targetis to have installed capacity exceeding 70 GW by 2020, with expectations thatnuclear power generation would rise from 2.3% of China’s of electricity generationto 16% by 2030. With the former 2007 target, greenhouse gas emissions wereexpected to be reduced by 50 Mt CO2 by 2010.60 Reported progress is that, as ofMarch 2008, China had been expanding nuclear power construction plans faster thanearlier planned. The installed power capacity could be 50% above the initial goal by2020.61 But China, like other nations, faces economic and financing challenges withnuclear power plant construction.
Improve Power Sector Efficiency. China has ambitious goals todecommission small, inefficient power generators and to accelerate the deploymentof very advanced powerplant technology (e.g., “supercritical” and “ultra-supercritical” combustion technology). These measures are expected to reducegreenhouse gas emissions by 110 Mt CO2 by 2010.62 In 2007, China reportedlyexceeded its target to close 10 GW of small inefficient generators.63 China has alsoinstalled relatively efficient supercritical and ultra-supercritical coal-fired powerplants over the past few years.64 Such technologies, in combination with carboncapture and sequestration (if required or subsidized), could profoundly alter China’sfuture carbon emissions trajectory.65
Development of a Coalbed Methane Industry. Capturing methane (CH4)potentially released during coal production and using it as a fuel both reducesemissions and substitutes for other fuel use and emissions. China’s National ClimateChange Program states that China wants to vigorously develop the coalbed methane(CBM) industry. Coalbed methane exploration, development, and utilization are to
CRS-22
66 NDRC, op. cit., p. 33.67 NDRC, op. cit., p. 33.68 Xinhua, June 25, 2008.69 Jiang Xufeng, op. cit., 2008.70 L. Price, X. Wang, and J. Yun, Reducing Energy Consumption in the 1000 LargestIndustrial Enterprises in China, Lawrence Berkeley National Laboratory, June 2008.
be adopted as important ways to “expedite the structural optimization of coalindustry, reduce accidents of coal production, improve rates of resource utilization,and prevent environmental pollution.”66 Some incentives provided by Chinese policyinclude adopting preferential tax policies for CBM utilization projects, exempting orpartially exempting surface extraction and exploring projects from utilization fees forprospecting and mining rights, applying preferential policies as defined in China’sRenewable Energy Law, and ensuring that the CBM price for industrial andresidential use is not below the price of natural gas with the same calorific value.With these measures, China’s mitigation target is that 10 CBM pipelines be builtthroughout the nation between 2006 and 2010. These pipelines should be capable ofdistributing 6.5 billion cubic meters of CBM. Expectations are for 200 Mt CO2e tobe reduced by 2010 as a result of policies.67 Reported progress indicates that, as ofJune 2008, China had started construction on the first of 10 coal-bed methanepipeline projects.68 Meeting the production target of 10 billion cubic meters of CBMproduction in 2010 will be challenging given relatively low production now.
Top 1,000 Enterprise Efficiency Program. China’s industry is dominatedby large, state-owned enterprises. These enterprises consume one-third of thecountry’s energy and emit the bulk of China’s pollution, including CO2. The Top1,000 Enterprise Efficiency Program was established in 2006, and aims to reduceenergy use of China’s 1,000 most energy-intensive enterprises. About 61 MMTCO2
are expected to be cut annually by 2010. One of the policies used to try to reach thisgoal has been to make energy efficiency improvement a criteria for job performanceevaluations of local officials and heads of state-owned enterprises.
By the end of 2007, China had shut down 29.4 million tons of outdated ironsmelting capacity and 15.21 million tons of outdated steel smelting capacity. In2008, the Chinese government expects to force closure of inefficient industrialfacilities producing 50 million tons of cement, 6 million tons of steel and 14 milliontons of iron.69 As of 2008, the 1,000 Enterprise Efficiency Program was reportedlyon or above track to meet its 2010 target.70
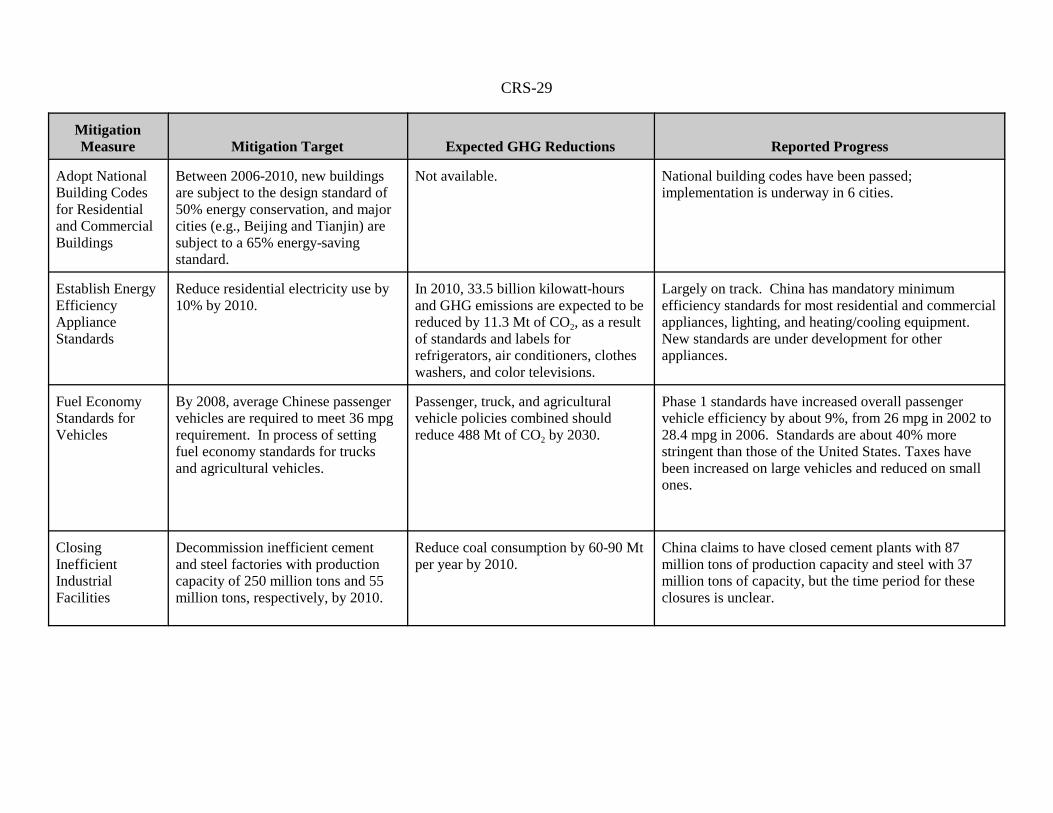
National Building Codes. The non-military building sector accounts forsome 28% of national energy consumption. China announced that new buildingsconstructed from 2006 to2010 are subject to a design standard that would improveenergy conservation by 50%; in major cities (e.g., Beijing), buildings are subject toa 65% energy-saving standard. From 2006 to 2010, large cities are expected toupgrade 25% of established building space with new efficiency measures. Medium-sized cities are expected to improve 15% of building their areas, and small cities are
CRS-23
71 The China Sustainable Energy Program, op. cit., [http://www.efchina.org].72 China Climate Change Info-Net. August 12, 2008. China Issues National Decree onEnergy Savings at State-Funded Organizations, [http://www.ccchina.gov.cn/en/NewsInfo.asp?NewsId=13810].73 China Climate Change Info-Net. August 13, 2008. Energy-Saving Rules Released,[http://www.ccchina.gov.cn/en/NewsInfo.asp?NewsId=13824].74 China Climate Change Info-Net. August 7, 2008. New Energy Rule in the Works,[http://www.ccchina.gov.cn/en/NewsInfo.asp?NewsId=13754].75 The China Sustainable Energy Program, op. cit., [http://www.efchina.org].76 N. Zhou, Status of China’s Energy Efficiency Standards and Labels for Appliances andInternational Collaboration, Lawrence Berkeley National Laboratory, March 2008.77 F. An and A. Sauer, Comparison of Passenger Vehicle Fuel Economy and GreenhouseGas Emission Standards Around the World, Pew Center on Global Climate Change,
(continued...)
expected to improve 10%.71 According to the national climate change office, thepercentage of new houses meeting the building energy standards rose from 20% in2004 to 71% last year in 2007. The government also reported that per-unit energyconsumption was down 2.9% in the first half of 2008 compared to the same periodin 2007.72 In August 2008, additional building efficiency regulations and measures(such as auditing of public buildings) were adopted, to take effect on October 1,2008.73
As an enforcement measure, 10 provinces, municipalities and autonomousregions (including Beijing, Tianjin, Jiangsu and Inner Mongolia) are beginning topilot a permitting system for the energy and environmental performance for allcapital investment projects. The vice-minister of the National Development andReform Commission has cited a “lack of leadership” in other regions as one obstacle.He also stated that “some local governments are investing heavily inresource-intensive sectors, ignoring the central government’s directive to save energyand reduce emissions.” An economist with the Chinese Academy of Social Sciencesrecommended that “the focus should be designing an accountability system to changethe local governments’ mindset of blindly speeding up investment.”74
Appliance Efficiency Standards. China makes more consumer appliancesthan any other country. In order to cut electricity growth and greenhouse gasemissions, China established energy efficiency standards and labels for lighting, airconditioners, and home appliances. The standards set a target of reducing residentialelectricity use by 10% by 2010.75 The Chinese government estimated that in 2010the standards and labels for refrigerators, air conditioners, clothes washers, and colortelevisions will save 33.5 terawatt-hours (billions of kilowatt-hours) and reducegreenhouse gas emissions by 11.3 MMTCO2. The program currently appears to beon track.76
Fuel Economy Standards and Taxes for Motor Vehicles. In 2004,China set passenger vehicle fuel economy standards in stages that exceeded those ofthe United States.77 The average Chinese passenger vehicle is required to meet a 36
CRS-24
77 (...continued)December 2006.78 The China Sustainable Energy Program, op. cit., [http://www.efchina.org].79 The relationship of this initiative — to close small, inefficient facilities — to the Top1,000 Enterprise Efficiency Program is unclear, though one covers the 1,000 largestcompanies while the other is focused on small facilities; there may be overlap between thetwo programs.80 NDRC, op. cit., “Brief Introduction to the Office of the National Coordination Committeeon Climate Change,” [http://www.ccchina.gov.cn/en/Public_Right.asp?class=25].
mpg requirement in 2008. China is in the process of setting fuel economy standardsfor trucks and agricultural vehicles as well. When these standards are allimplemented, passenger, truck, and agricultural vehicle policies combined shouldreduce 488 MMTCO2 by 2030 (compared to an unstated baseline). Phase one of fueleconomy standard enforcement increased overall passenger vehicle efficiency byabout 9% from 26 mpg in 2002 to 28.4 mpg in 2006.78
In addition, the Chinese Ministry of Finance adopted a gas-guzzler structure fortaxes on new vehicles, effective September 1, 2008 — doubling taxes on largevehicles while reducing them on small vehicles. More specifically, purchasers ofcars with engines above 4-liter capacity will pay a tax of 40%. The tax on vehicleswith engines between 3 and 4 liters will rise from 15% to 25%. In contrast, the taxon automobiles with engines less than 1-liter capacity will be reduced from 3% to1%. The Ministry of Finance said that this policy was prompted by the rise ofimported oil to 50% of China’s total oil consumption, as well as the failure of Chinain 2007 (and previous years) to meet its annual target of a 4% reduction in energyintensity.
Closing Inefficient Industrial Facilities. In 2006, China announced effortsto decommission hundreds of small, old, industrial plants. Many of the plants werein the cement and steel sectors, but other chemical, refining, and manufacturingfacilities were slated for closure as well. The government faces unique challengesin closing some plants given strong demand for their products. Plans called fordecommissioning inefficient cement and steel factories with production capacity of250 million tons and 55 million tons, respectively, by 2010. China claims to haveclosed cement plants with 87 million tons of production capacity and steel with 37million tons of capacity, though the timing of these closures is uncertain.79
China’s Role in International Cooperation to Curtail GHG Emissions
In 1998, China established the Office of the National Coordination Committeeon Climate Change to deal with coordination of climate change activities. TheCommittee is a cross-ministerial body “responsible for deliberation and coordinationon climate related policy issues and activities, [and] negotiations with foreignparties.”80 The National Development and Reform Commission takes the lead onmost domestic climate change activities, while the Ministry of Foreign Affairs leadson international issues.

CRS-25
81 [http://www.ccchina.gov.cn/en/Public_Right.asp?class=18].82 More information on comparative CDM projects is available at the “United NationsEnvironment Program Risoe CDM/JI Pipeline Analysis and Database,” [http://www.cdmpipeline.org].83 “Experts React to China’s Climate Change Plan,” Reuters, June 4, 2007, [http://www.ccchina.gov.cn/en/NewsInfo.asp?NewsId=7974].
China has ratified both the United Nations Framework Convention on ClimateChange (UNFCCC) and the Kyoto Protocol. As a non-Annex 1 (developing)country, China has no binding emissions limits in the first commitment period (2008-2012) of the Protocol. It also has resisted proposals under the UNFCCC fordeveloping countries — like Annex 1 countries — to submit regular GHGinventories to the Conference of the Parties according to agreed methodologicalguidelines. China prepared its first and only official GHG inventory for the year1994, although it sometimes cites IEA estimates or unofficial estimates for morerecent years. Its delegation has strongly rebuffed proposals that non-Annex 1(developing) countries prepare and submit annual national GHG inventories to theConference of the Parties. China submitted its first complete NationalCommunication to the Conference of the Parties in February 2007.81 With financingfrom the World Bank, China is beginning to plan its second national communicationto the UNFCCC Conference of the Parties.
China is an active participant in the Clean Development Mechanism (CDM)established under the Protocol. The CDM grants emission credits for verifiedreductions in developing countries, which can be used by developed countriestowards meeting their Kyoto targets. This provides lower-cost reductions fordeveloped countries and generates investment in clean development in developingcountries. China is by far the largest source of CDM credits, accounting for over40% of those generated to date.82 China’s dominance in the market is due in part toits entrepreneurship in developing CDM projects and to its relatively low-riskinvestment.
In addition, China participates in numerous bilateral and multilateral programsthat may facilitate GHG emissions reductions. Among these, China participates inthe Asia-Pacific Partnership on Clean Development and Climate, the ClimateTechnology Partnership, the Strategy for Clean Air and Energy Cooperation, theU.S.-China Oil and Gas Industry Forum, the Carbon Sequestration LeadershipForum, the International Partnership for a Hydrogen Economy, the InternationalThermonuclear Experimental Reactor (ITER), and a number of additional programslargely sponsored by the U.S. federal government.
China’s View: Developed Countries Should Lead. China has longbelieved that established industrial powers need to act first, because they built theirwealth largely by burning fossil fuels and adding to the atmosphere’s greenhousegasses. Ma Kai, former head of China’s National Development and ReformCommission (NDRC), said: “Our general stance is that China will not commit to anyquantified emissions reduction targets, but that does not mean we will not assumeresponsibilities in responding to climate change.”83 He also stressed that as alatecomer to industrialization, China has produced only a small fraction of the
CRS-26
84 J. Yardley and A. Revkin, “China Issues Plan on Global Warming, Rejecting MandatoryCaps on Greenhouse Gases,” The New York Times, June 5, 2007, sec. International / AsiaPacific, [http://www.nytimes.com].85 J. Yardley and A. Revkin, op. cit.
world’s greenhouse gases, and that its current per capita emissions equaled a smallfraction of the rate in the United States.84
An Alternative View: China Must Commit As Well. Some experts argue,however, that the environment cannot afford for China not to take rapid action toslow and then reduce its GHG emissions. Fatih Birol, Chief Economist of theInternational Energy Agency, warns that if China does not begin curbing its currentrate of GHG emissions within 25 years, “China’s output of CO2 emissions couldamount to twice the combined emissions of the world’s richest nations — includingthe United States, members of the European Union, and Japan.” “said that no plancould succeed without a major role for China and that making distinctions between‘total emissions’ and ‘per capita emissions’ obscured the larger point.”85
Conclusions
China will play a key role in any effective solution to address the global climatechallenge. While China is still considered a developing country, it has grown rapidlyenough in recent years for some to begin challenging that label; the old“developed/developing” dichotomy among countries that is embedded in much of theclimate change debate may be too simplistic for practical and equitable solutions.China and the United States are now the largest emitters of GHGs annually. Chinais very likely to become the undisputed leader in annual emissions by 2009, thoughfor now, data uncertainties make that ranking unverifiable. Some analysts concedethat measurements of GHG emissions cumulatively over some number of years,rather than annual emissions, would be a more meaningful characterization ofcontributions, since most gases exist in the atmosphere for decades if not centuries.On that measure, it may be several decades before China surpasses the United States.
China’s GHG emissions on a per capita basis were still lower than the worldaverage in 2005, but the intensity of Chinese emissions was relatively high. China’seconomic development aspirations point to increasing GHG emissions for at leastseveral decades, although this is speculative given the many social, economic, andpolitical challenges the country still faces.
China joins many other developing countries in calling for the industrializedworld to lead in GHG mitigation. At the same time, China appears to have takensome progressive steps to make economic development more sustainable, includingGHG mitigation. Progress on meeting targets in its National Climate ChangeProgram and other mitigation measures appears to demonstrate that the Chinesegovernment is making an effort to improve the country’s environmental reputation.Greater questions arise, however, over the ability of China to meet its goals for 2010and later, given their ambitiousness and limits to enforcement. It remains to be seenhow China’s policy might respond to acceptance of a binding emissions commitmentby the United States; that could become more evident in the 111th Congress.

CRS-27
Appendix. Selected Measures to Mitigate GHG Emissions in China
Table A-1. Mitigation of GHG Emissions in China: Selected Measures and Mitigation Targets, Expected GHGReductions, and Reported Progress
MitigationMeasure Mitigation Target Expected GHG Reductions Reported Progress
Economy-WideEnergyEfficiency Target
Reduce energy intensity 20%between 2005 and 2010.
700 Mt CO2 reduction in 2010compared to baseline; 1,500 MT CO2
reduction in 2010 compared to nointensity change.
In 2006, energy intensity fell 1.2% from 2005 levels,short of the 4% annual goal. In 2007, the decline wasreportedly 3%. China faces serious challenges meetingthis goal, although political requirements may demandsuccess.
RenewableEnergy Law
16% of all energy is to come fromwind, biomass, solar, andhydroelectric energy by 2020.
Wind, solar, geothermal, and tidalenergy expected to have a totalreduction of 60 Mt CO2 by 2010.
Bio-energy is expected to create a 30Mt CO2e reduction by 2010.
Hydroelectricity development isexpected to reduce emissions by 500Mt CO2 by 2010.
In 2008, China was ranked 5th globally in installed windpower capacity, with about 6 gigawatts (GW). Windcapacity is projected to be 20 GW by 2010 and 100 GWby 2020. The Global Wind Energy Council expectsChina to become the largest wind turbine market in2010.
China is also the world leader in installed solar hotwater systems, and expects continued strong growth inphotovoltaic production and use.
CRS-28
MitigationMeasure Mitigation Target Expected GHG Reductions Reported Progress
Promote NuclearPower
Operating power capacity to hit 40GW by 2020 from 8.6 GW in 2008.
50 Mt CO2 reduction by 2010 Appears to be on track.
Improve PowerSector Efficiency
Close 50 GW of small, inefficientand dated power plant capacity by2010 and develop 600 MW or abovesupercritical (SC) or ultra-supercritical (USC). 70-80%of newinstallations will be SC/USC units
Improve coal to electricity efficiencyfrom 366 to 345 Gt coal equivalentper kWh from 2006 to 2020.
110 Mt CO2 reduction by 2010 In 2007, China reportedly shut 553 small coal-firedpower plants, accounting for 14.4 GW of capacity. Thisexceeded the official target of shutting down 10 GW ofcapacity. In 2008, 13.0 GW of small units are to beclosed. Challenges remain, however, given shortages ofelectricity in China through mid-2008.
By end-2007, 74% of ordered thermal capacity is SC orUSC.
Develop CoalbedMethaneIndustry
China targets 10 billion cubic metersof gas production by 2010, and 40BCM by 2020. The 11th Five-YearPlan (2006-2010) also calls for theconstruction of 10 CBM pipelines.
200 Mt CO2 e reduction by 2010 In 2005 and 2006, China drilled as many CBM wells asit did from 1990 to 2004, according to Sun Maoyuan,head of China United Coalbed Methane Company. Still,China produced only 200 million cubic meters of CBMin 2006. In June 2008, China started construction on thefirst of 10 CBM pipeline projects.
Top 1,000EnterpriseEfficiencyProgram
Cut energy use of the 1,000 mostenergy-intensive enterprises.
Cut 100 million tons of coal-equivalent energy consumption and 61million tons of CO2 emissionsannually by 2010.
Many staff of the top 1000 enterprises have takentraining in energy savings, and firms have had energysaving audits performed. A preliminary survey reportsthat the enterprises saved 20 million tons of coalequivalent in 2006, indicating that the program is on orahead of target to meet its goals.
CRS-29
MitigationMeasure Mitigation Target Expected GHG Reductions Reported Progress
Adopt NationalBuilding Codesfor Residentialand CommercialBuildings
Between 2006-2010, new buildingsare subject to the design standard of50% energy conservation, and majorcities (e.g., Beijing and Tianjin) aresubject to a 65% energy-savingstandard.
Not available. National building codes have been passed;implementation is underway in 6 cities.
Establish EnergyEfficiencyApplianceStandards
Reduce residential electricity use by10% by 2010.
In 2010, 33.5 billion kilowatt-hoursand GHG emissions are expected to bereduced by 11.3 Mt of CO2, as a resultof standards and labels forrefrigerators, air conditioners, clotheswashers, and color televisions.
Largely on track. China has mandatory minimumefficiency standards for most residential and commercialappliances, lighting, and heating/cooling equipment.New standards are under development for otherappliances.
Fuel EconomyStandards forVehicles
By 2008, average Chinese passengervehicles are required to meet 36 mpgrequirement. In process of settingfuel economy standards for trucksand agricultural vehicles.
Passenger, truck, and agriculturalvehicle policies combined shouldreduce 488 Mt of CO2 by 2030.
Phase 1 standards have increased overall passengervehicle efficiency by about 9%, from 26 mpg in 2002 to28.4 mpg in 2006. Standards are about 40% morestringent than those of the United States. Taxes havebeen increased on large vehicles and reduced on smallones.
ClosingInefficientIndustrialFacilities
Decommission inefficient cementand steel factories with productioncapacity of 250 million tons and 55million tons, respectively, by 2010.
Reduce coal consumption by 60-90 Mtper year by 2010.
China claims to have closed cement plants with 87million tons of production capacity and steel with 37million tons of capacity, but the time period for theseclosures is unclear.


![Greenhouse Gas Emissions and Emissions Trading in North … · 2020. 2. 23. · 2002] Stephenson-Greenhouse Gas Emissions, Kyoto and U.S. Response 45 greenhouse gas molecules. This](https://img.pdfslide.us/doc/110x75/60facf56e286b02f9b10de99/greenhouse-gas-emissions-and-emissions-trading-in-north-2020-2-23-2002-stephenson-greenhouse.jpg)