Embed Size (px)
Citation preview

Chemistry Department
DOCTORAL THESIS
Jessica Avivar Cerezo
2012


Automated flow systems for total and
isotopic analysis of thorium and uranium
in samples of environmental interest
Doctoral Thesis
Jessica Avivar Cerezo
Palma de Mallorca, March 2012

Cover image: Gabriel Morell Capó
Cover design: David Lorenzo Patiño

Dr. Víctor Cerdà Martín, Professor of Analytical Chemistry at the Chemistry
Department of the University of the Balearic Islands and Dr. Laura Ferrer Trovato,
director of the Laboratory of Environmental Radioactivity (LaboRA) of the University
of the Balearic Islands, as directors of this Doctoral Thesis,
CERTIFY:
That the present work entitled: “Automated flow systems for total and isotopic
analysis of thorium and uranium in samples of environmental interest” has been
developed by Jessica Avivar Cerezo at the research group Analytical Chemistry,
Automation and Environment of the Chemistry Department of the University of the
Balearic Islands, as a requirement to get the degree of Doctor in Chemical Science
and Technology, with European mention.
Palma de Mallorca, 3rd February 2012
Dr. Víctor Cerdà Martín Dr. Laura Ferrer Trovato


El Dr. Víctor Cerdà Martín, Catedrático de Química Analítica del Departamento de
Química de la Universitat de les Illes Balears y la Dra. Laura Ferrer Trovato, directora del Laboratorio de Radioactividad Ambiental (LaboRA) de la Universitat de
les Illes Balears, en calidad de directores de esta tesis doctoral,
HACEN CONSTAR:
Que el presente trabajo titulado: “Automated flow systems for total and isotopic
analysis of thorium and uranium in samples of environmental interest” ha sido
realizado por Jessica Avivar Cerezo en el grupo de Química Analítica,
Automatización y Medioambiente del Departamento de Química de la Universitat de
les Illes Balears, como requisito para optar al Título de Doctor en Ciencia y
Tecnología Química, con mención europea.
Palma de Mallorca, 3 de Febrero de 2012
Dr. Víctor Cerdà Martín Dra. Laura Ferrer Trovato


Jessica Avivar PhD Thesis
ACKNOWLEDGEMENTS/ AGRADECIMIENTOS
To all the people who in one way or another have helped me, supported me and shared with
me all these years in which has been carried out this thesis.
To Víctor Cerdà and Laura Ferrer for being my supervisors, for their support throughout all
this time and for being directly responsible for this work. Also, for their optimism and for
making of every moment a great memory.
To Montserrat Casas for her time, suggestions and excellent contributions.
To the University of the Balearic Islands for the collaboration grant 2008/81.
To Jose Manuel Estela for introducing me in the group as a collaborator-student. All this
would not have been possible if he would have not trusted on me.
To Gillian M. Greenway for giving me the opportunity to work in her laboratory, and her
support during my stay at the University of Hull. To all the people in the lab of Hull for making
of my stay a great experience.
To the College of Chemists of the Balearic Islands, for the 2010 St. Albert Chemical
Research award.
Especially to all the colleagues of the laboratory, with whom I’ve had the pleasure to work
during all these years, for all the good times we've had together in the lab and outside of it
and for every wonderful day we’ve spent together. Also to all the visitors who have been at
our lab.
To Rogelio Rodriguez and Montse Mola for all the fun we had working together and for their
innate charm and friendliness.
To Lindomar Portugal and José González for their advice and their help.
To my friends (to my sister and best friend Marie, David, Marina, Gabi and David) for always
being there, listening, helping me and providing me a lot of joy. To Gabi for the photographs
and to David for the cover design.
To my family because I am who I am because of them, for being part of everything I do and
of my daily life. And because they are the most important and the best of my life. To whom I
dedicate this thesis.
To all and every one of you thanks for everything.

Agradecimientos
A todas aquellas personas, que de un modo u otro me han ayudado, apoyado y han
compartido estos años en los que ha sido llevada a cabo esta tesis.
A Víctor Cerdà y Laura Ferrer por ser mis directores de tesis, por su apoyo durante todo
este tiempo y por ser directamente responsables de este trabajo. Por su optimismo y por
hacer que todos y cada uno de mis recuerdos sean maravillosos.
A Montserrat Casas por su tiempo, sugerencias y excelentes aportaciones.
A la Universidad de las Islas Baleares por concederme la beca de colaboración 2008/81.
A José Manuel Estela por introducirme en el grupo como alumna colaboradora, todo esto no
habría sido posible si no hubiera confiado en mí.
A Gillian M. Greenway por darme la oportunidad de trabajar en su laboratorio, y el apoyo
recibido durante mi estancia en la Universidad de Hull. A todos los compañeros del
laboratorio de Hull por hacer de mi estancia una gran experiencia.
Al Colegio de Químicos de las Islas Baleares, por la concesión del premio San Alberto de
Investigación Química 2010.
En especial a todos los compañeros del laboratorio, con los que he tenido el placer de
trabajar durante todos estos años, por todos los buenos momentos que hemos vivido en el
laboratorio y fuera de él y por un ambiente y un día a día maravilloso. También a todos los
visitantes que han pasado por el laboratorio.
A Rogelio Rodríguez y Montse Mola por lo bien que lo hemos pasado trabajando juntos, por
su alegría y simpatía innata.
A Lindomar Portugal y José González por sus consejos y gran ayuda.
A mis amigos (mi hermana y mejor amiga Marie, David, Marina, Gabi y David) por estar ahí,
escuchando, ayudándome a desconectar y dándome alegrías. A Gabi por las fotos y a
David por el diseño de la portada.
A mi familia porque soy cómo soy gracias a ellos, por formar parte de lo que hago y de mi
día a día. Y porque son lo más importante y lo mejor de mi vida. A quienes dedico esta
tesis.
A todos y cada uno gracias.

Jessica Avivar PhD Thesis
Abbreviations
BI: Bead injection
CMPO: octylphenyl-N,N-di-isobutyl carbamoylphosphine oxide
CSN: Consejo de Seguridad Nuclear
DAAP: Diamyl, amyl phosphonate
ETFE: poly(ethylene-co-tetrafluoroethylene)
EURATOM: European Atomic Energy Community
FIA: Flow injection analysis
IAEA: International Atomic Energy Agengy
IUPAC: International Union of Pure and Applied Chemistry
ICP-MS: Inductively coupled plasma mass spectrometry/spectrometer
LOD: Limit of detection
LOV: Lab-on-valve
LWCC: Liquid waveguide capillary cell
MCFIA: Multicommutated flow injection analysis
MPFS: Multipumping flow system
MSFIA: Multisyringe flow injection analysis
NORM: Naturally occurring radioactive materials
PTFE: poly(tetrafluoroethylene)
PVDF: polyvinylidene fluoride
SIA: Sequential injection analysis
SPE: Solid phase extraction
TBP: tri-n-butyl phosphate
TENORM: Technically enhanced naturally occurring radioactive materials
TEVA®: Tetravalent actinides and technetium resin
TRU: Transuranide resin

Abbreviations
UNSCEAR: United Nations Scientific Committee on the Effects of Atomic Radiation
USEPA: United States Environmental Protection Agency
UTEVA®: Uranium and tetravalent actinide resin
WHO: World Health Organization

Jessica Avivar PhD Thesis
Index
Abstract…………………………………………………………………………………………………... …....1
Resumen………………………………………………………………………………………………….. …….3
Chapter 1 General Introduction ……………………………………………………………………….. ….…5
1.1 Uranium and thorium generalities ……………………………………………………………… ….…7
1.1.1 Natural Radioactivity ……………………………………………………………………….. .…...8
1.1.2 Anthropogenic radioactivity ………………………………………………………………… …...11
1.1.3 Uranium ………………………………………………………………………….................... …...12
1.1.4 Thorium ………………………………………………………………………………………. .…..13
1.1.5 Legislation ……………………………………………………………………………………. …...15
1.2 Laboratory automation ………………………………………………………………................. .…..17
1.2.1 Multisyringe flow injection analysis – MSFIA ………………………………………..….. …..17
1.2.2 Multipumping flow systems – MPFS …………………………………………….………… .…..18
1.2.3 Lab-on-Valve – LOV....................................................................................................... …...19
1.3 Detectors …………….………………………………………………………………................. …...21
1.3.1 Spectrophotometric detection ……………………………………………………………… .…..21
1.3.2 Inductively Coupled Plasma Mass Spectrometry - ICP-MS ……………………………. …..22
1.4 Solid phase extraction-SPE ……………………………………………………………………… …..24
1.5 Objectives ………………………………………………………………………………………….. …..27
1.6 Submitted manuscript …………………………………………………………………………….. …...28
Chapter 2 State of the art of automation in radiochemical analysis ………………………………... …..53
2.1 Introduction ………………………………………………………………………………………… …..55
2.2 Original paper ……………………………………………………………………………………… …..57
Chapter 3 Experimental section: instrumentation and common materials................................... …...69
3.1 Flow instrumentation............................................................................................................. …...71
3.1.1 Multisyringe burette.................................................................................................... .…..71
3.1.2 Multipumping flow system........................................................................................... …...73
3.1.3 Lab-on-valve....………………………………………………………………..……………. …...75
3.1.4 Manifold components ……………………………………………………………………... .…..76
3.2 Detectors …………………………………………………………………………..……………….. …...77
3.2.1 Spectrophotometric detection basis............................................................................ …...77
3.2.2 ICP-MS detection........................................................................................................ …...80
3.3 Separation and preconcentration techniques used ………………………………………….... …...85
3.3.1 TRU resin....................................................................................................................... …...85
3.3.2 UTEVA® resin................................................................................................................ …...86

Index
3.4 Software................................................................................................................................ .…..88
3.4.1 System configuration............................................................................................... …...88
3.4.2 Method edition......................................................................................................... …...89
3.4.3 Data processing....................................................................................................... …...90
3.5 Multivariate optimization ………………………………………………………………………….. …...92
3.5.1 Screening.................................................................................................................. …...94
3.5.1.1 Factorial designs................................................................................................... …...94
3.5.2 Response surface....................................................................................................... …...95
3.5.2.1 Desirability function............................................................................................. …...97
Chapter 4 Automated determination of uranium(VI) at ultra trace levels exploiting flow
techniques and spectrophotometric detection using a liquid waveguide capillary cell...............
…...99
4.1 Introduction......................................................................................................................... ….101
4.2 Original paper.................................................................................................................... .…102
4.3 Additional optimization information..................................................................................... ….111
Chapter 5 Lab on valve-multisyringe flow injection system (LOV-MSFIA) for fully
automated uranium determination in environmental samples ..................................................
.…119
5.1 Introduction....................................................................................................................... .…121
5.2 Original paper.................................................................................................................... .…123
5.3 Additional optimization information.................................................................................... ….133
Chapter 6 Smart thorium and uranium determination exploiting renewable solid-phase
extraction applied to environmental samples in a wide concentration range.............................
….141
6.1 Introduction....................................................................................................................... .…143
6.2 Original paper.................................................................................................................... .…144
6.3 Additional optimization information.................................................................................... .…155
Chapter 7 Fully automated LOV-MSFIA-ICP-MS system: an effective tool for fast, sensitive
and selective determination of thorium and uranium at environmental levels exploiting solid
phase extraction.........................................................................................................................
….171
7.1 Introduction........................................................................................................................ ….173
7.2 Original paper................................................................................................................... ….174
7.3 Additional optimization information.................................................................................... ….183
Chapter 8 Conclusions.............................................................................................................. ….195
Conclusiones............................................................................................................ ….199
Annex........................................................................................................................................ ….201

Jessica Avivar PhD Thesis
1
Abstract
As a result of the different uses of radioactivity during the last decades, there has been an
increase in the concentration of natural and artificial radionuclides in the environment. This
together with some accidents with high impact on the public opinion (e.g. Chernobil and
Fukushima) has led to establish or increase environmental radioactivity monitoring
programs. Actually, present trends in legislation and research are focused in the
development of accurate, precise, reliable and rapid analytical methods with low detection
limits to determine radionuclides, such as thorium and uranium, in environmental samples.
In this thesis, two comprehensive reviews and four automated analytical systems for total
and isotopic thorium and uranium determination are presented. The developed methods
have been applied to environmental samples with low concentrations of the above cited
elements. These methodologies have been automated exploiting multicommutated flow
techniques, such as Multisyringe Flow Injection Analysis (MSFIA), Multipumping Flow
Systems (MPFS) and Lab-on-valve (LOV), which provide minimal sample handling, low
reagent consumption and waste generation and a high frequency of analysis. Long path
length spectrophotometry and ICP-MS have been implemented in the developed methods as
detection techniques instead of radiometric detectors in order to obtain fully automated, low
cost and fast thorium and uranium analyzers.
The works presented are listed below:
1. A comprehensive review with a detailed description of flow techniques, their evolution,
their hyphenation advantages and a critical comparison between current developed
methods exploiting flow techniques aimed to solve present analytical needs.
2. The state of the art of flow analysis applied to the fully automated and semi-automated
determination of radioactive isotopes in environmental samples, including automatic
procedures for separation and preconcentration of radioisotopes is reviewed. We discuss
in detail advantages and drawbacks of automatic protocols exploiting various generations
of flow techniques using a variety of detection systems, including scintillation counting, α-
spectrometers, proportional counters, mass spectrometry and spectrophotometry.
Abstract
2
3. An automated, low-cost, robust, portable and rapid MSFIA-MPFS analyzer for total
uranium determination in environmental samples exploiting solid phase extraction (SPE)
using TRU resin and spectrophotometric detection with a liquid waveguide capillary cell.
4. A LOV-MSFIA method with spectrophotometric detection for total uranium determination
going a step forward by automating the column replacement of the SPE exploiting the
LOV technique and the UTEVA® resin. In this method the amount of resin used is
reduced and its reuse is increased.
5. A fully automated multiparametric smart LOV-MSFIA analyzer with spectrophotometric
detection for total thorium and uranium determination in samples of environmental
interest in a wide concentration range. On-line separation and preconcentration of
thorium and uranium are carried out by means of UTEVA® resin. The main feature of this
analyzer is its capability to work autonomously and to take its own decisions thanks to the
implementation of feedback mechanisms in the control software.
6. A LOV-MSFIA-ICP-MS system for simultaneous and isotopic analysis of thorium and
uranium at trace levels. This system has proved to be an effective tool for fast, isotopic,
sensitive and selective determination of thorium and uranium at environmental levels
exploiting solid phase extraction by UTEVA® resin.

Jessica Avivar PhD Thesis
3
Resumen En las últimas décadas, como consecuencia de los diferentes usos de la radioactividad,
se ha ido produciendo un aumento en las concentraciones de diferentes radionúclidos,
tanto artificiales como naturales, que se encuentran hoy en el medio ambiente. Esto,
junto a algunos accidentes de amplia repercusión en la opinión pública (Chernóbil,
Fukushima), ha llevado a establecer o incrementar los programas de vigilancia de
radioactividad ambiental. De hecho, las nuevas tendencias en legislación y en
investigación están dirigidas hacia el desarrollo de métodos exactos, precisos, robustos y
rápidos con bajos límites de detección para determinar radionúclidos, tales como torio y
uranio, en muestras ambientales.
En esta tesis se presentan dos revisiones exhaustivas y cuatro métodos analíticos para la
determinación total e isotópica de torio y uranio. Los métodos desarrollados han sido
aplicados a muestras ambientales con bajas concentraciones de los analitos de interés.
Estas metodologías han sido automatizadas mediante el uso de técnicas de análisis en
flujo multiconmutadas, tales como Análisis por Inyección en Flujo Multijeringa (MSFIA),
Sistemas de Flujo Multibomba (MPFS) y Lab-on-valve (LOV), que proporcionan un
importante ahorro de reactivos, con la consecuente reducción de coste por análisis y de
generación de residuos permitiendo una mayor frecuencia de análisis, y una mínima
manipulación de las muestras. La espectrofotometría de largo paso óptico y el ICP-MS
fueron las técnicas de detección utilizadas en los métodos desarrollados como
alternativas a detectores radiométricos con el fin de obtener métodos para torio y uranio
totalmente automáticos, económicos y rápidos.
Los trabajos presentados son los siguientes:
1. Una revisión exhaustiva con una descripción detallada de las técnicas de análisis en
flujo, su evolución, las ventajas de su acoplamiento y una comparación crítica de
métodos recientemente desarrollados, basados en técnicas de flujo, con el objetivo de
solventar necesidades analíticas actuales.
2. Una revisión del estado actual de la aplicación de las técnicas de análisis en flujo para
la determinación totalmente automática y semiautomática de isótopos radioactivos en
muestras ambientales, incluyendo procedimientos de separación y preconcentración
de radioisótopos. En la que se discuten en detalle las ventajas y desventajas de
protocolos automáticos utilizando diferentes generaciones de técnicas de análisis en

Resumen
4
flujo y una variedad de sistemas de detección, incluyendo contadores de centelleo,
espectrofotómetros alfa, contadores proporcionales, espectrometría de masas y
espectrofotometría.
3. Un método MSFIA-MPFS rápido, económico, portátil y robusto, para la separación,
preconcentración y determinación de uranio total en muestras ambientales, mediante
extracción en fase sólida usando resina TRU y detección espectrofotométrica con una
celda de largo paso óptico.
4. Un método LOV-MSFIA con detección espectrofotométrica para la determinación de
uranio total, aumentando el grado de automatización con la renovación automática de
la resina (UTEVA®) gracias a la técnica LOV. Con este método se consigue reducir la
cantidad de resina utilizada y aumentar su reutilización.
5. Un sistema inteligente LOV-MSFIA multiparamétrico y totalmente automatizado para la
determinación de torio y uranio en un amplio rango de concentraciones en muestras
de interés ambiental. La separación y preconcentración en línea de torio y uranio se
lleva a cabo con la resina UTEVA®. El rasgo más característico de este analizador es
su capacidad para trabajar de forma autónoma y para tomar sus propias decisiones
gracias a la implementación de mecanismos de retroalimentación en el software que
controla el equipo.
6. Un sistema LOV-MSFIA-ICP-MS para el análisis simultáneo e isotópico de torio y
uranio a niveles traza. Este sistema ha demostrado ser una herramienta efectiva para
la determinación selectiva y rápida de torio y uranio a niveles ambientales utilizando la
técnica de extracción en fase sólida con la resina UTEVA®.

Jessica Avivar PhD Thesis
5
Chapter 1
General introduction
In this chapter, a general introduction to the analytes of interest, the applied and related
analytical techniques used and the objectives for this thesis are presented.

Chapter 1. General introduction
6

Jessica Avivar PhD Thesis
7
1.1 Uranium and thorium generalities
Radioactive substances are defined as materials that contain unstable atoms which produce
ionizing radiation through nuclear rearrangement. Radionuclides are widely distributed on
Earth, partitioned between the atmosphere and the lithosphere. Over 320 isotopes have
been currently identified in nature. The radioactivity on Earth consists of naturally produced
radioisotopes and anthropogenic radioactive contamination initiated during the nuclear era.
The wide use of nuclear power and nuclear waste disposal plants have made the public
increasingly concerned about health hazards of radionuclide in nature.
Uranium and thorium are natural radioactive occurring elements members of the
actinide series. Actinides are considered the most toxic radionuclides in the environment, as
most of them are alpha emitters and have long half-lives. Alpha particles (α) consist of two
protons and two neutrons bound together into a particle identical to a helium nucleus
(42He+2). Despite the low penetration capacity of these particles, they are dangerous due to
their high ionizing energy.
Uranium and thorium isotopes determination has historically been a subject of interest
mostly within the fields of geochronology and geochemistry. In recent years uranium
isotopes has also been of major interest within the field of nuclear forensic analysis.
Moreover, determination of uranium and thorium in environmental and biological samples
has considerable potential as a tool for assessing human exposure. Despite the relatively
low specific activity of natural uranium and thorium isotopes, there exists an important health
concern because of their chemical toxicity and radio toxicity of their decay products.
These elements are enriched through numerous food chains to humans and, even in
small amounts, can cause health hazards. The effective dose equivalent for a person due to
natural radioactivity is in the range of 2-3 mSv per year. Some changes in blood cells can be
observed above few hundreds of millisieverts obtained in a short time, whereas above 1 Sv,
symptoms of acute radiation disease can be observed. There is a 50 % risk of death with an
effective dose of 4 Sv and above 10 Sv it results in certain death1. The increase in cancer
risk or cancer mortality is the main factor taken into consideration. Another hazard related to
radiation is the increase in mutation rate. Uranium and thorium are known to cause acute
toxicological effects for human and their compounds are potential occupational carcinogens.
These elements and compounds are highly toxic which cause progressive or irreversible
renal injury2.
1 J.W. Mietelski. Anthropogenic radioactivity, in Radionuclides in the Environment, D. A. Atwood (Ed.), Wiley & sons, 2010. Chapter 2, 19-34.
2 C. Galindo, L. Mougin, A. Nourreddin. An improved radiochemical separation of uranium and thorium in environmental samples involving peroxide fusion. Appl. Radiat. Isot. 65 (2007) 9-16.

Chapter 1. General introduction
8
1.1.1 Natural radioactivity
The natural ionizing radiation present on our planet comes from many sources and
generates most of the radioactivity that surrounds us. Radioactivity initiated by the
successive decay of 232Th, 235U and 238U is essentially responsible for the presence of
radioisotopes of lead, polonium, bismuth, astatine, radon, francium, radium and protactinium
on Earth3. Because of the short half-lives of these radioisotopes, which belong to the decay
series of uranium and thorium, with respect to Earth’s geologic timescale (4.6 x 10⁹ years),
the decay of these radionuclides is responsible for a significant portion of the radiation doses
from natural radioactivity received by humans. With the exception of radiation exposure for
medical purposes, natural radioactivity is responsible for the majority of the dose received by
humans.
Natural radioactivity can be categorized into three categories based on the origin of
production of the radioisotope: cosmogenic radionuclides, primordial radionuclides (defined
as radionuclides present since the formation of Earth about 4.6 x 10⁹ years ago) and
radioactive decay series. Uranium (238U and 235U) and thorium (232Th) are primordial
radionuclides and radionuclides from natural decay series (230Th, 234Th, 227Th, 228Th, 229Th, 231Th, 233U, 234U) (Fig. 1.1). The vast majority of the natural radioactivity detected on Earth
and its related dose results from radionuclides belonging to the decay series which have
primordial origins (Fig. 1.2). Radon comes from the natural uranium found on Earth and is
responsible for a significant part of the radioactivity received by human beings, as can be
seen in Fig. 1.3. Actually, of the 3.71 mSv received per year by a Spanish citizen, 2.40 mSv
are from natural radioactive sources4.
3 D. Larivière, N. Guérin. Natural radioactivity, in Radionuclides in the Environment, D. A. Atwood (Ed.), Wiley & sons, 2010. Chapter 1, 1-17.
4 Dosis de radiación, CSN (Consejo de Seguridad Nuclear), 2009. Legal deposit: M-26655-2004.

Jessica Avivar PhD Thesis
9
Figure 1.1 Natural decay series.

Chapter 1. General introduction
10
Figure 1.2 Percentage of contribution to the dose from natural radionuclides3.
Figure 1.3 Percentage of contribution to the dose received by a Spanish citizen per year (3.71 mSv)4.
Contribution to the dose from natural radionuclides
Natural radioactive decay series (82.7 %)
Primordial radionuclides (16.5 %)
Cosmogenic radionuclides (0.7 %)
Contribution to the Spanish dose
Medical uses (35%)
Radon (31%)
Natural radionuclides (13%)
Cosmogenic radionuclides (10.4%)
Food and drinks (7.8%)
Toron (2.7%)
Anthropogenic sources (0.1%)

Jessica Avivar PhD Thesis
11
1.1.2 Anthropogenic radioactivity
The term anthropogenic radioactivity covers sources of radioactivity not present on the Earth
in measurable amounts before the nuclear era (the so-called artificial radioactivity) and
technically enhanced natural radioactivity (TENORM).
TENORM are the result of human activities that transform natural resources containing
naturally occurring radioactive materials (NORM), generating by-products that find their way
into the environment. Thus, TENORM are responsible for the distribution of many natural
radionuclides in the environment. Mining and processing of ores, fossil fuel use or production
of natural gas and oil5, fertilizer production, smelting, and water treatment and purification
are examples of human activities known to modify the level of environmental radioactivity,
especially in soil, water and air. For example, agricultural phosphorous, essential for the
development of crops, is obtained from phosphate rocks found in sedimentation formations.
These formations contain trace quantities of uranium, thorium and their progenies,
incorporated in the structure of the mineral. During the treatment of phosphate rocks with
sulfuric acid to form phosphoric acid, radionuclides become partitioned between the products
and the waste stream. Typically, 226Ra (~80%), 232Th (~30%) and 238U (~14%) are left in the
phosphogypsum produced through this approach6. Furthermore, in the fertilizer, uranium
and thorium concentrations are generally approximately 150% of their original concentration
in the phosphate rock. Radionuclides dispersed on agricultural land via the spreading of
fertilizers are redistributed in the environment by means of soil erosion and surface water
runoff. In the south of Spain, and between many chemical industries, there is one in Huelva
dedicated to the production of phosphoric acid, from which a phosphogypsum sample was
analyzed with some of the proposed methods in this thesis. This factory produces annually
almost two million tons of sulfuric acid, phosphoric acid and ammonium phosphates, which
are commercialized as such or used as intermediates to obtain: diammonium phosphate
(DAP), complex fertilizers and soluble phosphates. There is another factory dedicated to
produce titanium dioxide, which also works with raw materials (ilmenite) with high activity
concentrations of natural radionuclides. An interesting study evaluating the radiologic impact
of these two non-nuclear industries in the south of Spain was presented by the CSN7. Many
geological and environmental events such as volcanic action, droughts, floods, hydrothermal
5 IAEA (International Atomic Energy Agency). Extent of Environmental Contamination by Naturally Occurring Radioactive Material (NORM) and Technological Options for Mitigation, Technical Reports Series 419, Vienna (2003), available at http://www-pub.iaea.org/MTCD/publications/SeriesMain.asp.
6 M.B. Cooper. Naturally occurring radioactive materials (NORM) in Australian industries – Review of current inventories and future generation. Rep. ERS-006, EnviroRad Services, Beaumaris, Australia, 2003.
7 Estudio y evaluación del impacto radiológico producido por las actividades de diversas industrias no nucleares del sur de España. CSN (Consejo de Seguridad Nuclear), Technical reports, 26, 2010. Legal deposit: M-52289-2010.

Chapter 1. General introduction
12
activity, ice melting, snow cap removal, earthquakes, and forest fire can also modify, as
human activity does, the distribution of naturally occurring radionuclides.
There are several sources of anthropogenic radionuclides in the environment, e.g.
nuclear weapons testing, nuclear industries, nuclear medicine (e. g. some radionuclides are
used with diagnosis purposes and some for cancer treatment) and research laboratories.
The most important are the military applications of nuclear energy. Officially, 2418 nuclear
test explosions and two combat ones (Hiroshima and Nagasaki) have taken place on the
Earth since 1945. Regarding to the dose received by humans, the UNSCEAR8 estimates
that a citizen of a developed country receives 1.28 mSv per year from medical exposure
(see Fig.1.3).
1.1.3 Uranium
Uranium is widely distributed throughout the world. It is a naturally occurring element
member of the actinide series. It is found in all rocks and soils, as well as in natural water
samples. The uranium content in various common rock types ranges between 0.5 and 4.7
mg kg-1 (ppm). Mineral resources such as phosphate ore, monazite sands, or copper ore can
have much higher uranium contents up to a factor of 5-1500 higher9. In Spain, there are
some projects related to uranium mining in stand-by due to political, environmental and
economical concerns. Spain is supposed to have the second largest global reserves of
uranium, previously managed by the company ENUSA, which stopped its mining activities in
1994 due to profitability reasons. During the last years, there has been an increasing interest
of some international companies (Berkeley Resources and Mawson) in exploiting the mines
of uranium. In 2009, Berkeley Resources and ENUSA formed a consortium to study the
uranium deposits located in Salamanca (Spain) and they plan to open the mine in 2012.
There are three main isotopes present in natural uranium, 234U (0.0055 %), 235U (0.72
%) and 238U (99.27%) with respective half-lives of 2.46 x 10⁵, 7.04 x 10⁸ and 4.47 x 10⁹
years. Given its long half-life, uranium is more chemotoxic than radiotoxic. Human activities
have resulted in a number of additional uranium isotopes being released to the environment
(e.g., 236U and 233U), as well as perturbations in natural uranium isotope ratios.
Regarding to speciation, uranium can occur either in its reduced state, U(IV), which is
generally highly immobile, or in its more soluble and mobile higher state, U(VI). Usually
uranium is present in oxidizing groundwater as the cationic uranyl species (UO2+2). However,
8 Sources and Effects of Ionizing Radiation, UNSCEAR 2008 Report: Volume I: Sources - Report to the General Assembly Scientific Annexes A and B. ISBN 13: 9789211422740, 472 pp. United Nations (Ed.), United Nations Office at Vienna.
9 H.V. Vandenhove, C. Hurtgen, T.E. Payne. Uranium, in Radionuclides in the Environment, D. A. Atwood (Ed.), Wiley & sons, 2010. Chapter 26, 261-272.

Jessica Avivar PhD Thesis
13
this species usually exists only in an uncomplexed form at low pH values. Typically, the
chemistry of uranyl ion in solution at higher pH values is dominated by a series of uranyl
hydroxyl and uranyl carbonate complexes.
The bioavailability of uranium is dependent on its speciation or physicochemical form.
The bioavailability of uranium in freshwater is influenced by a variety of physicochemical
variables, including pH, humic substances, water hardness, and alkalinity. There is
reasonable evidence from the literature to indicate that UO2+2 and UO2OH+ are the major
bioavailable forms of U(VI) in aquatic ecosystems. Uranyl complexation with inorganic
ligands (e.g., carbonate or phosphate) and humic substances apparently reduces the
bioavailability of uranium by reducing the activity of UO2+2 and UO2OH+. Thus, uranium
mobility and bioavailability are governed by oxidation state, complexation by organic and
inorganic ligands, pH, sorption by minerals including clays and hydroxides, and interactions
with organic matter.
Uranium concentrations in groundwaters worldwide10 range from < 0.001 µg L-1 to as
high as 2600 µg L-1. Most groundwaters are low in uranium, typically in the range 0.1-1 µg L-
1. Groundwaters often have higher concentrations of uranium than surface waters because
of the large solid-solution ratios in aquifers and the greater influence of water-rock
interactions. Concentrations in surface waters are usually low. For surface waters in
Canada, uranium concentrations were in the range 0.1-4.3 µg L-1, but usually < 1 µg L-1.
Surveys of stream waters in Britain have shown concentrations mostly < 1 µg L-1, although
some samples with concentrations exceeding 15 µg L-1 have been found.
1.1.4 Thorium Thorium is a naturally occurring radioactive member of the actinide series, usually
associated with U and the rare-earth elements. Thorium is composed of 27 different isotopes
with the common ones being 224Th, 226Th, 227Th, 228Th, 229Th, 230Th, 231Th, 232Th, 233Th, and 234Th11. Although thorium has 6 naturally occurring isotopes, none of these isotopes are
stable; however, one isotope, 232Th, is relatively stable, with a half-life of 14.05 x 10⁹ years.
Therefore, 232Th is the only primordial isotope of thorium and makes up effectively all of
natural thorium. Other particularly important isotopes of thorium are: 230Th with a half-life of
75,380 years, occurs as the daughter product of 238U decay, 229Th with a half life of 7300
years and 228Th with a half-life of 1.92 years. All of the remaining radioactive isotopes have
10
P.L. Smedley, B. Smith, C. Abesser, D. Lapworth. Uranium occurrence and behaviour in British groundwater. British Geological Survey. Groundwater systems and water quality programme, Commissioned report CR/06/050N Keyworth, Nottingham British Geological Survey, 2006.
11 Z.U.W. Mahmood, C.A.R. Mohamed. Thorium, in Radionuclides in the Environment, D.A. Atwood (Ed.), Wiley & sons, 2010. Chapter 24, 247-253.

Chapter 1. General introduction
14
half-lives that are less than thirty days and the majority of these have half-lives that are less
than ten minutes.
Thorium was formerly used commonly as for example as the light source in gas
mantles, in ceramic glazes, welding rods, thermistors, catalysis, and others but most of
these applications have declined due to concerns about its radioactivity. However, it is still
recognized as a potential fuel for fast breeder reactors, where it is converted to fissile 233U.
The intake of thorium isotopes by human being occurs mainly through animal products,
cereals, vegetables and waters. Thorium is widely distributed in small amounts, with an
average lithospheric concentration of 8-12 mg g-1 in the earth’s crust (at an average
concentration of 6 mg g-1 in soil). This is about two or three times as high as the
concentration of uranium. However, thorium is not as soluble as uranium and is thus not as
mobile as it in the chemical environment, but does move by mechanical processes as
discrete resistant mineral grains12. Wind-blown terrestrial dust and volcanic eruptions are two
important natural sources of thorium release in the air. Uranium and thorium mining, milling,
and processing; phosphate fertilizer production; tin processing; phosphate rock processing;
coal combustion; and industrial boilers are the primary anthropogenic sources of thorium
released into the air, soil, and water.
The fate and mobility of thorium in water and soil are governed by its chemical and
biological behaviors. Acidity and wet conditions enhance the solubility of thorium in soil.
Thorium discharged as ThO2 into surfaces waters from mining, milling, and processing will
be present as suspended particles or sediment because of its low solubility. Other soluble
thorium ions in water will hydrolyze at a pH above 5, forming insoluble Th(OH)4 or hydroxyl
complexes, e.g., [Th(OH)2]+2, [Th2(OH)2]+6, [Th3(OH)5]+7; then, the precipitates or complexes
will be adsorbed by the particulate matter in water, with the result that the concentration of
soluble thorium in water will be very low. In most cases, sediment resuspension and mixing
may control the transportation of particle-sorbed thorium in water, but in some cases, the
concentration of dissolved thorium in waters may increase due to the formation of soluble
complexes with carbonate, humic materials, or other ligands in the water.
Thorium is a general health hazard and will persist long into the future as a component
of residual radioactivity in the environment. Determination of thorium in nuclear wastes is
important due to the long radioactive half-lives, high radiological toxicities, and criticality
concerns of its isotopes. In addition, thorium determinations are necessary for waste
classification purposes.
An accurate characterization of thorium interactions in the environment requires the
expertise of many fields such as chemistry, biology, geochemistry, oceanography, geology,
12
S.S. Johnson. Annual report. Virginia Minerals 37 (2) (1991) 9-16.

Jessica Avivar PhD Thesis
15
etc. Therefore, the development of improved analytical separation methods for thorium
elements is of interest, and further progress is needed in developing analytical models,
which allow for comparison and incorporation of data from these disciplines.
1.1.5 Legislation
In the case of uranium, water is one of the principal pathways for dispersal of uranium
mining and mining pollutants into the environment. Water can become contaminated by
surface runoff from overburden and waste rock piles, seepage through overburden and
waste rock piles, and other actions where mining waste comes in contact with water. Where
pyrite and other sulfidic minerals are present, acidic solutions may be generated, which
increases the mobility of heavy metals and radionuclides in the ore. Since public water
supplies derive their water from surface water bodies or underground sources through drilled
wells, some directives/limit levels have been established. The WHO13 guidelines specify a
provisional guideline value for uranium of 15 µg L-1. The drinking water standard is 20 µg L-1
of uranium in Canada14 and Australia, and 30 µg L-1 in the United States15.
Regarding to thorium, as cited previously uranium and thorium mining, milling, and
processing; phosphate fertilizer production; tin processing; phosphate rock processing; coal
combustion; and industrial boilers are the primary anthropogenic sources of thorium
released into the air, soil, and water. Although thorium pathways are well established there is
no legislation on this element so far.
To date no European statutory limits have been imposed for uranium and thorium in
drinking water. The European Directive (98/83/EC)16 stipulates that α-emitting radionuclides
exceeding 0.1 Bq L-1 should be investigated to determine which corrective action, if any, is
needed. There is a new proposal for a Council Directive laying down the requirements for
the protection of the health of the general public with regard to radioactive substances in
water intended for human consumption17 which would supersede the provisions of the
Directive 98/83/EC with regard to radioactive substances. This proposal suggests the use of
screening methodologies for individual radionuclides determination in replacement of gross
13
WHO (World Health Organization), Guidelines for drinking water quality. 3rd
edition, World Health Organization, Geneva, Switzerland, 2004.
14 Health Canada. Guidelines for Canadian drinking water quality: Summary table, 2008.
15 USEPA (United States Environmental Protection Agency). A regulator’s guide to the management of radioactive residuals from drinking water treatment technologies. Office of water (4606M), EPA 816-R-05-004, 2005.
16 European directive 98/83/EC. Related with drinking water quality intended for human consumption. European Directive, Brussels, Belgium, 1998, Vol. L330, p. 32.
17 Proposal for a Council Directive laying down the requirements for the protection of the health of the general public with regard to radioactive substances in water intended for human consumption. Interinstitutional File: 2011/0170 (NLE).

Chapter 1. General introduction
16
alpha activity or gross beta activity screening and if one of the activity concentrations
exceeds 20% of its reference concentration, an analysis of additional radionuclides should
be required. Therefore, accurate, precise, reliable and rapid analytical methods with low
detection limits are needed to determine the concentrations of radionuclides in
environmental samples, especially of naturally occurring long lived radionuclides, such as
uranium and thorium.

Jessica Avivar PhD Thesis
17
1.2 Laboratory automation
Since the beginnings of automation of analytical methods, various different flow techniques
have been developed and used for analytical or monitoring applications. They have gained
importance for clinical, industrial and environmental purposes as they allow highly
reproducible fast determinations. Automation and miniaturization of solution-based analysis
are essential to make them fast and efficient for routine and research tasks18.
Sample preparation accounts for over 60-80% of the total analysis time and normally is
the main contributor to analytical uncertainty. Thus, automation of sample preparation is of
great value in order to maximize throughput and minimize costs, time, and analyst risks due
to chemicals exposure. In this context, on-line coupling of solid phase extraction (SPE) to
different detectors represents the automation milestone, as the overall analytical protocol
can be fully mechanized.
Ideally, analytical equipment should be versatile, capable of accommodating a wide
variety of assays without the need for system reconfiguration, and compatible with a wide
range of detectors. Among the benefits of automation of analytical procedures, the increase
of sample frequency, minimization of sample contamination or alteration, miniaturization of
the analytical system, and lower reagent and sample consumption, implying less personal
and consumable costs should be highlighted.
A comprehensive review on flow techniques has been submitted for publication. This
review entitled “Laboratory automation” is enclosed at the end of this chapter. However, the
flow techniques which have been used in this thesis are described in more detail below.
1.2.1 Multisyringe flow injection analysis – MSFIA
Multisyringe flow injection analysis19-21 (MSFIA) was firstly described in 1999 by our group
and developed in collaboration with Crison (Barcelona, Spain), as a novel multichannel
technique combining the multichannel operation and high injection throughput of Flow
Injection Analysis (FIA) with the robustness and the versatility of Sequential Injection
Analysis (SIA). By use of parallel moving syringes as liquid drivers, it overcomes the
shortcomings of peristaltic pumping such as pulsation, required recalibration of flow rates
18
M. Trojanowicz. Advances in flow analysis, Wyley-VHC, Weinheim, Germany, 2008. 19
V. Cerdà, J.M. Estela, R. Forteza, A. Cladera, E. Becerra, P. Altimira, P. Sitjar. Flow techniques in water analysis. Talanta 50 (1999) 695-705.
20 M. Miró, V. Cerdà, J.M. Estela. Multisyringe flow injection analysis: characterization and applications. Trends Anal. Chem. 21 (2002) 199-210.
21 V. Cerdà, R. Forteza, J.M. Estela. Potential of multisyringe flow-based multicommutated systems. Anal. Chim. Acta 600 (2007) 35-45.

Chapter 1. General introduction
18
and limitations regarding applicable reagents. Flow rates and propelled volumes are
precisely known and defined by software-based remote control of the multisyringe device, as
in SIA. Moreover, by implementation of the multicommutation concept, another shortcoming
of FIA was overcome, since liquids are delivered to the system only when required and so
the reagents and sample consumption are low. Thus, MSFIA is an ideal multichannel
technique for challenging analytical procedures, which require high and precise flow rates,
and high pressure stability such as those with sorbent columns implementation22, enabling at
the same time, the handling of aggressive and volatile solutions. The only disadvantage of
MSFIA in front of other flow techniques is the periodical syringe refilling which causes a
lower injection frequency than using a FIA approach. Recent trends in the development of MSFIA systems involve its hyphenation with Lab-
on-Valve23-25, multipumping flow systems26 and low pressure chromatography using
monolithic columns27-29. This shows its versatility and ease of implementation.
A more detailed technical description of the MSFIA module is given in Chapter 3,
section 3.1.1.
1.2.2 Multipumping flow systems - MPFS
Multipumping flow systems30,31 (MPFS) are based on using solenoid micropumps for
propelling liquids. These low cost devices are responsible for both sample-reagent
22
M.I.G.S. Almeida, J.M. Estela, V. Cerdà. Multisyringe flow Injection potentialities for hyphenation with different types of separation techniques. Anal. Letters 44 (2011) 360-373.
23 J.B. Quintana, M. Mirò, J.M. Estela, V. Cerdà. Automated on-line renewable solid-phase extraction-liquid chromatography exploiting multisyringe flow injection-bead injection lab-on-valve analysis. Anal. Chem. 78 (2006) 2832-2840.
24 X. Long, M. Miró, E.H. Hansen, J.M. Estela, V. Cerdà. Hyphenating multisyringe flow injection lab-on-valve analysis with atomic fluorescence spectrometry for on-line bead injection preconcentration and determination of trace levels of hydride-forming elements in environmental samples. Anal. Chem. 78 (2006) 8290-8298.
25 H.M. Oliveira, M.A. Segundo, J.L.F.C. Lima, M. Miró, V. Cerdà. On-line renewable solid-phase extraction hyphenated to liquid chromatography for the determination of UV filters using bead injection and multisyringe-lab-on-valve approach. J Chromatogr. A 1217 (2010) 3575-3582.
26 Y. Fajardo, L. Ferrer, E. Gómez, F. Garcías, M. Casas, V. Cerdà. Development of an automatic method for americium and plutonium separation and preconcentration using a multisyringe flow injection analysis multipumping flow system. Anal. Chem. 80 (2008) 195-202.
27 H.M. Oliveira, M.A. Segundo, J.L.F.C. Lima, V. Cerdà. Multisyringe flow injection system for solid-phase extraction coupled to liquid chromatography using monolithic column for screening of phenolic pollutants. Talanta 77 (2009) 1466-1472.
28 F. Maya, J.M. Estela, V. Cerdà. Interfacing on-line solid phase extraction with monolithic column multisyringe chromatography and chemiluminescence detection: An effective tool for fast, sensitive and selective determination of thiazide diuretics. Talanta 80 (2010) 1333-1340.
29 F. Maya, J. M. Estela, V. Cerdà. Multisyringe ion chromatography with chemiluminescence detection for the determination of oxalate in beer and urine samples. Microchim. Acta 173 (2011) 33-41.

Jessica Avivar PhD Thesis
19
introduction and manifold commutation. Minimal reagent consumption is achieved, since
each micropump is operated individually in inserting the solutions. In comparison with other
flow techniques, the pulsed flow of the micropumps is better and faster at homogenizing the
reaction zone32, which leads to higher analyte peaks. Main features to be highlighted are the
simplicity and very low costs of the controlling circuits, favouring economic, portable and
miniaturised flow analysers33,34, which facilitate field measurements. Further advantages of
MPFS are a high versatility and flexibility of the flow system networking, especially in
combination with multicommutation selection valves (MCSV). However, some disadvantages
of the micropumps are the susceptibility to blockage by particles and to backpressure,
requiring recalibration of the volume dispensed.
A more detailed technical description of the MPFS is given in Chapter 3, section 3.1.2.
1.2.3 Lab-on-Valve – LOV
The recently proposed lab-on-valve35,36 (LOV) brings to flow-based analysis the third
generation, which significantly facilitates integration of various analytical units in the valve
and provides great potential for miniaturization of the entire instrumentation.
Precise volumes of sample and reagents are stacked in a holding coil by sequential
aspiration from the microfluidic device mounted atop a rotary selection valve and propelled
afterwards by flow reversal. It is shown that sample handling in the sequential injection
mode, which employs forward, reversed and stopped flow, can be programmed to
accommodate a wide variety of assays, such as solution metering, mixing, dilution,
incubation and monitoring. In addition to compactness, another advantage of these “lab-on-
valve” systems is the permanent rigid position of the sample processing channels that
ensures repeatability of microfluidic manipulations. This provides proven robustness and
reliability of operation, and makes the microfluidic system compatible with real life samples
and peripheral instruments.
30
R.A.S. Lapa, J.L.F.C. Lima, B.F. Reis, J.L.M. Santos, E.A.G. Zagatto. Multi-pumping in flow analysis: concepts, instrumentation, potentialities. Anal. Chim. Acta 466 (2002) 125-132.
31 J.L.F.C. Lima, J.L.M. Santos, A.C.B. Dias, M.F.T. Ribeiro, E.A.G. Zagatto. Multi-pumping flow systems: an automation tool. Talanta 64 (2004) 1091-1098.
32 C. Pons, R. Forteza, A.O.S.S. Rangel, V. Cerdà. The application of multicommutated flow techniques to the determination of iron. Trends Anal. Chem. 25 (2006) 583-588.
33 B. Horstkotte, C.M. Duarte, V. Cerdà. A miniature and field-applicable multipumping flow analyzer for ammonium monitoring in seawater with fluorescence detection. Talanta 85 (2011) 380-385.
34 B. Horstkotte, C.M. Duarte, V. Cerdà. Multipumping flow systems devoid of computer control for process and environmental monitoring. Intern. J. Environ. Anal. Chem. (2011). DOI: 10.1080/03067319.2010.548601.
35 J. Ruzicka. Lab-on-valve: universal microflow analyzer based on sequential and bead injection. Analyst 125 (2000) 1053-1060.
36 J. Wang, E. H. Hansen. Sequential injection lab-on-valve: the third generation of flow injection analysis. Trends Anal. Chem. 22 (2003) 225-231.

Chapter 1. General introduction
20
It is noteworthy that LOV-based techniques have not only been extensively employed in
homogeneous solution-based assays, but have also shown promise in heterogeneous
assays because flexible fluid manipulation is also suitable for delivering beads in flow-based
manifolds, i.e. precise fluid manipulation by the LOV system and the channel configuration
also make it a powerful platform for bead injection (BI)37,38. In combination with the
renewable surface concept, BI has been widely exploited for separation and
preconcentration of analytes in the presence of complex matrix components. Most
importantly, the automated transport of solid materials in such a system allows their renewal
at will and thus provides measurement, packing and perfusion of beads with samples and
reagents with a high degree of repeatability.
Furthermore, being operated in a closed system, LOV systems are characterized by low
consumption of sample and reagent, reduced analysis time, high reproducibility and minimal
sample contamination. Shortcomings of LOV are quite similar to those of classical SIA, such
as a worse zone penetration and longer time of analysis than in FIA due to the use of wider
tubes, the refilling of the syringe and the sequential injection mode. Another disadvantage is
the impossibility of confluence mixing. Some of these disadvantages are overcome by
coupling it to MSFIA as can be seen in some of the developed methods.
Summarizing, true advantages of using microfluidics are the compactness, the
automation of all the steps of the experimental protocol and, last but not least, the integration
of all manifold components into a permanent rigid structure that enhances the repeatability of
sample processing operations.
A more detailed technical description of the LOV is given in Chapter 3, section 3.1.3.
37
Y. Yu, Y. Jiang, M. Chen, J. Wang. Lan-on-valve in the miniaturization of analytical systems and sample processing for metal analysis. Trends Anal. Chem. 30 (2011) 1649-1658.
38 S.S.M.P. Vidigal, I.V. Tóth, A.S.S. Rangel. Exploiting the bead injection LOV approach to carry out spectrophotometric assays in wine: Application to the determination of iron. Talanta 84 (2011) 1298-1303.

Jessica Avivar PhD Thesis
21
1.3 Detectors
In this section, the basis of the detection techniques used in the developed methods
integrated in this thesis are presented. Spectrophotometric detection was used for total
determination (screening methods) and finally, an ICP-MS method is proposed for isotopic
analysis of uranium and thorium.
1.3.1 Spectrophotometric detection
In three of the proposed methods spectrophotometric detection has been chosen to the
development of simple and inexpensive systems easily adaptable to field measurements.
Spectrophotometry is always an acceptable alternative method for total element
determination (e.g. either total-uranium or total-thorium determination), due to its robustness
and acceptable precision and accuracy, associated with its lower cost compared with other
techniques. Moreover, it is possible to automate these methods fully and to make them
portable. The critical point against the use of spectrophotometry for determination of uranium
and thorium is generally associated with low sensitivity and selectivity of the
spectrophotometric determinations. These limitations can be solved by using selective
extraction materials and a long path-length liquid core waveguide capillary cell (LWCC) to
enhance the sensitivity of the detection system. The emerging potential of LWCCs for the
determination of chemical species at low concentrations enhances the capability to
investigate environmental processes and monitor environmental systems. Taking into
account that the absorbance is directly proportional to the path length, as can be seen at the
Lambert-Beer’s law described below, an improvement of several orders of magnitude in the
signal regarding to a 1 cm path length cell can be accomplished.
A = ε x b x c
Where,
A represents the absorbance,
ε molar absorptivity,
b optical path length,
c analyte concentration.
It is expected in near future that new Directives will define reference values for single
radionuclides. Since isotopic analyses usually require extensive protocols to separate the

Chapter 1. General introduction
22
single radionuclides, spectrophotometric methods used as screening tools will be very
handy, enabling fast, sensitive and robust analyses.
1.3.2 Inductively Coupled Plasma Mass Spectrometry - ICP-MS
ICP-MS is the most frequently used mass spectrometric technique for the determination of
elements and isotope ratios in the trace and ultratrace concentration range. In recent years,
it has also increasingly been used for determination of radionuclides in environmental,
biological and waste samples39,40. In contrast to conventional inorganic solid mass
spectrometric techniques, ICP-MS allows a simple sample introduction in an ion source
operating at atmospheric pressure and an easy quantification procedure using aqueous
standard solutions. In ICP-MS, the chemical compounds contained in the sample solution
are decomposed into their atomic constituents in an inductively coupled argon plasma at a
temperature of 6000-8000 K, this high temperature ensures a high degree of ionization (>
90% for most elements) with a low fraction of multiply charged ions. The positively charged
ions are extracted from the inductively coupled plasma into a high vacuum of the mass
spectrometer via an interface. The extracted ions are then separated by mass filters of either
quadrupole type, time of flight or combination of magnetic and electrostatic sector, and finally
measured by an ion detector. This way the number of atoms of the radionuclide of interest is
directly measured. At present both MC-ICP-MS and Multi-collector thermal ionization mass
spectrometry (MC-TIMS) instruments are considered the ultimate tools for isotope ratio
measurement of the longer lived U and Th isotopes41. TIMS instruments show the best ion
beam stability and better abundance sensitivity due to the lower spread in ion energy than
ICP-MS instruments. However, for thorium in particular, ICP-MS is better than TIMS due to
the low ionization efficiency at the TIMS filament. Another advantage with ICP-MS
instruments is that other isotope than what is intended to be measured may be used to
correct for the mass bias (in this thesis, bismuth was used as internal standard to improve
the precision). ICP-MS is an increasingly important tool for the determination of longer-lived
radionuclides. In general, the long-lived radioisotopes are best determined by mass
spectrometric methods, while the short-lived ones are preferably determined by radiometric
methods. Relative to radiometric detection techniques, ICP-MS can potentially offer lower
detection limits for longer-lived radioisotopes, shorter analysis times, and more
39
X. Hou, P. Roos. Critical comparison of radiometric and mass spectrometric methods for the determination of radionuclides in environmental, biological and nuclear waste samples. Anal. Chim. Acta 608 (2008) 105-139.
40 D. Larivière, V.F. Taylor, R.D. Evans, R.J. Cornett. Radionuclide determination in environmental samples by inductively coupled plasma mass spectrometry. Spectrochim. Acta Part B 61 (2006) 877-904.
41 J.S. Becker. Mass spectrometry of long-lived radionuclides. Spectrochim. Acta Part B 58 (2003) 1757-1784.

Jessica Avivar PhD Thesis
23
straightforward analytical procedures. Main advantages of ICP-MS are speed and sensitivity,
with the capability of determining all the actinide elements within a minute, at concentrations
as low as 1 ng L-1 in liquid samples. In addition, there is no need to separate the elements
one from another, as there is in alpha-spectrometry, because this is achieved by the mass
spectrometer, hence the number of sample pretreatment stages and the time per analysis
can be greatly reduced. Thus, ICP-MS has been widely used for the determination of
isotopes of uranium, thorium, plutonium, strontium, americium, radium, lead, technetium,
palladium, neptunium, curium and iodine in environmental and waste samples.
The major obstacle with alpha spectrometry for U and Th isotopes determination in
environmental samples are long counting times (days–weeks) and a limited precision due to
the counting statistics. Due to the low specific activity of the long-lived 238U and 232Th
isotopes (12.3 and 4 Bq mg−1, respectively), long counting times are necessary in order to
obtain sufficiently good counting statistics. In addition, careful separations from the sample
matrix are necessary in order to obtain thin counting sources, which are required for good
energy resolution. Although matrix suppression of the signal also occurs in mass
spectrometry, counting of the ions instead of their emitted radiation makes mass
spectrometric analysis of the long-lived 238U and 232Th around six orders of magnitude more
sensitive than the radiometric methods. Therefore, ICP-MS provides a rapid and sensitive
technique for the determination of these elements. Nevertheless, high levels of sample
matrix can produce interferences in the plasma which result in a suppression of analyte
ionization, or block the nebulizer or torch due to the deposition of dissolved solids coming
out of solution. An important consideration is the concentration of total dissolved solids
(TDS) present in the solution when it is analyzed. As a general rule, this concentration
should not exceed 0.1%. This necessitates some form of sample pretreatment. Sample
dilution will decrease the matrix effects but will also decrease the U and Th concentrations.
SPE separates the analytes from the matrix sample without reducing the analyte
concentration, and has the advantage, when coupled on-line, of requiring only a small
sample volume. Flow techniques represent a versatile fluid handling methodology that can
be used for automating chemical separations. Continuous FIA separation/preconcentration
techniques with ICP-MS have been described for analysis of U and Th in environmental
matrixes42-44.
42
J. H. Aldstadt, J. M. Kuo, L. L. Smith, M. D. Erickson. Determination of uranium by flow injection inductively coupled plasma mass spectrometry. Anal. Chim. Acta 319 (1996) 135-143.
43 J. B. Truscott, L. Bromley, P. Jones, E. H. Evans, J. Turner, B. Fairman. Determination of natural uranium and thorium in environmental samples by ETV-ICP-MS after matrix removal by on-line solid phase extraction. J. Anal. At. Spectrom. 14 (1999) 627-631.

Chapter 1. General introduction
24
1.4 Solid phase extraction-SPE
Direct determination of uranium and thorium by instrumental techniques including ICP-MS is
still difficult because of insufficient sensitivity, lack of selectivity, presence of complex matrix,
poor precision and accuracy. To solve these problems, enrichment and separation
techniques have been used in the analytical chemistry laboratories for uranium and thorium
determinations. SPE is one of the most important preconcentration-separation procedures
for trace heavy-metals ions, due to its simplicity and limited usage of the organic solvents.
Among many others, ion exchange and extraction chromatography are very popular
methods due to their applicability to both preconcentration and separation. Extraction
chromatography combines the selectivity of liquid-liquid extraction with the rapidity of
chromatographic methods. The separation of the radionuclides is based on the distribution of
the cations of interest between an organic and an aqueous phase. The extractant is
adsorbed on the surface of an inert support and corresponds to the organic, stationary
phase (Fig. 1.4). The utilized support has to be inert with respect to chemical reactions with
the organic phase and the retained cations. It also has to be stable against mechanical
influences and must have a large specific surface. In addition the support should be
spherical in order to allow optimum packing. The extractant, which is determining the
capacity of the resin, has to have a high selectivity and needs to be chemically and
physically stable.
Figure 1.4 Scheme of a resin particle.
44
J. B. Truscott, P. Jones, B. E. Fairman, E. H. Evans. Determination of actinide elements at femtogram per gram levels in environmental samples by on-line solid phase extraction and sector field-inductively coupled plasma-mass spectrometry. Anal. Chim. Acta 433 (2001) 245-253.

Jessica Avivar PhD Thesis
25
The general procedure consists of: first conditioning of the resin, then the sample is
loaded, after that a rinsing or washing step is carried out in order to eliminate the possible
interferences which have been also retained on the SPE material and finally the isolated and
sometimes preconcentrated analytes are eluted (Fig. 1.5).
Figure 1.5 Schematic depiction of the extraction and preconcentration processes in SPE.
Some advantages derived from using these materials are the substantial minimization of
sample and reagents consumption, as well as the ease of the analytical procedure.
Moreover, preconcentration improves the detection limits, increases the sensitivity and
enhances the accuracy of the results. Analytical expectations can be outranged if the total
automation of the methodology is achieved. Horwitz et al. have developed several types of
extraction chromatographic resins that can be used for enrichment and separation of
uranium and thorium45,46.
So it is well known that uranium and tetravalent actinide specific resin UTEVA® and
transuranium specific resin TRU are very applicable for separation of U and Th from various
types of samples2,47-52. The implementation of highly selective chromatographic columns to
45
E. P. Horwitz, M. L. Dietz, R. Chiarizia, H. Diamond. Separation and preconcentration of uranium from acidic media by extraction chromatography. Anal. Chim. Acta 266 (1992) 25-37.
46 E. P. Horwitz, R. Chiarizia, M. L. Dietz, H. Diamond. Separation and preconcentration of actinides from acidic media by extraction chromatography. Anal. Chim. Acta 281 (1993) 361-372.
47 C. Pin, J. F. S. Zalduegui. Sequential separation of light rare-earth elements, thorium and uranium by miniaturized extraction chromatography: Application to isotopic analyses of silicate rocks. Anal. Chim. Acta 339 (1997) 79-89.
48 R. Pilviö, M. Bickel. Separation of actinides from a bone ash matrix with extraction chromatography. J. Alloys Comp. 271-273 (1998) 49-53.
49 H. E. Carter, P. Warwick, J. Cobb, G. Longworth. Determination of uranium and thorium in geological materials using extraction chromatography. Analyst 124 (1999) 271-274.
50J. Wang, I. Chen, J. Chiu. Sequential isotopic determination of plutonium, thorium, americium, strontium and uranium in environmental and bioassay samples. Appl. Rad. Isot. 61 (2004) 299-305.

Chapter 1. General introduction
26
flow based methodologies allowed the automation of many analytical methods. Nowadays,
there are specific resins for the determination of Ra, Ni, Pb, Th, U, Np, Pu, Am, Cm, Sr, Tc,
³H y Fe between others, which have been included in automated separation protocols.
For example, TRU resin extracts not only tetra- and hexa-valent ions but also trivalent
ions from HNO3 solutions of high concentration (>1 mol L-1). However, TRU resin needs a
relatively large amount of stripping solution and/or stripping agent to elute tetra- and hexa-
valent actinide elements. TEVA® resin extracts tetravalent actinide elements from HNO3
solutions of high concentration (>1 mol L-1) and elutes them with a small amount of stripping
solution. However, hexavalent uranium is hardly extracted from HNO3 solutions with TEVA®
resin. UTEVA® resin extracs tetra- and hexa-valent actinides from HNO3 solutions of high
concentration (>1 mol L-1) simultaneously and elutes them with a small amount of stripping
solution.
51
A. Fujiwara, Y. Kameo, A. Hoshi, T. Haraga, M. Nakashima. Application of extraction chromatography to the separation of thorium and uranium dissolved in a solution of high salt concentration. J. Chromatogr. A 1140 (2007) 163-167.
52 H. Michel, D. Levent, V. Barci, G. Barci-Funel, C. Hurel. Soil and sediment sample analysis for the sequential determination of natural and anthropogenic radionuclides. Talanta 74 (2008) 1527-1533.

Jessica Avivar PhD Thesis
27
1.5 Objectives
Taking into account the occurrence, the characteristics of uranium and thorium in the
environment as well as the evolution of the directives which stipulate the limit values of
radioactive materials in water samples, the general objective of this thesis is the
development of new automated, accurate, precise, reliable and rapid analytical systems for
monitoring of uranium and thorium in environmental samples, exploiting flow analysis
techniques. According with current trends, we would like to implement mainly
multicommutated flow techniques (LOV, MSFIA and MPFS) in order to achieve sensitive and
selective analytical methodologies based on SPE and spectrophotometric or ICP-MS
detection allowing total and isotopic analysis of uranium and thorium at trace levels,
respectively.
More specifically the following objectives were proposed:
1. Selection of low cost instruments and materials for the development of inexpensive
methods for thorium and uranium determination which can be used for field
measurements, i.e. development of portable uranium and thorium analyzers.
2. Reduction of the time of analysis, that is to say, to increase the sample injection
throughput and minimization of handling of samples by the analyst. This will be useful
for monitoring purposes and in case of a nuclear accident to become acquainted of the
seriousness of it as soon as possible reducing at the same risks during the analysis.
3. Minimization of reagents consumption and so the waste generation. Reducing this way
the environmental impact per analysis.
4. Development of new methods based on multicommutated flow analysis techniques with
high degree of automation, including the separation and preconcentration pretreatment
stages and the on-line detection. Reaching a total automation degree, as for example
development of autonomous smart systems.
5. Development of methods of screening for fast uranium and thorium determination at
trace levels.
6. Development of fast, simple and fully automated systems capable of isotopic analysis
of uranium and thorium in environmental samples.
This work was incorporated into the projects of the National Plan for Science and Chemical
Technology CTQ2007-64331 and CTQ2010-15541 entitled “Development of automated
methods of analysis. Application to environmental monitoring plans” supported by the Spain’s
Ministry of Science and Innovation. It contributed specially to the part of monitoring of
radioactive elements in samples of environmental interest.

Chapter 1. General introduction
28
1.6 Original paper
This review “Laboratory Automation by flow techniques” by V. Cerdà, J. Avivar and A. Cerdà
has been accepted for publication as invited manuscript in the journal Pure and Applied
Chemistry (IUPAC) (impact factor: 2.128 year 2010).

Jessica Avivar PhD Thesis
53
Chapter 2
State of the art of automation in
radiochemical analysis
In this chapter, the state of the art of automation regarding radionuclide determinations in
environmental samples is reviewed.

Chapter 2. Automation in radiochemical analysis
54

Jessica Avivar PhD Thesis
55
2.1 Introduction
Since radionuclides activity concentrations in environmental samples are very low, and the
presence of other interfering elements and radionuclides, preconcentration and
radiochemical separation are often unavoidable. Most of the assays are carried out
manually, which make them expensive, tedious and time consuming. Some attempts have
been carried out with the aim of automating these techniques by the use of flow techniques,
but most of these methods have only been applied to samples with high radioisotopes
content from nuclear power stations. In other words, there are scarce automated methods
for radioisotopes determination at environmental levels in the bibliography, despite the
existence of treaties and directives which establish the need of environmental monitoring
programs.
The European Atomic Energy Community (EURATOM) was established in 1957 in the
so called “Treaties of Rome” with the main objective of contributing to the formation and
development of Europe's nuclear industries, so that all the Member States can benefit from
the development of atomic energy, and to ensure security of supply. At the same time, the
Treaty guarantees high safety standards for the public and prevents nuclear materials
intended principally for civilian use from being diverted to military use. Particularly, the
articles 35 and 36 of the Euratom Treaty require that each Member State shall establish the
facilities necessary to carry out continuous monitoring of the levels of radioactivity in air,
water and soil and to ensure compliance with the basic safety standards. The Spanish
Nuclear Security Council (Consejo de Seguridad Nuclear “CSN”) was created in 19801 as
the only body responsible of the nuclear safety and radiation protection in Spain. Thus, the
CSN is responsible of the monitoring and control of the radioactivity levels in the whole
Spanish territory. In 1985 the Spanish government signed the treaties that constituted the
European Community, including the EURATOM, and became part of the European Union
the year after. From that moment, the rules imposed by the EURATOM regarding to
radioactive waste, radiation protection and nuclear safety become mandatory for Spain as a
member of the EU. Moreover, the Chernobil accident in April 1986 highlighted the need to
establish a regular environmental monitoring program, so the Spanish government decided
to develop a radiation monitoring network, the REVIRA network. Actually, this network
consists of two networks, the automatic stations network (Red de Estaciones Automáticas
“REA”) which is connected to the CSN and provides continuously real-time data (gamma
radiation, I-131, radon, alpha and beta activity concentration) being a powerful warning tool
in case of a radiological incident, and the sampling stations network (Red de Estaciones de
1 Ley 15/1980, de 22 abril, de creación del CSN.

Chapter 2. Automation in radiochemical analysis
56
Muestreo “REM”) which enables the determination of radionuclides in the laboratory in
different samples of environmental interest such as dust particles in air, soil, water, milk and
food. Nowadays this network comprises 25 stations2, 24 in Spanish territory and one in
Portugal.
Thus, our group started participating at the REVIRA network in 1991. In addition to the
systematic monitoring of a number of radioisotopes, resources and experience with classical
radiochemical methodologies have been employed in a parallel research line that has lead to
the implementation of some automated methods based on multicommutated flow techniques
for the determination of isotopes of Ra, Y, Sr, Am, Pu, U and Th. Some of these automated
methods are easy portable enabling in-situ measurements, thus reducing the time of
exposure of the analyst to problematic samples. Other methods are just partially automated,
although the steps susceptible to automation, i.e. the sample pretreatment steps, are the
most laborious, with a higher degree of manipulation by the analyst, the highest reagent
consumption and the longest execution times. Thus, by automating radiochemical
separations, an analysis which could take days is reduced to hours. Furthermore, using
multicommutated techniques (i.e. SIA, LOV, MPFS and MSFIA), minimal reagents
consumption is achieved, since they are dispensed to the system only when needed,
resulting in greener and more economic automated systems.
More detailed information can be found in a comprehensive review entitled “Automation
of radiochemical analysis by applying flow techniques to environmental samples”, attached
to this chapter. In this article, the state of the art of automation in the radiochemical field is
reviewed. Also, a critical comparison of automatic protocols exploiting various generations of
flow techniques with a variety of detection systems to determine radioisotopes in samples of
environmental interest can be found in it.
2 REVIRA: Red de Vigilancia Radiológica Ambiental, CSN, 2009. Legal deposit M 17.108-2005.

Jessica Avivar PhD Thesis
57
2.2 Original paper
The review “Automation of radiochemical analysis by applying flow techniques to
environmental samples” by Y. Fajardo, J. Avivar, L. Ferrer, E. Gómez, M. Casas and V.
Cerdà published in Trends in Analytical Chemistry 29 (2010) 1399-1408, is attached below.
Trends in Analytical Chemistry (impact factor: 6.602 year 2010) is located at the first quartile
of the journals of the Analytical Chemistry area.

Chapter 2. Automation in radiochemical analysis
58

Jessica Avivar PhD Thesis
69
Chapter 3
Experimental section:
instrumentation and common materials
In this chapter, the software, the instrumentation (including detection systems and flow
instrumentation), and the multivariate optimization methodology used are presented.

Chapter 3. Experimental section
70

Jessica Avivar PhD Thesis
71
3.1 Flow instrumentation
A multisyringe pump module Bu4S and a rotatory autosampler (Crison Instruments S.A.,
Barcelona, Spain) were used in all the developed methods. The autosampler used was
equipped with a 45-position turntable for 15 mL tubes. A valve module VA1+1 (Crison
Instruments) was used in three of the methods presented in this thesis. A six-port injection
valve (IV) MultiBurette 4S (Crison Instruments) was used in the last developed method.
Micropumps (BIO-Chem Valve, NJ, USA), were used in the first developed method
presented in this thesis.
The instruments were connected in series to a personal computer for remote operational
control via the serial RS232C interface and accomplished by the software AutoAnalysis as
described in section 3.3. The instrumentation used in the proposed methods is described in
detail below.
3.1.1 Multisyringe burette
The multisyringe burette1 can be equipped with up to four syringes, which are used as liquid
drivers (Fig.3.1). Each syringe has a three-way solenoid valve (N-Research, Caldwell, NJ,
USA) at the head, which facilitates the application of multicommutation schemes. Pistons are
mounted on a common steel bar driven by a single step motor (40000 steps). Thus, all
pistons are moved simultaneously and unidirectional for either liquid delivering (dispense) or
aspirating (pick up).
Figure 3.1 Frontal view of the Multisyringe burette.
1 V. Cerdà, J.M. Estela, R. Forteza, A. Cladera, E. Becerra, P. Altimira, P. Sitjar. Flow techniques in water analysis. Talanta 50 (1999) 695-705.

Chapter 3. Experimental section
72
The step motor showed a speed range of 1024-20 s for total displacement,
corresponding to 40000 steps. Thus, the multisyringe module allowed precise handling of
microliters and a wide flow rate range (0.057-30 mL min-1, depending on the syringe volume
1-10 mL). Syringes of 0.5, 1, 2.5, 5, 10 and 25 mL are available, enabling a wide flow rate
range and a great combination. High chemical robustness is provided by the use of resistant
polymers poly(ethylene-co-tetrafluoroethylene) (ETFE) (head valves) and
poly(tetrafluoroethylene) (PTFE) (piston heads, poppet flaps).
Solenoids valves located at the heads of the syringes (on: to the system; off: to the
reservoir) allow four kinds of liquid displacement: On-dispense, Off-dispense, On-pick-up
and Off-pick-up (Fig.3.2).
Figure 3.2 Schematic depiction of the solenoid valves placed at the head of each syringe. a) Activated solenoid: “on” position and b) Deactivated solenoid: “off” position.
Four backside ports (V5-V8, Fig. 3.3) enable the power of additional external
multicommutation valves, micropumps or other instruments either directly or via a relay
allowing remote software control (ICP-MS). This amplifies the possibilities to construct
sophisticated flow networks. External solenoid valves are commonly used to drive the liquids
in the proposed systems (Fig. 3.4). Each port provides 12 V with a maximal current of 0.5 A,
enabling the connection of up to three MCSV to each port.

Jessica Avivar PhD Thesis
73
Figure 3.3 Backside connections of the multisyringe burette.
3.1.2 Multipumping flow system
A MPFS2 set-up was used at the first developed method and consisted of three solenoid
micropumps (BIO-Chem Valve, NJ, USA) with stroke volumes of 20 μL (M1 and M2) and 8
μL (M3). A micropump (Fig. 3.5) is a solenoid operated device designed to provide a
discrete dispensed volume of fluid. The flow path is isolated from the operating mechanism
by a flexible diaphragm. When the solenoid is energized, the diaphragm is retracted creating
a partial vacuum within the pump body. This pulls liquid through the inlet check valve (A) and
2 R. A. S. Lapa, J. L. F. C. Lima, B. F. Reis, J. L. M. Santos, E. A. G. Zagatto. Multi-pumping in flow analysis: concepts, instrumentation, potentialities. Anal. Chim. Acta 466 (2002) 125–132.
Figure 3.4 External solenoid valve.

Chapter 3. Experimental section
74
simultaneously closes the outlet check valve (B). When the solenoid is de-energized a spring
pushes the diaphragm down, expelling a discrete volume of liquid through check valve B
while simultaneously closing check valve A. Micropumps require a complete on-off cycle for
each discrete dispense. Repeatedly cycling the solenoid creates a pulsed flow. Each
micropump allows injection of a specific volume of reagent or sample, varying the number of
pulses. The flow rate is controlled according to the frequency and volume dispensed in each
pulse. The body of the micropumps is made of steel at the top and teflon at the bottom
where is the pumping system (diaphragm). Micropumps when activated use an internal
source of 12 V. A schematic depiction of the controller system designed and created by our
group and commercialized by Sciware S.L.3 (Palma de Mallorca, Spain) is shown in Fig. 3.6.
This modul was controlled through the interface RS232.
Figure 3.5 Image and scheme of a micropump.
3 www.sciware.com.

Jessica Avivar PhD Thesis
75
Figure 3.6 Schematic depiction of the controller system of micropumps.
3.1.3 Lab-on-valve (LOV)
In the Lab-on-Valve4,5 methodology, sample, reagents and beads manipulation is carried out
in a sequential mode, allowing direct and reversed flow. The LOV microconduits are
specially designed for each system and were fabricated from methacrylate as a monolithic
structure encompassing either eight or six integrated microchannels (1.5 mm i.d./16.0 mm
length, excepting the bead column channel made of 3.2 mm i.d.), and commercialized by
Sciware. These were mounted atop of a multiposition selection valve (SV) (Fig. 3.7a). All of
them of low pressure design and made of chemical resistant polymers PEEK (stator) and
PTFE (rotor) (Fig. 3.7b).
The central port of the integrated LOV sample processing unit, connected to a
syringe of the MSFIA module, via a holding coil, is made to address the peripheral ports of
the unit, for sequential aspiration of the various constituents for the BI process, via the
central communication channel (CC) in the selection valve (see Fig. 3.7b). One of the LOV
channels (port 1) serves as microcolumn position for the renewable beads. This column is
filled in with an appropriate amount of resin (see Fig. 3.7a). To contain the sorbent within the
cavity of the LOV module and prevent them from escaping, the outlet of the column was
furnished with a glass fibre prefilter (Millipore) retaining the beads while allowing the solution
to flow freely (Fig. 3.8).
4 J. Ruzicka. Lab-on-valve: universal microflow analyzer based on sequential and bead injection. Analyst 125 (2000) 1053-1060.
5 J. Wang, E. H. Hansen. Sequential injection lab-on-valve: the third generation of flow injection analysis. Trends Anal. Chem. 22 (2003) 225-231.
Power supply
Digital I/O board
P8 P7 P6
Digital relay output
P4 P5 P3 P2 P1
RS485/RS232 interface
Power supply for relays

Chapter 3. Experimental section
76
Figure 3.7 a) Left: Example of a LOV piece. b) Right: Rotor of the SV.
Figure 3.8 Port 1 of the LOV platform equipped with an O-ring (toric joint) and a prefilter to retain the beads.
3.1.4 Manifold components
The flow network manifold was constructed of flexible tubes of chemical resistant PTFE of
0.8 and 1.5 mm i.d., including holding coils (HC) and knotted reaction coils (KRC) (Fig. 3.9).
Particular tube lengths are given at each developed manifold. All connections were made by
means of polyvinylidene fluoride (PVDF) connectors, except cross-junctions, which are
made of methacrylate.
Figure 3.9 Knotted reaction coil (KRC).

Jessica Avivar PhD Thesis
77
3.2 Detectors
3.2.1 Spectrophotometric detection basis
In three of the methods presented in this thesis, spectrophotometric detection was used as
an inexpensive screening tool, alternative to radiometric counters or ICP-MS. This allowed
the development of fully automated portable analyzers.
A flow cell made from a 100 cm type II Teflon AF long path-length liquid core waveguide
capillary cell (LWCC) (World Precision Instruments, FL, USA), with an internal diameter of
550 μm, an effective path length of 100.0±0.5 cm, and an internal volume of 240 μL was
used to enhance the LOD of the detection system (Fig. 3.10).
Taking into account that the absorbance is directly proportional to the path length, an
improvement of two orders of magnitude in the signal regarding to a 1 cm path length cell
was accomplished.
Figure 3.10 Inside of a 100 cm LWCC.
LWCCs6,7 are versatile and can enhance the sensitivity and improve limits of detection
of optical instrumentation, by detecting as much of the optical signal as possible while
minimizing background noise. LWCCs are based on the use of a capillary with a lower
refractive index (n1) than the liquid core contained in it (n2), so the light introduced into the
liquid core of the capillary is totally internally reflected down the capillary towards the
detector (Fig. 3.11). They are connected to the light source and to the spectrophotometer
through two optical fibres of 400 and 600 μm internal diameter (Ocean Optics, USA). The
6 L. J. Gimbert, P. J. Worsfold. Environmental applications of liquid-waveguide-capillary cells coupled with spectroscopic detection. Trends Anal. Chem. 26 (2007) 914–930.
7 F. Maya, J. M. Estela, V. Cerdà. Multisyringe flow injection analysis hyphenated with liquid core waveguides for the development of cleaner spectroscopic analytical methods: improved determination of chloride in waters. Anal. Bioanal. Chem. 394 (2009) 1577–1583.
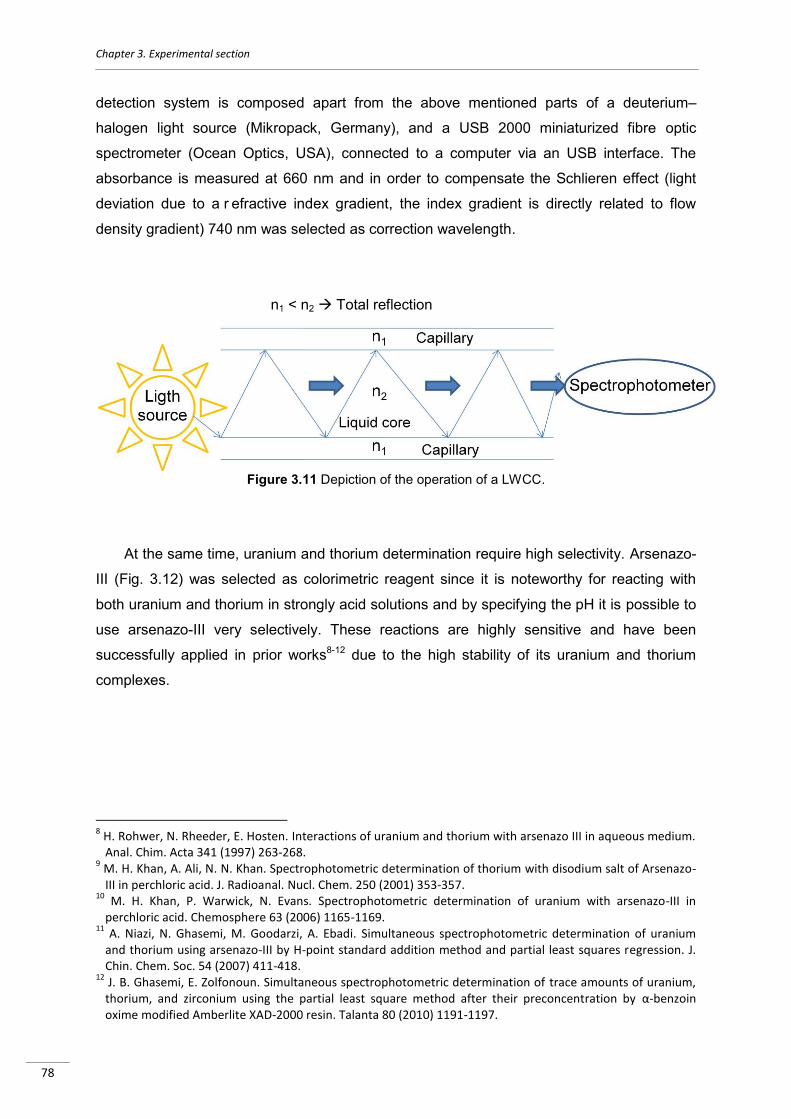
Chapter 3. Experimental section
78
detection system is composed apart from the above mentioned parts of a deuterium–
halogen light source (Mikropack, Germany), and a USB 2000 miniaturized fibre optic
spectrometer (Ocean Optics, USA), connected to a computer via an USB interface. The
absorbance is measured at 660 nm and in order to compensate the Schlieren effect (light
deviation due to a r efractive index gradient, the index gradient is directly related to flow
density gradient) 740 nm was selected as correction wavelength.
n1 < n2 Total reflection
Figure 3.11 Depiction of the operation of a LWCC.
At the same time, uranium and thorium determination require high selectivity. Arsenazo-
III (Fig. 3.12) was selected as colorimetric reagent since it is noteworthy for reacting with
both uranium and thorium in strongly acid solutions and by specifying the pH it is possible to
use arsenazo-III very selectively. These reactions are highly sensitive and have been
successfully applied in prior works8-12 due to the high stability of its uranium and thorium
complexes.
8 H. Rohwer, N. Rheeder, E. Hosten. Interactions of uranium and thorium with arsenazo III in aqueous medium. Anal. Chim. Acta 341 (1997) 263-268.
9 M. H. Khan, A. Ali, N. N. Khan. Spectrophotometric determination of thorium with disodium salt of Arsenazo-III in perchloric acid. J. Radioanal. Nucl. Chem. 250 (2001) 353-357.
10 M. H. Khan, P. Warwick, N. Evans. Spectrophotometric determination of uranium with arsenazo-III in perchloric acid. Chemosphere 63 (2006) 1165-1169.
11 A. Niazi, N. Ghasemi, M. Goodarzi, A. Ebadi. Simultaneous spectrophotometric determination of uranium and thorium using arsenazo-III by H-point standard addition method and partial least squares regression. J. Chin. Chem. Soc. 54 (2007) 411-418.
12J. B. Ghasemi, E. Zolfonoun. Simultaneous spectrophotometric determination of trace amounts of uranium, thorium, and zirconium using the partial least square method after their preconcentration by α-benzoin oxime modified Amberlite XAD-2000 resin. Talanta 80 (2010) 1191-1197.
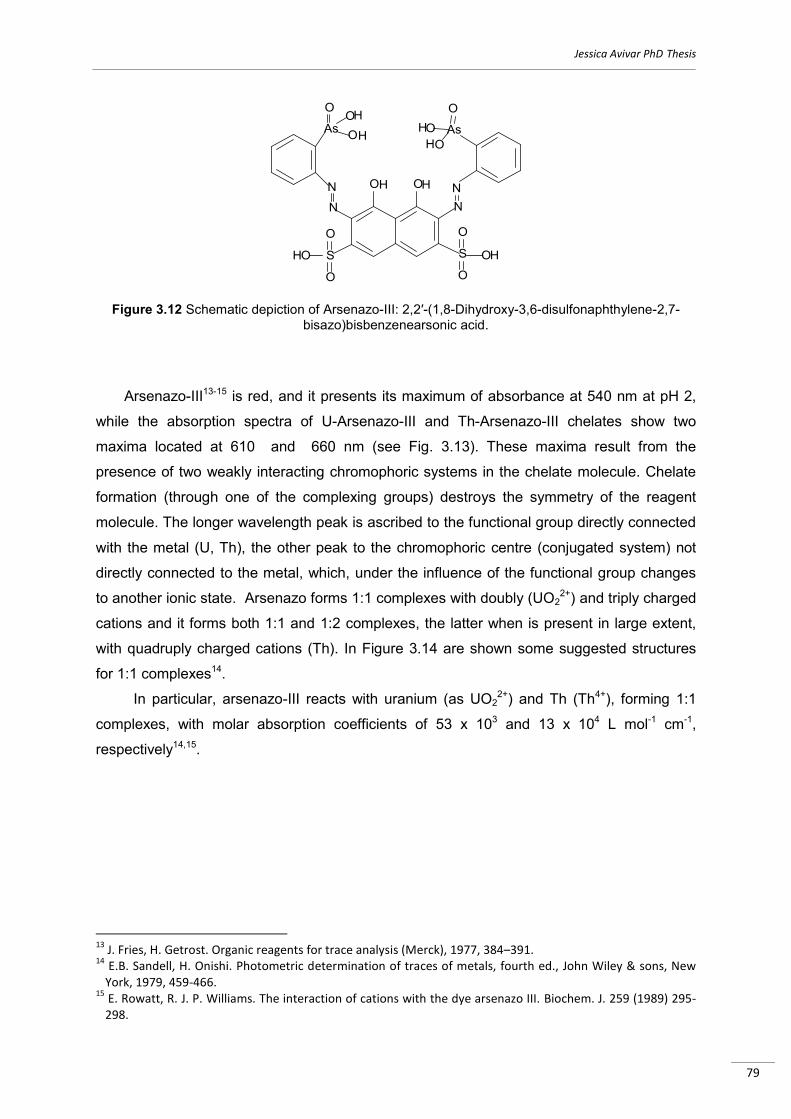
Jessica Avivar PhD Thesis
79
Figure 3.12 Schematic depiction of Arsenazo-III: 2,2′-(1,8-Dihydroxy-3,6-disulfonaphthylene-2,7-
bisazo)bisbenzenearsonic acid.
Arsenazo-III13-15 is red, and it presents its maximum of absorbance at 540 nm at pH 2,
while the absorption spectra of U-Arsenazo-III and Th-Arsenazo-III chelates show two
maxima located at 610 and 660 nm (see Fig. 3.13). These maxima result from the
presence of two weakly interacting chromophoric systems in the chelate molecule. Chelate
formation (through one of the complexing groups) destroys the symmetry of the reagent
molecule. The longer wavelength peak is ascribed to the functional group directly connected
with the metal (U, Th), the other peak to the chromophoric centre (conjugated system) not
directly connected to the metal, which, under the influence of the functional group changes
to another ionic state. Arsenazo forms 1:1 complexes with doubly (UO22+) and triply charged
cations and it forms both 1:1 and 1:2 complexes, the latter when is present in large extent,
with quadruply charged cations (Th). In Figure 3.14 are shown some suggested structures
for 1:1 complexes14.
In particular, arsenazo-III reacts with uranium (as UO22+) and Th (Th4+), forming 1:1
complexes, with molar absorption coefficients of 53 x 103 and 13 x 104 L mol-1 cm-1,
respectively14,15.
13
J. Fries, H. Getrost. Organic reagents for trace analysis (Merck), 1977, 384–391. 14
E.B. Sandell, H. Onishi. Photometric determination of traces of metals, fourth ed., John Wiley & sons, New York, 1979, 459-466.
15 E. Rowatt, R. J. P. Williams. The interaction of cations with the dye arsenazo III. Biochem. J. 259 (1989) 295-298.

Chapter 3. Experimental section
80
Figure 3.13 Absorbtion spectra of the reagent arsenazo-III and the complex with uranium at pH 2.
Figure 3.14 Suggested structures for the 1:1 arsenazo-III complexes.
3.2.2 ICP-MS detection An ICP-MS Elan DCR-e (Perkin Elmer) was used in this thesis. The ICP-MS used consists
of the following components:
• Sample introduction system – equipped with a cross flow nebulizer (Fig. 3.15) and a Scott
spray chamber and provides the means of getting samples into the instrument. The liquid
sample is introduced by a peristaltic pump to the cross flow nebulizer that creates an aerosol
of fine droplets (Fig. 3.16). These fine droplets are passed through a Scott spray chamber
before they are allowed to enter the plasma.
• ICP torch and radio frequency (RF) coil – generates the argon plasma, which serves as the
ion source of the ICP-MS. This plasma creates a very hot zone (6000 °C) that serves a
variety of functions. The plasma is generated by passing argon through a series of
concentric quartz tubes (the ICP torch) that are wrapped at one end by a RF coil. Energy
supplied to the coil by the RF generator couples with the argon to produce the plasma. Into

Jessica Avivar PhD Thesis
81
the plasma, the sample liquid droplets are dried to a solid and then heated to a gas. As the
atoms continue their travel through the plasma, they absorb more energy and eventually
release one electron to form singly charged ions which exit the plasma and enter the
interface region.
Figure 3.15 Cross-flow nebulizer. Figure 3.16 Form of sample in ICP-MS.
• Interface –The interface (Fig. 3.17) allows the plasma and the ion lens system to coexist
(despite the large temperature difference and the high pressure) and the ions generated by
the plasma to pass into the ion lens region. The interface consists of two inverted funnel-like
devices called cones. The sampler cone is located next to the plasma and the skimmer cone
is located several millimeters behind the sampler cone. These cones in the instrument used
are produced from nickel. The orifice openings of the cones should be large enough to allow
for the passage of the ion beam while, at the same time, not allow so much gas to enter the
instrument that the instrument’s vacuum system is taxed. The sampler and the skimmer
cone have orifice openings of 1.1 mm and 0.9 mm, respectively.
Figure 3.17 The ICP-MS interface.

Chapter 3. Experimental section
82
• Lens – The ion lens is positioned immediately behind the interface. It is responsible for
focusing ions into the quadrupole. Since the ions generated in the plasma are nearly all
positively charged, they have a natural tendency to repel each other. In order to get as many
of the ions as possible into the quadrupole, it is necessary to keep the ion beam from
diverging. This is achieved by passing the ions through a charged metallic cylinder that acts
as a focusing lens. Since the charge on the lens is the same as the charge on the ions, the
ions are repelled back toward each other to form a focused ion beam. The small disk located
between the skimmer cone and the cylinder lens is the shadow stop. This device keeps the
photons and unionized materials emitted from the plasma from moving downstream where
they could have an adverse effect on the performance of the ICP-MS. The mass
spectrometer uses an electrical field to focus the ion beam.
• Vacuum system – provides high vacuum for ion optics, quadrupole and detector. If an ion
has to travel the distance between the interface and the detector (< 1 m), it cannot collide
with any gas molecules. This requires removal of nearly all of the gas molecules in the space
between the interface and the detector. This task is accomplished using a combination of a
turbo molecular pump and mechanical roughing pump, which comprise the main
components of the vacuum system. The turbo molecular pump works like a jet turbine and is
capable of rapidly pumping a chamber to a pressure of 1.3 x 10⁻³ Pa or less. The roughing
(mechanical) pump backs the turbo molecular pump and evacuates the interface region.
• Reaction cell –The quadrupole ICP-MS (Fig. 3.18) was equipped with a reaction cell (DRC-
e) which can significantly suppress the interfering isobaric ions by choice of an appropriate
reaction gas. For thorium and uranium determination in environmental samples this was not
necessary.
• Mass spectrometer – acts as a mass filter to sort ions by their mass-to-charge ratio (m/z).
A quadrupole consists of 4 rods approximately 20 cm in length and 1 cm in diameter and
works by setting voltages and radio frequencies to allow ions of a given mass-to-charge ratio
to remain stable within the rods and pass through to the detector (Fig. 3.19). Ions with
different mass-to-charge ratios are unstable in the cell and are ejected. Under the control of
the instrument software, the mass spectrometer can move to any m/z needed to measure
the elements of interest in the sample analyzed. The quadrupole is capable of scanning at a
rate > 5000 atomic mass units (amu) per second. This is the reason why ICP-MS can
determine so many different elements quickly even though only one mass passes through
the quadrupole at a time.

Jessica Avivar PhD Thesis
83
Figure 3.18 Photograph of the reaction cell, the quadrupole and the detector of the ICP-MS used.
• Detector – counts individual ions exiting the quadrupole. The active surface of the detector,
known as a dynode, releases an electron each time an ion strikes it. The ion exiting the
quadrupole strikes the first dynode which releases electrons and starts the amplification
process. The electrons released from the first dynode strike a second dynode where more
electrons are released. This cascading of electrons continues until a measurable pulse is
created. By counting the pulses generated by the detector, the system counts the ions that
hit the first dynode.
Figure 3.19 Quadrupole mass filter.
Reaction Cell (DCR-e)
Quadrupole
Detector

Chapter 3. Experimental section
84
• Data handling and system controller – controls all aspects of instrument control and data
handling to obtain final concentration results.

Jessica Avivar PhD Thesis
85
3.3 Separation and preconcentration techniques used
In order to separate and preconcentrate analytes, solid phase extraction (SPE) was applied.
Although there are various kinds of resin, two commercial chromatographic resins from
Triskem Industries (France) were selected. It is well known that uranium and tetravalent
actinide specific resin UTEVA® and transuranium specific resin TRU are very applicable for
separation of U and Th from various types of samples. Moreover, preconcentration improves
the detection limits, increases the sensitivity and enhances the accuracy of the results.
The separation of the radionuclides is based on the distribution of the cations of interest
between an organic and an aqueous phase. The extractant is adsorbed on the surface of an
inert support and corresponds to the organic, stationary phase.
Some advantages derived from using these materials are the substantial minimization of
sample and reagents consumption, as well as the ease of the analytical procedure.
Analytical expectations can be outranged if the total automation of the methodology is
achieved.
3.3.1 TRU resin
TRU (TRansUranide) resin is an extraction chromatographic material based on a bifunctional
organophosphorus extractant, widely used for trace actinide isolation in complex samples16-
18. The extractant system is octylphenyl-N,N-di-isobutyl carbamoylphosphine oxide
(abbreviated CMPO) dissolved in tri-n-butyl phosphate (TBP) (Fig. 3.20).
The CMPO/TBP solvent system complexes actinide elements and extracts them out of
certain aqueous solutions. Most matrix elements show no or little retention on the resin in
acidic media and can be isolated from the actinides during the sample load and washing
steps.
16
O.B. Egorov, M.J. O’Hara, O.T. Farmer III, J.W. Grate. Extraction chromatographic separations and analysis of actinides using sequential injection techniques with on-line inductively coupled plasma mass spectrometry (ICP-MS) detection. Analyst 126 (2001) 1594–1601.
17 J. Mellado, M. Llaurado, G. Rauret. Determination of actinides and strontium in fish samples by extraction chromatography. Anal. Chim. Acta 458 (2002) 367–374.
18 Y. Fajardo, L. Ferrer, E. Gómez, F. Garcías, M. Casas, V. Cerdà. Development of an automatic method for americium and plutonium separation and preconcentration using a multisyringe flow injection analysis multipumping flow system. Anal. Chem. 80 (2008) 195–202.

Chapter 3. Experimental section
86
TBP CMPO
Figure 3.20 Structure of TRU resin extractant system, TBP and CMPO.
Assumed extraction equilibrium for uranium:
With, E = extractant.
3.3.2 UTEVA® resin
UTEVA® (Uranium and TEtraValents Actinides) resin is an extraction chromatographic
material widely used for uranium and tetravalent actinides isolation19-22. The extractant is
diamyl, amylphosphonate (DAAP, Fig. 3.21), and it forms nitrato complexes with
uranium(VI), thorium(IV), neptunium(IV) and plutonium(IV). Therefore, the nitric acid
concentration is a limiting factor for the uptake of these complexes.
19
I. W. Croudace, P. E. Warwick, R. C. Greenwood. A novel approach for the rapid decomposition of actinide resin and its application to measurement of uranium and plutonium in natural waters. Anal. Chim. Acta 577 (2006) 111-118.
20 A. Fujiwara, Y. Kameo, A. Hoshi, T. Haraga, M. Nakashima. Application of extraction chromatography to the separation of thorium and uranium dissolved in a solution of high salt concentration. J. Chromatogr. A 1140 (2007) 163-167.
21 E. Manickam, S. Sdraulig, R. A. Tinker. Method design and validation for the determination of uranium levels in human urine using high-resolution alpha spectrometry. J. Environ. Radioactiv. 99 (2008) 497-501.
22 H. Rameback, U. Nygren, P. Lagerkvist, A. Verbruggen, R. Wellum, G. Skarnemark. Basic characterization of 233
U: Determination of age and 232
U content using sector field ICP-MS, gamma spectrometry and alpha spectrometry. Nucl. Instr. Meth. A 266 (2008) 807-812.

Jessica Avivar PhD Thesis
87
Figure 3.21 Structure of UTEVA® resin extractant.
Assumed extraction equilibria for thorium and uranium:
With, E = extractant.

Chapter 3. Experimental section
88
3.4 Software
Instrumental control, data acquisition and processing were carried out with the software
package AutoAnalysis 5.0. It was fundamentally described by Becerra et al. (1999)23,
developed in our group and commercialized by Sciware3 S.L. The software is written in
Delphi and Visual C++ and offers a window-based graphical surface. It runs on all 32-bit
operation systems from Microsoft Corporation® (MS-Windows XP).
The distinctive feature of this software based on dynamic link libraries (DLLs) at 32 bits
is the possibility of using a single and versatile application without further modification for
whatever instrumentation and detection system needed. It involves a basic protocol which
allows the implementation of specific and individual DLLs, addressing the configuration of
the assembled flow analyzer. Thus being a very flexible tool, easy to handle by non-
specialised users.
3.4.1 System configuration
The establishment of a communication protocol or “channel” (e.g. RS232, RS485, USB,
IEEE488), incorporation and configuration of the connected hardware (e.g. syringe pump,
spectrometer, etc) are carried out via individual dynamic link libraries (DLL). Since, these are
installed and loaded as required for each system forming an individual configuration,
modification of the instrumentation assembly requires a minimum of adaptation effort (Fig.
3.22). Program versatility is only limited by the availability of the required DLLs. Up-to-now,
DLLs for seven communication channels and 30 devices are available including atomic
fluorescence, molecular fluorescence, spectrometric and electrochemical detectors,
autosampler, syringe-, peristaltic-, and solenoid-micropumps, valve modules, and I/O, A/D,
or D/A PC digital cards for the connection and communication with other devices. In this
work, DLLs for the communication channels Ocean Optics (USB), Generic Serial (RS485)
and Serial Crison (RS232), and Automatic Multisyringe Crison, Automatic Valve Module
Crison, Ibercomp Pump and Valve, Autosampler Crison, and Spectrometer Ocean Optics
instruments were used. After loading the required configuration for the connected
instruments, they can be addressed in each method and corresponding command forms
become available in the editor window in addition to the basic and former described
functions. Data processing is the same independently of the instruments or configuration
loaded. At the same time, data processing and method development are centralized,
23
E. Becerra, A. Cladera, V. Cerdà. Design of a very versatile software program for automating analytical methods. Lab. Robot. Autom. 58 (1999) 131-140.

Jessica Avivar PhD Thesis
89
providing ease of use for the users by minimizing the time and efforts required to incorporate
a new instrument to the system.
Figure 3.22 Hardware window, where channels and instruments are loaded to establish a
configuration.
3.4.2 Method edition
The analytical method is created by sequencing functions (e.g. wait, variable and
conditionals) or instructions for the instruments by their selection from a pull-down menu and
assigning specified commands to them (Fig. 3.23). This provides a variability of
programming functions for method creation including procedures, loops, indexing, basic
calculations, variables, user input, waiting steps, event marking, comments, conditional
enquiries, and on-line data processing. Further functions enable method test execution,
definition of detection thresholds, manual data processing, such as calibration, data
smoothing, spectral information processing, peak adjustment, and data export. Furthermore,
this software allows the use of conditionals which enables the development of smart
systems.
Procedures are prior-created instruction protocols, which can be loaded by all methods
within the same hardware configuration. Main advantages are higher method clearness by
apparent shorting, module-like programming, and repeated application in the same method.
It is important to note that pump operations could be carried out either exclusively, i.e.
the next instruction is not processed until the pump stops, or no-exclusive, i.e., the next

Chapter 3. Experimental section
90
instruction is processed already after initialization of the pump operation, which is then
executed in background.
The window “Execute” enables method initiation, pause, stop, as well as the control of
the execution and continuously acquired data. Zoom, scale, and shift functions are also
available.
Taking advantage of these features allows the creation and optimization of highly
versatile applications. Based on 32-bit technology, AutoAnalysis allows multitasking
operations such as simultaneous method execution and data processing, multiple loading,
and working with other programs running at the same time.
Figure 3.23 Method edition window
3.4.3 Data processing
AutoAnalysis offers tools for data processing after method termination such as zoom
functions, visualization of the original acquired data as well as of a smoothed function,
baseline, and peak data. It allows peak height and peak area calibration, data export and
saving, basic calculations, and overlay with prior acquired data (Fig. 3.24). For peak
maximum, start-, and end-point identification, thresholds for the numerical first and second
derivative and a peak height minimum can be defined. Manual, mouse-drag peak correction,
adding of non-identified peaks or elimination of error-peaks is further possible. On-line data
processing is also possible by the use of conditionals.

Jessica Avivar PhD Thesis
91
Figure 3.24 Fiagram and register table of the analytical signals.

Chapter 3. Experimental section
92
3.5 Multivariate optimization
Analytical chemists are constantly performing experiments for a very wide variety of reasons.
The term optimization has been commonly used in analytical chemistry as a means of
discovering the conditions that produce the best output. Traditionally, optimization in
analytical chemistry has been carried out by monitoring the influence of one factor at a time
on an experimental response. While only one parameter is changed, others are kept at a
constant level. This optimization technique is called one-variable-at-a-time. Its major
disadvantages are that it does not include the interactive effects among the variables studied
and that it is time consuming. Moreover, there is a risk of misinterpreting the results if
important interactions between factors are presented. Interaction between variables can be
relevant and not taking into account them can give wrong results.
In order to overcome this problem, the optimization of analytical procedures has been
carried out by using multivariate statistic techniques. Among the most relevant multivariate
techniques used in analytical optimization is response surface methodology24-26. Response
surface methodology is a collection of mathematical and statistical techniques based on the
fit of a polynomial equation to the experimental data, describing the behaviour of a data set
with the objective of making statistical previsions. The objective is to simultaneously optimize
the levels of the variables to attain the best system performance. Since, the response in any
point of the experimental domain can be predicted a graphical representation can be easily
obtained27.
By comparing univariate design with multivariate design, it is possible to say that:
Experimental design takes into account the interactions among the variables, while the
univariate design does not.
Experimental design provides a global knowledge (in the whole experimental domain),
while the univariate design gives a local knowledge (only where the experiments have
been performed).
In each point of the experimental domain, the quality of the information obtained by
experimental design is higher than the obtained by the univariate design.
24
T. Lundstedt, E. Seifert, L. Abramo, B. Thelin, A. Nyström, J. Pettersen, R. Bergman. Experimental design and optimization. Chemomet. Int. Lab. Syst. 42 (1998) 3-40.
25 M. A. Bezerra, R. E. Santelli, E. P. Oliveira, L. S. Villar, L. A. Escaleira. Response surface methodology (RSM) as a tool for optimization in analytical chemistry. Talanta 76 (2008) 965-977.
26 R. Leardi. Experimental design in chemistry: A tutorial. Anal. Chim. Acta 652 (2009) 161-172.
27 R. G. Brereton. Chemometrics, Data analysis for the laboratory and chemical plant. John Wiley & sons, New York, 2003.

Jessica Avivar PhD Thesis
93
The number of experiments required by an experimental design is smaller than those
performed with a univariate approach.
Also, it should be clear that:
The quality of the results depends on the distribution of the experiments in the
experimental domain.
The optimal distribution of the experiments depends on the postulated model.
Given the model, the experimental limitations and the budget available (= maximum
number of experiments), the experimental design will detect the set of experiments
resulting in the highest possible information.
Some terms that will be further used are defined below:
Experimental domain is the experimental field that must be investigated. It is defined by
the minimum and maximum limits of the experimental variables studied.
Experimental design is a specific set of experiments defined by a matrix composed by the
different levels combinations of the variables studied. A design defines a specific set of
combinations for the levels of variables that must be applied experimentally to obtain the
responses.
Factors or independent variables are experimental variables that can be changed
independently of each other.
Levels of a variable are different values of a variable at which the experiments must be
carried out. In these designs each variable has three levels, coded as +1, 0 and -1,
respectively. Codification of the levels of the variable consists of transforming each
studied real value into coordinates inside a scale with dimensionless values, which must
be proportional at its localization in the experimental space.
Responses or dependent variables are the measured values of the results from
experiments. A typical response is the analytical signal (absorbance, counts, etc).
Residual is the difference between the calculated and the experimental result for a
determinate set of conditions. A good mathematical model fitted to experimental data
must present low residuals values.
Pure error is the random fluctuation of measurements.
As general rule, when the experimental variables and the responses have been defined,
the experiments can be planned and performed in such a way that a maximum of
information is gained from a minimum of experiments. Screening is the first step in the
efficient assessment of the factors involved in an analytical system under study. Thus, it can
be said that a major role of experimental design is in screening. After determining the
significant factors, the optimum operation conditions are att ained by using more complex

Chapter 3. Experimental section
94
experimental designs such as Doehlert matrix (DM), central composite designs (CCD) or
three-level designs such as the Box-Behnken design (BBD).
3.5.1 Screening
In any experimental procedure, several experimental variables or factors may influence the
result. A screening experiment is performed in order to determine the experimental variables
and interactions that have significant influence on the result, measured in one or several
responses28,29.
In screening studies linear or second order interaction models are common, such as full
factorial or fractional factorial designs. In a factorial design the influences of all experimental
variables, factors, and interaction effects on the response or responses are investigated.
Three centre points were and should always be included in factorial designs, due to the risk
of missing non-linear relationships in the middle of the intervals is minimized, and repetition
allows the determination of confidence intervals.
3.5.1.1 Factorial designs
These were used in the screening of the methods presented in this thesis. Full factorial
designs are most useful when the number of factors is relatively limited. For a typical
factorial design, it is necessary to determine how many factors are of interest, and how many
levels each factor is to be studied at. An “n” factor, “k” level design involves performing kn
experiments.
First, it is necessary to establish the experimental domain; there is no guarantee that the
results will be valid outside this region. The second step is to choose a design. Basically,
choose the “k” levels depending on the number of factors to be studied “n”. Two level (k = 2)
designs were used in the developed methods. Then a mathematical model can be produced
relating the response to the factors. Often a linear model is obtained of the form:
Where represents the estimated response, b0 is the average experimental response,
the coefficients b1 and b2 are the estimated effects of the factors considered and the extent 28
P. W. Araujo, R.G. Brereton. Experimental design I. Screening. Trends Anal. Chem. 15 (1996) 26-31. 29 J. N. Miller, J. C. Miller. Statistics and chemometrics for analytical chemistry. Pearson Education Ltd, Harlow,
5th
Ed., 2005.

Jessica Avivar PhD Thesis
95
to which these terms affect the performance of the method is called main effect. The
coefficient b12 would be the interaction term. Factorial design provides information about the
importance of interactions between the factors. Reduced factorial designs are employed
when a large number of factors have to be studied, since the number of experiments is
reduced but they are subject to some restraints because main effects can be confounded
with interaction terms. From a geometrical point of view, a factorial design explores the
corners of a cube (if the variables are more than three it will be a hypercube).
Two-level factorial designs are used in the estimation of first-order effects, but they fail
when additional effects, such as second-order effects, are significant. So, central points in
two-level factorial designs can be used for evaluating curvature.
The evaluation of the screening, such as p-value for variables, curvature, lack of fit,
correlation coefficient and residuals, allows the selection of the representative variables and
its ranges. Nonetheless, in order to determine a critical point it is necessary for the
polynomial function to contain quadratic terms (response surface).
3.5.2 Response surface
Response surfaces are used to determine the critical values of independent variables which
provide the best response30. In addition, it is a good way to graphically illustrate the relation
between different experimental variables and the responses. To be able to determine an
optimum it is necessary that the polynomial function contains quadratic terms. For quadratic
models, the critical point can be characterized as maximum, minimum, or saddle. It is
possible to calculate the coordinates of the critical point through the first derivate of the
mathematical function, which describes the response surface and equates it to zero.
Among the more known second order symmetrical designs31 are the three-level factorial
design, Box–Behnken design32, central composite design, and Doehlert design. Central
composite designs are the result of superimposing a factorial design at 2 levels (2n) on a star
design (2n + 1), being the total number of factor combinations 2n + 2n + 1 to define the
linear, quadratic and interaction terms of the model together with an estimation of the error in
the terms.
Face centred central composite designs with resolution V (first and second order
interactions perfectly estimated) have been mostly used in the optimization of the proposed
methods. The name “Face Centered” derives from the fact that the location of the star points 30
P.W. Araujo, R.G. Brereton. Experimental design II. Optimization. Trends Anal. Chem. 15 (1996) 63-70. 31
D.C. Montgomery. Design and analysis of experiments. John Wiley & sons, New York, 7a Ed, 2009.
32 S.L.C. Ferreira, R.E. Bruns, H.S. Ferreira, G.D. Matos, J.M. David, G.C. Brandao, E.G.P. da Silva, L.A. Portugal, P.S. dos Reis, A.S. Souza, W.N.L. dos Santos. Box-Behnken design: An alternative for the optimization of analytical methods. Anal. Chim. Acta 597 (2007) 179-186.

Chapter 3. Experimental section
96
correspond to the centre of the faces of the cube. A drapper line small central composite
design was also used when many factors were representative in order to minimize the
number of experiments to be carried out. Draper-Lin designs are small central composite
designs that consist of a fractional factorial or Plackett-Burman design of less than resolution
V (resolution IV, first order interactions perfectly estimated but second order interactions can
be confused with other interactions), with added star points.
Figure 3.25 Face centered CCD for three variables and central points.
The mathematical model found after fitting the function to the data can sometimes not
satisfactorily describe the experimental domain studied. The more reliable way to evaluate
the quality of the model fitted is by the application of analysis of variance (ANOVA).
The central idea of ANOVA is to compare the variation due to the treatment (change in
the combination of variable levels) with the variation due to random errors inherent to the
measurements of the generated responses. From this comparison, it is possible to evaluate
the significance of the regression used to foresee responses considering the sources of
experimental variance. Moreover, as replicates of the central point are made, it is possible to
estimate the pure error associated with repetitions. Several models including linear and
quadratic models are checked in order to choose the one which fits better to the
experimental data. To fit a mathematical model with the experimental data, the experimental
design must be performed with authentic repetitions at least in its central point.

Jessica Avivar PhD Thesis
97
3.5.2.1 Desirability function
An increasingly popular form for treating multiple responses makes use of the Derringer
function or desirability function D, which was proposed by Derringer and Suich in 198033.
Individual response surfaces are determined for each response. Predicted values obtained
from each response surface are transformed to a dimensionless scale di. The scale of the
desirability function ranges between d=0 (for an undesirable response) and d=1 (for
completely desirable one). D is calculated combining the individual desirability values by
applying the geometric mean: D = (d1 x d2 x … dm)1/m. An algorithm is then applied to the D
function in order to determine the set of variable values that maximize it. This function has
been used during the optimization of analytical systems, which involve several responses.
Thus, the simultaneous optimization process is reduced to find the levels of factors that
demonstrate the maximum overall desirability. The application of desirability functions in
analytical chemistry brings advantages such as efficiency, economy, and objectivity in the
optimization of multiple response procedures.
In conclusion, experimental design gives very good tools making easier to understand
the problem; anyway, the final decision must rely on a practical basis.
Different statistical programs were used to carry out the optimization of the developed
methods e.g. Minitab 15, Statgraphics XV and Statistica 6. Particular information regarding
each method optimization is given in more detail in their respective chapters.
33
G. Derringer, R. Suich. Simultaneous-optimization of several response variables. J. Qual. Technol. 12 (1980) 214-219.

Chapter 3. Experimental section
98

Jessica Avivar PhD Thesis
99
Chapter 4
Automated determination of uranium(VI) at ultra
trace levels exploiting flow techniques and
spectrophotometric detection using a liquid
waveguide capillary cell

Chapter 4. MSFIA-MPFS-LWCC- U
100

Jessica Avivar PhD Thesis
101
4.1 Introduction
In this chapter, an automated, low-cost, robust, portable and rapid analyzer for total uranium
determination in environmental samples is presented. Multisyringe flow injection analysis
and a multipumping flow system were coupled to a long path length capillary cell to develop
a sensitive spectrophotometric method for ultra-trace uranium determination. The features of
this method make it a powerful tool for screening sample analyses reporting quickly the
presence and concentration of uranium.
The hyphenation of MSFIA with MPFS improved their individual capabilities, since both
are especially suitable for minimization of reagent consumption and enable the introduction
of large sample volumes in a short time. This is an aspect of great importance when
designing automatic methods for determination of radioactive isotopes in environmental
samples, where low concentrations are encountered. These low concentrations and the
presence of high levels of potentially interfering matrix make necessary a separation and
preconcentration treatment step prior detection. TRU resin was selected for this purpose,
due to its capability to extract uranium and since large number of commonly occurring matrix
elements show no or little retention in nitric acid media and can be separated from actinides
during sample load and column wash steps.
Arsenazo-III was selected as colorimetric reagent because it has been reported as the
most sensitive chromogenic reagent based on azo dyes and because the high stability of the
1:1 uranium complex.
Some figures of merit of this method should be highlighted, such as the limit of detection
(LOD) achieved, 1.26 ng U, and taking into account the preconcentration factor attained,
100:1, which is also responsible of the low LOD in concentration units, 12.6 ng L-1. This LOD
is lower than those obtained using radiometric detection and similar to other methods using
ICP-MS, reaching the present limit levels established for uranium in drinking waters by
legislation.
Moreover, this methodology was evaluated by analyzing four different water matrixes
(fresh water, mineral water, tap water and seawater), phosphogypsum, and vegetable
ashes. Thus, this method is proposed as an inexpensive screening tool for total uranium
determination in samples of environmental interest.

Chapter 4. MSFIA-MPFS-LWCC- U
102
4.2 Original paper
The published paper “Automated determination of uranium(VI) at ultra trace levels exploiting
flow techniques and spectrophotometric detection using a liquid waveguide capillary cell” by
J. Avivar, L. Ferrer, M. Casas and V. Cerdà in Analytical and Bioanalytical Chemistry 397
(2010) 871-878, is attached in the following pages. The journal Analytical and Bioanalytical
Chemistry (impact factor: 3.841 year 2010), is located at the first quartile of the journals of
the Analytical Chemistry area.
Supplementary information regarding to the optimization process is provided after the
published paper.

Jessica Avivar PhD Thesis
111
4.3 Additional optimization information
In order to find the best operational conditions for separation, preconcentration and detection
analysis of ultra-trace levels of uranium in the MSFIA-MPFS system a series of
investigations were conducted. Amongst the various parameters affecting the performance
of the sorbent bead-injection preconcentration in terms of sorption efficiency for U, sample
medium (HNO3 concentration), loading flow rate and stripping conditions were optimized in
previous assays.
Five potentially critical variables were taken into consideration, namely, the arsenazo-III
volume, the arsenazo-III concentration, the eluent concentration, the eluent volume and the
buffer concentration.
The computer statistics packages Statgraphics Centurion XV and Statistica 6 were used
to build a multivariate two-level fractional factorial design to screen the variables and the
interactions between them having a significant influence upon the trace element
determination (analytical response) and to discard those with negligible effects on the
response. The experimental design was built in a dimensionless coordinate system using
factor coding, wherein the highest and lowest levels are given as +1 and −1, respectively.
Three center points were included, to identify any irregularities, such as loss of linearity in
the center of the interval. Results showed that the curvature and the five variables studied
were significant. Finally, a response surface Drape-Lin small composite experimental design
with a total number of 25 experiments was resorted to find the critical value of the variables
for the uranium determination. More detailed information is attached below.
4.3.1 Screening U determination: 5 variables 4.3.1.1 Screening Design Attributes
Design class: Screening
Design name: Factorial 2^(5-1)
4.3.1.2 Base Design
Number of experimental factors: 5
Number of responses: 1
Number of runs: 19, including 3 centerpoints
Randomized: Yes

Chapter 4. MSFIA-MPFS-LWCC- U
112
4.3.1.3 Table of the studied ranges
Variable Encoded to decoded values
-1 0 1
Arsenazo III volume (mL) 0.1 0.55 1
Arsenazo III concentration (%) 0.00001 0.000055 0.0001
Eluent volume (mL) 0.1 0.3 0.5
Eluent concentration (mol L-1) 0.01 0.03 0.05
Buffer concentration (mol L-1) 0.1 0.2 0.3
4.3.1.4 Results of the screening
In order to evaluate the screening results, an ANOVA table, a Pareto chart, a fit of observed
vs predicted values, and a histogram of residuals were analyzed. To determine whether a
variable is significant or not, the p-value is used, i.e. when the p value obtained is < 0.05, the
variable is said to be statistically significant (marked with an asterisk at the ANOVA table,
table 4.1).
As can be seen in the ANOVA table and the Pareto chart (Fig. 4.1) all the variables
studied and their interactions were significant into the experimental domain. Moreover, as
can be seen at the Pareto chart and at the ANOVA table although having used a fractional
factorial design, main effects were not confounded with interaction terms. Besides, the fit
between the observed and predicted values showed a good distribution (Fig. 4.2), and the
profile of histogram was close to a normal distribution (Fig. 4.3).
Since results showed that the curvature and the five variables studied were significant, a
response surface Draper-Lin small composite experimental design with a total number of 25
experiments was resorted to find the critical value of the variables for the uranium
determination.

Jessica Avivar PhD Thesis
113
Table 4.1 ANOVA table of the screening for the MSFIA-MPFS-LWCC-uranium system.
Factor p Curvature 0.000250* (1) Buffer concentration 0.003069* (2) Arsenazo concentration 0.000098* (3) Arsenazo volume 0.000205* (4) Eluent volume 0.000013* (5) Eluent concentration 0.000129* 1 by 2 0.000101* 1 by 3 0.000316* 1 by 4 0.003553* 1 by 5 0.001640* 2 by 3 0.001446* 2 by 4 0.000118* 2 by 5 0.000358* 3 by 4 0.000208* 3 by 5 0.000104* 4 by 5 0.000137*
Factor Value Pure error (MS) 0.0000045 R-sqr 0.99999 Adj. 0.99988
The pure error is expressed as mean square (MS).
Pareto Chart of Standardized Effects; Variable: Abs2**(5-1) design; MS Pure Error=.0000045
DV: Abs
16.7324618.0104724.6608526.2702
-52.8717-56.2324-63.171569.3201969.79352
85.2716488.1589991.8983598.2647499.54274100.8918
276.2394
p=.05
Effect Estimate (Absolute Value)
1by4(1)Arsenazo-III concentration
1by52by32by51by3
Curvatr.3by4
(3)Eluent (TMAH) concentration4by5
(5)Buffer concentration2by43by51by2
(2)Arsenazo-III volume(4)Eluent volume
Figure 4.1 Pareto chart of the screening.

Chapter 4. MSFIA-MPFS-LWCC- U
114
Observed vs. Predicted Values2**(5-1) design; MS Pure Error=.0000045
DV: Abs
-0.1 0.0 0.1 0.2 0.3 0.4 0.5 0.6 0.7 0.8
Observed Values
-0.1
0.0
0.1
0.2
0.3
0.4
0.5
0.6
0.7
0.8
Pre
dict
ed V
alue
s
Figure 4.2 Predicted versus observed values of the screening.
Histogram of Raw Residuals2**(5-1) design; MS Pure Error=.0000045
DV: Abs
-0.004 -0.003 -0.002 -0.001 0.000 0.001 0.002
X <= Category Boundary
0
1
2
3
4
5
6
7
8
9
10
Freq
uenc
y
Figure 4.3 Histogram of raw residuals of the screening.

Jessica Avivar PhD Thesis
115
4.3.2 Response surface optimization: 5 variables
4.3.2.1 Central Composite Design
Design class: Response Surface
Design name: Draper Lin small central composite design
4.3.2.2 Base Design
Number of experimental factors: 5
Number of responses: 1
Number of runs: 25, including 3 centerpoints
Randomized: Yes
4.3.2.3 Studied range
Variable Encoded to decoded values
-1 0 1
Arsenazo III volume (mL) 0.5 0.75 1
Arsenazo III concentration (%) 0.00005 0.000075 0.0001
Eluent volume (mL) 0.5 0.75 1
Eluent concentration (mol L-1) 0.01 0.055 0.1
Buffer concentration (mol L-1) 0.3 0.4 0.5
4.3.2.4 Results of the optimization
Data were fitted to a model including lineal and quadratic main effects and second way
interactions. In order to evaluate the optimization results, an ANOVA table, a predicted
versus observed values chart, a histogram of residuals, and desirability charts were
analyzed. As can be seen in the ANOVA table (Table 4.2) the adjustment is good and the
pure error is small. Besides, the profile of the histogram of residuals is almost a normal
distribution (Fig. 4.5).
Although the experimental domain of optimization was changed following the screening
result trends, the critical values of the variables studied are at the upper limit of the range
delimited, as can be seen at the desirability charts (Fig. 4.6). However, due to limitations,
such as the width of the peak obtained and the absorbance of the blank, the range of any of
the variables could not be modified in that direction, so these values were accepted as
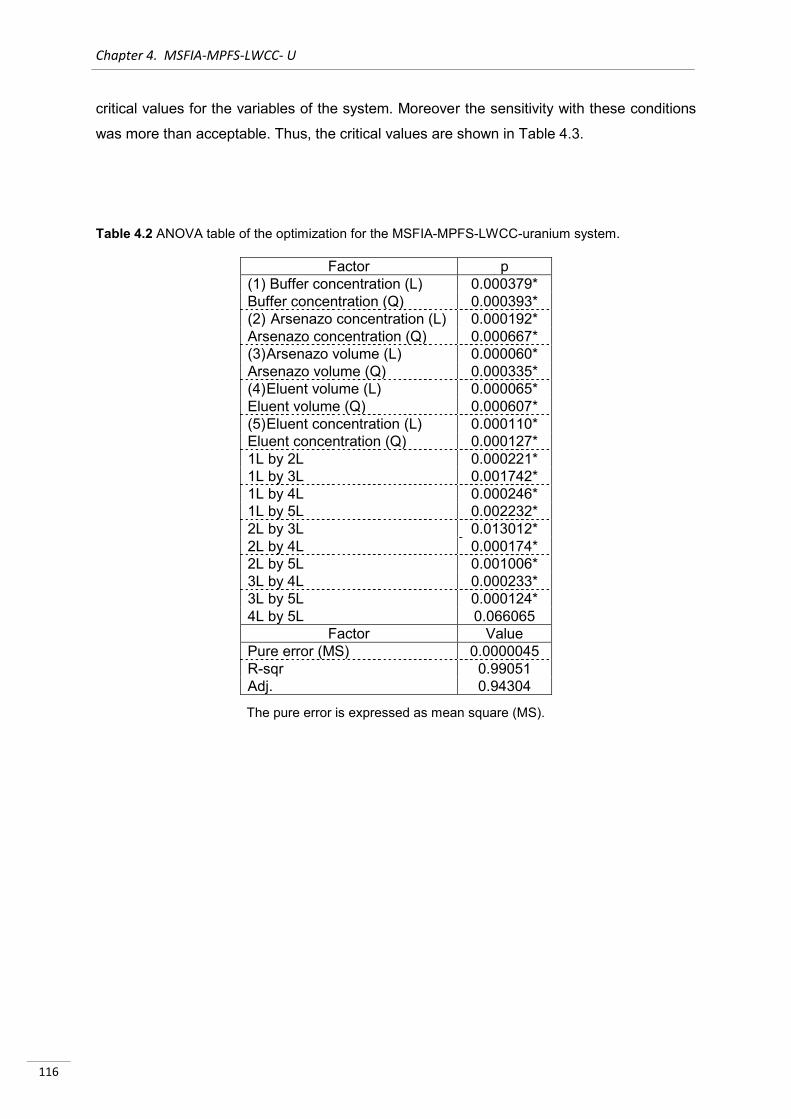
Chapter 4. MSFIA-MPFS-LWCC- U
116
critical values for the variables of the system. Moreover the sensitivity with these conditions
was more than acceptable. Thus, the critical values are shown in Table 4.3.
Table 4.2 ANOVA table of the optimization for the MSFIA-MPFS-LWCC-uranium system.
The pure error is expressed as mean square (MS).
Factor p (1) Buffer concentration (L) 0.000379* Buffer concentration (Q) 0.000393* (2) Arsenazo concentration (L) 0.000192* Arsenazo concentration (Q) 0.000667* (3) Arsenazo volume (L) 0.000060* Arsenazo volume (Q) 0.000335* (4) Eluent volume (L) 0.000065* Eluent volume (Q) 0.000607* (5) Eluent concentration (L) 0.000110* Eluent concentration (Q) 0.000127* 1L by 2L 0.000221* 1L by 3L 0.001742* 1L by 4L 0.000246* 1L by 5L 0.002232* 2L by 3L 0.013012* 2L by 4L 0.000174* 2L by 5L 0.001006* 3L by 4L 0.000233* 3L by 5L 0.000124* 4L by 5L 0.066065
Factor Value Pure error (MS) 0.0000045 R-sqr 0.99051 Adj. 0.94304

Jessica Avivar PhD Thesis
117
Observed vs. Predicted Values5 factors, 25 Runs; MS Pure Error=.0000045
DV: Abs
-0.1 0.0 0.1 0.2 0.3 0.4 0.5 0.6
Observed Values
-0.1
0.0
0.1
0.2
0.3
0.4
0.5
0.6P
redi
cted
Val
ues
Figure 4.4 Predicted versus observed values of the optimization.
Histogram of Raw Residuals
5 factors, 25 Runs; MS Pure Error=.0000045DV: Abs
-0.4 -0.3 -0.2 -0.1 0.0 0.1 0.2 0.3
X <= Category Boundary
0
1
2
3
4
5
6
7
8
9
10
Freq
uenc
y
Figure 4.5 Histogram of raw residuals of the optimization.

Chapter 4. MSFIA-MPFS-LWCC- U
118
Profiles for Predicted Values and DesirabilityBuffer
-.2000
.45254
.70000
Azoconc Vazo Veluent Eluent conc Desirability
0.
.5
1.
.00060
.26210
.52360
Abs
-1. 1.
.86414
-1. 1. -1. 1. -1. 1. -1. 1.
Des
irabi
lity
Figure 4.6 Desirability charts for the optimized variables.
Table 4.3 Critical decoded values.
Variable Critical value
Arsenazo III concentration 0.0001%
Arsenazo III volume 1 mL
TMAH(eluent) concentration 0.1 mol L-1
TMAH(eluent) volume 1 mL
Buffer concentration 0.5 mol L-1

Jessica Avivar PhD Thesis
119
Chapter 5
Lab on valve-multisyringe flow injection system
(LOV-MSFIA) for fully automated uranium
determination in environmental samples

Chapter 5. LOV-MSFIA-LWCC-U
120

Jessica Avivar PhD Thesis
121
5.1 Introduction
In the work presented in this chapter, we decided to go a step forward by automating the
column replacement of the SPE exploiting the LOV technique. Thus, the hyphenation of LOV
and MSFIA coupled to a long path length capillary cell allowed the development of a
sensitive spectrophotometric method for uranium determination in different types of
environmental samples.
In table 5.1 are summarized the most relevant figures of merit of our previous developed
work and the one proposed in this chapter.
Table 5.1 Comparison between the MSFIA-MPFS and the LOV-MSFIA methodologies for U
determination.
Parameter MSFIA-MPFS system LOV-MSFIA system
Resin TRU UTEVA®
Amount of resin 80 mg 30 mg
Column replacement manual automatic
Resin durability 40 injections 100 injections
Preconcentration volume 100 mL 30 mL
LOD in concentration units 12.6 ng L-1 10.3 ng L-1
LOD in mass units 1.26 ng 0.31 ng
Injection throughput 0.8 - 5 h-1 1.2 - 5.5 h-1
Reproducibility (RSD, n=5) 4.9 % 1.7 %
Repeatability (RSD, n=10) 1.5 % 1.6 %
Linear working range 0 - 155 ng 0 - 300 ng

Chapter 5. LOV-MSFIA-LWCC-U
122
The LOD attained with both methods are remarkable, i.e. both methods are able to
analyze uranium in environmental samples. Although the MSFIA-MPFS system is able to
preconcentrate 100 mL, up to 3 times more volume than the LOV-MSFIA system, the LOD in
concentration units of both methods are quite similar, since the LOV-MSFIA system has a
better LOD in mass units, probably due to a different SPE-material is used.
The injection throughput and the repeatability are also similar in both methods.
Nevertheless, the reproducibility of the LOV-MSFIA system is remarkably better than in the
MSFIA-MPFS, probably due to the higher robustness of LOV technique, especially thanks to
the rigid channels of the LOV.
Respect to the SPE-resin, in the LOV-MSFIA system the column replacement was
satisfactorily automated, and the reduction of the resin consumption was notorious, both in
the amount required which is up to three times less and in the durability, since the UTEVA®
resin can be used up to 100 times before being replaced.

Jessica Avivar PhD Thesis
123
5.2 Original paper
The published paper “Lab on valve-multisyringe flow injection system (LOV-MSFIA) for fully
automated uranium determination in environmental samples” by J. Avivar, L. Ferrer, M.
Casas and V. Cerdà in Talanta 84 (2010) 1221-1227, is attached in the following pages.
Talanta (impact factor: 3.722 year 2010) is located at the first quartile of the journals of the
Analytical Chemistry area.
Supplementary information regarding to the optimization process is provided after the
published paper.

Chapter 5. LOV-MSFIA-LWCC-U
124

Jessica Avivar PhD Thesis
133
5.3 Additional optimization information
In order to find the best operational conditions for separation, preconcentration and detection
analysis of ultra-trace levels of uranium in the LOV-MSFIA system a series of investigations
were conducted. Amongst the various parameters affecting the performance of the sorbent
bead-injection preconcentration in terms of sorption efficiency for U, sample medium (HNO3
concentration), loading flow rate and stripping conditions were optimized in previous assays.
Four potentially critical variables were taken into consideration, namely, the arsenazo-III
volume, the arsenazo-III concentration, the eluent concentration and the eluent volume. The
buffer concentration was optimized in previous assays (0.5 mol L-1).
The computer statistics packages Statgraphics Centurion XV and Statistica 6 were used
to build a multivariate two-level full factorial design to screen the variables and the
interactions between them having a significant influence upon the trace element
determination (analytical response) and to discard those with negligible effects on the
response. Finally a response surface face centered central composite design was carried
out to find the critical value of the significant variables.
The experimental design was built in a dimensionless coordinate system using factor
coding, wherein the highest and lowest levels are given as +1 and −1, respectively. Three
center points were included in all the designs, to identify any irregularities, such as loss of
linearity in the center of the interval. Detailed information of the whole optimization process
can be found below.
5.3.1 Screening Uranium in LOV-MSFIA system: 4 variables 5.3.1.1 Screening Design Attributes
Design class: Screening
Design name: Factorial 2^4
5.3.1.2 Base Design
Number of experimental factors: 4
Number of responses: 1
Number of runs: 19, including 3 center points
Randomized: Yes

Chapter 5. LOV-MSFIA-LWCC- U
134
5.3.1.3 Table of the studied ranges
Variable Encoded to decoded values
-1 0 1
Arsenazo III volume (mL) 0.1 0.55 1
Arsenazo III concentration (%) 0.0001 0.00055 0.001
HCl volume (mL) 0.1 0.55 1
HCl concentration (mol L-1) 0.01 0.03 0.05
5.3.1.4 Results of the screening
An ANOVA table, a Pareto chart, a fit of observed vs predicted values, and a histogram of
residuals were analyzed in order to evaluate the screening results. To determine whether a
variable is significant or not, the p-value is used, i.e. when the p value obtained is < 0.05, the
variable is said to be statistically significant.
As can be seen in the ANOVA table (Table 5.1) and the Pareto chart (Fig. 5.1) all the
studied variables and their interactions were significant into the experimental domain.
Besides, the fit between the observed and predicted values showed an acceptable
distribution (Fig. 5.2), and the profile of histogram was close to a normal distribution (Fig.
5.3).
Since all the variables studied and the curvature resulted significant, a response surface
face centered central composite design with a total number of 27 experiments was resorted
to find the critical value of the variables for the uranium determination.

Jessica Avivar PhD Thesis
135
Table 5.1 ANOVA table of the screening for the LOV-MSFIA-LWCC-uranium system.
Factor p Curvature 0.001279* (1) HCl volume 0.000355* (2) HCl concentration 0.002347* (3) Arsenazo concentration 0.000009* (4) Arsenazo volume 0.000007* 1 by 2 0.000305* 1 by 3 0.000878* 1 by 4 0.000298* 2 by 3 0.001784* 2 by 4 0.000538* 3 by 4 0.000016* 1*2*3 0.000705* 1*2*4 0.000565* 1*3*4 0.000924* 2*3*4 0.000126*
Factor Value Pure error (MS) 0.0000032 R-sqr 0.99618 Adj. 0.97707
The pure error is expressed as mean square (MS).
Pareto Chart of Standardized Effects; Variable: Raw absorbance2**(4-0) design; MS Pure Error=.0000032
DV: Raw absorbance
-20.604623.64287-27.9335-32.8737-33.7225-37.6514-42.039543.11566
-53.0886-57.2216-57.8896
89.11652246.3507
338.2364377.5438
p=.05
Effect Estimate (Absolute Value)
(2)HCl concentration2by3
Curvatr.1*3*41by31*2*31*2*42by4
(1)HCl Volume1by21by42*3*43by4
(3)Arsenazo Concentration(4)Arsenazo Volume
Figure 5.1 Pareto chart of the screening.

Chapter 5. LOV-MSFIA-LWCC- U
136
Observed vs. Predicted Values2**(4-0) design; MS Pure Error=.0000032
DV: Raw absorbance
-0.1 0.0 0.1 0.2 0.3 0.4 0.5 0.6 0.7 0.8
Observed Values
-0.1
0.0
0.1
0.2
0.3
0.4
0.5
0.6
0.7
0.8P
redi
cted
Val
ues
Figure 5.2 Fit between observed and predicted values of the screening.
Histogram of Raw Residuals2**(4-0) design; MS Pure Error=.0000032
DV: Raw absorbance
-0.20 -0.15 -0.10 -0.05 0.00 0.05 0.10 0.15
X <= Category Boundary
0
1
2
3
4
5
6
7
Freq
uenc
y
Figure 5.3 Histogram of raw residuals of the screening.

Jessica Avivar PhD Thesis
137
5.3.2 Response surface optimization: 4 variables 5.3.2.1 Response Surface Design Attributes
Design class: Response Surface
Design name: Central composite design: 2^4 + star
Design characteristic: Face centered
5.3.2.2 Base Design
Number of experimental factors: 4
Number of responses: 1
Number of runs: 27, including 3 centerpoints
Randomized: Yes
5.3.2.3 Table of the studied ranges
Variable Encoded to decoded values
-1 0 1
Arsenazo III volume (mL) 0.1 0.55 1
Arsenazo III concentration (%) 0.0001 0.0007 0.0015
HCl volume (mL) 0.1 0.55 1
HCl concentration (mol L-1) 0.01 0.03 0.05
5.3.2.4 Results of the optimization Data were fitted to a model including lineal and quadratic main effects and second way
interactions. In order to evaluate the optimization results, an ANOVA table, a fit of observed
vs predicted values, a histogram of residuals, and desirability charts were analyzed. As can
be seen in the ANOVA table (Table 5.2) all the studied variables and some of their
interactions were significant into the experimental domain. Although the fit between the
observed and predicted values showed a poor distribution (Fig. 5.4), the adjust coefficient
was satisfactory. Besides, the profile of the histogram of raw residuals showed a normal
distribution (Fig. 5.5).
Since the arsenazo-III (blank signal) also absorbs at 660 nm, the desirability function
was used to select the critical values in order to reach a compromise between the minimal
blank signal and the maximum absorbance. As can be seen at the desirability charts (Fig.

Chapter 5. LOV-MSFIA-LWCC- U
138
5.6), the critical values of the HCl volume and concentration, and arsenazo volume variables
are at the limit of the range delimited. The volume ranges of the HCl and arsenazo-III were
not modified in order to avoid peaks too wide. So these values were accepted as critical
values for the variables of the system. Moreover the sensitivity with these conditions was
more than acceptable. Thus, the established critical values are shown in Table 5.3.
Table 5.2 ANOVA table of optimization results for LOV-MSFIA-LWCC-uranium system.
The pure error is expressed as mean square (MS).
Factor p (1) HCl concentration (L) 0.000387* HCl concentration (Q) 0.014903* (2) HCl volume (L) 0.000819* HCl volume (Q) 0.000076* (3) Arsenazo concentration (L) 0.000008* Arsenazo concentration (Q) 0.000452* (4) Arsenazo volume (L) 0.000007* Arsenazovolume (Q) 0.000463* 1L by 2L 0.000305* 1L by 3L 0.000878* 1L by 4L 0.000298* 2L by 3L 0.001784* 2L by 4L 0.000538* 3L by 4L 0.000016*
Factor Value Pure error (MS) 0.0000032 R-sqr 0.95435 Adj. 0.90109

Jessica Avivar PhD Thesis
139
Observed vs. Predicted Values4 factors, 27 Runs; MS Pure Error=.0000032
DV: Raw
-0.1 0.0 0.1 0.2 0.3 0.4 0.5 0.6 0.7 0.8 0.9 1.0 1.1
Observed Values
-0.1
0.0
0.1
0.2
0.3
0.4
0.5
0.6
0.7
0.8
0.9P
redi
cted
Val
ues
Figure 5.4 Fit between observed and predicted values of the optimization.
Histogram of Raw Residuals4 factors, 27 Runs; MS Pure Error=.0000032
DV: Raw
-0.20 -0.15 -0.10 -0.05 0.00 0.05 0.10 0.15 0.20
X <= Category Boundary
0
2
4
6
8
10
12
14
Freq
uenc
y
Figure 5.5 Histogram of raw residuals of the optimization.

Chapter 5. LOV-MSFIA-LWCC- U
140
Profiles for Predicted Values and DesirabilityHCl concentration
-.1000
.21068
.50000
HCl v olume Arsenazo concentration Arsenazo Volume Desirability
1.
.5
0.
Bla
nk
.01610
.19852
.38093
-.2000
.73863
1.2000
0.
.5
1.
.05075
.48615
.92155
Raw
-1. 1.
.60715
-1. 1. -1. .7 1. -1. 1.
Des
irabi
lity
Figure 5.6 Desirability charts for optimized variables.
Table 5.3 Critical decoded values.
*The buffer concentration was optimized in preliminary studies.
Variable Critical value
Arsenazo III concentration 0.001%
Arsenazo III volume 1 mL HCl(eluent) concentration 0.01 mol L-1
HCl(eluent) volume 1 mL Buffer concentration* 0.5 mol L-1

Jessica Avivar PhD Thesis
141
Chapter 6
Smart thorium and uranium determination
exploiting renewable solid-phase extraction
applied to environmental samples in a wide
concentration range

Chapter 6. Smart LOV-MSFIA-Th-U
142

Jessica Avivar PhD Thesis
143
6.1 Introduction
This chapter presents a work in which, the grade of automation and the number of analytes
to be determined have been upgraded. Thus, a smart, fully automated, multiparametric, low-
cost, robust, portable and rapid analyzer for total thorium and uranium determination in
environmental samples is presented. The hyphenation of MSFIA and LOV coupled to a
LWCC make of this system a powerful tool for a rapid screening of thorium and uranium in
environmental samples, thanks to the multiparametric capabilities of the LOV, allowing the
analysis in a wide range of concentrations for both elements.
The main achievement of this work is the total automation provided by the design of a
smart system capable of taking decisions by itself and of choosing the best strategy to
quantify the analytes, which provides more autonomy to the designed analyzer and
distinguish it from previous developed approaches in which the presence of the analyst was
unavoidable. Many methods proposed in the literature as fully automated approaches can
not be considered so, since an automated device is conceived to make decisions by itself
with the help of feedback tools without human intervention1. The incorporation of feedback
mechanisms in the control software increases the possibilities within the system and is a
step forward in automation. A tree structure of choice statements, described in terms of
conditionals, such as “If” A occurs, “Then” B follows is used in the developed system to
adapt itself to select the direct, preconcentrated or diluted determination of the analytes.
Thus, the proposed system is able to work autonomously determining uranium and thorium
in environmental samples with unknown concentrations of these elements. All this was
possible thanks to the high versatility of the software AutoAnalysis. Moreover, the versatility
of the MSFIA-LOV system developed allowed the sequential determination of thorium and
uranium.
Other figures of merit of this method should also be highlighted, such as the limits of
detection (LOD) achieved, 5.9 and 60 ng L-1, for uranium and thorium, respectively, which
are lower than those obtained with radiometric detection and similar to other methods using
ICP-MS. These LODs reach the present limit levels established for uranium in drinking
waters by the WHO. Other great features of this system are the wide working ranges for both
analytes, provided by the use of UTEVA® resin which allows dilution, preconcentration and
direct determination of the analytes of interest.
Moreover, this methodology was evaluated by analyzing five different water matrixes
(fresh water, mineral water, tap water, well water and seawater), and a channel sediment
reference material.
1 M. Valcárcel, M.D. Luque de Castro. Automatic methods of analysis, Elsevier, Amsterdam, 1988.

Chapter 6. Smart LOV-MSFIA-Th-U
144
6.2 Original paper
The published paper “Smart thorium and uranium determination exploiting renewable solid-
phase extraction applied to environmental samples in a wide concentration range” by J.
Avivar, L. Ferrer, M. Casas and V. Cerdà in Analytical and Bioanalytical Chemistry 400
(2011) 3585-3594, is attached in the following pages. The journal Analytical and
Bioanalytical Chemistry (impact factor: 3.841 year 2010) is located at the first quartile of the
journals of the Analytical Chemistry area.
Supplementary information regarding to the optimization process is provided after the
published paper.

Jessica Avivar PhD Thesis
155
6.3 Additional optimization information
In order to find the best operational conditions for separation, preconcentration and detection
of thorium and uranium in the smart LOV-MSFIA system a series of investigations were
conducted. Amongst the various parameters affecting the performance of the sorbent bead-
injection preconcentration in terms of sorption efficiency for U and Th, sample medium,
loading flow rate and stripping conditions were optimized in previous assays.
Since Th and U were eluted sequentially, and Th was eluted firstly, we decided to
optimize Th and then U. Four potentially critical variables were taken into consideration,
namely, the arsenazo-III volume, the arsenazo-III concentration, the eluent concentration
and the eluent volume. Besides, tolerance to potential interfering species was investigated.
The computer statistics packages Statgraphics Centurion XV and Statistica 6 were used
to build a multivariate two-level full factorial design to screen the variables and the
interactions between them having a significant influence upon the trace element
determination (analytical response) and to discard those with negligible effects on the
response. Finally a response surface face centered central composite design was carried
out to find the critical value of the significant variables.
The experimental design was built in a dimensionless coordinate system using factor
coding, wherein the highest and lowest levels are given as +1 and −1, respectively. Three
center points were included in all the designs, to identify any irregularities, such as loss of
linearity in the center of the interval. Detailed information of the whole optimization process
can be found below.
6.3.1 Screening Thorium in Smart Th-U determination: 4 variables 6.3.1.1 Screening Design Attributes Design class: Screening
Design name: Factorial 2^4
6.3.1.2 Base Design
Number of experimental factors: 4
Number of responses: 1
Number of runs: 19, including 3 centerpoints
Randomized: Yes

Chapter 6. Smart LOV-MSFIA-Th-U
156
6.3.1.3 Table of the studied ranges
Variable Encoded to decoded values -1 0 1
Arsenazo III volume (mL) 0.1 0.4 0.7 Arsenazo III concentration (%) 0.0001 0.0003 0.0005 HCl volume (mL) 1 1.5 2
HCl concentration (mol L-1) 5 5.5 6
6.3.1.4 Results of the screening Th
In order to evaluate the screening results, an ANOVA table, a Pareto chart, a fit of observed
vs predicted values, and a histogram of residuals were analyzed. To determine whether a
variable is significant, the p-value is used (p < 0.05), the variable is said to be statistically
significant (marked with an asterisk at the ANOVA table, table 6.1).
As can be seen at the Pareto chart (Fig. 6.1) and at the ANOVA table, the curvature, the
volume and the concentration of arsenazo are significant variables into the studied range, so
these two variables will be optimized in a response surface design. However, the
concentration and volume of hydrochloric acid are not significant variables in the studied
range, so the minimum value of these will be taken as optimal for further investigations,
because their contribution is negative so the lower they are the better the signal will be.
The fit between the observed and predicted values showed a good distribution (Fig.
6.2), and the profile of the histogram was close to a normal distribution (Fig. 6.3)
Table 6.1 ANOVA table of the screening for the smart LOV-MSFIA system.
Factor p Curvature 0.001761* (A)Arsenazo volume 0.000451* (B)Arsenazo concentration 0.000169* (C)Eluent volume 0.072356 (D)Eluent concentration 0.924167 A by B 0.000692* A by C 0.610236 A by D 0.932711 B by C 0.710220 B by D 0.862140 C by D 0.909966
Factor Value Pure error (MS) 0.0001518 R-sqr 0.98485 Adj. 0.96104
The pure error is expressed as mean square (MS).

Jessica Avivar PhD Thesis
157
Figure 6.1 Pareto chart of the screening.
Figure 6.2 Predicted versus observed values chart
Standardized Pareto Chart for Abs
0 2 4 6 8 10
Standardized ef fect
AD
D:Eluent concent rationCD
BD
BCC:Eluent volume
AC
ABA:Arsenazo Volume
B:Arsenazo concentration +-
Observed vs. Predicted Values2**(4-0) design; MS Pure Error=.0001518
DV: Th
-0.1 0.0 0.1 0.2 0.3 0.4 0.5 0.6 0.7 0.8 0.9 1.0
Observed Values
-0.1
0.0
0.1
0.2
0.3
0.4
0.5
0.6
0.7
0.8
0.9
1.0
Pre
dict
ed V
alue
s

Chapter 6. Smart LOV-MSFIA-Th-U
158
Histogram of Raw Residuals2**(4-0) design; MS Pure Error=.0001518
DV: Th
-0.025 -0.020 -0.015 -0.010 -0.005 0.000 0.005 0.010 0.015
X <= Category Boundary
0
1
2
3
4
5
6
7
8
9
10Fr
eque
ncy
Figure 6.3 Histogram of raw residuals chart.
6.3.2 Response surface optimization Th: 2 variables 6.3.2.1 Central Composite Design
Design class: Response Surface
Design name: Central composite design: 2^2 + star
Design characteristic: Face centered
6.3.2.2 Base design
Factors: 2 Replicates: 1
Base runs: 11 Total runs: 11
Two-level factorial: Full factorial
Cube points: 4 Center points in cube: 3
Axial points: 4 Center points in axial: 0

Jessica Avivar PhD Thesis
159
6.3.2.3 Table of the studied ranges
Variable Encoded to decoded values
-1 0 1
Arsenazo III volume (mL) 0.1 0.55 1
Arsenazo III concentration (%) 0.0001 0.00055 0.001
6.3.2.4 Results of the optimization Data were fitted to a model including lineal and quadratic main effects and second way
interactions. In order to evaluate the optimization results, an ANOVA table, a predicted
versus observed values chart (Fig. 6.4), a histogram of residuals (Fig. 6.5), and desirability
charts (Fig. 6.6) were analyzed. Since the arsenazo-III also absorbs at 660 nm, the
desirability function was used to select the critical values in order to reach a compromise
between the minimal blank signal and the maximum absorbance.
As can be seen in the ANOVA table (Table 6.2) the adjustment is quite good and the
pure error is quite small. Although the fit between the observed and predicted values showed
a poor distribution, the profile of the histogram of residuals is acceptable (Fig. 6.5).
Table 6.2 ANOVA table of the optimization for the smart LOV-MSFIA system.
The pure error is expressed as mean square (MS).
Factor p (A) Arsenazo volume (L) 0.000077* Arsenazo volume (Q) 0.000082* (B) Arsenazo concentration (L) 0.000014* Arsenazo concentration (Q) 0.000458* AL by BL 0.000241*
Factor Value Pure error (MS) 0.0000122 R-sqr 0.93234 Adj. 0.86468

Chapter 6. Smart LOV-MSFIA-Th-U
160
Observed vs. Predicted Values2 factors, 11 Runs; MS Pure Error=.0000122
DV: Raw Abs
0.0 0.2 0.4 0.6 0.8 1.0 1.2 1.4
Observed Values
-0.2
0.0
0.2
0.4
0.6
0.8
1.0
1.2
1.4P
redi
cted
Val
ues
Figure 6.4 Predicted versus observed values of the optimization.
Histogram of Raw Residuals2 factors, 11 Runs; MS Pure Error=.0000122
DV: Raw Abs
-0.25 -0.20 -0.15 -0.10 -0.05 0.00 0.05 0.10 0.15 0.20
X <= Category Boundary
0
1
2
3
Freq
uenc
y
Figure 6.5 Histogram of raw residuals of the optimization.

Jessica Avivar PhD Thesis
161
Figure 6.6 Desirability charts for the optimized variables.
Table 6.3 Critical decoded values.
Variable Critical value
Arsenazo III concentration 0.00035%
Arsenazo III volume 0.75 mL
HCl(eluent) concentration 5 mol L-1
HCl(eluent) volume 1 mL

Chapter 6. Smart LOV-MSFIA-Th-U
162
6.3.3 Screening Uranium in Smart Th-U determination: 4 variables
6.3.3.1 Screening Design Attributes
Design class: Screening
Design name: Factorial 2^4
6.3.3.2 Base Design
Number of experimental factors: 4
Number of responses: 1
Number of runs: 19, including 3 center points
Randomized: Yes
6.3.3.3 Table of studied ranges
Variable Encoded to decoded values
-1 0 1
Arsenazo III volume (mL) 0.1 0.4 0.7
Arsenazo III concentration (%) 0.0001 0.00055 0.001
HCl volume (mL) 0.1 0.55 1
HCl concentration (mol L-1) 0.03 0.04 0.05
6.3.3.4 Results of the U screening As can be seen at the Pareto chart (Fig. 6.7) and at the ANOVA table (Table 6.4), the
volume and the concentration of arsenazo are significant variables in the studied range.
Although the volume and the concentration of hydrochloric acid are not significant variables
we decided to include them in the response surface optimization design, since they show
interaction between them (Fig. 6.8). The predicted versus observed values chart (Fig. 6.9)
and the histogram of raw residuals (Fig. 6.10) were acceptable.

Jessica Avivar PhD Thesis
163
Table 6.4 ANOVA table for the screening of U in the smart LOV-MSFIA system.
Factor p
Curvature 0.002741* (A) HCl volume 0.244620 (B)HCl concentration 0.639315 (C)Arsenazo concentration 0.000009* (D)Arsenazo volume 0.000007* A by B 0.213035 A by C 0.448127 A by D 0.208215 B by C 0.591236 B by D 0.337548 C by D 0.000416*
Factor Value Pure error (MS) 0.0000247 R-sqr 0.95858 Adj. 0.90677
The pure error is expressed as mean square (MS).
Figure 6.7 Pareto chart of the uranium screening.
Standardized Pareto Chart for Abs
0 2 4 6 8 10
Standardized ef fect
B:HCl v olume
BCAC
BD
A:HCl concentrat ionAB
AD
CDC:Arsenazo concentration
D:Arsenazo Volume +-

Chapter 6. Smart LOV-MSFIA-Th-U
164
Figure 6.8 Interaction plots
Observed vs. Predicted Values2**(4-0) design; MS Pure Error=.0000247
DV: U
-0.1 0.0 0.1 0.2 0.3 0.4 0.5 0.6 0.7 0.8 0.9 1.0
Observed Values
-0.2
-0.1
0.0
0.1
0.2
0.3
0.4
0.5
0.6
0.7
0.8
0.9
Pre
dict
ed V
alue
s
Figure 6.9 Observed versus predicted values chart of the screening.
Interact ion Plot f or Abs
0
0.2
0.4
0.6
0.8
Ab
s
AB
- -+
+
AC
- -
++
AD
- -
+
+
BC
--
+ +
BD
--
+ +
CD
-
-+
+

Jessica Avivar PhD Thesis
165
Histogram of Raw Residuals2**(4-0) design; MS Pure Error=.0000247
DV: U
-0.4 -0.3 -0.2 -0.1 0.0 0.1 0.2 0.3 0.4
X <= Category Boundary
0
1
2
3
4
5
6
7Fr
eque
ncy
Figure 6.10 Histogram of raw residuals of the uranium screening.
6.3.4 Response surface optimization U: 4 variables 6.3.4.1 Response Surface Design Attributes
Design class: Response Surface
Design name: Central composite design: 2^4 + star
Design characteristic: Face centered
6.3.4.2 Base Design
Number of experimental factors: 4
Number of responses: 1
Number of runs: 27, including 3 centerpoints
Randomized: Yes

Chapter 6. Smart LOV-MSFIA-Th-U
166
6.3.4.3 Table of studied ranges
Variable Encoded to decoded values
-1 0 1
Arsenazo III volume (mL) 0.1 0.55 1
Arsenazo III concentration (%) 0.0001 0.00055 0.001
HCl volume (mL) 0.1 0.55 1
HCl concentration (mol L-1) 0.01 0.03 0.05
6.3.4.4 Results of the optimization
The desirability function was also used to select the critical values in order to reach a
compromise between the minimal blank signal and the maximum absorbance.
Data were fitted to a model including lineal and quadratic main effects and second way
interactions. In order to evaluate the optimization results, an ANOVA table, a predicted
versus observed values chart (Fig. 6.11), a histogram of residuals, and desirability charts
were analyzed. As can be seen in the ANOVA table (Table 6.5) the adjustment is good and
the pure error is small. Besides, the profile of the histogram of residuals is almost a normal
distribution (Fig. 6.12).
Although the experimental domain of optimization was changed following the screening
result trends, the critical values of the variables studied are at the upper limit of the range
delimited, as can be seen at the desirability charts (Fig. 6.13). However, due to limitations,
such as the width of the peak obtained and the absorbance of the blank, the range of any of
the variables could not be modified in that direction, so these values were accepted as
critical values for the variables of the system. Moreover the sensitivity with these conditions
was more than acceptable. Thus, the critical values are shown in Table 6.6.
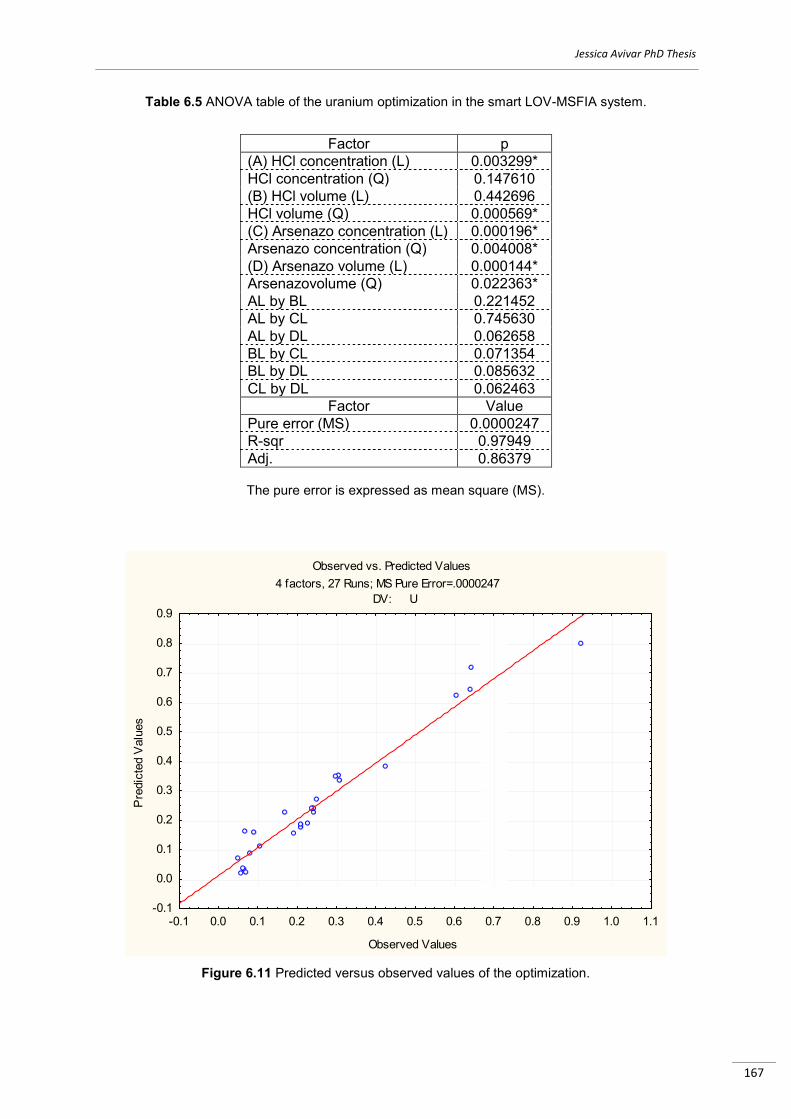
Jessica Avivar PhD Thesis
167
Table 6.5 ANOVA table of the uranium optimization in the smart LOV-MSFIA system.
The pure error is expressed as mean square (MS).
Observed vs. Predicted Values4 factors, 27 Runs; MS Pure Error=.0000247
DV: U
-0.1 0.0 0.1 0.2 0.3 0.4 0.5 0.6 0.7 0.8 0.9 1.0 1.1
Observed Values
-0.1
0.0
0.1
0.2
0.3
0.4
0.5
0.6
0.7
0.8
0.9
Pre
dict
ed V
alue
s
Figure 6.11 Predicted versus observed values of the optimization.
Factor p (A) HCl concentration (L) 0.003299* HCl concentration (Q) 0.147610 (B) HCl volume (L) 0.442696 HCl volume (Q) 0.000569* (C) Arsenazo concentration (L) 0.000196* Arsenazo concentration (Q) 0.004008* (D) Arsenazo volume (L) 0.000144* Arsenazovolume (Q) 0.022363* AL by BL 0.221452 AL by CL 0.745630 AL by DL 0.062658 BL by CL 0.071354 BL by DL 0.085632 CL by DL 0.062463
Factor Value Pure error (MS) 0.0000247 R-sqr 0.97949 Adj. 0.86379

Chapter 6. Smart LOV-MSFIA-Th-U
168
Histogram of Raw Residuals4 factors, 27 Runs; MS Pure Error=.0000247
DV: U
-0.20 -0.15 -0.10 -0.05 0.00 0.05 0.10 0.15 0.20
X <= Category Boundary
0
2
4
6
8
10
12
14Fr
eque
ncy
Figure 6.12 Histogram of raw residuals of the optimization.
Figure 6.13 Desirability charts for the optimized variables.

Jessica Avivar PhD Thesis
169
Table 6.6 Decoded critical values.
*The buffer concentration was optimized in a previous work.
Variable Critical value
Arsenazo III concentration 0.001%
Arsenazo III volume 1 mL
HCl(eluent) concentration 0.01 mol L-1
HCl(eluent) volume 1 mL
Buffer concentration* 0.5 mol L-1

Chapter 6. Smart LOV-MSFIA-Th-U
170

Jessica Avivar PhD Thesis
171
Chapter 7
Fully automated LOV-MSFIA-ICP-MS system: an
effective tool for fast, sensitive and selective
determination of thorium and uranium at
environmental levels exploiting solid phase
extraction

Chapter 7. LOV-MSFIA-ICP-MS-Th-U
172

Jessica Avivar PhD Thesis
173
7.1 Introduction
In this chapter, an automated multiparametric system for isotopic thorium and uranium
analysis in environmental samples is presented. In this work, not only a high degree of
automation is reached again thanks to the hyphenation of MSFIA and LOV, but also the
isotopic analysis of both radionuclides due to the use of ICP-MS. Thus, this method is
proposed as an alternative to radiometric determinations for thorium and uranium analyses
at trace-levels, since it is capable of isotopic analysis in a shorter time, avoiding the large
counting time required to achieve a good statistics in this type of sample when using alpha
spectrometry.
Other figures of merit of this method should also be highlighted, such as the low limits of
detection (LOD) achieved, 0.4 and 2.8 ng L-1, for uranium and thorium, respectively, the
reproducibility which is 1.7% of RSD and a high injection frequency up to 9 h-1 (depending
on the sample volume).
Moreover, this methodology was evaluated by analyzing five different water matrixes
(fresh water, mineral water, tap water, well water and seawater), a phosphogypsum sample
and a channel sediment reference material.
A mass calibration curve of the isotope 235U (Fig. 7.1) with a good fit, which was not
included in the published paper, is shown below in order to demonstrate the sensitivity
achieved for 235U radionuclide.
Figure 7.1 Mass calibration curve of the isotope 235U.
y = 0.0048x + 0.0001R² = 0.9995
0
0.002
0.004
0.006
0.008
0.01
0.012
0.014
0.016
0 0.5 1 1.5 2 2.5 3 3.5
coun
ts 23
5 U/ 2
09B
i
ng Unat
Mass Calibration curve

Chapter 7. LOV-MSFIA-ICP-MS-Th-U
174
7.2 Original paper
The published paper “Fully automated lab-on-valve-multisyringe flow injection analysis-ICP-
MS system: an effective tool for fast, sensitive and selective determination of thorium and
uranium at environmental levels exploiting solid phase extraction” by J. Avivar, L. Ferrer, M.
Casas and V. Cerdà in Journal of Analytical Atomic Spectrometry 27 (2012) 327-334, is
attached in the following pages. Journal of Analytical Atomic Spectrometry (impact factor:
4.372 year 2010) is located at the first quartile of the journals of the Analytical Chemistry
area.
Supplementary information regarding to the optimization process is provided after the
published paper.

Jessica Avivar PhD Thesis
183
7.3 Additional optimization information
In order to find the best operational conditions for separation, preconcentration and detection
analysis of ultra-trace levels of thorium and uranium in the LOV-MSFIA-ICP-MS system a
series of investigations were conducted. Amongst the various parameters affecting the
performance of the sorbent bead-injection preconcentration in terms of sorption efficiency for
Th and U, sample medium (HNO3 concentration), loading flow rate and stripping conditions
were optimized in previous works.
Three potentially critical variables for thorium and uranium determination were taken into
consideration, namely, the nitric acid concentration, the oxalic acid concentration, and the
eluent volume.
The computer statistics packages Minitab 15 and Statistica 6 were used to build a
multivariate two-level full factorial design to screen the variables and the interactions
between them having a significant influence upon the trace elements determination
(analytical response) and to discard those with negligible effects on the response. By
comparing this study with the previous ones, we can immediately detect a relevant
difference: since both analytes are eluted at the same time, more than one response is
studied, this meaning that we must look at all of them at the same time, finding the best
compromise; rather than looking for the “best” conditions. We are interested in identifying the
region of the experimental domain corresponding to a product of “acceptable” quality. Inside
this region the most profitable setting will be selected, in this case not because of the blank
signal limitation but because we are eluting both analytes with the same eluent.
The experimental design was built in a dimensionless coordinate system using factor
coding, wherein the highest and lowest levels are given as +1 and −1, respectively. A
randomized complete block amounting to a total number of 11 experiments, were performed
aimed at ensuring that the variability found in the response is on the account of the variables
rather than the random error. Three center points were included, to identify any irregularities,
such as loss of linearity in the center of the interval. Results showed that the curvature and
the three variables studied were significant. Finally, a response surface face centered central
composite experimental design with a total number of 17 experiments was resorted to find
the critical value of the variables for the thorium and uranium determination. Detailed
information of the whole optimization process can be found below.

Chapter 7. LOV-MSFIA-ICP-MS-Th-U
184
7.3.1 Screening Uranium and Thorium in LOV-MSFIA-ICP-MS system: 3 variables 7.3.1.1 Screening Design Attributes
Design class: Screening
Design name: Factorial 2^3
7.3.1.2 Base Design
Number of experimental factors: 3
Number of responses: 2
Number of runs: 11, including 3 center points
Randomized: Yes
7.3.1.3 Table of the studied ranges
Variable Encoded to decoded values
-1 0 1
Oxalic acid concentration (%) 0.01 0.02 0.03
HNO3 concentration (mol L-1) 0.01 0.03 0.05
Eluent volume (mL) 0.1 0.3 0.5
7.3.1.4 Results of the screening
In order to evaluate the screening results, ANOVA tables, Pareto charts, fits of observed vs
predicted values, and histograms of residuals were analyzed. To determine whether a
variable is significant or not, the p-value is used (p < 0.05), the variable is said to be
statistically significant (marked with an asterisk at the ANOVA tables).
As can be seen in the ANOVA tables (Table 7.1 and Table 7.2) and at the Pareto charts
(Fig. 7.2 and Fig. 7.3) two of the variables studied and the interaction between the three of
them resulted significant for both 238U and 232Th.
Moreover, the fits between the observed and predicted values showed a good
distribution (Fig. 7.4 and Fig. 7.5), and the profile of histograms were close to a normal
distribution (Fig. 7.6 and Fig. 7.7), despite the small number of data.
Although the curvature was not significant we decided to carry out a face centered
central composite response surface in order to find the critical value of the variables for the
uranium and thorium determination.

Jessica Avivar PhD Thesis
185
Table 7.1 ANOVA table of the screening of 238U.
Factor p Curvature 0.086319 (1) Oxalic acid concentration 0.034639* (2) HNO3 concentration 0.247913 (3) Eluent volume 0.012333* 1 by 2 0.163939 1 by 3 0.121066 2 by 3 0.075967 1*2*3 0.011680*
Factor Value Pure error (MS) 0.0000498 R-sqr 0.99126 Adj. 0.95632 The pure error is expressed as mean square (MS).
Table 7.2 ANOVA table of the screening of 232Th.
Factor p Curvature 0.347145 (1) Oxalic acid concentration 0.027617* (2) HNO3 concentration 0.211012 (3) Eluent volume 0.008482* 1 by 2 0.567002 1 by 3 0.064019 2 by 3 0.672012 1*2*3 0.033640*
Factor Value Pure error (MS) 0.0001101 R-sqr 0.99005 Adj. 0.95024 The pure error is expressed as mean square (MS).

Chapter 7. LOV-MSFIA-ICP-MS-Th-U
186
Pareto Chart of Standardized Effects; Variable: U-2382**(3-0) design; MS Pure Error=.0000498
DV: U
1.613824
-2.15511
-2.60618
-3.17923
-3.4181
-5.2324
8.921138
-9.17173
p=.05
Effect Estimate (Absolute Value)
(2)Nitric acid concentration
1by2
1by3
Curvatr.
2by3
(1)Oxalic acid concentration
(3)Eluent volume
1*2*3
Figure 7.2 Pareto chart for the screening of 238U.
Pareto Chart of Standardized Effects; Variable: Th-2322**(3-0) design; MS Pure Error=.0001105
DV: Th
-.491007
-.679338
1.218873
-1.81605
-3.7599
-5.31363
5.89208
10.7887
p=.05
Effect Estimate (Absolute Value)
2by3
1by2
Curvatr.
(2)Nitric acid concentration
1by3
1*2*3
(1)Oxalic acid concentration
(3)Eluent volume
Figure 7.3 Pareto chart for the screening of 232Th.

Jessica Avivar PhD Thesis
187
Observed vs. Predicted Values2**(3-0) design; MS Pure Error=.0000498
DV: U-238
1.26 1.28 1.30 1.32 1.34 1.36 1.38 1.40 1.42 1.44
Observed Values
1.26
1.28
1.30
1.32
1.34
1.36
1.38
1.40
1.42
1.44P
redi
cted
Val
ues
Figure 7.4 Predicted versus observed values of the screening of 238U.
Observed vs. Predicted Values2**(3-0) design; MS Pure Error=.0001105
DV: Th-232
1.02 1.04 1.06 1.08 1.10 1.12 1.14 1.16 1.18 1.20 1.22 1.24 1.26
Observed Values
1.02
1.04
1.06
1.08
1.10
1.12
1.14
1.16
1.18
1.20
1.22
1.24
1.26
Pre
dict
ed V
alue
s
Figure 7.5 Predicted versus observed values of the screening of 232Th.

Chapter 7. LOV-MSFIA-ICP-MS-Th-U
188
Histogram of Raw Residuals2**(3-0) design; MS Pure Error=.0000498
DV: U-238
-0.010 -0.008 -0.006 -0.004 -0.002 0.000 0.002 0.004 0.006 0.008 0.010
X <= Category Boundary
0
1
2
3
4
5
6
7
8
9Fr
eque
ncy
Figure 7.6 Histogram of raw residuals of the screening of 238U.
Histogram of Raw Residuals2**(3-0) design; MS Pure Error=.0001105
DV: Th-232
-0.020 -0.015 -0.010 -0.005 0.000 0.005 0.010 0.015
X <= Category Boundary
0
1
2
3
4
5
6
7
8
9
10
Freq
uenc
y
Figure 7.7 Histogram of raw residuals of the screening of 232Th.

Jessica Avivar PhD Thesis
189
7.3.2 Response surface optimization: 3 variables 7.3.2.1 Response Surface Design Attributes
Design class: Response Surface
Design name: Central composite design: 2^3 + star
Design characteristic: Face centered
7.3.2.2 Base Design
Number of experimental factors: 3
Number of responses: 2
Number of runs: 17, including 3 centerpoints
Randomized: Yes
7.3.2.3 Table of the studied ranges
Variable Encoded to decoded values
-1 0 1
Oxalic acid concentration (%) 0.01 0.03 0.05
HNO3 concentration (mol L-1) 0.01 0.02 0.05
Eluent volume (mL) 0.1 0.4 0.7
7.3.2.4 Results of the optimization Data were fitted to a model including lineal and quadratic main effects and second way
interactions. In order to evaluate the optimization results, ANOVA tables, predicted versus
observed values charts, histograms of residuals, and desirability charts were analyzed. As
can be seen in the ANOVA tables (Table 7.3 and Table 7.4) the adjustment is good for both
responses and the pure error is small also for both responses. The fit between predicted
versus observed values are acceptable (Fig. 7.8 and Fig. 7.9), and also the profiles of the
histograms of residuals (Fig. 7.10 and Fig. 7.11).
The desirability function (Fig. 7.12) was used to select the critical values in order to
reach a maximum signal for both analytes within the same striping conditions. The studied
ranges were modified following the trends of the Pareto charts of the screening. However the
oxalic acid concentration is at the upper limit of the new range. Despite this, in order not to
exceed the total dissolved solids coming into the ICP-MS, this concentration was taken as
critical value for this variable (Table 7.5).
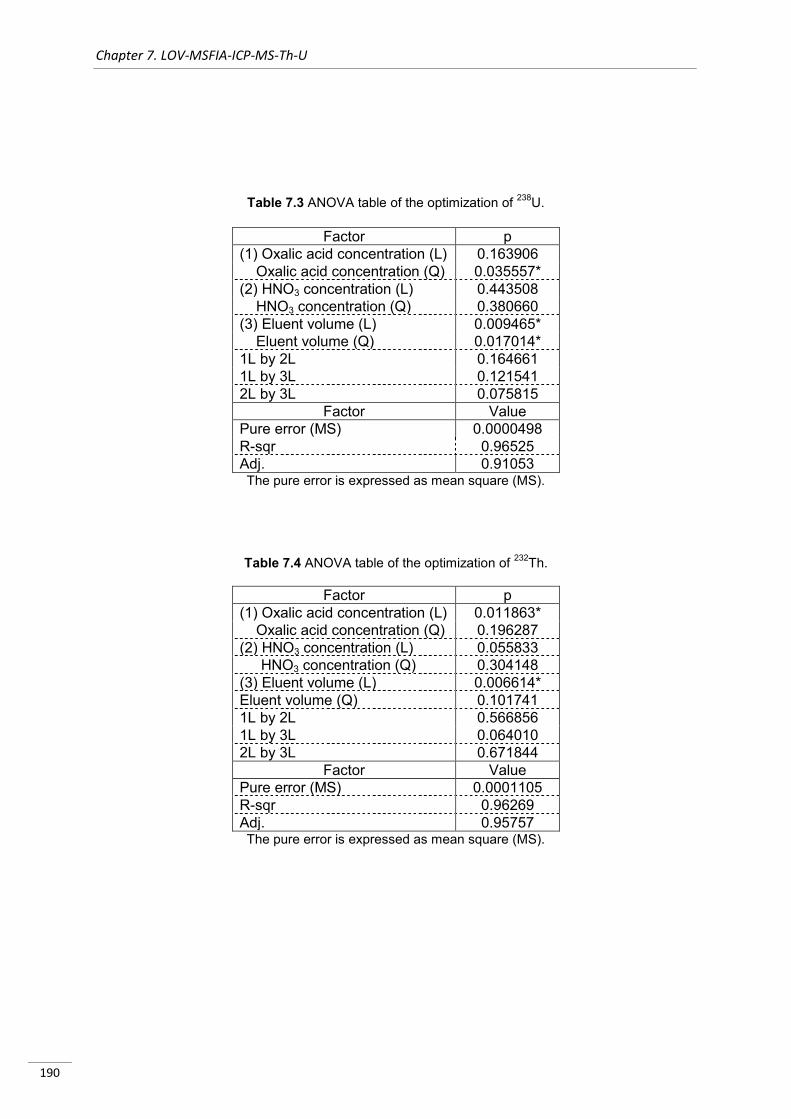
Chapter 7. LOV-MSFIA-ICP-MS-Th-U
190
Table 7.3 ANOVA table of the optimization of 238U.
Factor p
(1) Oxalic acid concentration (L) 0.163906 Oxalic acid concentration (Q) 0.035557*
(2) HNO3 concentration (L) 0.443508 HNO3 concentration (Q) 0.380660
(3) Eluent volume (L) 0.009465* Eluent volume (Q) 0.017014*
1L by 2L 0.164661 1L by 3L 0.121541 2L by 3L 0.075815
Factor Value Pure error (MS) 0.0000498 R-sqr 0.96525 Adj. 0.91053 The pure error is expressed as mean square (MS).
Table 7.4 ANOVA table of the optimization of 232Th.
Factor p (1) Oxalic acid concentration (L) 0.011863*
Oxalic acid concentration (Q) 0.196287 (2) HNO3 concentration (L) 0.055833
HNO3 concentration (Q) 0.304148 (3) Eluent volume (L) 0.006614* Eluent volume (Q) 0.101741 1L by 2L 0.566856 1L by 3L 0.064010 2L by 3L 0.671844
Factor Value Pure error (MS) 0.0001105 R-sqr 0.96269 Adj. 0.95757 The pure error is expressed as mean square (MS).

Jessica Avivar PhD Thesis
191
Figure 7.8 Predicted versus observed values of the optimization of 238U.
Figure 7.9 Predicted versus observed values of the optimization of 232Th.

Chapter 7. LOV-MSFIA-ICP-MS-Th-U
192
Histogram of Raw Residuals3 factors, 17 Runs; MS Pure Error=.0000498
DV: U-238
-0.08 -0.06 -0.04 -0.02 0.00 0.02 0.04 0.06 0.08
X <= Category Boundary
0
1
2
3
4
Freq
uenc
y
Figure 7.10 Histogram of raw residuals of the optimization of 238U.
Histogram of Raw Residuals
3 factors, 17 Runs; MS Pure Error=.0001105DV: Th-232
-0.08 -0.06 -0.04 -0.02 0.00 0.02 0.04 0.06 0.08
X <= Category Boundary
0
1
2
3
4
5
6
7
Freq
uenc
y
Figure 7.11 Histogram of raw residuals of the optimization of 232Th.

Jessica Avivar PhD Thesis
193
Figure 7.12 Desirability charts for the optimized variables.
Table 7.5 Decoded critical values.
Variable Critical value
Nitric acid concentration 0.01 mol L-1
Oxalic acid concentration 0.05 mol L-1
Eluent volume 0.50 mL

Chapter 7. LOV-MSFIA-ICP-MS-Th-U
194

Jessica Avivar PhD Thesis
195
Chapter 8
Conclusions

Chapter 8.Conclusions
196

Jessica Avivar PhD Thesis
197
In the present doctoral thesis new automated approaches for total and isotopic analysis of
thorium and uranium have been developed especially suited for analysis of environmental
samples with very low levels of these elements. The multicommutated flow techniques used
have shown great potential in automating systems allowing separation and preconcentration
processes by solid phase extraction. These new methods have been focused in the
development of alternatives to classical radiochemical determinations, which are laborious
and time consuming.
The implementation of long path length capillary cells based on liquid core fiber optics to the
spectrophotometric detection technique and its combination with multicommutated flow
techniques improved the limits of detection of the developed systems providing portable low
cost automated analyzers for thorium and uranium determination. Thus, these automated
analyzers are excellent monitoring tools for thorium and uranium and are proposed as
screening methodologies for these radionuclides following the new trends in legislation with
regard to radioactive substances.
Spectrophotometric detection and ICP-MS have proved to be great alternatives, providing
similar and even lower LODs than when using radiometric detectors, improving at the same
the sample analysis frequency and enabling the development of fully automated uranium
and thorium analyzers.
Results have demonstrated that ICP-MS is an excellent tool for determining long lived
radionuclides, such as thorium and uranium, offering low detection limits, and short analysis
times. Moreover, ICP-MS is a technique ideally suited for the simultaneous determination of
the concentration and isotopic composition of thorium and uranium.
The incorporation of feedback mechanisms in the control software allowed the development
of a smart fully automated system for total uranium and thorium determination, being able to
analyze the analytes of interest in a wide working range and with a high degree of
automation. This is a step forward in automation which enables the system to work
autonomously.
Reduction of the analysis time and therefore the increase of the injection throughput,
together with the minimal handling of sample and reagents, improving the analyst safety, are
characteristics achieved in all the developed systems which should also be highlighted.
Moreover, the reproducibility and repeatability of the methodologies have also been
upgraded, avoiding at the same time cross contamination since the proposed approaches
are closed systems.

Chapter 8.Conclusions
198
Reduction of the environmental impact per analysis has been accomplished by the
hyphenation of different multicommutated flow techniques. This improved their individual
advantages, complementing each other and attaining great advantages such as minimal
reagents consumption and waste generation, which is of great importance when dealing with
radioactive materials.
Summing up, several automated analyzers have been developed with a high degree of
automation for fast total uranium and thorium determination at ultra-trace levels, and an
automated method for isotopic analysis of both elements has also been presented in this
thesis. Finally, it is worth to be mentioned that all the developed methods proposed in this
thesis have been satisfactorily applied to environmental samples obtaining good recoveries
for the different matrices analyzed. Moreover all the automated flow systems have been
validated with reference materials.
Jessica Avivar PhD Thesis
199
Conclusiones
En esta tesis doctoral se han desarrollado nuevas metodologías para la determinación total
y el análisis isotópico de muy bajas concentraciones de torio y uranio en muestras
ambientales. Las técnicas de análisis en flujo multiconmutadas utilizadas en esta tesis han
demostrado poseer un gran potencial para automatizar sistemas que incluyen procesos de
separación y preconcentración mediante extracción en fase sólida. Estos nuevos métodos
fueron diseñados con el objetivo de disponer de alternativas a las separaciones
radioquímicas clásicas, que se caracterizan por ser laboriosas y de larga duración.
La implementación de celdas de largo paso óptico basadas en fibras ópticas con núcleo
líquido a la espectrofotometría y su combinación con las técnicas de análisis en flujo
mejoraron los límites de detección de los sistemas desarrollados, proporcionando al mismo
tiempo equipos portátiles de bajo coste para la determinación de torio y uranio. Por lo que
siguiendo las nuevas tendencias en legislación con respecto a substancias radioactivas, se
proponen como metodologías de cribado para los anteriormente citados radionúclidos.
La detección espectrofotométrica y la espectrometría de masas de plasma acoplado
inductivamente (ICP-MS) han demostrado ser excelentes alternativas a la detección
radiométrica, presentando límites de detección similares e incluso más bajos. Al mismo
tiempo proporcionan una mayor frecuencia de análisis y permiten el desarrollo de sistemas
totalmente automatizados para la determinación de torio y uranio.
Los resultados han demostrado que el ICP-MS es una herramienta extraordinaria para
determinar radionúclidos de larga vida media, tales como torio y uranio, ofreciendo bajos
límites de detección y tiempos de análisis. Además, ICP-MS es una técnica de gran utilidad
para la determinación simultánea de la concentración de torio y uranio, así como de su
composición isotópica.
La incorporación de mecanismos de retroalimentación en el software que controla los
sistemas ha permitido el desarrollo de un sistema inteligente totalmente automatizado para
determinar torio y uranio, siendo capaz de determinar estos analitos en un amplio rango de
concentraciones y con un alto grado de automatización. Este avance permite trabajar de
forma totalmente autónoma sin intervención del analista, mejorando la seguridad del mismo.

Chapter 8.Conclusions
200
Cabe resaltar la reducción del tiempo de análisis, la cual conlleva el aumento de la
frecuencia de inyección, junto con la mínima manipulación de reactivos y muestras por parte
del analista, características comunes en todos los sistemas desarrollados. Otros aspectos a
resaltar, y debido a que todos los sistemas desarrollados son cerrados, son la mejora
significativa de la reproducibilidad y la repetitividad de las metodologías, evitando al mismo
tiempo la contaminación cruzada.
Gracias al acoplamiento de varias técnicas de análisis en flujo multiconmutadas se ha
conseguido reducir el impacto ambiental por análisis, complementándose unas con otras,
logrando mejorías tales como la mínima generación de residuos y consumo de reactivos,
aspecto de gran relevancia cuando se trabaja con materiales radioactivos.
Resumiendo, se han desarrollado varios sistemas automáticos para la determinación rápida
de uranio y torio total a niveles de ultra-traza con un alto grado de automatización. También
se presenta en esta tesis un método automático para el análisis isotópico de ambos
elementos. Finalmente, cabe destacar que todos los métodos propuestos en esta tesis han
sido aplicados con éxito a diferentes matrices ambientales, obteniendo buenas
recuperaciones. Además todas las metodologías propuestas han sido validadas con
materiales de referencia.

Jessica Avivar PhD Thesis
201
Annex

Annex

Jessica Avivar PhD Thesis
Publications included in this thesis
1. Automated determination of uranium(VI) at ultra trace levels exploiting flow techniques
and spectrophotometric detection using a liquid waveguide capillary cell.
Authors: Jessica Avivar, Laura Ferrer, Montserrat Casas and Víctor Cerdà.
Journal: Analytical and Bioanalytical Chemistry
Year: 2010 Number: 397 Pages: 871-878.
2. Automation of radiochemical analysis by applying flow techniques to environmental
samples.
Authors: Yamila Fajardo, Jessica Avivar, Laura Ferrer, Enrique Gómez, Montserrat
Casas and Víctor Cerdà.
Journal: Trends in Analytical Chemistry
Year: 2010 Number: 11 Pages: 1399-1408.
3. Lab on valve-Multisyringe flow injection system (LOV-MSFIA) for fully automated uranium
determination in environmental samples.
Authors: Jessica Avivar, Laura Ferrer, Montserrat Casas and Víctor Cerdà.
Journal: Talanta
Year: 2011 Number: 84 Pages: 1221-1227.
4. Smart thorium and uranium determination exploiting renewable solid phase extraction
applied to environmental samples in a wide concentration range.
Authors: Jessica Avivar, Laura Ferrer, Montserrat Casas and Víctor Cerdà.
Journal: Analytical and Bioanalytical Chemistry
Year: 2011 Number: 400 Pages: 3585-3594.
5. Fully automated lab-on-valve-multisyringe flow injection analysis-ICP-MS system: an
effective tool for fast, sensitive and selective determination of thorium and uranium at
environmental levels exploiting solid phase extraction
Authors: Jessica Avivar, Laura Ferrer, Montserrat Casas and Víctor Cerdà.
Journal: Journal of Analytical Atomic Spectrometry
Year: 2012 Number: 27 Pages: 327-334.

Annex
6. Laboratory Automation
Authors: Jessica Avivar, Amalia Cerdà and Víctor Cerdà.
Journal: Pure and Applied Chemistry
Year: 2012 Status: submitted for publication
Other publications
These publications are enclosed at the end of this section. 1. Técnicas de análisis en flujo aplicadas a la determinación totalmente automatizada de
trazas de uranio.
Authors: Jessica Avivar, Laura Ferrer, Montserrat Casas and Víctor Cerdà.
Book: VI Jornadas sobre calidad en el control de la radioactividad ambiental. Ed.
Consejo de Seguridad Nuclear
Year: 2011 Legal Diposit: BI 2536/2011 Pages: 236-245.
2. Automated total and radioactive strontium separation and preconcentration in samples of
environmental interest exploiting a lab-on-valve system.
Authors: Rogelio Rodríguez, Jessica Avivar, Laura Ferrer, Luz O. Leal and Víctor Cerdà.
Journal: Talanta
Year: 2011 DOI: 10.1016/j.talanta.2011.11.042

Jessica Avivar PhD Thesis
Congress communications
1. Development of a MSFIA-MPFS method for uranium separation and preconcentration
followed by spectrophotometric detection using a long path length liquid waveguide
capillary cell.
Authors: Jessica Avivar, Laura Ferrer, Montserrat Casas and Víctor Cerdà.
Congress: XI Flow Analysis.
Year: 2009 Place: Pollença-Spain Type of communication: Póster
2. Development of a MSFIA-MPFS method for uranium separation and preconcentration
followed by spectrophotometric detection using a long path length liquid waveguide
capillary cell.
Authors: Jessica Avivar, Laura Ferrer, Montserrat Casas and Víctor Cerdà.
Congress: XI Flow Analysis.
Year: 2009 Place: Pollença-Spain Type of communication: Workshop
3. Ultra trace uranium automated determination exploiting flow techniques and
spectrophotometric detection.
Authors: Jessica Avivar, Laura Ferrer, Montserrat Casas and Víctor Cerdà.
Congress: XI Flow Analysis.
Year: 2009 Place: Pollença-Spain Type of communication: Lecture
4. Radioisotopes determination by flow techniques.
Authors: Jessica Avivar.
Congress: Les doctoriales transfrontelières.
Year: 2009 Place: Pollença-Spain Type of communication: Poster
5. Multisyringe flow injection–Lab on valve system (MSFIA-LOV) for fully automated uranium
determination at ultra trace levels.
Authors: Jessica Avivar, Laura Ferrer, Montserrat Casas and Víctor Cerdà.
Congress: 16th International Conference in Flow Injection Analysis (ICFIA).
Year: 2010 Place: Pattaya-Thailand Type of communication: Lecture

Annex
6. MSFIA-LOV: a fully automated miniaturized system for radioisotopes isolation and
determination at ultra trace levels. Authors: Jessica Avivar, Laura Ferrer, Montserrat Casas and Víctor Cerdà.
Congress: II International Workshop on Analytical Miniaturization (“lab-on-a-chip”)
(IWAM).
Year: 2010 Place: Oviedo-Spain Type of communication: Poster
7. Monitoring of uranium in environmental samples by means of flow techniques. Authors: Jessica Avivar, Laura Ferrer, Montserrat Casas and Víctor Cerdà.
Congress: The 55thAnnual Meeting of the Health Physics Society.
Year: 2010 Place: Utah-USA Type of communication: Poster
8. Técnicas de análisis en flujo aplicadas a la determinación totalmente automatizada de
trazas de uranio.
Authors: Jessica Avivar.
Congress: VI Jornadas sobre calidad en el control de la radioactividad ambiental.
Year: 2010 Place: Cáceres-Spain Type of communication: Lecture
9. Fully automated LOV-MSFIA-ICP-MS system for thorium and uranium determination
exploiting renewable solid phase extraction applied to environmental samples.
Authors: Jessica Avivar, Laura Ferrer, Montserrat Casas and Víctor Cerdà.
Congress:17th International Conference in Flow Injection Analysis (ICFIA).
Year: 2011 Place: Krakow-Poland Type of communication: Lecture
10. LOV system for fully automated of stable and radioactive strontium determination in
samples of environmental interest.
Authors: Rogelio Rodríguez, Jessica Avivar, Laura Ferrer, Luz O Leal and Víctor Cerdà.
Congress: 17th International Conference in Flow Injection Analysis (ICFIA).
Year: 2011 Place: Krakow-Poland Type of communication: Poster
11. SIA and MSFIA determination of radiochemical isotopes in environmental samples.
Authors: Víctor Cerdà, Laura Ferrer, Jessica Avivar and Montserrat Casas.
Congress: 17th International Conference in Flow Injection Analysis (ICFIA).
Year: 2011 Place: Krakow-Poland Type of communication: Keynote Lecture

Jessica Avivar PhD Thesis
12. Thorium determination at ultra-trace levels exploiting LOV-MSFIA techniques.
Authors: Jessica Avivar, Laura Ferrer, Montserrat Casas and Víctor Cerdà.
Congress: IUPAC International Congress on Analytical Sciences.
Year: 2011 Place: Kyoto-Japan Type of communication: Poster
13. Radiochemical multicommutated flow techniques applied to environmental samples.
Authors: Víctor Cerdà, Laura Ferrer, Jessica Avivar and Montserrat Casas.
Congress: IUPAC International Congress on Analytical Sciences.
Year: 2011 Place: Kyoto-Japan Type of communication: Keynote Lecture
14. Smart thorium and uranium determination exploiting renewable solid phase extraction
applied to environmental samples in a wide concentration range.
Authors: Jessica Avivar, Laura Ferrer, Montserrat Casas and Víctor Cerdà.
Congress: Argentina y Ambiente. Congreso Internacional de Ciencia y Tecnología
Ambiental.
Year: 2012 Place: Mar del Plata-Argentina Type of communication: Poster

![Chasing the accreditation dream - SHURAshura.shu.ac.uk/10803/3/Canter_Chasing_the_accreditation_dream[1]… · 2 Chasing the accreditation dream: Do employers value accredited journalism](https://img.pdfslide.us/doc/110x75/5b5419347f8b9a575f8c854d/chasing-the-accreditation-dream-1-2-chasing-the-accreditation-dream-do-employers.jpg)