Embed Size (px)
Citation preview

12/12/2012
Charter School Performance in Indiana
12/12/2012
Charter School Performance in Indiana

2
CREDO at Stanford University
434 Galvez Mall Stanford University Stanford, CA 94305-6010 CREDO, the Center for Research on Education Outcomes at Stanford University, was established to improve empirical evidence about education reform and student performance at the primary and secondary levels. CREDO at Stanford University supports education organizations and policymakers in using reliable research and program evaluation to assess the performance of education initiatives. CREDO’s valuable insight helps educators and policymakers strengthen their focus on the results from innovative programs, curricula, policies or accountability practices. http://credo.stanford.edu
Acknowledgements
This report, Charter School Performance in Indiana, is part of a larger set of studies on charter school effectiveness that CREDO is conducting. CREDO gratefully acknowledges the support of the Richard M. Fairbanks Foundation, the Robertson Foundation, and the Smith Richardson Foundation for this research. All results and opinions expressed in this report, however, belong to CREDO.

3
Introduction ................................................................................................. 6
Study Approach ............................................................................................ 7
Indiana Charter School Demographics ........................................................... 11
Overall Charter School Impact ...................................................................... 14
Charter School Impact with 2011 Cohort ........................................................ 16
Charter School Impact by Growth Period ........................................................ 17
Charter School Impact by CMO Affiliation ....................................................... 18
Charter School Impact by Location ................................................................ 19
Charter School Impact by School Level .......................................................... 20
Charter School Impact by Students’ Years of Enrollment .................................. 21
Charter School Impact by Race/Ethnicity ........................................................ 22
Charter School Impact with Students in Poverty .............................................. 24
Charter School Impact with Race/Ethnicity and Poverty .................................... 25
Charter School Impact with Special Education Students ................................... 26
Charter School Impact with English Language Learners .................................... 27
Charter School Impact with Grade-Repeating Students .................................... 28
Charter School Impact by Student’s Starting Decile ......................................... 29
School–Level Analysis ................................................................................. 31
Authorizer Analysis ..................................................................................... 34
Indianapolis ............................................................................................... 39
Synthesis and Conclusions ........................................................................... 46
Appendix ................................................................................................... 50
Table of Contents

4
Figure 1: CREDO Virtual Control Record Methodology ......................................... 9
Figure 2: Opened and Closed Charter Campuses, 2002-2011 ............................ 11
Figure 3: Average Learning Gains in Indiana Charter Schools, 2007-2011 Compared
to Gains for VCR Students in Each Charter Schools’ Feeder TPS ................... 15
Figure 4: Original and Updated Impacts for the 2011 Charter School Cohort ....... 16
Figure 5: Impact by Growth Period, 2007-2011 ............................................... 17
Figure 6: Impact by CMO Affiliation ............................................................... 18
Figure 7: Impact by School Location .............................................................. 19
Figure 8: Impact by School Level .................................................................. 20
Figure 9: Impact by Students’ Years of Enrollment .......................................... 21
Figure 10: Impact with Black and Hispanic Students ........................................ 23
Figure 11: Impact with Students in Poverty .................................................... 24
Figure 12: Impact with Black and Hispanic Students in Poverty ......................... 25
Figure 13: Impact with Special Education Students .......................................... 26
Figure 14: Impact with English Language Learners .......................................... 27
Figure 15: Impact with Grade-Repeating Students........................................... 28
Figure 16: Impact by Students’ Starting Decile – Reading ................................. 29
Figure 17: Impact by Students’ Starting Decile – Math ..................................... 30
Figure 18: Impact by Charter School Authorizer .............................................. 35
Figure 19: Impact by Authorizer and Growth Period – Reading .......................... 36
Figure 20: Impact by Authorizer and Growth Period – Math .............................. 37
Figure 21: Impact with Indianapolis Black and Hispanic Students ...................... 40
Figure 22: Impact with Indianapolis Students in Poverty .................................. 41
Figure 23: Impact with Indianapolis Black and Hispanic Students in Poverty ........ 42
Figure 24: Impact with Indianapolis Special Education Students ........................ 43
Figure 25: Impact with Indianapolis English Language Learners ........................ 44
Figure 26: Impact with Indianapolis Grade-Repeating Students ......................... 45
Table of Figures

5
Table 1: Demographic Comparison of Students in TPS, Feeders and Charters ...... 12
Table 2: Demographic Composition of Charter Students in the Study ................. 13
Table 3: Transformation of Average Learning Gains ......................................... 15
Table 4: Performance of Charter Schools Compared to Their Local Markets ......... 32
Table 5: Reading Growth and Achievement .................................................... 33
Table 6: Math Growth and Achievement ......................................................... 34
Table 7: Performance of Charter Schools Authorized by Ball State University
Compared to Their Local Markets ............................................................. 38
Table 8: Performance of Charter Schools Authorized by Indianapolis Mayor's Office
Compared to Their Local Markets ............................................................. 38
Table 9: Performance of Indianapolis Charter Schools Compared to Their Local
Markets ............................................................................................... 45
Table 10: Summary of Statistically Significant Findings for Indiana Charter Schools
Compared to the Average Learning Gain for VCR students. ......................... 48
Table of Tables

6
Introduction Across the country, charter schools occupy a growing position in the public education landscape. Heated debate has accompanied their existence since their start in Minnesota two decades ago. Similar debate has occurred in Indiana as well, with charter advocates extolling such benefits of the sector as expanding parental choice and introducing market-based competition to education. Little of that debate, however, is grounded in hard evidence about their impact on student outcomes. This report contributes to the discussion by providing evidence for charter students in Indiana for six years of schooling, beginning with the 2005-2006 school year and concluding in 2010-2011. With the cooperation of the Indiana Department of Education, CREDO obtained the historical sets of student-level administrative records. The support of Indiana DOE staff was critical to CREDO's understanding of the character and quality of the data we received. However, it bears mention that the entirety of interactions with the Department dealt with technical issues related to the data. CREDO has developed the findings and conclusions independently. This report provides the second in-depth examination of the results for charter schools in Indiana by CREDO. Although Indiana was not made available to us for inclusion in the CREDO national charter school study from 2009, a state-level report was published in 2011. 1 The current report has two main benefits. First, it provides an updated rigorous and independent view of the state’s charter schools. Second, the study design is consistent with CREDO’s reports on charter school performance in other locations, making the results amenable to being benchmarked against those nationally and in other states. The analysis presented here takes two forms. We first present the findings about the effects of charter schools on student academic performance. These results are expressed as the results that a typical charter school student in Indiana would realize. The second set of findings is presented at the school level. Because schools are the instruments on which legislation and public policy works, it is important to understand the range of performance for the schools. These findings look at the performance of students by school and present school average results. Compared to the educational gains that charter students would have had in a traditional public school (TPS), the analysis shows that the typical charter school
1 CREDO. Multiple Choice: Charter School Performance in 16 States (2009). Charter School Performance in Indiana (2011). Both are available at http://credo.stanford.edu.

7
student in Indiana makes larger learning gains in both reading and mathematics. However, when students are aggregated at the school level, schools show their own patterns of variation. At the school level, 18 percent of the charter schools have significantly higher learning gains than their TPS counterparts in reading, while 8 percent of charter schools have significantly lower learning gains. In math, 23 percent of the charter schools studied outperform their TPS peers and 42 percent perform worse.
Study Approach This study of charter schools in Indiana focuses on the academic progress of their enrolled students. Whatever else charter schools may provide their students, their contributions to their students’ readiness for secondary education, high school graduation and post-secondary life remains of paramount importance. Indeed, if charter schools do not succeed in forging strong academic futures for their students, other outcomes of interest, such as character development or non-cognitive skills, cannot compensate. Furthermore, current data limitations prevent the inclusion of non-academic outcomes in this analysis. This statewide analysis uses the Virtual Control Record (VCR) methodology that has been used in previous CREDO publications.2 The approach is a quasi-experimental study design with matched student records that are followed over time. The current analysis examines whether students in charter schools in Indiana outperform their TPS counterparts. The current analysis begins with the general question of whether in the aggregate students in charter schools outperform their TPS counterparts. This general question is then extended to consider whether the observed charter school performance is consistent when the charter school population is disaggregated along a number of dimensions, such as race/ethnicity, geographic location and so on. Answers to all these questions require that we ensure that the contribution of the schools – either the charter schools or the TPS schools – is isolated from other potentially confounding influences. For this reason, these analyses include an array of other variables whose purpose is to prevent the estimate of charter schooling to be tainted by other effects. In its most basic form, the analysis includes controls for student characteristics: standardized starting
2 CREDO. Multiple Choice: Charter School Performance in 16 States (2009). Davis, Devora H. and Margaret E. Raymond. Choices for Studying Choice: Assessing Charter School Effectiveness Using Two Quasi-experimental Methods. Economics of Education Review 31, no. 2 (2012): 225-236. For the interested reader, links to these reports are available at http://credo.stanford.edu.

8
score, race/ethnicity, special education and lunch program participation, English proficiency, grade level, and repeating a grade. To create a reliable comparison group for our study, we attempted to build a VCR for each charter school student. A VCR is a synthesis of the actual academic experience of students who are identical to the charter school students, except for the fact that they attend a TPS that the charter school students would have attended if not enrolled in their charter school. We refer to the VCR as a ‘virtual twin’ because it takes the experience of multiple ‘twins’ and creates a single synthesis of their academic performance to use as the counterfactual to the charter school student’s performance. Our approach is displayed in Figure 1. We identify all the traditional public schools whose students transfer to a given charter school; each of these schools is a “feeder school.” Once a TPS qualifies as a feeder school, all the students in the school become potential matches for a student in a particular charter school. All the student records from all the feeder schools are pooled – this becomes the source of records for creating the virtual match. Using the records of the students in those schools in the year prior to the test year of interest (t0), CREDO selects all of the available TPS students that match each charter school student. Match factors include:
Grade-level Gender Race/Ethnicity Free or Reduced Price Lunch Status English Language Learner Status Special Education Status Prior test score on state achievement tests

9
Figure 1: CREDO Virtual Control Record Methodology
At the point of selection as a VCR-eligible TPS student, all candidates are identical to the individual charter school student on all observable characteristics, including prior academic achievement. The focus then moves to the subsequent year, t1. The scores from this test year of interest (t1) for as many as seven VCR-eligible TPS students are then averaged and a Virtual Control Record is produced. The VCR produces a score for the test year of interest that corresponds to the expected gains a charter student would have realized if he or she had attended one of the traditional public schools that would have enrolled the charter school's students. The VCR provides the counterfactual "control" experience for this analysis. For the purposes of this report, the impact of charter schools on student academic performance is estimated in terms of academic growth from one school year to the next. This increment of academic progress is referred to by policy makers and researchers as a “growth score” or “learning gains” or ”gain scores.” Using statistical analysis, it is possible to isolate the contributions of schools from other social or programmatic influences on a student's growth. Thus, all the findings that follow are measured as the average one-year growth of charter schools, relative to the VCR-based comparison. With six years of student records in Indiana, it is possible to create five periods of academic growth. One growth period needs a "starting score", (i.e., the achievement test result from the spring of one year) and a "subsequent score",

10
(i.e., the test score from the following spring) to create a growth score. To simplify the presentation of results, each growth period is referred to by the year in which the second spring test score is obtained. For example, the growth period denoted "2008" covers academic growth that occurred between the end of the 2006-2007 and the end of the 2007-2008 school years. Similarly, the time period denoted "2011" corresponds to the year of growth between the 2009-2010 and 2010-2011 school years.3 With six years of data, and six tested grades (3rd - 8th) as well as two end-of-course exams (EOCs), there are 48 different sets of data each for Reading and Math; each subject-grade-year group of scores (or, in the case of EOCs, subject-year group) has slightly different mid-point averages and distributions. The analysis is helped by transforming the test scores for all these separate tests into a common measurement. All test scores have been converted to "bell curve" standardized scores so that year-to-year computations of growth can be made.4 When scores are thus standardized into z-scores, every student is placed relative to his peers in his own state. A z-score of zero, for example, denotes a student at the 50th percentile in that state, while a z-score one standard deviation above that equates to the 84th percentile. Students who maintain their relative place from year to year would have a growth score of zero, while students who make larger gains relative to their peers will have positive growth scores. Conversely, students who make smaller academic gains than their peers will have negative growth scores in that year.
3 Indiana administered fall exams until the 2008-2009 school year, when they administered both a fall and spring exam and have since been using a spring administration. Fall exams reflect the achievement of the prior academic year, so we matched the fall scores to the school attended in the previous school year. For example, a student’s fall 2007 exam score is attributed to the school attended in the 2006-2007 school year. 4 For each subject-grade-year set of scores, scores are centered around a standardized midpoint of zero, which corresponds to the actual average score of the test before transformation. Then each score of the original test is recast as a measure of deviation around that new score of zero, so that scores that fell below the original average score are expressed as negative numbers and those that were larger are given positive values. These new values are assigned so that in every subject-grade-year test, 68 percent of the former scores fall within a given distance, known as the standard deviation.

11
Indiana Charter School Demographics The Indiana charter school sector has grown markedly since its inception in 2002. Figure 2 below notes the new, continuing and closed charter school campuses from the fall of 2002 to the fall of 2011. Figure 2: Opened and Closed Charter Campuses, 2002-2011
According to the National Center for Education Statistics (NCES), there were 54 charter schools open in Indiana in the 2009-2010 school year.5 Because charter schools are able to choose their location, the demographics of the charter sector may not mirror that of the TPS sector as a whole. Furthermore, charter schools create a degree of sorting through their offer of different academic programs and alternate school models. In addition, parents and students who choose to attend charter schools select schools for a variety of reasons such as location, school safety, school size, academic focus or special interest programs. The cumulative result of all these forces is that the student populations at charters and their TPS feeders may differ. Table 1 below compares the student populations of all Indiana’s
5 This is the most recent year available from the NCES Common Core of Data Public School Universe.
13 4 8 8 9 4 10 5 9 3
13
15
22
2936
39 49
5362
2
1
12
1
1
0
10
20
30
40
50
60
70
2002 2003 2004 2005 2006 2007 2008 2009 2010 2011
# closed
continuing
# opened

12
traditional public schools, the charters’ feeder schools, and the charter schools themselves. Table 1: Demographic Comparison of Students in TPS, Feeders and Charters
As the table shows, about 44 percent of charter school students are concentrated in Indianapolis. For this reason alone, one would not expect charter school populations to parallel the demographics of the Indiana TPS population as a whole. Table 1 bears this out: charter schools have more students in poverty, as well as more Black students and fewer White students. The feeder school populations would be expected to more closely align demographically, but even here there are significant differences. Charter schools enroll greater shares of students in poverty and Black students, and a smaller share of students are Hispanic, White or Asian, compared to the feeder schools. There has been considerable attention paid to the share of students in charter schools who are receiving Special Education services or who are English Language Learners. As shown in Table 1, a lower proportion of Indiana’s charter school population is designated as special education compared to all TPS, and this proportion is also lower than that of the feeder TPS population. The cause of this difference is unknown. Parents of children with special needs may believe the TPS sector is better equipped to educate their children and therefore will be less likely to opt out for a charter. An alternate possibility is that charter schools and traditional public schools have different criteria for categorizing special education. The profile for English Language Learners also shows that, in the aggregate, charter schools enroll a smaller share than the feeder schools and all TPS. As with Special
TPS Feeders Charters
Number of schools 1906 612 54Average enrollment per school 539 676 349Total number of students enrolled 1,027,559 413,566 18,488Indianapolis Students 12% 29% 44%Students in Poverty 45% 51% 68%English Language Learners 5% 7% 3%Special Education Students 15% 15% 11%White Students 75% 60% 29%Black Students 11% 22% 58%Hispanic Students 7% 10% 7%Asian/Pacific Islander Students 2% 2% 1%Native American Students 0.3% 0.3% 0.2%

13
Education students, it is not possible to discern the underlying causes for these figures. Table 2: Demographic Composition of Charter Students in the Study
NOTE: The appendix includes additional descriptive demographics. For this analysis, a total of 15,267 charter school students (with 27,852 observations across 5 periods) from 64 charter schools are followed for as many years as data are available. 6 The students are drawn from Grades 3– 8, since these are the continuous grades that are covered by the state achievement testing program for reading and math. High school students are also included whenever they take the end-of-course exam sequence in consecutive years, e.g., Algebra I in 9th
6 Schools that have opened recently or that have only recently begun serving tested grades will not have five growth periods of experience to include.
Student Group
Number Percent Number Percent
Indiana Charter Students 17,558 15,267 % Matched 15,267 87%Indianapolis Charter School Students 7,642 44% 6,651 44%Black Students 10,187 58% 9,162 60%Hispanic Students 1,246 7% 946 6%White Students 5,092 29% 4,556 30%Students in Poverty 12,233 70% 10,924 72%Special Education Students 2,409 14% 1,665 11%English Language Learners 507 3% 372 2%Grade Repeating Students 684 4% 176 1%
All Charter Students Tested
Matched Charter Students
A Roadmap to the Graphics
The graphics in this report have a common format.
Each graph presents the average performance of charter students relative to their pertinent comparison student. The reference group differs depending on the specific comparison. Where a graph compares student subgroup performance, the pertinent comparison student is the same for both subgroups. Each graph is labeled with the pertinent comparison group for clarity.
The height of the bars in each graph reflects the magnitude of difference between traditional public school and charter school performance over the period studied.
Stars are used to reflect the level of statistical significance of the difference between the group represented in the bar and its comparison group; the absence of stars means that the schooling effect is not statistically different from zero.
Comparisons of the performance of similar student subgroups contain an additional test of the absolute difference between the charter school subgroup and their comparison VCRs. Where a charter school student subgroup has learning gains that are statistically significantly different, the bars have a gradient shade.
14
grade and Algebra II in 10th grade. An identical number of virtual comparison records are included in the analysis. In Indiana, it was possible to create virtual matches for 87 percent of the tested charter school students on average in reading and math. This proportion assures that the results reported here can be considered indicative of the overall performance of charter schools in the state. The total number of observations is large enough to be confident that the tests of effect will be sensitive enough to detect real differences between charter school and TPS student performance at the statistically acceptable standard of p<.05. This is also true for each student subgroup examined, as can be seen in Table 2 above.
Overall Charter School Impact First, we examine whether charter schools differ overall from traditional public schools in how much their students learn, holding other factors constant. To answer this question, we average the pooled performance for all charter school students across all the growth periods and compare it with the same pooled performance of the VCRs. The result is a measure of the average one-year learning of charter school students compared to the average growth for VCRs in the state. The results appear in Figure 3. On average, students in Indiana charter schools learned significantly more than their virtual counterparts in reading and mathematics. When we investigate the learning impacts of Indianapolis charter schools separately, we find that their results are larger in reading and math than both the overall state results and the results for the charter schools that are not in Indianapolis.

15
Figure 3: Average Learning Gains in Indiana Charter Schools, 2007-2011 Compared to Gains for VCR Students in Each Charter Schools’ Feeder TPS
The data is analyzed in units of standard deviations of growth so that the results will be statistically correct. These units, unfortunately, do not have much meaning for the average reader. Transforming the results into more accessible units is challenging and can be done only imprecisely. Therefore, Table 3 below, which presents a translation of various outcomes, should be interpreted cautiously.7 Table 3: Transformation of Average Learning Gains
7 Hanushek, Eric A. and Steven G. Rivkin. Teacher quality. In Handbook of the Economics of Education, Vol. 2, ed. EA Hanushek, F Welch, (2006): 1051–1078. Amsterdam: North Holland.
.041**
.06**
.03**
.037**
.08**
.005
.00
.05
.10
Overall Indiana Indianapolis Outside Indianapolis
Gro
wth
(in
sta
nd
ard
de
via
tio
ns)
* Significant at p ≤ 0.05 ** Significant at p ≤ 0.01
ReadingMath
Growth(in standard deviations)
Gain(in months of
learning)0.00 0.00.05 1.80.10 3.60.15 5.40.20 7.20.25 9.0

16
Using the results from Figure 3 and the transformations from Table 3, per year of schooling, we can see that, on average, charter students in Indiana gain about an additional month and a half of learning over their TPS counterparts in both reading and math. Charter students in Indianapolis gain an additional two months in reading and nearly three months in math.
Charter School Impact with 2011 Cohort Because the charter school market is dynamic, new schools have opened since the previous report. To create an apples-to-apples comparison between the two reports, the subset of schools from the 2011 report were re-analyzed using only data released since the previous report.8 Both these and the 2011 results are shown in Figure 4. Figure 4: Original and Updated Impacts for the 2011 Charter School Cohort
In the previous report, students from the 2011 charter school cohort learned significantly more than their TPS counterparts in reading and math. Charter students at these same schools in more recent growth periods also learn significantly more than their TPS peers in both reading and math. The updated effect sizes are slightly larger in reading than the first report but slightly smaller in math. 8 CREDO. Charter School Performance in Indiana (2011). Available at http://credo.stanford.edu.
.05**
.058**
.07**
.055**
.00
.05
.10
Overall Indiana 2011 2012 Cohort Update
Gro
wth
(in
sta
nd
ard
de
via
tio
ns)
* Significant at p ≤ 0.05 ** Significant at p ≤ 0.01
ReadingMath
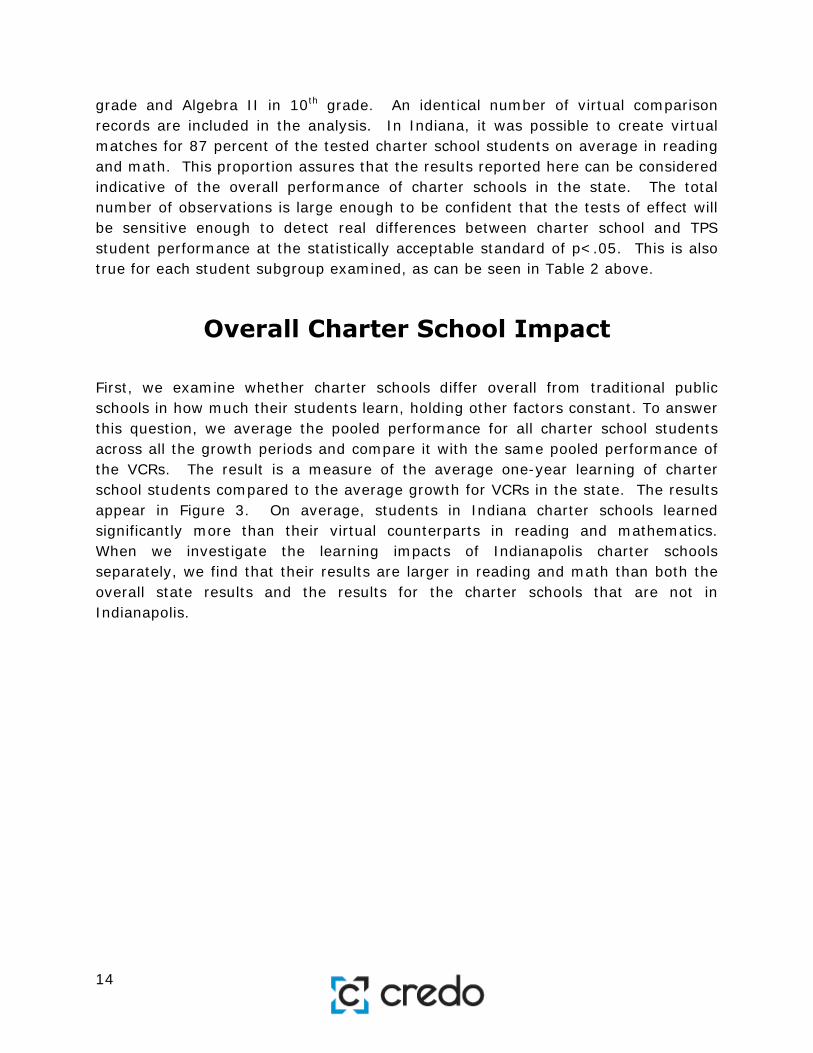
17
Charter School Impact by Growth Period To determine whether performance remained consistent over all the years of study, the average charter school effects were disaggregated into the five growth periods. Results are shown in Figure 5 along with the number of newly opened and persisting schools for each year. Figure 5: Impact by Growth Period, 2007-2011
In reading, charter students in Indiana learned significantly more than their virtual counterparts in four of the five periods analyzed. In 2011, the charter impact on reading was positive but not significant. The results were positive and significant for three of the five periods in math. The charter impact on math was not significant in the two most recent periods. In both reading and math, however, the lowest charter school impacts are in 2011. Disaggregating the impacts by cohort sheds light on these findings. The new cohort of charter schools – those that opened in 2008-2009 or later – had significantly negative effects in reading and math in the two most recent growth periods, while the earlier cohort’s results were positive and significant in both subjects over the same periods.
.03**.04**
.06**
.07**
.004
.09**.08**
.08**
.01
-.01
-.05
.00
.05
.10
2007 2008 2009 2010 2011
Gro
wth
(in
sta
nda
rd d
evi
ati
ons
)
* Significant at p ≤ 0.05 ** Significant at p ≤ 0.01
ReadingMath
New schools: 9 4 8 5 7 Persisting : 28 36 40 48 54

18
Charter School Impact by CMO Affiliation The growth of charter management organizations (CMOs), which directly operate charter schools within a network of affiliated schools, has accelerated in recent years. Figure 6 below shows the charter impacts for students at schools that are part of a CMO and schools with no CMO affiliation. Figure 6: Impact by CMO Affiliation
The results show that students in charter schools learn significantly more in reading and math whether or not the charter school is affiliated with a CMO. The results for CMO-affiliates are smaller in reading than the results for schools that are not part of a CMO. In math, the learning gains are similar for students at CMO-affiliated schools and other charter schools.
.02**
.06**
.03**.04**
.00
.05
.10
CMO Non-CMO
Gro
wth
(in
sta
nd
ard
de
via
tio
ns)
* Significant at p ≤ 0.05 ** Significant at p ≤ 0.01
ReadingMath

19
Charter School Impact by Location
Although charter schools in urban areas receive the bulk of media attention, charter schools can and do choose to locate in other locales. Differences in location may correlate to different average charter school effects. The results in Figure 7 represent the disaggregated impacts for urban, suburban and rural charter schools as well as charter schools in towns.
Figure 7: Impact by School Location
Students enrolled in urban charter schools in Indiana learn significantly more in both math and reading compared to their peers in TPS. This is also true for students in suburban charter schools in reading, although the reverse is true for math. Charter students in rural areas and towns learn significantly more than their TPS counterparts in reading, but there is no significant difference between the charter and TPS student growth in math.
.04** .03**
.12**
.09**
.05**
-.04**-.02
.02
-.1
.0
.1
.2
Urban Suburban Rural Town
Gro
wth
(in
sta
nd
ard
de
via
tio
ns)
* Significant at p ≤ 0.05 ** Significant at p ≤ 0.01
ReadingMath

20
Charter School Impact by School Level
The flexibility and autonomy enjoyed by charter schools allows them to choose which grade levels to serve, with many charter operators deciding to focus on particular ages while others seek to serve a broader range of students. For example, multi-level charter schools serve grade ranges larger than traditional elementary, middle or high schools, such as a combination of middle and high school grades. These school levels are tracked by the National Center for Education Statistics, which allows us to disaggregate charter school impacts for different grade spans. This study examined the outcomes of students enrolled in elementary, middle, high and multi-level schools. The results appear in Figure 8. Growth scores for high schools should be interpreted with caution, because they are calculated only for students who take the two-test EOC exam sequence in consecutive years. Figure 8: Impact by School Level
The results show that, on average, charter students learn significantly more than their virtual counterparts in reading in the elementary, high school and multi-level grade span configurations. In math, charter students have significantly better learning than their TPS peers in middle and multi-level schools. Charter students in middle schools learn significantly less than their TPS counterparts in reading. There
.04**
-.03**
.17**
.04**
.01
.05**
-.002
.08**
-.1
.0
.1
.2
Elementary Middle High Multi-level
Gro
wth
(in
sta
nd
ard
de
via
tio
ns)
* Significant at p ≤ 0.05 ** Significant at p ≤ 0.01
Reading
Math

21
are no significant learning differences between charter and TPS students in math at the elementary and high school levels. Charter students in middle and multi-level schools learn significantly more than their TPS peers in math.
Charter School Impact by Students’ Years of Enrollment
Student learning gains in charter schools may change as students continue their enrollment over time. To test this, students were grouped by the number of consecutive years they were enrolled in charter schools. In this scenario, the analysis is limited to the charter students who enrolled for the first time in a charter school between 2006-2007 and 2010-2011; although the number of students included will be smaller, it is the only way to make sure that the available test results align with the years of enrollment. This question examines whether the academic success of students who enroll in a charter school changes as they continue their enrollment in a charter school. The results are shown below in Figure 9.
Figure 9: Impact by Students’ Years of Enrollment
The results suggest that charter students in their first year do not have significantly different learning gains in reading and math compared to their counterparts in traditional public schools. This finding contrasts with the parallel
.01
.06**
.01
.060*
-.01
.08**
.06** .055
-.1
.0
.1
First Year Second Year Third Year Fourth & Fifth Years
Gro
wth
(in
sta
nd
ard
de
via
tio
ns)
* Significant at p ≤ 0.05 ** Significant at p ≤ 0.01
ReadingMath
Years of Attendance

22
result in the 2009 national study, which showed a significantly negative first year impact on student learning. In the second year of charter school attendance, there is a significant and positive gain in learning for charter students compared to students in TPS observed in both reading and math. In the third year, there is no significant difference in learning for students compared to their counterparts in TPS in reading, but charter students learn significantly more in math. Students with four or five years in charter schools have significantly positive learning gains compared to their TPS peers in reading but no difference in math.
Charter School Impact by Race/Ethnicity Attention in US public education to achievement differences by racial and ethnic backgrounds has increased since the passage of the No Child Left Behind Act in 2001. The effectiveness of charter schools across ethnic and racial groups is especially important given the proportion of charter schools that are focused on serving historically underserved students. The impact of charter schools on the academic gains of Black and Hispanic students is presented in Figure 10 below.
The graph displays two distinct comparisons, described below:
The first comparison displays the performance of TPS students in the subgroups of interest relative to the "average white student in TPS;" in this comparison, the white student does not qualify for subsidized school meals, Special Education services or English Language Learner support and is not repeating a grade. The values that appear in each vertical bar indicate the magnitude of difference from this comparison student, and the stars indicate the level of statistical significance. Thus, if there is no difference in the learning gains, the bar would be missing entirely; if the learning of the student group in question is not as great as the comparison baseline, the bar is negative, and if the learning gains exceed the comparison, the bar is positive.
A second comparison tests whether the learning gains in the charter school student subgroup differs significantly from their peers in the same student subgroup in their feeder TPS. Where the difference is significant, the charter school bar has gradient shading.

23
Figure 10: Impact with Black and Hispanic Students
On average, Black students in both TPS and charter schools have significantly smaller gains in reading and math than those of average white students in TPS, the baseline of comparison. However, Black students enrolled in charter schools show significantly better performance in reading and math compared to Black students in TPS.
Hispanic students in TPS have gains that are statistically similar to those of white TPS students, the baseline of comparison. This means that there is no learning gap between white and Hispanic students. The same is true for reading in charter schools, where Hispanic students have statistically similar gains in reading compared to white TPS students. In math, however, Hispanic students in charter schools have significantly smaller gains in math than those of white TPS students. There are no significant differences in the gains of Hispanic students in charter schools compared to Hispanic students in TPS.
-.15**
-.09**
.004
-.02
-.20**
-.16**
-.03
-.07**
-.25
-.20
-.15
-.10
-.05
.00
.05
Traditional Public School Charter Traditional Public School Charter
Gro
wth
(in
sta
nda
rd d
evi
atio
ns)
* Significant at p ≤ 0.05 ** Significant at p ≤ 0.01
ReadingMath
Black Hispanic

24
Charter School Impact with Students in Poverty
Much of the motivation for developing charter schools aims at improving education outcomes for students in poverty. The enrollment profiles of charter schools across the country underscore this fact; in Indiana, 68 percent of charter students are eligible for subsidized school meals, a proxy for low income households. Thus, the impact of charter schools on the learning of students in poverty is important in terms of student outcomes and as a test of the commitment of charter school leaders and teachers to address the needs of this population. Figure 11 presents the results for students in poverty. In this graph, the comparison student is a student who pays full price for school meals in TPS, a proxy for not being in poverty.
Figure 11: Impact with Students in Poverty
As shown in the figure above, in Indiana, students in poverty perform significantly worse than their non-poverty peers regardless of whether they attend a TPS or a charter. However, students in poverty who are enrolled in charter schools perform significantly better in math compared to students in poverty in TPS. Charter students in poverty receive no significant benefit or loss in reading gains compared to their TPS peers in poverty.
-.11**
-.10**
-.12**
-.07**
-.15
-.10
-.05
.00
Traditional Public School Charter
Gro
wth
(in
sta
nda
rd d
evia
tio
ns)
* Significant at p ≤ 0.05 ** Significant at p ≤ 0.01
ReadingMath
25
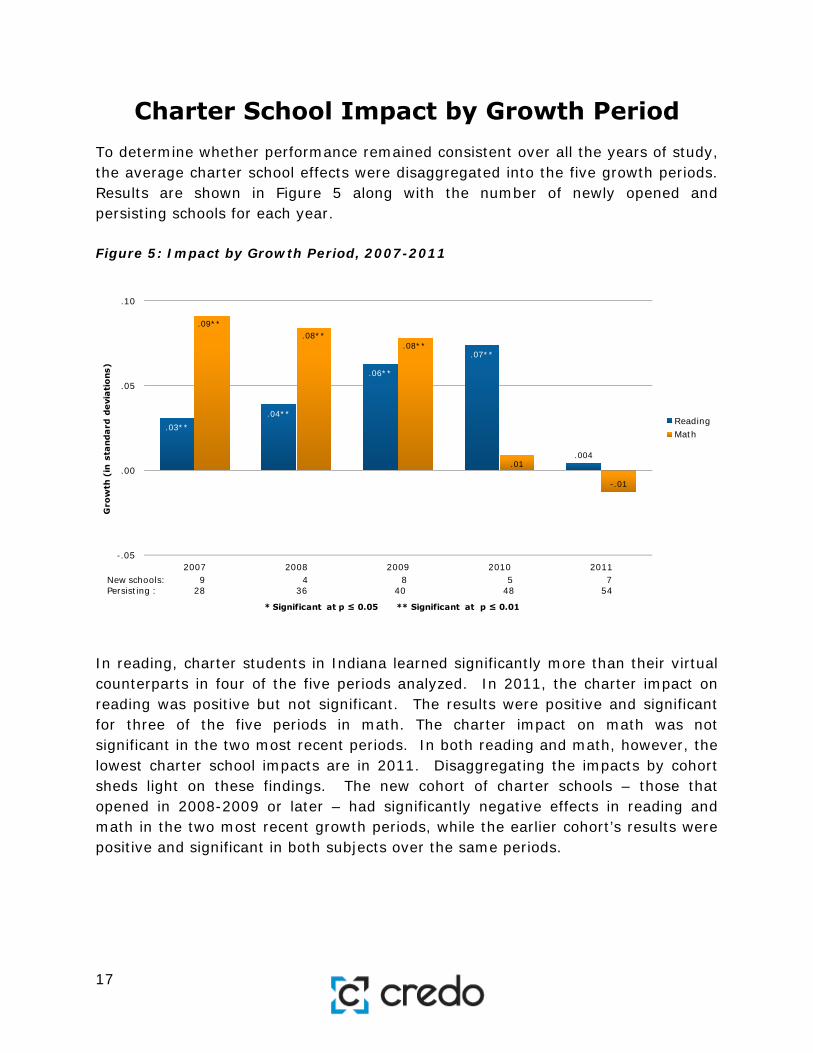
Charter School Impact with Race/Ethnicity and Poverty
Many charter schools have a dual mission to educate historically underserved minority students who are also living in poverty. The impact of charter schools on the academic gains of Black students living in poverty and Hispanic students living in poverty is presented in Figure 12 below. Figure 12: Impact with Black and Hispanic Students in Poverty
Black students in poverty in both TPS and charter schools have smaller gains in reading and math than those of the average non-poverty white TPS student, the baseline of comparison. However, Black students in poverty who are enrolled in charter schools show significantly better performance in reading and math compared to Black students in poverty in TPS.
Hispanic students in poverty in both TPS and charter schools have gains in math and reading that are smaller than those of white students in traditional public schools, the baseline of comparison. Hispanic students in poverty at charter schools perform similarly to Hispanic students in poverty at traditional public schools in both reading and math.
-.29**
-.22**
-.13**-.15**
-.34**
-.25**
-.17**-.16**
-.40
-.35
-.30
-.25
-.20
-.15
-.10
-.05
.00
Traditional Public School Charter Traditional Public School Charter
Gro
wth
(in
sta
nd
ard
de
via
tio
ns)
* Significant at p ≤ 0.05 ** Significant at p ≤ 0.01
ReadingMath
Black / Poverty Hispanic / Poverty

26
Charter School Impact with Special Education Students
The demographic comparisons in the CREDO national charter school report released in 2009 indicated that across the charter sector, charter schools serve fewer Special Education students than the traditional public schools both in number of students and as a proportion of their enrollment. In some cases, this is a deliberate and coordinated response with local districts, based on a balance of meeting the needs of the students and considering the most cost-effective strategies for doing so. In Indiana, the overall proportion of charter school students who are Special Education is 11 percent, compared to 15 percent in TPS statewide and in the charter schools' feeder schools. Anecdotal evidence suggests that TPS and charters may differ in their criteria for designating students as needing to be assessed for special education services; this topic has been flagged for future study on student enrollments.
It is especially difficult to compare the outcomes of Special Education students, regardless of where they enroll. The most serious challenge rests on the small numbers of Special Education students. Consequently, there is tremendous variation when all categories are aggregated, a necessary and messy requirement for comparison purposes. Of all the facets of the current study, this one deserves the greatest degree of skepticism. With this cautionary note, the results are presented in Figure 13 below.
Figure 13: Impact with Special Education Students
-.14** -.14**
-.18**
-.16**
-.2
-.1
.0
Traditional Public School Charter
Gro
wth
(in
sta
nda
rd d
evi
ati
on
s)
* Significant at p ≤ 0.05 ** Significant at p ≤ 0.01
ReadingMath

27
Special Education students enrolled in both TPS and charter schools perform significantly worse than students not receiving special education services. In charter schools in Indiana, Special Education students receive no significant benefit or loss from charter school attendance compared to their counterparts in TPS in either reading or math.
Charter School Impact with English Language Learners
Students who enroll in school without sufficient English proficiency represent a growing share of public school students. Their success in school today will greatly influence their success in the world a decade from now. Since their performance as reflected by National Assessment of Education Progress lags well behind that of their English proficient peers, their learning gains are a matter of increasing focus and concern both nationally and in Indiana.
The comparison of learning gains of charter school English Language Learners and their TPS counterparts appears in Figure 14.
Figure 14: Impact with English Language Learners
English Language Learner students in both TPS and charter schools learn significantly less than native/fluent English speakers in reading and math. English Language Learners in charter schools have similar gains in reading and math as their counterparts in TPS.
-.14**
-.11**
-.12**
-.08**
-.2
-.1
.0
Traditional Public School Charter
Gro
wth
(in
sta
nda
rd d
evi
atio
ns)
* Significant at p ≤ 0.05 ** Significant at p ≤ 0.01
ReadingMath

28
Charter School Impact with Grade-Repeating Students
This study examined the outcomes of students who were retained. Often a highly charged topic, the underlying premise is that additional time in grade can help students by remediating deficits and shoring up grade-level competencies. Existing research on the outcomes of students who have been retained is limited.
Retention practices differ widely across the country and between the charter and TPS sectors. The fact that retained charter students have the lowest match rate (26 percent) of any subgroup in our study suggests that charter schools are more likely to retain academically low-performing students. The results of learning gains following retention appear in Figure 15.
Figure 15: Impact with Grade-Repeating Students
The retained students included in the analysis perform better than non-retained students in both TPS and charter schools in math and reading. There is no significant difference in learning gains between retained students at charter schools and retained students in TPS.
.14**
.09**
.18**
.17**
.0
.1
.2
Traditional Public School Charter
Gro
wth
(in
sta
nd
ard
de
via
tio
ns)
* Significant at p ≤ 0.05 ** Significant at p ≤ 0.01
ReadingMath

29
Charter School Impact by Student’s Starting Decile
A general tenet of charter schools is a commitment to the education and development of every child. Further, many charter schools, including several in Indiana, have as part of their mission a specific emphasis on serving students who have not thrived academically in TPS and whose early performance is well below average. We examined the performance of charter schools to see if they produced equivalent results across the spectrum of student starting points and in relation to the results observed for equivalent students in TPS.
To do this, baseline achievement test scores in reading and math for both charter school students and their VCRs were disaggregated into deciles. In this analysis, the base of comparison is the average academic growth of the TPS students in Decile 5, which corresponds to students in the 50th to 60th percentiles in the state. Student achievement growth in each decile for charter school students and their VCRs was then compared. The results appear in Figures 16 and 17 below.
Figure 16: Impact by Students’ Starting Decile – Reading
.33**
.16**.10**
.01
-.01
-.06** -.08**-.14**
-.25**
.36**
.20**
.12**.06**
.04** .02
-.01-.05**
-.14**
-.24**
-.5
-.4
-.3
-.2
-.1
.0
.1
.2
.3
.4
.5
1 2 3 4 5 6 7 8 9 10
Gro
wth
(in
sta
nda
rd d
evia
tion
s)
* Significant at p ≤ 0.05 ** Significant at p ≤ 0.01
TPSCharter

30
Figure 17: Impact by Students’ Starting Decile – Math
Both figures demonstrate the expected “S”-shaped curve to the results. The overall curve reflects the typical pattern of larger learning gains for students with lower prior scores and larger learning losses for students with higher starting scores, a phenomenon known as “regression to the mean.” Here, the relative magnitudes are of importance: Do charter schools produce relatively better growth results than TPS? If so, the charter curve would have larger gains on the low end and smaller losses on the high end of the distribution. For students in Indiana, Figures 16 and 17 show that charter schools do better than TPS in the lower and middle deciles in reading and the lower deciles math. In the upper two deciles in reading, the performance of charter school students is equivalent to the gains produced in TPS for these high achieving students. In math, charter students in the 6th through 9th deciles have equivalent gains compared to TPS students in the same decile. The highest achieving charter students, those in the 10th decile, perform significantly worse than their TPS counterparts in math.
.36**
.14**.08**
.06**
-.04** -.05**-.08**
-.13**
-.19**
.40**
.19**
.14**.09**
.03*
-.02
-.07**-.11**
-.16**
-.27**
-.5
-.4
-.3
-.2
-.1
.0
.1
.2
.3
.4
.5
1 2 3 4 5 6 7 8 9 10
Gro
wth
(in
sta
nda
rd d
evia
tion
s)
* Significant at p ≤ 0.05 ** Significant at p ≤ 0.01
TPS
Charter

31
School–Level Analysis
Comparative School-level Quality While the numbers reported above represent the average learning gains for charter school students across the state, the pooled average effects tell only part of the story. Parents and policymakers are also interested in school-level performance. In order to determine the current distribution of charter school performance, the average effect of charter schools on student learning over the two most recent growth periods (2010 and 2011) is compared to the experience the students would have realized in their local traditional public schools.9 The performance of the VCR students associated with each charter school comprises this measure of the local educational market. This analysis calculates an average contribution to student learning gains for each charter school. This measure is called the school’s effect size; as for the overall and by-year impacts, it is expressed in standard deviations of growth. As noted in Table 1, charter schools are generally smaller than their corresponding feeder schools. In addition, some charter schools elect to open with a single grade and mature one grade at a time. Consequently, care is needed when making school-level comparisons to ensure that the number of tested students in a school is sufficient to provide a fair test of the school impact. Our
9 We chose to include only the two most recent growth periods in this analysis for two reasons. First, we wanted a highly relevant contemporary distribution of charter school performance. Second, using only two periods of data ensured that all schools’ effect sizes were measured fairly; they are all based on one or two periods of data instead of one period for some schools and five periods for others.
A Note about Tables 5 and 6
There are four quadrants in each table. We have expanded on the usual quadrant analysis by dividing each quadrant into four sections. The value in each box is the percentage of charter schools with the corresponding combination of growth and achievement. These percentages are generated from the 2010 and 2011 periods. The uppermost box on the left denotes the percentage of charters with very low average growth but very high average achievement. The box in the bottom left corner is for low-growth, low-achieving schools. Similarly, the topmost box on the right contains the percentage of charters with very high average growth and very high average achievement, while the bottom right corner contains high-growth, low-achieving schools. The major quadrants were delineated using national charter school data. We would expect about 46% of schools to have an effect size between -0.15 and 0.15 standard deviations of growth (the two middle columns). Similarly, we would expect about 50% of schools to achieve between the 30th and 70th percentiles. Therefore, if schools were randomly distributed, we would expect about 6% in any small square and about 25% of the schools to appear in the middle four squares.
32
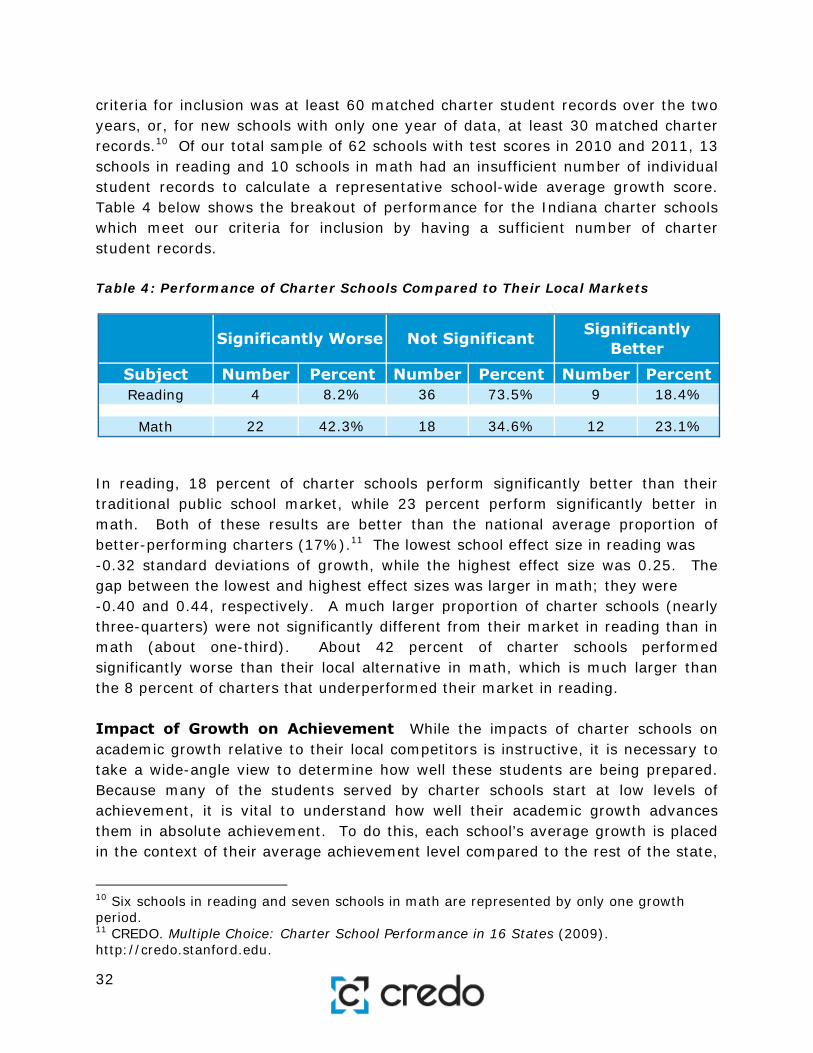
criteria for inclusion was at least 60 matched charter student records over the two years, or, for new schools with only one year of data, at least 30 matched charter records.10 Of our total sample of 62 schools with test scores in 2010 and 2011, 13 schools in reading and 10 schools in math had an insufficient number of individual student records to calculate a representative school-wide average growth score. Table 4 below shows the breakout of performance for the Indiana charter schools which meet our criteria for inclusion by having a sufficient number of charter student records. Table 4: Performance of Charter Schools Compared to Their Local Markets
In reading, 18 percent of charter schools perform significantly better than their traditional public school market, while 23 percent perform significantly better in math. Both of these results are better than the national average proportion of better-performing charters (17%).11 The lowest school effect size in reading was -0.32 standard deviations of growth, while the highest effect size was 0.25. The gap between the lowest and highest effect sizes was larger in math; they were -0.40 and 0.44, respectively. A much larger proportion of charter schools (nearly three-quarters) were not significantly different from their market in reading than in math (about one-third). About 42 percent of charter schools performed significantly worse than their local alternative in math, which is much larger than the 8 percent of charters that underperformed their market in reading. Impact of Growth on Achievement While the impacts of charter schools on academic growth relative to their local competitors is instructive, it is necessary to take a wide-angle view to determine how well these students are being prepared. Because many of the students served by charter schools start at low levels of achievement, it is vital to understand how well their academic growth advances them in absolute achievement. To do this, each school’s average growth is placed in the context of their average achievement level compared to the rest of the state,
10 Six schools in reading and seven schools in math are represented by only one growth period. 11 CREDO. Multiple Choice: Charter School Performance in 16 States (2009). http://credo.stanford.edu.
Subject Number Percent Number Percent Number PercentReading 4 8.2% 36 73.5% 9 18.4%
Math 22 42.3% 18 34.6% 12 23.1%
Significantly Worse Not Significant Significantly Better

33
as in Tables 5 and 6 below. For growth, we use the effect sizes discussed above. The school’s average achievement level is the mean achievement of the students over the same two periods covered by the effect size (2010 and 2011).12 The 50th percentile indicates statewide average performance for all public school students (traditional and charter). A school achievement level above the 50th percentile indicates that the school performs above the statewide average.
Table 5: Reading Growth and Achievement
In Indiana, 25 of the 49 charter schools (51 percent) had positive average growth in reading, regardless of their average achievement (this percentage is the sum of the squares in the 2 right quadrants). About six percent of charters had positive growth and average achievement above the 50th percentile of the state (i.e., the total for the blue quadrant on the top right). About 84 percent of charters perform below the 50th percentile of achievement (the sum of the two bottom quadrants). Of concern is the nearly 39 percent of charters in the gray bottom left quadrant, which represents low growth and low achievement.
12 Average achievement was computed using students’ z-scores from the end of the growth period (e.g., spring 2010 and spring 2011), and the resulting school-level mean was then converted into a percentile.
Growth(in Standard Deviations)
70th Percentile
10.2% 6.1%50th Percentile
2.0% 18.4% 26.5% 4.1%30th Percentile
2.0% 16.3% 14.3%
-0.15 0.15
Low Growth,High Achievement
High Growth,High Achievement
Low Growth,Low Achievement
High Growth,Low Achievement
0

34
Table 6: Math Growth and Achievement
For math, 21 of the 52 charter schools (about 40 percent) had positive average growth, as seen in the two right quadrants. Less than 4 percent of charters had positive growth and average achievement above the 50th percentile (the top right orange quadrant). About 92 percent of charters have achievement results below the 50th percentile of the state (the sum of the two bottom quadrants). Nearly 37 percent – over one-third – of Indiana charters have positive growth and achievement below the 50th percentile in the state, as seen in the bottom right pink quadrant. If those schools continue their trends of positive academic growth, their achievement would be expected to rise over time.
Authorizer Analysis Nearly all the Indiana charter schools are currently authorized, or overseen, by either Ball State University or the Indianapolis Mayor’s Office. There are two additional authorizers in Indiana. The Evansville-Vanderburgh School Corporation oversees two charter schools, and the Lafayette School Corporation oversees one charter school. In this section, authorizer results are shown for all students and by
Growth(in Standard Deviations)
70th Percentile
3.8% 1.9% 1.9%50th Percentile
13.5% 15.4% 15.4% 9.6%30th Percentile
17.3% 9.6% 9.6% 1.9%
-0.15 0.15
Low Growth,High Achievement
High Growth,High Achievement
Low Growth,Low Achievement
High Growth,Low Achievement
0
35
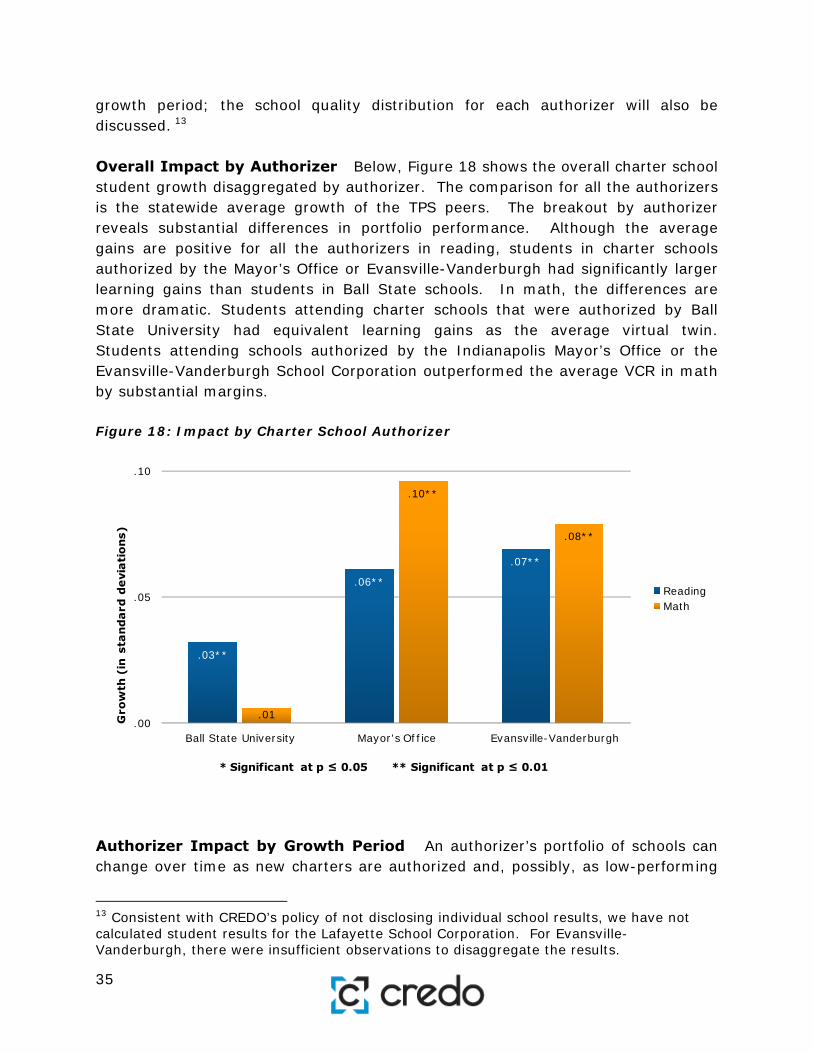
growth period; the school quality distribution for each authorizer will also be discussed. 13 Overall Impact by Authorizer Below, Figure 18 shows the overall charter school student growth disaggregated by authorizer. The comparison for all the authorizers is the statewide average growth of the TPS peers. The breakout by authorizer reveals substantial differences in portfolio performance. Although the average gains are positive for all the authorizers in reading, students in charter schools authorized by the Mayor’s Office or Evansville-Vanderburgh had significantly larger learning gains than students in Ball State schools. In math, the differences are more dramatic. Students attending charter schools that were authorized by Ball State University had equivalent learning gains as the average virtual twin. Students attending schools authorized by the Indianapolis Mayor’s Office or the Evansville-Vanderburgh School Corporation outperformed the average VCR in math by substantial margins. Figure 18: Impact by Charter School Authorizer
Authorizer Impact by Growth Period An authorizer’s portfolio of schools can change over time as new charters are authorized and, possibly, as low-performing
13 Consistent with CREDO’s policy of not disclosing individual school results, we have not calculated student results for the Lafayette School Corporation. For Evansville-Vanderburgh, there were insufficient observations to disaggregate the results.
.03**
.06**
.07**
.01
.10**
.08**
.00
.05
.10
Ball State University Mayor's Off ice Evansville-Vanderburgh
Gro
wth
(in
sta
nd
ard
de
via
tio
ns)
* Significant at p ≤ 0.05 ** Significant at p ≤ 0.01
ReadingMath

36
charter schools are closed. It is also possible that an authorizer’s performance will change over time due to either organizational learning or the loss of it through staff turnover. A continuing commitment to quality authorizing in both these areas – who is granted a new charter and who is allowed to continue operating – should be evident by consistent or improving performance of an authorizer’s portfolio over time. Charter school student results by growth period for the two largest authorizers in Indiana, Ball State University and the Indianapolis Mayor’s Office, are shown in Figures 19 and 20 below. In both reading and math, charter student performance differs between the two authorizers in every growth period with the differences becoming more pronounced over time. Figure 19: Impact by Authorizer and Growth Period – Reading
For the first four growth periods, students at Ball State charters have significantly better learning gains in reading compared to the statewide average VCR and fairly even results until the 2011 growth period, when they have significantly lower learning gains. Students in Mayor’s Office charters initially have learning gains that are similar to the virtual peer group in reading and have progressively better results in subsequent growth periods with a spike in 2010.
.05**.04**
.064**.055**
-.02**
.003 .03*
.060**
.11**
.07**
-.10
-.05
.00
.05
.10
.15
2007 2008 2009 2010 2011
Gro
wth
(in
sta
nda
rd d
evia
tio
ns)
* Significant at p ≤ 0.05 ** Significant at p ≤ 0.01
BSU
Mayor's Office

37
Figure 20: Impact by Authorizer and Growth Period – Math
The differences between authorizers in their student progress are more sharply revealed in the math results. Students attending Ball State charters learned significantly more than their TPS counterparts in the first three growth periods. There was no difference in learning gains between the two groups in 2010, and in 2011, Ball State charter students learned significantly less than their virtual peers. The results for students at charters authorized by the Indianapolis Mayor’s Office are more consistently positive. These students have significantly higher learning gains than the average VCR in every growth period. While positive, there is a downward trend to the results for Mayor’s Office charter students until the trend reverses in 2011. Comparative School-level Quality by Authorizer Although individual student learning gains are important, authorizer decision-making occurs at the school level. One factor to consider may be whether a charter school’s learning gains are outpacing the local market, as described in the preceding section on statewide charter school quality. Here, each authorizer’s portfolio of charter school quality is displayed.
.04**
.07** .06**
-.004
-.07**
.14**
.11**.10**
.04**
.12**
-.10
-.05
.00
.05
.10
.15
2007 2008 2009 2010 2011
Gro
wth
(in
sta
nda
rd d
evi
ati
ons
)
* Significant at p ≤ 0.05 ** Significant at p ≤ 0.01
BSU
Mayor's Office

38
Table 7: Performance of Charter Schools Authorized by Ball State University Compared to Their Local Markets
As shown in Table 7 above, about 10 percent of charter schools authorized by Ball State University have significantly better learning gains in reading when compared to their local market. In math, 16 percent of Ball State charters significantly outperform their traditional public school alternatives. These proportions are smaller than both the statewide percentages shown in Table 4 and the national average of 17 percent. Table 8: Performance of Charter Schools Authorized by Indianapolis Mayor's Office Compared to Their Local Markets
The proportion of Indianapolis Mayor’s Office charter schools that perform significantly better in reading than their local peers is nearly 38 percent, which is only slightly higher than the 37 percent of charters performing significantly better in math. In both subjects, the proportion of Mayor’s Office charters that outperform their market is greater than the results for Ball State charters, for Indiana charters and for the national average. It should be noted that several changes transpired in the past year that suggest that, going forward, authorizer differences in performance may be reduced. Ball State University Charter School Office has modified their policies and procedures with the assistance of the National Association of Charter School Authorizers (NACSA). In addition, the Indiana State Board of Charter Schools was created with a focus to build more uniform performance measurements and management practices for authorizers in the state. Finally, recent legislation allows for the
Subject Number Percent Number Percent Number PercentReading 4 12.9% 24 77.4% 3 9.7%
Math 15 48.4% 11 35.5% 5 16.1%
Significantly Worse Not Significant Significantly
Better
Subject Number Percent Number Percent Number PercentReading 0 0.0% 10 62.5% 6 37.5%
Math 6 31.6% 6 31.6% 7 36.8%
Significantly Worse Not Significant Significantly
Better
39
expansion of permissible authorizers to include colleges and universities, so the number of operating authorizers is expected to increase over time.
Indianapolis After the previous CREDO report on Indiana, we were asked by several groups to delve more deeply into charter school performance in Indianapolis, where more than 40 percent of Indiana charter students attend school. As with the earlier statewide graphs, each graph in this section displays two distinct comparisons: The first comparison displays the performance of Indianapolis TPS and charter
students in the subgroup of interest relative to the "average statewide student in TPS." The values that appear in each vertical bar indicate the magnitude of difference from this comparison student, and the stars indicate the level of statistical significance. Thus, if there is no difference in the learning gains, the bar would be missing entirely; if the learning of the Indianapolis student group in question is not as great as the statewide comparison baseline, the bar is negative, and if the learning gains exceed the comparison, the bar is positive.
A second comparison tests whether the learning gains in the Indianapolis charter school student subgroup differs significantly from their peers in the same student subgroup in Indianapolis traditional public schools. Where the difference is significant, the charter school bar has gradient shading.
Impact with Black and Hispanic Students Over 60 percent of Indianapolis charter students are Black and about 5 percent are Hispanic, making these two historically underserved groups the majority student population in the city’s charter schools. The impact of charter schools on the academic gains for Black and Hispanic students in Indianapolis are in Figure 21 below.

40
Figure 21: Impact with Indianapolis Black and Hispanic Students
Black students in both traditional public and charter schools in Indianapolis have smaller learning gains in reading and math than those of White students statewide in traditional public schools, the baseline of comparison. In both reading and math, Black students in Indianapolis charter schools have significantly better performance in reading and math compared to Black students in Indianapolis TPS. Hispanic students in both traditional public and charter schools in Indianapolis have similar rates of growth in reading and math as the average White student statewide in traditional public schools, the baseline of comparison. These results are similar to the statewide results for Hispanic students, although in Indianapolis, Hispanic students in charter schools have erased the learning gap in math as well as reading. In both math and reading, Hispanic students in Indianapolis charter schools grow at similar rates compared to Hispanic students in Indianapolis traditional public schools. Impact with Students in Poverty In addition to Blacks and Hispanics, another historically underserved group, students in poverty, comprises a large proportion of the Indianapolis charter school population. Results for students in poverty are shown in Figure 22 below.
-.12**
-.07**
.03.02
-.17**
-.11**
-.001 -.01
-.20
-.15
-.10
-.05
.00
.05
Traditional Public School Charter Traditional Public School Charter
Gro
wth
(in
sta
nd
ard
de
via
tio
ns)
* Significant at p ≤ 0.05 ** Significant at p ≤ 0.01
ReadingMath
Black Hispanic

41
Figure 22: Impact with Indianapolis Students in Poverty
In Indianapolis, students in poverty grow at a rate that is significantly worse than their non-poverty peers statewide. As shown in the figure above, Indianapolis students in poverty enrolled in charter schools receive no significant benefit or loss in reading but show better growth in math compared to Indianapolis students in poverty attending TPS. Impact by Race/Ethnicity and Poverty In Indianapolis, 80% of minority students are living in poverty, making charter schools’ impact with these students extremely important. The impact of Indianapolis charter schools on the academic gains of Black students living in poverty and Hispanic students living in poverty is presented in Figure 23 below.
-.123**
-.099**
-.120**
-.06**
-.15
-.10
-.05
.00
Traditional Public School Charter
Gro
wth
(in
sta
nd
ard
de
via
tio
ns)
* Significant at p ≤ 0.05 ** Significant at p ≤ 0.01
ReadingMath

42
Figure 23: Impact with Indianapolis Black and Hispanic Students in Poverty
Indianapolis’ Black students in poverty in both TPS and charter schools have smaller gains in reading and math than those of the average non-poverty White TPS student statewide, the baseline of comparison. Black students in poverty who are enrolled in Indianapolis charter schools show significantly better performance in reading and math compared to Black students in poverty in Indianapolis TPS.
Hispanic students in poverty in Indianapolis TPS and charter schools have gains in reading and math that are smaller to those of non-poverty White students statewide in traditional public schools, the baseline of comparison. In reading, Hispanic students in poverty in Indianapolis charter schools have similar learning gains to Hispanic students in poverty at Indianapolis TPS. In math, Hispanic students in poverty at Indianapolis charter schools have significantly larger learning gains than Hispanic students in poverty at Indianapolis traditional public schools. Impact with Special Education Students Due to the small total number of Special Education students in charter schools in Indianapolis and statewide, it is difficult to make a strong comparison of the learning gains for Special Education students. Given this caveat, the results for Indianapolis students who receive special education services are shown in Figure 24 below.
-.27**
-.187**
-.16**
-.107*
-.30**
-.189** -.18**
-.107**
-.35
-.30
-.25
-.20
-.15
-.10
-.05
.00
Traditional Public School Charter Traditional Public School Charter
Gro
wth
(in
sta
nd
ard
de
via
tio
ns)
* Significant at p ≤ 0.05 ** Significant at p ≤ 0.01
ReadingMath
Black / Poverty Hispanic / Poverty

43
Figure 24: Impact with Indianapolis Special Education Students
Indianapolis Special Education students in both TPS and charter schools learn significantly less than the average regular education student in TPS statewide, the baseline of comparison. Special education students in Indianapolis charter schools receive no significant benefit or loss in either reading or math compared to their counterparts in Indianapolis TPS. Impact with English Language Learners Although English Language Learners comprise a small proportion of charter students statewide and in Indianapolis, educating these students is critically important. The results for Indianapolis students who are English Language Learners are shown in Figure 25 below.
-.14**-.14**
-.17**
-.15**
-.2
-.1
.0
Traditional Public School Charter
Gro
wth
(in
sta
nd
ard
de
via
tio
ns)
* Significant at p ≤ 0.05 ** Significant at p ≤ 0.01
ReadingMath

44
Figure 25: Impact with Indianapolis English Language Learners
Students who are English Language Learners in Indianapolis traditional public schools have significantly lower learning gains than the typical statewide TPS student who is a native or fluent English speaker. English Language Learners in Indianapolis charter schools have learning gains that are similar to native or fluent English speakers in both reading and math. However, there are no significant differences in learning gains between English Language Learners in Indianapolis TPS and those in Indianapolis charter schools. Taken together, these findings suggest that the average impacts shown above for English language learners at Indianapolis charter schools mask a high degree of variation in the results for these students. Impact with Grade-Repeating Students As was found statewide, retained charter students in Indianapolis have the lowest match rate of any subgroup in our study, which suggests that Indianapolis charter schools are more likely to retain academically low-performing students than their feeder TPS. The results for Indianapolis students who are repeating a grade are shown in Figure 26 below.
-.17**
-.076
-.15**
-.081
-.2
-.1
.0
Traditional Public School Charter
Gro
wth
(in
sta
nd
ard
de
viat
ion
s)
* Significant at p ≤ 0.05 ** Significant at p ≤ 0.01
Reading
Math

45
Figure 26: Impact with Indianapolis Grade-Repeating Students
Retained students in Indianapolis TPS and charter schools have similar reading gains compared to non-retained students statewide in traditional public schools, the baseline of comparison. In math, retained students in Indianapolis traditional public and charter schools have significantly better learning gains than non-retained students statewide in TPS. Indianapolis charter school students who are retained perform similarly to their Indianapolis TPS counterparts in both reading and math. Comparative School-level Quality As with the statewide results, comparing charter school performance to the local traditional public school alternative in Indianapolis can be an informative measure of quality. Using the same criteria that were described in the section above on statewide comparative school-level quality, it was possible to include 17 Indianapolis charter schools in reading and 20 schools in math for this analysis. The results for these Indianapolis charter schools are shown in Table 9 below. Table 9: Performance of Indianapolis Charter Schools Compared to Their Local Markets
.06 .06
.11* .103*
.0
.1
.2
Traditional Public School Charter
Gro
wth
(in
sta
nd
ard
de
via
tio
ns)
* Significant at p ≤ 0.05 ** Significant at p ≤ 0.01
Reading
Math
Subject Number Percent Number Percent Number PercentReading 1 5.9% 10 58.8% 6 35.3%
Math 7 35.0% 6 30.0% 7 35.0%
Significantly Worse Not Significant Significantly
Better

46
A larger proportion of Indianapolis charter schools outperform their market than charter schools statewide in Indiana. In reading, 35 percent of Indianapolis charter schools perform significantly better than their traditional public school market, and similarly, 35 percent perform significantly better in math. Both of these results are better than the national average proportion of better-performing charters (17%).14 A much larger proportion of charter schools were not significantly different from their market in reading (nearly 60 percent) than in math (30 percent).
Synthesis and Conclusions Based on the findings presented here, the typical student in Indiana charter schools gains more learning in a year than his or her TPS counterparts, amounting to about an additional month and a half of learning in reading and math. These positive patterns are pronounced in Indianapolis, where historically, student academic performance has been poor. The difference in learning in Indianapolis charter schools equates to two months of additional learning in reading and nearly three months in math. These outcomes are consistent with the result that charter schools statewide and in Indianapolis have significantly better results than TPS for Black students who are in poverty.
Charter school performance was not consistent over all the years of the study. Charter students outperformed their TPS counterparts in reading and math in the earlier growth periods but most recently the performance has been statistically similar. A more in-depth analysis revealed that charter schools that were opened in 2008-2009 and later are responsible for this downward trend. The bulk of these low-performing recent charter entrants were authorized by Ball State University.
A portion of Indiana charter schools appear to outpace TPS in how well they support academic learning gains in their students in both reading and math. Eighteen percent of Indiana charters outpace the learning impacts of TPS in reading, and 23 percent do so in math. In both subjects, the proportions are lower for charters authorized by Ball State University and higher for charters authorized by the Indianapolis Mayor’s Office. Only a few of the Indiana schools included in the study have academic results that are significantly worse than their TPS counterparts in reading: 8 percent of charter schools have results that are significantly worse than TPS in that subject. In math, 42 percent of charter schools have gains that are significantly worse than their local markets.
14 CREDO. Multiple Choice: Charter School Performance in 16 States (2009). http://credo.stanford.edu.

47
In comparison to the statewide proportions, a larger share of Indianapolis charter schools performs significantly better than the local market in both reading and math. Thirty-five percent of Indianapolis charters outpace TPS in reading, and the proportion is the same in math. As with the statewide results, Indianapolis charter schools perform better in reading than math when compared to the local alternative. Only 6 percent of Indianapolis charter schools have academic results that are significantly worse than TPS in reading, while the number is 35 percent in math.
The student-to-student and school-to-school results show charter schools to be performing well or comparable to the local alternatives. The larger question of whether charter schools are helping students achieve at high levels is also important. Nearly 39 percent of Indiana charter schools have below-average growth and below-average achievement in reading, and the same is true for 56 percent of the charter schools in math. Students in these schools will not only have inadequate progress in their overall achievement but will fall further and further behind their peers in the state over time.
The share of underperforming charter schools is partially offset, however, by the proportion of charter schools that are either already achieving at high levels or are in positions to reach those levels. In reading, a majority of charter schools have academic growth that is above the average for all schools in Indiana, and in math the proportion is about 40 percent. Should these trends continue, the share of schools that currently lag the state average for absolute achievement would be expected to decline. These absolute improvements are within sight in Indiana. Table 10 presents a summary of the results.

48
Table 10: Summary of Statistically Significant Findings for Indiana Charter Schools Compared to the Average Learning Gain for VCR students.
Reading MathIndiana Charter Students Positive PositiveIndianapolis Charter Students Positive PositiveOutside Indianapolis PositiveCohort Update from 2011 Report Positive PositiveCharters in 2007 Positive PositiveCharters in 2008 Positive PositiveCharters in 2009 Positive PositiveCharters in 2010 PositiveCMO-affiliated Charter Schools Positive PositiveNon-CMO-affiliated Charter Schools Positive PositiveUrban Students Positive PositiveSuburban Students Positive NegativeRural Students PositiveTown Students PositiveElementary Charter Schools PositiveMiddle Charter Schools Negative PositiveHigh Charter Schools PositiveMulti-Level Charter Schools Positive PositiveSecond Year Enrolled in Charter School Positive PositiveThird Year Enrolled in Charter School PositiveFourth & Fifth Years Enrolled in Charter School PositiveBlack Charter School Students Positive PositiveCharter School Students in Poverty PositiveBlack Charter School Students in Poverty Positive Positive

49
Reading MathStudents at Ball State Charters PositiveStudents at Indianapolis Mayor's Office Charters Positive PositiveStudents at Evansville-Vanderburgh Charters Positive PositiveBall State Charters in 2007 Positive PositiveBall State Charters in 2008 Positive PositiveBall State Charters in 2009 Positive PositiveBall State Charters in 2010 PositiveBall State Charters in 2011 Positive PositiveIndianapolis Mayor's Office Charters in 2007 PositiveIndianapolis Mayor's Office Charters in 2008 Positive PositiveIndianapolis Mayor's Office Charters in 2009 Positive PositiveIndianapolis Mayor's Office Charters in 2010 Positive PositiveIndianapolis Mayor's Office Charters in 2011 Positive PositiveIndianapolis Black Charter School Students Positive PositiveIndianapolis Charter School Students in Poverty PositiveIndianapolis Black Charter Students in Poverty Positive PositiveIndianapolis Hispanic Charter Students in Poverty Positive

50
Appendix The numbers in the tables below represent the number of charter observations associated with the corresponding results in the report. An equal number of VCRs were included in each analysis.
Student Group
Reading MathIndiana Charter Students 27,114 28,590 Students in Indianapolis 11,488 12,115 Students in Charters in 2007 3,304 3,247 Students in Charters in 2008 3,943 3,984 Students in Charters in 2009 5,962 5,973 Students in Charters in 2010 6,050 6,789 Students in Charters in 2011 7,855 8,597 Students in Urban Schools 23,092 24,441 Students in Suburban Schools 2,787 2,908 Students in Town Schools 342 345 Students in Rural Schools 893 896 Students in Elementary Schools 13,604 14,068 Students in Middle Schools 2,540 2,663 Students in High Schools 1,321 1,795 Students in Multi-level Schools 9,622 10,038 Students First Year Enrolled in Charter School 8,571 8,946 Students Second Year Enrolled in Charter School 3,125 3,286 Students Third Year Enrolled in Charter School 1,293 1,329 Students Fourth Year Enrolled in Charter School 385 381 Black Students 16,971 17,894 Hispanic Students 1,710 1,673 White Students 7,408 7,992 Students in Poverty 19,807 20,705 Black Students in Poverty 13,780 14,459 Hispanic Students in Poverty 1,526 1,509 Special Education Students 2,764 2,862 English Language Learners 591 585 Grade Repeating Students 304 265
Matched Charter Students

51
Student GroupReading Math
Students in Decile 1 3,612 4,559Students in Decile 2 4,186 4,176Students in Decile 3 3,946 3,958Students in Decile 4 3,567 3,758Students in Decile 5 3,234 3,318Students in Decile 6 2,829 2,945Students in Decile 7 2,113 2,292Students in Decile 8 1,717 1,749Students in Decile 9 1,310 1,330Students in Decile 10 600 505
Matched Charter
Student GroupReading Math
Students at Ball State Charters 16,473 17,407 Charter Students in 2007 1,809 1,729 Charter Students in 2008 2,272 2,276 Charter Students in 2009 3,574 3,571 Charter Students in 2010 3,880 4,378 Charter Students in 2011 4,938 5,453
Students at Indianapolis Mayor's Office Charters 9,735 10,216
Charter Students in 2007 1,387 1,390 Charter Students in 2008 1,554 1,592 Charter Students in 2009 2,319 2,310 Charter Students in 2010 2,122 2,339 Charter Students in 2011 2,353 2,585
Students at Evansville-Vanderburgh Charters 366 442
Matched Charter Students
Student GroupReading Math
Indianapolis Charter Students 11,488 12,115 Indianapolis Black Students 7,188 7,472 Indianapolis Hispanic Students 622 624 Indianapolis White Students 3,261 3,586 Indianapolis Students in Poverty 8,413 8,757 Indianapolis Black Students in Poverty 5,642 5,856 Indianapolis Hispanic Students in Poverty 591 581 Indianapolis Special Education Students 1,244 1,276 Indianapolis English Language Learners 243 242 Indianapolis Grade Repeating Students 218 179
Matched Charter Students