Embed Size (px)
Citation preview
Is Historical Cost Accounting a Panacea? Market Stress, Incentive Distortions, and Gains Trading
Andrew Ellul
Indiana University, ECGI and CSEF
Chotibhak Jotikasthira University of North Carolina
Christian T. Lundblad
University of North Carolina
Yihui Wang Fordham University and Chinese University of Hong Kong
September 2012
ABSTRACT
We provide new empirical evidence concerning the contentious debate over the use of historical cost versus mark-to-market accounting in regulating financial institutions. These accounting rules, through their interactions with capital regulations, alter financial institutions’ optimal portfolio choice and trading behavior. The insurance industry provides a natural laboratory in which to explore these interactions since significant differences exist in the accounting rules imposed by regulators: life insurers have greater flexibility to hold speculative-grade instruments at historical cost than property and casualty (P&C) insurers. Using detailed data on insurers’ transactions and portfolio positions, including the regulatory accounting treatment for each security held, we show that life and P&C insurers respond differently to the observed massive downgrades among their holdings in asset-backed securities (ABS). Life insurers largely continue to hold the downgraded securities at historical cost and instead selectively sell their corporate bond holdings with the highest unrealized gains to improve their capital positions. This so-called “gains trading” is particularly widespread among those life insurers that face regulatory capital constraints and that are heavily exposed to ABS. For the most part, P&C insurers do not engage in gains trading; they instead sell their re-marked ABS holdings. In sum, the trading incentives induced by the interplay between historical cost accounting and capital regulations alter financial institutions’ portfolio allocation, potentially engender distortions in key regulatory metrics, and transmit shocks across otherwise unrelated markets. JEL classifications: G11; G12; G14; G18; G22 Keywords: Regulation; Mark to market; Historical cost accounting; Gains trading; Fire sales; Asset-backed securities (ABS); Corporate bonds; Insurance companies Acknowledgments: We are grateful for comments received from Utpal Bhattacharya, Dirk Black, Mike Burkart, Mark Carey, Scott Harrington, Cam Harvey, Jean Helwege, Alan Huang, Gur Huberman, Tim Jenkinson, Sreenivas Kamma, Mozaffar Khan, Peter Kondor, Wayne Landsman, Mark Lang, Christian Leuz, Martin le Roux, Dong Lou, Ed Maydew, Colin Meyer, Greg Niehaus, Marco Pagano, Lubos Pastor, Chester Spatt, Dragon Tang, Dimitri Vayanos, James Wahlen, and participants in the 2012 Adam Smith Corporate Finance Conference at Oxford University, City University of Hong Kong Conference, China International Conference in Finance (2012), FIRS Annual Meeting (2012), and the Seventh NY Fed/ NYU Stern Conference on Financial Intermediation, and seminar participants at Chinese University of Hong Kong, Duke University, Einaudi Institute for Economics and Finance, Imperial College London, Indiana University, London School of Economics, University of North Carolina (Accounting), University of Oxford, University of South Carolina, University of Toulouse, and University of Warwick. We are especially grateful to Robert Hartwig of the Insurance Information Institute for detailed discussions. This research was conducted, in part, while Lundblad was visiting the Einaudi Institute for Economics and Finance in Rome, Italy. Wang acknowledges the financial support from Rega Technologies Limited.
1
1. Introduction
This paper explores the trading incentives of financial institutions induced by the interaction
between regulatory accounting rules and capital requirements. The theoretical literature (see, for
example, Allen and Carletti (2008), Plantin, Sapra and Shin (2008), and Sapra (2008)) argues that
mark-to-market (MTM), or fair value, accounting leads to the forced selling of assets by financial
institutions during times of market stress, resulting in a downward spiral of liquidity and prices and
potential contagion effects for other markets. These authors also contend that historical cost
accounting (HCA), in contrast, may avoid fire sales and contagion effects.1 This paper challenges
this view by providing new empirical evidence that HCA, along with regulatory capital
requirements, induces an altered incentive to “gains trade” where, in order to shore up capital, an
institution selectively sells otherwise unrelated assets with high unrealized gains. Critically, it is
important not to consider the accounting treatment in isolation, but rather how the different
treatments interact with capital regulations (Heaton, Lucas, and McDonald (2010)) to influence
financial institutions’ trading incentives (Laux and Leuz (2009, 2010)).2,3
The role of MTM during the recent financial crisis has generated an intense debate. The
accounting rules followed by financial institutions may appear to simply be an issue of
measurement and, in frictionless markets, free of any impact on economic fundamentals.
However, when markets are illiquid and trading frictions elevated, financial assets may
temporarily trade at market prices that are well below fundamental values (Duffie (2010), AFA
Presidential Address). In such an environment, write-downs (and the associated deterioration of
financial institutions’ asset values) will lead to an erosion of their capital base, potentially forcing
the liquidation of some assets. Allen and Carletti (2008) argue that in such a market environment,
HCA will avoid fire sales because financial institutions would not suffer from a deterioration of
their asset valuations in the first place. Plantin, Sapra and Shin (2008) also argue that MTM
1 This is a view that has received support from the banking industry as well. In a letter to the SEC in September 2008, the American Bankers Association was of the opinion that, among several factors that led to the financial crisis, “one factor that is recognized as having exacerbated these problems is fair value accounting.” 2 Carey (1994) finds some evidence of gains trading by banks during 1979-1992. He finds that, at the bank level, most banks appear to gains trade to realize earnings as they appear (snacking) or to smooth earnings over time; very few try to manage tax liabilities or regulatory capital. See also Scholes, Wilson, and Wolfson (1990). Our paper differs from Carey (1994) and Scholes et al. (1990) in that we investigate gains trading at the security level, as opposed to the aggregate portfolio level, which allows us to identify gains trading from other trading motives. 3 See also Berger, Herring, and Szego (1995). Bleck and Liu (2007) theoretically examine, in a signaling framework, the economic consequences of MTM and HCA. They show that HCA may distort management’s incentives, and in some cases, may induce a behavior similar to “gains trading” in our paper when the management tries to signal good project quality to the market.
2
generates inefficiencies because it injects excessive volatility in prices that naturally degrades their
information content and leads to sub-optimal decisions by financial institutions.
HCA may also engender inefficiencies as financial institutions, under HCA, have an
incentive to engage in selective asset sales aimed at the early realization of earnings (see Laux and
Leuz (2009) for a discussion of the gains trading incentive under HCA). Indeed, Plantin, Sapra
and Shin (2008) recognize that HCA is not immune to these inefficiencies in normal times. In this
paper, we focus on the implications of this trading incentive and its impact on financial
institutions’ trading behavior during times of market stress. Below, we argue that it is precisely
during these times that financial institutions have the highest need to realize gains in order to
improve capital positions.
We argue that a crucial issue in the debate surrounding the accounting treatment of
financial assets and its impact on financial institutions relates to the interaction between the
accounting regime and the institutional framework. In particular, the accounting treatment cannot
be viewed separately from regulatory capital requirements. To focus ideas, consider a financial
institution that invested heavily in Asset-Backed Securities (ABS) in the years leading up to the
financial crisis. Because of the risk-based capital requirements, the severe downgrades of ABS
that occurred during the 2007-2009 period, taking many such holdings from investment to
speculative grades, significantly increased the regulatory (required) capital of various financial
institutions holding the downgraded instruments. The financial health of these institutions, as
measured by the Risk-Based Capital (RBC) ratio, the ratio of statutory (or actual accounting-
based) capital to regulatory capital, declined.4 Each affected institution then faced a stark decision:
either keep the downgraded instruments and find additional capital elsewhere5 or sell the
downgraded instruments to reduce the required risk-based capital.
Since the downgraded instruments experienced severe price declines, a crucial determinant
of the institution’s decision is whether the price declines had already been (or would soon be)
reflected in the institution’s statutory capital. This is where the accounting treatment used for
these instruments is likely to have a first-order effect on trading and portfolio choices. If the
4 Insurance regulators measure an insurer’s financial health using the risk-based capital (RBC) ratio, defined as the ratio of statutory (or actual accounting-based) capital to risk-based capital. This ratio is similar in spirit to various capital ratios used by bank regulators. Low values of the RBC ratio indicate weakness. Regulatory intervention is required for insurers with RBC ratio below 2, but attention is often prompted by a downtrend in the RBC ratio above that threshold. 5 Berry-Stolzle, Nini, and Wende (2012) show that life insurers do not appear to face difficulty in raising a large amount of equity capital during the crisis.
3
downgraded asset is held at market value, the price decline would be automatically reflected in the
balance sheet, and the loss would directly reduce the institution’s statutory capital (the numerator
of the RBC ratio). From a purely accounting point of view, the institution will be indifferent
between keeping the asset on the balance sheet and selling it. However, considering the regulatory
capital dimension, selling the downgraded asset has an important advantage as swapping a
speculative-grade asset for cash or investment-grade asset reduces the required regulatory capital
(the denominator of the RBC ratio). The disadvantage of selling is that trades will take place in a
market already characterized by severe price declines and illiquidity.
The situation is very different if the asset is held under HCA, where the decline in value
would not be recognized in the balance sheet unless the institution sold the asset. However,
despite the fact that the numerator of the RBC ratio is unchanged if no sale occurs, the ratio is
affected as the denominator increases due to the downgrade. In line with Allen and Carletti
(2008), the institution may yet respond to maintain a healthy RBC ratio. Holding the downgraded
asset has the advantage of limiting the unfavorable price impact and avoiding the recognition of
capital loss, but additional capital needs to be raised. It is precisely in this situation that the
incentive for gains trading arises: the institution may sell other existing assets to shore up its
capital position. Specifically, the institution faces an altered incentive to selectively sell those
assets that are held under HCA and have the largest unrealized gains. By doing so, these
unrealized gains can be recognized and flow to its capital.
The insurance industry presents a natural laboratory in which to explore the interaction
between accounting rules and capital regulations for financial institutions since the accounting
treatments used in determining the required regulatory capital for holding speculative-grade assets,
under the National Association of Insurance Commissioners (NAIC)’s model law, differ
significantly for life and for property and casualty (P&C) insurers. Specifically, we focus on the
crisis period from 2007-2009 where thousands of ABS were sharply downgraded, capital
constraints became practically binding, and so the effects of accounting rules were likely to be
most pronounced. In the case of an ABS downgraded from investment to speculative grade, P&C
insurers have to immediately recognize the value of the ABS as the lower between the book value
(based on HCA) and the market price (or model price, in case no market price is available). On the
other hand, life insurers can continue to hold the downgraded ABS under HCA except in the
4
extreme case when it is classified as ‘in or near default’ (Class 6).6 Given the observed large
downgrades among insurers’ holdings in ABS, these variations in accounting treatment, as they
interact with regulatory capital requirements, are likely to induce significantly different trading
behaviors and portfolio choices among life and P&C firms, particularly those firms that are the
most capital-constrained and the most exposed to the ABS market. For this reason, our empirical
investigation employs a panel of 1,882 life and P&C insurers for which portfolio-security level
data are readily available through the NAIC.
We construct a dataset of 34,957 downgrades of non-agency ABS to speculative-grade by
S&P over the period 2005-2010 using S&P’s Ratings IQuery. We combine information on these
securities with firm-level observations, provided by the NAIC, on insurance companies’ holdings
of and transactions in individual ABS and corporate bonds. Further, for each ABS and corporate
bond position, insurance companies provide, under statutory accounting principles prescribed by
insurance regulatory authorities, both fair and book values to the NAIC. We obtain data on the
financial position and strength of each insurance company from Weiss Ratings, LLC.
As of 2007, life and P&C insurance companies held roughly the same amount of non-
agency ABS as a percentage of their total bond portfolio (around 5-7%). During the financial
crisis, the downgrades of some of these ABS instruments were severe, with the majority of
downgraded securities falling to speculative grade.7 We find confirmation that the different
accounting treatment between life and P&C insurers is triggered when such downgrades occur.
For example, from 2004 to 2006, both life and P&C insurance companies hold around 5% of their
non-agency ABS positions at market values. In 2008, almost 20% (5%) of the holdings of P&C
(life) are held at market values. Given the similar exposure to downgraded ABS, this evidence
provides confirmation of the different accounting regulations across the two groups. Further, the
statutory capital of life companies, due to HCA, is much less affected by the downgrades than the
capital of P&C firms (-6% vs. -13% from 2007 to 2008). For both groups, however, the required
regulatory capital increased. The question is then how the different accounting treatments
influence the incentives of life and P&C firms to respond to this increase.
6 To put the definitions of the asset classes in perspective, a “Class 5” security is one that corresponds to a CCC/Caa credit rating; even in such cases life insurers can continue to hold the asset at HCA while P&C insurers have to recognize the market price if the price falls below the amortized historical value. 7 For example, out of the 1,238 ABS held by insurance companies that were downgraded to BB status, 946 were previously rated in the top three credit rating classes, with 451 coming straight from the highest AAA rating class.
5
Several key empirical results deserve attention. First, during the crisis, we find clear
evidence that life firms (the financial institutions generally booking downgraded securities under
HCA) largely keep the downgraded ABS in their balance sheet, whereas P&C firms (the
institutions generally marking to market downgraded securities) disproportionately sell their
downgraded ABS holdings (about 45% more likely than life firms). While the selling may take
place at fire-sales prices, P&C insurers, having already booked the loss, would be indifferent
between holding the asset at the lower value and selling it. Selling the asset has an important
advantage from the regulatory capital point of view, as a speculative-grade asset will be exchanged
for cash or an investment-grade asset thus reducing the capital requirement.
Second, we find that life insurers disproportionately sell the otherwise unrelated corporate
bonds that have, on balance, the highest unrealized gains. Because most corporate bonds are also
held at historical cost, it is only by the sale transaction that these unrealized gains can be
recognized. Following this course of action, life insurers achieve two important objectives: (1)
reduce their regulatory capital and (2) realize the gain that arises from the HCA treatment of
corporate bonds. Most importantly, we find that this trading behavior is disproportionately
conducted by life insurers that have (a) large exposures to downgraded ABS booked under HCA,
and (b) low risk-based capital ratios. Among these insurers, the probability of selling corporate
bonds with the highest unrealized gains increases by more than 50% over the normal selling
probabilities.8 These results are obtained after controlling for standard insurance company and
bond characteristics.9
The question then becomes whether such selective selling generates distortions in the
financial institutions’ portfolio choices and engenders price pressures in the selected assets with
high unrealized gains but that are unrelated to the ABS downgrades. If so, one can conclude that
HCA – precisely because of its interaction with capital regulations – does not completely avoid
market distortions and illiquidity spillovers. We address this question in two ways.
First, we track changes in the portfolio allocations of life and P&C insurers through time.
The significant ABS downgrades reflect the elevated risk profile of this asset class, in general;
8 The marginal selling probability is calculated by comparing the selling probability between the corporate bonds at the 75th percentile of unrealized gains and the bonds at the 25th percentile. 9 While the majority of the insurers in our sample are private firms, some are publicly listed. Given that the majority of insurance company positions are listed as “available for sale” and hence marked to market under GAAP (as opposed to the Statutory Accounting Principles used by insurance regulators and highlighted here), we explore the robustness of our main results for the two groups separately. The results are broadly similar, suggesting that the additional disclosure associated with public firms does not significantly alter the incentives generated by HCA versus fair value accounting as they interact with capital regulations.
6
even those ABS that are not downgraded, on average, suffered sizeable price declines. To
maintain the same risk-return profile as in the pre-crisis period, both life and P&C insurers should
reduce their portfolio allocation to ABS (holding constant the overall rating and maturity allocation
and hence the capital requirement). We find that this is not the case – striking differences exist in
life and P&C insurers’ portfolio changes. While P&C insurers quickly reduced their ABS holdings
as the financial crisis unfolded, no such reduction is found for life insurers. Importantly, we find
that life insurers with the lowest risk-based capital ratios, i.e. those that are closest to regulatory
scrutiny and should therefore be the most sensitive to elevated risk, were among the most likely to
hold on to their ABS positions. Moreover, due to severe ABS price declines coupled with the
positions’ HCA treatment, high ABS exposures among insurers often translate to large unrealized
losses in their portfolios. Given the current methodology for assessing risk-based capital
requirements, these insurers may appear artificially healthy and therefore potentially slip
regulators’ attention.
Second, we investigate price pressures that may be generated in the corporate bond market
due to the selective selling of corporate bonds by life insurers. We find that the corporate bonds
disproportionately targeted by life insurers facing the highest propensity to gains trade statistically
and economically underperform otherwise similar bonds (0.7 to 1.3% over the interquartile range
of aggregated gains-trading propensity). In the quarters with the largest number of ABS
downgrades, we find even larger price impacts (1.1 to 5.0% as we move from the 25th to 75th
percentile of gains-trading propensity).
Overall, these results show that the interactions between accounting treatment, especially
HCA, and capital regulations can create unintended consequences where spillover effects and fire
sales are not entirely avoided. HCA, through the incentive it creates for gains trading, can still
engender price distortions during market stress for assets that are completely unrelated to the
original downgraded securities. Thus, using the terminology in Plantin et al. (2008) “in such an
environment, prices drive measurement, but measurements have an impact on pricing.” The results
for life insurers are of particular importance to banking institutions since life insurers, in contrast
to P&C, have asset and liability structures that resemble those of banks.
Our paper is related to several strands of the literature. We contribute to the growing
literature exploring the trading decisions made by institutional investors when faced with a
financial shock (for example, Anand et al. (2010), Boyson et al. (2011), Manconi et al. (2011),
Hau and Lai (2011), among others). To the best of our knowledge, we are the first to empirically
7
demonstrate the importance of the interaction between accounting rules and capital regulations on
the decisions made by institutional investors and the spillover effects that may occur. One
unintended consequence of such an interaction, which we focus on in this paper, is the incentive
for gains trading; Beatty, Chamberlain, and Magliolo (1995), Hirst and Hopkins (1998), Hirst et al.
(2004), Kashyap and Stein (2000), Lee et al. (2006), among others, also explore the gains trading
(what these articles refer to as the ‘cherry picking’) phenomenon. In contrast to these earlier
efforts, we show that gains trading behavior takes place during periods of market stress and has
significant price impacts. Furthermore, we are the first to document such trading behavior at the
security-level, rather than inferring trading behavior from aggregated data at the institution-level.10
Most importantly, our results contribute to the debate on the choice of accounting system,
historical cost vs. marking to market, used in regulating financial institutions.11 The literature
(mostly theoretical) suggests that during a financial crisis, marking to market may cause distressed
selling and financial instability (Allen and Carletti (2008), Plantin et al. (2008), and Wallison
(2008)).12 Merrill et al. (2012) provide evidence in support of this prediction, focusing on
insurers’ trading in residential mortgage-backed securities (RMBS) following modifications in
their accounting rules that require the recognition of changes in the values of RMBS. We provide
new empirical evidence that suggests that the contentious debate about accounting choices for
financial institutions in general cannot focus exclusively on accounting treatments but rather must
acknowledge important interactions with the regulatory framework in which they are being
employed. Specifically, our evidence supports Laux and Leuz (2009, 2010)’s conjecture that
historical cost accounting is not a panacea. Historical cost accounting creates an altered-incentive
environment in which financial institutions sell assets to realize gains, essentially transmitting
shocks across potentially unrelated markets.
The remainder of the paper is organized as follows. Section 2 discusses the sample
construction and describes the summary statistics of the data. Section 3 presents our main
empirical analysis that uncovers gains trading and more generally contrasts the trading behavior of
insurers, who use different accounting rules, during the massive wave of ABS downgrades. In
10 Our results also imply that reported income that includes realized gains and losses may not be reflective of insurers’ financial health and valuation, consistent with the findings of Nissim (2011). 11 See Goh et al. (2009) for a general analysis of the determinants of accounting choice and the effects of fair value disclosure on firms’ information environment. See also Eccher, Ramesh, and Thiagarajan (1996), Penman (2007), Petroni and Wahlen (1995), and Wyatt (1991). 12 See Veron (2008), and Bleck and Liu (2007) for an opposing view.
8
Section 4, we investigate the effects of gains trading on portfolio allocation and security prices.
Section 5 concludes.
2. The Data
We are interested in providing evidence concerning the contentious debate over historical cost
versus fair value accounting for financial institutions. In particular, how do these different
accounting rules, coupled with the overall capital regulation, affect the institutions’ risk taking
activities? The insurance industry provides a natural laboratory in which to empirically examine
this question. First, there exist significant differences in regulatory accounting rules: life insurers
have greater flexibility to hold downgraded assets at amortized historical cost than P&C insurers.
Second, within an insurer’s investment portfolio, detailed data are available on transactions,
positions, and, most importantly, the accounting treatment for each security.
2.1 Sample Construction
We combine three sets of data in our analysis: information on insurance companies, ABS securities
and their rating changes, and corporate bonds and their trade prices. We discuss in detail how we
assemble the three sets of data below. Our sample period is from 2004 to 2010. This period covers
the financial crisis of 2007-2009 and also a non-crisis period that we shall use for comparison.
Specifically, we define our crisis period as 2007 Q3 – 2009 Q4, as virtually all significant
downgrades of ABS happen during this period.
Our primary data on insurance companies’ transactions and year-end positions are from the
National Association of Insurance Commissioners (NAIC).13 The NAIC data provide year-end
holdings of invested securities for each insurance company and detailed transaction information on
every trade. Both the position and transaction data provide the identities of the insurance firms and
the relevant securities (e.g., 9-digit CUSIP). We merge the year-end position data with transaction
data to infer quarter-end positions. Finally, the NAIC data provide detailed information about the
book-adjusted carrying value and fair value of each position held by each insurance company at
year-end. We employ this information to infer whether an insurance company holds its ABS and
corporate bonds at historical cost or at fair value.
13 Further details of the NAIC data can be found in Ellul, Jotikasthira, and Lundblad (2011).
9
The financial information on each insurance firm is from Weiss Ratings, which provides
financial strength ratings and other related information.14 From this source, we obtain annual firm
characteristics, such as size, ‘capital and surplus’, and the risk-based capital (RBC) ratio used for
capital regulation. We eliminate small insurers with investment assets less than $13 million (the
bottom 1%) and/or with an RBC ratio either below 2 or above 20 to avoid any bias from small or
abnormal firms.15 We also delete all AIG’s affiliated insurers and 32 others that provide financial
insurance and guarantees for bonds, such as credit default swaps and municipal finance, as these
firms were affected by the downgrade of ABS securities through a different channel.16 Our final
sample of insurance firms consists of 12,555 firm-years representing 2,249 firms, among which
577 are life insurers and 1,672 P&C insurers.
Our data on ABS ratings are from S&P’s Ratings IQuery. We extract all the data in the
structured credit subsector in Ratings IQuery, which comprehensively covers initial ratings and
histories for all securitized issues rated by S&P from 1991 to 2010. The database records issue
and tranche identity (9-digit CUSIP), gross principle, class, maturity, collateral type, rating, and
rating date. With this dataset, we identify 127,719 ABS securities in 13,430 issues.17 Among all
the ABS securities rated by S&P, 65% are mortgage-backed securities, 20% are collateralized debt
obligations, and 15% are asset-backed securities backed by consumer loans. We use the list of 9-
digit CUSIP of ABS in the rating dataset to identify holdings of ABS by insurers. Over our sample
period, 24,452 unique CUSIPs in the portfolios of insurance firms are identified as ABS. The
ratings and rating dates are then used to generate the list of significant rating downgrades.
The data on corporate bond characteristics and trading are obtained from Mergent Fixed
Income Securities Database (FISD) and TRACE. We merge the FISD data with the position and
transaction data of insurance firms to identify the corporate bonds being held and transacted as
well as the bond characteristics, such as issue size, age, maturity, rating downgrades, and
bankruptcy. When we identify downgrades of corporate bonds, we use S&P’s ratings whenever 14 Weiss Ratings was split from the Street.com in 2010, to focus only on rating insurance companies. 15 Small insurance firms do not have many trading choices. Insurance firms with larger RBC ratios are considered better capitalized. Firms with RBC ratios below two are subject to supervisory intervention. Firms with RBC ratios above 20 are unusual and may behave differently from the average. 16 We identify bond insurers from Ratings IQuery, which reports financial insurance providers in securitized issues. In addition to AIG, we also exclude Ambac Assurance Corp, MBIA Insurance Corp, Financial Guaranty Insurance Co., etc. 17 According to SEC (2011), S&P ratings are outstanding for a total of 117,900 ABS securities as of year-end 2010. Note that ABS securities, particularly mortgage-backed securities tend to have long maturities, suggesting that most of the securities in our sample may still exist by year-end 2010. In addition, the majority of the ABS securities were issued after 2000 when this market grew substantially. According the SEC report, S&P rated the largest number of ABS among all rating agencies. The number of S&P’s ratings is greater than Moody’s 101,546 outstanding ratings.
10
they are available, to be consistent with our data source of ABS ratings. When S&P’s ratings are
missing, we use the ratings from Moody’s (or Fitch if Moody’s ratings are not available). Data on
bond market transaction prices and size are from TRACE, which covers over-the-counter corporate
bond market transactions for both investment- and speculative-grade bonds since 2004. We use the
9-digit CUSIP to merge bonds in FISD and in TRACE.
2.2 Insurance Firms and Their ABS Exposure
Table 1 shows summary statistics on several key financial variables for our sample firms at the end
of 2007. A detailed description of the variables can be found in Appendix A.
[Insert Table 1 here]
At the end of 2007, we have complete financial information for 1,344 P&C companies and 432 life
companies in the sample. Life firms are larger than P&C firms. Invested assets are $4.7 billion, on
average, (median of $393 million) for life firms and $829 million, on average, (median of $119
million) for P&C firms. The average ‘capital and surplus’ is also larger for life firms at $476
million (median of $66 million), compared to $384 million (median of $53 million) for P&C firms.
In addition, life firms, similar to banks, operate at much higher leverage than P&C firms. Return
on equity is at similar levels for both types.
The capital positions of life and P&C firms are similar. We use the NAIC risk-based capital
ratio (RBC ratio) to measure capitalization. The RBC ratio is the ratio of total adjusted statutory
capital to NAIC risk-based capital (RBC), which is the minimum capital under current regulation
that an insurance company must maintain given the inherent risks in its operations.18 It is
calculated based on the NAIC’s formula which reflects a risk assessment of different asset classes
and businesses. Risky assets are weighted more heavily in computing RBC, and higher RBC ratios
reflect better capitalization. Insurance companies with RBC ratios below 2 are considered under-
capitalized and subject to supervisory interventions. The average life and P&C firms in our
sample have RBC ratios of 9.1 and 8.3, respectively. We use the RBC ratio to capture the
regulatory constrains that insurers may face when their fixed income holdings are downgraded, as
downgrades can lead to higher weights assigned on the same assets and hence a lower RBC ratio.
18 This is similar in idea to a variety of capital ratios (e.g. tier 1 capital/risk-weighted assets) used in bank regulation.
11
Insurance companies heavily invest in investment-grade bonds, representing 57-60% of
their portfolios, on average. Weiss Ratings creates a series of standardized indices to measure
insurers’ liquidity, profitability, and other aspects of their financial conditions. Life and P&C
firms are, on average, not systematically different in terms of Weiss Ratings’ assessment of
profitability and liquidity. Overall, as insurers heavily invest in bonds, their trading behavior in
this asset class is representative of their portfolio choices and thus interesting to analyze.
To see the exposure of the insurance firms to ABS, we report their holdings of ABS over
the period 2004-2010 in Table 2.
[Insert Table 2 here]
Life firms have greater exposures to ABS when compared to P&C firms. Based on the left two
columns, about 80% (60%) of life (P&C) firms hold ABS. These percentages decline for P&C
firms over the crisis period. In the other columns, we report the number and total values of ABS in
each year across the firms that hold any ABS. Three features of the data are notable. First,
insurance firms’ portfolio exposures to ABS were quite large during the crisis. For example, life
firms held, on average, 75-79 ABS during 2007-2009, and these securities accounted for about 7-
8% of the par value of their total fixed income holdings, including government, corporate,
municipal and all other types of bonds, in addition to securitized instruments. P&C firms held
fewer ABS, compared to life firms, but the average exposure was still about 5% in 2007 and 2008.
Second, we note that insurance firms built up their holdings of ABS before the crisis and
reduced the exposure afterwards. For life firms, the ABS holdings accounted for 4.7% (median
3.5%) of par value of all bond positions in 2004, increased to 7.7% (median 6.2%) in 2007, and
dropped to 5.7% (median 4.6%) by the end of 2010. P&C firms reduce their exposure earlier and
more substantially than life firms. Their relative holdings, measured with par value, were reduced
from the maximum of 5.5% (median 3.8%) in 2007 to 3% (median 1.6%) by 2010. We also
compute ABS exposure using fair instead of par value. The last four columns show that the fair
value of insurance companies’ holdings was substantially lower than par value after 2008,
suggesting that the values of ABS holdings were more affected by the crisis than those of the other
types of bonds.
Finally, we point out the substantial heterogeneity in ABS exposure across insurance
companies. For example, in 2007, the median life firm held only 15 ABS and those in the top
12
percentile held more than 156 such securities. Similarly, the median firm invested 6.2% of the
bond portfolio in ABS, and the top percentile held 16.3% in ABS. The same heterogeneity was
also present among P&C firms. We will use this heterogeneity to economically identify “gains
trading,” as those more affected by ABS downgrades and the associated price decline have greater
incentives to realize gains in other asset classes in order to improve capital positions.
2.3 Downgrades of ABS Securities and Impact on Insurance Companies
The securitization market expanded substantially before the crisis of 2007-2009. Total ABS
issuance grew from $1.5 trillion in 2004 to $2.3 trillion in 2007, according to Asset-Backed Alert.
A key development in this market was the collateralized debt obligation (CDO), which, by pooling
and tranching, created securities that have much better credit ratings than the collateral assets
backing the issues. The better ratings of the ABS attracted investors that face regulatory constraints
mechanically tied to credit ratings, such as insurance firms. Following the onset of the financial
crisis, ABS were severely downgraded by major rating agencies. In Ratings IQuery, we find
39,464 ABS downgrade actions by S&P in 2008.
We are particularly interested in the downgrades from investment to speculative grades,
because these downgrades would force firms to apply higher risk weights thereby triggering larger
capital requirements. Figure 1 presents the total number of investment-to-speculative downgrades
of ABS on a quarterly basis.
[Insert Figure 1 here]
The massive downgrades started in Q3 of 2007, with 952 downgrades from investment to
speculative grades. In each of the following four quarters, we observe more than 3,500 such
downgrades. In total from Q3 of 2007 to Q4 of 2009, S&P downgraded 33,917 ABS from
investment grade to speculative grade.
To gauge the degree to which insurance companies were affected by these downgrades, we
count the number of investment to speculative downgrades of ABS that were held by insurance
firms. These numbers are also shown in Figure 1 on the right scale. Only a small portion of the
downgrades in the early stage of the crisis affected insurers: before the end of 2008, about 5-9% of
the downgrades in each quarter affected insurance firms. Insurance companies were, however,
more significantly affected by the ABS downgrades in 2009, representing 15-18% of the total
13
number of downgrades of ABS in each quarter of that year. Moreover, we note that the
downgrades in the later stage of the crisis were more severe. For example, 332 downgrades in Q4
of 2008 were straight from AAA to speculative grade, compared to only 94 of such downgrades in
all of the preceding quarters. In 2009, a total of 887 downgrades affecting insurance firms were
from AAA to speculative grade.
[Insert Table 3 here]
Table 3 shows the rating transitions of downgrades, many of which were by several notches, of the
ABS held by insurance companies. For example, 1,238 ABS were downgraded to a BB rating
class (for the sake of brevity, we aggregate all ABS that were downgraded to BB+, BB or BB- in
one class); 451 of these securities were rated as AAA before the downgrade. The same applies to
the 1,639 ABS downgraded to the B rating class; 714 of them were previously rated as AAA.
These dramatic shifts, which likely came as a surprise to insurers, significantly impacted the
insurers’ regulatory capital. In fact, when a bond or bond-like instrument is downgraded from
either “Class 1” or “Class 2” to “Class 3”, which is equivalent to a downgrade from an investment
grade rating class to a BB class, the required regulatory capital increases significantly for both life
and P&C insurance companies.
2.4 Accounting Treatment of Downgraded ABS Securities
We now explain the rules surrounding the accounting treatment imposed on life and P&C
insurance companies, when the ABS they held were downgraded. NAIC regulations define 6
different classes by credit ratings, and all fixed income securities held by insurers fall into one of
these classes. A particular threshold of importance is between Class 2 and Class 3; the former
refers to a security with a BBB rating while the latter refers to a security with a BB rating.
When a fixed income security is downgraded from investment to non-investment grades,
P&C insurers have to immediately recognize the value of the bond as the lower of the amortized
historical cost (based on HCA) or the market price (or model price, in case no reliable market price
is available). Life insurers face no such requirement; they can continue to hold the downgraded
bonds under HCA, except in the extreme case when the bonds are classified as ‘in or near default’
(Class 6). A Class 5 security is one that corresponds to a CCC/Caa credit rating; even in such
14
cases, life insurers can continue holding the security at amortized value while P&C insurers have
to recognize the market price if the price falls below the amortized value.
At this stage, it is important to draw a distinction between the accounting rules followed
by insurance companies when producing their financial statements for investors (GAAP) and
those in the Statutory Accounting Principles (SAP) used by regulators. The main difference of
interest for this paper is the way unrealized gains and losses on available-for-sale (AFS)
securities are treated under the two methods. This is important in our context because the
securities that are most likely to be targeted for sale once an ABS is downgraded are mostly
classified as AFS in insurance companies’ balance sheets.19 GAAP states that AFS securities
should be booked at MTM and any unrealized gains and losses will flow into the insurance
company economic capital (but not to the income statement, so long as the securities are not
sold).20 SAP adopts a very different approach to AFS securities held by insurance companies
because, in general, any unrealized gains and losses are excluded from the SAP economic capital
calculation.21 Specifically in the case of securities downgraded to non-investment grades, as
explained above, SAP allows life insurers more accounting flexibility: while P&C insurers have
to immediately recognize the value of the bond as the lower between the amortized historical
cost or the market price, life insurers face no such requirement.
In the light of these regulations, the significant ABS downgrades documented in Section
2.3 should generate significant cross-sectional variability in the accounting treatment of
downgraded ABS between P&C and life companies. To explore this, we use year-end positions
data, which contain the book value and the fair value (the market price or a model price for illiquid
assets) reported for each position. We classify as “revalued” the positions for which the book and
the fair values are equal. Others are classified as held at historical cost (i.e. treated under HCA).
This identification of MTM vs. HCA may underestimate the frequency of MTM as no revaluation
is required if the position’s book value remains below its fair value (unlikely the case for recently
downgraded ABS). However, we have no reason to believe that this underestimation affects one
type of insurers more than the other; and, hence the difference in revaluation frequency across
insurer type is most likely driven by different accounting treatments.
19 This inference is based on the balance sheet information of publicly listed insurance companies. 20 The accounting rules of interest are SFAS 115 and SFAS 130. 21 The treatment afforded to unrealized gains and losses of AFS securities by SAP in the case of insurance companies is similar to that afforded by the Regulatory Accounting Principles in the case of banks.
15
Figure 2 reports the percentages of ABS holdings (Panel A for investment-grade ABS and
Panel B for speculative-grade ABS) revalued at year-end for both life and P&C firms over the
period 2004-2010.
[Insert Figure 2 here]
The most striking feature is the significantly higher percentage of speculative-grade positions that
were revalued by P&C firms, far greater than those by life firms. In 2008, when a large number of
ABS were downgraded and suffered severe price decline, P&C firms revalued 70% of their
speculative-grade ABS, while life firms only revalued less than 20%.22 Even for investment-grade
ABS, P&C firms appeared to revalue their ABS positions more often than life firms during the
crisis, possibly to impair some ABS whose changes in value are deemed permanent. Investment-
and speculative-grades combined, P&C firms go from marking to market around 5% of their ABS
holdings in 2006 (similar to life firms) to marking to market almost 20% of their positions by
2009. We attribute these differences in accounting treatment, starting from the end of 2007, to the
different accounting regulations imposed on life vs. P&C firms that become increasingly relevant
when many of the ABS are downgraded to speculative grades.
An additional question that arises is whether different insurance firms agree on the
accounting treatment used to book each downgraded ABS (which should be the case if the
accounting treatment is determined by the regulation). We address this issue by investigating the
revaluations of the ABS positions at the CUSIP level for both life and P&C companies
(considering only those ABS that are held by at least two insurance companies within each group).
We do not report these results for the sake of brevity; however, the picture that emerges
corroborates the evidence in Figure 2.23
22 The difference is less striking but still significant in other years, as revaluation is not required if the book value is lower than the market value. 23 For example, 91% of all ABS held by at least two life firms are booked at historical cost in 2006, and 92% in 2009. The picture is very different for P&C: in 2006, 88% of all ABS were held at historical cost, but that figure decreases to 65% in 2008, 72% in 2009 and 68% in 2010. Around 4% of ABS were held at market value by all P&C firms in 2006, but this figure rose to 21% in 2008. Finally, we find that there is some disagreement on the same ABS across insurance companies in both groups, but such disagreement is much lower in the life group than P&C group. It is possible that such disagreement arises because of the limited discretion in the hands of each insurance company when determining the fair value of each ABS and whether the change in value is temporary or permanent nature.
16
To better focus on the change in the accounting treatment, we investigate the differences
across life and P&C companies in their subsequent accounting treatment of the downgraded ABS.
This analysis is shown in Table 4, for two types of downgrades (a) from investment to speculative
grades, and (b) from AAA to speculative grade (this being the most severe type of downgrades).
[Insert Table 4 here]
There are striking differences between life and P&C companies. Consider row (2), which include
all downgrades from AAA to speculative grade over the period 2005-2010. We see that life
insurers had a total of 1,860 positions in these securities that were held under HCA before the
downgrade. Once the downgrade occurred, life insurers kept 79% of those securities at amortized
value and revalued only 9% to market values. Compare this to the behavior of P&C firms that
held 851 downgraded ABS positions at amortized value before the downgrade. Once the
downgrade occurred, P&C firms kept only 45% of these securities under HCA, revalued 36% to
market values (three times as much as life firms did), and sold 20%.
One drawback of the NAIC balance sheet data for this particular type of analysis is that the
positions are available only at the year-end. It is plausible that revaluations occur at different times
within the year. Since we only observe the difference between the book value and fair value at
year-end, this may lead to some bias against finding revaluations if market prices subsequently
drift (recall that revaluation is required only when the market value falls below the book value).
This may have happened, for example, during 2009 when many of the extreme downgrades took
place relatively early in the year. To address this issue, we consider a subset of downgrades that
occurred in the fourth quarter, as these are temporally closer to the year-end measurement we
observe and the drift problem may be less important. As expected, the results are more striking.
Life insurers had a total of 514 positions in ABS securities that were downgraded from AAA to
speculative grade and were held at amortized value before the downgrade. Once the downgrade
occurred, life insurers kept 79% of these securities under HCA and revalued 10% to market values.
In contrast, P&C firms kept only 16% of the similarly downgraded securities at amortized value,
revalued 63% to market values (six times as much as life), and sold 11%.
Taken together, we conclude that the differences in the regulation governing the accounting
treatment between life and P&C firms draw a clear wedge between the two types. We employ this
distinction, and the resulting impact on the way downgraded assets are booked, to explore the
17
incentive for gains trading created by the interplay between accounting rules and regulatory capital
requirements for financial institutions.
2.5 Unrealized Gains and Losses
For each bond position, we calculate the unrealized gain as the difference between the position’s
book-adjusted carrying value and fair value as a percentage of carrying value. As discussed,
insurance companies report both the carrying values and the fair values of all bond positions at
year end to the NAIC. Table 5 reports the distribution of the percentage unrealized gains (and
losses) separately for life and P&C firms. Panel A is for ABS, and Panel B is for corporate
bonds.
[Insert Table 5 here]
Table 5 Panel A shows that up to the end of 2007, the median unrealized gain for ABS is
close to zero, but in 2008 the median unrealized gains for life firms turns into unrealized losses to
the tune of -30% with over nine tenths of all ABS positions having unrealized losses and over one
tenth having the losses exceeding 75%. These unrealized losses slightly improve in 2009 and
2010, but the overall distribution remains negatively skewed. P&C firms suffer unrealized losses
to a much lesser degree, with the median unrealized gain coming back to around zero in 2009 and
2010. This sharp difference between the two groups may be due to the fact that P&C firms are
forced to revalue the ABS that are downgraded to speculative-grade, essentially truncating the left
tail of the unrealized gain distribution. In addition, life firms are likely to avoid selling their ABS
in 2008-2009, as doing so would have a significant negative effect on their income and capital.
Panel B of Table 5 shows that the distribution of unrealized gains for corporate bonds also
suffers a negative shift in 2008, but quickly returns to normal in 2009. Interestingly, over a
quarter of corporate bond positions have unrealized gains in 2008, suggesting that there is more
flexibility to potentially realize these gains by trading. In 2009, over half of the corporate bond
positions have unrealized gains for life and over three quarters for P&C firms. As a result, we
will use corporate bonds as the main asset class for studying gains trading among insurance
companies.
18
3. Empirical Methodologies and Results
3.1 Difference in Regulatory Accounting Treatment of Downgraded ABS
As seen earlier, P&C firms revalue a larger proportion of their ABS positions than do life firms
during the crisis. To ensure that this finding is indeed due to regulatory differences, rather than
the difference in, say, the credit quality of the ABS held by the two types of insurers, we estimate
a logit model for the probability that an ABS position is revalued controlling for credit quality and
other distinct characteristics of the ABS:
)()1Pr( ,0,, tWtiXjPtji WXPlM (1)
where )(l denotes the logistic probability function, tjiM ,, is an indicator variable that equals one if
the insurance company j (holding bond i) revalues bond i at the end of year t and zero otherwise,
jP is an indicator variable that equals one if the insurance company j is a P&C insurer and zero
otherwise, tiX , is a vector of bond i’s static characteristics (e.g. issue size) and time-varying
characteristics (e.g. remaining maturity) at the end of year t, tW is a vector of time-specific
variables, and s' are the corresponding vectors of coefficients to be estimated. It is important to
highlight that in all specifications, we include ratings group24 (in tiX , ) and U.S. state of
incorporation fixed effects (in jP ), as well as either a crisis indicator or year fixed effects (in tW ).
We estimate the model for the crisis (2007-2009)25 and non-crisis (2004-2006, 2010)
periods, both separately as well as together. We are interested in how P&C firms’ incremental
propensity to revalue their ABS positions differs across the crisis (where many ABS are severely
downgraded) and non-crisis periods. Given our use of interaction terms in a number of
specifications, it is difficult within a logit specification to interpret parameter estimates for the
property and crisis indicators in isolation. We therefore estimate and report the marginal effect of
being a P&C firm on the probability of revaluation by making 2,000 repeated draws from the
(multivariate normal) distribution of parameter estimates and calculating a simulated sample of
probability difference between life and P&C firms (a) in the crisis vs. non-crisis periods and (b)
24 The ratings fixed effects are equivalent to the NAIC class 1, 2, 3, separately, and classes 4-6 put together. 25 Note that the logit is estimated for revaluations that can only be observed at annual frequency.
19
for downgraded ABS vs. others. We then use the simulated sample of marginal effects to
construct 90%, 95%, and 99% confidence intervals to determine statistical significance. 26 The
results are shown in Table 6.
[Insert Table 6 here]
In column (1) of Table 6, we report the simplest specification in which we examine the
behavior of P&C relative to life insurers during the non-crisis period, including ratings group,
U.S. state of incorporation, and year fixed effects. In column (2), we have the same specification
for the crisis period. We find that while the P&C indicator carries a positive coefficient for both
the crisis and the non-crisis periods, it is only statistically significant during the crisis period, with
the marginal effect being much larger during the crisis period (1.9% vs. 8.2%). Considering that
the average probability of a revaluation of ABS held by all insurance companies during the crisis
period is 3.6% (during non-crisis period it amounts to 5.2%), it is very evident that P&C insurers
do revalue significantly more often than life insurers.
We find similar results in columns (3) and (4) when we consider an alternative
specification that includes ABS-level control variables (while still using all fixed effects as
before). In columns (5) to (8), we consider the entire sample from 2004 to 2010 together and
introduce (a) a crisis indicator and (b) an interaction effect between the P&C indicator and the
crisis indicator. In column (5), for example, we show that P&C companies have a slightly higher
propensity to revalue assets compared to life companies, and this difference increases
dramatically during the financial crisis consistent with the time-separated results. The results
hold strongly in all specifications, largely unaffected by any control variables we include.
In columns (3), (4), (7), and (8), we also investigate the propensity to revalue downgraded
ABS, by adding a downgrade indicator that takes the value of 1 when the ABS rating falls from
investment to speculative grades. Recall that by regulation, P&C companies are required to book
speculative-grade ABS at the lower of the amortized historical cost or the market value while life
companies are required to do so only when the ABS are near or in default. Thus, the difference in
revaluation probability should come out most strongly among the downgraded ABS. Indeed, we
26 This methodology is standard for a non-linear model with many indicator variables (see Bratsberg, Raaum, and Roed (2010), for example) and/or interaction terms (see Scheve and Slaughter (1999), for example). See Norton, Wang, and Ai (2004) for a detailed discussion of both the problem and the STATA program they write to address it; however, in most of our settings, we cannot use their program directly.
20
find that the marginal effects of P&C indicator on revaluation are multiple times higher for the
downgraded ABS than for others, during both the crisis (12.5%) and non-crisis (14.2%) periods.
This striking result, consistent with our finding in Table 4, suggests that the wave of ABS
downgrades during 2007-2009 is ideal for investigating the implications of HCA vs. fair value
accounting.
Overall, these results show clearly that the different regulatory accounting treatments
imposed on P&C and life firms have a significant impact on their revaluation behavior. To be
clear, the higher propensity of P&C firms to revalue should be understood more as an outcome of
regulations on the accounting treatment rather than voluntary choice. If it is true that accounting
is not simply a veil but rather constitutes an important influence on real decisions in markets
characterized by frictions, then we should expect to see differences in trading behavior across
insurance firms that have different revaluation propensities. Specifically, we expect P&C firms to
behave differently from life firms when faced with the stark decision of how to adjust their
portfolios in response to a large number of ABS downgrades, given that the same trading decision
may have different implications under the different accounting rules.
3.2 Selling of Downgraded ABS
In this section, we assess whether the P&C firms’ revaluation of downgraded ABS to market
values (which we have shown truncates the distribution of unrealized losses) makes them more
likely to directly sell the downgraded ABS relative to their life counterparts. We model the
probability of selling the downgraded ABS within 3 months after the downgrade having occurred
as a logistic function:
)()1Pr( ,,,0,, kWkiXkjiVjPkji WXVPlS (2)
where )(l denotes the logistic probability function, kjiS ,, is an indicator variable that equals one if
the insurance company j (holding downgraded bond i) sells the downgraded bond i within 3
months after downgrade event k and zero otherwise, jP is an indicator variable that equals one if
the insurance company j is a P&C insurer and zero otherwise, kjiV ,, is an indicator variable that
equals one if the insurance company j holds the downgraded bond i at market value at the year-
end before event k and zero otherwise, kiX , is a vector of bond i’s static characteristics and time-
21
varying characteristics just before event k, kW is a vector of time-specific variables for each event
k, and s' are the corresponding vectors of coefficients to be estimated. In all specifications, we
include ratings group, U.S. state of domicile and year fixed effects.
We estimate the model separately for (a) all downgraded ABS, (b) only the ABS that were
downgraded from investment to speculative grades, and (c) only the ABS that were downgraded
from AAA to speculative grade. The marginal effects of the P&C and revaluation indicators are
calculated as described in Section 3.1. The results are shown in Table 7.
[Insert Table 7 here]
From column (1), we find that P&C companies have a higher propensity to sell the
downgraded ABS (rather than keeping these ABS on their book) relative to life. This result is
confirmed using the specification that includes ABS-level control variables (remaining maturity
and the log of the issue size) and a revaluation indicator variable that captures the insurance
company’s decision to revalue the downgraded ABS. The revaluation indicator variable is used
to control for the likelihood that insurance companies are more likely to sell positions that have
been re-booked at market price because once they do so, they should be largely indifferent
between keeping the asset on their balance sheet or selling it. In fact, the marginal effect of the
revaluation indicator is positive and statistically significant in all specifications, showing that
revalued positions are indeed more likely to be sold. It should be noted that these trading
dynamics cannot be explained by any differences in regulations across different U.S. states since
we include state of incorporation fixed effects. Further, these effects are not driven by ABS-level
characteristics, such as liquidity, since we include ABS-level controls.27
The main result that P&C firms are more likely to sell downgraded ABS than life firms is
confirmed for the more severe downgrades (a) from investment to speculative grades (columns
(3) and (4)) and (b) from AAA to speculative grade (columns (5) and (6)). We want to highlight
that for the last set (most severe downgrades), the effects of the P&C indicator are about twice as
large as those for the other types of downgrades. For these AAA-to-speculative-grade
downgrades, and controlling for the revaluation effects, we find that the selling probability of
P&C firms exceeds the selling probability of life firms by 5.8%. Considering that the average
27 In fact, the marginal effects of issue size show that large-issue ABS are more likely to be sold, possibly due to their superior liquidity.
22
selling probability is 7.3% for these downgraded ABS, we can say that, P&C firms have an 80
percentage points higher propensity to sell than life firms. The same selling behavior is observed
when we consider less severe downgrades from investment to speculative (45 percentage points)
and all downgrades (53 percentage points).
These results, obtained at the individual ABS-level, are a confirmation of the broad
industry trend shown in Table 2. Recall that the average holdings of ABS of life insurers was
6.58% in 2006 and was reduced to 5.15% in 2009, while the average holdings of ABS of P&C
went from 5.08% to 2.75% over the same period.
In sum, the results from Table 7 exhibit a sharp contrast between P&C and life companies:
P&C firms disproportionately sell their downgraded ABS holdings. This may very well be a
consequence of the regulatory accounting treatment we document in Section 3.1. Since P&C
companies are forced to book the losses that result from severe downgrades, they would be
indifferent between holding the asset at the lower value and selling it. More importantly, these
trading dynamics may be the result of the interactions between those accounting rules and the
regulatory capital requirements. For P&C insurers, selling the speculative-grade asset has an
important advantage from the regulatory point of view, as they are exchanging a very risky asset
for cash (or even a less risky asset) thereby reducing their capital requirements.
3.3 Propensity to Gains Trade
In this section, we assess insurance companies’ propensity to gains trade, defined as selectively
selling the positions in the book that have high unrealized gains, when they hold these positions at
amortized historical costs. So far we have established that P&C insurers are more likely to
revalue the downgraded ABS to market prices and have a higher propensity to sell them relative
to life insurers. Given that both P&C and life firms have roughly similar exposures to
downgraded ABS securities, and thus a similar impact on their regulatory capital, this begs the
question as to the actions taken by life insurers in response to this hit on their regulatory capital.
In continuing to hold their downgraded ABS positions, life companies may have the
advantage of limiting an unfavorable price impact and avoiding the realization of losses, but
additional capital may still be required. It is precisely here that gains trading becomes important.
As a life firm attempts to sell its existing assets that have not been downgraded to shore up its
capital, it has an incentive to do so by selectively selling those assets that have the largest

23
unrealized gains. Only by selling these assets can these large unrealized gains be recognized and
be applied to its capital.
Life companies engaging in gains trading have different asset classes from which to
choose. It would be natural to consider government bonds which feature heavily in insurance
companies’ portfolio. However, selling government bonds does little to assist from a regulatory
capital point of view because they are free from capital requirement. Insurance companies also
hold equities, but we do not consider these positions since equities are held at market value. The
other natural positions to consider are (mostly investment-grade) corporate bonds28, a significant
number of which are carried at unrealized gains, as shown in Table 5. Another advantage of
selling corporate bonds is that the insurance company will exchange a risky asset for cash,
thereby reducing the required regulatory capital.
We model the probability of selling each corporate bond position as a logistic function:
)()1Pr( ,,,,0,, qWqjYqiXqjiZqji WYXZlS (3)
where )(l denotes the logistic probability function, qjiS ,, is an indicator variable that equals one if
the insurance company j (holding bond i) sells bond i in calendar quarter q and zero otherwise,
qjiZ ,, is the percentile (ranging from 0 to 1) of unrealized gain of corporate bond i in the portfolio
of insurance company j at the year-end prior to quarter q, qiX , is a vector of bond i’s static
characteristics and time-varying characteristics at the beginning of quarter q, qjY , is a vector of
financial and risk characteristics of insurance company j at the year-end prior to quarter q, qW is a
vector of time-specific variables for quarter q, and s' are the corresponding vectors of
coefficients to be estimated. The results are shown in Table 8.
[Insert Table 8 here]
We start by comparing the results during the crisis period for life insurers, shown in
columns (1) and (2), with those for P&C insurers, shown in columns (7) and (8). Considering the 28 On balance, there are various reasons to believe that corporate bonds will be preferred to equity for gains trading. First, insurance companies are significant investors in corporate bonds. Schultz (2001) and Ellul et al. (2011) estimate that insurance companies collectively hold between one-third and forty percent of investment-grade corporate bonds. At a weight of around 8%, equities represent a much smaller segment of insurance companies’ portfolios. Finally, and most importantly, equities are held at market value, and thus gains trading is not possible.

24
first row in Panel A, assuming that the insurance firms do not have high ABS exposure and low
RBC ratio (hence all interaction terms are zero), we find that life companies have a positive and
statistically significant propensity to sell corporate bonds at higher levels of unrealized gains.
Interestingly, the same coefficient is negative for P&C firms. When we compare the propensity
of life and P&C insurers during the non-crisis periods (results shown in columns (3) and (4) for
life and columns (9) and (10) for P&C), we also find a significant difference between the two
groups. In normal times, life insurers are actually less likely to sell bonds with high unrealized
gains (possibly to avoid tax)29 while P&C firms’ trading is insensitive to unrealized gains.
Overall, life insurers appear to engage in gains trading only during the crisis period, while they
tend to sell their corporate bonds with the lowest unrealized gains during the non-crisis period.
No such behavior is detected for P&C companies.
We next investigate the impact of each insurance company’s exposure to ABS assets held
at amortized historical cost on the propensity to engage in gains trading. We have argued that
this is precisely a factor that may lead insurance companies to gains trade. We find that while life
insurers with high ABS exposure (held at book values) sell more frequently corporate bonds
(possibly just turning over their portfolios more often) in general (second row), they do not appear
more likely to gains trade during the crisis (third row of columns (1) and (2)). These life firms
tend to sell corporate bonds with the lowest unrealized gains during the non-crisis period (third
row of columns (3) and (4)). These life firms thus change their behavior from the non-crisis
period (selling of corporate bonds with lowest unrealized gains) to the crisis period. Interestingly,
the results for P&C also confirm that gains trading is associated with HCA. Recall that the
variable “High ABS exposure dummy” refers to ABS held at amortized historical cost. Thus,
even in P&C companies, high exposure to ABS held under HCA should still induce gains trading.
For both life and P&C companies, however, our unreported results show that the incremental
effects of ABS exposure on gains trading are economically very small (less than 0.3% probability
as we move from the 25th to 75th percentiles of unrealized gain).
The other important dimension to consider in the decision to gains trade is the regulatory
capital pressure that each insurance company faces at times of severe downgrades. We explore
this additional dimension by investigating the impact of the firm-level RBC ratio. Recall from
Section 2 that the RBC ratio is the ratio of total adjusted statutory capital to NAIC risk-based
capital. The insurance literature views RBC ratios as indicative of financial health rather than 29 See Jin (2006).
25
categorical (e.g. above or below two is not a sole criterion for regulatory scrutiny) and the higher
is the ratio the lower are the regulatory constraints.
To fully understand the dynamics of the interactions between accounting treatment and
regulatory capital, we use three different variables: (a) an indicator variable to capture insurance
companies with low RBC, defined as the RBC ratios in the bottom quartile of the distribution, (b)
an interaction term between the low RBC ratio indicator and the unrealized gains percentile, and
(c) a triple interaction term between the low RBC ratio indicator, the unrealized gains percentile
and the high ABS exposure held at amortized historical cost indicator variable. We find evidence
indicative of the impact of the interaction between accounting treatment and capital regulations.
While life insurers with low RBC ratio and high ABS exposure are more likely to engage in gains
trading during the crisis, we find no such behavior for P&C companies.
So far, we have investigated the trading behavior of insurance firms during crisis and non-
crisis periods, separately. We also estimate the propensity to engage in gains trading for the
entire sample for life insurers, in columns (5) and (6), and for P&C insurers, in columns (11) and
(12). In such specifications we introduce a crisis indicator variable and interact this indicator with
other variables of interest. This pooled specification broadly confirms the evidence in the time-
separate estimations. First, life insurers appear to engage in gains trading during the crisis period,
whereas the coefficient estimate for P&C is found to be negative. Second, the quadruple
interaction term (in row 14) where we interact the crisis indicator with the low RBC ratio
indicator, the unrealized gains percentile, and the high ABS exposure held at historical cost
indicator confirms that life companies facing regulatory constraints and holding significant ABS
positions under HCA disproportionately sell corporate bonds with high unrealized gains during
the crisis. No such action is observed for P&C companies.
Given the non-linear nature of the logistic function and our heavy use of interaction terms,
a more accurate way to understand the sign, magnitude, and economic significance of these
results, is to investigate the marginal effects (estimated via simulation). Panel B of Table 8
provides the estimates of the marginal effects using the models for the entire sample period
(shown in columns (5) and (6) for life and columns (11) and (12) for P&C). We estimate the
marginal effects on gains trading considering two cases for each group: (a) insurers with low
exposure to ABS held at historical costs and high RBC ratios (denoted as “High ABS exposure
dummy = 0 and Low RBC ratio dummy = 0” in Panel B), and (b) insurers with high exposure to
ABS held at historical costs and low RBC ratios (denoted as “High ABS exposure dummy = 1
26
and Low RBC ratio dummy = 1” in Panel B). Note that the average selling probability of a
corporate bond held by life companies over the entire period is 4.2%. Consider two similar
corporate bonds held by a life firm with high ABS exposure and low RBC ratio, one with
unrealized gain at the 25th percentile of the firm’s portfolio and the other with unrealized gain at
the 75th percentile. Using the estimates from model (5), the second bond is significantly less
likely than the first bond to be sold during the non-crisis period (by 1.0%) but is significantly
more likely during the crisis (by 1.3%). The difference is equivalent to an increase of the
probability of selling by 2.3%, almost 55 percentage points of the average selling probability for
the entire period. Similar results are obtained when we estimate the marginal effects using the
model shown in columns (6) in Panel A. In sharp contrast, all the marginal effects for corporate
bonds held by P&C companies are statistically and economically insignificant, confirming the
indicative results found in Panel A. While we find that life companies with low ABS exposure
and high RBC ratio also engage in gains trading during the crisis, the effect is much smaller than
that found among the companies with high ABS exposure and low RBC ratio. This result is
consistent with the important interplay between regulatory capital and accounting treatments.
It is also important to note that the probability of gains trading of life insurers is robust to
the inclusion of a host of control variables that may be associated with selling for unrelated
reasons. Panel C reports the marginal effects of control variables, where the effects are calculated
by moving the value of continuous variable from the 25th to 75th percentiles or moving the value
of dummy variables from 0 to 1. The first notable variable is liquidity. The corporate bond
literature has found that bid-ask spreads increase with bond age and decrease with bond issue size
(see Edwards, Harris and Piwowar (2007)).30 In all specifications, we include the log of the
corporate bond age and the log of the corporate bond issue size and thus liquidity considerations
should not drive our results. The signs of these liquidity control variables indicate that insurance
companies are more likely to sell younger bonds and bonds with larger issue size. One
interpretation of these results is that insurers actively try to minimize any negative price impact by
avoiding the sale of illiquid corporate bonds.
Other significant control variables include an indicator that measures whether the position
is revalued at the previous year-end, an indicator that measures whether the bond is downgraded
to the speculative class during the quarter, an indicator that captures whether the bond issuer filed
30 See also Hong and Warga (2000) and Schultz (2001). Driessen (2005) uses bond age to identify the liquidity component of credit spreads.
27
for bankruptcy during the quarter, and depending on specifications, the proportion of risky assets
in an insurer’s portfolio (capturing the insurer’s risk appetite or its capacity to bear risk) as well as
the insurer’s book leverage. Bonds that are revalued at the previous year-end are about 0.8-4%
more likely to be sold, consistent with the result for ABS. Bonds that are downgraded to the
speculative grade or bonds of the issuers that recently go into bankruptcy are 5-24% more likely
to be sold. This may be due to the differential degrees of negative information across rating
classes or the regulation that imposes much higher capital charge for holding speculative-grade
bonds, consistent with the findings of Ellul et al. (2011). Finally, we find only weak evidence
that insurers with higher leverage and insurers with higher risk appetite or higher capacity to bear
risk (as proxied by their risky asset holdings) are more likely to sell corporate bonds.
It is important to note that the above results are obtained after the inclusion of year-quarter
dummies, U.S. state (of domicile) dummies and rating group dummies. Thus, our results cannot
be driven by market-wide conditions that occur during the time of downgrades, other regulations
faced by insurance companies, which differ across U.S. states, or ratings of the bonds.
Finally, we perform two additional robustness checks, not tabulated for brevity. First, we
examine our results separately for public and private insurance firms. While the majority of the
insurers in our sample are private, some are publicly listed. Public firms have to disclose
unrealized gains/losses (under accumulated other comprehensive income) in their annual reports,
as the majority of bond positions are classified as “available for sale” and hence marked to market
under GAAP (as opposed to the statutory accounting principles highlighted here). This disclosure
may alter the incentives generated by HCA vs. MTM as they interact with regulation. However,
we find broadly similar results for both private and public insurers, suggesting that our findings
are general and not driven by the disclosure requirement. Second, we examine whether gains
trading is driven by the difference in leverage between life and P&C firms, rather than the
difference in regulatory accounting rules (life insurers have significantly higher leverage than
P&C insurers, as reported in Table 1). We repeat our analysis for the groups of life and P&C
firms with leverage between 0.58 (25th percentile of P&C firms) and 0.96 (75th percentile of life
firms). The results are similar to those reported above, suggesting the driving factors are separate
from leverage. Together, these additional tests show that our results are robust and consistent
with the hypothesis that different accounting rules, as they are used for capital regulation, can
alter incentives and thus trading behavior of financial institutions.
28
4. Portfolio and Price Distortions
So far, we have shown that HCA – precisely because of its interaction with capital regulations –
induces life insurers to engage in gains trading during the massive waves of ABS downgrades
observed during the financial crisis. In this section, we investigate further whether such gains
trading leads to (a) distortions in the insurers’ portfolio allocation, and (b) price impacts in the
corporate bond market.
4.1 Distortions in Portfolio Allocations
The significant ABS downgrades observed during the crisis reflect the elevated risk profile of this
asset class, in general; even those ABS that were not downgraded, on average, suffered sizeable
price declines (and were carried by life insurers, on average, as unrealized losses). To maintain
the same risk-return profile as in the pre-crisis period, both life and P&C insurers should reduce
their portfolio allocation to ABS (holding constant the overall rating and maturity allocation and
hence the capital requirement). Furthermore, this reduction should be most pronounced for
insurers with relatively low RBC ratios because they are most sensitive to elevated risk and
vulnerable to further market declines. The question then is whether regulatory accounting rules
interfere in any significant way with this process.
We investigate this question by regressing the proportion of ABS held by each insurance
company on year dummies during the period 2007-2010 (our event period) and their interactions
with a life insurer dummy variable. This allows us to analyze the general evolution of ABS
holdings over the event period and to capture any differences in the behavior of life insurers
relative to P&C insurers. The benchmark period is the average ABS holdings of each company
over the years 2004-2006. We include insurance company fixed effects in all specifications, thus
explicitly controlling for any unobserved heterogeneity in ABS holdings at the company level.
[Insert Table 9]
We first investigate these dynamics for the entire sample of insurance companies (Column
(1)) and then separately for each of the RBC ratio quartiles (Columns (2) to (5)) in Panel A of
Table 9. Starting from the entire sample, the ABS holdings of P&C insurers increase slightly
(0.8% of portfolio) in 2007 over the average holdings in the benchmark period but decrease
29
markedly as the crisis unfolds (-0.4% in 2008, -1.4% in 2009, and -1.8% in 2010). The ABS
holdings of life insurers follow a significantly different trajectory. In 2007, life insurers also
increase their ABS holdings, albeit with a larger magnitude. In the subsequent years, unlike P&C
firms, life firms do not seem to significantly reduce their ABS allocations. For example, life
insurers do not decrease their ABS exposure in 2008 and only reduce it by 0.2% (compared to the
average during the benchmark period) in 2009.
Moving to the results in Columns (2) to (5) of Table 9 Panel A, it is evident that the slow
pace of reduction in ABS allocations of life insurers is concentrated among those with the lowest
RBC ratios (Column (2)), i.e. those that are financially weak and hence most sensitive to risk and
further reductions in the value of their positions. This evidence is consistent with the finding in
Section 3 that life insurance companies with low RBC ratios and high ABS exposures are most
likely to engage in gains trading in their corporate bond holdings. These companies avoid selling
ABS in fear of realizing the extreme losses that we document in Table 5, which would further
impair their statutory capitals. On the contrary, P&C insurers appear to reduce their ABS
exposure at essentially the same speed across RBC ratio groups.
By failing to recognize changes in the fair value of assets, HCA may induce a wedge
between financial institutions’ reported capital ratios, e.g., the RBC ratios in the case of insurance
companies, and the hypothetical ratios that might better reflect market conditions. We investigate
this issue in Panel B of Table 9. For each insurer at each year end, we calculate a market-adjusted
RBC ratio by adding the unrealized gains and losses on all securities held at historical costs to the
firm’s reported statutory capital, the numerator of RBC ratio. In Column (1), we present the mean
difference between the market-adjusted RBC ratio and the reported RBC ratio for all life and
P&C insurers. For P&C insurers, the difference is close to zero even when we look at the 25th
percentile (shown in Column (2)). The same cannot be said for life insurers: there are several
years in which the differences between the market-adjusted and reported RBC ratios are sizeable.
In 2004 and 2010, the market-adjusted RBC ratio is larger than the reported RBC ratio, on
average. The opposite is true in 2008, at the height of the crisis, where the reported RBC ratio of
an average life insurer is larger than the market-adjusted RBC by 3.4 (5.1 at the 25th percentile).
We benchmark these differences against the RBC ratios reported in Table 1 (for year 2007). The
mean RBC ratio for life insurers would have decreased from 9.1 to 5.7, a significant change,
under fair value accounting. Thus, to the extent that fair values contain relevant information, life
insurers as a group appear significantly healthier in 2008 than they actually were. More
30
importantly, when we look at life insurers in the bottom 25th percentile, we find that their average
RBC ratio would have decreased from 4.7 to 2.0 had fair value accounting been employed. Given
the regulatory threshold of 2, many of these life insurers would have been placed under regulatory
intervention.
We next investigate the relationship between the difference in insurers’ market-adjusted
and reported RBC and their ABS holdings. As an asset class, ABS suffer extremely large
unrealized losses during the crisis, as reported in Table 5, and therefore life insurers with large
ABS holdings should have the reported RBC ratios that are significantly above the market-
adjusted counterparts. Causality may also flow in the other direction; the results in panel A imply
life insurers with large difference between the market-adjusted and the reported RBC ratios
should have incentives not to reduce their ABS holdings. To investigate this association, we rank
life insurers into quartiles according to their portfolio allocations, with lowest ABS exposures in
Column (3) and the highest in Column (6). Focusing on year 2008, in which the difference
between market-adjusted and reported RBC ratios is most negative, we find a striking
confirmation of our conjecture: the difference between the market-adjusted and the reported RBC
ratios increases in the level of ABS exposure. In fact, life insurers with the lowest ABS holdings
would have been practically unaffected had fair value accounting been used while those with the
highest allocation to ABS would have seen their RBC ratios decrease by 6.21 in 2008.
Before proceeding, it should be acknowledged the extent to which market values may fail
to convey value relevant information in particularly illiquid markets is important for how one
interprets these deviations. In particular, one consequence of MTM accounting for a market-
adjusted RBC ratio involves potentially marking illiquid assets based upon short-run deviations
from fundamental values; related concerns for financial regulation are expressed in Heaton,
Lucas, and McDonald (2010). Regardless, the evidence presented above demonstrates clearly
that the incentives for life insurers induced by the interplay between HCA and capital regulations
leaves many of these insurers with an overweight position in underperforming ABS. To the
extent that fair values contain any value relevant information, these insurers are potentially in a
far less healthy financial position than the standard RBC metric would imply. Even if we cannot
say definitely what the correct RBC ratio should be, the sizeable nature of these deviations
constructed from our novel position-level data suggests, at a minimum, the potential for
significant distortions in the regulatory ratios that currently play a critical role in financial
regulation. Future research is clearly warranted.

31
4.2 Price Impact of Gains Trade
The final question we address is whether the selective selling in Section 3.3 creates enough
pressure in the targeted corporate bonds to distort prices. In the case that such price pressures do
occur, one can conclude that HCA – precisely because of its interactions with capital regulation –
does not avoid spillovers and fire sales, as claimed by the existing theoretical literature.
We compare the quarterly return across bonds that are subject to different degrees of gains
trading.31 Schultz (2001) and Ellul et al. (2011) estimate that insurers collectively hold between
one-third and forty percent of investment-grade corporate bonds. If a large number of insurance
companies attempt to gains trade using the same corporate bonds in an illiquid market, then we
should expect the bonds to suffer significant price pressures. Using the transaction prices from
TRACE, we calculate the quarterly return of a bond as the logged change in price from the last
day of the previous quarter to the last day of the current quarter. This return measure is far from
perfect. First, corporate bonds do not trade every day so the last day on which we observe trades
for each bond may often be a few days before quarter-end. We however find that for the bonds in
our data that pass our screen, approximately 90% of the last trading days that we use fall in the
last month of the quarter. Second, the holding period over which we measure the bond return
may be greater than one or two quarters (if the bond is last traded a few quarters back). This
problem affects less than 5% of the observations. We address these two problems, which result in
irregular holding periods, by measuring the values of (some) control variables over the same
period in which the bond return is measured. Finally, a bond may trade a few times in a day and
the trade prices can be very different.32 Since corporate bond prices are more accurate for larger
trades, we use the size-weighted average of all trade prices on the last day of a quarter.
Our model of quarterly bond return is as follows:
qiqWqiXqi WXR ,,0, (4)
31 In earlier versions of this paper, we reported transaction price impacts and showed that they increase in gains-trading selling pressure during the crisis for life insurers but not for P&C insurers. As we move from the 25th to 75th percentiles of selling pressure for life companies, the price impact increases by 9-15 basis points. This price impact is sizable, considering that the mean one-way transaction costs are about 15 basis points in normal markets (see Edwards et al. (2007)). 32 See Bao, Pan, and Wang (2011), Feldhutter (2011), and Jotikasthira (2008), for example.

32
Where qiR , is the return of bond i in quarter q, qiX , is a vector of bond static and time-varying
characteristics at the beginning of quarter q, qW is a vector of time-specific variables (including
the Treasury and rating- and maturity-matched credit spread returns) for quarter q, and s' are
the corresponding vectors of coefficients to be estimated.
Our variable of interest is the selling pressure associated with unrealized gains, which we
measure in two broad ways. First, we use the bond-level averaged marginal effects of unrealized
gain on selling probability. The marginal effect for each bond position is calculated as the
predicted value (relative to mean) obtained from the logit model similar to column (2) in Table 8,
estimated separately for each calendar quarter. For each bond in each quarter, we then take
(value-weighted or equally-weighted) averages of the marginal effects across the positions of all
insurance companies in the particular bond. Second, we also consider the percentage unrealized
gains, averaged across all positions in the bond. Although this measure does not reflect the fact
that the same unrealized gains may have different effects on selling propensity for different
insurance companies, it is not affected by possible misspecifications of our logit model. These
selling pressures from gains trading enter the model as part of the vector qiX , .
We distinguish the effect of gains trading from other effects of unrealized gains by
interacting our measures of selling pressure with the crisis indicator. The selling pressure from
gains trading should only operate during the crisis where insurers are hit by ABS downgrades and
the huge unrealized losses of ABS positions in their portfolios. We only include the pressure
from life firms, as we have shown in Table 8 that P&C firms do not appear to significantly gains
trade.
We estimate the above model (5) by OLS, and cluster the standard errors by bond issuer.
We include standard control variables for the fundamental movement in the bond price, using
maturity-matched Treasury and rating- and maturity-matched credit spread returns. We use the
interpolated constant maturity Treasury bond/note from the Fed to calculate the Treasury return.
The spread return is the corporate bond index return minus the Treasury return, where we use the
rating- and maturity-matched Bank of America-Merrill Lynch bond index as our primary source.
Since the maturity group for the index is broad, we also adjust for the duration difference between
the index and the bond of interest to ensure accuracy. Finally, we control for bond-specific
characteristics, particularly bond age and issue size, which are key determinants of bond liquidity.
Rating group and calendar quarter dummies are also included. The results are shown in Table 10.
33
[Insert Table 10 here]
We find clear evidence that the corporate bonds disproportionately targeted by life
insurance companies for gains trading statistically and economically underperform otherwise
similar bonds. The coefficient estimate of the interaction variable of interest (the crisis indicator
interacted with gains-trading selling pressure) is always negative whether we use an equal-
weighted or a value-weighted methodology and whether we use marginal effects of unrealized
gain on selling probability (columns (1) to (4)) or the percentage unrealized gains (columns (5) to
(8)).
Depending on specification, the average quarterly return for the entire stress period is 0.7
to 1.3% lower as we move from the 25th to 75th percentiles of aggregated gains trading. Given
that the inter-quartile range of quarterly bond abnormal return is approximately 5%, the
magnitude of the selling pressure is economically significant. While this effect is relatively
modest as compared to extant research on fire sales, there are two observations worth making.
First, the price impact of gains trading, measured at the quarterly frequency, may be mitigated by
the fact that the insurers buy back some of these bonds, or very close substitutes, after the gains
have been realized.33 Second, while interesting, the reported figure is an average price impact that
may mask significant time-series differences. For instance, one might expect the price effects to
be large and relatively easy to detect in 2009, as Figure 1 shows that the second and third quarters
of that year exhibit the largest number of downgrades of the ABS held by insurance companies.
This is indeed the case – in 2009, the average quarterly return is 1.1 to 5% lower as we move
from the 25th to 75th percentiles of gains-trading propensity.
In sum, it is important to put these results in perspective: the selling pressure is generated
by gains trading engaged in by life companies. This originates, in part, from their exposure to
ABS held at amortized historical cost. We are thus documenting some evidence of price declines
in the corporate bond market, thereby demonstrating spillover effects from downgraded ABS to
33 On average, life (P&C) insurers buy about 4% (3%) of the same bonds back within 3 months after selling. Further, this number increases to about 30% (20%) if we consider substitute bonds with the same credit rating (for example, A+) and with maturity within ±1 year of the bond sold. As these are rather illiquid markets, purchases of substitute bonds may generate price effects in the original bond as traders extract what information they can from related trading activity. This appears rather like a wash sale, but for the sole purpose of realizing an accounting gain.
34
otherwise unrelated corporate bonds through the interaction between the accounting treatment and
regulatory capital requirements.
5. Conclusions
While the theoretical literature has argued that historical cost accounting may insulate financial
institutions from the price distortions associated with market stress, we provide new empirical
evidence supporting the view that historical cost accounting, along with regulatory capital
requirements, induces an altered incentive to “gains trade” – that is, to selectively sell otherwise
unrelated assets with high unrealized gains. Given (a) the distinction in regulatory accounting
treatment across life and property and casualty insurance companies and (b) the availability of
security-level data on all positions held, traded, and booked by insurers, the insurance industry
presents an interesting laboratory to explore the interplay between accounting and regulatory
capital requirements for financial institutions.
In contrast to property and casualty insurers, life insurers have a greater degree of
regulatory flexibility to hold downgraded instruments at historical cost. When faced with severe
downgrades among their holdings in asset-backed securities (ABS) during the financial crisis, life
insurers, particularly those facing both regulatory capital constraints and high ABS exposures,
largely continue to hold the downgraded securities at historical cost and instead selectively sell
their unrelated corporate bond holdings with the highest unrealized gains. This behavior is largely
absent among property and casualty insurers. Finally, we observe some potential distortions
associated with the incentives created by the accounting regime. Under HCA, life insurers, on
average, maintain sizeable allocations to significantly underperforming ABS; the deviations
between their reported and market-adjusted RBC ratios are large suggesting possible distortions in
the metric used for financial regulation. Second, as the observed gains trading by life insurers
induces price declines for the corporate bonds that happen to exhibit high unrealized gains, we
conclude that historical cost accounting does not completely avoid illiquidity spillovers.
References
Allen F. and E. Carletti, 2008, Mark-to-market accounting and cash-in-the-market pricing, Journal of Accounting and Economics 45, 358-378.
Anand, A., P. J. Irvine, A. Puckett, and K. Venkataraman, 2010, Market crashes and institutional trading, working paper, University of Georgia.

35
Bao, J., J. Pan, and J. Wang, 2011, The illiquidity of corporate bonds, Journal of Finance, forthcoming.
Beatty, A., S. L. Chamberlain, and J. Magliolo. 1995. Managing financial reports of commercial banks: The influence of taxes, regulatory capital earnings, Journal of Accounting Research 33, 231-261.
Berger, A.N., R.J. Herring, and G.P. Szego, 1995, The role of capital in financial institutions, Journal of Banking and Finance 19, 393-430.
Berry-Stolzle, T.R., G.P. Nini, and S. Wende, 2012, External financing in the life insurance industry: Evidence from the financial crisis, working paper, University of Georgia.
Bleck, A., and X. Liu, 2007, Market transparency and accounting regimes, Journal of Accounting Research 45, 229-256.
Boyson, N., J. Helwege, and J. Jindra, 2011, Crises, liquidity shocks, and fire sales at financial institutions, working paper, University of South Carolina.
Bratsberg, B., O. Raaum and K. Røed, 2010, When minority labor migrants meet the welfare state, Journal of Labor Economics 28, 633-676.
Carey, M., 1994, Snacking and smoothing: Gains trading of investment account securities by commercial banks, working paper, Board of Governors of the Federal Reserve System.
Driessen, J., 2005, Is default event risk priced in corporate bonds? Review of Financial Studies 18, 165-195.
Duffie, D., 2010, Presidential address: Asset price dynamics with slow-moving capital, Journal of Finance 65, 1237-1267.
Eccher, E. A., K. Ramesh, and S. R. Thiagarajan, 1996, Fair value disclosures by bank holding companies, Journal of Accounting and Economics 22, 79-117.
Edwards, A., L. Harris, and M. Piwowar, 2007, Corporate bond market transaction costs and transparency, Journal of Finance 63, 1421-1451.
Ellul, A., C. Jotikasthira, and C. Lundblad, 2011, Regulatory pressure and fire sales in the corporate bond market, Journal of Financial Economics, 2011, 101, 596-620.
Feldhutter, P., 2011, The same bond at different prices: Identifying search frictions and selling pressures, Review of Financial Studies, forthcoming.
Goh, B.W., Ng, J., and Yong, K.O., 2009, Market pricing of banks' fair value assets reported under SFAS 157 during the 2008 economic crisis, working paper, Singapore Management University.
Heaton, J., D. Lucas, and R. McDonald, 2010, Is mark-to-market accounting destabilizing? Analysis and implications for policy, Journal of Monetary Economics 57, 64-75.
Hirst, D., and P. Hopkins, 1998, Comprehensive income reporting and analysts’ valuation judgments, Journal of Accounting Research 36 (Supplement), 47–75.
Hirst, D., P. Hopkins, and J. Wahlen, 2004, Fair values, income measurement, and bank analysts’ risk and valuation judgments, The Accounting Review 79, 453–472.
Hong, G., and A. Warga, 2000, An empirical study of bond market transactions, Financial Analysts Journal 56, 32-46.
Jin, L., 2006, Capital gains tax overhang and price pressure, Journal of Finance 61, 1399-1431.
Jotikasthira, C., 2008, Does search friction really matter? Evidence from the corporate bond market, working paper, University of North Carolina at Chapel Hill.
Kashyap, A. K. and J. C. Stein, 2000, What do a million observations on banks say about the transmission of monetary policy? American Economic Review 90, 407-428.
36
Laux, C., and C. Leuz, 2009, The crisis of fair-value accounting: Making sense of the recent debate, Accounting, Organizations and Society 34, 826–834.
Laux, C., and C. Leuz, 2010, Did fair-value accounting contribute to the financial crisis? Journal of Economic Perspectives 24, 93–118.
Lee, Y-J, K.R. Petroni, and M. Shen (2006), Cherry picking, disclosure quality, and comprehensive income reporting choices: The case of property-liability insurers, Contemporary Accounting Research 23, 655–692.
Manconi, A, M. Massa, and A. Yasuda, 2010, The behavior of intoxicated investors: The role of institutional investors in propagating the crisis of 2007-2008, Journal of Financial Economics, forthcoming.
Merrill, C.B., T.D. Nadauld, R.M. Stulz, and S.M. Sherlund, 2012, Did capital requirement and fair value accounting spark fire sales in distressed mortgage-backed securities?, working paper, Ohio State University.
Nissim, D., 2011, Relative valuation of U.S. insurance companies, Review of Accounting Studies, forthcoming.
Norton, E., H, Wang, and C. Ai, 2004, Computing interaction effects and standard errors in logit and probit models, The STATA Journal 4, 154-167.
Penman, S. H., 2007, Financial reporting quality: Is fair value a plus or a minus? Accounting and Business Research Special Issue: International Accounting Policy Forum, 33-44.
Petroni, K.R., and J.M. Wahlen, 1995, Fair values of equity and debt securities and share prices of property-liability insurers, Journal of Risk and Insurance, 62, 719-737.
Plantin, G., H. Sapra, and H. Shin, 2008, Marking-to-market: Panacea or Pandora's box? Journal of Accounting Research 46, 435-460.
Sapra, H., 2008, Do accounting measurement regimes matter? A discussion of mark-to-market accounting and liquidity pricing, Journal of Accounting and Economics 45, 379-387.
Scheve, K. F., and M. J. Slaughter, 1999, What determines individual trade-policy preferences? NBER working paper.
Scholes, M. S., G. P. Wilson, and M. A. Wolfson, 1990, Tax planning, regulatory capital planning, and financial reporting strategy for commercial banks, Review of Financial Studies 3, 625-650.
Schultz, P., 2001, Corporate bond trading costs: A peek behind the curtain, Journal of Finance 56, 677-698.
SEC, 2011, 2011 Summary Report of Commission Staff's examinations of each nationally recognized statistical rating organization, U.S. Securities and Exchange Commission, September 2011.
Veron, N., 2008, Fair value accounting is the wrong scapegoat for this crisis, European Accounting Review 5, 63-69.
Wallison, P.J., 2008, Fair value accounting: A critique, Financial Services Outlook, American Enterprise Institute for Public Policy Research, July 2008.
Wyatt, A. (1991). The SEC says: mark to market! Accounting Horizons 5, 80-84.

37
Appendix A: Descriptions of Variables
Variable Specific to Definition % risky assets Insurer-year Percentage of investment assets invested in any of the following asset classes: non-
investment grade bonds, common and preferred stocks, non-performing mortgages, real estate, and other investments. According to Weiss Ratings and NAIC, the target capital percentages for these assets are greater than or equal to those of the least risky class of non-investment grade bonds (BB).
ABS exposure Insurer-year Percentage of bond portfolio invested in asset-backed securities (ABS) held at book value, measured in market value terms. Securities (9-digit CUSIPs) are classified as ABS, based on the list of rated securities from S&P’s RatingIquery. High ABS exposure dummy equals 1 for ABS exposures above the annual median, and 0 otherwise.
Bankruptcy dummy
Bond-quarter Dummy variable equal to 1 if the issuer of the bond files for bankruptcy during the quarter, and 0 otherwise.
Bond age Bond-quarter Time from issuance to the beginning of quarter of interest or the beginning of quarter in which the interested transactions fall (depending on specifications), measured in years.
Bond return Bond-quarter Log of change in prices from the last day when there are any trades of a bond in the previous quarter to the last day in the current quarter, scaled by a factor of 100. Abnormal bond return is calculated as the residual of pooled OLS regression of bond return on maturity matched treasury return and maturity- and rating-matched corporate bond index return over the same quarter. Corporate bond index return is calculated using Bank of America-Merrill Lynch bond index, adjusted for duration difference between the index and the bond of interest.
Calendar quarter fixed effects
Quarter Set of dummy variables for calendar quarters in which the observations fall.
Capital and surplus
Insurer-year The insurance company’s statutory net worth (including paid-in capital or unimpaired surplus and additional funds in surplus) in millions of dollars through the most recent year end.
Crisis dummy Quarter Dummy variable equal to 1 if the calendar quarters are in the 2007-2009 crisis period, and 0 otherwise. The crisis period is defined based on the volume of ABS downgrades, and covers 2007Q3 to 2009Q4.
Downgrade dummy
Bond-quarter Dummy variable equal to 1 if the bond is downgraded from investment to non-investment grades during the quarter, and 0 otherwise. S&P ratings are used wherever available. Moody’s ratings are used when S&P ratings are unavailable.
Incremental effect of unrealized gain on selling probability
Position-quarter or Bond-quarter
Position-quarter incremental effect of unrealized gain on selling probability is predicted value for each bond position (relative to mean) obtained from the logit model similar to model (2) in Table 8, estimated separately for each calendar quarter. Bond-quarter incremental effect of unrealized gain on selling probability is value-weighted or equally-weighted average of position-quarter incremental effects, where the average is taken across all insurers holding the bond at the beginning of the quarter.
Issue size Bond Offering amount of the bond, measured in million dollars. Leverage Insurer-year Debt as percentage of total assets, all measured at book values. Liquidity index *,**
Insurer-year Weiss Ratings’s index that measures the insurance company’s ability to raise cash to settle claims. The inability to raise cash may arise when the company is owed a great deal of money from its agents or reinsurers, or it cannot sell its investments at the prices at which the investments are valued in the company’s financial statements. Low liquidity index dummy equals 1 for liquidity index values below 5, and 0 otherwise.
Maturity Bond-quarter Maturity of the bond at the beginning of quarter of interest or the beginning of quarter in which the interested transactions fall (depending on specifications), measured in years.
NAIC risk-based capital ratio (RBC
Insurer-year Ratio of total adjusted capital (capital, surplus, and applicable valuation reserves) to NAIC risk-based capital (RBC). RBC is the minimum amount of capital that the

38
Variable Specific to Definition Ratio) insurance company must maintain based on the inherent risks in its operations.
RBC is calculated based on the NAIC’s formula which reflects its assessment of risks of different asset classes and businesses. For example, a company with RBC ratio of 1.0 has capital equal to its RBC. Insurance companies with higher RBC ratios are considered better capitalized. Insurance companies with RBC ratio below 2.0 are subject to supervisory interventions. The levels of supervisory actions depend on the level of RBC ratio. Low RBC ratio dummy equals 1 for RBC ratios below the annual median, and 0 otherwise.
Rating group fixed effects
Bond-quarter Set of dummy variables for credit rating groups, defined by the NAIC’s capital requirement in the RBC ratio formula. The groups are, in order of credit quality, A and above, BBB, BB, and B and below. S&P ratings are used wherever available. Moody’s ratings are used when S&P ratings are unavailable.
Revalue dummy Position-year Dummy variable equal to 1 if the position has the book value that is equal to its reported fair or market value, and 0 otherwise.
ROE Insurer-year Return on equity, measured as net income divided by book value of equity at the beginning of the year. Positive ROE dummy equals 1 if ROE is greater than zero, and 0 otherwise.
Sell dummy (dependent variable in logit)
Position-quarter
Dummy variable equal to 1 if part or all of the position is sold during the quarter, and 0 otherwise.
Selling probability Position-quarter or Bond-quarter
Position-quarter selling probability is predicted selling probability for each bond position obtained from the logit model similar to model (2) in Table 8, estimated separately for each calendar quarter. Bond-quarter selling probability is value-weighted or equally-weighted average of position-quarter selling probabilities, where the average is taken across all insurers holding the bond at the beginning of the quarter.
State fixed effects Insurer-year Set of dummy variables for insurers’ domicile states. Unrealized gain (and loss)
Position-year Difference between insurer’s reported fair value and book-adjusted carrying value of the position at previous year end, measured as percentage of book value. Unrealized gain percentile is the percentile rank, ranging from 0 to 1, of the position’s dollar unrealized gain within the insurer’s portfolio at previous year end.
* Weiss Ratings’ may not evaluate some insurance companies for one or more of the following reasons: (i) total assets are less than $1 million, (ii) premium income for the current year is less than $100,000, (iii) the company functions almost exclusively as a holding company rather than as an underwriter, or (iv) Weiss Ratings does not have enough information to reliably evaluate the company. ** Scores range from 1 to 10. Scores of 7 to 10, 5 to 6.9, 3 to 4.9, and 2.9 and below are considered “strong”, “good”, “fair”, and “weak”, respectively.
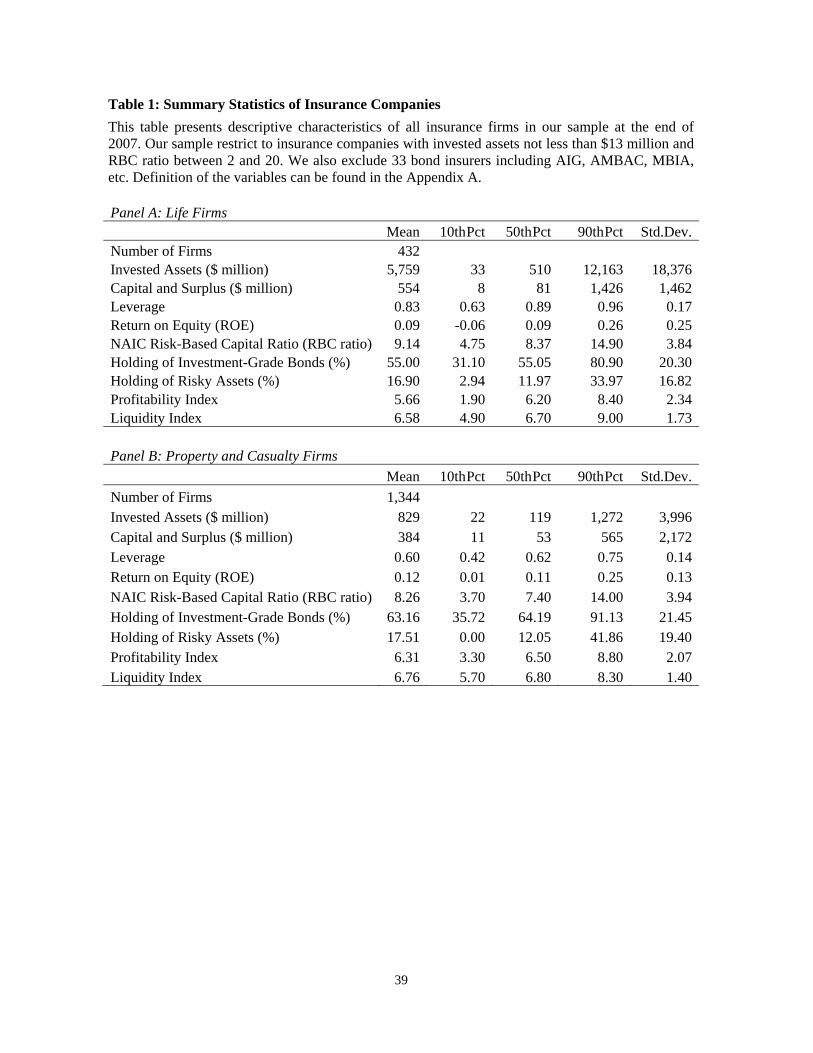
39
Table 1: Summary Statistics of Insurance Companies
This table presents descriptive characteristics of all insurance firms in our sample at the end of 2007. Our sample restrict to insurance companies with invested assets not less than $13 million and RBC ratio between 2 and 20. We also exclude 33 bond insurers including AIG, AMBAC, MBIA, etc. Definition of the variables can be found in the Appendix A. Panel A: Life Firms Mean 10th Pct 50th Pct 90th Pct Std.Dev.Number of Firms 432Invested Assets ($ million) 5,759 33 510 12,163 18,376Capital and Surplus ($ million) 554 8 81 1,426 1,462Leverage 0.83 0.63 0.89 0.96 0.17Return on Equity (ROE) 0.09 -0.06 0.09 0.26 0.25NAIC Risk-Based Capital Ratio (RBC ratio) 9.14 4.75 8.37 14.90 3.84Holding of Investment-Grade Bonds (%) 55.00 31.10 55.05 80.90 20.30Holding of Risky Assets (%) 16.90 2.94 11.97 33.97 16.82Profitability Index 5.66 1.90 6.20 8.40 2.34Liquidity Index 6.58 4.90 6.70 9.00 1.73
Panel B: Property and Casualty Firms
Mean 10th Pct 50th Pct 90th Pct Std.Dev.
Number of Firms 1,344Invested Assets ($ million) 829 22 119 1,272 3,996Capital and Surplus ($ million) 384 11 53 565 2,172Leverage 0.60 0.42 0.62 0.75 0.14Return on Equity (ROE) 0.12 0.01 0.11 0.25 0.13NAIC Risk-Based Capital Ratio (RBC ratio) 8.26 3.70 7.40 14.00 3.94Holding of Investment-Grade Bonds (%) 63.16 35.72 64.19 91.13 21.45Holding of Risky Assets (%) 17.51 0.00 12.05 41.86 19.40Profitability Index 6.31 3.30 6.50 8.80 2.07Liquidity Index 6.76 5.70 6.80 8.30 1.40
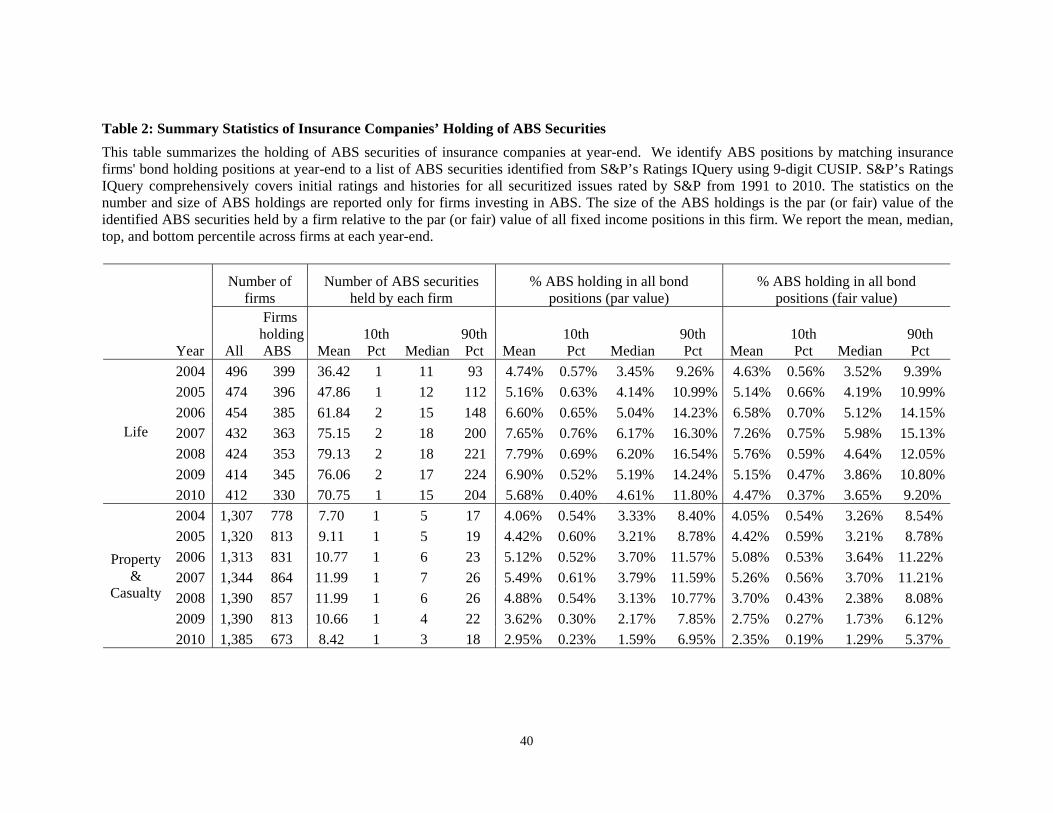
40
Table 2: Summary Statistics of Insurance Companies’ Holding of ABS Securities
This table summarizes the holding of ABS securities of insurance companies at year-end. We identify ABS positions by matching insurance firms' bond holding positions at year-end to a list of ABS securities identified from S&P’s Ratings IQuery using 9-digit CUSIP. S&P’s Ratings IQuery comprehensively covers initial ratings and histories for all securitized issues rated by S&P from 1991 to 2010. The statistics on the number and size of ABS holdings are reported only for firms investing in ABS. The size of the ABS holdings is the par (or fair) value of the identified ABS securities held by a firm relative to the par (or fair) value of all fixed income positions in this firm. We report the mean, median, top, and bottom percentile across firms at each year-end.
Number of
firms Number of ABS securities
held by each firm % ABS holding in all bond
positions (par value) % ABS holding in all bond
positions (fair value)
Year All
Firms holding ABS Mean
10th Pct Median
90th Pct Mean
10th
Pct Median 90th
Pct Mean 10th
Pct Median 90th
Pct
Life
2004 496 399 36.42 1 11 93 4.74% 0.57% 3.45% 9.26% 4.63% 0.56% 3.52% 9.39%
2005 474 396 47.86 1 12 112 5.16% 0.63% 4.14% 10.99% 5.14% 0.66% 4.19% 10.99%
2006 454 385 61.84 2 15 148 6.60% 0.65% 5.04% 14.23% 6.58% 0.70% 5.12% 14.15%
2007 432 363 75.15 2 18 200 7.65% 0.76% 6.17% 16.30% 7.26% 0.75% 5.98% 15.13%
2008 424 353 79.13 2 18 221 7.79% 0.69% 6.20% 16.54% 5.76% 0.59% 4.64% 12.05%
2009 414 345 76.06 2 17 224 6.90% 0.52% 5.19% 14.24% 5.15% 0.47% 3.86% 10.80%
2010 412 330 70.75 1 15 204 5.68% 0.40% 4.61% 11.80% 4.47% 0.37% 3.65% 9.20%
Property &
Casualty
2004 1,307 778 7.70 1 5 17 4.06% 0.54% 3.33% 8.40% 4.05% 0.54% 3.26% 8.54%
2005 1,320 813 9.11 1 5 19 4.42% 0.60% 3.21% 8.78% 4.42% 0.59% 3.21% 8.78%
2006 1,313 831 10.77 1 6 23 5.12% 0.52% 3.70% 11.57% 5.08% 0.53% 3.64% 11.22%
2007 1,344 864 11.99 1 7 26 5.49% 0.61% 3.79% 11.59% 5.26% 0.56% 3.70% 11.21%
2008 1,390 857 11.99 1 6 26 4.88% 0.54% 3.13% 10.77% 3.70% 0.43% 2.38% 8.08%
2009 1,390 813 10.66 1 4 22 3.62% 0.30% 2.17% 7.85% 2.75% 0.27% 1.73% 6.12%
2010 1,385 673 8.42 1 3 18 2.95% 0.23% 1.59% 6.95% 2.35% 0.19% 1.29% 5.37%
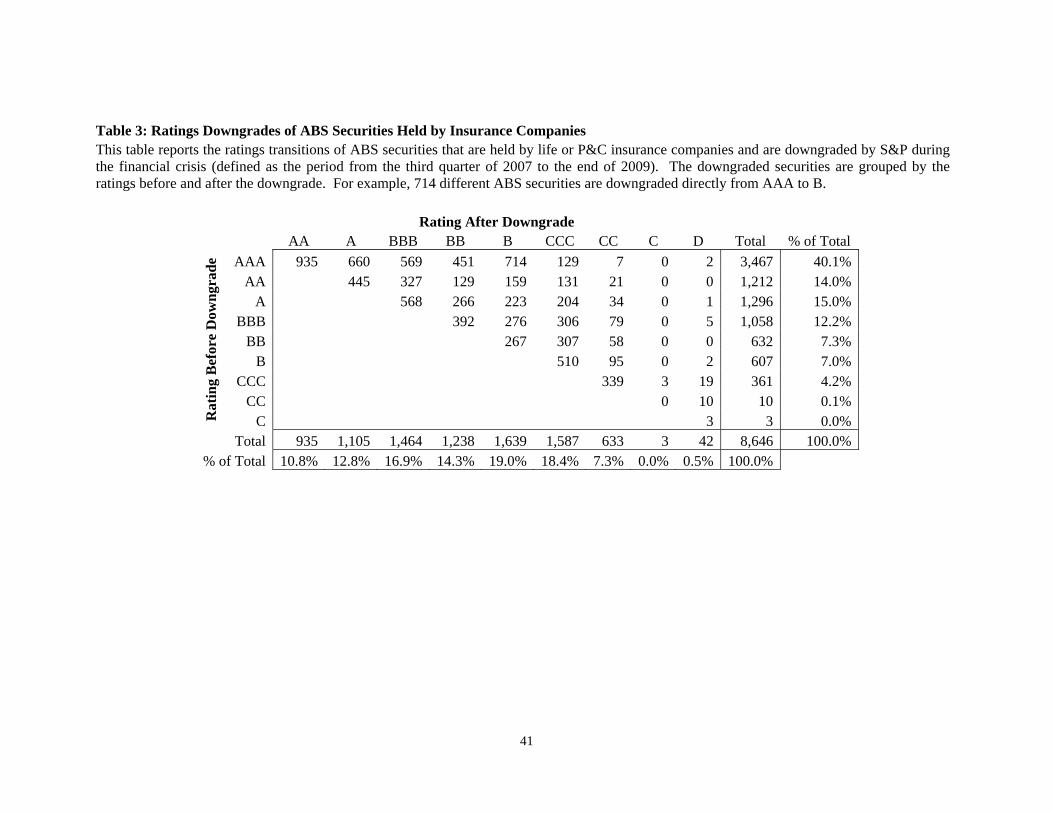
41
Table 3: Ratings Downgrades of ABS Securities Held by Insurance Companies This table reports the ratings transitions of ABS securities that are held by life or P&C insurance companies and are downgraded by S&P during the financial crisis (defined as the period from the third quarter of 2007 to the end of 2009). The downgraded securities are grouped by the ratings before and after the downgrade. For example, 714 different ABS securities are downgraded directly from AAA to B.
Rating After Downgrade AA A BBB BB B CCC CC C D Total % of Total
Rat
ing
Bef
ore
Dow
ngr
ade AAA 935 660 569 451 714 129 7 0 2 3,467 40.1%
AA 445 327 129 159 131 21 0 0 1,212 14.0%A 568 266 223 204 34 0 1 1,296 15.0%
BBB 392 276 306 79 0 5 1,058 12.2%BB 267 307 58 0 0 632 7.3%
B 510 95 0 2 607 7.0%CCC 339 3 19 361 4.2%
CC 0 10 10 0.1%C 3 3 0.0%
Total 935 1,105 1,464 1,238 1,639 1,587 633 3 42 8,646 100.0%% of Total 10.8% 12.8% 16.9% 14.3% 19.0% 18.4% 7.3% 0.0% 0.5% 100.0%
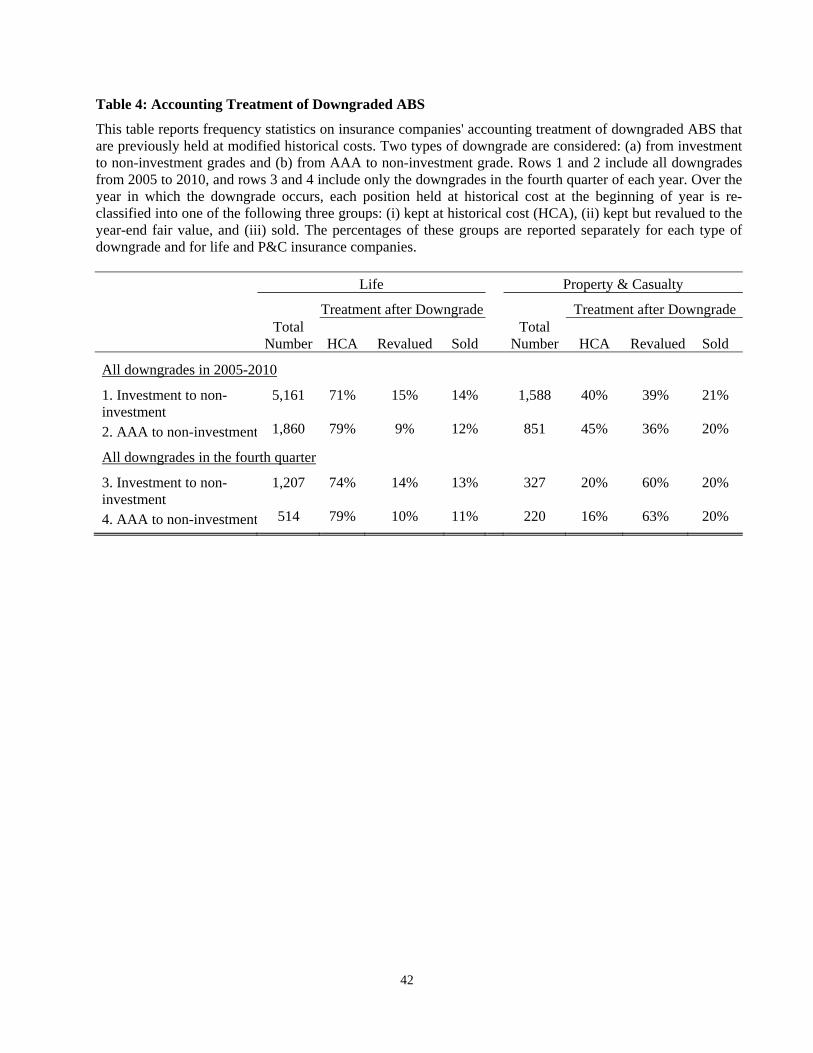
42
Table 4: Accounting Treatment of Downgraded ABS
This table reports frequency statistics on insurance companies' accounting treatment of downgraded ABS that are previously held at modified historical costs. Two types of downgrade are considered: (a) from investment to non-investment grades and (b) from AAA to non-investment grade. Rows 1 and 2 include all downgrades from 2005 to 2010, and rows 3 and 4 include only the downgrades in the fourth quarter of each year. Over the year in which the downgrade occurs, each position held at historical cost at the beginning of year is re-classified into one of the following three groups: (i) kept at historical cost (HCA), (ii) kept but revalued to the year-end fair value, and (iii) sold. The percentages of these groups are reported separately for each type of downgrade and for life and P&C insurance companies.
Life
Property & Casualty
Treatment after Downgrade Treatment after DowngradeTotal
Number HCA Revalued Sold
Total Number HCA Revalued Sold
All downgrades in 2005-2010
1. Investment to non-investment
5,161 71% 15% 14%
1,588 40% 39% 21%
2. AAA to non-investment 1,860 79% 9% 12%
851 45% 36% 20%
All downgrades in the fourth quarter
3. Investment to non-investment
1,207 74% 14% 13%
327 20% 60% 20%
4. AAA to non-investment 514 79% 10% 11%
220 16% 63% 20%
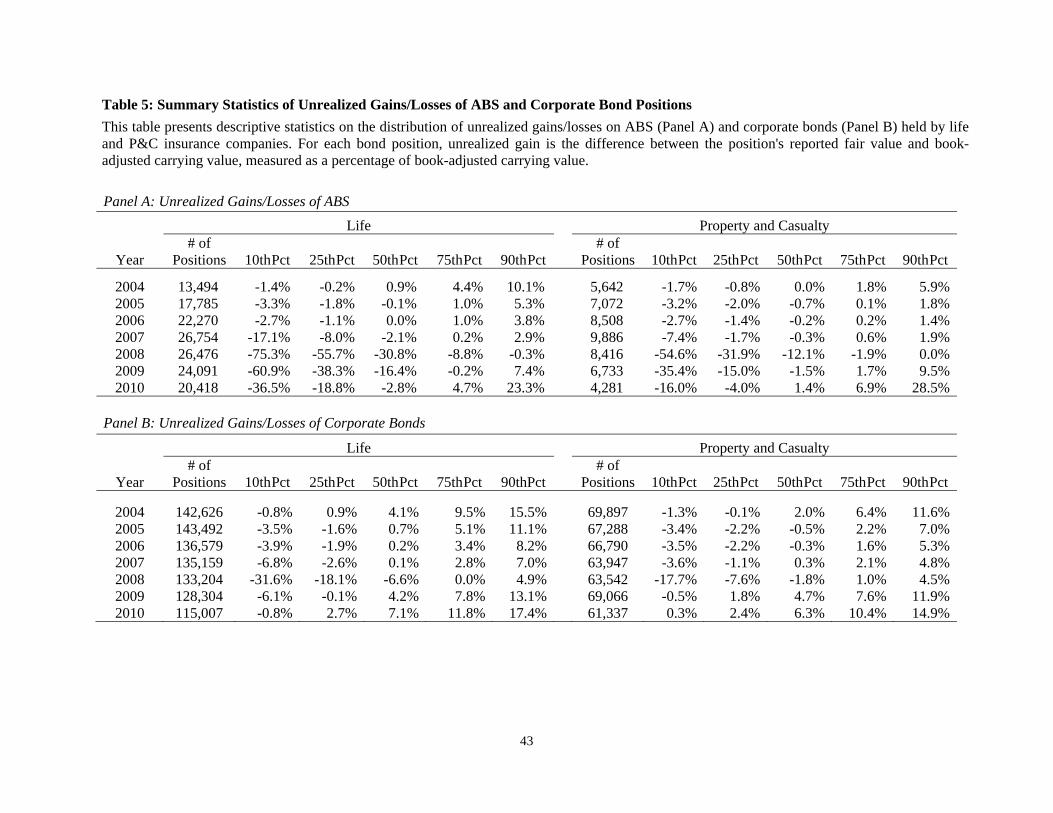
43
Table 5: Summary Statistics of Unrealized Gains/Losses of ABS and Corporate Bond Positions
This table presents descriptive statistics on the distribution of unrealized gains/losses on ABS (Panel A) and corporate bonds (Panel B) held by life and P&C insurance companies. For each bond position, unrealized gain is the difference between the position's reported fair value and book-adjusted carrying value, measured as a percentage of book-adjusted carrying value.
Panel A: Unrealized Gains/Losses of ABS
Life Property and Casualty
Year # of
Positions 10th Pct 25th Pct 50th Pct 75th Pct 90th Pct # of
Positions 10th Pct 25th Pct 50th Pct 75th Pct 90th Pct
2004 13,494 -1.4% -0.2% 0.9% 4.4% 10.1% 5,642 -1.7% -0.8% 0.0% 1.8% 5.9%2005 17,785 -3.3% -1.8% -0.1% 1.0% 5.3% 7,072 -3.2% -2.0% -0.7% 0.1% 1.8%2006 22,270 -2.7% -1.1% 0.0% 1.0% 3.8% 8,508 -2.7% -1.4% -0.2% 0.2% 1.4%2007 26,754 -17.1% -8.0% -2.1% 0.2% 2.9% 9,886 -7.4% -1.7% -0.3% 0.6% 1.9%2008 26,476 -75.3% -55.7% -30.8% -8.8% -0.3% 8,416 -54.6% -31.9% -12.1% -1.9% 0.0%2009 24,091 -60.9% -38.3% -16.4% -0.2% 7.4% 6,733 -35.4% -15.0% -1.5% 1.7% 9.5%2010 20,418 -36.5% -18.8% -2.8% 4.7% 23.3% 4,281 -16.0% -4.0% 1.4% 6.9% 28.5%
Panel B: Unrealized Gains/Losses of Corporate Bonds
Life Property and Casualty
Year # of
Positions 10th Pct 25th Pct 50th Pct 75th Pct 90thPct # of
Positions 10th Pct 25th Pct 50th Pct 75th Pct 90th Pct
2004 142,626 -0.8% 0.9% 4.1% 9.5% 15.5% 69,897 -1.3% -0.1% 2.0% 6.4% 11.6%2005 143,492 -3.5% -1.6% 0.7% 5.1% 11.1% 67,288 -3.4% -2.2% -0.5% 2.2% 7.0%2006 136,579 -3.9% -1.9% 0.2% 3.4% 8.2% 66,790 -3.5% -2.2% -0.3% 1.6% 5.3%2007 135,159 -6.8% -2.6% 0.1% 2.8% 7.0% 63,947 -3.6% -1.1% 0.3% 2.1% 4.8%2008 133,204 -31.6% -18.1% -6.6% 0.0% 4.9% 63,542 -17.7% -7.6% -1.8% 1.0% 4.5%2009 128,304 -6.1% -0.1% 4.2% 7.8% 13.1% 69,066 -0.5% 1.8% 4.7% 7.6% 11.9%2010 115,007 -0.8% 2.7% 7.1% 11.8% 17.4% 61,337 0.3% 2.4% 6.3% 10.4% 14.9%
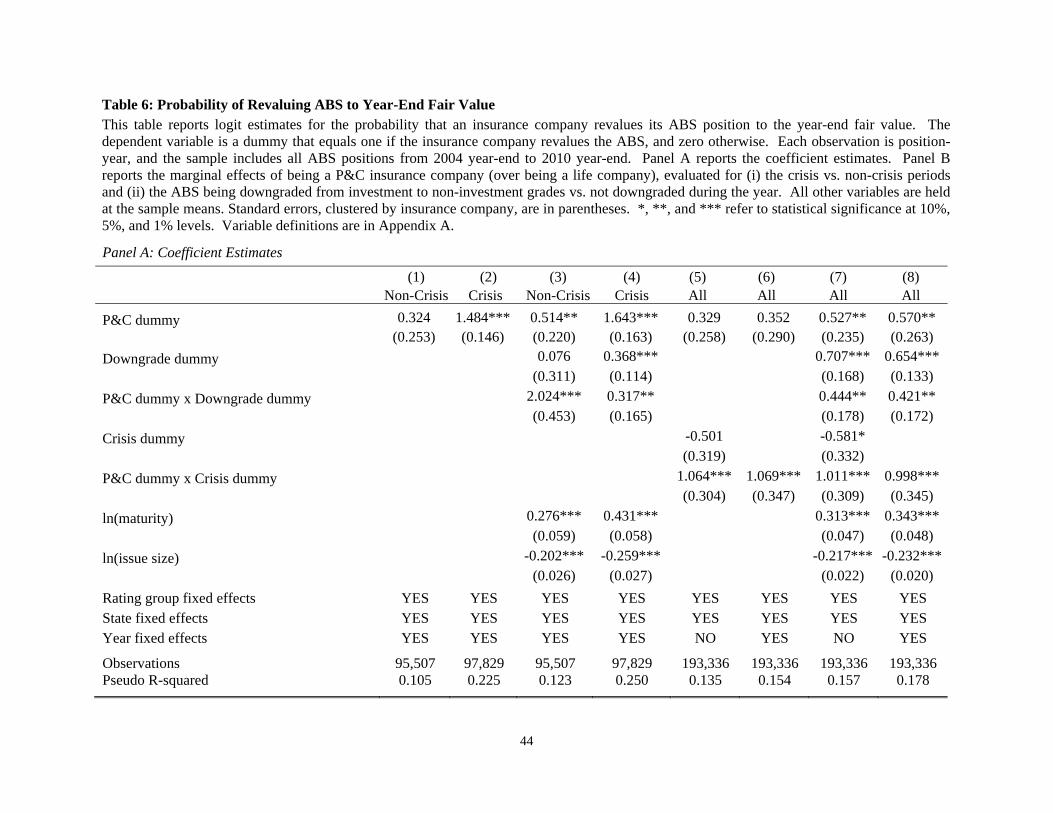
44
Table 6: Probability of Revaluing ABS to Year-End Fair Value This table reports logit estimates for the probability that an insurance company revalues its ABS position to the year-end fair value. The dependent variable is a dummy that equals one if the insurance company revalues the ABS, and zero otherwise. Each observation is position-year, and the sample includes all ABS positions from 2004 year-end to 2010 year-end. Panel A reports the coefficient estimates. Panel B reports the marginal effects of being a P&C insurance company (over being a life company), evaluated for (i) the crisis vs. non-crisis periods and (ii) the ABS being downgraded from investment to non-investment grades vs. not downgraded during the year. All other variables are held at the sample means. Standard errors, clustered by insurance company, are in parentheses. *, **, and *** refer to statistical significance at 10%, 5%, and 1% levels. Variable definitions are in Appendix A.
Panel A: Coefficient Estimates
(1) (2) (3) (4) (5) (6) (7) (8) Non-Crisis Crisis Non-Crisis Crisis All All All All
P&C dummy 0.324 1.484*** 0.514** 1.643*** 0.329 0.352 0.527** 0.570** (0.253) (0.146) (0.220) (0.163) (0.258) (0.290) (0.235) (0.263)
Downgrade dummy 0.076 0.368*** 0.707*** 0.654*** (0.311) (0.114) (0.168) (0.133)
P&C dummy x Downgrade dummy 2.024*** 0.317** 0.444** 0.421** (0.453) (0.165) (0.178) (0.172)
Crisis dummy -0.501 -0.581* (0.319) (0.332)
P&C dummy x Crisis dummy 1.064*** 1.069*** 1.011*** 0.998*** (0.304) (0.347) (0.309) (0.345)
ln(maturity) 0.276*** 0.431*** 0.313*** 0.343*** (0.059) (0.058) (0.047) (0.048)
ln(issue size) -0.202*** -0.259*** -0.217*** -0.232***(0.026) (0.027) (0.022) (0.020)
Rating group fixed effects YES YES YES YES YES YES YES YES State fixed effects YES YES YES YES YES YES YES YES Year fixed effects YES YES YES YES NO YES NO YES
Observations 95,507 97,829 95,507 97,829 193,336 193,336 193,336 193,336 Pseudo R-squared 0.105 0.225 0.123 0.250 0.135 0.154 0.157 0.178
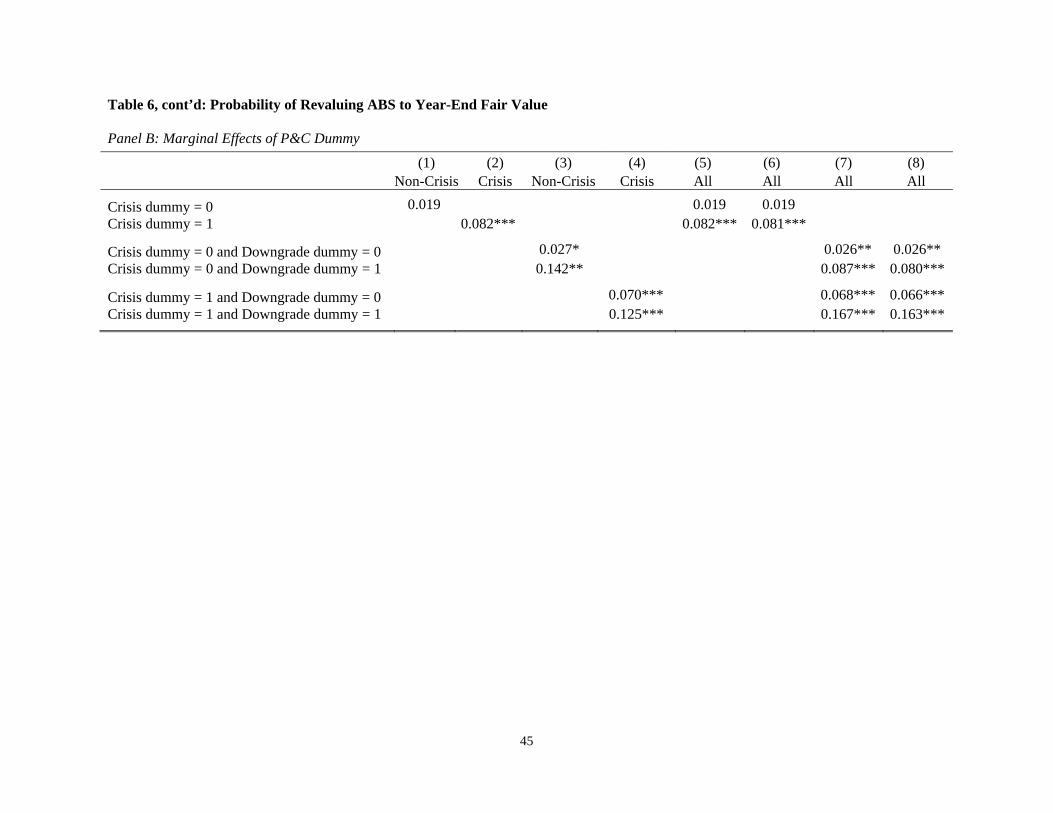
45
Table 6, cont’d: Probability of Revaluing ABS to Year-End Fair Value Panel B: Marginal Effects of P&C Dummy
(1) (2) (3) (4) (5) (6) (7) (8) Non-Crisis Crisis Non-Crisis Crisis All All All All
Crisis dummy = 0 0.019 0.019 0.019 Crisis dummy = 1 0.082*** 0.082*** 0.081***
Crisis dummy = 0 and Downgrade dummy = 0 0.027* 0.026** 0.026** Crisis dummy = 0 and Downgrade dummy = 1 0.142** 0.087*** 0.080***
Crisis dummy = 1 and Downgrade dummy = 0 0.070*** 0.068*** 0.066*** Crisis dummy = 1 and Downgrade dummy = 1 0.125*** 0.167*** 0.163***
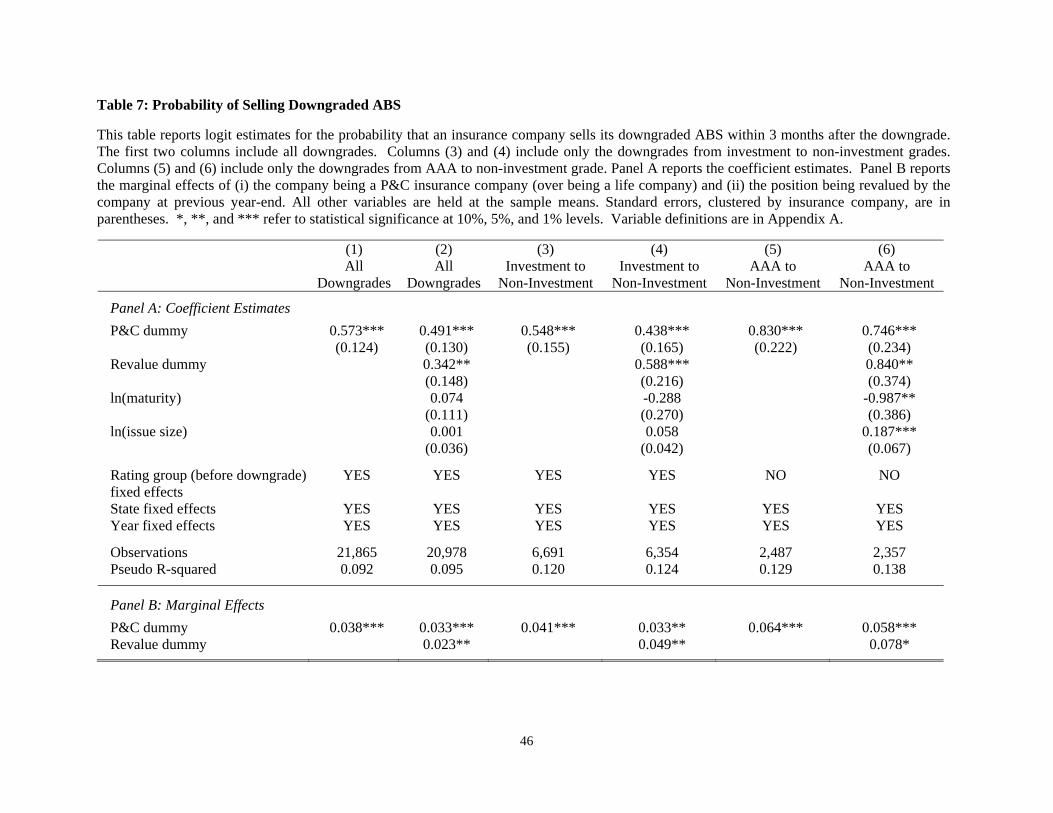
46
Table 7: Probability of Selling Downgraded ABS
This table reports logit estimates for the probability that an insurance company sells its downgraded ABS within 3 months after the downgrade. The first two columns include all downgrades. Columns (3) and (4) include only the downgrades from investment to non-investment grades. Columns (5) and (6) include only the downgrades from AAA to non-investment grade. Panel A reports the coefficient estimates. Panel B reports the marginal effects of (i) the company being a P&C insurance company (over being a life company) and (ii) the position being revalued by the company at previous year-end. All other variables are held at the sample means. Standard errors, clustered by insurance company, are in parentheses. *, **, and *** refer to statistical significance at 10%, 5%, and 1% levels. Variable definitions are in Appendix A.
(1) (2) (3) (4) (5) (6) All
Downgrades All
Downgrades Investment to
Non-Investment Investment to
Non-Investment AAA to
Non-Investment AAA to
Non-Investment
Panel A: Coefficient Estimates
P&C dummy 0.573*** 0.491*** 0.548*** 0.438*** 0.830*** 0.746*** (0.124) (0.130) (0.155) (0.165) (0.222) (0.234)
Revalue dummy 0.342** 0.588*** 0.840** (0.148) (0.216) (0.374)
ln(maturity) 0.074 -0.288 -0.987** (0.111) (0.270) (0.386)
ln(issue size) 0.001 0.058 0.187*** (0.036) (0.042) (0.067)
Rating group (before downgrade) fixed effects
YES YES YES YES NO NO
State fixed effects YES YES YES YES YES YES Year fixed effects YES YES YES YES YES YES
Observations 21,865 20,978 6,691 6,354 2,487 2,357 Pseudo R-squared 0.092 0.095 0.120 0.124 0.129 0.138
Panel B: Marginal Effects
P&C dummy 0.038*** 0.033*** 0.041*** 0.033** 0.064*** 0.058*** Revalue dummy 0.023** 0.049** 0.078*
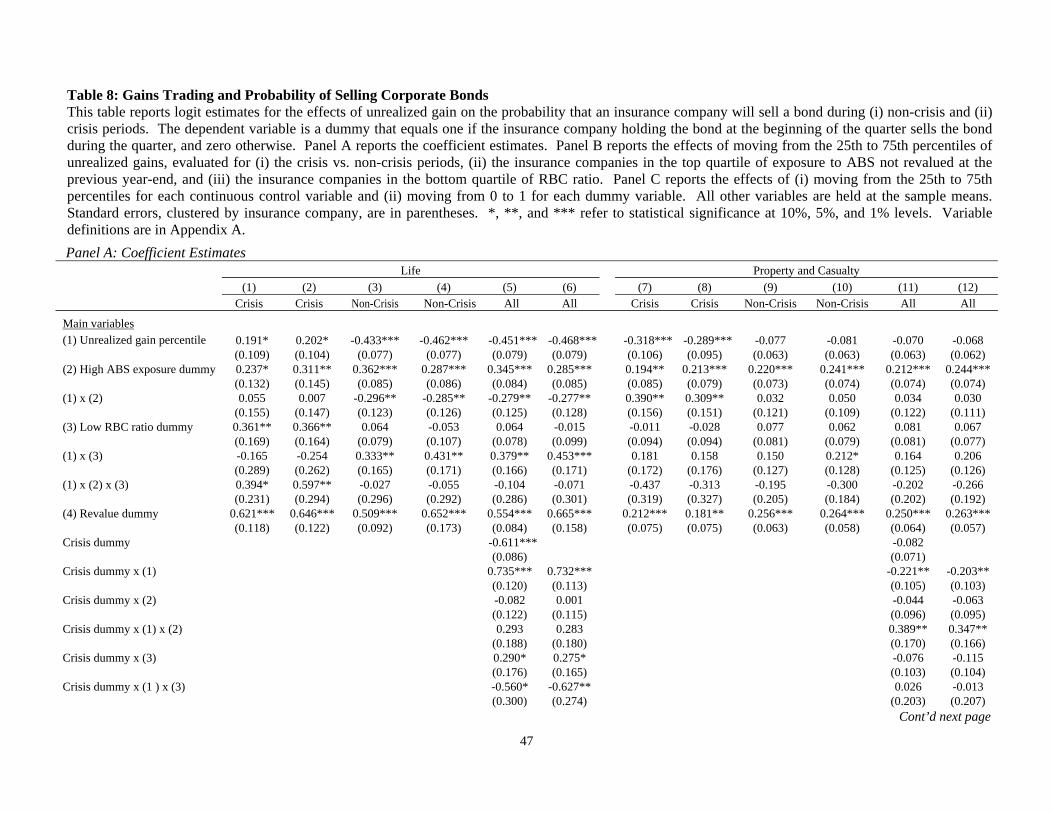
47
Table 8: Gains Trading and Probability of Selling Corporate Bonds This table reports logit estimates for the effects of unrealized gain on the probability that an insurance company will sell a bond during (i) non-crisis and (ii) crisis periods. The dependent variable is a dummy that equals one if the insurance company holding the bond at the beginning of the quarter sells the bond during the quarter, and zero otherwise. Panel A reports the coefficient estimates. Panel B reports the effects of moving from the 25th to 75th percentiles of unrealized gains, evaluated for (i) the crisis vs. non-crisis periods, (ii) the insurance companies in the top quartile of exposure to ABS not revalued at the previous year-end, and (iii) the insurance companies in the bottom quartile of RBC ratio. Panel C reports the effects of (i) moving from the 25th to 75th percentiles for each continuous control variable and (ii) moving from 0 to 1 for each dummy variable. All other variables are held at the sample means. Standard errors, clustered by insurance company, are in parentheses. *, **, and *** refer to statistical significance at 10%, 5%, and 1% levels. Variable definitions are in Appendix A.
Panel A: Coefficient Estimates
Life Property and Casualty
(1) (2) (3) (4) (5) (6) (7) (8) (9) (10) (11) (12) Crisis Crisis Non-Crisis Non-Crisis All All Crisis Crisis Non-Crisis Non-Crisis All All
Main variables (1) Unrealized gain percentile 0.191* 0.202* -0.433*** -0.462*** -0.451*** -0.468*** -0.318*** -0.289*** -0.077 -0.081 -0.070 -0.068
(0.109) (0.104) (0.077) (0.077) (0.079) (0.079) (0.106) (0.095) (0.063) (0.063) (0.063) (0.062) (2) High ABS exposure dummy 0.237* 0.311** 0.362*** 0.287*** 0.345*** 0.285*** 0.194** 0.213*** 0.220*** 0.241*** 0.212*** 0.244***
(0.132) (0.145) (0.085) (0.086) (0.084) (0.085) (0.085) (0.079) (0.073) (0.074) (0.074) (0.074) (1) x (2) 0.055 0.007 -0.296** -0.285** -0.279** -0.277** 0.390** 0.309** 0.032 0.050 0.034 0.030
(0.155) (0.147) (0.123) (0.126) (0.125) (0.128) (0.156) (0.151) (0.121) (0.109) (0.122) (0.111) (3) Low RBC ratio dummy 0.361** 0.366** 0.064 -0.053 0.064 -0.015 -0.011 -0.028 0.077 0.062 0.081 0.067
(0.169) (0.164) (0.079) (0.107) (0.078) (0.099) (0.094) (0.094) (0.081) (0.079) (0.081) (0.077) (1) x (3) -0.165 -0.254 0.333** 0.431** 0.379** 0.453*** 0.181 0.158 0.150 0.212* 0.164 0.206
(0.289) (0.262) (0.165) (0.171) (0.166) (0.171) (0.172) (0.176) (0.127) (0.128) (0.125) (0.126) (1) x (2) x (3) 0.394* 0.597** -0.027 -0.055 -0.104 -0.071 -0.437 -0.313 -0.195 -0.300 -0.202 -0.266
(0.231) (0.294) (0.296) (0.292) (0.286) (0.301) (0.319) (0.327) (0.205) (0.184) (0.202) (0.192) (4) Revalue dummy 0.621*** 0.646*** 0.509*** 0.652*** 0.554*** 0.665*** 0.212*** 0.181** 0.256*** 0.264*** 0.250*** 0.263***
(0.118) (0.122) (0.092) (0.173) (0.084) (0.158) (0.075) (0.075) (0.063) (0.058) (0.064) (0.057) Crisis dummy -0.611*** -0.082
(0.086) (0.071) Crisis dummy x (1) 0.735*** 0.732*** -0.221** -0.203**
(0.120) (0.113) (0.105) (0.103) Crisis dummy x (2) -0.082 0.001 -0.044 -0.063
(0.122) (0.115) (0.096) (0.095) Crisis dummy x (1) x (2) 0.293 0.283 0.389** 0.347**
(0.188) (0.180) (0.170) (0.166) Crisis dummy x (3) 0.290* 0.275* -0.076 -0.115
(0.176) (0.165) (0.103) (0.104) Crisis dummy x (1 ) x (3) -0.560* -0.627** 0.026 -0.013
(0.300) (0.274) (0.203) (0.207) Cont’d next page
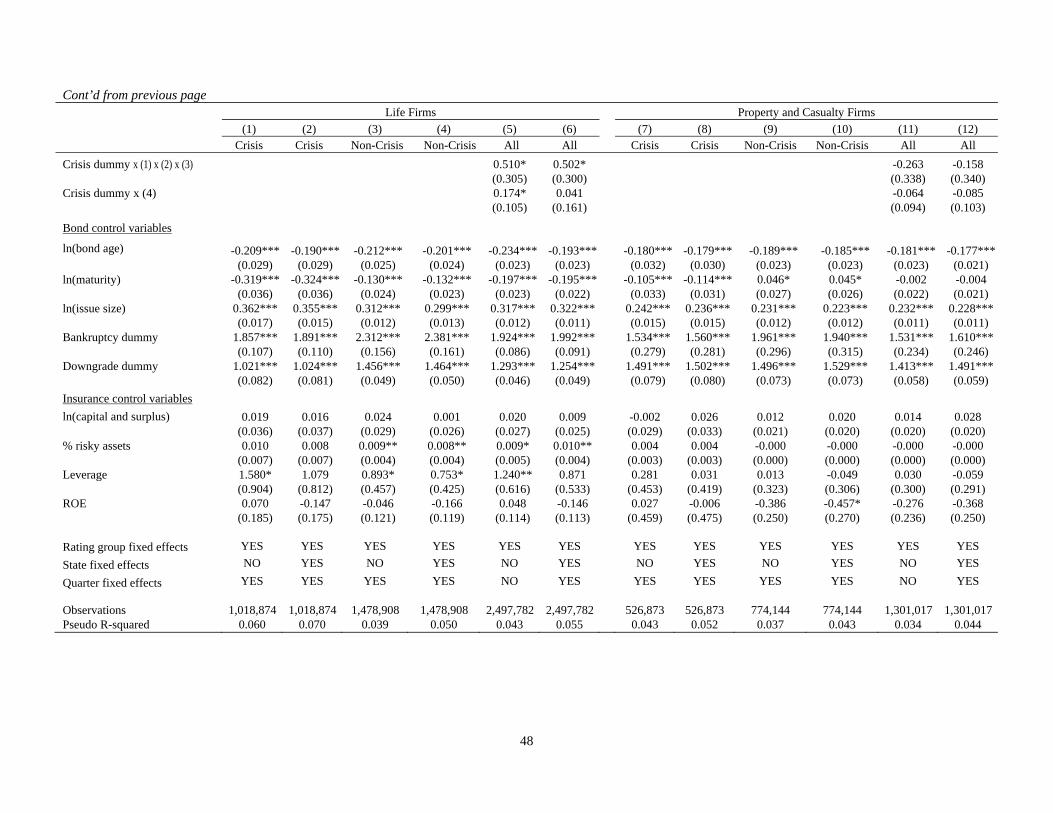
48
Cont’d from previous page Life Firms Property and Casualty Firms
(1) (2) (3) (4) (5) (6) (7) (8) (9) (10) (11) (12) Crisis Crisis Non-Crisis Non-Crisis All All Crisis Crisis Non-Crisis Non-Crisis All All
Crisis dummy x (1) x (2) x (3) 0.510* 0.502* -0.263 -0.158 (0.305) (0.300) (0.338) (0.340)
Crisis dummy x (4) 0.174* 0.041 -0.064 -0.085 (0.105) (0.161) (0.094) (0.103)
Bond control variables
ln(bond age) -0.209*** -0.190*** -0.212*** -0.201*** -0.234*** -0.193*** -0.180*** -0.179*** -0.189*** -0.185*** -0.181*** -0.177*** (0.029) (0.029) (0.025) (0.024) (0.023) (0.023) (0.032) (0.030) (0.023) (0.023) (0.023) (0.021)
ln(maturity) -0.319*** -0.324*** -0.130*** -0.132*** -0.197*** -0.195*** -0.105*** -0.114*** 0.046* 0.045* -0.002 -0.004 (0.036) (0.036) (0.024) (0.023) (0.023) (0.022) (0.033) (0.031) (0.027) (0.026) (0.022) (0.021)
ln(issue size) 0.362*** 0.355*** 0.312*** 0.299*** 0.317*** 0.322*** 0.242*** 0.236*** 0.231*** 0.223*** 0.232*** 0.228*** (0.017) (0.015) (0.012) (0.013) (0.012) (0.011) (0.015) (0.015) (0.012) (0.012) (0.011) (0.011)
Bankruptcy dummy 1.857*** 1.891*** 2.312*** 2.381*** 1.924*** 1.992*** 1.534*** 1.560*** 1.961*** 1.940*** 1.531*** 1.610*** (0.107) (0.110) (0.156) (0.161) (0.086) (0.091) (0.279) (0.281) (0.296) (0.315) (0.234) (0.246)
Downgrade dummy 1.021*** 1.024*** 1.456*** 1.464*** 1.293*** 1.254*** 1.491*** 1.502*** 1.496*** 1.529*** 1.413*** 1.491*** (0.082) (0.081) (0.049) (0.050) (0.046) (0.049) (0.079) (0.080) (0.073) (0.073) (0.058) (0.059)
Insurance control variables
ln(capital and surplus) 0.019 0.016 0.024 0.001 0.020 0.009 -0.002 0.026 0.012 0.020 0.014 0.028 (0.036) (0.037) (0.029) (0.026) (0.027) (0.025) (0.029) (0.033) (0.021) (0.020) (0.020) (0.020)
% risky assets 0.010 0.008 0.009** 0.008** 0.009* 0.010** 0.004 0.004 -0.000 -0.000 -0.000 -0.000 (0.007) (0.007) (0.004) (0.004) (0.005) (0.004) (0.003) (0.003) (0.000) (0.000) (0.000) (0.000)
Leverage 1.580* 1.079 0.893* 0.753* 1.240** 0.871 0.281 0.031 0.013 -0.049 0.030 -0.059 (0.904) (0.812) (0.457) (0.425) (0.616) (0.533) (0.453) (0.419) (0.323) (0.306) (0.300) (0.291)
ROE 0.070 -0.147 -0.046 -0.166 0.048 -0.146 0.027 -0.006 -0.386 -0.457* -0.276 -0.368 (0.185) (0.175) (0.121) (0.119) (0.114) (0.113) (0.459) (0.475) (0.250) (0.270) (0.236) (0.250)
Rating group fixed effects YES YES YES YES YES YES YES YES YES YES YES YES
State fixed effects NO YES NO YES NO YES NO YES NO YES NO YES
Quarter fixed effects YES YES YES YES NO YES YES YES YES YES NO YES
Observations 1,018,874 1,018,874 1,478,908 1,478,908 2,497,782 2,497,782 526,873 526,873 774,144 774,144 1,301,017 1,301,017 Pseudo R-squared 0.060 0.070 0.039 0.050 0.043 0.055 0.043 0.052 0.037 0.043 0.034 0.044
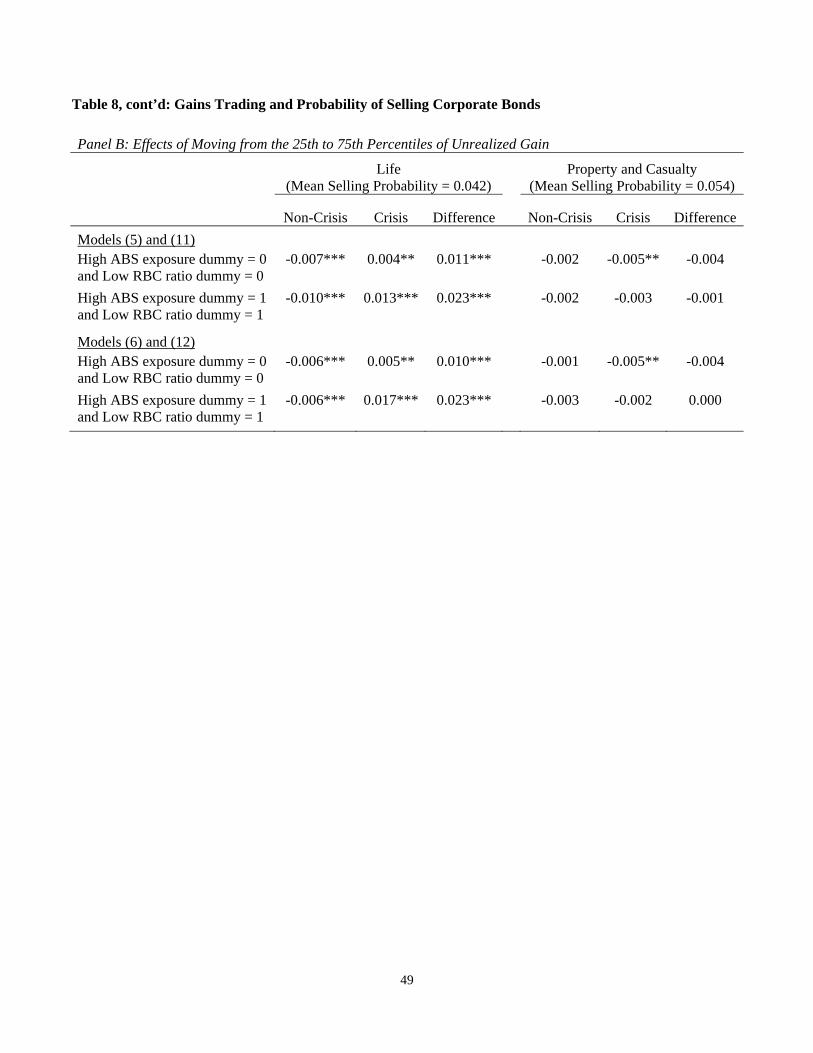
49
Table 8, cont’d: Gains Trading and Probability of Selling Corporate Bonds
Panel B: Effects of Moving from the 25th to 75th Percentiles of Unrealized Gain
Life (Mean Selling Probability = 0.042)
Property and Casualty (Mean Selling Probability = 0.054)
Non-Crisis Crisis Difference Non-Crisis Crisis Difference
Models (5) and (11) High ABS exposure dummy = 0 and Low RBC ratio dummy = 0
-0.007*** 0.004** 0.011*** -0.002 -0.005** -0.004
High ABS exposure dummy = 1 and Low RBC ratio dummy = 1
-0.010*** 0.013*** 0.023*** -0.002 -0.003 -0.001
Models (6) and (12) High ABS exposure dummy = 0 and Low RBC ratio dummy = 0
-0.006*** 0.005** 0.010*** -0.001 -0.005** -0.004
High ABS exposure dummy = 1 and Low RBC ratio dummy = 1
-0.006*** 0.017*** 0.023*** -0.003 -0.002 0.000
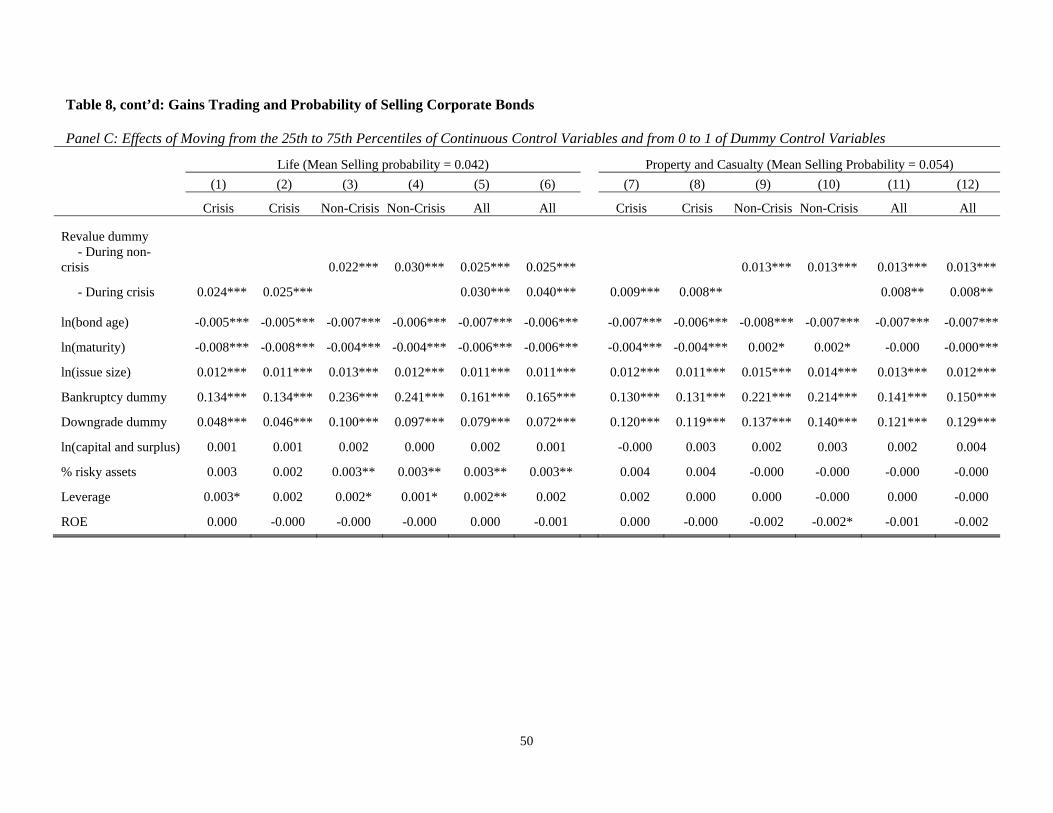
50
Table 8, cont’d: Gains Trading and Probability of Selling Corporate Bonds Panel C: Effects of Moving from the 25th to 75th Percentiles of Continuous Control Variables and from 0 to 1 of Dummy Control Variables
Life (Mean Selling probability = 0.042) Property and Casualty (Mean Selling Probability = 0.054)
(1) (2) (3) (4) (5) (6) (7) (8) (9) (10) (11) (12)
Crisis Crisis Non-Crisis Non-Crisis All All Crisis Crisis Non-Crisis Non-Crisis All All
Revalue dummy - During non-crisis 0.022*** 0.030*** 0.025*** 0.025*** 0.013*** 0.013*** 0.013*** 0.013***
- During crisis 0.024*** 0.025*** 0.030*** 0.040*** 0.009*** 0.008** 0.008** 0.008**
ln(bond age) -0.005*** -0.005*** -0.007*** -0.006*** -0.007*** -0.006*** -0.007*** -0.006*** -0.008*** -0.007*** -0.007*** -0.007***
ln(maturity) -0.008*** -0.008*** -0.004*** -0.004*** -0.006*** -0.006*** -0.004*** -0.004*** 0.002* 0.002* -0.000 -0.000***
ln(issue size) 0.012*** 0.011*** 0.013*** 0.012*** 0.011*** 0.011*** 0.012*** 0.011*** 0.015*** 0.014*** 0.013*** 0.012***
Bankruptcy dummy 0.134*** 0.134*** 0.236*** 0.241*** 0.161*** 0.165*** 0.130*** 0.131*** 0.221*** 0.214*** 0.141*** 0.150***
Downgrade dummy 0.048*** 0.046*** 0.100*** 0.097*** 0.079*** 0.072*** 0.120*** 0.119*** 0.137*** 0.140*** 0.121*** 0.129***
ln(capital and surplus) 0.001 0.001 0.002 0.000 0.002 0.001 -0.000 0.003 0.002 0.003 0.002 0.004
% risky assets 0.003 0.002 0.003** 0.003** 0.003** 0.003** 0.004 0.004 -0.000 -0.000 -0.000 -0.000
Leverage 0.003* 0.002 0.002* 0.001* 0.002** 0.002 0.002 0.000 0.000 -0.000 0.000 -0.000
ROE 0.000 -0.000 -0.000 -0.000 0.000 -0.001 0.000 -0.000 -0.002 -0.002* -0.001 -0.002
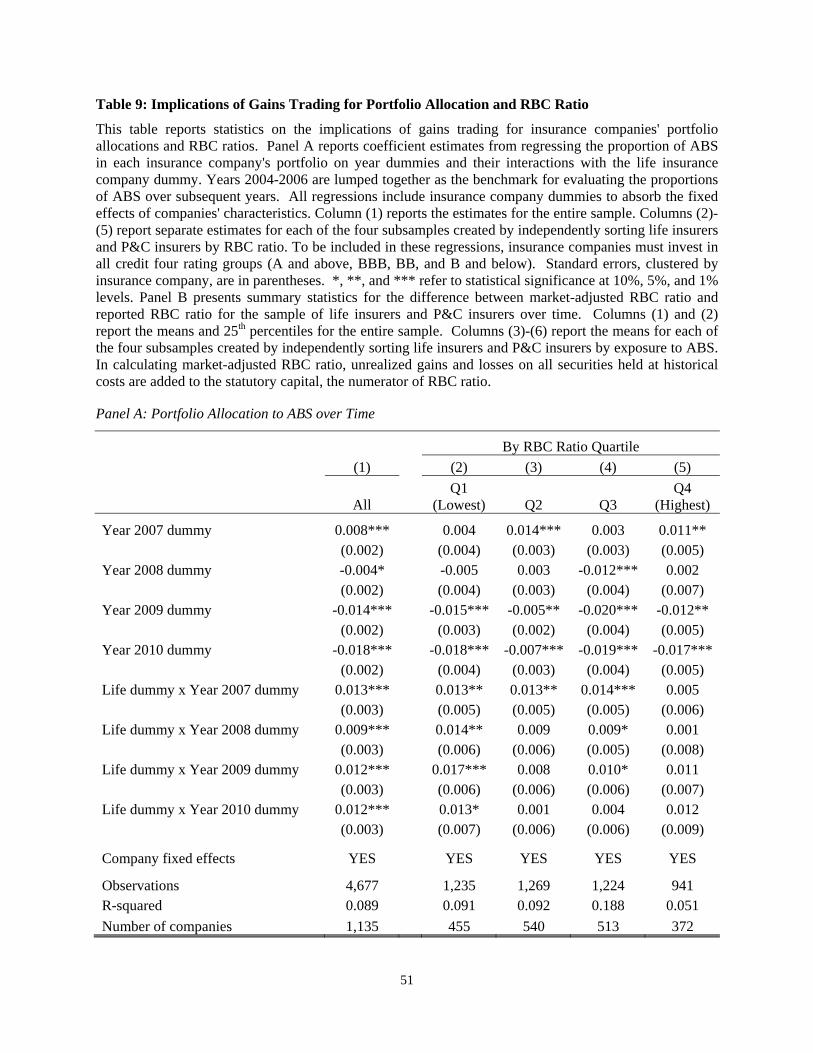
51
Table 9: Implications of Gains Trading for Portfolio Allocation and RBC Ratio
This table reports statistics on the implications of gains trading for insurance companies' portfolio allocations and RBC ratios. Panel A reports coefficient estimates from regressing the proportion of ABS in each insurance company's portfolio on year dummies and their interactions with the life insurance company dummy. Years 2004-2006 are lumped together as the benchmark for evaluating the proportions of ABS over subsequent years. All regressions include insurance company dummies to absorb the fixed effects of companies' characteristics. Column (1) reports the estimates for the entire sample. Columns (2)-(5) report separate estimates for each of the four subsamples created by independently sorting life insurers and P&C insurers by RBC ratio. To be included in these regressions, insurance companies must invest in all credit four rating groups (A and above, BBB, BB, and B and below). Standard errors, clustered by insurance company, are in parentheses. *, **, and *** refer to statistical significance at 10%, 5%, and 1% levels. Panel B presents summary statistics for the difference between market-adjusted RBC ratio and reported RBC ratio for the sample of life insurers and P&C insurers over time. Columns (1) and (2) report the means and 25th percentiles for the entire sample. Columns (3)-(6) report the means for each of the four subsamples created by independently sorting life insurers and P&C insurers by exposure to ABS. In calculating market-adjusted RBC ratio, unrealized gains and losses on all securities held at historical costs are added to the statutory capital, the numerator of RBC ratio. Panel A: Portfolio Allocation to ABS over Time
By RBC Ratio Quartile
(1) (2) (3) (4) (5)
All Q1
(Lowest) Q2 Q3 Q4
(Highest)
Year 2007 dummy 0.008*** 0.004 0.014*** 0.003 0.011** (0.002) (0.004) (0.003) (0.003) (0.005)
Year 2008 dummy -0.004* -0.005 0.003 -0.012*** 0.002 (0.002) (0.004) (0.003) (0.004) (0.007)
Year 2009 dummy -0.014*** -0.015*** -0.005** -0.020*** -0.012** (0.002) (0.003) (0.002) (0.004) (0.005)
Year 2010 dummy -0.018*** -0.018*** -0.007*** -0.019*** -0.017*** (0.002) (0.004) (0.003) (0.004) (0.005)
Life dummy x Year 2007 dummy 0.013*** 0.013** 0.013** 0.014*** 0.005 (0.003) (0.005) (0.005) (0.005) (0.006)
Life dummy x Year 2008 dummy 0.009*** 0.014** 0.009 0.009* 0.001 (0.003) (0.006) (0.006) (0.005) (0.008)
Life dummy x Year 2009 dummy 0.012*** 0.017*** 0.008 0.010* 0.011 (0.003) (0.006) (0.006) (0.006) (0.007)
Life dummy x Year 2010 dummy 0.012*** 0.013* 0.001 0.004 0.012 (0.003) (0.007) (0.006) (0.006) (0.009)
Company fixed effects YES YES YES YES YES
Observations 4,677 1,235 1,269 1,224 941 R-squared 0.089 0.091 0.092 0.188 0.051
Number of companies 1,135 455 540 513 372
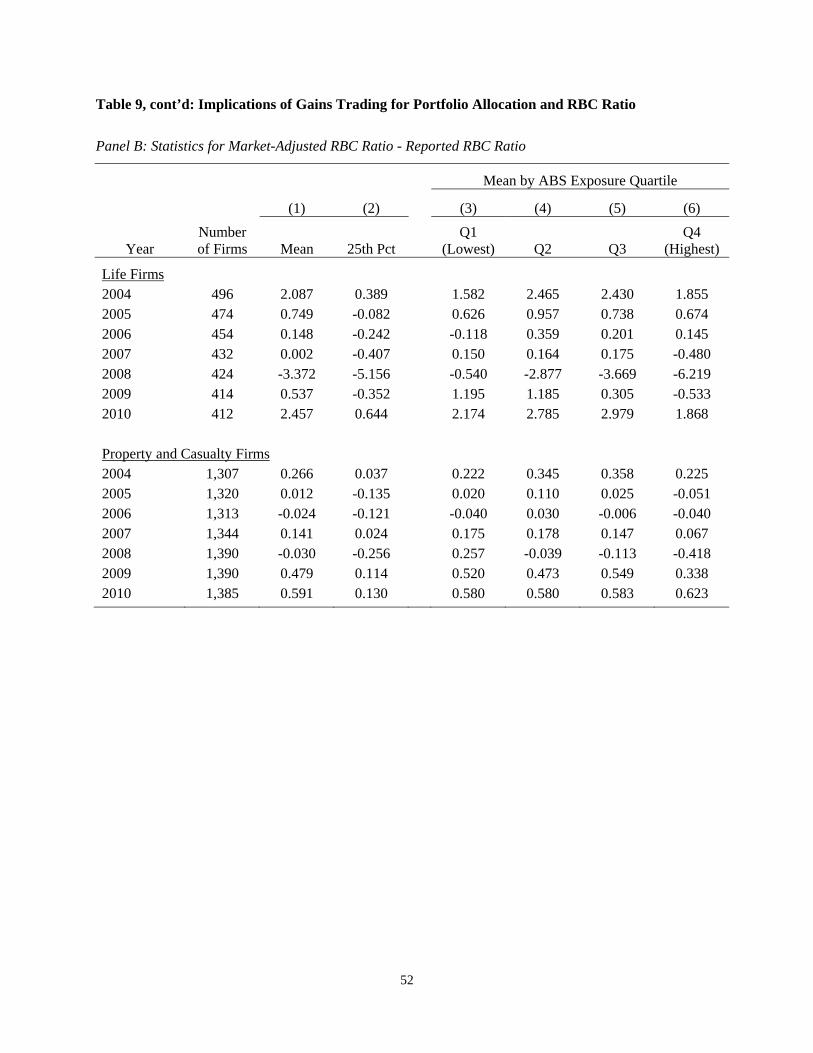
52
Table 9, cont’d: Implications of Gains Trading for Portfolio Allocation and RBC Ratio
Panel B: Statistics for Market-Adjusted RBC Ratio - Reported RBC Ratio
Mean by ABS Exposure Quartile
Number of Firms
(1) (2) (3) (4) (5) (6)
Year Mean 25th Pct Q1
(Lowest) Q2 Q3 Q4
(Highest)
Life Firms 2004 496 2.087 0.389 1.582 2.465 2.430 1.855 2005 474 0.749 -0.082 0.626 0.957 0.738 0.674 2006 454 0.148 -0.242 -0.118 0.359 0.201 0.145 2007 432 0.002 -0.407 0.150 0.164 0.175 -0.480 2008 424 -3.372 -5.156 -0.540 -2.877 -3.669 -6.219 2009 414 0.537 -0.352 1.195 1.185 0.305 -0.533 2010 412 2.457 0.644 2.174 2.785 2.979 1.868
Property and Casualty Firms 2004 1,307 0.266 0.037 0.222 0.345 0.358 0.225 2005 1,320 0.012 -0.135 0.020 0.110 0.025 -0.051 2006 1,313 -0.024 -0.121 -0.040 0.030 -0.006 -0.040 2007 1,344 0.141 0.024 0.175 0.178 0.147 0.067 2008 1,390 -0.030 -0.256 0.257 -0.039 -0.113 -0.418 2009 1,390 0.479 0.114 0.520 0.473 0.549 0.338 2010 1,385 0.591 0.130 0.580 0.580 0.583 0.623
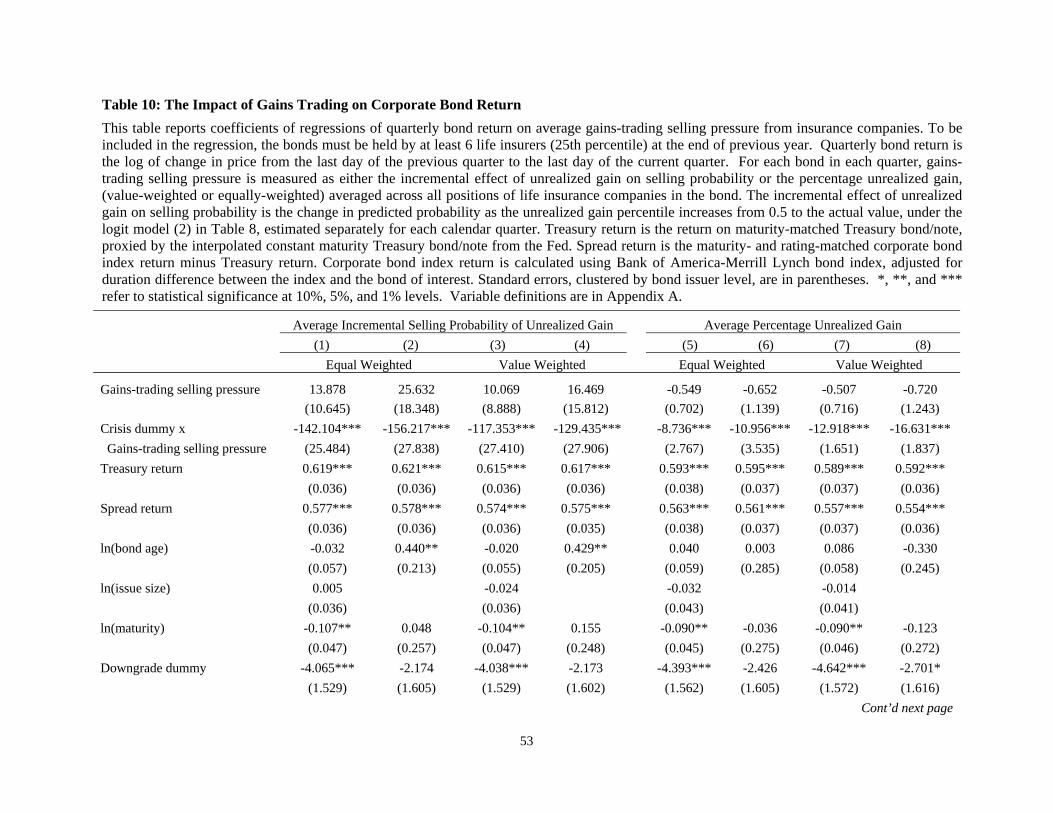
53
Table 10: The Impact of Gains Trading on Corporate Bond Return
This table reports coefficients of regressions of quarterly bond return on average gains-trading selling pressure from insurance companies. To be included in the regression, the bonds must be held by at least 6 life insurers (25th percentile) at the end of previous year. Quarterly bond return is the log of change in price from the last day of the previous quarter to the last day of the current quarter. For each bond in each quarter, gains-trading selling pressure is measured as either the incremental effect of unrealized gain on selling probability or the percentage unrealized gain, (value-weighted or equally-weighted) averaged across all positions of life insurance companies in the bond. The incremental effect of unrealized gain on selling probability is the change in predicted probability as the unrealized gain percentile increases from 0.5 to the actual value, under the logit model (2) in Table 8, estimated separately for each calendar quarter. Treasury return is the return on maturity-matched Treasury bond/note, proxied by the interpolated constant maturity Treasury bond/note from the Fed. Spread return is the maturity- and rating-matched corporate bond index return minus Treasury return. Corporate bond index return is calculated using Bank of America-Merrill Lynch bond index, adjusted for duration difference between the index and the bond of interest. Standard errors, clustered by bond issuer level, are in parentheses. *, **, and *** refer to statistical significance at 10%, 5%, and 1% levels. Variable definitions are in Appendix A.
Average Incremental Selling Probability of Unrealized Gain Average Percentage Unrealized Gain
(1) (2) (3) (4) (5) (6) (7) (8)
Equal Weighted Value Weighted Equal Weighted Value Weighted
Gains-trading selling pressure 13.878 25.632 10.069 16.469 -0.549 -0.652 -0.507 -0.720
(10.645) (18.348) (8.888) (15.812) (0.702) (1.139) (0.716) (1.243)
Crisis dummy x -142.104*** -156.217*** -117.353*** -129.435*** -8.736*** -10.956*** -12.918*** -16.631***
Gains-trading selling pressure (25.484) (27.838) (27.410) (27.906) (2.767) (3.535) (1.651) (1.837)
Treasury return 0.619*** 0.621*** 0.615*** 0.617*** 0.593*** 0.595*** 0.589*** 0.592***
(0.036) (0.036) (0.036) (0.036) (0.038) (0.037) (0.037) (0.036)
Spread return 0.577*** 0.578*** 0.574*** 0.575*** 0.563*** 0.561*** 0.557*** 0.554***
(0.036) (0.036) (0.036) (0.035) (0.038) (0.037) (0.037) (0.036)
ln(bond age) -0.032 0.440** -0.020 0.429** 0.040 0.003 0.086 -0.330
(0.057) (0.213) (0.055) (0.205) (0.059) (0.285) (0.058) (0.245)
ln(issue size) 0.005 -0.024 -0.032 -0.014
(0.036) (0.036) (0.043) (0.041)
ln(maturity) -0.107** 0.048 -0.104** 0.155 -0.090** -0.036 -0.090** -0.123
(0.047) (0.257) (0.047) (0.248) (0.045) (0.275) (0.046) (0.272)
Downgrade dummy -4.065*** -2.174 -4.038*** -2.173 -4.393*** -2.426 -4.642*** -2.701*
(1.529) (1.605) (1.529) (1.602) (1.562) (1.605) (1.572) (1.616)
Cont’d next page
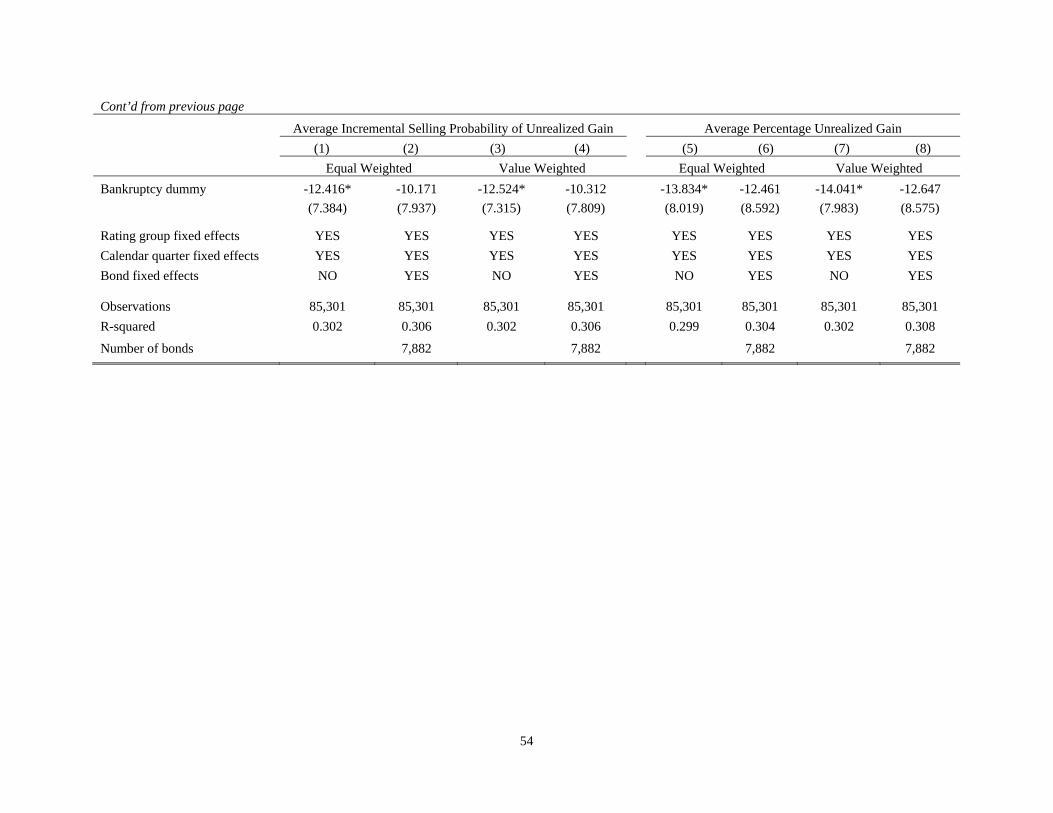
54
Cont’d from previous page
Average Incremental Selling Probability of Unrealized Gain Average Percentage Unrealized Gain
(1) (2) (3) (4) (5) (6) (7) (8)
Equal Weighted Value Weighted Equal Weighted Value Weighted
Bankruptcy dummy -12.416* -10.171 -12.524* -10.312 -13.834* -12.461 -14.041* -12.647
(7.384) (7.937) (7.315) (7.809) (8.019) (8.592) (7.983) (8.575)
Rating group fixed effects YES YES YES YES YES YES YES YES
Calendar quarter fixed effects YES YES YES YES YES YES YES YES
Bond fixed effects NO YES NO YES NO YES NO YES
Observations 85,301 85,301 85,301 85,301 85,301 85,301 85,301 85,301
R-squared 0.302 0.306 0.302 0.306 0.299 0.304 0.302 0.308
Number of bonds 7,882 7,882
7,882 7,882
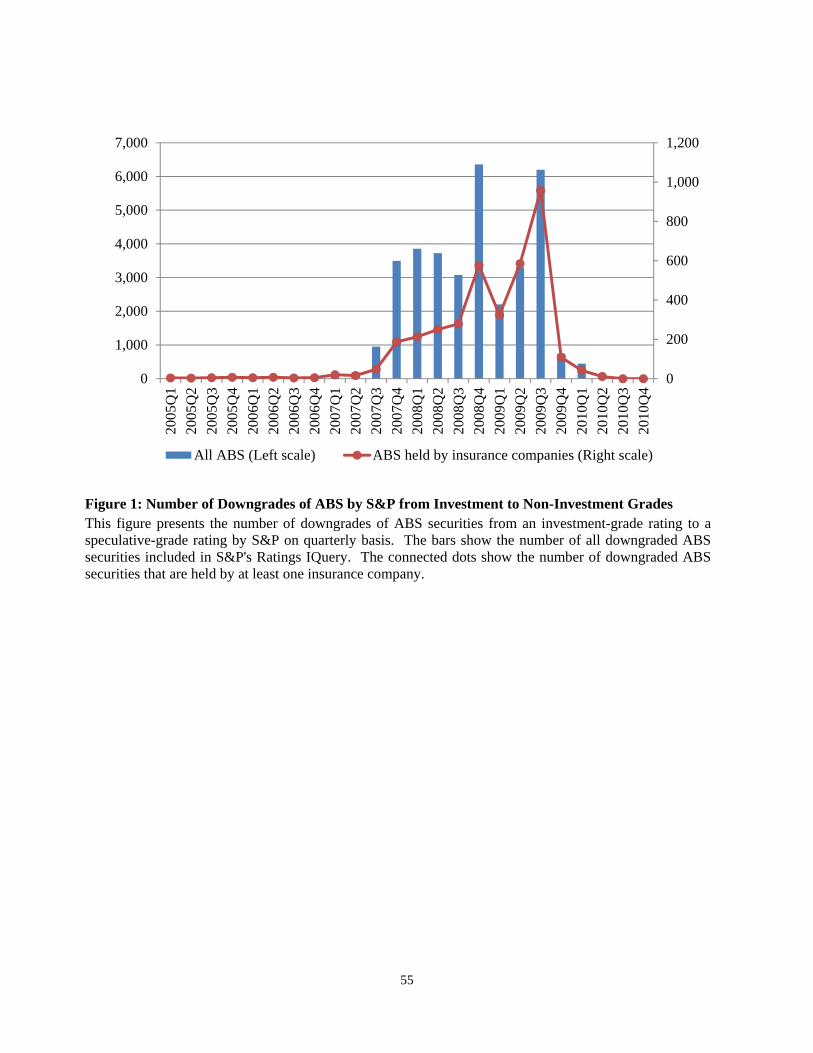
55
Figure 1: Number of Downgrades of ABS by S&P from Investment to Non-Investment Grades This figure presents the number of downgrades of ABS securities from an investment-grade rating to a speculative-grade rating by S&P on quarterly basis. The bars show the number of all downgraded ABS securities included in S&P's Ratings IQuery. The connected dots show the number of downgraded ABS securities that are held by at least one insurance company.
0
200
400
600
800
1,000
1,200
0
1,000
2,000
3,000
4,000
5,000
6,000
7,000
2005
Q1
2005
Q2
2005
Q3
2005
Q4
2006
Q1
2006
Q2
2006
Q3
2006
Q4
2007
Q1
2007
Q2
2007
Q3
2007
Q4
2008
Q1
2008
Q2
2008
Q3
2008
Q4
2009
Q1
2009
Q2
2009
Q3
2009
Q4
2010
Q1
2010
Q2
2010
Q3
2010
Q4
All ABS (Left scale) ABS held by insurance companies (Right scale)
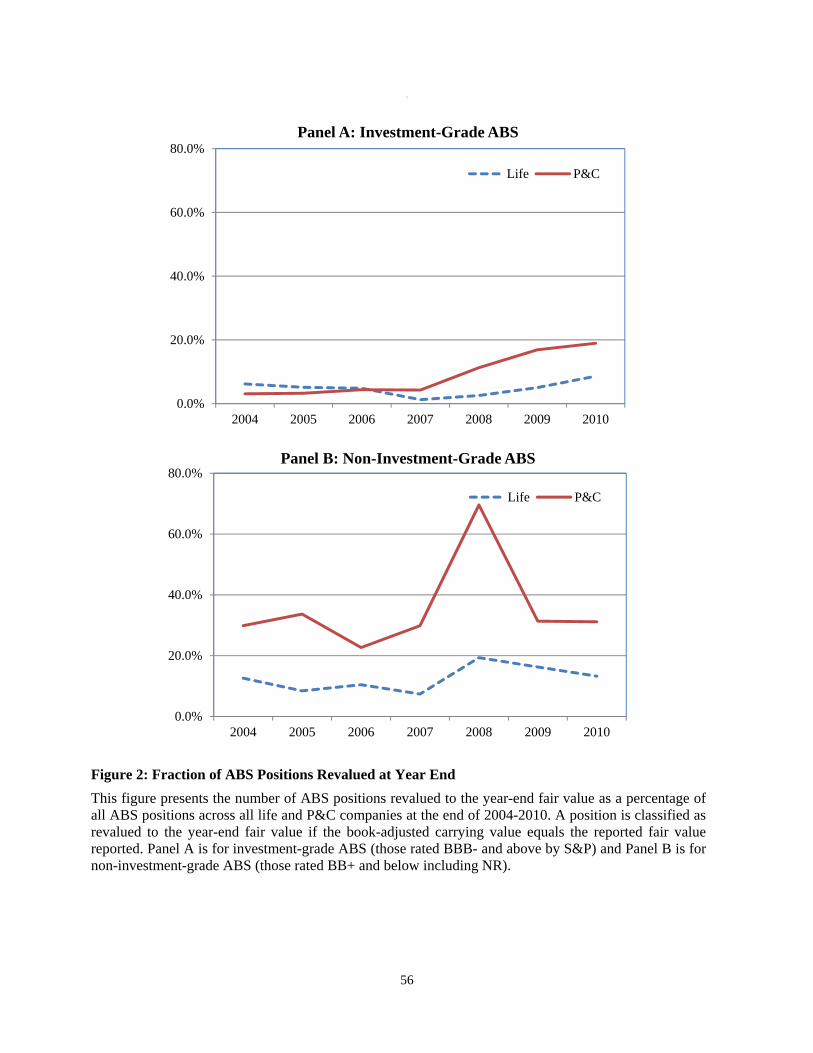
56
\
Figure 2: Fraction of ABS Positions Revalued at Year End
This figure presents the number of ABS positions revalued to the year-end fair value as a percentage of all ABS positions across all life and P&C companies at the end of 2004-2010. A position is classified as revalued to the year-end fair value if the book-adjusted carrying value equals the reported fair value reported. Panel A is for investment-grade ABS (those rated BBB- and above by S&P) and Panel B is for non-investment-grade ABS (those rated BB+ and below including NR).
0.0%
20.0%
40.0%
60.0%
80.0%
2004 2005 2006 2007 2008 2009 2010
Panel A: Investment-Grade ABS
Life P&C
0.0%
20.0%
40.0%
60.0%
80.0%
2004 2005 2006 2007 2008 2009 2010
Panel B: Non-Investment-Grade ABS
Life P&C