Embed Size (px)
Citation preview
The Effects of Perceptions of Economic Inequality on Policy Preferences:
Evidence from Michigan
Charles L. Ballard and Jeremy F. Duff
April 18, 2016
Ballard: Department of Economics, Michigan State University, Marshall-Adams Hall, 486 W.
Circle Drive, East Lansing, MI 48824. 517-353-2961. [email protected]. Duff: Department of
Political Science, Midwestern State University, Wichita Falls, TX 76308. 940-397-4747.
We are grateful to Bill Jacoby, Elisabeth Gerber, and two anonymous referees for helpful
comments. Any errors are our responsibility.
The Effects of Perceptions of Economic Inequality on Policy Preferences:
Evidence from Michigan
Abstract
Using survey data from a random sample of the Michigan adult population, we investigate the
relationship between individuals’ perceptions of income inequality, economic mobility, and
labor-market discrimination, and their preferences regarding a wide variety of public policies.
These include policies (such as cash payments for the poor) that are economic in nature, as well
as other policies (such as abortion and the death penalty) that are not narrowly economic. Our
results indicate that perceptions of income inequality, economic mobility, and labor-market
discrimination play an important role in explaining the variation in policy preferences. These
effects tend to be more important for issues on which the degree of political polarization is
relatively small. However, in many cases, these perceptions also have significant effects for
issues that are more polarized. Self-reported ideology has no significant effects on preferences
toward the policies for which polarization is small, but ideology has large and significant effects
for the more highly polarized variables.
2
The Effects of Perceptions of Economic Inequality on Policy Preferences:
Evidence from Michigan
INTRODUCTION
In this paper, we study perceptions of income inequality, economic mobility, and labor-market
discrimination, and the effects of these perceptions on policy preferences, using data from a
survey of a random sample of Michigan adults. We hypothesize that individuals’ policy
preferences are shaped by their perceptions of the degree and nature of economic inequality,
even when we control for ideology and other potentially relevant factors.
We argue that these perceptions affect preferences toward policies that are substantially
economic in nature, such as cash assistance for the poor: People who perceive high levels of
inequality will be more likely to favor active government measures to reduce inequality,
especially if the inequality is perceived as being due to discrimination. Similarly, those who
perceive lower levels of inequality, and/or who believe that such inequality results from inherent
differences among people (rather than from discrimination), will be more likely to oppose active
government measures to reduce those inequalities, and may prefer policies that have the effect of
increasing existing inequalities.
Our approach is similar to that of Alesina and Glaeser (2004) and Alesina and La Ferrara
(2000, 2002), who explore the roles of personal and attitudinal factors and policy context on
support for redistributive policies. However, our work differs from theirs in three major respects.
First, our study extends beyond preferences for redistribution. We examine the ways in which
perceptions of economic inequality and discrimination shape preferences on a wide range of
public policies, including some issues that are not narrowly economic in nature. Second, we
incorporate political ideology explicitly. We estimate the marginal effect of perceptions of
3
income inequality, economic mobility, and labor-market discrimination, controlling for self-
reported ideology. Third, we investigate the extent to which the degree of polarization
influences the relationships between inequality perceptions, self-reported ideology, and policy
preferences.
One important feature of our paper is that we examine abortion, the death penalty, and
gay rights, which are not usually considered to be related directly to economic inequality.
However, even though these issues are not related to economic inequality in a narrow sense, it
does not follow that perceptions of economic inequality will have no effect. In considering these
policy issues, we expect perceptions of income inequality, economic mobility, and labor-market
discrimination to serve as a proxy for more general perceptions of inequality (i.e., those who
perceive a world with greater economic inequality may also perceive greater inequalities in a
variety of social relationships). Indeed, in many cases, our results support the hypothesis that
perceptions of income inequality, economic mobility, and labor-market discrimination have
important effects on policy preferences toward issues that are not narrowly economic.
We use data from a public-opinion survey of a random sample of the Michigan adult
population to analyze preferences toward six policy issues: (1) cash payments for poor families,
(2) military spending, (3) the power of corporations, (4) abortion, (5) the death penalty, and (6)
the rights of gays and lesbians. Our empirical analysis shows that perceptions of income
inequality and labor-market discrimination have significant effects in explaining the variation in
preferences toward all of these policies, even when we control for political-party affiliation, self-
reported ideology, and a large number of other covariates. These effects tend to be more
important for issues on which the degree of political polarization is relatively small.
4
We measure ideology on the standard seven-point scale ranging from very liberal (coded
as 1) to very conservative (coded as 7), with moderate coded as 4. Jacoby (2009) argues that
citizens with different degrees of political sophistication tend to use liberal-conservative terms
differently. Nevertheless, as Jacoby puts it, “political scientists have generally regarded ideology
as a major influence on voting behavior… even though the psychological mechanisms
underlying its impact may vary across strata within the mass public.” For further discussion
along these lines, see Schiffer (2000) and Stimson and Ellis (2012). We use self-reported
ideology because it is a standard control variable in this literature, and we discuss ideology at
length because our analysis suggests that it has very different effects for different policy issues.
After we control for perceptions of income inequality, economic mobility, and labor-market
discrimination, self-reported ideology does not have any significant effect on preferences toward
cash payments for the poor, military spending, and the power of corporations. On the other
hand, ideology plays a very significant role in explaining the variation in policy preferences
toward abortion, the death penalty, and gay rights. These are the policies on which preferences
are most polarized, in the sense that the variance of responses is largest.
McCarty, Poole, and Rosenthal (2006) and others have demonstrated the increasing
ideological polarization of the two major political parties in the U.S. since the early 1990s.
Nivola and Brady (2006) and others point to redistricting, term limits, the rise of conservative
ideology, and other influences that have fueled the rise in polarization. In light of the increasing
importance of ideology, it is probably not surprising that ideology has a strong influence on
preferences toward some policy issues. In our view, however, it is remarkable that ideology falls
far short of significance in explaining preferences toward half of the policy issues that we
consider. For the policy issues that are relatively highly polarized, self-reported ideology does
5
have large and statistically significant effects. However, even for the more polarized issues,
perceptions of income inequality and labor-market discrimination still have important effects in
many cases.
FACTS AND PERCEPTIONS REGARDING ECONOMIC INEQUALITY AND
DISCRIMINATION
One of the most striking trends of the last four decades in the United States has been the large
increase in income inequality. Data compiled by Piketty and Saez (2003) show that the share of
total income received by the top one percent of households increased from about 8% in 1980 to
about 18% in recent years. (If we include capital gains, the increase is from about 9% to more
than 20%.) The increase in household income inequality has been dominated by rising
inequality in labor-market earnings. For economic analysis of the trend toward greater earnings
inequality, see Bound and Johnson (1992) and Autor, Katz, and Kearney (2008).
The empirical research conducted here is based on the responses to an opinion survey
conducted in 2010. In one of the survey questions, we ask what happened to the income gap
between high-income people and low-income people in the United States since 1980. A
substantial majority answered (correctly) that the income gap has increased. However, about
16% of the respondents said that the gap has stayed about the same, and about 13% said it has
decreased.
These responses are remarkable, since the increase in income inequality has been so
dramatic, and has received a great deal of attention. On the other hand, the lack of knowledge
that we have found here is not unique to our survey. Public-opinion surveys have repeatedly
shown that a substantial portion of the American public is poorly informed about many basic
economic and demographic facts. For example, Americans tend to understate the relative size of
6
the white population, and overstate the relative size of minority populations, often to an
astonishing degree. Gallup and Newport (1990) report that “The average American thinks that
America is 32% black, 21% Hispanic, and 18% Jewish.” Nadeau, Niemi, and Levine (1993) and
Alba, Rumbaut, and Marotz (2005) report similar findings. Also, the Kaiser Family Foundation
(2013) found that the average American believes that 28 percent of the federal budget is spent on
foreign aid, whereas the correct figure is about one percent. Finally, it should be noted that our
results regarding changes in the income gap do not appear to be due to idiosyncratic responses to
this particular survey. The same question was asked on another round of this survey of Michigan
residents in early 2014, and the results were remarkably similar. Bartels (2005) reports similar
results from the 2002 National Election Survey. In any event, our empirical analysis reveals that
a variable based on responses to the question about what has happened to the income gap plays
an important role in explaining differences of opinion regarding a number of public policies.
We also focus on perceptions of the extent to which earnings differences by race and sex
are due to labor-market discrimination. Black/white and male/female earnings differences are
salient in the minds of many, and perceptions of the nature of these differences may have an
important influence on preferences toward public policies. Accessible reviews of the literature
on differences in labor-market outcomes by race and sex can be found in Blau and Kahn (2000)
and Darity and Mason (1998). This literature demonstrates that the wage gaps between men and
women and between whites and blacks are considerably smaller than they were in the middle
decades of the 20th century, but that large differences still remain. Census data indicate that, for
full-time, year-round workers, the ratio of median earnings for black males to median earnings
for white males rose from about 71% in 1980 to about 80% in 2014 (see U.S. Census (2016),
Tables P-38B and P-38W). The ratio of median earnings for women to median earnings for men
7
rose from about 60% in 1980 to about 79% in 2014 (see U.S. Census (2016), Table P-38AR).
Thus the earnings gaps by race and sex have tended to decrease, even though overall earnings
inequality has increased substantially. For further discussion, see Blau, Ferber, and Winkler
(1998).
Measuring an earnings gap is more straightforward than identifying the extent to which
the gap is caused by labor-market discrimination or by other influences. In some cases, it has
been possible to shed direct light on discrimination in the labor market, as in the study of
orchestra auditions by Goldin and Rouse (2000). They find that perhaps one-fourth to one-third
of the increase in the number of female musicians at these orchestras can be attributed to the
adoption of “blind” auditions, in which the sex of the auditioning musician is not observed by the
judges. However, since it is difficult to perform controlled experiments in this area, those who
wish to isolate the extent of discrimination must often resort to indirect methods of inference.
The consensus in the literature appears to be that discrimination against both women and
minorities (like the earnings gaps themselves) has decreased over time, although not to zero. For
example, Charles and Guryan (2008) conclude that 25% of the racial wage gap is due to
discrimination.
Regardless of the actual amount of labor-market inequality and discrimination, numerous
researchers have sought to understand how people perceive labor-market differences. For
example, Antecol and Kuhn (2000) show that young women are much more likely to perceive
discrimination than older women, and that the difference cannot be explained by observed
personal or job characteristics. Kluegel and Smith (1982) suggest that people tend to
underestimate the extent of discrimination felt by other groups. This applies especially to
whites’ perceptions of discrimination against black men.
8
The respondents to our survey express a wide variety of views regarding the relative
importance of discrimination and job-skill differences in explaining the earnings gaps by race
and sex. Some 30% of respondents said that black/white earnings differences are mostly due to
skill differences, but 18% said these differences are mostly due to discrimination. About 23%
said that male/female earnings differences are mostly due to skill differences, while 25.5% said
that these are mostly due to discrimination. We exploit this variation in perceptions in our
empirical analysis.
POLITICAL-ECONOMY MODELS OF THE RELATIONSHIP BETWEEN
INEQUALITY AND POLICY PREFERENCES
While much attention has been focused on the economic causes and consequences of inequality,
several scholars have sought to understand the relationship between economic inequality and
various political factors. For example, Bartels (2008) and Kelly (2005) show that the policies
pursued by the major political parties have substantially different effects on economic inequality.
McCarty, Poole, and Rosenthal (2006) have established a link between income inequality and the
increasing polarization of party politics. Other studies have demonstrated the effect of income
inequality on a wide range of important attitudes and activities, such as trust, group membership,
and group participation. For example, see Alesina and La Ferrara (2000, 2002), Blakely,
Kennedy, and Kawachi (2001), Oliver (1999), and Uslaner and Brown (2005).
Meltzer and Richard (1981) develop a theoretical political-economy model with
implications for the relationship between income inequality and public-policy attitudes and
outcomes. In their model, those with below-average incomes favor income redistribution, and
this suggests that as economic inequality increases, public support for redistributive programs
will also increase. On the other hand, Bénabou (2000) develops a model with imperfect credit
9
and insurance markets, in which an increase in inequality can lead to a decrease in support for
redistribution. Thus, even in relatively simple models, there is no clear-cut theoretical
presumption regarding the relationship between inequality and policy preferences. Other
authors, such as Acemoglu and Robinson (2012), Alesina and Glaeser (2004), Bartels (2005,
2008), Edsall (1985), and Frank (2004) have discussed a large number of channels through
which economic inequality could be related to preferences and public policies.
In a recent empirical paper, Kelly and Enns (2010) find some support for the model of
Bénabou (2000). Their analysis suggests that “both the rich and the poor respond to rising
inequality by shifting in a conservative direction.” (For further discussion, see Luttig (2013).) In
our view, however, it is possible that the estimates of Kelly and Enns could suffer from omitted-
variables bias, as well as reverse causality. Thus we do not believe that the direction of these
relationships is a settled issue. In fact, some of our results provide support for the model of
Meltzer and Richard (1981)—we find that those who perceive that income inequality has
increased are significantly more likely to support an increase in cash payments for the poor.
Kelly and Enns (2010) measure income inequality using the Gini coefficient for family
money income. They then compare this to a measure of public opinion based on Stimson’s
(1999) public mood. However, as we have seen, the public often has imperfect information
about actual levels of inequality. Therefore, we focus on perceptions of inequality.
DATA AND VARIABLES
Our dataset is created from a survey of 979 Michigan adults, ranging in age from 18 to 92,
conducted in May, June, and July 2010 by Michigan State University’s State of the State Survey
(SOSS). This survey, which was established in 1994, has provided the data for a large number of
10
published papers, including Davis and Silver (2003), Kaplowitz, Broman, and Fisher (2006), and
Skidmore, Ballard, and Hodge (2010). The respondents to this survey are a random sample of
the Michigan adult population. We believe that evidence from Michigan is of genuine interest in
its own right. Moreover, the characteristics of the Michigan population are sufficiently similar to
national averages for us to suggest that it may be possible to generalize our results to the broader
American population. This would be an interesting avenue for future research.
Our questions on SOSS allow us to operationalize the measures of public-policy
preferences and perceptions of economic inequality and discrimination discussed above. The
survey also provides a full range of individual-level control variables. (For complete details on
the survey, see http://www.ippsr.msu.edu/SOSS/.)
Background Characteristics of Respondents to the State of the State Survey
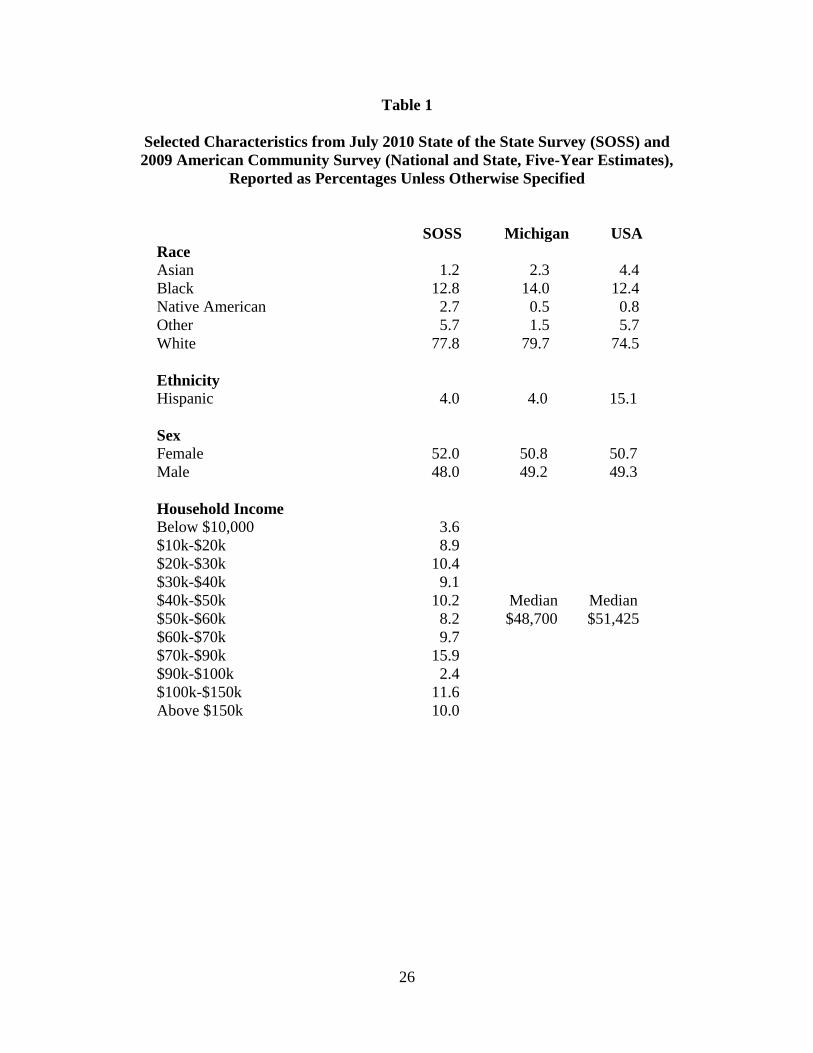
In Table 1, we summarize the data from the SOSS sample for a number of individual and
demographic characteristics. In columns 2 and 3, we also report comparable statistics for the
Michigan and U.S. populations, for a subset of the questions that are available from the 2009
American Community Survey of the U.S. Census. The table shows that the SOSS sample is
roughly comparable to the state population on these observable background characteristics, and
differs from the national population in predictable ways. For example, the SOSS sample and the
American Community Survey estimates of the Michigan population have lower percentages of
Asians and Hispanics than the population of the U.S. as a whole.
<Table 1 here>
Variables Describing Policy Preferences
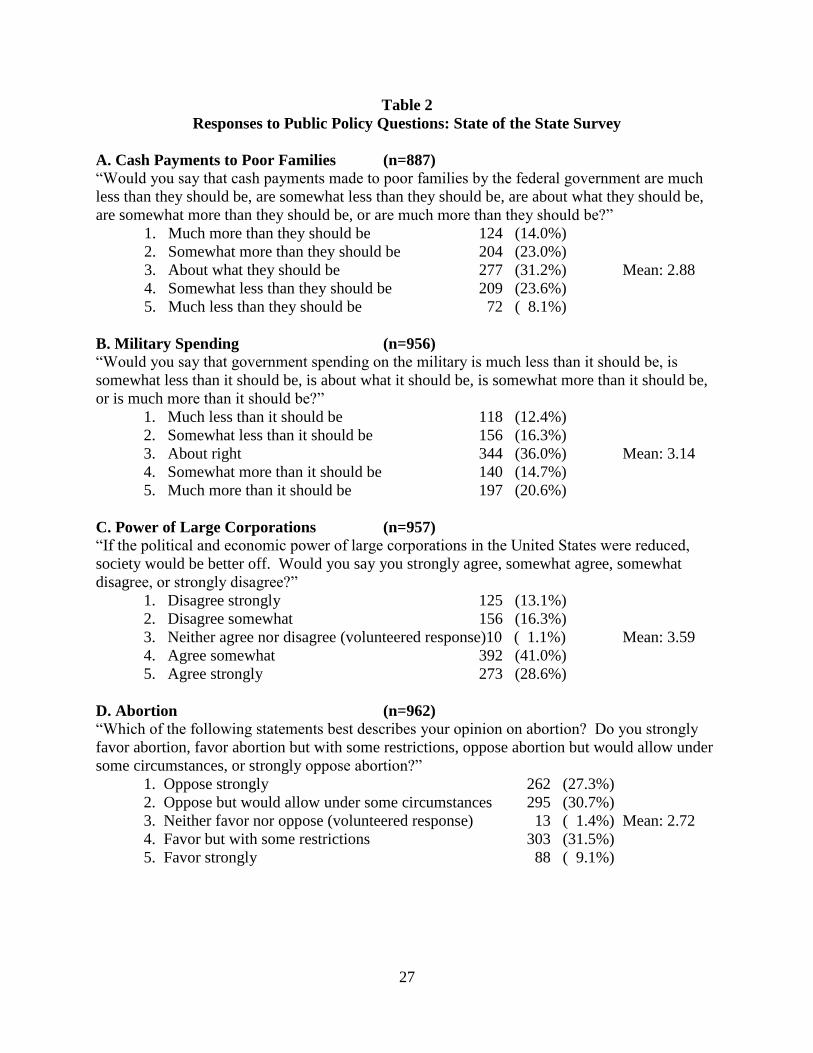
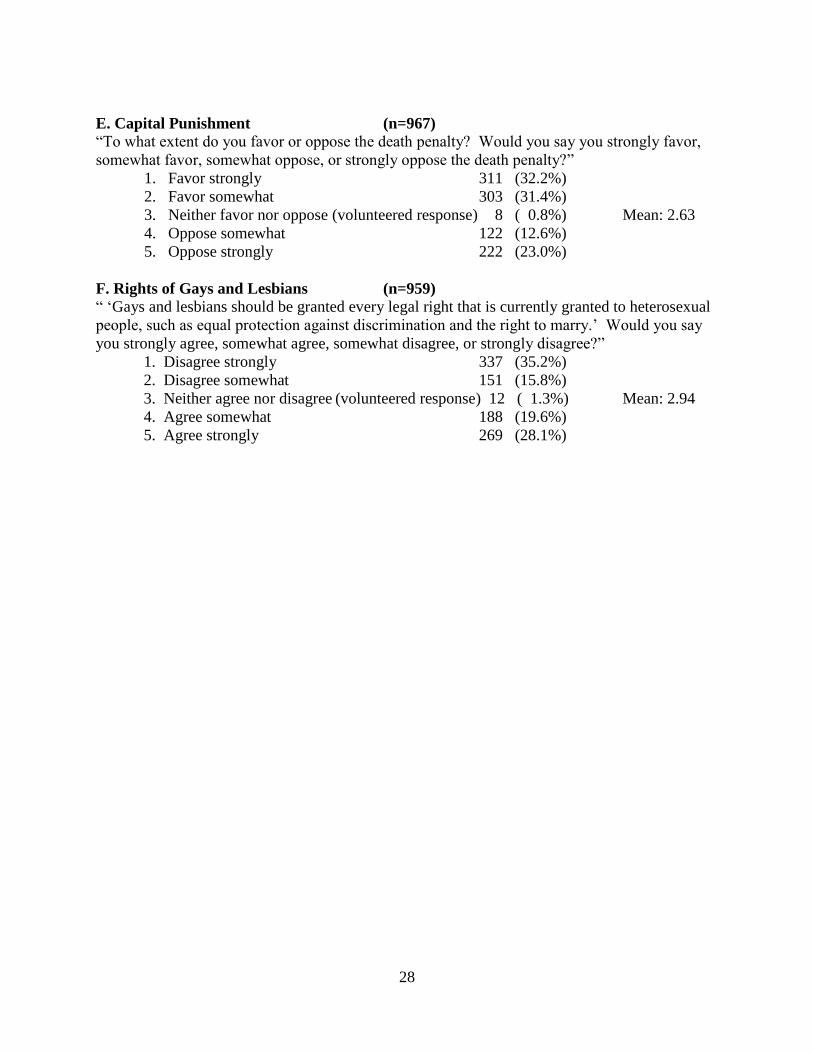
Our dependent variables are derived from six survey questions about preferences for specific
public policies. Each of these questions has five ordinal response categories, plus a “Don’t
11
Know” option. Table 2 contains the question wordings and top-line responses for these
variables.
<Table 2 here>
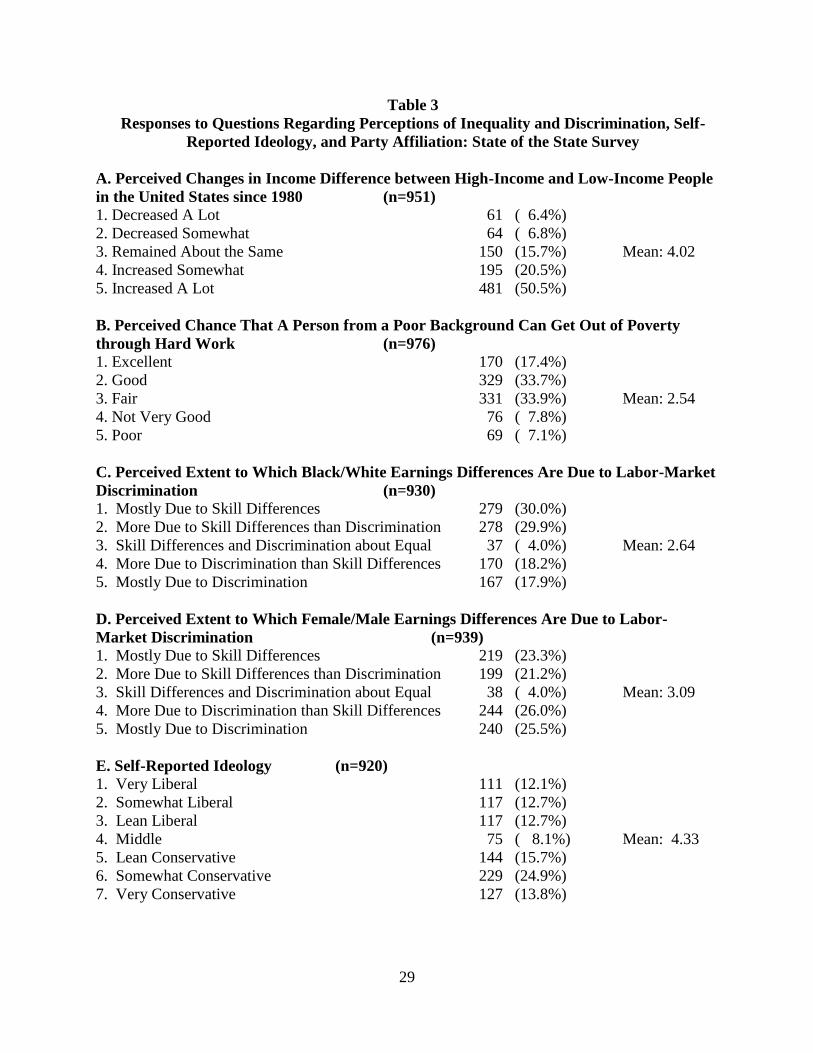
Variables Describing Perceptions of Inequality
We construct three explanatory variables regarding perceptions of inequality and discrimination:
Change in Income Inequality: This question asks whether respondents think the income
difference between high-income people and low-income people in the United States has
increased a lot, increased somewhat, remained about the same, decreased somewhat, or
decreased a lot since 1980.
Discrimination: This variable is created from two survey questions. The first question
begins by stating that black men earn less in the labor market than white men, on average, and
then asks respondents whether they believe this difference is due to differences in job skills or to
discrimination. The second question begins by stating that a similar wage gap exists between
women and men, and then asks respondents whether they believe this difference is due to job
skills or discrimination. For both questions, the response options are: mostly to differences in
skills; somewhat more to the differences in skills than to discrimination; somewhat more to
discrimination than to skills; and mostly to discrimination. Respondents were also allowed to
volunteer that both factors mattered about equally. Discrimination takes on the average value of
the coded responses from these two questions.
Escape Poverty: This question asks for the respondent’s opinion about the chances for a
person from a poor background to get out of poverty, if he/she is willing to work hard. The
response options are that his/her chances are excellent, good, fair, not very good, or poor.
12
In Table 3, we summarize the responses for these perception variables, as well as
political-party affiliation and ideology. Table 3 demonstrates that the responses to our
perception questions show a great deal of variation. This variation is consistent with the results
from previous studies of perceptions of income inequality, economic mobility, and labor-market
discrimination (described above), many of which reveal considerable heterogeneity in
perceptions.
<Table 3 here>
POLARIZATION
We seek to compare the effects on policy preferences of (1) perceptions of income inequality,
economic mobility, and labor-market discrimination, and (2) self-reported ideology. We expect
that the effect of these influences will depend on the degree of polarization of the policy variable
that is to be explained. (Here, when we say “degree of polarization”, we are referring to the
degree of variation in the responses regarding particular policy issues, rather than to the broad
environment of political polarization.) Specifically, for issues that are more polarized
ideologically, we hypothesize that self-reported ideology will play a relatively more substantial
role.
We use the standard deviation of responses as a measure of polarization. In our data, we
find considerable variation in the degree of polarization of responses across our policy-
preference questions. The standard deviations range from 1.16 on cash spending for poor
families to 1.70 for gay and lesbian rights, where the underlying variables are measured on a 1-5
scale. (It is noteworthy that the number of respondents who answered “Don’t Know” is smaller
for the most polarized issues (abortion, death penalty, and gay and lesbian rights) than for any of
the less polarized issues.)
13
One valid question is whether our data reveal patterns of polarization across issues that
are similar to the patterns found in other samples. For most of our policy variables, we were able
to identify a similarly worded question from a nationally representative poll, identified through
the Roper iPOLL database of the Roper Center for Public Opinion Research. For four of our six
questions regarding public-policy preferences, we found a similarly worded question that offered
at least four response options, and we found a question with three response options for one of our
other two questions. The standard deviations from the iPOLL survey questions are ordered
similarly to those from the similarly worded questions in our surveys. (More detailed information
on the Roper iPOLL questions is available on request.) The range of standard deviations is
smaller for the iPOLL data than for our surveys, but this smaller variance is due in part to the
fact that the national polls offered only three or four response options, while our surveys offered
five. We interpret the consistency in the relative magnitudes of the standard deviation as
evidence that the observed patterns of preferences and polarization across issues in our survey
can be generalized to the broader population.
RESULTS
We report the results from several OLS regressions in Tables 4-7.1 The dependent variables are
the responses to the policy-preference questions. The key independent variables are our
measures of perceptions of income inequality, economic mobility, and labor-market
discrimination, as well as self-reported ideology and political-party affiliation. Table 4 shows
1 We report on OLS regressions, because of the ease of interpreting OLS coefficients. For each
of the regressions reported here, we have also performed an ordered-probit regression. The signs
and significance levels are very similar for the ordered-probit regressions and the OLS
regressions. Results from the ordered-probit regressions are available on request.
14
the results for Cash Payments for Poor Families (the least polarized issue), and Tables 5 and 6
show the results for Abortion and Gay and Lesbian Rights, which are two of the most polarized
issues. For each issue, we first present a regression analysis in which the only regressors are
demographic characteristics and perceptions of income inequality, economic mobility, and labor-
market discrimination. We then run the regression a second time, excluding perceptions of
inequality, mobility, and discrimination, while including partisanship and self-reported ideology.
The third regression includes all of the independent variables.
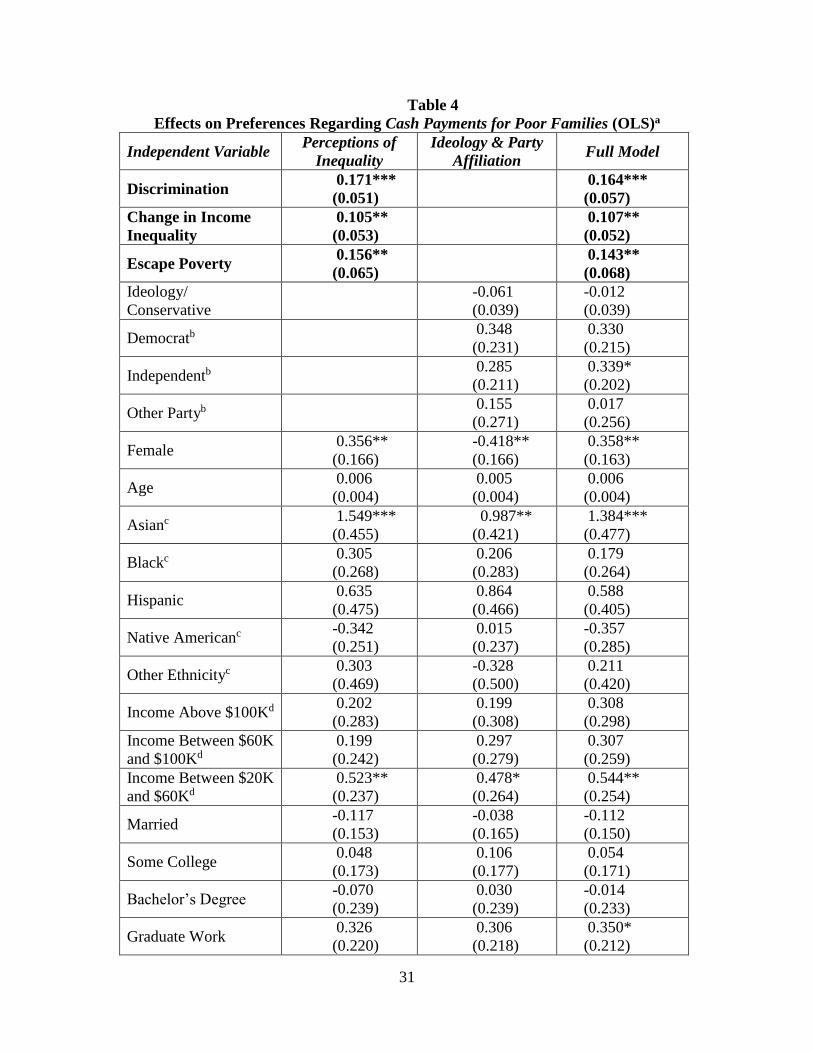
Table 4 displays the regression results for Cash Payments for Poor Families. This
dependent variable is scaled so that a high value indicates that spending is less than the
respondent prefers (i.e., he/she would prefer to increase this type of spending). In the first
regression (which includes only the demographic variables and the perceptions of income
inequality, economic mobility, and labor-market discrimination), Discrimination is significantly
positively related to Cash Payments for Poor Families: All else equal, individuals who perceive
more labor-market discrimination are more likely to say that cash payments for the poor are too
low. The positive and significant coefficient for Change in Income Inequality indicates that, all
else equal, those who perceive that the increases in income inequality have been larger are more
likely to believe that spending on the poor is too low. Finally, in a result that is very consistent
with the findings of Alesina and Glaeser (2004), the positive and significant effect of Escape
Poverty indicates that those who believe the poor have few opportunities to escape poverty
through hard work are more likely to believe that cash payments for the poor are too low.
<Table 4 here>
The magnitudes of these three coefficients are between 0.1 and 0.2. This means that,
holding constant all other influences, a one-point increase in Discrimination, Change in Income
15
Inequality, or Escape Poverty (each of which is scaled from 1 to 5) is associated with an increase
of about 0.1 or 0.2 in the favorability with which the respondent views cash payments to poor
families (where the dependent variable is also scaled from 1 to 5). We characterize this as an
effect of moderate size, which is estimated fairly precisely.
In the second column of Table 4, we include self-reported ideology and political-party
identification as regressors, in addition to the demographic characteristics, while excluding
perceptions of income inequality, economic mobility, and labor-market discrimination. None of
the ideology or partisanship variables is statistically significant. Thus self-reported ideology
plays relatively little role in explaining policy preferences toward spending on poor families,
which is the least polarized of our policy-preference variables.
In the last column of Table 4, we include all of the independent variables, including
perceptions of income inequality, labor-market discrimination, and economic mobility, as well as
ideology, partisanship, and demographics. In this full model, the perceptions of income
inequality, labor-market discrimination, and economic mobility remain strong and significant (as
in the first specification), while ideology and partisanship remain insignificant (as in the second
specification). In other words, in the full model in the last column of Table 4, perceptions of
income inequality, labor-market discrimination, and economic mobility play an important role in
explaining preferences for spending on the poor, but ideology does not. Some of the
demographic variables are statistically significant as well. For example, in the full model, we see
that women are substantially more likely than men to believe that cash payments for the poor are
too low, even after controlling for other influences.
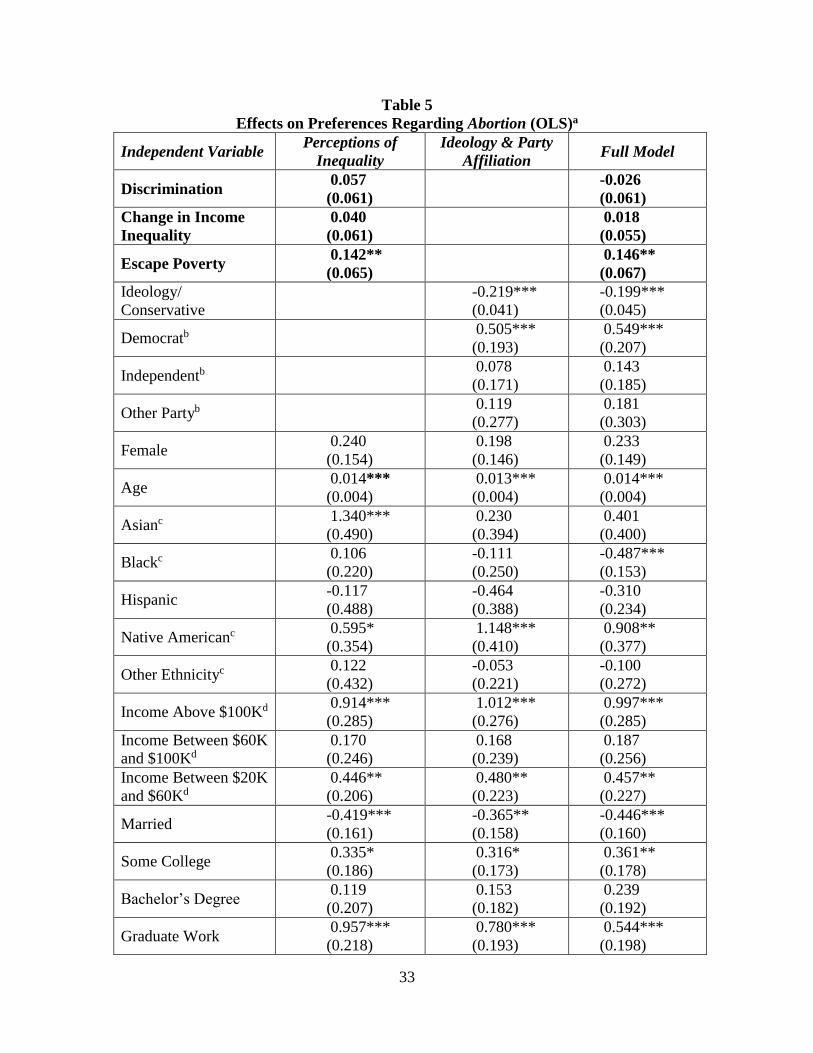
Table 5 shows the regression results for Abortion. We have scaled this variable so that a
higher value indicates greater support for legal abortion. Since abortion is one of the more
16
highly polarized issues we consider, we expect that ideology and partisanship will have an effect
on policy preferences. When self-reported ideology and partisanship are not included in the
model, as shown in the first column of results in Table 5, all of the coefficients for the inequality
and discrimination perception variables are positively signed. However, only the effect of
Escape Poverty is statistically significant. By contrast, the second column of results in Table 5
shows that the effects of ideology and partisanship are both strong and significant.
Conservatives are substantially less likely to favor abortion rights, and Democrats are much more
likely than Republicans to favor abortion rights. These patterns continue to hold in the full model
in column 3 of Table 5.
<Table 5 here>
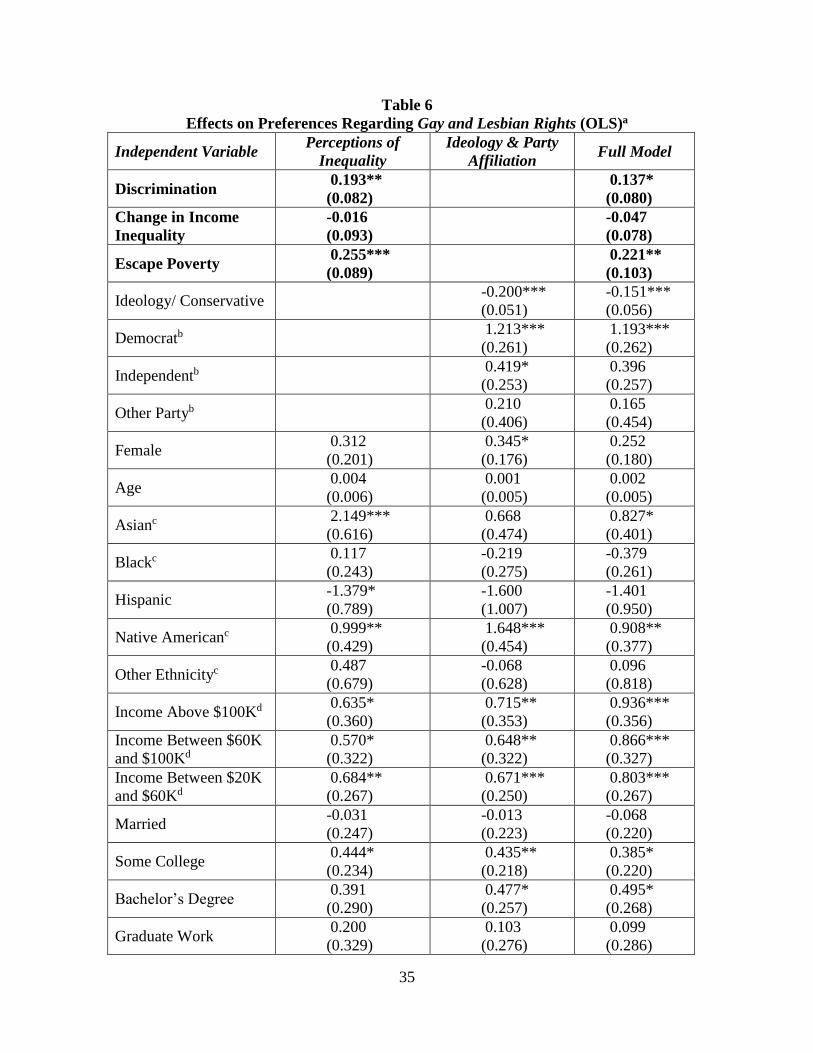
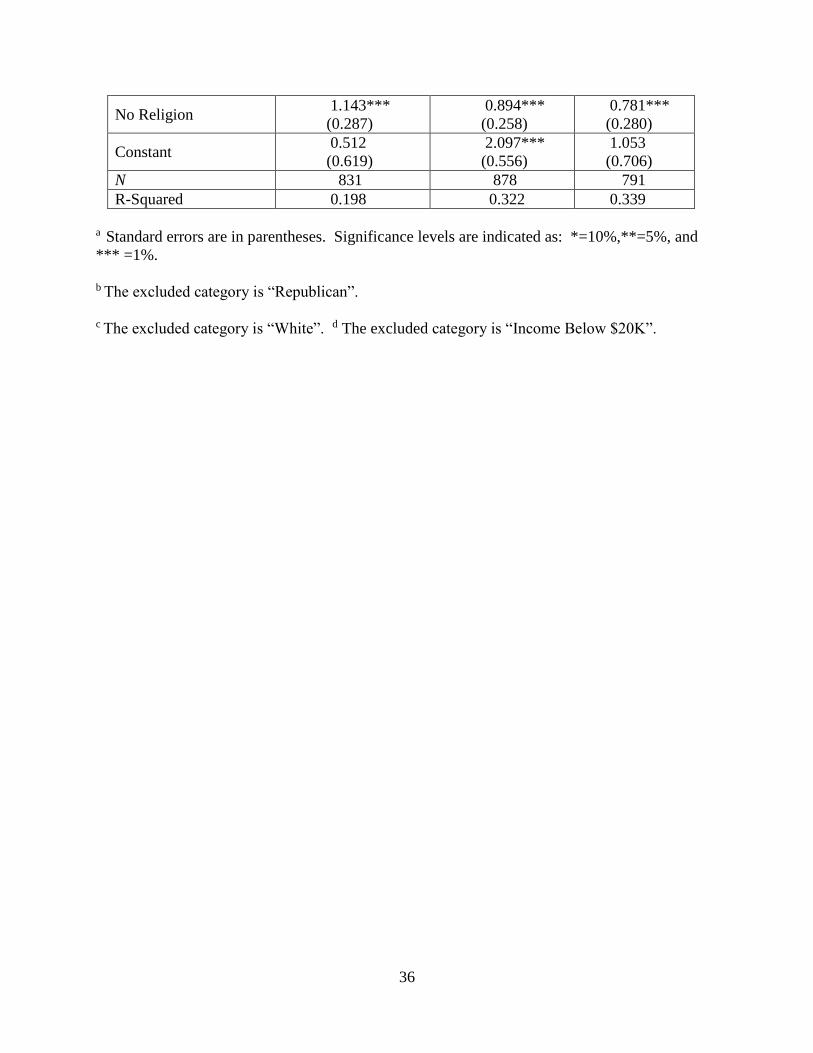
Table 6 shows the regression results for Gay and Lesbian Rights, which is scaled so that a
higher value indicates greater support for gay rights. The responses to the gay-rights question
have a higher standard deviation than the responses for any of the other issues that we consider,
which we interpret as meaning that this issue is relatively highly polarized. Thus we expect that
self-reported ideology will have an effect on policy preferences in this case. The second column
of results in Table 6 shows that the effects of ideology and partisanship are both strong and
significant, with conservatives less likely to favor gay rights, and Democrats much more likely
than Republicans to favor gay rights. These patterns continue to hold in the full model in column
3 of Table 6.
<Table 6 here>
Although we expect ideology to play a more prominent role in explaining policy
preferences for a highly polarized policy such as gay rights, this does not necessarily mean that
17
perceptions of income inequality, economic mobility, and labor-market discrimination will not
have any effects. Those who perceive a large degree of discrimination against blacks or women
in the labor market may also be more likely to think of gays and lesbians as victims of
discrimination. Indeed, as shown in the third column of results in Table 6, perceptions of labor-
market discrimination have an effect on policy preferences regarding gay rights that is significant
at the 10-percent level, even after we control for ideology. Also, perceptions of whether poor
people are able to escape poverty have a significant effect on policy preferences regarding gay
rights, even after controlling for ideology.
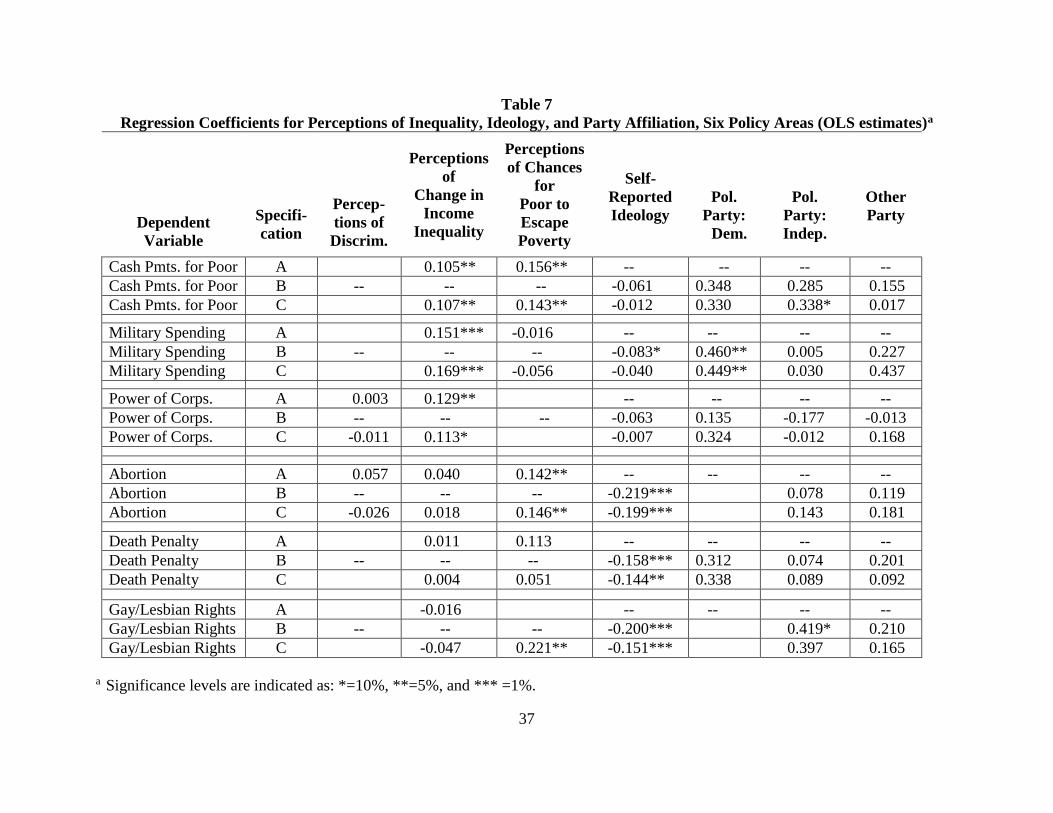
Next, we consider the overall pattern of results for all six of our policy-preference
variables. The results are shown in Table 7, in which the issues are ordered from lowest to
highest variance. Each row of Table 7 shows selected OLS coefficients for a particular
regression equation. For each of the dependent variables, specification A includes the variables
representing perceptions of income inequality, economic mobility, and labor-market
discrimination, plus controls. Specification B includes self-reported ideology political-party
affiliation plus controls, and specification C includes all of the independent variables.
<Table 7 here>
As shown in Table 7 for the full specification C, all three of our variables regarding
perceptions of income inequality, economic mobility, and labor-market discrimination play a
statistically significant role in explaining the variation in preferences toward Cash Payments for
the Poor Families. Two of the three are significant in explaining Military Spending, and two of
the three are significant in explaining Power of Corporations. On the other hand, Ideology does
not have a significant effect on preferences toward any of these three policy issues.
18
However, the effect of Ideology is strong and significant for Abortion, Death Penalty, and
Gay and Lesbian Rights. In addition, two of the variables regarding perceptions of economic
inequality and discrimination have significant effects in the regressions for these more-polarized
policies, even after we control for ideology and partisanship. Specifically, the belief that the
poor cannot easily escape poverty has significant effects on preferences regarding Abortion and
Gay and Lesbian Rights. Perceptions of labor-market discrimination are significantly related to
policy preferences for Death Penalty and Gay and Lesbian Rights, even when we control for
ideology and partisanship. As mentioned earlier, some respondents may see gay rights as an
issue of discrimination. Some may also see capital punishment in the same light, due to the well-
publicized racial disparities in the use of the death penalty. (For example, see Zeisel (1981).)
The broad patterns shown in Table 7 indicate that, when polarization on an issue is low,
perceptions of income inequality, economic mobility, and labor-market discrimination have
important effects on policy preferences, even when we control for ideology and partisanship. On
the issues with lower polarization, ideology has no significant effects. Ideology and partisanship
play an important and statistically significant role in explaining policy preferences when
polarization is high, and perceptions of economic mobility and labor-market discrimination also
have significant effects on the more-polarized variables in some cases.
Endogeneity
Throughout the discussion thus far, we have assumed implicitly that Discrimination, Change in
Income Inequality, and Escape Poverty are exogenous to policy preferences. However, we
acknowledge the possibility that these variables are potentially endogenous, i.e., that the implied
causal relationship between perceptions of inequality/discrimination/mobility and policy
19
preferences is reversed. To test the assumption of exogeneity, we have performed a series of
tests using the procedure of Hausman (1978, 1983).
The results of the Hausman tests (which are available on request) show that there is no
apparent endogeneity in our analyses of policy preferences for cash payments for the poor, the
power of corporations, and gay rights. In the Hausman tests for military spending, abortion, and
the death penalty, at least one of our instruments produces a test statistic that is statistically
significant, indicating that endogeneity may be an issue. We interpret the results for the
Hausman tests as suggesting that endogeneity is not an overwhelming problem, but also that we
should be careful not to overstate the extent to which the relationships uncovered here are causal.
CONCLUSION
In this paper, we study the role of perceptions of income inequality, economic mobility, and
labor-market discrimination in explaining preferences regarding a wide variety of public policies.
We test our hypotheses with data from a survey of 979 Michigan adults. The survey contains
questions about preferences regarding cash payments for the poor, military spending, the power
of corporations, abortion, gay rights, and the death penalty. It also includes questions about
respondents’ perceptions of the extent and sources of inequality in various economic
relationships, as well as self-reported ideology, political-party identification, and personal
characteristics.
Our results indicate that perceptions of income inequality, economic mobility, and labor-
market discrimination have important and significant effects on policy preferences, even after
controlling for self-reported ideology and party affiliation. For the less-polarized policy-
preference variables (cash payments for the poor, military spending, and the power of
20
corporations), ideology does not have significant effects. For the more highly polarized
variables, self-reported ideology has effects that are large and statistically significant, although
perceptions of labor-market discrimination and economic mobility still have important effects in
many cases. Specifically, perceptions of economic mobility have important and statistically
significant effects on preferences regarding abortion and gay rights, even after we control for
ideology and political-party affiliation. Perceptions of labor-market discrimination have
substantial and significant effects on preferences toward the death penalty and gay rights, even
after controlling for ideology and party. This demonstrates that perceptions of economic
inequality and its sources have very wide-ranging effects on policy preferences, even for policy
issues that are not considered primarily in economic terms, and even after controlling for
ideology.
21
References
Acemoglu, Daron, and James A. Robinson. 2012. Why Nations Fail: The Origins of Power,
Prosperity, and Poverty. New York: Crown Business.
Alba, Richard, Ruben G. Rumbaut, and Karen Marotz. 2005. “A Distorted Nation: Perceptions
of Racial/Ethnic Group Sizes and Attitudes Toward Immigrants and Other Minorities.”
Social Forces 84 (2): 901-919.
Alesina, Alberto, and Eliana La Ferrara. 2000. “Participation in Heterogeneous Communities.”
Quarterly Journal of Economics 115 (3): 847-904.
Alesina, Alberto, and Eliana La Ferrara. 2002. “Who Trusts Others?” Journal of Public
Economics 85 (2): 207-234.
Alesina, Alberto, and Edward L. Glaeser. 2004. Fighting Poverty in the US and Europe. Oxford:
Oxford University Press.
Antecol, Heather, and Peter Kuhn. 2000. “Gender as an Impediment to Labor Market Success:
Why Do Young Women Report Greater Harm?” Journal of Labor Economics 18 (4):
702-728.
Autor, David H., Lawrence F. Katz, and Melissa Kearney. 2008. “Trends in U.S. Wage
Inequality: Revising the Revisionists.” Review of Economics and Statistics 90 (2): 300-
323.
Bartels, Larry M. 2005. “Homer Gets a Tax Cut: Inequality and Public Policy in the American
Mind.” Perspectives on Politics 3 (1): 15-31.
Bartels, Larry M. 2008. Unequal Democracy. Princeton, NJ: Princeton University Press.
Bénabou, Roland. 2000. “Unequal Societies: Income Distribution and the Social Contract.”
American Economic Review 90 (1); 96-129.
22
Blakely, Tony A., Bruce P. Kennedy, and Ichiro Kawachi. 2001. “Socioeconomic Inequality in
Voting Participation and Self-Rated Health.” American Journal of Public Health 91 (1):
99-104.
Blau, Francine D., Marianne A. Ferber, and Anne E. Winkler. 1998. The Economics of Women,
Men, and Work, 3rd edition. Upper Saddle River, NJ: Prentice Hall.
Blau, Francine D., and Lawrence M. Kahn. 2000. “Gender Differences in Pay.” Journal of
Economic Perspectives 14 (4): 75-99.
Bound, John, and George Johnson. 1992. “Changes in the Structure of Wages in the 1980s: An
Evaluation of Alternative Explanations.” American Economic Review 82 (3): 371-392.
Charles, Kerwin, and Jonathan Guryan. 2008. “Prejudice and Wages: An Empirical Assessment
of Becker’s the Economics of Redistribution.” Journal of Political Economy 116 (5):
773-809.
Darity, William A. Jr., and Patrick L. Mason. 1998. “Evidence on Discrimination in
Employment: Codes of Color, Codes of Gender.” Journal of Economic Perspectives 12
(2): 63-90.
Davis, Darren W., and Brian D. Silver. 2003. “Stereotype Threat and Race of Interviewer
Effects in a Survey on Political Knowledge.” American Journal of Political Science 47
(1): 33-45.
Edsall, Thomas Byrne. 1985. The New Politics of Inequality. New York: W.W. Norton and
Company.
Frank, Thomas. 2004. What’s the Matter with Kansas? How Conservatives Won the Heart of
America. New York: Henry Holt and Company.
23
Gallup, George, Jr., and Frank Newport. 1990. “Americans Ignorant of Basic Census Facts.”
Gallup Poll Monthly (294): 2-5.
Goldin, Claudia, and Cecilia Rouse. 2000. “Orchestrating Impartiality: The Impact of ‘Blind’
Auditions on Female Musicians.” American Economic Review 90 (4): 715-741.
Hausman, Jerry A. 1978. “Specification Tests in Econometrics.” Econometrica 46 (6): 1251-
1271.
Hausman, Jerry A. 1983. “Specification and Estimation of Simultaneous Equations Models.” In
Zvi Griliches and Michael D. Intriligator (eds.), Handbook of Econometrics, vol. I.
Amsterdam: North Holland: 391-448.
Jacoby, William G. 2009. “Ideology and Vote Choice in the 2004 Election.” Electoral Studies
28: 584-594.
Kaplowitz, Stan A., Clifford L. Broman, and Bradley J. Fisher. 2006. “Perceptions of Economic
and Behavioral Differences Between Blacks and Whites: Racial Attitudes of White
Americans and Status Generalization.” Social Psychology Quarterly 69 (4): 367-379.
Kaiser Family Foundation. 2013. “2013 Survey of Americans on the U.S. Role in Global
Health.” http://kff.org/global-health-policy/poll-finding/2013-survey-of-americans-on-
the-u-s-role-in-global-health/
Kelly, Nathan J. 2005. “Political Choice, Public Policy, and Distributional Outcomes.” American
Journal of Political Science 44 (4): 868-880.
Kelly, Nathan J. and Peter K. Enns. 2010. “Inequality and the Dynamics of Public Opinion: The
Self-Reinforcing Link Between Economic Inequality and Mass Preferences.” American
Journal of Political Science 54 (4): 855-870.
24
Kluegel, James R., and Eliot R. Smith. 1982. “Whites’ Beliefs about Blacks’ Opportunity.”
American Sociological Review 47 (4): 518-532.
Luttig, Matthew. 2013. “The Structure of Inequality and Americans’ Attitudes Toward
Redistribution.” Public Opinion Quarterly 77 (3): 811-821.
McCarty, Nolan, Keith T. Poole, and Howard Rosenthal. 2006. Polarized America: The Dance
of Ideology and Unequal Riches. Cambridge, MA: MIT Press.
Meltzer, Allan H., and Scott F. Richard. 1981. “A Rational Theory of the Size of Government."
Journal of Political Economy 89 (5): 914-927.
Nadeau, Richard, Richard G. Niemi, and Jeffrey Levine. 1993. “Innumeracy About Minority
Populations.” Public Opinion Quarterly 57 (3): 332-347.
Nivola, Pietro S., and David W. Brady, eds. 2006. Red and Blue Nation? Characteristics and
Causes of America’s Polarized Politics. Washington, D.C.: Brookings Institution Press.
Oliver, J. Eric. 1999. “The Effects of Metropolitan Economic Segregation on Local Civic
Participation.” American Journal of Political Science 43 (1): 186-212.
Piketty, Thomas, and Emmanuel Saez. 2003. “Income Inequality in the United States: 1913-
1998.” Quarterly Journal of Economics 118 (1): 1-39. Data through 2014 are available
at http://eml.berkeley.edu/~saez/.
Roper Center for Public Opinion Research. 2007.
http://www.ropercenter.uconn.edu/data_access/ipoll/ipoll.html.
Schiffer, Adam J. 2000. “I’m Not That Liberal: Explaining Conservative Democratic
Identification.” Political Behavior 22 (4): 293-310.
25
Skidmore, Mark, Charles L. Ballard, and Timothy R. Hodge. 2010. “Property Value Assessment
Growth Limits and Redistribution of Property Tax Payments: Evidence from Michigan.”
National Tax Journal 63 (3): 509–538.
Stimson, James A. 1999. Public Opinion in America: Moods, Cycles, and Swings. Boulder, CO:
Westview Press.
Stimson, James A., and Christopher Ellis. 2012. Ideology in America. New York: Cambridge
University Press.
U.S. Census Bureau. 2016. Historical Income Tables for Households and People.
Table P-38, Full-Time, Year-Round Workers by Median Earnings and Sex.
Uslaner, Eric M., and Mitchell Brown. 2005. “Inequality, Trust, and Civic Engagement.”
American Politics Research 33 (6): 868-894.
Zeisel, Hans. 1981. “Race Bias in the Administration of the Death Penalty: The Florida
Experience.” Harvard Law Review 95 (2): 456-468.
26
Table 1
Selected Characteristics from July 2010 State of the State Survey (SOSS) and
2009 American Community Survey (National and State, Five-Year Estimates),
Reported as Percentages Unless Otherwise Specified
SOSS
Michigan
USA
Race
Asian 1.2 2.3 4.4
Black 12.8 14.0 12.4
Native American 2.7 0.5 0.8
Other 5.7 1.5 5.7
White 77.8 79.7 74.5
Ethnicity
Hispanic 4.0 4.0 15.1
Sex
Female 52.0 50.8 50.7
Male 48.0 49.2 49.3
Household Income
Below $10,000 3.6
Median
$48,700
Median
$51,425
$10k-$20k 8.9
$20k-$30k 10.4
$30k-$40k 9.1
$40k-$50k 10.2
$50k-$60k 8.2
$60k-$70k 9.7
$70k-$90k 15.9
$90k-$100k 2.4
$100k-$150k 11.6
Above $150k 10.0
27
Table 2
Responses to Public Policy Questions: State of the State Survey
A. Cash Payments to Poor Families (n=887)
“Would you say that cash payments made to poor families by the federal government are much
less than they should be, are somewhat less than they should be, are about what they should be,
are somewhat more than they should be, or are much more than they should be?”
1. Much more than they should be 124 (14.0%)
2. Somewhat more than they should be 204 (23.0%)
3. About what they should be 277 (31.2%) Mean: 2.88
4. Somewhat less than they should be 209 (23.6%)
5. Much less than they should be 72 ( 8.1%)
B. Military Spending (n=956)
“Would you say that government spending on the military is much less than it should be, is
somewhat less than it should be, is about what it should be, is somewhat more than it should be,
or is much more than it should be?”
1. Much less than it should be 118 (12.4%)
2. Somewhat less than it should be 156 (16.3%)
3. About right 344 (36.0%) Mean: 3.14
4. Somewhat more than it should be 140 (14.7%)
5. Much more than it should be 197 (20.6%)
C. Power of Large Corporations (n=957)
“If the political and economic power of large corporations in the United States were reduced,
society would be better off. Would you say you strongly agree, somewhat agree, somewhat
disagree, or strongly disagree?”
1. Disagree strongly 125 (13.1%)
2. Disagree somewhat 156 (16.3%)
3. Neither agree nor disagree (volunteered response)10 ( 1.1%) Mean: 3.59
4. Agree somewhat 392 (41.0%)
5. Agree strongly 273 (28.6%)
D. Abortion (n=962)
“Which of the following statements best describes your opinion on abortion? Do you strongly
favor abortion, favor abortion but with some restrictions, oppose abortion but would allow under
some circumstances, or strongly oppose abortion?”
1. Oppose strongly 262 (27.3%)
2. Oppose but would allow under some circumstances 295 (30.7%)
3. Neither favor nor oppose (volunteered response) 13 ( 1.4%) Mean: 2.72
4. Favor but with some restrictions 303 (31.5%)
5. Favor strongly 88 ( 9.1%)
28
E. Capital Punishment (n=967)
“To what extent do you favor or oppose the death penalty? Would you say you strongly favor,
somewhat favor, somewhat oppose, or strongly oppose the death penalty?”
1. Favor strongly 311 (32.2%)
2. Favor somewhat 303 (31.4%)
3. Neither favor nor oppose (volunteered response) 8 ( 0.8%) Mean: 2.63
4. Oppose somewhat 122 (12.6%)
5. Oppose strongly 222 (23.0%)
F. Rights of Gays and Lesbians (n=959)
“ ‘Gays and lesbians should be granted every legal right that is currently granted to heterosexual
people, such as equal protection against discrimination and the right to marry.’ Would you say
you strongly agree, somewhat agree, somewhat disagree, or strongly disagree?”
1. Disagree strongly 337 (35.2%)
2. Disagree somewhat 151 (15.8%)
3. Neither agree nor disagree (volunteered response) 12 ( 1.3%) Mean: 2.94
4. Agree somewhat 188 (19.6%)
5. Agree strongly 269 (28.1%)
29
Table 3
Responses to Questions Regarding Perceptions of Inequality and Discrimination, Self-
Reported Ideology, and Party Affiliation: State of the State Survey
A. Perceived Changes in Income Difference between High-Income and Low-Income People
in the United States since 1980 (n=951)
1. Decreased A Lot 61 ( 6.4%)
2. Decreased Somewhat 64 ( 6.8%)
3. Remained About the Same 150 (15.7%) Mean: 4.02
4. Increased Somewhat 195 (20.5%)
5. Increased A Lot 481 (50.5%)
B. Perceived Chance That A Person from a Poor Background Can Get Out of Poverty
through Hard Work (n=976)
1. Excellent 170 (17.4%)
2. Good 329 (33.7%)
3. Fair 331 (33.9%) Mean: 2.54
4. Not Very Good 76 ( 7.8%)
5. Poor 69 ( 7.1%)
C. Perceived Extent to Which Black/White Earnings Differences Are Due to Labor-Market
Discrimination (n=930)
1. Mostly Due to Skill Differences 279 (30.0%)
2. More Due to Skill Differences than Discrimination 278 (29.9%)
3. Skill Differences and Discrimination about Equal 37 ( 4.0%) Mean: 2.64
4. More Due to Discrimination than Skill Differences 170 (18.2%)
5. Mostly Due to Discrimination 167 (17.9%)
D. Perceived Extent to Which Female/Male Earnings Differences Are Due to Labor-
Market Discrimination (n=939)
1. Mostly Due to Skill Differences 219 (23.3%)
2. More Due to Skill Differences than Discrimination 199 (21.2%)
3. Skill Differences and Discrimination about Equal 38 ( 4.0%) Mean: 3.09
4. More Due to Discrimination than Skill Differences 244 (26.0%)
5. Mostly Due to Discrimination 240 (25.5%)
E. Self-Reported Ideology (n=920)
1. Very Liberal 111 (12.1%)
2. Somewhat Liberal 117 (12.7%)
3. Lean Liberal 117 (12.7%)
4. Middle 75 ( 8.1%) Mean: 4.33
5. Lean Conservative 144 (15.7%)
6. Somewhat Conservative 229 (24.9%)
7. Very Conservative 127 (13.8%)
30
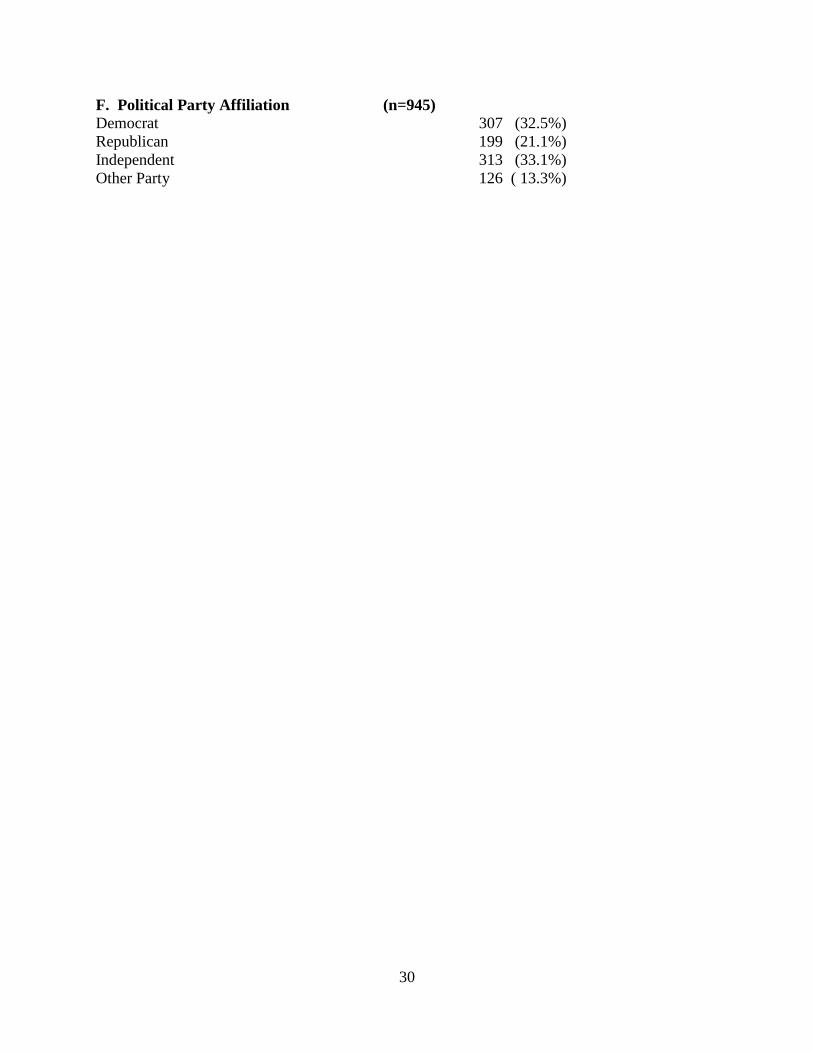
F. Political Party Affiliation (n=945)
Democrat 307 (32.5%)
Republican 199 (21.1%)
Independent 313 (33.1%)
Other Party 126 ( 13.3%)
31
Table 4
Effects on Preferences Regarding Cash Payments for Poor Families (OLS)a
Independent Variable Perceptions of
Inequality
Ideology & Party
Affiliation Full Model
Discrimination 0.171***
(0.051)
0.164***
(0.057)
Change in Income
Inequality
0.105**
(0.053)
0.107**
(0.052)
Escape Poverty 0.156**
(0.065)
0.143**
(0.068)
Ideology/
Conservative
-0.061
(0.039)
-0.012
(0.039)
Democratb 0.348
(0.231)
0.330
(0.215)
Independentb 0.285
(0.211)
0.339*
(0.202)
Other Partyb 0.155
(0.271)
0.017
(0.256)
Female 0.356**
(0.166)
-0.418**
(0.166)
0.358**
(0.163)
Age 0.006
(0.004)
0.005
(0.004)
0.006
(0.004)
Asianc 1.549***
(0.455)
0.987**
(0.421)
1.384***
(0.477)
Blackc 0.305
(0.268)
0.206
(0.283)
0.179
(0.264)
Hispanic 0.635
(0.475)
0.864
(0.466)
0.588
(0.405)
Native Americanc -0.342
(0.251)
0.015
(0.237)
-0.357
(0.285)
Other Ethnicityc 0.303
(0.469)
-0.328
(0.500)
0.211
(0.420)
Income Above $100Kd 0.202
(0.283)
0.199
(0.308)
0.308
(0.298)
Income Between $60K
and $100Kd
0.199
(0.242)
0.297
(0.279)
0.307
(0.259)
Income Between $20K
and $60Kd
0.523**
(0.237)
0.478*
(0.264)
0.544**
(0.254)
Married -0.117
(0.153)
-0.038
(0.165)
-0.112
(0.150)
Some College 0.048
(0.173)
0.106
(0.177)
0.054
(0.171)
Bachelor’s Degree -0.070
(0.239)
0.030
(0.239)
-0.014
(0.233)
Graduate Work 0.326
(0.220)
0.306
(0.218)
0.350*
(0.212)

32
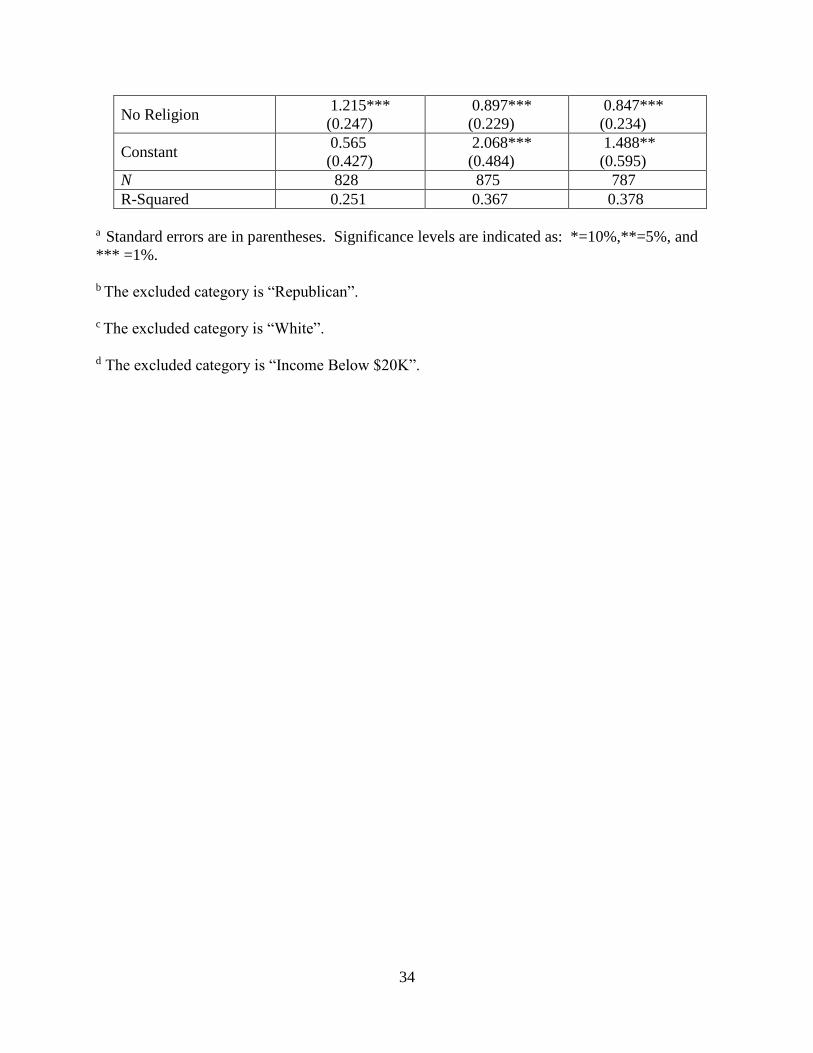
No Religion 0.021
(0.185)
-0.001
(0.172)
-0.111
(0.178)
Constant 0.766*
(0.461)
2.006***
(0.550)
0.555
(0.604)
N 775 798 739
R-Squared 0.179 0.141 0.212
a Standard errors are in parentheses. Significance levels are indicated as: *=10%,**=5%, and
*** =1%.
b The excluded category is “Republican”.
c The excluded category is “White”.
d The excluded category is “Income Below $20K”.
33
Table 5
Effects on Preferences Regarding Abortion (OLS)a
Independent Variable Perceptions of
Inequality
Ideology & Party
Affiliation Full Model
Discrimination 0.057
(0.061)
-0.026
(0.061)
Change in Income
Inequality
0.040
(0.061)
0.018
(0.055)
Escape Poverty 0.142**
(0.065)
0.146**
(0.067)
Ideology/
Conservative
-0.219***
(0.041)
-0.199***
(0.045)
Democratb 0.505***
(0.193)
0.549***
(0.207)
Independentb 0.078
(0.171)
0.143
(0.185)
Other Partyb 0.119
(0.277)
0.181
(0.303)
Female 0.240
(0.154)
0.198
(0.146)
0.233
(0.149)
Age 0.014***
(0.004)
0.013***
(0.004)
0.014***
(0.004)
Asianc 1.340***
(0.490)
0.230
(0.394)
0.401
(0.400)
Blackc 0.106
(0.220)
-0.111
(0.250)
-0.487***
(0.153)
Hispanic -0.117
(0.488)
-0.464
(0.388)
-0.310
(0.234)
Native Americanc 0.595*
(0.354)
1.148***
(0.410)
0.908**
(0.377)
Other Ethnicityc 0.122
(0.432)
-0.053
(0.221)
-0.100
(0.272)
Income Above $100Kd 0.914***
(0.285)
1.012***
(0.276)
0.997***
(0.285)
Income Between $60K
and $100Kd
0.170
(0.246)
0.168
(0.239)
0.187
(0.256)
Income Between $20K
and $60Kd
0.446**
(0.206)
0.480**
(0.223)
0.457**
(0.227)
Married -0.419***
(0.161)
-0.365**
(0.158)
-0.446***
(0.160)
Some College 0.335*
(0.186)
0.316*
(0.173)
0.361**
(0.178)
Bachelor’s Degree 0.119
(0.207)
0.153
(0.182)
0.239
(0.192)
Graduate Work 0.957***
(0.218)
0.780***
(0.193)
0.544***
(0.198)
34
No Religion 1.215***
(0.247)
0.897***
(0.229)
0.847***
(0.234)
Constant 0.565
(0.427)
2.068***
(0.484)
1.488**
(0.595)
N 828 875 787
R-Squared 0.251 0.367 0.378
a Standard errors are in parentheses. Significance levels are indicated as: *=10%,**=5%, and
*** =1%.
b The excluded category is “Republican”.
c The excluded category is “White”.
d The excluded category is “Income Below $20K”.
35
Table 6
Effects on Preferences Regarding Gay and Lesbian Rights (OLS)a
Independent Variable Perceptions of
Inequality
Ideology & Party
Affiliation Full Model
Discrimination 0.193**
(0.082)
0.137*
(0.080)
Change in Income
Inequality
-0.016
(0.093)
-0.047
(0.078)
Escape Poverty 0.255***
(0.089)
0.221**
(0.103)
Ideology/ Conservative -0.200***
(0.051)
-0.151***
(0.056)
Democratb 1.213***
(0.261)
1.193***
(0.262)
Independentb 0.419*
(0.253)
0.396
(0.257)
Other Partyb 0.210
(0.406)
0.165
(0.454)
Female 0.312
(0.201)
0.345*
(0.176)
0.252
(0.180)
Age 0.004
(0.006)
0.001
(0.005)
0.002
(0.005)
Asianc 2.149***
(0.616)
0.668
(0.474)
0.827*
(0.401)
Blackc 0.117
(0.243)
-0.219
(0.275)
-0.379
(0.261)
Hispanic -1.379*
(0.789)
-1.600
(1.007)
-1.401
(0.950)
Native Americanc 0.999**
(0.429)
1.648***
(0.454)
0.908**
(0.377)
Other Ethnicityc 0.487
(0.679)
-0.068
(0.628)
0.096
(0.818)
Income Above $100Kd 0.635*
(0.360)
0.715**
(0.353)
0.936***
(0.356)
Income Between $60K
and $100Kd
0.570*
(0.322)
0.648**
(0.322)
0.866***
(0.327)
Income Between $20K
and $60Kd
0.684**
(0.267)
0.671***
(0.250)
0.803***
(0.267)
Married -0.031
(0.247)
-0.013
(0.223)
-0.068
(0.220)
Some College 0.444*
(0.234)
0.435**
(0.218)
0.385*
(0.220)
Bachelor’s Degree 0.391
(0.290)
0.477*
(0.257)
0.495*
(0.268)
Graduate Work 0.200
(0.329)
0.103
(0.276)
0.099
(0.286)
36
No Religion 1.143***
(0.287)
0.894***
(0.258)
0.781***
(0.280)
Constant 0.512
(0.619)
2.097***
(0.556)
1.053
(0.706)
N 831 878 791
R-Squared 0.198 0.322 0.339
a Standard errors are in parentheses. Significance levels are indicated as: *=10%,**=5%, and
*** =1%.
b The excluded category is “Republican”.
c The excluded category is “White”. d The excluded category is “Income Below $20K”.
37
Table 7
Regression Coefficients for Perceptions of Inequality, Ideology, and Party Affiliation, Six Policy Areas (OLS estimates)a
Dependent
Variable
Specifi-
cation
Percep-
tions of
Discrim.
Perceptions
of
Change in
Income
Inequality
Perceptions
of Chances
for
Poor to
Escape
Poverty
Self-
Reported
Ideology
Pol.
Party:
Dem.
Pol.
Party:
Indep.
Other
Party
Cash Pmts. for Poor A
0.171***
0.105** 0.156** -- -- -- --
Cash Pmts. for Poor B -- -- -- -0.061 0.348 0.285 0.155
Cash Pmts. for Poor C
0.164***
0.107** 0.143** -0.012 0.330 0.338* 0.017
Military Spending A
0.181***
0.151*** -0.016 -- -- -- --
Military Spending B -- -- -- -0.083* 0.460** 0.005 0.227
Military Spending C
0.145**
0.169*** -0.056 -0.040 0.449** 0.030 0.437
Power of Corps. A 0.003 0.129**
0.183***
-- -- -- --
Power of Corps. B -- -- -- -0.063 0.135 -0.177 -0.013
Power of Corps. C -0.011 0.113*
0.231***
-0.007 0.324 -0.012 0.168
Abortion
A 0.057 0.040 0.142** -- -- -- --
Abortion
B -- -- -- -0.219***
0.505**
*
0.078 0.119
Abortion
C -0.026 0.018 0.146** -0.199***
0.549**
*
0.143 0.181
Death Penalty
A
0.243***
0.011 0.113 -- -- -- --
Death Penalty
B -- -- -- -0.158*** 0.312 0.074 0.201
Death Penalty
C
0.156**
0.004 0.051 -0.144** 0.338 0.089 0.092
Gay/Lesbian Rights
A
0.193**
-0.016
0.255***
-- -- -- --
Gay/Lesbian Rights
B -- -- -- -0.200***
1.213**
*
0.419* 0.210
Gay/Lesbian Rights
C
0.137*
-0.047 0.221** -0.151***
1.193**
*
0.397 0.165
a Significance levels are indicated as: *=10%, **=5%, and *** =1%.