Embed Size (px)
Citation preview

HES5 silencing is an early and recurrent change in prostate tumourigenesis Charles E Massie1, Inmaculada Spiteri1, Helen Ross-Adams1, Hayley Luxton1, Jonathan Kay1, Hayley C Whitaker1, Mark J Dunning1, Alastair D Lamb1,7,8, Antonio Ramos-Montoya1, Daniel S Brewer3, Colin S. Cooper3, Rosalind Eeles2,4, UK Prostate ICGC Group, Anne Y Warren6, Simon Tavaré1, David E. Neal1,7,8 and Andy G Lynch1 1 Cancer Research UK Cambridge Institute, University of Cambridge, Cambridge, UK. 2 Division of Genetics and Epidemiology, The Institute Of Cancer Research, Sutton, UK 3 Also at Department of Biological Sciences and School of Medicine, University of East Anglia, Norwich, UK 4 Royal Marsden NHS Foundation Trust, London and Sutton, UK 5 UK Prostate ICGC Group listed in Supplementary Material-1 6 Department of Pathology, Addenbrooke's Hospital, Hills Road, Cambridge CB2 2QQ, UK 7 Department of Urology, Addenbrooke's Hospital, Hills Road, Cambridge CB2 2QQ, UK 8 Department of Surgical Oncology, University of Cambridge, Addenbrooke's Hospital, Hills Road, Cambridge CB2 2QQ Correspondence to: [email protected] or [email protected]
Short title
HES5 silenced early in prostate tumourigenesis Keywords
Prostate cancer, epigenetics, methylation, HES5, HES6, AR, ERG, NOTCH Word count
4,586
Page 1 of 23 Accepted Preprint first posted on 5 January 2015 as Manuscript ERC-14-0454
Copyright © 2015 by the Society for Endocrinology.
Abstract
Prostate cancer is the most common cancer in men, resulting in over 10,000 deaths per year in the UK. Sequencing and copy number analysis of primary tumours has revealed heterogeneity within tumours and an absence of recurrent founder mutations, consistent with non-genetic disease initiating events. Using methylation profiling in a series of multi-focal prostate tumours we identify promoter methylation of the transcription factor HES5 as an early event in prostate tumourigenesis. We confirm that this epigenetic alteration occurs in 86-97% of cases in two independent prostate cancer cohorts (n=49 and n=39 tumour-normal pairs). Treatment of prostate cancer cells with the demethylating agent 5-aza-2′-deoxycytidine increased HES5 expression and down-regulated its transcriptional target HES6, consistent with functional silencing of the HES5 gene in prostate cancer. Finally we identify and test a transcriptional module involving the AR, ERG, HES1 and HES6 and propose a model for the impact of HES5 silencing on tumourigenesis as a starting point for future functional studies.
Page 2 of 23
Introduction
Current analysis of cancer genome sequencing has revealed disease processes and genomic alterations that may underlie disease initiation or evolution (Baca, et al. 2013; Nik-Zainal, et al. 2012; Tarpey, et al. 2013). These approaches have identified and enumerated recurrently mutated driver genes in several cancer types, such as KRAS which is mutated in 93% of pancreatic cancers (Biankin, et al. 2012) and TP53 which is mutated in 96% of high grade serous ovarian cancers (2011), 69% of oesophageal cancer (Weaver, et al. 2014) and over 50% of colorectal cancers (2012). In contrast with these highly recurrent mutations a recent study of 112 aggressive primary prostate cancers reported that the most significantly mutated gene (SPOP) was altered in only 13% of cases, with the next most commonly affected gene TP53 affected in only 6% of prostate tumours (Barbieri, et al. 2012). Therefore, while genome sequencing approaches have provided important insights into the biology of prostate cancer (Baca et al. 2013; Berger, et al. 2011; Lindberg, et al. 2013; Weischenfeldt, et al. 2013) the high intra- and inter-tumour heterogeneity coupled with the small samples sizes may have limited the identification of genetic driver events in primary tumours. Indeed previous genome sequencing studies have reported few common mutations between different tumour foci within the same prostate (Lindberg et al. 2013), highlighting marked intra-tumour heterogeneity and the absence of a genetic founder mutation. This complexity has led many groups to focus on late stage, aggressive disease with the aim of identifying genomic events associated with disease progression (Barbieri et al. 2012; Grasso, et al. 2012). However, their remain important unanswered questions over the early stages of prostate tumour evolution where genetic events appear to be for the most part heterogeneous. One notable exception to this are gene fusions involving ETS transcription factors that have been found to occur in approximately half of all prostate cancers (Perner, et al. 2006; Tomlins, et al. 2005). However, these androgen receptor (AR) driven gene fusions alone are insufficient to initiate prostate tumours in disease models (Carver, et al. 2009; Chen, et al. 2013) and may not be early ‘founder’ events in disease evolution (Barry, et al. 2007; Mertz, et al. 2013; Minner, et al. 2013). Therefore current evidence would seem to suggest that if a common initiating driver event exists it is not genetic, implicating other mechanisms in disease aetiology. In addition to somatic mutation several other disease-initiating pathways have been proposed in prostate cancer including germline predisposition (Eeles, et al. 2013; Kote-Jarai, et al. 2011), telomere shortening (Heaphy, et al. 2013; Sommerfeld, et al. 1996), chronic inflammation (Caini, et al. 2014; Elkahwaji, et al. 2009), metabolic stress (Freedland 2005; Kalaany and Sabatini 2009) and epigenetic alterations (Kanwal, et al. 2014; Lee, et al. 1994). It is likely that non-genetic and genetic alterations interact during tumourigenesis and several studies have identified interactions between somatic mutations and micro-environmental changes (Garcia, et al. 2014), inflammation (Kwon, et al. 2014) and metabolism (Kalaany and Sabatini 2009). Current technologies allow accurate identification and quantification of epigenetic
Page 3 of 23

alterations and are therefore a tractable second line of enquiry to identify driver events in prostate tumourigenesis. We have recently identified a role for the enhancer of split transcription factor HES6 in prostate cancer and AR signaling (Ramos-Montoya, et al. 2014). Herein we characterize an epigenetic alteration at the promoter of the related HES5 gene, which was recently reported in a panel of genes that showed promise as a prostate cancer marker in biopsy samples (Paziewska, et al. 2014). We profile this change in detail and show it to be an early event in prostate cancer development and highly recurrent across three unrelated prostate tumour cohorts. We then characterize an interaction between the epigenetic silencing of HES5 and the expression of HES6 and provide evidence for interactions with known oncogenic pathways in prostate cancer (namely AR signaling and ERG gene-fusions), highlighting a transcriptional network that is altered in prostate cancer development first by an epigenetic change and then by a genomic rearrangement. Materials and methods
Sample cohorts
In a series of four radical prostatectomy specimens we systematically dissected the whole prostates, identified regions containing tumour and harvested seventeen tumour-rich samples from thirteen spatially separated tumour cores (median 46% tumour, IQR 36-62%), four adjacent benign samples and three whole blood samples (Figure 1a and Supplementary Figure 1a). Each tumour core was taken from a 5mm tissue slice and the tumour content of samples used for DNA extraction was assessed by a Pathologist using H&E staining of immediately adjacent sections (Warren, et al. 2013). From two such cores we also took three sets of sections for DNA extraction to allow assessment of heterogeneity within cores in addition to the spatial heterogeneity within and between cancerous prostates (Supplementary Figure 1a). These samples were used for global methylation profiling using Infinium HumanMethylation450 arrays (see below for details). In a separate cohort of 39 matched prostate tumour and adjacent benign samples we performed targeted bisulfite sequencing of the HES5 promoter, to assess the frequency of HES5 hypermethylation in prostate cancer. This analysis provides a promoter-wide view of DNA methylation changes at the HES5 promoter (in contrast to the limited number of CpGs assessed using methylation profiling arrays). In an unrelated, larger cohort of prostate cancers with publicly available methylation array data (n=304 tumours, n=49 matched normal samples) (Weinstein, et al. 2013) we assessed the recurrence of HES5 promoter methylation.
Page 4 of 23
DNA methylation profiling in blood, benign prostate and multiple spatially
separate tumour foci
Clinical samples for analysis were collected from prostatectomy patients with full research consent at the Addenbrooke’s Hospital, Cambridge, UK. Prostates were sliced and processed as described previously (Warren et al. 2013). A single 5mm slice of the prostate was selected for research purposes. Tissue cores of 4mm or 6mm were taken from the slice and frozen. Frozen cores were mounted vertically and sectioned transversely giving a single 5µm frozen section for H&E staining followed by 6x50µm sections for DNA preparation using the Qiagen Allprep kit. Using the Infinium HumanMethylation450 BeadChip Kit DNA was subjected to bisulfite conversion, amplification, fragmentation, hybridization, extension and labeling according to the manufacturers instructions (Illumina, UK). Bead summary data from Infinium HumanMethylation450 arrays were processed using the Minfi package in the R statistical software (Aryee, et al. 2014; R-Core-Team 2014). As previously described probe types were normalized separately (Marabita, et al. 2013) before generating M-values and B-values for exploratory analysis. Summary plots were generated in the R statistical software (R-Core-Team 2014). Raw and processed data have been uploaded to the ArrayExpress portal under accession E-MTAB-2964, in addition all code used to generate figures in the paper are included as part of the R-markdown HTML document available on our group webpage. Targeted bisulfite sequencing
PCR primers were designed to amplify a 441bp fragment from the HES5 promoter containing 60 CpGs (HES5-BSx-F: 5’-GAGGGGGTGTTAGGTTGGTT-3’; HES5-BSx-R: 5’-ACCCACCTACTCCTTAAAAAAC-3’). Amplicons were generated separately for 39 matched tumour normal sample pairs and assessed before preparing barcoded sequencing libraries using a Nextera XT kit (Illumina, UK). Barcoded DNAs were quantified and equal amounts of each indexed library were then pooled and sequenced on an Illumina MiSeq (PE300). Fastq data files were split using index sequences and downstream methylation analysis was performed using Bismark (Krueger and Andrews 2011) and summary plots and test statistics were generated in the R statistical software (R-Core-Team 2014). This analysis gave a median sequencing coverage of 786x (Supplementary
Figure 3). All code used to generate figures in the paper are included as part of the R-markdown HTML document available on our group webpage.
Data mining
An R markdown document containing all code required to reproduce our analysis and all figures has been included as a supplementary HTML document (available on our group webpage). Briefly, DNA methylation 450k array data for LNCaP prostate cancer cells and PrEC benign prostate epithelial cells (CC-2555, Lonza) were obtained from GEO (triplicate data for each cell line from GSE34340 and singleton data for each cell line from GSE40699) (Statham, et al. 2012; Varley, et al. 2013) and summary plots were generated using the R statistical software (R-Core-Team 2014). Gene expression data from LNCaP cells treated with the demethylating agent 5-aza-2′-deoxycytidine were retrieved from GEO (GSE25346). Gene expression data from human prostate benign and tumour tissues were obtained from GEO (GSE3325). Gene expression data from control
Page 5 of 23

and ERG-knockdown VCaP cells was retrieved from GEO (GSE60771). All GEO data were retrieved using the GEOquery package in the R statistical software and summary plots were generated using the same software (Davis and Meltzer 2007; R-Core-Team 2014). Transcriptional networks were drawn using the BioTapestry application (Longabaugh 2012) constructing models using ChIP-seq binding profiles, expression correlations and published transcriptional links. HES5 motif enrichment analysis
The position weight matrix for HES5 was obtained from Yan, et al 2013 (Yan, et al. 2013) and used to search the genomic sequence of the HES6 gene locus (including 1kb upstream and 1kb downstream sequence). Motif searches were carried out using the RSAT matrix-scan (with human ‘upstream-noorf’ background control) (Turatsinze, et al. 2008) and motif scores were visualized using BioSAVE (Pollock and Adryan 2008).
Androgen time-course gene expression profiling in LNCaP and VCaP cells
Following 72hr steroid depletion in media containing 10% charcoal stripped FBS LNCaP and VCaP cells were subjected to androgen stimulation (1nM R1881) or vehicle control treatment (0.01% ethanol). Cells were harvested at the indicated time-points over a 24h period following treatment and RNA extracted using Trizol (Life Technologies). For the LNCaP treatment time-course a full analysis has been published (Massie, et al. 2011) and raw and normalized data have been deposited at GEO (GSE18684). Data for the VCaP androgen treatment time-course have also been deposited at ArrayExpress (E-MTAB-2968). Expression data were analysed using the beadarray software, with spatial artefacts identified and removed automatically (BASH) and curated manually (Cairns, et al. 2008; Dunning, et al. 2007). The resulting data set was summarized with outliers removed to obtain mean log-intensity and standard error for each probe/array combination. Results
HES5 promoter methylation is an early event in prostate tumourigenesis
In order to investigate the epigenetic landscape within and between prostate tumours we systematically dissected four radical prostatectomy specimens, harvesting seventeen tumour-rich samples from thirteen spatially separated tumour cores (median 46% tumour, IQR 36-62%), four adjacent benign samples and three whole blood samples (Figure 1a and Supplementary Figure 1a). Consistent with previous reports (Lindberg et al. 2013) these spatially separated tumour cores appeared to be only distantly related by somatic mutations and so our aim was to identify early (common ‘trunk’) epigenetic events. Analysis of the methylation distributions for all assayed CpGs revealed that global methylation profiles were similar between tumour and benign prostate samples (Spearman’s rank correlation of tumour versus benign methylation profiles 0.94-1.00; Supplementary Figure 1b-e). A recent study highlighted eight genomic loci that showed differential methylation in a series of unmatched tumour and benign prostate samples (i.e. from different individuals), a subset of which were proposed as molecular markers to support pathological diagnosis of biopsies
Page 6 of 23
(Paziewska et al. 2014). We assessed the reproducibility and clonality of these eight differentially methylated regions in our cohort of cases with multiple spatially separate tumour samples, matched benign tissue and blood DNA samples (Figure 1b and Supplementary Figure 1f-m). In our cohort the promoter region of the HES5 gene showed the largest and most consistent increase in methylation in tumour samples compared to matched normal tissue (median 7.6-fold increase, median variance = 0.003), together with consistently low methylation in adjacent normal tissue (median normal methylation = 0.08, median variance = 0.0006; Figure 1b-d and Supplementary
Figure 1f-m). The study by Paziewska et al. showed low HES5 promoter methylation in benign prostatic hyperplasia and hypermethylation in prostate tumour biopsies (Paziewska et al. 2014). Among the other regions examined we found that tumour methylation at the ITGB2 and mir10B loci showed no difference with matched benign tissue, the APC locus showed variable differences between tumour and matched benign and the remaining four loci (RARB, C5orf4, TACC2 and DGKZ) showed increased methylation in tumour versus matched benign samples, although to a lesser extent than the HES5 locus (Figure 1b-d and Supplementary Figure 1f-m). The tumour-specific methylation changes at the HES5 promoter were consistent within and between cases and comparable to the hypermethylation observed at the GSTP1 gene (Figure 1d-e), which is invariably silenced in prostate cancer and has been extensively studied (Lee et al. 1994). These consistent methylation changes at the HES5 promoter appear to be locus specific, as highlighted by the similarity of global methylation profiles (Supplementary Figure 1b-e) and the absence of consistent changes in DNA methylation at other genomic loci across spatially separated tumour samples from the same patient (Supplementary Figure 2). Therefore using our cohort of cases with multiple tumour foci and matched benign samples we found that hypermethylation at the HES5 promoter region was observed across tumour samples from all patients and in all spatially separated tumour foci from the same patient. The homogenous hypermethylation of the HES5 promoter across genetically heterogeneous tumour cores is consistent with this being an early event in tumourigenesis (Figure 1c and Supplementary Figure 1m). HES5 promoter methylation is a recurrent event in prostate tumours To assess the frequency of HES5 hypermethylation in prostate cancer we performed targeted bisulfite sequencing of the HES5 promoter in a separate cohort of 39 matched tumour and adjacent benign samples. This analysis included 60 CpGs in the HES5 promoter and gave a median sequencing coverage of 786x (Supplementary Figure 3). This analysis provided a comprehensive view of DNA methylation across the HES5 gene promoter, in contrast to the 4 CpGs assessed using methylation arrays and a narrow genomic window in a previous study (Paziewska et al. 2014). Benign samples showed hypomethylation across the entire HES5 promoter, whereas matched tumour samples had consistent hypermethylation across all 60 CpGs assayed (Figure
2a-b and Supplementary Figure 4). This pattern of hypomethylation in benign tissue and hypermethylation in tumours was consistent in 38/39 matched
Page 7 of 23
tumour normal pairs (97% at p<0.05, Wilcox test; Figure 2c). In the single discordant sample pair there was increased methylation in the matched benign sample that was maintained in the tumour (median methylation 20.7 and 15.4, respectively; Supplementary Figure 4), consistent with either a pre-transformation change in this single case or tumour contamination of this normal tissue core. We also assessed HES5 methylation in an additional prostate cancer patient cohort using publicly available methylation array data (n=304 tumours, n=49 matched normal samples) (Weinstein et al. 2013). In this second validation cohort we again observed hypermethylation in tumours and hypomethylation in benign samples (42/49 pairs, 86% at p<0.05, Wilcox test; Figure 2d-e). Receiver operating characteristic (ROC) curve analysis for these two geographically distinct validation cohorts run on different platforms revealed high sensitivity and specificity (PPV=0.92, AUC>0.9, Figure 2f). These results clearly demonstrate that in addition to being an early event in prostate tumourigenesis HES5 methylation is a highly recurrent event in prostate cancer, suggesting potential as a specific disease marker and an early acquired (or selected) event in prostate tumourigenesis. HES5 is silenced in prostate cancer cells and demethylation restores expression Consistent with observations in human tumours we found that LNCaP prostate cancer cells exhibit hypermethylation of the HES5 promoter, in contrast to HES5 hypomethylation in benign epithelial cells PrEC (Figure 3a). The expression of HES5 is low or undetectable in cultured prostate cancer cell lines and is also low in human prostate tumours (Supplementary Figure 5a+c and Figure 3d+f), consistent with epigenetic silencing of HES5 in prostate cancer (Supplementary
Figure 5g-h). Treatment of LNCaP cells with the DNA demethylating agent 5-aza-2′-deoxycytidine caused de-repression of the HES5 gene (Figure 3b), consistent with active epigenetic silencing of the HES5 gene in prostate cancer cells. HES5 epigenetic silencing is associated with HES6 expression
HES5 is known to play a similar role to HES1 in developmental processes (Hatakeyama, et al. 2004; Hatakeyama, et al. 2006; Tateya, et al. 2011) and both are involved in negative feedback loops with HES6 (Fior and Henrique 2005; Jacobsen, et al. 2008), which antagonizes the activity of HES1 and HES5 (Bae, et al. 2000; Salama-Cohen, et al. 2005). Of note HES6 was recently reported to play an important functional role in prostate cancer enhancing oncogenic signaling through the AR (Ramos-Montoya et al. 2014). Although a rare HES6 gene fusion has been reported (Annala, et al. 2014) no molecular mechanism has been found for the frequent up-regulation of HES6 in prostate cancer. In prostate cancer cells de-repression of HES5 with the demethylating agent 5-aza-2′-deoxycytidine resulted in a delayed down-regulation of HES6 (Figure 3c), consistent with HES5 repression of HES6. We also observed an inverse relationship between HES5 and HES6 expression in a series of primary tumours compared to benign prostate samples, where HES5 expression decreased and HES6 expression increased in tumour versus benign prostate samples (Figure 3d-e). In our cohort of multiple spatially separated tumour samples we found that HES5
Page 8 of 23
expression was decreased in tumour cores compared to matched benign tissue and that HES6 was also increased in some of those tumour cores, consistent with HES5 silencing in tumourigenesis and additional mechanisms regulating HES6 expression (Supplementary Figure 5e-f). However, we found no evidence of a correlation between HES5 methylation and expression in a larger series of tumours (n=39), nor between HES5 and HES6 expression in this tumour cohort (Figure 3f). This lack of correlation may at least in part be explained by the low or absent expression of HES5 in prostate tumour samples (Figure 2 and Figure
3d+f) confounding such correlative analysis. Indeed we found that HES5 expression appeared to be low and showed little variation in this series of 39 prostate tumours (Figure 3f). The few samples that had slightly higher HES5 expression also had low HES6 expression (Figure 3f), which although not compelling alone is consistent with our other data supporting an inverse relationship between HES5 and HES6 in addition to highlighting the recurrent silencing of HES5 in tumourigenesis. There are no successful HES5 genomic binding data nor chromatin immunoprecipitation grade antibodies for HES5 therefore we could not assess direct binding of HES5 at the HES6 gene locus (Yan et al. 2013). However, the preferred consensus DNA binding sequence of HES5 has been determined experimentally (Yan et al. 2013) and we found strong HES5 consensus sites in and around the HES6 gene (Supplementary Figure 5i-k). Taken together our observations of (1) the inverse correlation between HES5 and HES6 in cancer cells treated with 5-aza-2′-deoxycytidine, (2) their inverse correlation in tumour-normal comparisons and (3) strong consensus HES5 binding sites at the HES6 gene locus suggests that HES5 may repress HES6 in prostate epithelial cells. The ubiquitous HES5 silencing in tumours cells may therefore potentiate (or de-repress) HES6 expression in prostate tumours. ERG and HES6 expression show an inverse relationship
Despite the early and frequent silencing of HES5 in prostate cancer we observed variable expression of the HES5 transcriptional target HES6 in prostate tumour samples (Fior and Henrique 2005) (Figure 3f and Supplementary Figure 5f), prompting us to investigate other factors that may regulate HES6 expression in prostate tumour cells. We found that variations in HES6 expression showed an inverse relationship with expression of the frequently rearranged ERG gene in prostate tumours, highlighted by an inverse correlation (r=-0.28) and mutual exclusivity of HES6 and ERG expression (i.e. no samples have both high ERG and HES6 expression, Figure 3g left panel). This inverse relationship is illustrated clearly by the increasing difference between ERG and HES6 at higher levels of expression (i.e. divergence from zero with increasing expression, Figure 3g
right panel). ERG and HES1 expression show a positive correlation
In contrast the other major HES6 antagonist HES1 (Bae et al. 2000; Hatakeyama et al. 2004; Hatakeyama et al. 2006; Jacobsen et al. 2008) showed a strong positive correlation with ERG expression (r=0.65; Figure 3h), suggesting an ERG-HES1-HES6 transcriptional network in ERG-fusion positive prostate cancer cells (Figure 3g-i). In support of this prediction we found evidence for extensive ERG binding at the HES1 gene locus (Figure 4f) and also confirmed the
Page 9 of 23
previously reported AR binding sites upstream of the HES6 gene (Ramos-Montoya et al. 2014) by using multiple data sets (Figure 4g). A transcriptional network involving HES5, AR, ERG and HES6
Combining our observations of HES5 silencing in prostate cancer with expression correlations in prostate tissue, DNA binding profiles for ERG and the AR and published transcriptional links (i.e. between HES5-HES6 (Fior and Henrique 2005), HES1-HES6 (Jacobsen et al. 2008), reciprocal HES6-HES1/5 negative-feedback (Bae et al. 2000; Hatakeyama et al. 2006; Salama-Cohen et al. 2005) and AR-HES6 (Ramos-Montoya et al. 2014)) we constructed models of putative gene expression networks in benign prostate, prostate cancer and prostate cancer harboring ERG-rearrangements (Figure 3j). In this model we predict that [i] HES5 expression in benign epithelial cells contributes to HES6 repression and [ii] HES5 promoter methylation and silencing in prostate tumours potentiates AR activation of HES6 to start an oncogenic feed-forward transcriptional signaling network (Figure 3j). Finally our model suggests that in tumour cells harbouring an ERG gene fusion [iii] AR activation of the ERG fusion gene creates a dynamic negative feedback loop impacting on both the AR and HES6, creating a more complex transcriptional network (Figure 3j). Negative feedback loops are common motifs in biological networks and have been shown to increase robustness and speed-up response times of transcriptional circuits (Austin, et al. 2006; Nevozhay, et al. 2009; Rosenfeld, et al. 2002; Shen-Orr, et al. 2002). Therefore our model may highlight a previously unknown signaling node in ERG-positive tumours that may increase the robustness and response-rates of key pathways in prostate cancer. ERG-fusion status affects HES1 and HES6 regulation by the AR
We tested the putative AR-HES6 and AR-ERG-HES1-HES6 transcriptional networks in AR-positive prostate cancer cells with and without TMPRSS2-ERG gene fusions (VCaP and LNCaP, respectively; Figure 4). Using an androgen stimulation time-course we were able to both track changes in gene expression and map their dynamics in prostate cancer cells with and without AR-regulated ERG-fusion expression following AR stimulation (Massie et al. 2011; Tomlins et al. 2005). We observed early up-regulation of the known AR target gene TMPRSS2 in both ERG-fusion positive and ERG-fusion negative cells in response to androgen stimulation (Figure 4a), while ERG induction only occurred in TMPRSS2-ERG fusion positive cells (Supplementary Figure 7a). Consistent with its epigenetic silencing we found low expression and no change in HES5 expression in either cell type (Supplementary Figure 7b). HES1 expression was not significantly changed in ERG-fusion negative cells but showed strong androgen induction in ERG-fusion positive cells (Figure 4b). HES6 expression was increased in ERG-fusion negative cells but was down-regulated in ERG-fusion positive cells (Figure 4c). Defining the timing of gene expression changes (‘change–points’) for these genes in ERG-fusion positive cells shows that the sequence of events is: (1) TMPRSS2-ERG up-regulation; (2) HES1 up-regulation; (3) HES6 down-regulation (Figure 4e). These data show that HES1 is only induced by androgen signaling in ERG-fusion positive cells and that induction precedes HES6 repression. This transcriptional data is supported by genome-wide binding profiles showing that the AR is recruited to the HES6 gene locus
Page 10 of 23
(Figure 4g) but not to the HES1 gene locus in ERG-fusion negative cells (Figure
4f). However, in ERG-fusion positive cells ERG binding is widespread at the HES1 locus (Figure 4f), consistent with direct ERG regulation of the HES1 gene. HES1 expression is dependent on ERG
To test this further we looked at the expression of HES1 following ERG knockdown in VCaP cells (Mounir, et al. 2014) (Figure 4h and Supplementary
Figure 6b-c) and found that HES1 expression was dependent on the expression of ERG (Figure 4i and Supplementary Figure 6d-e), further supporting our model. In addition to the timing of expression changes in response to androgen stimulation these data support an AR-ERG-HES1-HES6 transcriptional network in ERG-fusion positive prostate cancer cells. While in ERG-fusion negative cells a simpler AR-HES6 network seems to occur. In each case these transcriptional networks may have been preceded (and potentiated) by HES5 epigenetic silencing in early tumourigenesis. Discussion
Our data are consistent with an early role in prostate tumourigenesis for promoter-wide hypermethylation of HES5, supported by the very high frequency of this epigenetic change and our observation that this was a common alteration in a series of multi-focal tumours. While the functional role of HES5 methylation in prostate tumourigenesis is yet to be determined we found that demethylation resulted in down-regulation of the HES5 target gene HES6, which has recently been shown to drive progression in prostate cancer via the androgen receptor (Ramos-Montoya et al. 2014). Therefore we speculate that one potential effector mechanism of HES5 silencing could be de-repression of HES6 that in turn enhances AR regulation of key oncogenic targets, contributing to transformation and/or priming cells for subsequent acquisition of aggressive phenotypes. In addition HES5 has established roles in tissue patterning during development (Hatakeyama et al. 2004; Tateya et al. 2011), with HES5 null cells promoting an imbalance in intestinal and neural stem cell fate choices resulting from defective NOTCH signaling (Sancho, et al. 2013). Intriguingly defective NOTCH signaling has recently been shown to drive clonal expansions of P53 mutant cells (Alcolea, et al. 2014), raising the possibility that HES5 silencing early in prostate tumourogenesis might drive clonal expansions and contribute to the ‘field effect’ observed in prostate tumours (Bostwick, et al. 1998; Hanson, et al. 2006; Mehrotra, et al. 2008). However, these and other downstream consequences of the early and common epigenetic silencing of HES5 will require careful dissection in future studies. It is intriguing that this HES5-HES6/AR-HES6 transcriptional network is affected by TMPRSS2-ERG gene fusion status. While the functional consequences of this remain to be explored, the implication of both AR and ERG oncogenenic signaling axes provides further weight for the importance of the HES transcriptional network in prostate cancer. Future studies will need to include over-expression of HES5 in prostate cancer cells to establish the direct consequences on HES6 and AR signaling, as well as the phenotypic consequences of bypassing HES5 silencing. In addition depletion of HES5 in 5-aza-2′-deoxycytidine treated
Page 11 of 23
prostate cancer cells (both ERG-positive and ERG-negative) will allow an assessment of de-repression of the endogenous HES5 locus on gene expression and cellular phenotypes. Finally future studies should also address the mechanisms upstream of HES5 silencing, the high frequency of which would be consistent with either a strong selective pressure or a targeted silencing of HES5, for example via loss of GCM as described in neural stem cells (Hitoshi, et al. 2011). This report highlights HES5 silencing as an early and frequent event in prostate tumourigenesis that may serve as a useful biomarker or as a starting point for preventive medicine or targeted intervention strategies. Declaration of interest
The authors have no financial or other conflict of interest in relation to the work presented herein.
Author contributions
CEM carried out analysis, directed the project and wrote the manuscript, IS designed and carried out bisulfite sequencing experiments, HRA prepared samples for bisulfite sequencing and tumour gene expression data, HL, JK and HW co-designed and provided all samples for the initial methylation profiling, expression and validation experiments, MD, AL and ARM provided tumour gene expression data, AW carried out systematic pathology of prostatectomy samples and identified tumour and benign cores for sampling, ST designed the study and drafted the manuscript, DSB, CSC, RE and the ICGC Working Group provided 3D prostate reconstructions, contributed to study design and drafted the manuscript, DEN co-designed the study and drafted the manuscript, AGL co-designed the study, carried out analysis, directed the project and co-authored the manuscript.
Acknowledgements
We are grateful to study volunteers for their participation and staff at the Welcome Trust Clinical Research Facility, Addenbrooke’s Clinical Research Centre, Cambridge. We also thank the NIHR Cambridge Biomedical Research Centre, the DOH HTA (ProtecT grant), and the NCRI/MRC (ProMPT grant) for help with the bio-repository, The University of Cambridge, Hutchison Whampoa Limited and Cancer Research UK for funding. The ICGC Prostate UK Group is funded by Cancer Research UK Grant C5047/A14835, by the Dallaglio Foundation, and by The Wellcome Trust. The Human Research Tissue Bank is supported by the NIHR Cambridge Biomedical Research Centre. We are grateful to the CRUK Cambridge Institute Genomics and Bioinformatics Core Facilities. Cross-validation of HES5 methylation includes the use of data generated by the TCGA Research Network: http://cancergenome.nih.gov/
Page 12 of 23
References
2011 Integrated genomic analyses of ovarian carcinoma. Nature 474 609-
615.
2012 Comprehensive molecular characterization of human colon and rectal
cancer. Nature 487 330-337.
Alcolea MP, Greulich P, Wabik A, Frede J, Simons BD & Jones PH 2014
Differentiation imbalance in single oesophageal progenitor cells causes
clonal immortalization and field change. Nat Cell Biol 16 615-622.
Annala M, Kivinummi K, Leinonen K, Tuominen J, Zhang W, Visakorpi T &
Nykter M 2014 DOT1L-HES6 fusion drives androgen independent growth in
prostate cancer. EMBO Mol Med.
Aryee MJ, Jaffe AE, Corrada-Bravo H, Ladd-Acosta C, Feinberg AP, Hansen KD
& Irizarry RA 2014 Minfi: a flexible and comprehensive Bioconductor
package for the analysis of Infinium DNA methylation microarrays.
Bioinformatics 30 1363-1369.
Austin DW, Allen MS, McCollum JM, Dar RD, Wilgus JR, Sayler GS, Samatova
NF, Cox CD & Simpson ML 2006 Gene network shaping of inherent noise
spectra. Nature 439 608-611.
Baca SC, Prandi D, Lawrence MS, Mosquera JM, Romanel A, Drier Y, Park K,
Kitabayashi N, MacDonald TY, Ghandi M, et al. 2013 Punctuated evolution of
prostate cancer genomes. Cell 153 666-677.
Bae S, Bessho Y, Hojo M & Kageyama R 2000 The bHLH gene Hes6, an
inhibitor of Hes1, promotes neuronal differentiation. Development 127 2933-
2943.
Barbieri CE, Baca SC, Lawrence MS, Demichelis F, Blattner M, Theurillat JP,
White TA, Stojanov P, Van Allen E, Stransky N, et al. 2012 Exome sequencing
identifies recurrent SPOP, FOXA1 and MED12 mutations in prostate cancer.
Nat Genet 44 685-689.
Barry M, Perner S, Demichelis F & Rubin MA 2007 TMPRSS2-ERG fusion
heterogeneity in multifocal prostate cancer: clinical and biologic
implications. Urology 70 630-633.
Berger MF, Lawrence MS, Demichelis F, Drier Y, Cibulskis K, Sivachenko AY,
Sboner A, Esgueva R, Pflueger D, Sougnez C, et al. 2011 The genomic
complexity of primary human prostate cancer. Nature 470 214-220.
Biankin AV, Waddell N, Kassahn KS, Gingras MC, Muthuswamy LB, Johns AL,
Miller DK, Wilson PJ, Patch AM, Wu J, et al. 2012 Pancreatic cancer genomes
reveal aberrations in axon guidance pathway genes. Nature 491 399-405.
Bostwick DG, Shan A, Qian J, Darson M, Maihle NJ, Jenkins RB & Cheng L 1998
Independent origin of multiple foci of prostatic intraepithelial neoplasia:
comparison with matched foci of prostate carcinoma. Cancer 83 1995-2002.
Caini S, Gandini S, Dudas M, Bremer V, Severi E & Gherasim A 2014 Sexually
transmitted infections and prostate cancer risk: A systematic review and
meta-analysis. Cancer Epidemiol 38 329-338.
Cairns JM, Dunning MJ, Ritchie ME, Russell R & Lynch AG 2008 BASH: a tool
for managing BeadArray spatial artefacts. Bioinformatics 24 2921-2922.
Carver BS, Tran J, Gopalan A, Chen Z, Shaikh S, Carracedo A, Alimonti A,
Nardella C, Varmeh S, Scardino PT, et al. 2009 Aberrant ERG expression
Page 13 of 23

cooperates with loss of PTEN to promote cancer progression in the prostate.
Nat Genet 41 619-624.
Chen Y, Chi P, Rockowitz S, Iaquinta PJ, Shamu T, Shukla S, Gao D, Sirota I,
Carver BS, Wongvipat J, et al. 2013 ETS factors reprogram the androgen
receptor cistrome and prime prostate tumorigenesis in response to PTEN
loss. Nat Med 19 1023-1029.
Davis S & Meltzer PS 2007 GEOquery: a bridge between the Gene Expression
Omnibus (GEO) and BioConductor. Bioinformatics 23 1846-1847.
Dunning MJ, Smith ML, Ritchie ME & Tavare S 2007 beadarray: R classes and
methods for Illumina bead-based data. Bioinformatics 23 2183-2184.
Eeles RA, Olama AA, Benlloch S, Saunders EJ, Leongamornlert DA,
Tymrakiewicz M, Ghoussaini M, Luccarini C, Dennis J, Jugurnauth-Little S, et
al. 2013 Identification of 23 new prostate cancer susceptibility loci using the
iCOGS custom genotyping array. Nat Genet 45 385-391, 391e381-382.
Elkahwaji JE, Hauke RJ & Brawner CM 2009 Chronic bacterial inflammation
induces prostatic intraepithelial neoplasia in mouse prostate. Br J Cancer
101 1740-1748.
Fior R & Henrique D 2005 A novel hes5/hes6 circuitry of negative regulation
controls Notch activity during neurogenesis. Dev Biol 281 318-333.
Freedland SJ 2005 Obesity and prostate cancer: a growing problem. Clin
Cancer Res 11 6763-6766.
Garcia AJ, Ruscetti M, Arenzana TL, Tran LM, Bianci-Frias D, Sybert E,
Priceman SJ, Wu L, Nelson PS, Smale ST, et al. 2014 Pten null prostate
epithelium promotes localized myeloid-derived suppressor cell expansion
and immune suppression during tumor initiation and progression. Mol Cell
Biol 34 2017-2028.
Grasso CS, Wu YM, Robinson DR, Cao X, Dhanasekaran SM, Khan AP, Quist MJ,
Jing X, Lonigro RJ, Brenner JC, et al. 2012 The mutational landscape of lethal
castration-resistant prostate cancer. Nature 487 239-243.
Hanson JA, Gillespie JW, Grover A, Tangrea MA, Chuaqui RF, Emmert-Buck
MR, Tangrea JA, Libutti SK, Linehan WM & Woodson KG 2006 Gene promoter
methylation in prostate tumor-associated stromal cells. J Natl Cancer Inst 98
255-261.
Hatakeyama J, Bessho Y, Katoh K, Ookawara S, Fujioka M, Guillemot F &
Kageyama R 2004 Hes genes regulate size, shape and histogenesis of the
nervous system by control of the timing of neural stem cell differentiation.
Development 131 5539-5550.
Hatakeyama J, Sakamoto S & Kageyama R 2006 Hes1 and Hes5 regulate the
development of the cranial and spinal nerve systems. Dev Neurosci 28 92-
101.
Heaphy CM, Yoon GS, Peskoe SB, Joshu CE, Lee TK, Giovannucci E, Mucci LA,
Kenfield SA, Stampfer MJ, Hicks JL, et al. 2013 Prostate cancer cell telomere
length variability and stromal cell telomere length as prognostic markers for
metastasis and death. Cancer Discov 3 1130-1141.
Hitoshi S, Ishino Y, Kumar A, Jasmine S, Tanaka KF, Kondo T, Kato S, Hosoya
T, Hotta Y & Ikenaka K 2011 Mammalian Gcm genes induce Hes5 expression
by active DNA demethylation and induce neural stem cells. Nat Neurosci 14
957-964.
Page 14 of 23
Jacobsen KX, Vanderluit JL, Slack RS & Albert PR 2008 HES1 regulates 5-HT1A
receptor gene transcription at a functional polymorphism: essential role in
developmental expression. Mol Cell Neurosci 38 349-358.
Kalaany NY & Sabatini DM 2009 Tumours with PI3K activation are resistant
to dietary restriction. Nature 458 725-731.
Kanwal R, Pandey M, Bhaskaran N, Maclennan GT, Fu P, Ponsky LE & Gupta S
2014 Protection against oxidative DNA damage and stress in human prostate
by glutathione S-transferase P1. Mol Carcinog 53 8-18.
Kote-Jarai Z, Olama AA, Giles GG, Severi G, Schleutker J, Weischer M, Campa D,
Riboli E, Key T, Gronberg H, et al. 2011 Seven prostate cancer susceptibility
loci identified by a multi-stage genome-wide association study. Nat Genet 43
785-791.
Krueger F & Andrews SR 2011 Bismark: a flexible aligner and methylation
caller for Bisulfite-Seq applications. Bioinformatics 27 1571-1572.
Kwon OJ, Zhang L, Ittmann MM & Xin L 2014 Prostatic inflammation
enhances basal-to-luminal differentiation and accelerates initiation of
prostate cancer with a basal cell origin. Proc Natl Acad Sci U S A 111 E592-
600.
Lee WH, Morton RA, Epstein JI, Brooks JD, Campbell PA, Bova GS, Hsieh WS,
Isaacs WB & Nelson WG 1994 Cytidine methylation of regulatory sequences
near the pi-class glutathione S-transferase gene accompanies human
prostatic carcinogenesis. Proc Natl Acad Sci U S A 91 11733-11737.
Lindberg J, Klevebring D, Liu W, Neiman M, Xu J, Wiklund P, Wiklund F, Mills
IG, Egevad L & Gronberg H 2013 Exome sequencing of prostate cancer
supports the hypothesis of independent tumour origins. Eur Urol 63 347-353.
Longabaugh WJ 2012 BioTapestry: a tool to visualize the dynamic properties
of gene regulatory networks. Methods Mol Biol 786 359-394.
Marabita F, Almgren M, Lindholm ME, Ruhrmann S, Fagerstrom-Billai F,
Jagodic M, Sundberg CJ, Ekstrom TJ, Teschendorff AE, Tegner J, et al. 2013 An
evaluation of analysis pipelines for DNA methylation profiling using the
Illumina HumanMethylation450 BeadChip platform. Epigenetics 8 333-346.
Massie CE, Lynch A, Ramos-Montoya A, Boren J, Stark R, Fazli L, Warren A,
Scott H, Madhu B, Sharma N, et al. 2011 The androgen receptor fuels prostate
cancer by regulating central metabolism and biosynthesis. EMBO J 30 2719-
2733.
Mehrotra J, Varde S, Wang H, Chiu H, Vargo J, Gray K, Nagle RB, Neri JR &
Mazumder A 2008 Quantitative, spatial resolution of the epigenetic field
effect in prostate cancer. Prostate 68 152-160.
Mertz KD, Horcic M, Hailemariam S, D'Antonio A, Dirnhofer S, Hartmann A,
Agaimy A, Eppenberger-Castori S, Obermann E, Cathomas G, et al. 2013
Heterogeneity of ERG expression in core needle biopsies of patients with
early prostate cancer. Hum Pathol 44 2727-2735.
Minner S, Gartner M, Freudenthaler F, Bauer M, Kluth M, Salomon G, Heinzer
H, Graefen M, Bokemeyer C, Simon R, et al. 2013 Marked heterogeneity of ERG
expression in large primary prostate cancers. Mod Pathol 26 106-116.
Mounir Z, Lin F, Lin VG, Korn JM, Yu Y, Valdez R, Aina OH, Buchwalter G, Jaffe
AB, Korpal M, et al. 2014 TMPRSS2:ERG blocks neuroendocrine and luminal
cell differentiation to maintain prostate cancer proliferation. Oncogene.
Page 15 of 23
Nevozhay D, Adams RM, Murphy KF, Josic K & Balazsi G 2009 Negative
autoregulation linearizes the dose-response and suppresses the
heterogeneity of gene expression. Proc Natl Acad Sci U S A 106 5123-5128.
Nik-Zainal S, Van Loo P, Wedge DC, Alexandrov LB, Greenman CD, Lau KW,
Raine K, Jones D, Marshall J, Ramakrishna M, et al. 2012 The life history of 21
breast cancers. Cell 149 994-1007.
Paziewska A, Dabrowska M, Goryca K, Antoniewicz A, Dobruch J, Mikula M,
Jarosz D, Zapala L, Borowka A & Ostrowski J 2014 DNA methylation status is
more reliable than gene expression at detecting cancer in prostate biopsy. Br
J Cancer.
Perner S, Demichelis F, Beroukhim R, Schmidt FH, Mosquera JM, Setlur S,
Tchinda J, Tomlins SA, Hofer MD, Pienta KG, et al. 2006 TMPRSS2:ERG fusion-
associated deletions provide insight into the heterogeneity of prostate
cancer. Cancer Res 66 8337-8341.
Pollock RF & Adryan B 2008 BioSAVE: display of scored annotation within a
sequence context. BMC Bioinformatics 9 157. R-Core-Team 2014 R: A language and environment for statistical
computing. R Foundation for Statistical Computing, Vienna, Austria.
Ramos-Montoya A, Lamb AD, Russell R, Carroll T, Jurmeister S, Galeano-
Dalmau N, Massie CE, Boren J, Bon H, Theodorou V, et al. 2014 HES6 drives a
critical AR transcriptional programme to induce castration-resistant
prostate cancer through activation of an E2F1-mediated cell cycle network.
EMBO Mol Med 6 651-661.
Rosenfeld N, Elowitz MB & Alon U 2002 Negative autoregulation speeds the
response times of transcription networks. J Mol Biol 323 785-793.
Salama-Cohen P, Arevalo MA, Meier J, Grantyn R & Rodriguez-Tebar A 2005
NGF controls dendrite development in hippocampal neurons by binding to
p75NTR and modulating the cellular targets of Notch. Mol Biol Cell 16 339-
347.
Sancho R, Blake SM, Tendeng C, Clurman BE, Lewis J & Behrens A 2013 Fbw7
repression by hes5 creates a feedback loop that modulates Notch-mediated
intestinal and neural stem cell fate decisions. PLoS Biol 11 e1001586.
Shen-Orr SS, Milo R, Mangan S & Alon U 2002 Network motifs in the
transcriptional regulation network of Escherichia coli. Nat Genet 31 64-68.
Sommerfeld HJ, Meeker AK, Piatyszek MA, Bova GS, Shay JW & Coffey DS 1996
Telomerase activity: a prevalent marker of malignant human prostate
tissue. Cancer Res 56 218-222.
Statham AL, Robinson MD, Song JZ, Coolen MW, Stirzaker C & Clark SJ 2012
Bisulfite sequencing of chromatin immunoprecipitated DNA (BisChIP-seq)
directly informs methylation status of histone-modified DNA. Genome Res 22
1120-1127.
Tarpey PS, Behjati S, Cooke SL, Van Loo P, Wedge DC, Pillay N, Marshall J,
O'Meara S, Davies H, Nik-Zainal S, et al. 2013 Frequent mutation of the major
cartilage collagen gene COL2A1 in chondrosarcoma. Nat Genet 45 923-926.
Tateya T, Imayoshi I, Tateya I, Ito J & Kageyama R 2011 Cooperative
functions of Hes/Hey genes in auditory hair cell and supporting cell
development. Dev Biol 352 329-340.
Tomlins SA, Rhodes DR, Perner S, Dhanasekaran SM, Mehra R, Sun XW,
Varambally S, Cao X, Tchinda J, Kuefer R, et al. 2005 Recurrent fusion of
Page 16 of 23
TMPRSS2 and ETS transcription factor genes in prostate cancer. Science 310
644-648.
Turatsinze JV, Thomas-Chollier M, Defrance M & van Helden J 2008 Using
RSAT to scan genome sequences for transcription factor binding sites and
cis-regulatory modules. Nat Protoc 3 1578-1588.
Varley KE, Gertz J, Bowling KM, Parker SL, Reddy TE, Pauli-Behn F, Cross MK,
Williams BA, Stamatoyannopoulos JA, Crawford GE, et al. 2013 Dynamic DNA
methylation across diverse human cell lines and tissues. Genome Res 23 555-
567.
Warren AY, Whitaker HC, Haynes B, Sangan T, McDuffus LA, Kay JD & Neal DE
2013 Method for sampling tissue for research which preserves pathological
data in radical prostatectomy. Prostate 73 194-202.
Weaver JM, Ross-Innes CS, Shannon N, Lynch AG, Forshew T, Barbera M,
Murtaza M, Ong CA, Lao-Sirieix P, Dunning MJ, et al. 2014 Ordering of
mutations in preinvasive disease stages of esophageal carcinogenesis. Nat
Genet 46 837-843.
Weinstein JN, Collisson EA, Mills GB, Shaw KR, Ozenberger BA, Ellrott K,
Shmulevich I, Sander C & Stuart JM 2013 The Cancer Genome Atlas Pan-
Cancer analysis project. Nat Genet 45 1113-1120.
Weischenfeldt J, Simon R, Feuerbach L, Schlangen K, Weichenhan D, Minner S,
Wuttig D, Warnatz HJ, Stehr H, Rausch T, et al. 2013 Integrative genomic
analyses reveal an androgen-driven somatic alteration landscape in early-
onset prostate cancer. Cancer Cell 23 159-170.
Yan J, Enge M, Whitington T, Dave K, Liu J, Sur I, Schmierer B, Jolma A, Kivioja
T, Taipale M, et al. 2013 Transcription factor binding in human cells occurs
in dense clusters formed around cohesin anchor sites. Cell 154 801-813.
Figure legends
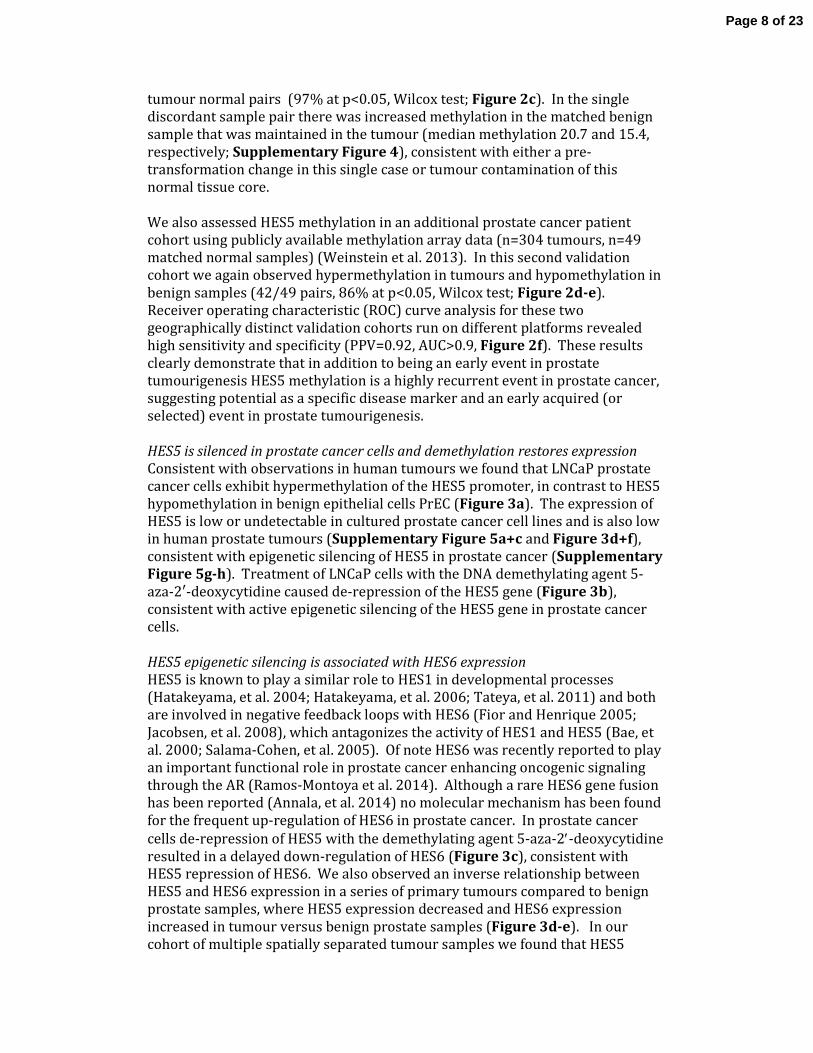
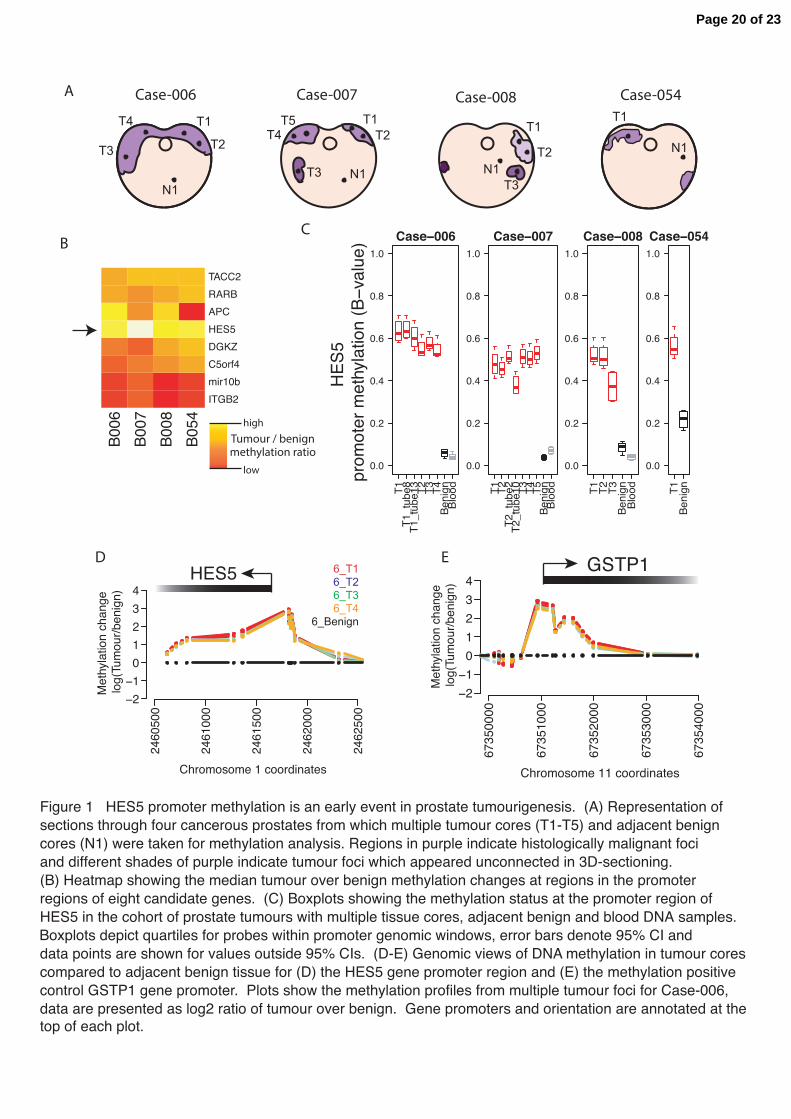
Figure 1 HES5 promoter methylation is an early event in prostate tumourigenesis. (A) Representation of sections through four cancerous prostates from which multiple tumour cores (T1-T5) and adjacent benign cores (N1) were taken for methylation analysis. Regions in purple indicate histologically malignant foci and different shades of purple indicate tumour foci that appeared unconnected in 3D-sectioning. Sample keys provided are ICGC Prostate UK IDs. (B) Heatmap showing the median tumour over benign methylation changes at regions in the promoter regions of eight candidate genes. (C) Boxplots showing the methylation status at the promoter region of HES5 in the cohort of prostate tumours with multiple tissue cores, adjacent benign and blood DNA samples. Boxplots depict quartiles for probes within promoter region genomic windows, error bars denote 95% CI and data points are shown for values outside 95% CIs. (D-E) Genomic views of DNA methylation in tumour cores compared to adjacent benign tissue for (D) the HES5 gene promoter region and (E) the methylation positive control GSTP1 gene promoter. Plots show the methylation profiles from multiple tumour foci for Case-006, data are presented as log2 ratio of tumour over benign. Gene promoters and orientation are annotated at the top of each plot.
Page 17 of 23
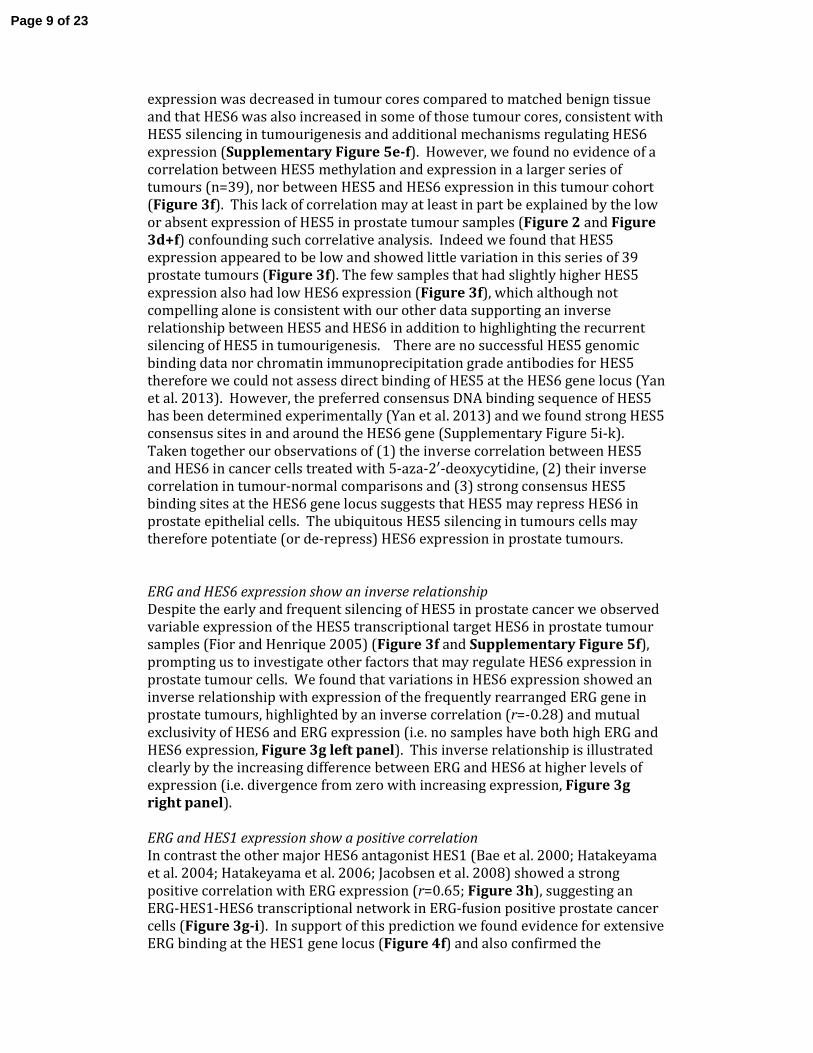
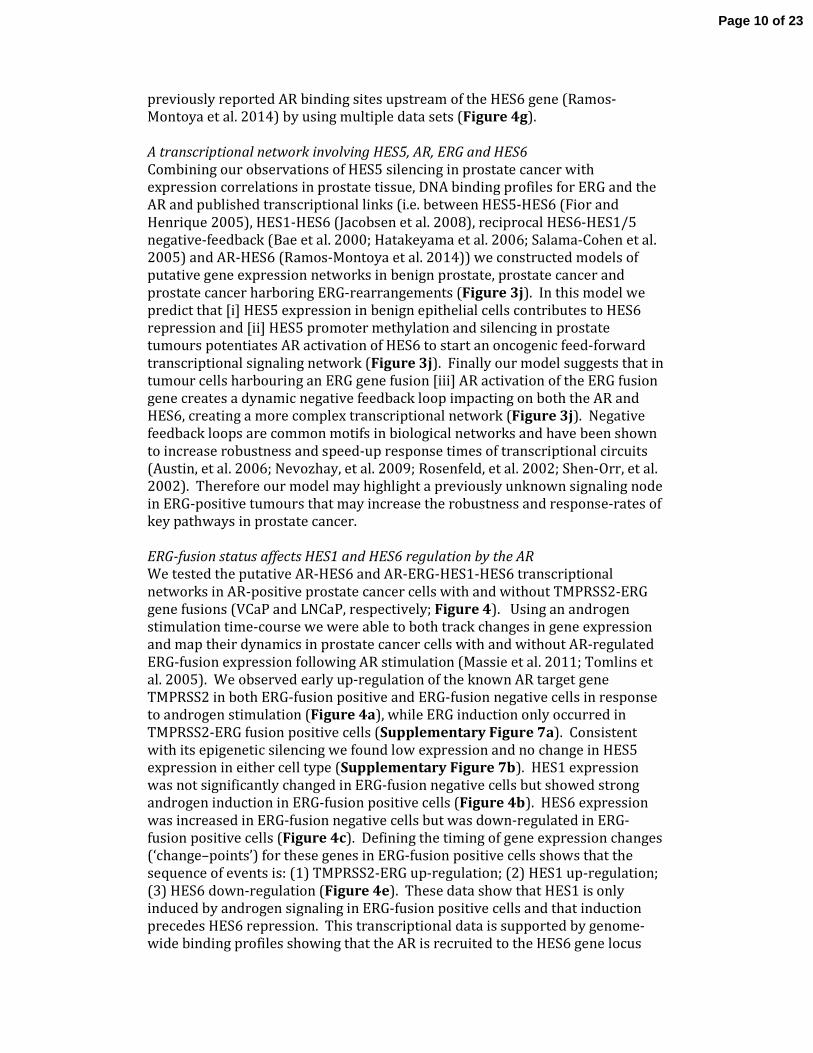
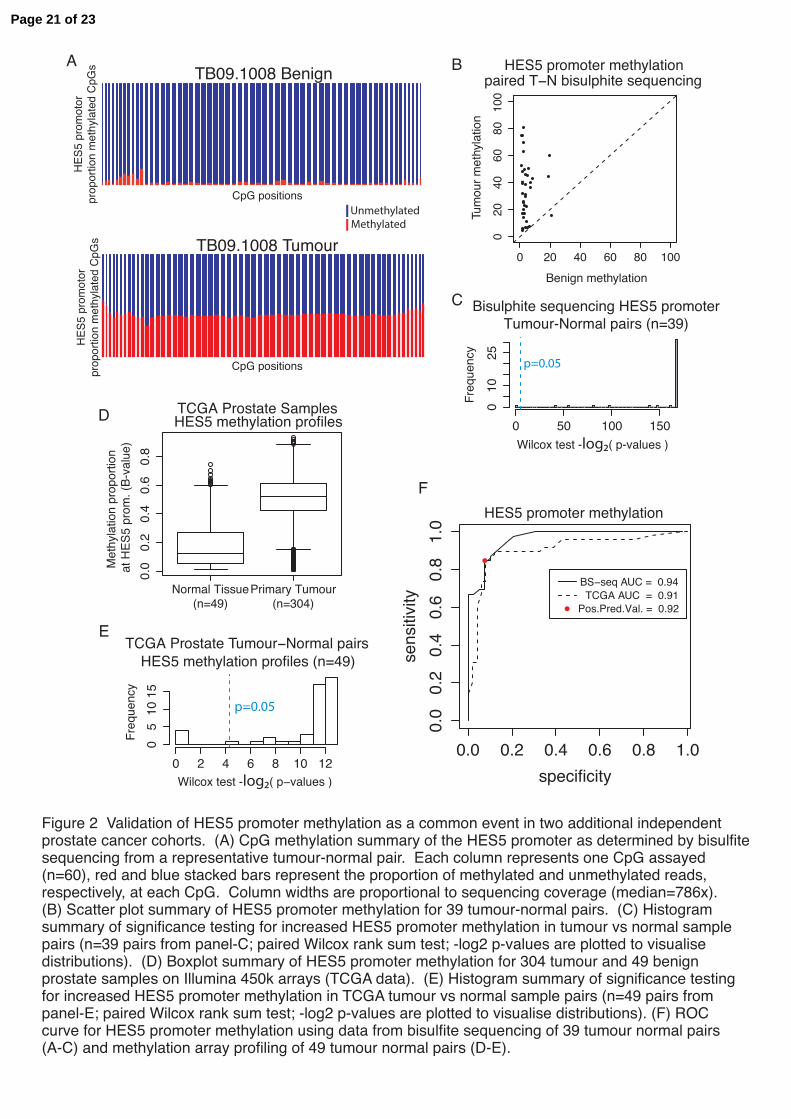
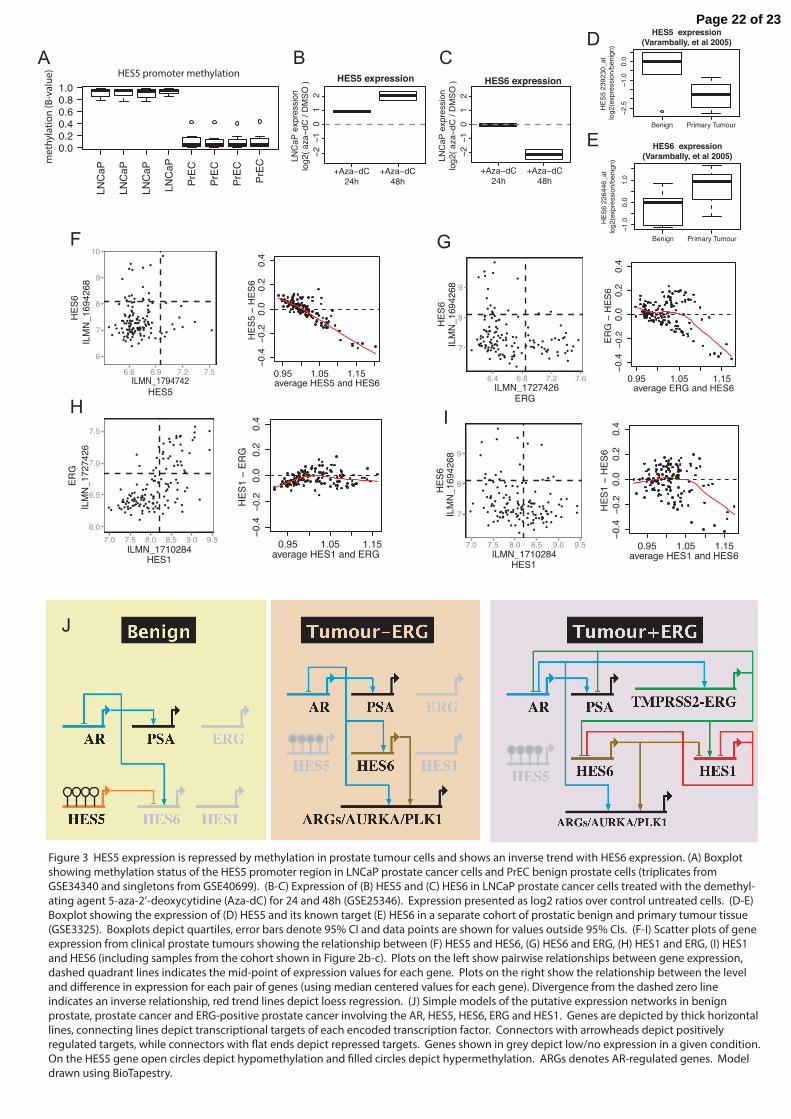
Figure 2 Validation of HES5 promoter methylation as a common event in two additional independent prostate cancer cohorts. (A) CpG methylation summary of the HES5 promoter as determined by bisulfite sequencing from a representative tumour-normal pair. Each column represents one CpG assayed (n=60), red and blue stacked bars represent the proportion of methylated and unmethylated reads, respectively, at each CpG. Column widths are proportional to sequencing coverage (median=786x). (B) Scatter plot summary of HES5 promoter methylation for 39 tumour-normal pairs. (C) Histogram summary of significance testing for increased HES5 promoter methylation in tumour vs normal sample pairs (n=39 pairs from panel-C; paired Wilcox rank sum test; -log2 p-values are plotted to visualise distributions). (D) Boxplot summary of HES5 promoter methylation for 304 tumour and 49 benign prostate samples on Illumina 450k arrays (TCGA data). (E) Histogram summary of significance testing for increased HES5 promoter methylation in TCGA tumour vs normal sample pairs (n=49 pairs from panel-E; paired Wilcox rank sum test; -log2 p-values are plotted to visualise distributions). (F) ROC curve for HES5 promoter methylation using data from bisulfite sequencing of 39 tumour normal pairs (A-C) and methylation array profiling of 49 tumour normal pairs (D-E). Figure 3 HES5 expression is repressed by methylation in prostate tumour cells and shows an inverse trend with HES6 expression. (A) Boxplot showing methylation status of the HES5 promoter region in LNCaP prostate cancer cells and PrEC benign prostate cells (triplicates from GSE34340 and singletons from GSE40699). (B-C) Expression of (B) HES5 and (C) HES6 in LNCaP prostate cancer cells treated with the demethylating agent 5-aza-2’-deoxycytidine (Aza-dC) for 24 and 48h (GSE25346). Expression presented as log2 ratios over control untreated cells. (D-E) Boxplot showing the expression of (D) HES5 and its known target (E) HES6 in a separate cohort of prostatic benign and primary tumour tissue (GSE3325). Boxplots depict quartiles, error bars denote 95% CI and data points are shown for values outside 95% CIs. (F-I) Scatter plots of gene expression from clinical prostate tumours showing the relationship between (F) HES5 and HES6, (G) HES6 and ERG, (H) HES1 and ERG, (I) HES1 and HES6 (including samples from the cohort shown in Figure 2b-c). Plots on the left show pairwise relationships between gene expression, dashed quadrant lines indicates the mid-point of expression values for each gene. Plots on the right show the relationship between the level and difference in expression for each pair of genes (using median centered values for each gene). Divergence from the dashed zero line indicates an inverse relationship, red trend lines depict loess regression. (J) Simple models of the putative expression networks in benign prostate, prostate cancer and ERG-positive prostate cancer involving the AR, HES5, HES6, ERG and HES1. Genes are depicted by thick horizontal lines, connecting lines depict transcriptional targets of each encoded transcription factor. Connectors with arrowheads depict positively regulated targets, while connectors with flat ends depict repressed targets. Genes shown in grey depict low/no expression in a given condition. On the HES5 gene open circles depict hypomethylation and filled circles depict hypermethylation. ARGs denotes AR-regulated genes. Model drawn using BioTapestry.
Page 18 of 23

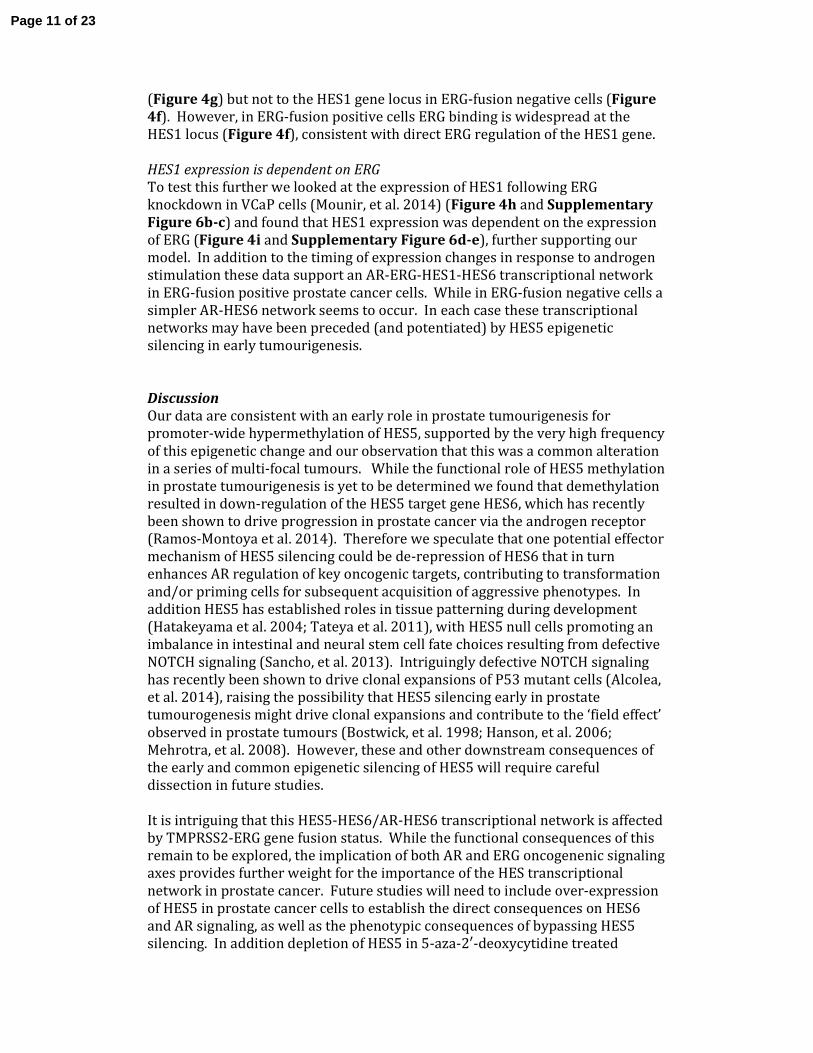
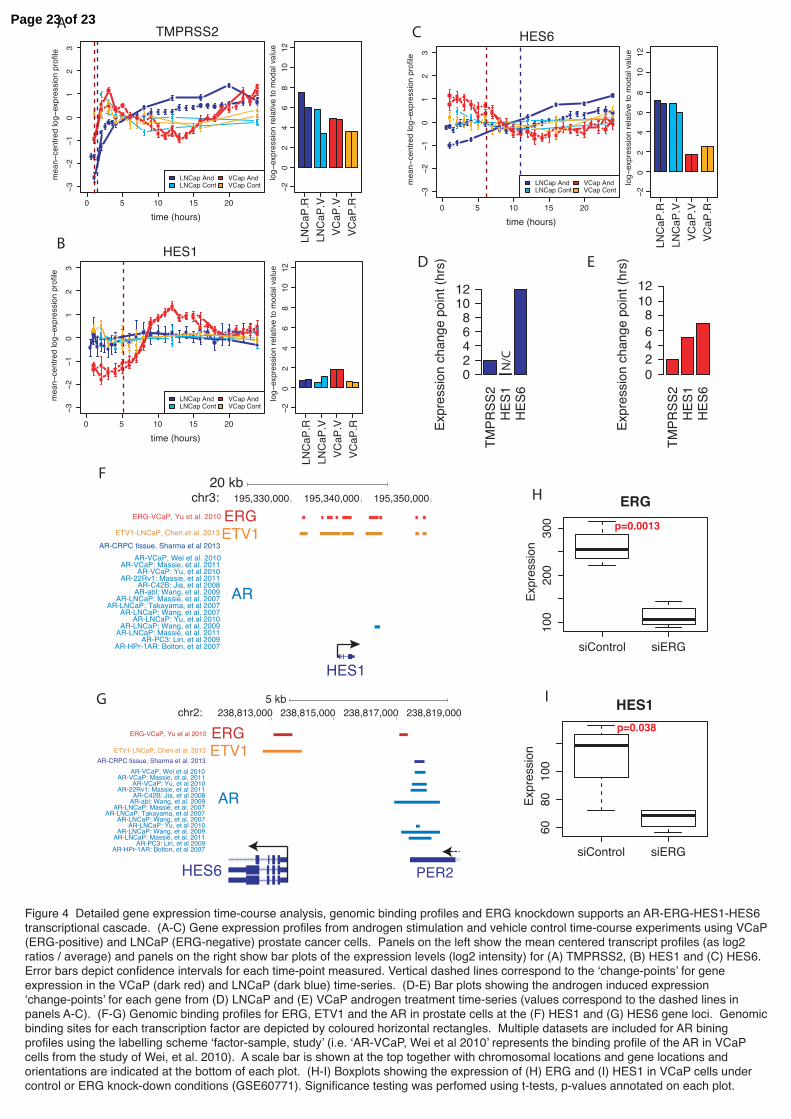
Figure 4 Detailed gene expression time-course analysis, genomic binding profiles and ERG knockdown supports an AR-ERG-HES1-HES6 transcriptional cascade. (A-C) Gene expression profiles from androgen stimulation and vehicle control time-course experiments using VCaP (ERG-positive) and LNCaP (ERG-negative) prostate cancer cells. Panels on the left show the mean centered transcript profiles (as log2 ratios / average) and panels on the right show bar plots of the expression levels (log2 intensity) for (A) TMPRSS2, (B) HES1 and (C) HES6. Error bars depict confidence intervals for each time-point measured. Vertical dashed lines correspond to the ‘change-points’ for gene expression in the VCaP (dark red) and LNCaP (dark blue) time-series. (D-E) Bar plots showing the androgen induced expression ‘change-points’ for each gene from (D) LNCaP and (E) VCaP androgen treatment time-series (values correspond to the dashed lines in panels A-C). (F-G) Genomic binding profiles for ERG, ETV1 and the AR in prostate cells at the (F) HES1 and (G) HES6 gene loci. Genomic binding sites for each transcription factor are depicted by coloured horizontal rectangles. Multiple datasets are included for AR binding profiles using the labeling scheme ‘factor-sample, study’ (i.e. ‘AR-VCaP, Wei et al 2010’ represents the binding profile of the AR in VCaP cells from the study of Wei, et al. 2010). A scale bar is shown at the top together with chromosomal locations and gene locations and orientations are indicated at the bottom of each plot. (H-I) Boxplots showing the expression of (H) ERG and (I) HES1 in VCaP cells under control or ERG knock-down conditions (GSE60771). Significance testing was performed using t-tests, p-values annotated on each plot.
Page 19 of 23
2460
500
2461
000
2461
500
2462
000
2462
500
−2−1
01234
HES5
Chromosome 1 coordinates
Met
hyla
tion
chan
ge
log(
Tum
our/b
enig
n)
6_T16_T26_T36_T4
6_Benign
Figure 1 HES5 promoter methylation is an early event in prostate tumourigenesis. (A) Representation of sections through four cancerous prostates from which multiple tumour cores (T1-T5) and adjacent benign cores (N1) were taken for methylation analysis. Regions in purple indicate histologically malignant foci and different shades of purple indicate tumour foci which appeared unconnected in 3D-sectioning. (B) Heatmap showing the median tumour over benign methylation changes at regions in the promoter regions of eight candidate genes. (C) Boxplots showing the methylation status at the promoter region of HES5 in the cohort of prostate tumours with multiple tissue cores, adjacent benign and blood DNA samples.Boxplots depict quartiles for probes within promoter genomic windows, error bars denote 95% CI and data points are shown for values outside 95% CIs. (D-E) Genomic views of DNA methylation in tumour corescompared to adjacent benign tissue for (D) the HES5 gene promoter region and (E) the methylation positive control GSTP1 gene promoter. Plots show the methylation profiles from multiple tumour foci for Case-006, data are presented as log2 ratio of tumour over benign. Gene promoters and orientation are annotated at the top of each plot.
T1T1
_tub
e8T1
_tub
e13 T2 T3 T4
Beni
gnBl
ood
0.0
0.2
0.4
0.6
0.8
1.0Case−006
HES
5 pr
omot
er m
ethy
latio
n (B
−val
ue)
T1 T2T2
_tub
e2T2
_tub
e10 T3 T4 T5
Beni
gnBl
ood
0.0
0.2
0.4
0.6
0.8
1.0Case−007
T1 T2 T3Be
nign
Bloo
d
0.0
0.2
0.4
0.6
0.8
1.0Case−008
T1Be
nign
0.0
0.2
0.4
0.6
0.8
1.0Case−054
A
B
ED
6735
0000
6735
1000
6735
2000
6735
3000
6735
4000
−2−1
01234
Chromosome 11 coordinates
GSTP1
Met
hyla
tion
chan
ge
log(
Tum
our/b
enig
n)
T1
T2T3
N1
T4 T1T2
T3 N1
T5T4 T1
T2
T3N1
Case-006 Case-007 Case-008B0
06B0
07B0
08B0
54
ITGB2mir10bC5orf4DGKZHES5APCRARBTACC2
C
Tumour / benignmethylation ratio
low
high
T1
N1
Case-054
Page 20 of 23
UnmethylatedMethylated
Figure 2 Validation of HES5 promoter methylation as a common event in two additional independent prostate cancer cohorts. (A) CpG methylation summary of the HES5 promoter as determined by bisulfite sequencing from a representative tumour-normal pair. Each column represents one CpG assayed (n=60), red and blue stacked bars represent the proportion of methylated and unmethylated reads, respectively, at each CpG. Column widths are proportional to sequencing coverage (median=786x). (B) Scatter plot summary of HES5 promoter methylation for 39 tumour-normal pairs. (C) Histogram summary of significance testing for increased HES5 promoter methylation in tumour vs normal sample pairs (n=39 pairs from panel-C; paired Wilcox rank sum test; -log2 p-values are plotted to visualise distributions). (D) Boxplot summary of HES5 promoter methylation for 304 tumour and 49 benign prostate samples on Illumina 450k arrays (TCGA data). (E) Histogram summary of significance testing for increased HES5 promoter methylation in TCGA tumour vs normal sample pairs (n=49 pairs from panel-E; paired Wilcox rank sum test; -log2 p-values are plotted to visualise distributions). (F) ROC curve for HES5 promoter methylation using data from bisulfite sequencing of 39 tumour normal pairs (A-C) and methylation array profiling of 49 tumour normal pairs (D-E).
A B
C
D
E
Normal Tissue(n=49)
Primary Tumour(n=304)
TCGA Prostate SamplesHES5 methylation profiles
Met
hyla
tion
prop
ortio
n at
HES
5 pr
om. (
B-va
lue)
0.0
0.2
0.4
0.6
0.8
0 20 40 60 80 100
020
4060
8010
0
HES5 promoter methylationpaired T−N bisulphite sequencing
Benign methylation
Tum
our m
ethy
latio
n
CpG positions
TB09.1008 BenignH
ES5
prom
otor
prop
ortio
n m
ethy
late
d C
pGs
TB09.1008 Tumour
HES
5 pr
omot
orpr
opor
tion
met
hyla
ted
CpG
s
CpG positions
Bisulphite sequencing HES5 promoterTumour-Normal pairs (n=39)
Wilcox test -log2( p-values )
Freq
uenc
y
0 50 100 150
010
25 p=0.05
TCGA Prostate Tumour−Normal pairsrofiles (n=49)
8 10 12
F
0.0 0.2 0.4 0.6 0.8 1.0
0.0
0.2
0.4
0.6
0.8
1.0 HES5 promoter methylation
specificity
sens
itivi
ty
BS−seq AUC = 0.94TCGA AUC = 0.91
Pos.Pred.Val. = 0.92
HES5 methylation p
Freq
uenc
y
0 2 4 6
05
15
p=0.0510
Wilcox test -log2( p−values )
Page 21 of 23
+Aza−dC24h
+Aza−dC48h
−2−1
01
2
HES5 expression
LNC
aP e
xpre
ssio
nlo
g2( a
za−d
C /
DM
SO )
+Aza−dC24h
+Aza−dC48h
−2−1
01
2
HES6 expression
LNC
aP e
xpre
ssio
nlo
g2( a
za−d
C /
DM
SO )
BA
Figure 3 HES5 expression is repressed by methylation in prostate tumour cells and shows an inverse trend with HES6 expression. (A) Boxplot showing methylation status of the HES5 promoter region in LNCaP prostate cancer cells and PrEC benign prostate cells (triplicates from GSE34340 and singletons from GSE40699). (B-C) Expression of (B) HES5 and (C) HES6 in LNCaP prostate cancer cells treated with the demethyl-ating agent 5-aza-2’-deoxycytidine (Aza-dC) for 24 and 48h (GSE25346). Expression presented as log2 ratios over control untreated cells. (D-E) Boxplot showing the expression of (D) HES5 and its known target (E) HES6 in a separate cohort of prostatic benign and primary tumour tissue (GSE3325). Boxplots depict quartiles, error bars denote 95% CI and data points are shown for values outside 95% CIs. (F-I) Scatter plots of gene expression from clinical prostate tumours showing the relationship between (F) HES5 and HES6, (G) HES6 and ERG, (H) HES1 and ERG, (I) HES1 and HES6 (including samples from the cohort shown in Figure 2b-c). Plots on the left show pairwise relationships between gene expression, dashed quadrant lines indicates the mid-point of expression values for each gene. Plots on the right show the relationship between the level and di�erence in expression for each pair of genes (using median centered values for each gene). Divergence from the dashed zero line indicates an inverse relationship, red trend lines depict loess regression. (J) Simple models of the putative expression networks in benign prostate, prostate cancer and ERG-positive prostate cancer involving the AR, HES5, HES6, ERG and HES1. Genes are depicted by thick horizontal lines, connecting lines depict transcriptional targets of each encoded transcription factor. Connectors with arrowheads depict positively regulated targets, while connectors with �at ends depict repressed targets. Genes shown in grey depict low/no expression in a given condition. On the HES5 gene open circles depict hypomethylation and �lled circles depict hypermethylation. ARGs denotes AR-regulated genes. Model drawn using BioTapestry.
C
LNC
aP
LNC
aP
LNC
aP
LNC
aP
PrEC
PrEC
PrEC
PrEC
0.00.20.40.60.81.0
HES5 promoter methylation
met
hyla
tion
(B-v
alue
)
Benign Primary Tumour
−2.5
−1.0
0.0
HES5 expression(Varambally, et al 2005)
HES
5 23
9230
_at
log2
(exp
ress
ion/
beni
gn)
Benign Primary Tumour
−1.0
0.0
1.0
HES6 expression(Varambally, et al 2005)
HES
6 22
6446
_at
log2
(exp
ress
ion/
beni
gn)
D
E
F
H I
J
G
6
7
8
9
10
6.6 6.9 7.2 7.5
HES5
HES
6
ILMN_1794742
ILM
N_1
6942
68
7
8
9
6.4 6.8 7.2 7.6
ERG
HES
6
ILMN_1727426
ILM
N_1
6942
68
7
8
9
7.0 7.5 8.0 8.5 9.0 9.5
HES1
HES
6IL
MN
_169
4268
ILMN_1710284
6.0
6.5
7.0
7.5
7.0 7.5 8.0 8.5 9.0 9.5
HES1
ERG
ILM
N_1
7274
26
ILMN_1710284
0.95 1.05 1.15
−0.4
0.0
0.2
0.4
average HES5 and HES6
HES
5 −
HES
6 −0
.2
0.95 1.05 1.15
−0.4
0.0
0.2
0.4
average HES1 and HES6
HES
1 −
HES
6 −0
.2
0.95 1.05 1.15
−0.4
0.0
0.2
0.4
average HES1 and ERG
HES
1 −
ERG
−0
.2
0.95 1.05 1.15
−0.4
0.0
0.2
0.4
average ERG and HES6
ERG
− H
ES6
−0.2
Page 22 of 23
TMPR
SS2
HES
1H
ES6
Expr
essi
on c
hang
e po
int (
hrs)
02468
1012
TMPR
SS2
HES
1H
ES6
Expr
essi
on c
hang
e po
int (
hrs)
02468
1012
A
B
C
D E
chr3:
AR-CRPC tissue, Sharma et al 2013
ERG-VCaP, Yu et al. 2010
ETV1-LNCaP, Chen et al. 2013
AR-VCaP, Wei et al. 2010 AR-VCaP: Massie, et al. 2011
AR-VCaP: Yu, et al 2010AR-22Rv1: Massie, et al 2011
AR-C42B: Jia, et al 2008AR-abl: Wang, et al. 2009
AR-LNCaP: Massie, et al. 2007AR-LNCaP: Takayama, et al 2007
AR-LNCaP: Wang, et al. 2007AR-LNCaP: Yu, et al 2010
AR-LNCaP: Wang, et al. 2009AR-LNCaP: Massie, et al. 2011
AR-PC3: Lin, et al 2009AR-HPr-1AR: Bolton, et al 2007
20 kb195,330,000 195,340,000 195,350,000
HES1
ERGETV1
AR
chr2:
AR-CRPC tissue, Sharma et al. 2013
ERG-VCaP, Yu et al 2010
ETV1-LNCaP, Chen at al. 2013
AR-VCaP, Wei et al 2010AR-VCaP: Massie, et al. 2011
AR-VCaP: Yu, et al 2010AR-22Rv1: Massie, et al 2011
AR-C42B: Jia, et al 2008AR-abl: Wang, et al. 2009
AR-LNCaP: Massie, et al. 2007AR-LNCaP: Takayama, et al 2007
AR-LNCaP: Wang, et al. 2007AR-LNCaP: Yu, et al 2010
AR-LNCaP: Wang, et al. 2009AR-LNCaP: Massie, et al. 2011
AR-PC3: Lin, et al 2009AR-HPr-1AR: Bolton, et al 2007
5 kb238,813,000 238,815,000 238,817,000 238,819,000
HES6 PER2
ERGETV1
AR
F
G
H
I
siControl siERG
100
200
300
ERG
Expr
essi
onp=0.0013
siControl siERG
6080
100
HES1
Expr
essi
on
p=0.038
0 5 10 15 20
−3−2
−10
12
3
TMPRSS2
time (hours)
mea
n−ce
ntre
d lo
g−ex
pres
sion
pro
file
� ��
�
�
� �
� � �� �
� � � �
� � �� � � �
� � � �
�
�
�
�
� �
�
�
�
�
�
�
�
��
� ��
�
��
�
�� �
�
�
�
�
�
�
�
�
�� �
��
�
� �
�
�
�
�
�
�
��
�
��
�� �
�
� �
�
�
�
�
��
�
� �� �
�
�
���
�
�
�
��
��
�
LNCap AndLNCap Cont
VCap AndVCap Cont −2
02
46
810
12lo
g−ex
pres
sion
rela
tive
to m
odal
val
ue
0 5 10 15 20
−3−2
−10
12
3
HES1
time (hours)
mea
n−ce
ntre
d lo
g−ex
pres
sion
pro
file
�
�
��
��
� �
�
�
� ��
��
�
�
�
�
��
�
�
�� �
��� �
��
� �
�
�
��
��
�
�� �
�
�
�
�
�
��
�
�
�
��
�
�� �
��
�
��
��
�
�
�
�
� �
��
�
�
�
�
�
�� �
�
�
��
�
��
�
��
��
��
�
�
�
�
�� �
� �
��
�
LNCap AndLNCap Cont
VCap AndVCap Cont −2
02
46
810
12lo
g−ex
pres
sion
rela
tive
to m
odal
val
ue
0 5 10 15 20
−3−2
−10
12
3
HES6
time (hours)
mea
n−ce
ntre
d lo
g−ex
pres
sion
pro
file
� ��
� � � �� �
��
��
��
��
�� �
�� � �
� ��
��
�
�
�
� �
�
�
�
� �
��
� ��
�
�
��
��
�
�
��
�� �
� �� �
� ��
�
��
�
�
�
�
� �
�� �
��
� ��
�
�
� �� �
�
��
��
��
�
� �
�
���
�� �
�
�
�
�
�
LNCap AndLNCap Cont
VCap AndVCap Cont −2
02
46
810
12lo
g−ex
pres
sion
rela
tive
to m
odal
val
ue
N/C
LNC
aP.V
LNC
aP.R
VCaP
.VVC
aP.R
LNC
aP.V
LNC
aP.R
VCaP
.VVC
aP.R
LNC
aP.V
LNC
aP.R
VCaP
.VVC
aP.R
Figure 4 Detailed gene expression time-course analysis, genomic binding profiles and ERG knockdown supports an AR-ERG-HES1-HES6 transcriptional cascade. (A-C) Gene expression profiles from androgen stimulation and vehicle control time-course experiments using VCaP (ERG-positive) and LNCaP (ERG-negative) prostate cancer cells. Panels on the left show the mean centered transcript profiles (as log2 ratios / average) and panels on the right show bar plots of the expression levels (log2 intensity) for (A) TMPRSS2, (B) HES1 and (C) HES6. Error bars depict confidence intervals for each time-point measured. Vertical dashed lines correspond to the ‘change-points’ for gene expression in the VCaP (dark red) and LNCaP (dark blue) time-series. (D-E) Bar plots showing the androgen induced expression ‘change-points’ for each gene from (D) LNCaP and (E) VCaP androgen treatment time-series (values correspond to the dashed lines in panels A-C). (F-G) Genomic binding profiles for ERG, ETV1 and the AR in prostate cells at the (F) HES1 and (G) HES6 gene loci. Genomic binding sites for each transcription factor are depicted by coloured horizontal rectangles. Multiple datasets are included for AR bining profiles using the labelling scheme ‘factor-sample, study’ (i.e. ‘AR-VCaP, Wei et al 2010’ represents the binding profile of the AR in VCaP cells from the study of Wei, et al. 2010). A scale bar is shown at the top together with chromosomal locations and gene locations and orientations are indicated at the bottom of each plot. (H-I) Boxplots showing the expression of (H) ERG and (I) HES1 in VCaP cells under control or ERG knock-down conditions (GSE60771). Significance testing was perfomed using t-tests, p-values annotated on each plot.
Page 23 of 23