Embed Size (px)
Citation preview

To be presented by Melanie Berg at the NASA Electronics Parts and Packaging (NEPP) Electronics Technology Workshop (ETW), Greenbelt, MD, June26–29, 2017 1
Characterization of System Level Single Event Upset (SEU) Responses using SEU
Data, Classical Reliability Models, and Space Environment Data
Melanie Berg1, Kenneth LaBel2, Michael Campola2, Michael Xapsos2
[email protected]&D in support of NASA/GSFC
2. NASA/GSFC
To be presented by Melanie Berg at the NASA Electronics Parts and Packaging (NEPP) Electronics Technology Workshop (ETW), Greenbelt, MD, June26–29, 2017
Acronyms• Combinatorial logic (CL)• Commercial off the shelf (COTS)• Complementary metal-oxide
semiconductor (CMOS)• Device under test (DUT)• Edge-triggered flip-flops (DFFs)• Error rate (λ)• Error rate per bit(λbit)• Error rate per system(λsystem)• Field programmable gate array (FPGA)• Global triple modular redundancy (GTMR)• Hardware description language (HDL)• Input – output (I/O)• Intellectual Property (IP)• Linear energy transfer (LET)• Mean fluence to failure (MFTF)• Mean time to failure (MTTF)• Number of used bits (#Usedbits)• Operational frequency (fs)• Personal Computer (PC)
2
• Probability of configuration upsets (Pconfiguration)
• Probability of Functional Logic upsets (PfunctionalLogic)
• Probability of single event functional interrupt (PSEFI)
• Probability of system failure (Psystem)• Processor (PC)• Radiation Effects and Analysis Group (REAG)• Reliability over time (R(t))• Reliability over fluence (R(Φ))• Single event effect (SEE)• Single event functional interrupt (SEFI)• Single event latch-up (SEL)• Single event transient (SET)• Single event upset (SEU)• Single event upset cross-section (σSEU)• System on a chip (SoC)• Windowed Shift Register (WSR)• Xilinx Virtex 5 field programmable gate array
(V5)• Xilinx Virtex 5 field programmable gate array
radiation hardened (V5QV)

To be presented by Melanie Berg at the NASA Electronics Parts and Packaging (NEPP) Electronics Technology Workshop (ETW), Greenbelt, MD, June26–29, 2017
Problem Statement• Conventional methods of
applying single event upset (SEU) data to complex systems need improvement.
• The problem boils down to extrapolation and application of SEU data to characterize system performance in radiation environments.
3

To be presented by Melanie Berg at the NASA Electronics Parts and Packaging (NEPP) Electronics Technology Workshop (ETW), Greenbelt, MD, June26–29, 2017
Abstract – Impact to Community• We are investigating the application of classical reliability
performance metrics combined with standard SEU analysis data.
• We expect to relate SEU behavior to system performance requirements… – Our proposed methodology will provide better prediction of SEU
responses in harsh radiation environments with confidence metrics.
4

To be presented by Melanie Berg at the NASA Electronics Parts and Packaging (NEPP) Electronics Technology Workshop (ETW), Greenbelt, MD, June26–29, 2017
SEU System Analysis Is Not Simple Algebra
• When a system is targeted for space, single event effect (SEE) data are obtained for all devices that make up that system.
• Combining component data is not simple addition.
• Co-dependent susceptibilities exist and must be handled accordingly.
5
Proposed method should target critical missions subjected to ionizing particles.

To be presented by Melanie Berg at the NASA Electronics Parts and Packaging (NEPP) Electronics Technology Workshop (ETW), Greenbelt, MD, June26–29, 2017
NEPP - Small Mission Efforts
Reliable Small
Missions
Model-Based Mission Assurance (MBMA)•W NASA R&M Program
Best Practices and
Guidelines
COTS and Non-Mil Data
SEE Reliability Analysis CubeSat
Mission Success Analysis
CubeSat Databases
Working Groups
6
Proposed method fits into new approaches for small mission assurance.
To be presented by Melanie Berg at the NASA Electronics Parts and Packaging (NEPP) Electronics Technology Workshop (ETW), Greenbelt, MD, June26–29, 2017
Scope of Presentation
• Full system analysis requires combining SEU data for a variety of devices across a variety of boxes/mediums.
• The scope of this presentation is for System-type SEU data analysis for a single device.
• System on a Chip (SoC) field programmable gate array (FPGA) analysis.
• Future presentations will expand to address full systems.
7

To be presented by Melanie Berg at the NASA Electronics Parts and Packaging (NEPP) Electronics Technology Workshop (ETW), Greenbelt, MD, June26–29, 2017
Background (1)FPGA SEU Susceptibility
Design σSEU Configuration σSEU Functional logic σSEU
SEFI σSEU
Sequential and Combinatorial logic (CL) in data path
Global Routes and Hidden Logic
8
• σSEUs (per category) are calculated from SEU test and analysis.• σSEUs are calculated with particles that vary in linear energy
transfer (LET).• FPGA architectures vary and so do their SEU responses. • Most believe the dominant σSEUs are per bit (configuration or flip-
flops (DFFs)). However, global routes are significant (more than DFFs).
σSEUs are measured by bit
σSEUs are measured by bit???
For a system, should σSEUs be measured by bit????
SEU Cross Section (σSEU)
To be presented by Melanie Berg at the NASA Electronics Parts and Packaging (NEPP) Electronics Technology Workshop (ETW), Greenbelt, MD, June26–29, 2017
Background (2) Conventional Conversion of SEU Cross-Sections To
Error Rates for Complex Systems First Step
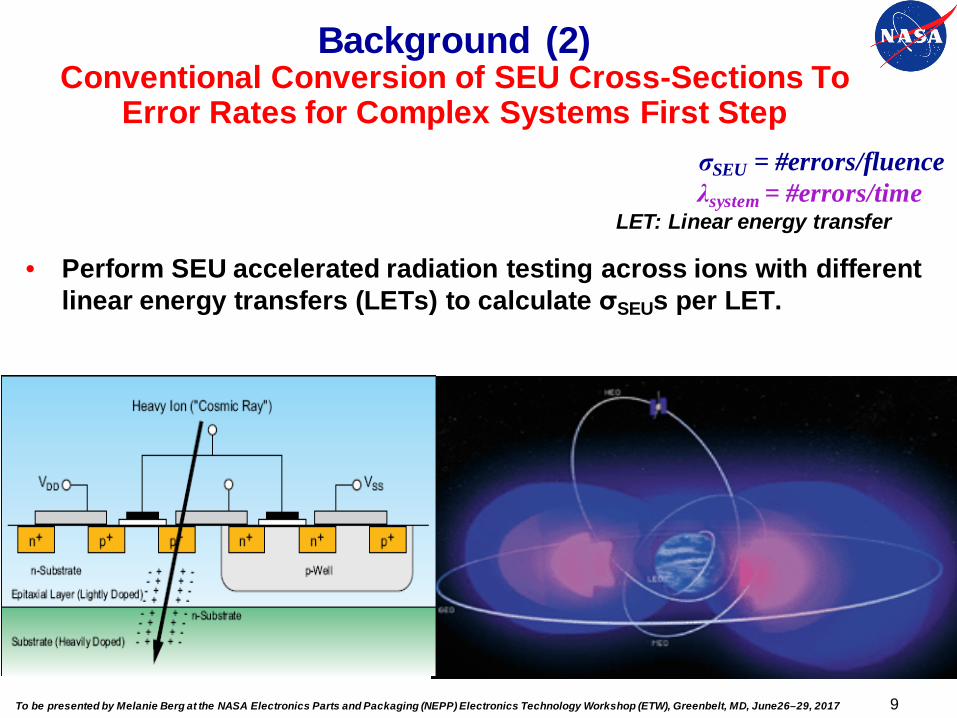
• Perform SEU accelerated radiation testing across ions with different linear energy transfers (LETs) to calculate σSEUs per LET.
9
σSEU = #errors/fluenceλsystem = #errors/time
LET: Linear energy transfer

To be presented by Melanie Berg at the NASA Electronics Parts and Packaging (NEPP) Electronics Technology Workshop (ETW), Greenbelt, MD, June26–29, 2017
Windowed Shift Register (WSR) Test Structures Are Used To Obtain SEU Data
• Shift registers are typical test structures (mapped into device under test (DUT)) used for accelerated radiation testing.
• Purpose is to analyze DFF and CL susceptibility.
10
CL: combinatorial logic
To be presented by Melanie Berg at the NASA Electronics Parts and Packaging (NEPP) Electronics Technology Workshop (ETW), Greenbelt, MD, June26–29, 2017
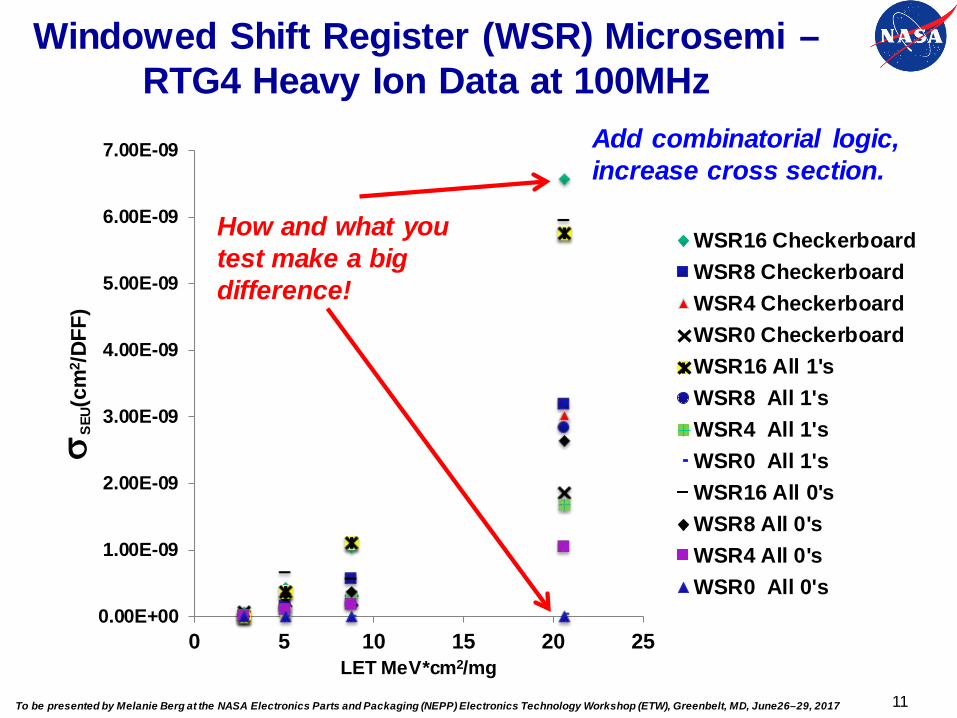
Windowed Shift Register (WSR) Microsemi –RTG4 Heavy Ion Data at 100MHz
11
0.00E+00
1.00E-09
2.00E-09
3.00E-09
4.00E-09
5.00E-09
6.00E-09
7.00E-09
0 5 10 15 20 25
σSE
U(cm
2 /DFF
)
LET MeV*cm2/mg
WSR16 CheckerboardWSR8 CheckerboardWSR4 CheckerboardWSR0 CheckerboardWSR16 All 1'sWSR8 All 1'sWSR4 All 1'sWSR0 All 1'sWSR16 All 0'sWSR8 All 0'sWSR4 All 0'sWSR0 All 0's
How and what you test make a big difference!
Add combinatorial logic, increase cross section.

To be presented by Melanie Berg at the NASA Electronics Parts and Packaging (NEPP) Electronics Technology Workshop (ETW), Greenbelt, MD, June26–29, 2017
Background (3) Conventional Conversion of SEU Cross-Sections To
Error Rates for Complex Systems Next Step• Bottom-Up approach (transistor level):
– Given σSEU (per bit) use an error rate calculator (such as CRÈME96) to obtain an error rate per bit (λbit ).
– Multiply λbit by the number of used memory bits (#UsedBits) in the target design to attain a system error rate (λsystem). Configuration and DFFs.
• Top-Down approach (system level):• Given σSEU (per system) use an error rate calculator (such as
CRÈME96) to obtain an error rate per bit (λsystem ).
12

To be presented by Melanie Berg at the NASA Electronics Parts and Packaging (NEPP) Electronics Technology Workshop (ETW), Greenbelt, MD, June26–29, 2017
Technical Problems with Current Methods of Error Rate Calculation
• For submission to CRÈME96, σSEUdata (in Log-linear form) are fitted to a Weibull curve.– The two main parameters for curve
fitting are a shape factor and a slope factor.
– During the curve fitting process, a large amount of error can be introduced.
– Consequently, it is possible for resultant error rates (for the same design) to vary by decades.
• Because of the error rate calculation process, σSEU data are blended together and it is nearly impossible to hone in on the problem spots. This can become important for mitigation insertion.
13
1.00E-08
1.00E-07
1.00E-06
1.00E-05
1.00E-04
1.00E-03
1.00E-02
1.00E-01
0.0 20.0 40.0 60.0σ S
EU(c
m2 /d
esig
n)
LET MeV*cm2/mg
Data mimic wear-out portion of Weibull curve

To be presented by Melanie Berg at the NASA Electronics Parts and Packaging (NEPP) Electronics Technology Workshop (ETW), Greenbelt, MD, June26–29, 2017
Technical Problems with Bottom-Up Analysis Method (1)
• Multiplying each bit within a design by λbit is not an efficient method of system error rate prediction.– Works well with memory structures…
but…complex systems do not operate or respond like memories.
– If an SEU affects a bit, and the bit is either inactive, disabled, or masked, a system malfunction might not occur.
• Using the same multiplication factor across DFFs will produce extreme over-estimates.
• To this date, there is no accurate method to predict DFF activity for complex systems.
• Fault injection or simulation will not determine frequency of activity.
14
λsystem < λbit×#UsedBits

To be presented by Melanie Berg at the NASA Electronics Parts and Packaging (NEPP) Electronics Technology Workshop (ETW), Greenbelt, MD, June26–29, 2017
Technical Problems with Bottom-Up Analysis Method (2)
• There are a variety of components that are susceptible to SEUs (clocks, resets, combinatorial logic, flip-flops (DFFs, etc…)). – Various component susceptibilities
are not accurately characterized at a per bit level.
– Design topology makes a significant difference in susceptibility and is not characterized in error rate calculators (e.g., CREME96).
15
Error rates calculated at the transistor-bit level are estimated at too small of granularity for proper extrapolation to complex systems.

To be presented by Melanie Berg at the NASA Electronics Parts and Packaging (NEPP) Electronics Technology Workshop (ETW), Greenbelt, MD, June26–29, 2017
What If Tests Do Not Investigate Test Structures Across A Variety of Parameters
16
0.00E+00
1.00E-09
2.00E-09
3.00E-09
4.00E-09
5.00E-09
6.00E-09
7.00E-09
0 5 10 15 20 25
σSE
U(cm
2 /DFF
)
LET MeV*cm2/mg
WSR16 CheckerboardWSR8 CheckerboardWSR4 CheckerboardWSR0 CheckerboardWSR16 All 1'sWSR8 All 1'sWSR4 All 1'sWSR0 All 1'sWSR16 All 0'sWSR8 All 0'sWSR4 All 0'sWSR0 All 0's
Bottom up approach based on DFF bits is not a realistic approach to SEU system characterization
Data might not reflect potential SEU responses!

To be presented by Melanie Berg at the NASA Electronics Parts and Packaging (NEPP) Electronics Technology Workshop (ETW), Greenbelt, MD, June26–29, 2017
Understand Goal of SEU Testing and Data Application
• Is the goal of SEU testing to analyze test circuits?– Efficacy of DFF mitigation.– Single event transient (SET) propagation strength.– SET width.– General test circuit evaluation.
• Or… is the goal of testing to obtain data for eventual system characterization?
• System characterization requires more than conventional test circuit analysis.– Test circuits are too simple.– Test circuits often do not follow formal design rules (e.g.,
synchronous, CMOS balancing, or place and route).– Design topology affects SEU response.
• Complex system test structures are important for SEU system characterization.– Top down approach.– Multiple complex test structures and trend evaluation is essential.
17

To be presented by Melanie Berg at the NASA Electronics Parts and Packaging (NEPP) Electronics Technology Workshop (ETW), Greenbelt, MD, June26–29, 2017
Let’s Not Reinvent The Wheel… A Proven Solution Can Be Found in
Classical Reliability Analysis• Classical reliability
models have been used as a standard metric for complex system performance.
• The analysis provides a more in depth interpretation of system behavior over time by using system-level MTTF data for system performance metrics.
18
Theory is already developed, proven, and should be in our hands!R(t)=e-t/MTTF or R(t)=e-λt
To be presented by Melanie Berg at the NASA Electronics Parts and Packaging (NEPP) Electronics Technology Workshop (ETW), Greenbelt, MD, June26–29, 2017
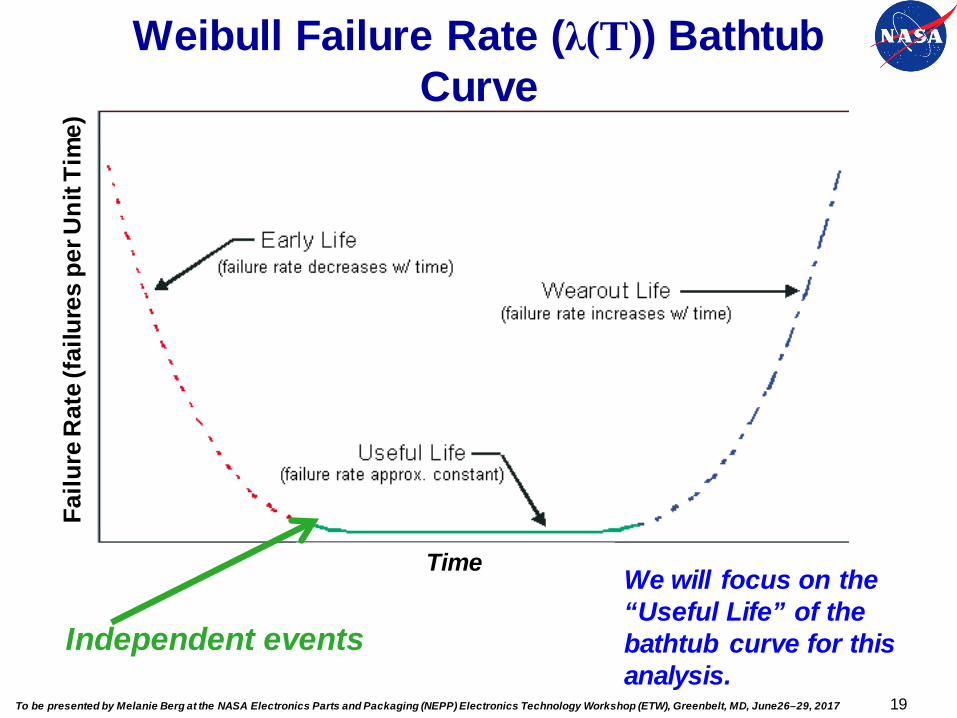
Weibull Failure Rate (λ(T)) Bathtub Curve
19
Time
Failu
re R
ate
(failu
res
per U
nit T
ime)
We will focus on the “Useful Life” of the bathtub curve for this analysis.
Independent events

To be presented by Melanie Berg at the NASA Electronics Parts and Packaging (NEPP) Electronics Technology Workshop (ETW), Greenbelt, MD, June26–29, 2017
• The exponential model that relates reliability to MTTF assumes that during useful-lifetime:– Failures are independent.– Error rate is constant.– MTTF = 1/λ.
• For a given LET (across fluence):– SEUs are independent.– σSEU is constant.– MFTF = 1/σSEU.
• Hence, mapping from the time domain to the fluence domain (per LET) is straight forward:– t Φ– MTTF MFTF– λ σSEU
Mapping Classical Reliability Models from The Time Domain To The Fluence Domain
20
R(t)=e-t/MTTF R(Φ)=eΦ/MFTF
R(t)=e-t/MTTF or R(t)=e-λt
Parallel between time and fluence.σSEU = #errors/fluenceλsystem = #errors/time
Weibull slope = 1… exponential.
To be presented by Melanie Berg at the NASA Electronics Parts and Packaging (NEPP) Electronics Technology Workshop (ETW), Greenbelt, MD, June26–29, 2017
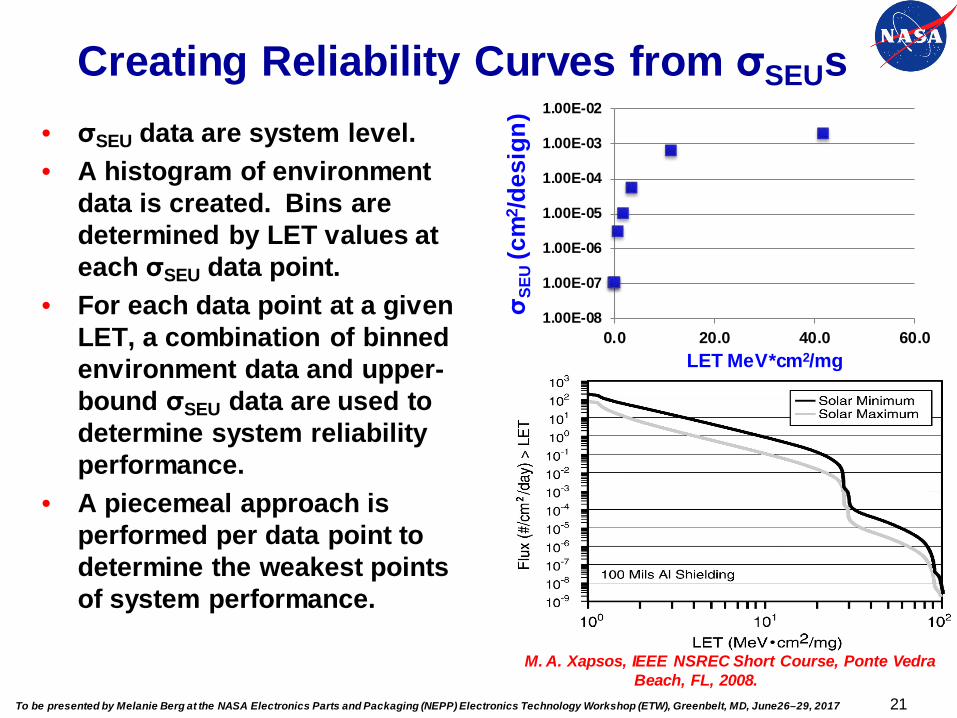
Creating Reliability Curves from σSEUs• σSEU data are system level.• A histogram of environment
data is created. Bins are determined by LET values at each σSEU data point.
• For each data point at a given LET, a combination of binned environment data and upper-bound σSEU data are used to determine system reliability performance.
• A piecemeal approach is performed per data point to determine the weakest points of system performance.
21
1.00E-08
1.00E-07
1.00E-06
1.00E-05
1.00E-04
1.00E-03
1.00E-02
0.0 20.0 40.0 60.0
σ SEU
(cm
2 /des
ign)
LET MeV*cm2/mg
M. A. Xapsos, IEEE NSREC Short Course, Ponte VedraBeach, FL, 2008.

To be presented by Melanie Berg at the NASA Electronics Parts and Packaging (NEPP) Electronics Technology Workshop (ETW), Greenbelt, MD, June26–29, 2017
Example of Proposed Methodology Application
• Mission requirements:– The FPGA shall contain an embedded microprocessor.– Selection shall be made between a Xilinx V5QV (very
expensive device) or a Xilinx V5 with embedded PowerPC (relatively cheap device).
– FPGA operation shall have reliability of 3-nines (99.9%) within a 10 minute window at Geosynchronous Equatorial Orbit (GEO).
• Proposed methodology:– Create a histogram of particle flux versus LET for a 10-
minute window of time for your target environment.– Calculate MFTF per LET (obtain SEU data).– Graph R(Φ) for a variety of LET values and their associated
MFTFs. R(Φ)=eΦ/MFTF
– For selected ranges of LETs, use an upper bound of particle flux (number of particles/cm210-minutes), to determine if the system will meet the mission’s reliability requirements.
22
To be presented by Melanie Berg at the NASA Electronics Parts and Packaging (NEPP) Electronics Technology Workshop (ETW), Greenbelt, MD, June26–29, 2017
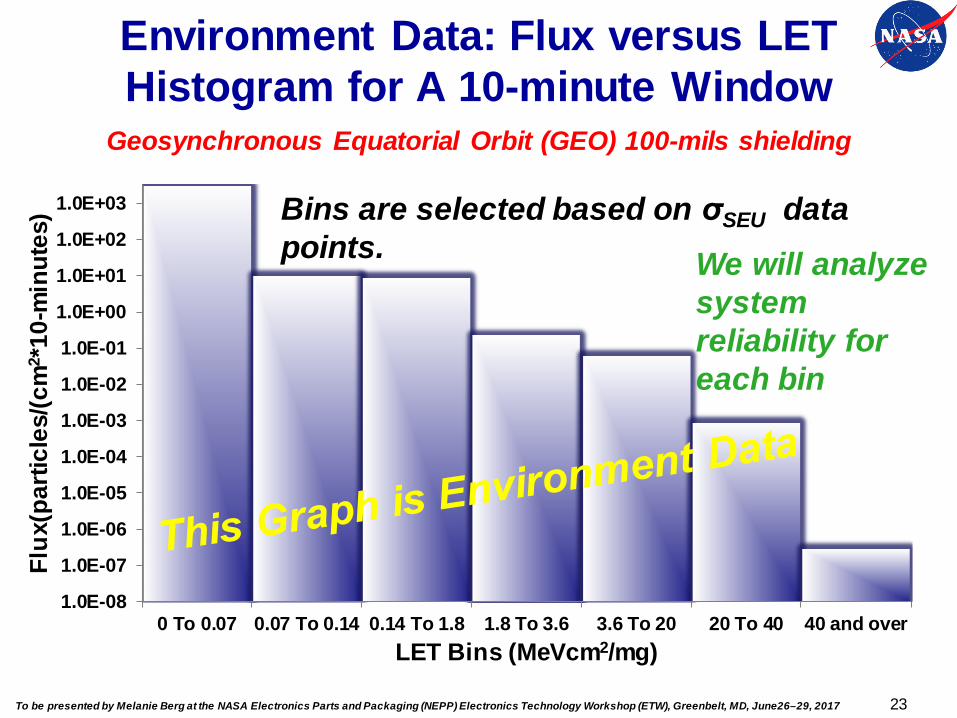
Environment Data: Flux versus LET Histogram for A 10-minute Window
23
Geosynchronous Equatorial Orbit (GEO) 100-mils shielding
1.0E-08
1.0E-07
1.0E-06
1.0E-05
1.0E-04
1.0E-03
1.0E-02
1.0E-01
1.0E+00
1.0E+01
1.0E+02
1.0E+03
0 To 0.07 0.07 To 0.14 0.14 To 1.8 1.8 To 3.6 3.6 To 20 20 To 40 40 and over
Flux
(par
ticle
s/(c
m2 *
10-m
inut
es)
LET Bins (MeVcm2/mg)
Bins are selected based on σSEU data points. We will analyze
system reliability for each bin

To be presented by Melanie Berg at the NASA Electronics Parts and Packaging (NEPP) Electronics Technology Workshop (ETW), Greenbelt, MD, June26–29, 2017
MFTF versus LET for the Xilinx V5 Embedded PowerPC Core and the Xilinx V5QV MicroBlaze Soft Processor Core
• V5QV: no system errors were observed below LET=1.8MeVcm2/mg. Total fluence > 5.0×10⁸
particles/cm2.• PowerPC:
– No system errors were observed below LET=0.07MeVcm2/mgwith total fluence = 1.0×10⁸ particles/cm2.
– Hence, at 0.07, we will assume an upper-bound MFTF = 1.0×10⁸
particles/cm2. – More tests would increase
the MFTF for this bin.24
1.00E+02
1.00E+03
1.00E+04
1.00E+05
1.00E+06
1.00E+07
1.00E+08
0 20 40 60 80 100
MFT
F (p
artic
les/
cm2 )
LET MeVcm2/mg
V5QV: MicroBlazewith Cache EnabledV5: PowerPC
MFTF = 1/σSEU

To be presented by Melanie Berg at the NASA Electronics Parts and Packaging (NEPP) Electronics Technology Workshop (ETW), Greenbelt, MD, June26–29, 2017
9.998400E-01
9.998600E-01
9.998800E-01
9.999000E-01
9.999200E-01
9.999400E-01
9.999600E-01
9.999800E-01
1.000000E+00
0 1000 2000 3000 4000 5000 6000 7000 8000 9000
Rel
iabi
lity
Fluence (particles/cm2)
Reliability across Fluence up to LET=0.07MeVcm2/mg
25
Binned GEO Environment data show approximately 3000particles/(cm210-minutes), in the range of 0.0MeVcm2/mg to 0.07MeVcm2/mg. We are using MFTF for 0.07MeVcm2/mg to upper bound this bin.
Reliability at 3000 particles/(cm210-minutes) > 99.99% for the PowerPC design implementation. “9’s” could be increased with more tests.
R(Φ)=eΦ/1.0×108
PowerPC: MFTF = 1.0×10⁸
Used MFTF= 1.0×10⁸ because that was the maximum fluence for tests (no errors observed)
To be presented by Melanie Berg at the NASA Electronics Parts and Packaging (NEPP) Electronics Technology Workshop (ETW), Greenbelt, MD, June26–29, 2017
9.999920E-01
9.999930E-01
9.999940E-01
9.999950E-01
9.999960E-01
9.999970E-01
9.999980E-01
9.999990E-01
1.000000E+00
0 2.5 5 7.5 10 12.5 15 17.5 20 22.5
Rel
iabi
lity
Fluence (particles/cm2)
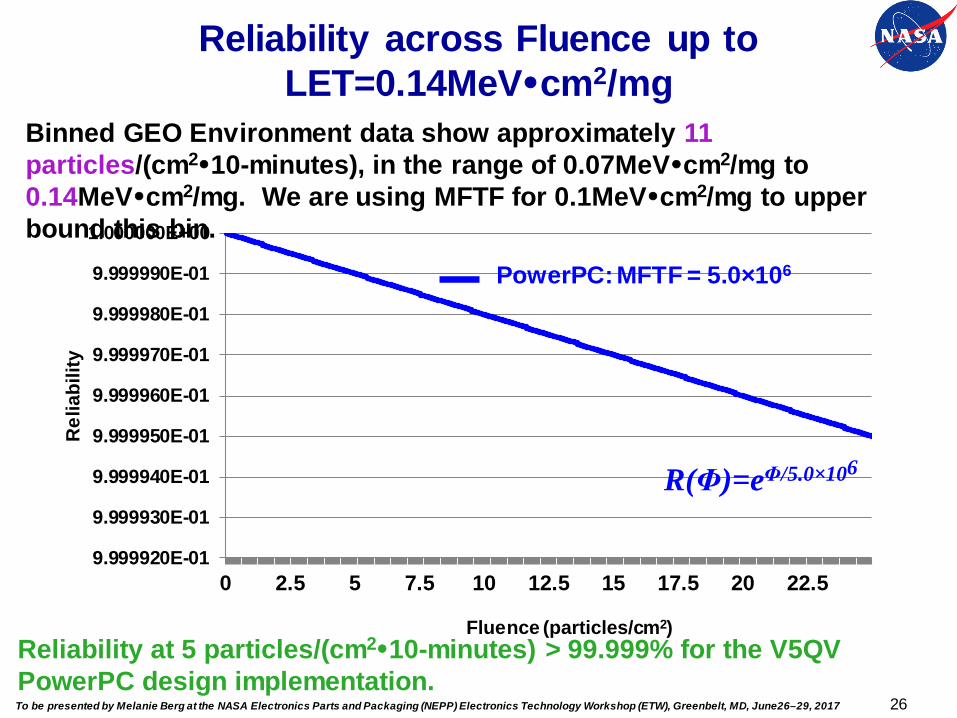
Reliability across Fluence up to LET=0.14MeVcm2/mg
26
Binned GEO Environment data show approximately 11 particles/(cm210-minutes), in the range of 0.07MeVcm2/mg to 0.14MeVcm2/mg. We are using MFTF for 0.1MeVcm2/mg to upper bound this bin.
Reliability at 5 particles/(cm210-minutes) > 99.999% for the V5QV PowerPC design implementation.
R(Φ)=eΦ/5.0×106
PowerPC: MFTF = 5.0×10⁶
To be presented by Melanie Berg at the NASA Electronics Parts and Packaging (NEPP) Electronics Technology Workshop (ETW), Greenbelt, MD, June26–29, 2017
9.992000E-01
9.993000E-01
9.994000E-01
9.995000E-01
9.996000E-01
9.997000E-01
9.998000E-01
9.999000E-01
1.000000E+00
0 4 8 12 16 20 24 28
Rel
iabi
lity
Fluence (particles/cm2)
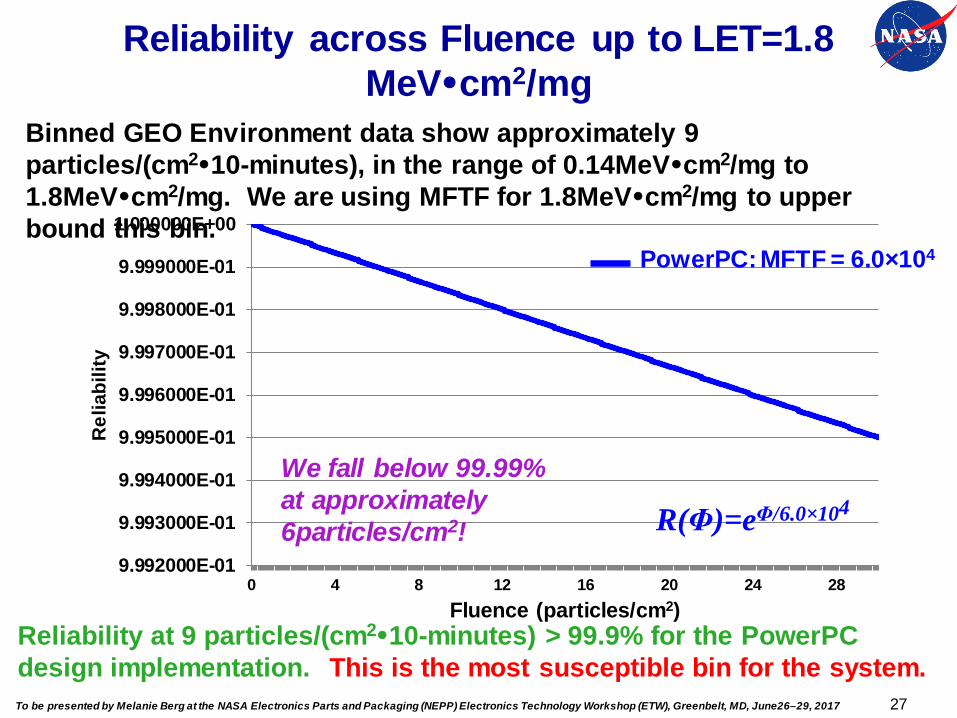
Reliability across Fluence up to LET=1.8 MeVcm2/mg
27
Binned GEO Environment data show approximately 9 particles/(cm210-minutes), in the range of 0.14MeVcm2/mg to 1.8MeVcm2/mg. We are using MFTF for 1.8MeVcm2/mg to upper bound this bin.
Reliability at 9 particles/(cm210-minutes) > 99.9% for the PowerPC design implementation. This is the most susceptible bin for the system.
We fall below 99.99% at approximately 6particles/cm2! R(Φ)=eΦ/6.0×104
PowerPC: MFTF = 6.0×10⁴

To be presented by Melanie Berg at the NASA Electronics Parts and Packaging (NEPP) Electronics Technology Workshop (ETW), Greenbelt, MD, June26–29, 2017
Reliability across Fluence up to LET=3.6MeVcm2/mg
28
Binned GEO Environment data show approximately 0.23 particles/(cm210-minutes), in the range of 1.8MeVcm2/mg to 3.6MeVcm2/mg.
Within this LET range, reliability at 0.23 particles/(cm210-minutes) > 99.999% for both design implementations.
9.99700E-01
9.99750E-01
9.99800E-01
9.99850E-01
9.99900E-01
9.99950E-01
1.00000E+00
0 1 2 3 4 5 6 7 8 9 10
Rel
iabi
lity
Fluence (particle/cm2)
V5QV: MFTF= 2.5×10⁶
PowerPC: MFTF = 1.2×10³
R(Φ)=eΦ/1.2×103R(Φ)=eΦ/2.5×106

To be presented by Melanie Berg at the NASA Electronics Parts and Packaging (NEPP) Electronics Technology Workshop (ETW), Greenbelt, MD, June26–29, 2017
Reliability across Fluence at LET=40MeVcm2/mg
29
Within this LET range, reliability at 0.07 particles/(cm210-minutes) > 99.9% for both design implementations. We can refine by analyzing
smaller bins.
Binned GEO environment data show approximately 0.07 particles/(cm210-minutes), in the range of 3.6MeVcm2/mg to 40.0MeVcm2/mg.
0.9994
0.9995
0.9996
0.9997
0.9998
0.9999
1
0 0.01 0.02 0.03 0.04 0.05 0.06 0.07 0.08 0.09 0.1
Rel
iabi
lity
Fluence (particle/cm2)
We fall below 99.99% at approximately 0.02particles/cm2!
V5QV: MFTF= 2×10⁴
PowerPC: MFTF = 2.8×10²
R(Φ)=eΦ/2.8×102R(Φ)=eΦ/2.0×104
To be presented by Melanie Berg at the NASA Electronics Parts and Packaging (NEPP) Electronics Technology Workshop (ETW), Greenbelt, MD, June26–29, 2017
Example Conclusion• Using the proposed methodology, the commercial Xilinx
V5 device will meet project requirements.• In this case, the project is able to save money by
selecting the significantly cheaper FPGA device and gain performance because of the embedded PowerPC.
30

To be presented by Melanie Berg at the NASA Electronics Parts and Packaging (NEPP) Electronics Technology Workshop (ETW), Greenbelt, MD, June26–29, 2017
Conclusions• This study transforms proven classical reliability models into the
SEU particle fluence domain. The intent is to better characterize SEU responses for complex systems.
• The method for reliability-model application is as follows: – SEU data are obtained as MFTF. – Reliability curves (in the fluence domain) are calculated using
MFTF; and are analyzed with a piecemeal approach.– Environment data are then used to determine particle flux
exposure within required windows of mission operation.• The proposed method does not rely on data-fitting and hence
removes a significant source of error.• The proposed method provides information for highly SEU-
susceptible scenarios; hence enables a better choice of mitigation strategy.
• This is preliminary work. There is more to come.
31
This methodology expresses SEU behavior and response in terms that missions understand via classical reliability metrics.

To be presented by Melanie Berg at the NASA Electronics Parts and Packaging (NEPP) Electronics Technology Workshop (ETW), Greenbelt, MD, June26–29, 2017
Acknowledgements
• Some of this work has been sponsored by the NASA Electronic Parts and Packaging (NEPP) Program and the Defense Threat Reduction Agency (DTRA).
• Thanks is given to the NASA Goddard Radiation Effects and Analysis Group (REAG) for their technical assistance and support. REAG is led by Kenneth LaBel and Jonathan Pellish.
32
Contact Information:Melanie Berg: NASA Goddard REAG FPGA
Principal Investigator:[email protected]

![Washington State Register, Issue 18-20 WSR 18-19-039 WSR ...lawfilesext.leg.wa.gov/law/wsr/2018/20/18-20PERM.pdfWashington State Register, Issue 18-20 WSR 18-19-039 [ 3 ] Permanent](https://img.pdfslide.us/doc/110x75/5e296fba3c4ac031d5241955/washington-state-register-issue-18-20-wsr-18-19-039-wsr-washington-state-register.jpg)

![Washingtonapps.leg.wa.gov/documents/laws/wsr/2011/02/11-02MISC.pdfFeb 11, 2011 · Washington State Register, Issue 11-02 WSR 11-01-009 [ 1 ] Miscellaneous WSR 11-01-009 NOTICE OF](https://img.pdfslide.us/doc/110x75/601d94968bcf4a436d5fb8c1/feb-11-2011-washington-state-register-issue-11-02-wsr-11-01-009-1-miscellaneous.jpg)

![Washington State Register, Issue 15-24 WSR 15-23-052 WSR ...lawfilesext.leg.wa.gov/law/wsr/2015/24/15-24PROP.pdf · Washington State Register, Issue 15-24 WSR 15-23-052 [ 3 ] Proposed](https://img.pdfslide.us/doc/110x75/5f041c557e708231d40c5ec0/washington-state-register-issue-15-24-wsr-15-23-052-wsr-washington-state-register.jpg)
![lawfilesext.leg.wa.govlawfilesext.leg.wa.gov/law/wsr/2006/19/06-19PERM.pdf · Washington State Register, Issue 06-19 WSR 06-19-006 [ 1 ] Permanent WSR 06-19-006 PERMANENT RULES COLUMBIA](https://img.pdfslide.us/doc/110x75/5fc956b20858ac4f59139174/washington-state-register-issue-06-19-wsr-06-19-006-1-permanent-wsr-06-19-006.jpg)
![Washington State Register, Issue 19-13 WSR 19-13-039 WSR ...lawfilesext.leg.wa.gov/law/wsr/2019/13/19-13PROP.pdfWashington State Register, Issue 19-13 WSR 19-13-039 [ 1 ] Proposed](https://img.pdfslide.us/doc/110x75/60fdcb8745e4c11c7b038d1b/washington-state-register-issue-19-13-wsr-19-13-039-wsr-washington-state-register.jpg)
![Washington State Register, Issue 19-17 WSR 19-17-013 WSR ...lawfilesext.leg.wa.gov/law/wsr/2019/17/19-17PROP.pdf · Washington State Register, Issue 19-17 WSR 19-17-037 [ 3 ] Proposed](https://img.pdfslide.us/doc/110x75/5e896ab35bac746fc738f497/washington-state-register-issue-19-17-wsr-19-17-013-wsr-washington-state-register.jpg)
![apps.leg.wa.govapps.leg.wa.gov/documents/laws/wsr/2007/07/07-07PERM.pdfWashington State Register, Issue 07-07 WSR 07-06-041 [ 1 ] Permanent WSR 07-06-041 PERMANENT RULES DEPARTMENT](https://img.pdfslide.us/doc/110x75/5e89698e09922a23a2448408/appslegwa-washington-state-register-issue-07-07-wsr-07-06-041-1-permanent.jpg)


![Washington State Register, Issue 16-14 WSR 16-14-003 WSR ...lawfilesext.leg.wa.gov/law/wsr/2016/14/16-14PERM.pdf · Washington State Register, Issue 16-14 WSR 16-14-003 [ 1 ] Permanent](https://img.pdfslide.us/doc/110x75/606f816e8f839c29535021ca/washington-state-register-issue-16-14-wsr-16-14-003-wsr-washington-state-register.jpg)