Embed Size (px)
Citation preview

Chapter 8:
The Challenge of Fiscal Discipline in the Indian States
W.J. McCarten1
India is de facto a decentralized federal democracy of one billion inhabitants and 25 states
which embraces a great deal of ethnic, linguistic and cultural diversity. More than half of general
government expenditures are undertaken by state and local governments. It also has many
attributes of a highly centralized country including a quasi-federal constitution, a high
concentration of effective taxing powers at the central level, a highly regulated financial market
dominated by centrally-owned financial institutions, and significant parts of its economy still
subject to central directives. Much ingenuity has been devoted to the business of resolving these
apparent contradictions and making Indian fiscal federalism work in practice. But this same
ingenuity has deprived India of some potential benefits of pure federalism, .2 such as sole
accountability of each level of government for its fiscal performance. Despite the existence of
hierarchical federal structures which are capable of imposing hard budget constraints, in recent
decades lines of authority and accountability have become blurred across levels of government
resulting in a softening of budget constraints or in state-level expectations that their budget
constraints might soft. In turn, institutions and policies, which have softened budget constraints
or created expectations of softening, have complicated macroeconomic management, distorted
state-level debt financing decisions, encouraged states to make bad inter-temporal budget choices,
and contributed to major distortions in sub-national public expenditure composition. Fortunately,
1 The views expressed in this paper are those of the author and do not necessarily reflect those of the World Bank. My colleagues Roberto Zagha, Edgardo Favora, Shahrokh Fardoust, Kanishka Ghoshal, Rajni Khanna, V.J Ravishankar, Mike Stevens, Fahrettin Yagci, and Farah Zahir have assisted generously in the production and review of this paper, although I remain solely responsible for the judgments expressed herein. I also owe a debt to Professor Roy Bahl of Georgia States University for his comments, to the late S. Guhan for being my initial guide to Indian federalism. The sponsorship of the decentralization thematic group is also gratefully acknowledged. 2 Pure federalism is defined by Richard Musgrave as the case where state governments possess full autonomy. See Musgrave (1959: 12).

2
as this paper will report, a few important steps have recently been taken by the states to achieve
greater fiscal consolidation and by the Center to reduce the risk of moral hazard exposure.
This case study examines the institutions and incentive mechanisms which influence
budget outcomes at the state level and reviews the power of mechanisms of correction when soft
budget constraints become a major fiscal problem. These mechanisms are: (i) the hierarchical
mechanism of central oversight and control of state debt and deficit financing, (ii) credit market
incentives, (iii) political checks on deficit financing and populist politics through electoral
processes, (iv) the potential role of capitalization effects on land markets, and (v) the interstate
competitive effects of fiscal regime performance in attracting or discouraging investment. The
case study attempts to identify the most important constitutional features and market
characteristics which influence sub-national deficit financing and debt management in India as
well as the informal “rules of the game” of intergovernmental fiscal relations.
I. Description and overview of Indian federalism
At independence, India’s political leaders inherited a badly fractured society and an
economy which had stagnated during the previous fifty years of colonial rule. They resolved to
create a centralized, federal constitution both to ensure the cohesiveness of a vast country and to
build a system of government which would act as an engine of economic growth and
development. The framers of India’s 1950 constitution divided the powers of government into
three lists: a Union or Central list, a states list, and a concurrent list. In addition to the usual
powers over matters related to interstate commerce, the institutions of macroeconomic policy, and
defense, all residual powers are placed on the Union List. The Central or Union government has
wide power to intervene in state affairs and to exercise supervisory power over the states.
Matters relating to land rights, public health and sanitation, agriculture, agricultural education,
irrigation and water use, roads, and local government are placed on the States List. Matters

3
relating to population control and family planning, education, minor ports, electricity, and trade
and supply of certain basic agricultural commodities have been placed on the Concurrent List.
States incur about 87 percent of total expenditure on social services and 59 percent of
expenditures on economic services, embracing both current and capital account activities.
Significantly, the responsibility for economic and social planning was made a concurrent subject.
But at least during the period from 1950 to 1991, state planning units functioned primarily as the
agents of the central planning authority.
In an effort to prevent intergovernmental jurisdictional disputes, the Constitution divided
most taxing powers between the Center and the states without a degree of overlap. These unique
assignments have inhibited the states from broadening their tax bases in an efficient manner to
meet increasing expenditure responsibilities for infrastructure and social spending. The unique
assignments have also undermined the scope for co-operative and tax harmonization initiatives
that have developed in other federal countries. The states were given the power to levy a broad-
based sales tax, but the tax room intended for the states by this provision has been partially
preempted by the authority given to the Center to impose excises on almost any commodity.
Revenue sources
Indian states raise less than half of their financial requirements from their own resources.
States' own tax yields have been a relatively constant 5.7 percent of GDP over the last four years
despite tremendous untapped opportunities for improvements in state tax policy and
administration. Out of expenditure amounting to 16 percent of GDP in recent years, the states
own revenues financed only the equivalent of 7-8 percent of GDP, the remaining 8-9 percent
being financed through transfers from the central government budget or debt financing organized
by the central government. Thus, the central government is responsible for the financing of 55
percent of states' spending. States account for approximately 58 percent of the combined center
and state expenditures net of state interest and central transfers. The average performance in own

4
revenue generation effort by all states masks wide disparities amongst the states. For example,
Gujarat manages to mobilize own tax and non-tax revenues equivalent to 76 percent of its current
account expenditures, while for Uttar Pradesh and Bihar the corresponding percentages are 36
percent and 35 percent respectively. Effective tax effort varies considerably across states from a
high of 12 percent of state national product in Tamil Nadu to a low of 6 percent in Uttar Pradesh
and 5 percent in Bihar among major states. Cost recovery, particularly in power, irrigation and
water resources use, meets less than 1/3 of break even costs for non-commercial users. The local
government or third tier tax to GDP ratio is estimated to be just about 1 percent, compared to
about 7.5 percent for the Central taxes and 8.5 percent for the state -level taxes.
Fiscal Federal Relations in the Era of Planning
Formal economic planning, begun shortly after independence, greatly augmented the
central government’s effective powers of command and control over state governments and the
private economy. Under the leadership of its first Prime Minister, Jawaharlar Nehru, India
committed itself to ownership and control of what the fabian socialists evocatively termed “the
commanding heights” of the economy. From 1950 until 1991 the system of federal transfers,
together with other instruments of central planning such as exchange controls, investment
licensing (which enabled the central government to influence the regional distribution of
investment), and tight control over lending policies of financial institutions enabled the Center to
exercise a strong centripetal influence over state government finances. These instruments and a
commitment to planning of both private and public investment discouraged states and local
governments from developing economic policies of their own and nurtured a political culture of
dependence at the state level.
The process of harmonization of state policy priorities and the national development strategy
is a byproduct of Central approval of the size and composition of annual state plans and state
utilization of centrally-sponsored scheme resources. The Center is cash rich relative to its

5
expenditure responsibilities. It has used transfer instruments such as matching grants and spending
conditions on block grants to influence the expenditure outcomes of states, which are revenue poor
but rich in expenditure mandates. During the era of formal planning, the paramount goals of the
system of federal transfers were to encourage states to act as the agent of Plan-led economic
growth and to provide an effective channel to fuel this Plan-led growth with ever-increasing
domestic savings. Reliance on voluntary absorption of domestic savings, largely generated in the
farm sector, appeared to be an eminently sensible strategy for incremental resource mobilization,
given the difficulty of taxing farmers directly under the best of conditions and the relatively low
real interest rates prevailing pr ior to the onset of liberalization. High public sector borrowing by
the states was judged to be sustainable, provided that on-lent funds were invested efficiently in
infrastructure projects or social spending with high social rates of return. Transfers formulas
were rules based and reasonably stable rather than ad hoc.
Until the mid-1980s this mechanism largely achieved its purpose. Public sector investment
rose from 4 percent of GDP in the early 1950's to approximately 12 percent in the 1980's, of
which state level investment accounts for more than half. The system of fiscal relations
functioned adequately as long as: (i) financial repression permitted deficit financing with loans
that bore low positive real interest rates 3, (ii) the supply of highly-subsidized services such as
power to agricultural users was limited, and (iii) the “license raj” system for approval of all
private investments ensured that all states would retain their existing proportional shares of new
private investment.
3 John Williamson and Molly Maher (1998) judge that India moved from full financial repression in 1973 to partial repression by 1996 for interest rates and credit controls.

6
Market liberalization reforms swept away much of this system. In particular, the
investment license raj was abolished giving the states more de facto economic autonomy.
Beginning in the late 1980s, the private sector overtook the public sector as the engine of growth.4
The interstate competition to attract private investment began to overshadow public sector
investment as a determinant of state level economic growth. But during the 1990s the economic
liberalization process suffered from a fundamental imbalance. Progress has been slow in
implementing capital market, banking and pension reforms, although progress in banking reform
began to speed up in 20005. In principle, the new-found autonomy of states and local
governments should provide them with opportunities to design expenditure and revenue policies
better tailored to local needs and conditions. But he loosening of central control of state public
finances in an economy with incomplete financial sector reform increased the risk that many
states would make the wrong adjustment choices and employ innovative financing instruments
purely in an effort to escape from hard budget constraints. To some extent, this has already
happened and even when the Central Government has acted to push the onus of paying for
populist policies back on to the states it appears to have taken most states by surprise.
Reform of state finances has assumed greater significance for macroeconomic management
as the fiscal deficit of state governments has reached unsustainable levels. Current account
deficits have emerged in most states since 1986-87 and have led implicitly to the diversion of
central transfers to the states intended for capital projects to service the interest expenses of states.
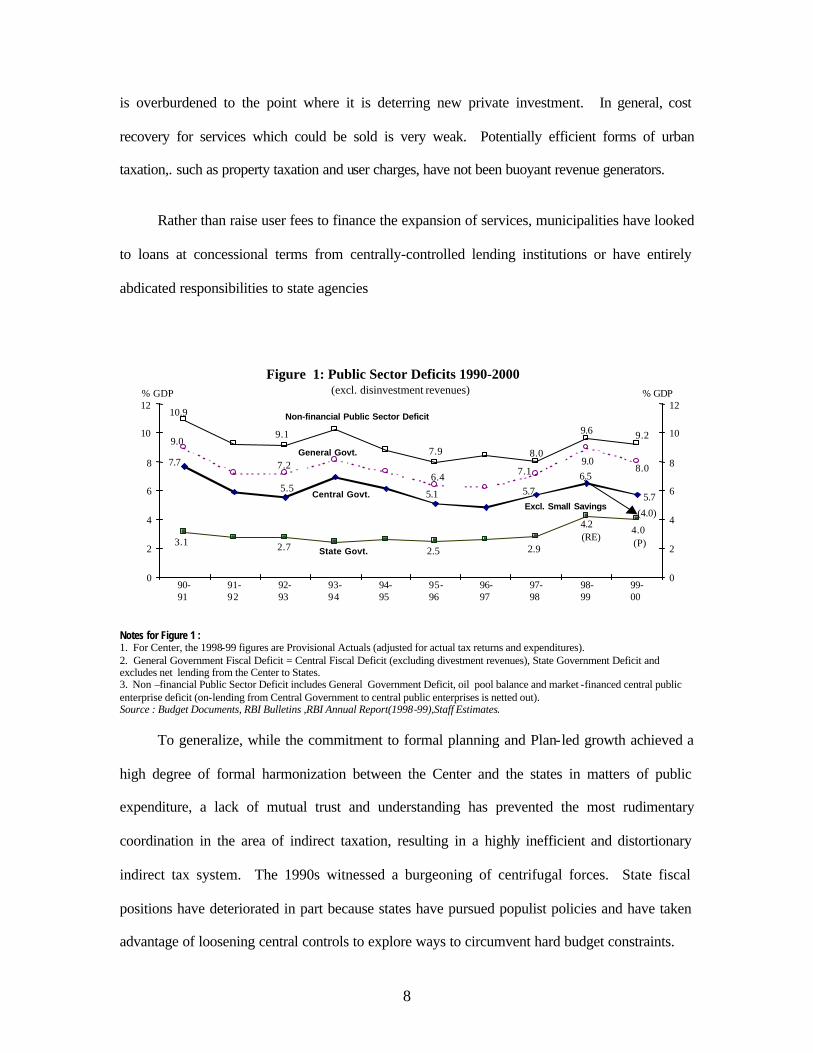
As shown in Figure 1, the gross fiscal deficit to GDP ratio of all state governments rose to a high
of 4.2% in 1998-99 – the highest recorded in Indian fiscal history so far. The fiscal performance
of individual states varies widely over the 1990s, with the most marked deterioration coming in
4 Gross fixed capital formation (GFCF) for India has risen from 17% in 1970-71 to 26.3% in 1995-96. An investigation of the sectoral composition of GFCF shows that the private corporate sector's contribution grew from 2.4 percent of GDP to 9.1 percent- over this period. Public sector capital formation also grew from 6.5 percent of GDP to peak in 1986-87 at 11.7% of GDP and then dwindled to 7.9 percent in 1995-96. 5 For example during 2000 the GOI gave ‘in-principle’ approval to two public banks for dilution of the government’s shareholding to 33% by mobilizing fresh capital through public issues and cleared a uniform Voluntary Retirement Scheme for the banking sector, remo ving a major hurdle to bank restructuring, particularly that of weak banks

7
some of the poorer states. In Uttar Pradesh, the fiscal deficit rose from 4.5% of GSDP in 1993-94
to 8.6% in 1997-98; in Bihar, from 4.0% to 6.2%; in Orissa from 5.7% to 6.3%. In 1998-99, the
states’ fiscal deficit worsened to 4.2%, as the Central Government’s generous wage settlement
influenced the wage bills of overstaffed states administrations.
Financing these large deficits has meant increased borrowings from the Central
Government and the issuance of guarantees by the states for the borrowing of state-owned public
enterprises..
Table 1. Main Fiscal Trends in All States (percent of GDP) (fiscal year ending March 31)
1990-91 1991-92 1992-93 1993-94 1994-95 1995-96 1996-97 1997-98 R.E.
Total Revenue 11.5 12.1 11.9 12.0 11.8 11.2 10.8 11.3 Own Revenue Tax 5.2 5.4 5.2 5.3 5.4 5.2 5.0 5.4 Non-Tax 1.6 1.9 1.7 1.8 2.1 1.9 1.7 1.6 Central Transfers 4.6 4.8 5.0 5.0 4.3 4.1 4.1 4.3 Shared Taxes 2.5 2.5 2.7 2.6 2.4 2.4 2.5 2.6 Grants 2.2 2.3 2.3 2.4 1.9 1.7 1.6 1.8 Total Expenditure 14.7 15.0 14.7 14.4 14.4 13.8 13.5 14.6 Revenue Expenditure 12.4 13.0 12.6 12.5 12.4 11.9 12.0 12.6 Interest Payments 1.5 1.6 1.7 1.8 1.9 1.8 1.8 2.0 Education 2.7 2.6 2.5 2.5 2.4 2.4 2.3 2.5 Health and Family Welfare 0.8 0.8 0.7 0.8 0.7 0.7 0.7 0.7 Capital Expenditure (net) 2.3 2.0 2.1 1.9 2.0 1.9 1.5 2.0 Revenue Deficit 0.9 0.9 0.7 0.4 0.6 0.7 1.1 1.3 Fiscal Deficit 3.2 2.9 2.7 2.3 2.6 2.6 2.7 3.3 Debt Stock 18.7 18.6 18.4 18.3 17.8 17.4 17.2 18.2
Note : New GDPmp series is used (revised base 93-94) and for years prior to 1993-94 rebasing is done assuming a linking factor Source : RBI States Supplement 1998, CSO
Decentralization at the local level has also raised issues of financial accountability and
control. Prior to 1992, local government in India did not have a recognized constitutional
identity. While the legal status of urban local governments has now been raised, they continue to
exercise only such taxing and expenditures responsibilities as were devolved to them by their
respective state governments. Urban governments lack adequate revenue resources to carry out its
mandate and suffer from fragmentation of responsibilities. Urban infrastructure, in major centers,
8
is overburdened to the point where it is deterring new private investment. In general, cost
recovery for services which could be sold is very weak. Potentially efficient forms of urban
taxation,. such as property taxation and user charges, have not been buoyant revenue generators.
Rather than raise user fees to finance the expansion of services, municipalities have looked
to loans at concessional terms from centrally-controlled lending institutions or have entirely
abdicated responsibilities to state agencies
Figure 1: Public Sector Deficits 1990-2000(excl. disinvestment revenues)
9.1
7.9 8.0
9.6 9.2
10.9
5.5
7.7
5.76.5
5.75.1
4.2
2.92.52.73.1
7.26.4 7.1
9.0
9.0
0
2
4
6
8
10
12
90-91
91-92
92-93
93-94
94-95
95-96
96-97
97-98
98-99
99-00
0
2
4
6
8
10
12
General Govt.
Central Govt.
State Govt.
% GDP % GDP
(P)(RE)
Excl. Small Savings
Non-financial Public Sector Deficit
8.0
4.0
(4.0)
Notes for Figure 1 : 1. For Center, the 1998-99 figures are Provisional Actuals (adjusted for actual tax returns and expenditures). 2. General Government Fiscal Deficit = Central Fiscal Deficit (excluding divestment revenues), State Government Deficit and excludes net lending from the Center to States. 3. Non –financial Public Sector Deficit includes General Government Deficit, oil pool balance and market -financed central public enterprise deficit (on-lending from Central Government to central public enterprises is netted out). Source : Budget Documents, RBI Bulletins ,RBI Annual Report(1998-99),Staff Estimates.
To generalize, while the commitment to formal planning and Plan-led growth achieved a
high degree of formal harmonization between the Center and the states in matters of public
expenditure, a lack of mutual trust and understanding has prevented the most rudimentary
coordination in the area of indirect taxation, resulting in a highly inefficient and distortionary
indirect tax system. The 1990s witnessed a burgeoning of centrifugal forces. State fiscal
positions have deteriorated in part because states have pursued populist policies and have taken
advantage of loosening central controls to explore ways to circumvent hard budget constraints.

9
Fiscal Transfers
There are four components or channels to the fiscal transfer system with implied associated
hierarchical controls.
Finance Commission Transfers
First, state governments account for almost 57 percent of general government expenditures
but only 35 percent of revenues. To cope with the resulting shortfall, the constitution stipulates
that a Finance Commissions be established every five years to devolve to the states parts of the
proceeds of some taxes assigned to the Center for reasons of efficiency and administrative ease.
Rules for making transfer awards have varied from commission to commission, so that a set of firm
principles to guide incoming commissioners has not evolved. Minor debt relief has been extended
periodically by the Center to states on the recommendations of successive Finance Commissions
but as shown in Table 2 when the quantum of debt relief is normalized by the state domestic
product of the year in which it was granted, the trend is clearly one of decreased relative
commitment to central debt forgiveness over time.
Over the course of the 1970s and 1980s, finance commissions have expressed sympathy with
the argument that the mismatch between state development mandates and inadequate instruments of
taxation required greater tax share awards and special block grant awards defined in absolute rupee
terms for deficit gap filling. In response, Central finances were destabilized as the Center sought to
raise its own tax revenues or borrow in order to comply with Finance Commission awards and
finance increasing proportions of state expenditures. Whereas the tax shares were allocated to states
on the basis of objective criteria such as population and disparities in per capita state income, block
grants have been allocated to states on the basis of their projected gap on non-plan account
between projected revenues and projected expenditures for a five-year period. Using these
projections, the Commission makes recommendations for tax devolution and grants-in-aid as

10
required by the Constitution to achieve a hypothetical balance or surplus on non-plan current
account. This gap filling methodology has been a major contributor to softening of originally hard
budget constraints of the states by encouraging them to slip from current account surpluses into
deficit positions. Indeed, knowledge of this projection methodology by state budget makers may
have had perverse consequences according to Gurumurthi (1995). He contends that, “ with a
view to maximizing their share in the central transfers , it is not unusual to see states tending to
incur a large amount of expenditure in the base year prior to the constitution of a Finance
Commission” (Gurumurthi, 1995: 35). Even if state budgeting behavior is not as strategic as
Gurumurthi alleges, the "gap filling" approach is likely to discourage states from running current
account surpluses. New econometric research on the determinants of states own tax effort also
indicates that increases in grants from the central government to the states have reduced the
efficiency of tax collections by states and that the poorer states, which benefit most from the gap
filling approach, are the least efficient in tax collection. R. Jha et al (1999) model the determinants
of tax effort by major states and find that the higher the ratio of central grants in total expenditures
of any government, the lower is its tax effort.
Some recent Commissions have adopted formal methodologies for measuring the
divergence in fiscal capacity in objective terms and for allocating devolved resources among the
states so as to compensate for these divergences. This approach was partially adopted by the
Ninth Finance Commission. A byproduct of this approach, if adopted comprehensively, is that
the tax devolution awards would be invariant to actual tax collections, thus removing the
disincentive for states with low tax effort outcomes to achieve improvements. This approach is
also attractive because it can address both vertical and horizontal imbalances with a single policy
instrument.
The Tenth Finance Commission sought to reform the incentive of the transfer system by
recommending: (i) a phased reduction of general grants-in-aid, which had previously been used to
fill revenue gaps between current revenues and expenditures; and (ii) two new incentive schemes

11
for debt relief of principal owed to the Center, one tied to improvement in fiscal performance in
the current account, and a matching debt relief scheme tied to the amount of state PE divestment
proceeds used to retire state debt.
These two debt reduction schemes might have been expected to provide a powerful
incentive for the states to adjust, but in practice the actual fiscal benefits realized by the states
from these schemes has been meager. Little privatization of state-owned enterprises has occurred
since the release of the Tenth Finance Commission’s report, in part because of the political power
of state employees, who resist privatization.
Successive Finance Commissions also established a tradition of unconditional debt
forgiveness. The Sixth, Seventh and Eighth Commissions gave substantial debt relief to the most
indebted states in the proportion of their indebtedness relative to the size of their economies.
Table 2: Debt Forgiveness by Finance Commissions
FC Year of
Report Rs. Billion GDP Billions % of GDP
Sixth 1974 19.7 667 2.95 Seventh 1979 21.6 1025 2.11 Eighth 1984 22.9 2223 1.03 Ninth 1989 9.8 4357 0.22 Tenth 1995 5 10672 0.05 Eleventh 2000 34 20050 0.17
Source: Table 19.5 H.L. Bhatia, Public Finance. Report of Tenth Finance Commission, Report o the Eleventh Finance Commission
Planning Commission Transfers
The second channel is provides by the Planning Commission (PC), which has a mandate
to co-ordinate the development plans of the center and the states. At its inception, the Planning
Commission was enjoined to reduce poverty and to work to minimize inequalities in income,
status, facilities, and opportunities among individuals and groups. The states were responsible for
preparing their own plans. However, these were assessed and adjudicated by the Planning
Commission in terms of national objectives and norms before financial support of a state plan is

12
secured. Most transfers awarded by the Planning Commission to the larger states are block
transfers, composed of loans (70 percent) and grants (30 percent). The Center also onlends
bilateral and multilateral agency lending at the same terms as for regular Plan assistance.
In practice, according to Mozoodmar (1996), the Planning Commission has substantial
executive authority in determining public sector investment programs, especially by the states.
Most significantly, in the case of the states, it has the final say in allocating plan assistance which
for most states provides the bulk of the debt financing and grants needed to implement their
investment programs. These transfers are used to finance the state infrastructure investments and
new current account programs dur ing the five-year life of a plan. Each state is guaranteed a
quantum of financing, tied to the size of its state plan, which is a mixture of grants, loans, and
access to centrally-guaranteed funding from financial institutions. The provision of Central
financing for the wage components of new programs for the first five years from inception has
also created a bias for expansion of programs and ballooning of state civil services.
Each year the states bilaterally negotiate the size of their own plans with the Planning
Commission. At this time, the limits are set on state borrowing from all sources including the
Central government, domestic financial institutions, additional central assistance for externally-
aided projects and projected small savings onlending. Historical borrowing records of individual
states and other economic indicators are taken into account, but formal debt sustainability
analysis has not been an ingredient in the process.
A formula bases largely on population and deviations in per capita income among the
states provides a transparent foundation for most grant and debt financing. However, despite the
great reliance on formula based transfers, the annual bilateral negotiations between the Planning
Commission and individual states introduces an element of non-transparency into state debt
financing and encourages states to pursue fiscal policies leading to moral hazard problems. Much
discretion remains at the margin for the Planning Commission to augment both the grant
resources of individual states. The Planning Commission does not publicize the rationale for its

13
decisions or its assessment of state debt and deficit sustainability. The process of setting debt
ceilings for individual states does not appear to take into account dynamic sustainability
considerations, such as the growth rate of real state income.
Conditional Grant Transfers
The third channel for transfer is conditional matching grants (usually covering between 50
percent to 80 percent of costs) for shared cost programs for centrally-sponsored schemes (CSS)
which are intended to ensure that the Center can influence state priorities so as to achieve national
policy goals. Examples of such programs include: primary education expansion programs, child
nutrition programs, public works, and poverty alleviation schemes. The mushrooming of
centrally-sponsored or shared cost schemes designed and monitored by the central government
has increased state dependency on central resources to finance marginal expenditures. In 1995-96
there were 182 CSS being supported with Central funding equivalent to 1.3 % of GDP. The vast
number of such schemes, their high administrative overhead costs, and rigid eligibility criteria,
have undermined effectiveness and distorted state priorities. The Center intends to streamline the
CSS system and convert most of the programs into block grants, but little progress has been made
in this initiative to date.6 One reason for the lack of progress is that the new block funding which
has been offered to the states, as a quid pro quo, is less generous than existing funding.
Deficit Financing
The fourth channel is deficit financing. Most of this is provided with an implicit Central
guarantee. In recent years, about 38 percent of the aggregate fiscal defic it of all states has been
financed with net loans from the Center. This is a dramatic decline from a 50 percent contribution
6 According to the text of the Ninth Plan, " In principle , the CSS should be confined to schemes of an inter-State character, matters impinging on national security, selected national priority where Central supervision is essential for effective implementation and multi-State externally financed projects where Central Co -ordination is necessary for operation reasons. Except for such schemes , all other schemes

14
in 1991-92, reflecting the increased burden of repaying past loan principal. Most of the remaining
components in deficit financing are controlled directly or indirectly by the central government.
“Market borrowings”, which designate resources from captive sources of finance, are
state-issued bonds placed with banks (as part of their Statutory Liquidity Ratios (SLR)
requirements which these institutions must meet), insurance companies and non-government
pension and provident funds. The Central Government allocates the SLR securities among states,
while states initiate other forms of borrowing. The Central Bank assumes responsibility for
marketing or assigning the agreed debt obligations of individual states to financial institutions.
Prior to liberalization, as much as one third of the gross fiscal deficit of the Centra1 Government
was monetized (Srinivasan 1993). As recently as early 1993, the SLR was 37.75 percent,
representing a substantial amount of financial sector repression. But during the early to mid-
1990s financial repression was eased and the government established an enabling environment for
market-based pricing of new capital issues. The SLR was reduced in stages to free private sector
asset space in the portfolios of financial institutions lending. Real interest rates on government
securities rose sharply. The SLR is currently 25 percent of deposits. The states also receive debt
financing from various un-funded or weakly funded provident, pension and insurance funds for
civil servants and public enterprise employees. The Central Government passes on funds that it
borrows on behalf of the States at its average cost of funds. These costs have been rising with
financial liberalization.
As a final instrument to control sub-national borrowing, since 1985 states have been required
to clear their overdraft positions with the RBI within 10 days or lose checking privileges with the
RBI. This threat has provided some degree of fiscal discipline with respect to short-term spending
controls and management of arrears, but it has not fostered hard budget constraints in the sense of
preventing states from adopting unsustainable expenditure and debt financing policies
should be transferred to the States along with the corresponding funds." Para 6.10 Planning Commission,

15
Logic and Problems of the System
The logic of the fiscal transfer and debt financing system assumed that states would run
current (revenue) account surpluses, or at least current non-plan surpluses so that borrowed
resources used to finance deficits would only fund productive capital account investments. Such
a strategy for financing capital outlays would be financially viable, if all capital expenditures
yielded net cash flows sufficient to cover amortized principal and interest obligations. Weak cost
recovery in power, water and irrigation by the states implies inefficient use of these resources,
and increasing infrastructure supply scarcity and use of borrows to finance current expenditures.
As shown in Figure 2, even in the mid 1980s, the states collectively exhibited a decreased
capacity to maintain levels of investment expenditure, while their interest expense obligations
began to rise. Interest has risen from approximately 14 percent of states own revenue plus share
of central taxes in 1980/81 to approximately 25 percent of this revenue aggregate by 1996/97. By
contrast, capital expenditures by the states, exclusive of net lending, have declined from
approximately 31 percent of state own revenue plus transferred tax shares in 1980/81 to
approximately 17 percent of the same revenue aggregate in 1996/97. Investment in power,
irrigation, roads, and urban infrastructure and rural water has stagnated. Expenditures for the
operation and maintenance of capital assets utilized in each of these sectors has actually declined,
while explicit and implicit subsidies for power, transport and irrigation has increased.
Concurrently, a policy failure to levy and collect adequate user charges on social and economic
services and to operate public utilities on a cost recovery basis has led to a relative decline in state
non-tax revenues and increased subsidization of state utilities. Although an overall crisis in state
finances leading to default may not be imminent in most states, a “quiet” crisis of expenditure
composition has emerged.
(1999) Ninth Plan

16
Figure 2: Key Components of State Governments'Expenditure
0.00.51.01.52.02.53.03.5
80-81
83-84
86-87
89-90
92-93
95-96
Source : RBI.
(% ofGSDP) Interest Payments
Capital Exp.
expenditureEducation
Health and FamilyWelfare
Overstaffing in response to populist demands, and adoption of wage parity with the Center
by most states during the 1980s, has contributed to dwindling capital expenditure. Consequently,
public investment at the state level has fallen far short of Plan intentions and the resultant
productivity of capital is low. During the late 80s and early 90s, as state resource constraints
hardened, states maintained or increased their real expenditures on wages and salaries, and
subsidies, while reducing expenditures on socially productive capital and maintenance and
permitting expenditures on basic health and primary education to stagnate. With financial
liberalization, interest rates increased and interest payments absorbed an increasingly large share
of state resources. Gradually but perceptibly, many states found themselves increasingly unable
to play their intended role in India’s development.
The scatter diagram in Figure 3 below shows a measure of state debt service ability in a
pre-liberalization base year, 1990-91 on the horizontal axis and the same measure six years later
on the vertical axis. Points above the 45% line imply a deterioration in debt service ability while
points below indicate an improvement in the second period. The diagram thus provides relative
positions of states at two points in time and a notion of movement. The numerator of the ratio is

17
gross interest paid and amortization of principal. The denominator is own tax revenue plus own
non-tax revenue and devolved tax shares. Grants from Planning Commission and shared cost
grants have been excluded from the base because these funds are earmarked for other purposes.
What the diagram shows clearly is that all states did not react in the same manner to the new
policy environment and that the system permitted the marked deterioration in debt servicing
ability of at least four states to go unchecked until the late 1990s.
Once key supports for the old planning system, such as low real interest rates and the
licenses raj vanished, the internal logic of the system began to collapse. As more of the
interregional investment patterns came to be determined by market forces, poorer states appeared
to be attracting proportionately less investment because of their deficient infrastructure
endowments. Unfortunately, there was a major recognition lag on the part of state level policy
makers and their advisors in appreciating that the macroeconomic structure of India had changed
fundamentally and that the states needed new financing strategies for the era of economic
liberalization.
Figure 3
Debt Servicing ratio (DSR) as a Percentage of Discretionary Revenue
0.0
5.0
10.0
15.0
20.0
25.0
30.0
35.0
40.0
45.0
0.0 5.0 10.0 15.0 20.0 25.0 30.0 35.0 40.0 45.0
DSR 1990/91
OR
RJ
UPPJ
450
WB
BH
AP
KRGJ
MP
MH
HYT N
KN

18
II. Incentives and Channels of the Soft Budget Constraint
The descriptive analysis in the previous sections indicates that the fiscal transfer system
which has evolved to deal with vertical fiscal imbalances within the federation has a number of
characteristic that work against fiscal correction by the states. Specifically, these characteristic
are: (i) provision of debt financing to states by financial institutions on uniform terms irrespective
of the degree of state creditworthiness; (ii) a large vertical fiscal imbalance which tends to erode
the “Wicksellian Connection” or link between expenditures in a state and tax burdens on state
residents; (iii) weak or non-existent linkage between loan disbursement from the Planning
Commission for state capital projects and actual capital infrastructure expenditures by the states;
(iv) a built-in incentive to establish new programs on current account because such programs
qualify for loan and grant financing from the Planning Commission for the first five years from
inception; and (v) the fragmenting and priority distorting impacts of the large number of
conditional, shared cost grant schemes, each with its own eligibility criteria. Some states have
exploited these design flaws by taking opportunistic approaches to maximizing transfers without
addressing their fundamental fiscal problems. Finally addition, without mandates to undertake
macroeconomic management, subnational governments may be more prone to fiscal
irresponsibility than their national counterparts.
The plan/non-plan distinction and associated Central financing support restrictions have
led to duplication and waste and adversely affected state finances (Kurian 1999). Mixing loans
and grants in a fixed proportion, irrespective of the varying mixes across states in the composition
of capital and current account expenditures for state projects and programs encourages the slower
growth states to assume an inappropriate mix of debt and taxes. Prior to 1969, loans and grants
were awarded to states after a project by project assessment. The 1969 adoption of the 70 percent
loan/ 30 percent grant financing proportionality reflected the then reasonable assumption that 30
percent of plan expenditures would be allocated to current account activities, while the remaining

19
70 percent would be assigned to fund productive capital expenditures. By contrast, the plans of
most states now typically allocate between 70 percent to percent of social spending and from
between 35 percent to 50 percent of economic spending to current account activities.
States and municipalities are apt to assume that the consequences of a potential default will
not be catastrophic, because partial bailout will be arranged either by the creditors or by a senior
level of government. These expectations of bailouts by states and their agencies have encouraged
Indian states to adoption high risk deficit financing strategies. In the case of India, a major direct
default has yet to occur, but indirect defaults by urban development authorities, which are
controlled by state governments, have occurred to Center infrastructure investment banks and
bills owed by states to centrally-owned electric power grids sometimes go unpaid.
High levels of power tariff subsidization for farmers have produced massive losses for
State Electricity Boards (SEB) and fostered overdraft positions which have been difficult for
many states to clear. For a long time, large subsidies from the states to their electricity utilities
(which are estimated to be equivalent to 1.5 percent of GDP) masked the deterioration in
electricity board finances. The awareness that state governments are prepared to extend a regime
of soft budget constraints led to lax bill collection by SEBs, widespread power theft and non-
payment of the bills which SEBs owe to creditors. Near bankrupt SEBs have been, "chronic
defaulters in honoring their payment obligations to their suppliers-- the coal mines, the power
stations of the Center which sell power to the state boards and the Indian Railways" (Dhawan
1997). Even in the late 1980s, power was available to many farmers for a mere four hours per
day. In this way, soft budget constraints and associated subsidization have led to binding supply
constraints that retard growth. Ironically, the soft budget constraints bring about real opportunity
cost prices for rural electricity which are many times higher than the cost recovery prices for SEB
energy under proper management regimes. Removal of state power subsidies and other
subsidized central inputs would also discourage over-exploitation of groundwater.

20
Institutional Deficiencies of State Budgeting Processes7
The state budget-making model is a system of investment led budgeting with weak checks
on recurrent costs, no mechanisms to force trade-offs among programs within departments, and
little medium-term perspective. The budget is a single document presented to the state assembly,
but the process is essentially dualistic. Budget preparation typically involves incremental
increases for existing programs and the addition of new programs. New programs on current
account may be classified as Plan. Plan expenditures, including wages, will then qualify for
partial Central funding for five years from inception once they have been sanctioned by the
Planning Commission as part of the National Plan. All budgets are divided into "Plan" and "Non-
Plan" components, as required by central guidelines. "Plan" spending consists of new projects
plus their running costs until the plan period is over, and running costs are then transferred to the
Non-Plan account of the budget for funding against states own revenue resources and devolved
shared taxes.
The link between policy, planning and budgeting has been weak at the state level, partly
because of dependence on the Center for policy initiatives. Aggregate financial discipline of the
budget process is weak and hard expenditure targets are almost nonexistent as evidenced by the
tradition of having up to three supplementary budgets. Supplementary budgets undermine the
usefulness of initial budget targets (Premchand 1999). There is little managerial autonomy and
no reward for improved cost effectiveness.
An inadequate expenditure management framework embodied in structure of the Indian
planning process creates perverse budgeting incentives for the states. The budgeting process does
not evaluate the incremental recurrent costs of Plan projects, nor does it encourage departments to
make trade-offs between alternative current and capital use of funds. The status quo approach
leads to delayed implementation, cost overruns and low social rates of return on public
investment.
7 This section draws on Stevens (1999)

21
Reverse Spillover in Sub-national Government Wage Determination
India maintains a tradition of establishing pay commissions every ten years to advise the
Central Government on the determination of public service compensation. The recommendations
of such commissions are applicable only to the employees of the Central Government.
Nevertheless, their recommendation have a major influence, via the demonstration effect, on
subsequent pay awards by state governments and state public enterprises. The Fifth Pay
Commission (FPC), which reported in 1997, recommended an upward adjustment of about 30
percent in the average rate of Central government compensation and a 30 percent reduction in
employment levels over 10 years. But the Government of India, secure in the knowledge that its
own wage bill did not bulk very large in overall general government expenditure commitments,
chose to enhance the award of the Pay Commission by providing a pay award of approximately
35 percent and to ignore the recommendations on rightsizing. By contrast, state governments in
India have much more employment intensive public commitments (such as education, health
services and public works) than does the Center. The wage bill of state governments are typically
much larger in relation to their GSDPs, in the range of 5 to 8 percent, so that an increase of 35
percent would amount to an incremental expenditure commitment of 1.8-2.8 percentage points of
GSDP.
Institutions of the Soft Budget Constraint
Small Saving Accounts On-lending
The small savings mechanism, which related to the automatic onlending of 80 percent of net
deposits in Centrally-controlled postal saving accounts to the state where the deposits are made, is
an important avenue of partial escape from hard budget constraints. When net deposits exceed
budgeted targets, state deficit slippages occur, aided by supplementary budgeting. Such an escape
is not in the long-term best interests of states, particularly the ones experiencing the most fiscal

22
stress. The relative access to these funds among states is not tied to creditworthiness, relative
economic growth performance, or any indicator of fiscal performance. The quantum of this
source of financing has exceeded budgeted predictions in the late 1990s. The high transaction costs
of assembling these funds leads the Union government to charge a relatively high interest rate (14
percent in 1998-99) on funds on-lent to the state where the savings are derived. This high cost
financing, is often supported by state savings incentives to depositors. It has grown recently to be
equivalent to 1.6 percent of GDP (1999-2000), far outstripping the financing contribution of
market loans at 0.6 percent of GDP.8 In 1998-99 small savings and provident fund accruals have
unexpectedly increased and the receipts net of repayments exceeded Rs 330. billion as compared
to the initially projected level of Rs 216. billion. The relative success of the poorer states, such as
Bihar and West Bengal, in mobilizing small saving account deposits within their jurisdiction has
softened their budget constraints while burdening them with high cost debt (Venkitaramanan
1999). This outcome is explained in part by the lack of other convenient outlets for savings in the
poorer states, such as Bihar, and the use of state-sponsored incentive schemes, such as lotteries and
emoluments for small savings promoters, by other states such a Punjab and West Bengal.
State Guarantees and other Contingent Liabilities
The issue of the contingent liabilities of states has assumed heightened importance since
1994/95, when borrowings by state-owned public enterprises were removed from coverage under
the ceiling established for states’ market and SLR borrowings. Prior to 1994-95, state enterprises
were given separate borrowing allocations each year as part of state-specific global ceilings for
SLR and market borrowings. Their SLR qualification status permitted state-controlled
enterprises to mobilize funds at relatively low rates of interest. At the same time, the allocation
of a specific limit on the amount that could be raised meant there was some control on the extent
to which state governments could issue guarantees. Subsequently, guarantees have become a
8 Reserve Bank of India, (1999) Bulletin, Appendix III, S222.

23
convenient means for states to circumvent the ceiling on the quantum of their market borrowings.
Each state is now free to permit its state public enterprises to borrow as much as they can in the
domestic market. The rising deficits on revenue account have pre-empted financial resources
from investment projects. Therefore the growing need for infrastructure and public investment
inspired state governments to issue guarantees to mobilise resources through bond issues and
discouraged lenders and credit rating agencies from assessing project-specific risks. Some states
have uses bonds financed through "special purposed vehicle" or corporations with little or no credit
records but with borrowing guarantees from state governments to rise debt financing for direct
budgetary support.
The outstanding guarantees increased from 3 percent of GDP in 1992 to Rs. 796. billion or
5.0% of GDP by September 1998. The growth in guarantees particularly since 1995 have been
significant, the annual growth rate between March 1995 and September 1998 was 13.1 percent
whereas the growth in debt during the same period was 7.5 percent. The value of these
contingent liabilities may rise quickly if state governments respond to the demand for increased
infrastructure investment by encouraging more “Build–Own-Transfers” which often requires
guarantees to the private sector, and off-budget financing by state infrastructure agencies, without
making adequate policy provision for project–specific cost recovery.
The other significant issue associated with state guarantees is the rationale of extending
guarantees by the states for the borrowings of its public enterprises, especially State Electricity
Boards (SEBs) which are incurring large losses. Attracting private sector investment for power
generation projects in the absence of tariff reform has requires granting of rate of return guarantees
by many states with counter-guarantees extended by the Government of India. In the case of
foreign investors the guarantees implicitly involve the assumption of foreign exchange risk. Past
guarantee issuance for SEBs and other PEs has become an obstacle to reform because when a
state-owned SEB is privatized, the state government has to bear the up-front cost of reforms. If
the SEB has raised a large amount of loans guaranteed by the state government, the cost of

24
unwinding these commitments as part of privatization is formidable. There is a lot of variation
across states in issuing these liabilities. As a percentage of GSDP they range from 4% in Utar
Pradesh to 14.4% in Punjab.
There are also many other potential implicit contingent liabilities falling on the states such
as under-funded pension and provident fund obligations, arrears of state enterprises, and cleanup
cost of the liabilities of public enterprises to be privatized.
III. Potential Control Mechanisms
Attempts to maintain fiscal discipline in the Indian federation have relied heavily on
hierarchical oversight and control, but this mechanism has not been utilized effectively since the
liberalization of economic life began in 1991. This section reviews those attempts, and then
discusses the problems and prospects of discipline based on capital markets, political accountability,
and land markets.
0.0
10.0
20.0
30.0
40.0
50.0
60.0
% G
SD
P
And
hra
Pra
desh
Bih
ar
Guj
arat
Har
yana
Kar
nata
ka
Ker
ala
Mad
hya
Pra
desh
Mah
aras
htra
Oris
sa
Pun
jab
Raj
asth
an
Tam
il N
adu
Utta
r P
rade
sh
Wes
t Ben
gal
Figure 4: Outstanding Debt and Guarantees of the 14 Major States in India (1997/98)
Guarantees
Debt

25
Hierarchical Controls and Intergovernmental Fiscal Rules
Coalitions government at the Center in the mid 1990s often gave the impression that they
intended to acquiesce or ignore states’ efforts to maneuver past the hard budget constraints being
guarded over by officials of the Planning Commission, the Finance Ministry and the Central
Bank. Although subsequent policies articulated in end of the decade, such as the intention to
recover any funds lost through counter-guarantees called against the states, the Center’s weak
signaling of it commitment to hard constraint may have encouraged financially imprudent and
inter-temporally inconsistent policies by some states.
Under Article 293 (3) of the Indian Constitution, any borrowing by state governments
requires prior concurrence of the Centre whenever there are any loans outstanding from the latter.
Because all states are in debt to the Center the unrestricted power to borrow is effectively blocked.
The states are also prohibited from borrowing abroad with the exception of loans from multilateral
investment banks intermediated by the Central Government. According to Rao (1999), “in actual
practice, the Planning Commission in consultation with the Union Finance Minister and the Reserve
Bank of India (RBI), simply determines the total quantum of states’ borrowing and allocates each
state’s share.” In this way, borrowing from non-central creditors is intended to be effectively
controlled by the Center. But at least two channels exist to enable the states to break through the
protective defenses of the hard budget constraint. These channe ls are uncontrolled increases in
small saving borrowings due to greater than expected net deposits and taking borrowing "off
budget" with state guarantees for borrowing by state controlled special purpose vehicles.
States have managed to finance large components of their own and their municipalities'
capital budgeting needed for such projects as major irrigation systems, power projects, and roads
via off-budget borrowing with guarantees.
The strain placed on state finances by mounting state debt, populist subsidies, and rising
wage bills generate intense bargaining by the states to secure more resources from the center and
central initiative to foster economic adjustments by the states. The officially sanctioned forums

26
for such bargaining are the annual bilateral discussions between a state and either the Panning
Commission or the Finance Ministry of India. Failure to achieve the desired accommodation has
often resulted in bargaining by press release with the states appealing directly to their
constituenc ies for support in the ongoing dialogue. State leaders make direct appeals to their
political allies in the Central Government for more financial resources. In response, Central
political leaders, mindful of the Center’s own mounting debt and the strong tradition of rule -
based formulas for resources sharing, have been cautious about requests for more financial
resources or in using hierarchical controls to impose adjustment on the states. The Center is
encouraging voluntary state adjustment and consensus building for joint actions likely to improve
state finances such as adoption of value added taxes by the states and self-imposed limits on the
level of guarantees.
Capital Markets
The absence of any correlation between state creditworthiness and risk premia on interest
rates borne by sub-national governments in India has prevented the emergence of a market-based
fiscal discipline regime for states.9 Currently, any state which successfully executes a fiscal
correction will not receive an immediate reward from the financial community and, based on past
experience, it might even expect to incur penalties in the form of diminished resource transfers
from the Center. But substantial additional liberalization of the Indian debt market for state
government securities will be required before it can be looked to in performing an effective fiscal
surveillance and policing role. A byproduct of efficient market debt intermediation, where it can
be created, will be a more effective screening out of projects with low internal rates of return, in
the case of special purpose debt, and timely market signaling of fiscal loosening, in the case of
general obligation debt.
9 Market based fiscal disciple is the proposition that yields on government bonds are tightly correlated with indicators of insolvency risk and that increasing yield spreads discipline subnational government by encouraging them to undertake fiscal corrections.

27
States do obtain credit ratings for the public enterprise bonds which they guarantee in
support of major irrigation or power projects. Two important local credit rating agencies, CRISIL
and ICRA have taken note of the deteriorating finances of a number of states by marginally
reducing credit rating. For example, Maharashtra’s rating was reduced by one grade in light of its
mounting debt and increasing wage bill obligations early in 1999. In January 2000, CRISIL, the
largest credit rating agency, issued a general credit warning which warned that that, “ratings for
state-government backed instruments are likely to come under pressure due to worsening
financial conditions and lack of any effort to improve fiscal situation in the states.”10 The agency
foresees a systemic deterioration in the credit profile of the states that may lead to revision of
their ratings in the absence of comprehensive fiscal and structural reforms.
But the some market signals under current immature conditions are often confusing to the
states. In 1999 the Reserve Bank of India began to encourage states to auction their debt issues
directly to the market with an initial limit set at 35 percent of market borrowings. In 1999
Punjab, a state experiencing sharply deteriorating finances due to aggressive pursuit of populist
policies, has utilized this new borrowing route to auction a small issues of Rs. 600 million. This
issue was fully subscribed and the average yield on the issue was 12.39% versus 12.5% for the
current yield on SLR placements. Hence a state with a sharply deteriorating fiscal performance
achieved a lower than average return, which suggests that purchasers of debt issues are
uninformed of the financial position of states or expect a central bailout.
The secondary debt market in India remains under-developed, particularly the short term
money market, and state debt issues are not rediscounted or re-priced to reflect fiscal performance
and implicit risk of default. Risk management systems are weak in the secondary market as a
whole. Fine pricing of assets is difficult and credit ratings are crude. Banking and insurance
remain nationalized industries. Although the government appears to be serious about lowering its
stake in banks to below 51%, its effective control on the bank's functioning might actually
10 Business Standard, (2000) “Crisil sees state governments finances going further downhill” January 7.

28
continue. Public sector bankers have little incentive to conduct comprehensive risk assessments
of loan proposals particularly when they are made to sub-national government agencies with an
implicit government guarantee. This retarded area of reform in combination with large general
government fiscal deficits has kept interest rates high and discouraged the development of mature
secondary markets in government debt, which might encourage market-based fiscal discipline.
Creditworthiness has not been the chief criterion for lending to municipalities or urban
development authorities. Municipal agencies that have not met their obligations to apex national
development banks often hope to use political channels and processes to mitigate the negative
consequences of weak fiscal performance and avert default. When municipal borrowing is
undertaken by development authorities with limited local oversight or from creditors such as
nationalized infrastructure development banks, accountability and debt servicing commitments
are difficult to maintain. Under these conditions, public servants are lending in effect to other
public servants. The market agents needed to achieve market-based fiscal discipline-- creditors
seeking a high risk-adjusted rate of return, borrowers seeking the best loan terms, and accountable
local executive agencies-- are nowhere to be found. .
The Political Mechanism: Democratic Institutions and Fiscal Discipline
Indian state governments, like their national counterparts, are democratically elected on the
basis of first-past-the-post competitions or the plurality rule. Elections are constitutionally
required every five years. Until very recently those state governments, which were unable to
maintain the confidence of the state legislatures, were often dismissed by centrally –appointed
Mumbai.

29
state governor on the advice of the central cabinet. Such dismissals under Article 356 of
the Constitution, have usually been followed by a period of administrative rule by the governor
known as “President’s Rule.” Elected governments have also been superceded by President’s
Rule for failure to maintain a constitutionally-required standard of law and order. In the period
1967 to 1991, President’s Rule was invoked 78 time and has affected almost all states. However,
the incidence of state government dismissals appears to have decreased recently under the
influence of a 1995 Supreme Court ruling requiring the Central authorities to provide the
President and the public with a detailed set of reasons for such action. 11
Party discipline is maintained by tight state party control over constituency nominations.
The mediating role of state legislators in solving the problems of and delivering benefits to their
constituencies varies greatly from state to state. State level cabinets are more involved in
economic decisions than at the national level, particularly under coalition governments
India was characterized by one party domination at both the Center and state levels from
independence until the 1970s. As long as the Congress party held office at the Center and in most
of the states, differences over policy, including economic management, could be mediated
informally within the dominant party (Hardgrave & Kochanek 1993). With the loss of one-party
hegemony, center-state policy disputes are increasingly bargained in public forums including the
Conference of Chief Ministers, the National development Council and of course, the mass media.
The 1990s have been a period of coalition or minority government at the Center.
Consensus politics has inhibited New Delhi from playing a strong leadership role in bringing
about structural reforms at the state level. During the 1990s the Center has little headway in
implementing micro-economic structural reforms in collaboration with the states to augment the
gains achieved from its unilateral macroeconomic reforms.
11 Some commentators notably Lijphart (1999) allege that, “in practice President’s Rule was been used mainly by the central government to remove state governments controlled by other parties and to call new state elections in the hope of winning these.” (Lijpart P 190)

30
The period from 1970 to the present has witnessed the growth of regional parties at the
state level and the fragmentation of parties of both the left and right, leading to coalition politics
as the norm at the state level by the early 1980s. Political coalitions are not stable at the state
level in many states. The combination of coalition governments losing their majority before the
completion of their five year constitutional term and the possibility that state governments would
be dismissed by the Central Government, has fostered short term time horizon among elected
governments. In the 1980s and 1990s there has been a strong anti-incumbency trend and a lack of
likelihood that chief ministers will succeed themselves or return to office after an election defeat.
The relatively short mandates have led political leadership to have short-term time
horizons when in office. Rather than competing for the support of the median voter, state
politicians often strive to solidify the support of their main support group State level political
leaders endeavor to maintain a stable core voting block defined in sectarian, caste or occupational
terms. . When they attain office these political leaders have rewarded their supporters with public
sector jobs and highly subsidized, lower-priced services including electric power and university
fees once they attain office. Leaders who lose power, but maintain such a core constituency, have
a reasonable probability of return to office in some future coalition.
Dutta (1997), in an important empirical study of political instability and coalition
government at the state level, examined fiscal polices pursed by majority and coalition
governments in 15 major stated for a 25 year period. Using an econometric model and pooled
data from many states and periods, he finds that unstable coalition state governments have a
significantly higher proportion of current account (non-capital) expenditures relative to state
domestic product and a significantly lower proportion of current account surplus to state domestic
product than other state governments. Hence, the statistical evidence for the period he reviews
indicates some evidence that unstable coalition governments are guilty of a greater level of fiscal
indiscipline. He argues in the Indian context that, “if political power alternates rapidly and

31
randomly between competing political parties or groups of parties then each government will
follow myopic policies since its assigns a low probability” to being reelected.
The late S. Guhan, a former state Finance Secretary, has eloquently drawn out the
implication of short tenures for state governments.
The implications for governance of this degree of instability are serious. State governments, or their Chief Minister , with a time - horizon of two to three years cannot be expected to have deep commitment to long-term development or even an involvement in medium-term issues during their uneasy and limited tenure, they will be forced to politicize and interfere with the administration in order to survive; and tempted to make hay while the sun shines (Guhan 1995).
Most state governments have pursued populist social policies, particularly with respect to
the provision of power and irrigation services to farmers. Throughout the 1970s and 1980s, the
states expanded investments in physical infrastructure (power, roads, irrigation, ports, roads), and
provision of social services, without establishing mechanisms for cost recovery and for
maintaining these assets in the long run. Prices charged for power, water, irrigation and other
services declined to levels equivalent to a small fraction of production costs and are at the origin
of extremely large implicit and explicit subsidies which are estimated at 7 percent of GDP for
“non-merit” goods.
The success of the development strategy pursued by the Center from 1960 to
approximately 1986 in propagating the spread of green revolution agricultural technology built a
large constituency of stakeholders among farmers for increased rural electrification coverage and
expansion of irrigation with little or no cost recovery. The irrigation potential nearly tripled from
the beginning of the First Plan to end of the Seventh Plan (Vaidyanathan 1994: 18-74). In their
efforts to encourage the spread of the green revolution and agricultural productivity increases,
most states heavily subsidized inputs used by farmers including surface irrigation and electricity
to power tubewells. Indeed, some states, such as Tamil Nadu and Punjab, give free electricity to
farmers. These policies appeared sustainable during the 1960s and 1970s, when rural
electrification covered less than half of villages and farm use of electricity to power tubewell

32
irrigation was not the norm. But as shown in Figure 5 by 1995 fully 89 % of all villages in India
were electrified versus only 33 % in 1970. Increased usage of electricity by farmers, coupled
with low agricultural power tariffs and widespread power theft created financial stress for state
electricity boards (SEBs).
Figure 5
The nexus among nationally administered prices, subsidization of agricultural inputs
and softening budget constrains makes it difficult to unravel parts of the state system of
subsidization with piecemeal reforms. One subsidized group will resist reform unless others
forfeit their subsidies as well. For example, farmers employing tubewell technology with highly
subsidized power oppose higher tariff rates on the grounds of horizontal equity. They point to the
relative ly more generous subsidization of farmers receiving surface irrigation. There is a
complex interconnection among low administrative pricing policies at the central level with
implicit taxation of agricultural commodities, high rates of subsidization for farmers at the state
level, and concessional financing to the states by the Center. Over time, a soft budget loop has
grown up connecting the state finances, the household economies of farms and the Central
Government. Unraveling such a system, through agricultural pricing and input subsidization rate
Percentage of Electrified Villages
10
20
30
40
50
60
70
80
90
100
1970 1973 1976 1979 1982 1985 1988 1991 1994
%
All India
Bihar
AndhraPradesh

33
reform, would create major differential looses among stakeholder unless there were very close co-
ordination within a state across departments and even between Center and state policies.
Land Markets and The Capitalization Impacts of State Fiscal Strategies
State governments have tried to contribute to farmer prosperity and indirectly to higher
land rents and property values with their support for under-priced irrigation and power services.
States, which have the constitutional power to tax both agricultural land and agricultural income,
have been disinclined to do so and prefer to let the revenue yields of land taxes dwindle away. To
generate their own revenue, the states have relied primarily on indirect tax system such as stamp
duties, market fees, and interstate sales tax. Many of these taxes are regressive and they are often
capricious in their incidence. Most state taxes fall on consumption or occasionally back on
farmers through hidden taxes, such as on market fees, associated with the marketing of
agricultural produce. Market fees are likely to be shifted backwards to farmers but to fall
disproportionately on smaller farmers in remote areas. Such groups may suffer capitalization
impacts on the value of their land but they are unlikely to be politically powerful. Because of
this approach to revenue generation, rural property owners do not expect that higher state
government spending will lead to higher direct taxes on land or associated capitalization impacts
on the price of land. But extreme under-pricing has led to a lack of conservation and effective
use on the demand side and rationing, particularly for power, on the supply side.
From independence until the century’s close the Government of India has retained in force
colonial wartime legislation on rent controls. During the 1980s judicial decisions have linked
property tax liabilities in all urban areas to the fair rents authorized under rent controls
irrespective of whether a property is rented or used by the owned. The rent controls per se have
led to low levels of building maintenance, while the link between controlled rents and property
valuation has undermined the abilities of local governments to raise revenue from property
taxation. Hence property owners do not perceive an automatic link between mounting municipal

34
or state debt and future tax liabilities which will be borne by land. Accordingly local land markets
are unlikely to discipline local borrowing in the near to medium term.
The relative efficiency of state fiscal systems in providing adequate public infrastructure
relative to tax burdens may be a potent force in influencing interstate investment decisions and
provide an increasing influential check on fiscal laxity. Competition for investment is likely to
become increasingly important in India and to encourage better fiscal management over the medium
term. This process, which can be interpreted as interstate capital migration induced by state fiscal
performance or a capital Tiebout effect, does hold out the prospect of improving the fiscal
performance and public service delivery in those states which are active participants in the
competition to attract substantial domestic and foreign private investment. But it may no be an
effective incentives for states at the tail end of the fiscal benefit rank order.
Why The Problem is Persistent, What Should be Done
Past indifference by the Center to the size of small saving borrowing, the growth of
contingent liabilities, and issues of debt sustainability has weakened the regime of subnational
macroeconomic control for general government finances. As has been shown above, in the
narrow rule-based sense, the central government attempts to impose hard budget constraints on
the states in the form of restrictions on access to market credit for deficit financing. However, a
lack of market-based fiscal discipline implies that there are no price (example; interest rate risk
premia) or quantity (example: credit rationing) signals to deter states that borrow too much
relative to their growth prospects and debt servicing capacities. A corollary is that there are no
obvious rewards for prudent fiscal management. Individual state borrowing ceilings have not
been determined with reference to state-specific debt sustainability analysis, such that borrowing
ceilings have done little to stop the growth of state debt to state domestic product ratios.
In the absence of improved efforts at raising own tax revenues, most state governments are
likely to continue their dependence on high cost small savings to fund their increasing deficits.
Future policy towards small savings will be a very important element in the evolution of States'

35
fiscal deficits. The GOI has begun to adjust interest rate paid to depositors on small savings
account more frequently in light of rates in other markets. The GOI has also increased the spread
between the deposit interest rate and the on-lending rate by 1/2 a percent point in recognition of
the high administrative costs borne by the GOI in managing these deposits. Moreover, some
signs have recently appeared indicating that national policy makers want to initiate more
substantive reform of the system of fiscal federalism. For example, the terms of reference of the
Eleventh Finance Commission explicitly enjoins it to, “review the state of the Finances of the
Union and the States and suggest ways and means to… restore budgetary balance and maintain
macroeconomic stability” (Srivastava and Sen, 1999), whereas previous finance commissions
were discouraged from examining transfers other than their own. The official Ninth Plan (1999)
has acknowledged many of the structural weaknesses of the current fiscal federal system. Under
the theme of co-operative federalism, it proposes to move with the states to a more flexible
approach to transfer design and the co-ordination of development strategies. It acknowledges
that, “fixation of unrealistic Plan size which does not materialize, has affected the credibility of
the whole planning exercise” and it proposes to remove the bias on favor of large plans by de-
linking the size of the plan from the level of Central assistance to the States.
Measures which would discourage fiscal indiscipline by the states include: rejection of the
gap-filling methodology by finance commissions, basing future tax share devolutions on
differences in fiscal capacity to be measured in ways that are invariant to actual tax collections,
and adoption of a no bailout commitment by the Central Government, or at least a commitment
that any partial bailout is contingent upon significant adjustment by the benefiting state.
Reforming the small savings system might be accomplished by breaking the automatic link between
where the funds are deposited and where they are lent and perhaps introducing state-level fiscal
performance criteria into future allocation decisions.
The Center has also responded to accumulating arrears of state public enterprises with
defensive measures designed to harden budget constraints. Since 1997 outstanding arrears of
State Electricity Boards to Coal India and the centrally-owned power grid corporations have been

36
deducted against the normal central assistance from the Planning Commission, up to a maximum
of 15 percent of such assistance for each state. An Indian committee on state guarantee
consisting of state representatives and central bank advisors has recently suggested ceilings on the
use of guarantees by states. The committee's report has suggested linking guarantees to the size
of state economies, their revenues, or the consolidated fund itself, and that the ratio of
incremental guarantees to incremental debt should be kept constant or reduced. Gujarat and
Andhra Pradesh have established ceiling for the amount of limits for contingent liabilities. .
New institutional frameworks are also needed for state budget design, expenditure
management, and state debt management. One urgent priority for the states and perhaps the
Central government is to adopt a much more comprehensive approach to debt management which
would embrace the macroeconomic implications of aggregate state debt and deficits,
determination of debt ceilings, and the assessment of appropriate limits on contingent debt
liabilities associated with the debt of PE and guaranteed for private participation in infrastructure
financing.
Mature credit markets and a more transparent political oversight process would improve
subnational fiscal policy policing and better differentiate performance differences among the
states. Indeed the strong constitutional hierarchical mechanisms may discourage the other
correction mechanisms such as strong electoral or credit market oversight, from operating. The
adoption of the Musgrave's notion of pure federalism with greater sole accountability would
likely strengthen the land market capitalization and electoral impacts. Another alternative to sole
accountability is the cooperative or negotiated approach to debt control practiced in Australia.
Under this approach, the subnational governments are actively involved in formulating
macroeconomic objectives, agreeing on global deficit targets for general government, and then
determining the financial requirements of individual states. But the much larger number of
Indian than Australian states and the absence in India of a long-standing tradition of forging wide
national consensus for fiscal corrections suggests that it would be difficult to successfully graft
the Australian approach on to the Indian federal polity.

37
Recent Developments
Indian fiscal federal arrangements appear to be at the crossroads. The theoretical literature
on design of incentives related to intergovernmental transfers as summarized by Bird (1995)
indicates that there are essentially only two broad frameworks: (i) a bargaining situation between
principals, in this case a bilateral process, or (ii) a principal agent framework where a dominant
Central government establishes, either unilaterally or after consultation, a uniform framework for
transfer design. Indian federalism might be entering a new era characterized by bilateral
bargaining between the Center and individual states intended to achieve state fiscal adjustment
with renewed growth. The bilateral approach has the potential to take Center/state relation in a
far different direction from the multilateral or symmetrical approach to negotiating new Center-
state agreements envisaged by the advocates of co-operative federalism. Alternatively, a general
dissatisfaction with the status quo may be the prelude to a more far reaching review and overhaul
of the entire system with a concentration on reform of Planning Commission transfer incentives
to improve both fiscal performance and foster a more balanced national growth. During 1999 and 2000 central policy makers, appreciative of the need to provide clearer
and tangible reward signals for states that embarked on fiscal reforms as a counterweights to the
existing disincentives, set out to craft stronger mechanisms of fiscal correction for those states
experiencing the greatest fiscal stress. The Center's initial response was to offer Memorandums
of Understanding (MOUs) negotiated between the Center and individual target states, under
which a state agreed to implement a customized programs of fiscal adjustment measures in return
for medium term loans and cash advances of future pledged funding. This approach clearly fell
within the bilateral bargain framework. The first round of MOUs with the fiscally-stressed states
had of necessity an ad hoc quality and lacked transparency. Its impact on fiscal performance
have yet to be assessed. The terms and conditions of the loans and cash advances were not
publicized. Many commentators on this first round process have stressed that in order to have
real legitimacy conditionality-based support by the Center for the adjustment reforms of
38
individual states should be transparent with state residents and financial markets being able to
learn about the term. Individual states have objected that bilateral bargaining enhances the
position of those states with the most bargain power vis a vis the Center. There is also a danger
that by utilizing the instrument of new loan funds to generate incentives for adjustment the Center
has only provided resources that are nonrecurring and can be used to postpone adjustment.
In a separate initiative, the Government of India wrote to the sitting Eleventh Finance
Commission near the end of its term, requiring it to "evolve a monitorable fiscal reform
programme to accompany [its] grants-in-aid." Therefore the Supplementary Report of the
Eleventh Finance Commission is intended to be the legitimizing instrument for a new round of
bargained conditionalities within a more transparent principal agent framework, with the release
of otherwise devolved grants against achievement of fiscal consolidation targets or the adoption
of measures of adjustment. The MOU process linked to broad conditionalities or a similar
approach might also be established to determine the way in which discretionary funds are
allocated by the Planning Commission.12
IV. Conclusion
A quasi federal constitution does provide India with hierarchical control to foster the
maintenance of hard budget constrains, but many other aspects of the fiscal federal system, as it
operated during the 1990s, have encouraged states to explore soft budget tactics. The traditional
mechanisms for curbing excessive debt accumulation such as capital market risk premia, electoral
disapproval, capital Tiebout effects, and capitalization of debt and future tax burdens on
privately-held asset prices, have not provided significant impetus to fiscal correction. However,
India's system of inter-governmental transfers has remained basically sound and it continues to
provides a relatively transparent, predictable and rule-based framework. By subjecting state
12 "The Centre should attach conditionalities on the development funds that it gives to the states, [according to] Planning Commission member, Montek Singh Ahluwalia. " [H]e said that the central aid to

39
borrowings to central government approval and precluding states' access to financing either from
external markets or from their own banks (of which there are none), India's fiscal federal
arrangements have succeeded in imposing a relatively hard budget constraint. India has been
spared from the moral hazards and macroeconomic crises witnessed in several federated states of
Latin America. While many states have seen rising debt to state GDP ratios, the overall ratio of
total state debt to national GDP has been relatively stable at around 20% for the last decade. And
the fiscal deterioration at the state level has been reflected primarily in worsening composition of
expenditure: with salaries, subsidies and interest payments crowding out non-wage O&M and
capital spending.
Nevertheless, the Indian case demonstrates that the hierarchical mechanism is often
awkward and fraught with difficulties. The stylized facts of this case study include high levels of
vertical fiscal imbalance and a variety of inadequate marginal incentives, leading to moral hazard
challenges and the expectations by some states during the 1990s that they might manage to shift
much of the onus of adjustment to the Center. For the most part, these expectations have not been
validated by the Center. Over the short run, states have sought ways around hierarchical
oversight even when hard budget constraints have not been breached inter-temporally.
Hierarchical control have fended off the worst forms of opportunism, but they have not been
obvious enough or omnipresent enough to induce prudent budget making by states. Political
fragmentation, coalition governments at the Center and governments of short duration at the state
level have made coordinating politics between the Center and the states difficult and reduced the
Center’s effective will to curtail populist policies by the states. This has led to difficulties, but
hierarchical controls, even if enforced in a cautious or half-hearted manner, have prevented
unfettered state access to credit. The domestic capital market has failed to send strong signals or
to act as on an early warning system, both because most of the market consists of captive
the states for development purposes should go with conditionalities so that the reforms process gains momentum at the state-level" Financial Express, Nov 23,2000 .

40
financial institutions and because, during the period under review, the market may have believed
that there was an implicit guarantee.
The Indian case suggests that hierarchical institutions alone are not optimal mechanism for
policing sub-national finances. Past use of paternalistic forms of oversight, of which “Presidents
Rule” is the most extreme, has encouraged state governments to adopt short time horizons.
Paternalistic oversight strengthened lenders in the belief that should state fiscal problems appear
intractable, a paternalistic central government will step into the shoes of state governments and
provide adequate financial resources to resolve the problem.
Whether the way forward in India will be a new bilateralism or principal agent rule -setting,
with aspects of conditionality for highly indebted states, some features of the Australian
approach, such as a more timely dissemination of information on states’ finances perhaps
institutionalized with the support of state-level Fiscal Responsibility legislation and consultations
on macroeconomic outlooks, are worth exploring.
Liberalization of economic markets and decentralization have made India ripe for more
institutional reforms including those needed to strengthen hard budget constraints and make their
implication more tangibly visible to state politicians. Dissatisfaction with the status quo is
growing. But broad-based tax reform, financial markets liberalization and banking sector
liberalization have lagged far behind liberalization of the market for goods. Much additional
reform in these subjects will be required to foster creditworthiness and more mature markets for
state debt before the market will be able to send stronger signals to state cabinets. If institutional
and policy regime changes succeed in dispelling the notion that future budget constraints for
states and municipalities might soften, subnational government is likely to become both more
accountable and more effective in meeting society's public needs. Although debt obligations for
most states are manageable with reasonable programs, efforts to date at fiscal correction have not
been equal to the challenge.
41
References
Bhatia, H.L. (1994) Public Finance: Eighteenth Edition (New Delhi, Vikas) Bird, Richard (1999) "Threading the Fiscal Labyrinth : Some Issues in Fiscal Decentralization" in Tax Policy in The Real World" ed. Joel Slemrod (Cambridge University Press) Breton, Albert (1996). Competitive Government, (Cambridge, Cambridge University Press) Business Standard (2000) “Crisil sees state governments finances going further downhill” Report of January 7. Mumbai, Chelliah, Raja J (1999) "Issues Before the Eleventh Finance Commission". (Seminar on Issues Before the Eleventh Finance Commission, New Delhi) Datta , Abhijit (1999) “ Institutional Aspects of Urban Governance” in Om Mathur (ed.) India: the challenge of urban government, (NIPFP , New Delhi) Dutta , Bhashkar (1997) “Coalition Governments and Policy Distortions: The Indian Experience in Parthasarasthi Shome ed. Fiscal Policy , Public Policy and Governance, (New Delhi, Centax Publications) Dhawan, B. D (1997) "Latent Threats to Irrigated Agriculture" in Bhupat. M. Desai ed. Agricultural Development Paradigm for the Ninth Plan under New Economic Environment, (Oxford, New Delhi) Guhan, S. (1995) "Center and State in the Reform Process" in, India: The Future of Economic Reform , ed. Robert Cassen and Vijay Joshi (New Delhi, Oxford) Gurumurthi, S (1995) Fiscal Federalism in India , (New Delhi, Vikas Publishing House) . Hardgrave , Robert L., Jr. and Stanley A. Kochanek, (1993) India: Government & Politics in a Developing Nation, (Harcourt Brace Jovanovich, Fort Worth) Jha, Raghbendra (1999) "Some Notes on Principles of Central Transfer", (Seminar on Issues Before the Eleventh Finance Commission, New Delhi) Kurian, N. J. (1999) Need For Restructuring of Government Finances: Center and States, (Seminar on Issues Before the Eleventh Finance Commission, New Delhi) Lakdawala, D. K. (1987) Eighth Finance Commission’s Recommendation: Center State Budgetary Transfers, (New Delhi, Oxford University Press) Lijphart, A. (1999) Democracy ? (Yale University Press)

42
Mathur, Om Prakash (1999) India: The Challenge of Urban Governance, (New Delhi, National Institute of Public Finance and Policy) Musgrave (1957) The Theory of Public Finance (New York: Mcgraw Hill) Oates, Wallace A. (1994) "Federalism and Government Finance" in John M. Quigley and Eugene Smolensky (eds.) Modern Public Finance, (Cambridge, Mass, Harvard University Press) Planning Commission, (1999) Ninth Plan , Web http://www.nic.in/ninthplan/ Premchand, A. (1999) Issues Before the Eleventh Finance Commission (New Delhi, mimeo) Rakshit, Mihir (1988) "Uses and Abuses of Instruments for Resource Mobilization: The Indian Experience, in Robert E.B. Lucas and Gustav. F. Papanek (eds) The Indian Economy :Recent Development and Future Prospects. ( Bolder, Westview) Rao, M. Govinda (1998) "India: intergovernmental fiscal relations in a planned economy", in Richard M. Bird and Francois Vaillancourt (eds) Fiscal Decentralization in Developing Countries, (Cambridge, Cambridge University Press) Rao, M. Govinda (1999) " Role of Sub-national government in the Process of Fiscal Reform in India" in Ric Shand, (ed). Economic Liberalization in South Asia , (Macmillan India, New Delhi) Reserve Bank of India, (1999) Report of the Technical Committee on State Government Guarantees, (Mumbai, Reserve Bank of India) Shah, Anwar (1994) The Reform of Intergovernmental Fiscal Relations in Developing And Emerging Market Economies (Washington, World Bank,) Srinivasan, T. N. (1993) "Indian Economic Reform Background, Rationale and Next Steps". (New Haven, mimeo) Srivastava, D.K and Tapas K. Sen, (1999) Issues Before The Eleventh Finance Commission (Seminar on Issues before the Eleventh Finance Commission, New Delhi ) Stevens, Mike (1999) "Back to Office Report : India (Washington, mimeo) Vaidyanathan, A. (1994) "Performance of Indian Agriculture since Independence" Agrarian Questions, ed. Kaushik Basu (New Delhi, Oxford University Press ) Vaidyanathan, A. (1996) "Depletion of Groundwater :Some Issues" Ind. Jn. Of Agri. Econ, Vol. 51, Nos. 1 and 2 , Venkitaramanan, S. (1999) “ A Long Haul to Reform” The Hindu, February 15. Williamson, John and Molly Mahar (1998) "A Survey of Financial Liberalization" No. 211, Essays in International Finance (Department of Economics, Princeton University) World Bank (1996) India: Five Years of Stabilization and Reform and the Challenges Ahead, (Washington, World Bank) .

43
World Bank, (1997) India: Sustaining Rapid Economic Growth, (Washington, The World Bank)

44
Appendix:
Financing of All States Fiscal Deficit (Percent of GDP)
1990-91 1994-95 1995-96 1996-97 1997-98 1998-99 (RE) 1999-00 (BE)
Fiscal Deficit 3.2 2.6 2.5 2.7 2.9 4.2 4.0 Financing :
Loans from Center 1.7 1.3 1.1 1.2 1.5 1.8 1.9
Market term loans 0.5 0.4 0.5 0.5 0.5 0.6 0.5
Others (PFs, reserves and deposits) 1.0 0.9 0.9 1.0 0.8 1.8 1.6
Memo :
Revenue Deficit 0.8 0.6 0.6 1.1 1.0 2.2 2.2
GDP numbers are at the 1993-94 base. For 1998-99 GDP, revised estimates (July 1999) have been used RBI Annual Report (for 1997-99 figures, Appendix Table 4.5). Source : RBI Annual Report 1998/99, Supplement to RBI Bulletin on Finances of State Governments, CSO, World Bank Staff Estimates