Embed Size (px)
Citation preview
Transport, Storage, Communications and Information Technology
CHAPTER 7 |
Sheikh Zayed road in Dubai downtown.
Dubai_DED DubaiDED Dubai DEDDubai Economic Report 2018
117
Dubai Economic Report 2018dubaided.gov.ae
-
-
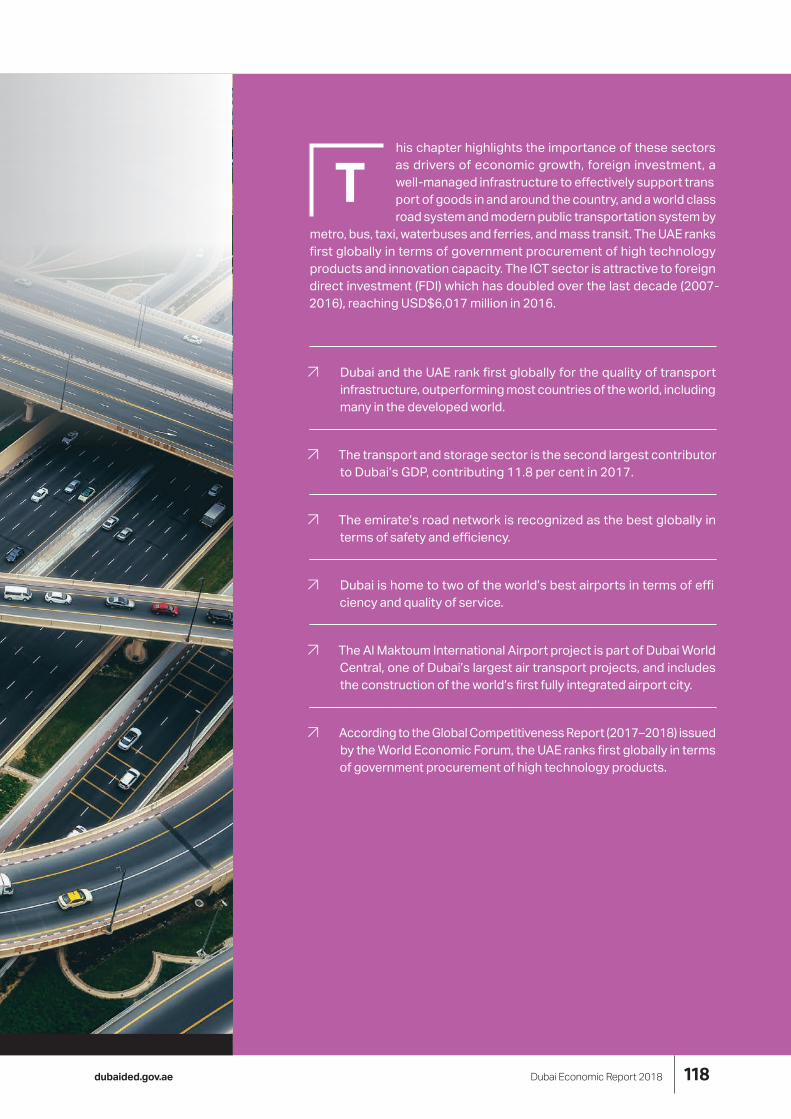
T his chapter highlights the importance of these sectors as drivers of economic growth, foreign investment, a well-managed infrastructure to effectively support trans port of goods in and around the country, and a world class road system and modern public transportation system by
metro, bus, taxi, waterbuses and ferries, and mass transit. The UAE ranks first globally in terms of government procurement of high technology products and innovation capacity. The ICT sector is attractive to foreign direct investment (FDI) which has doubled over the last decade (2007-2016), reaching USD$6,017 million in 2016.
↗ Dubai and the UAE rank first globally for the quality of transport infrastructure, outperforming most countries of the world, including many in the developed world.
↗ The transport and storage sector is the second largest contributor to Dubai’s GDP, contributing 11.8 per cent in 2017.
↗ The emirate’s road network is recognized as the best globally in terms of safety and efficiency.
↗ Dubai is home to two of the world’s best airports in terms of effi ciency and quality of service.
↗ The Al Maktoum International Airport project is part of Dubai World Central, one of Dubai’s largest air transport projects, and includes the construction of the world’s first fully integrated airport city.
↗ According to the Global Competitiveness Report (2017–2018) issued by the World Economic Forum, the UAE ranks first globally in terms of government procurement of high technology products.
118

Dubai_DED DubaiDED Dubai DEDDubai Economic Report 2018
CHAPTER 7 | Transport, Storage, Communications and Information Technology
Economic Growth Promoted byWorld Class Infrastructure
Dubai’s investment in transportation, storage, and ICT has created a fertile and profitable environment for foreign investment, international trade, and tourism.
1 World Class Transport and Storage Sector
The UAE has a world class transport and storage sector that is poised to only improve over time.
1st for road qualityin the world
According to the 4th for the highest qualityof port infrastructure World Economic Forum, in the world (1st in GCC) the UAE ranks:
3rd for the highest qualityof air transport infrastructurein the world (1st in GCC)
2 Foreign Direct Investment (FDI)
Total FDI in the transport and storage sector has almost doubled from 2007-2018 to US $5,214 million 3 Government Procurement Total FDI in ICT sector has doubled The UAE is #1 in government from 2007-2016 to procurement of high technology US $6,017 million products.
FDI for Transport FDI for ICT: & Storage: 1st GLOBALLY
in government US$6,017procurement of US$5,214 MILLION
MILLIONhigh technology products globally US$2,863 US$2,555
MILLION MILLION
2007 2016 2007 2016
119
Dubai Economic Report 2018dubaided.gov.ae
Transport, Storage, Communications and Information Technology | CHAPTER 7
Overview
The Transport and Storage sector in Dubai has a special importance beyond its position as one of the main economic sectors in the emirate in terms of its contribution to GDP. This stems from its interrelation-ships with other economic sectors, especially trade and tourism. The quality of the emirate’s transport infrastructure is a determinant of Dubai’s international competitiveness and of foreign investment inflows. The transport and logistics infrastructure is closely linked to both domestic trade and foreign trade. The ability of the country to offer its products and services with the required speed, efficiency and reliability is one of the fundamental determinants of its competitiveness in international trade. Throughout human history, the most developed and economically prosperous coun-tries are the ones which are easily accessible and well connected to their trading partners. In addition finan-cial activity in modern economies, particularly in the service industries, increasingly depends on the effi-ciency of the information and communications (ICT sector and its ability to deliver voice and digital data. This is bolstered by rising consumer demand for infor-mation and entertainment services as living standards rise. Although smaller than the transport sector Dubai is widely regarded as having one of the most competitive telecommunications industries in the MENA region.
Given the pivotal importance of the transport sector, the Government of Dubai is continuously developing plans and strategies to improve it, not only by making financial allocations to support investment in its expan-sion, but also by enhancing and improving the quality of various transport services. Dubai and the UAE rank first globally in terms of the quality of transport infra-structure, outperforming most countries of the world, including many of those in the developed world.
The Government of Dubai has also established appro-priate institutional, organizational and administrative frameworks given the importance of transport and communications in the economy. The responsibilities for managing and supervising the sector are distribut-ed between the Roads and Transport Authority (RTA) and the Dubai Civil Aviation Authority. While the former is responsible for the regulation and management of land, sea and rail (Dubai Metro) means of transport, the latter is responsible for managing and regulating air transport and shipping. The supervision of ICT service providers (Etisalat and du) is the responsibility of the Telecommunications Regulatory Authority.
Dubai and the UAE rank first globally for the quality of transport infrastructure,
outperforming most countries of the world, including many in the developed world.
120
Dubai_DED DubaiDED Dubai DEDDubai Economic Report 2018
CHAPTER 7 | Transport, Storage, Communications and Information Technology
Contribution of the Transport and Communication sectors to Dubai’s GDP
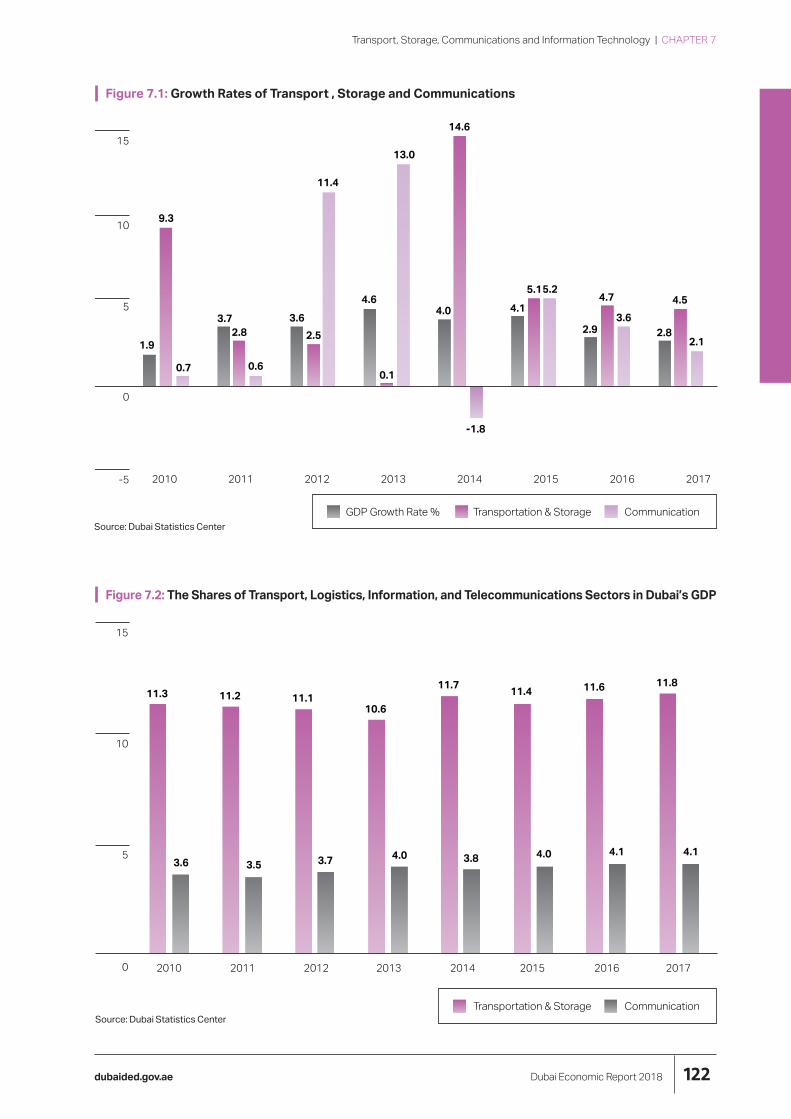
7.1 The transport and communications sectors grew at differing rates in 2017. While the output of the transport and storage sector
grew by 4.5 per cent in constant prices on the previous year, the ICT sector grew by about 2 per cent in the same year. (Figure 7.1)
This growth was reflected in changes in contribution of the two sectors to the total GDP of the emirate. The share of the transport and storage sector increased slightly from about 11.6 per cent of GDP in 2016 to 11.8 per cent in 2017, making it the second largest contributor to Dubai’s GDP. The contribution of the ICT sector was stable at about 4 per cent in both 2016 and 2017. (Figure 7.2)
121
0
Transport, Storage, Communications and Information Technology | CHAPTER 7
Figure 7.1: Growth Rates of Transport , Storage and Communications
14.6 15
13.0
11.4
9.310
5.15.2 4.6 4.54.7
5 4.14.03.7 3.6 3.6
2.92.8 2.82.5 2.11.9
0.7 0.6 0.1
Dubai Economic Report 2018dubaided.gov.ae
-1.8
-5 2010 2011 2012 2013 2014 2015 2016 2017
GDP Growth Rate % Transportation & Storage Communication Source: Dubai Statistics Center
Figure 7.2: The Shares of Transport, Logistics, Information, and Telecommunications Sectors in Dubai’s GDP
15
11.811.7 11.611.411.3 11.2 11.1 10.6
10
4.1 4.15 4.0 4.03.7 3.83.6 3.5
0 2010 2011 2012 2013 2014 2015 2016 2017
Transportation & Storage Communication Source: Dubai Statistics Center
122
CHAPTER 7 | Transport, Storage, Communications and Information Technology
The Transport and Storage sector
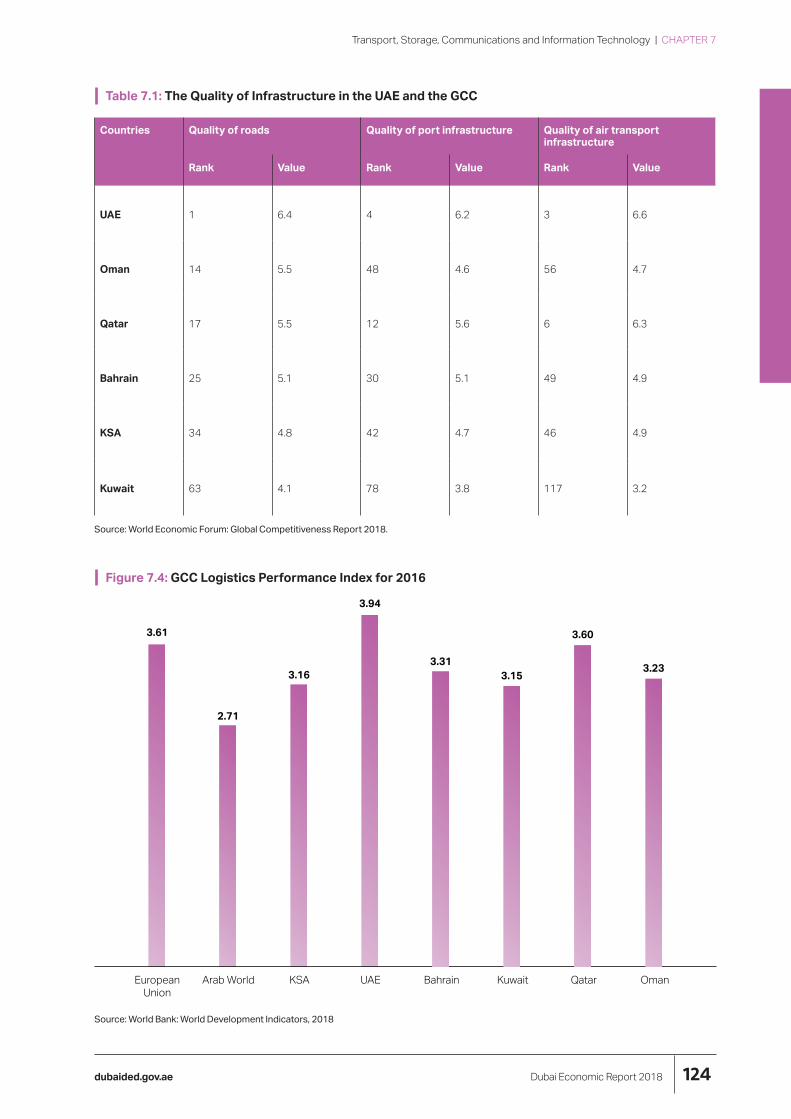
7.2 In light of the attention paid to infrastructure quality by the UAE in general and Dubai in particular, it is no surprise that the United
Arab Emirates topped some major infrastructure quality indicators, as shown in the World Economic Forum’s Global Competitiveness Report 20181.
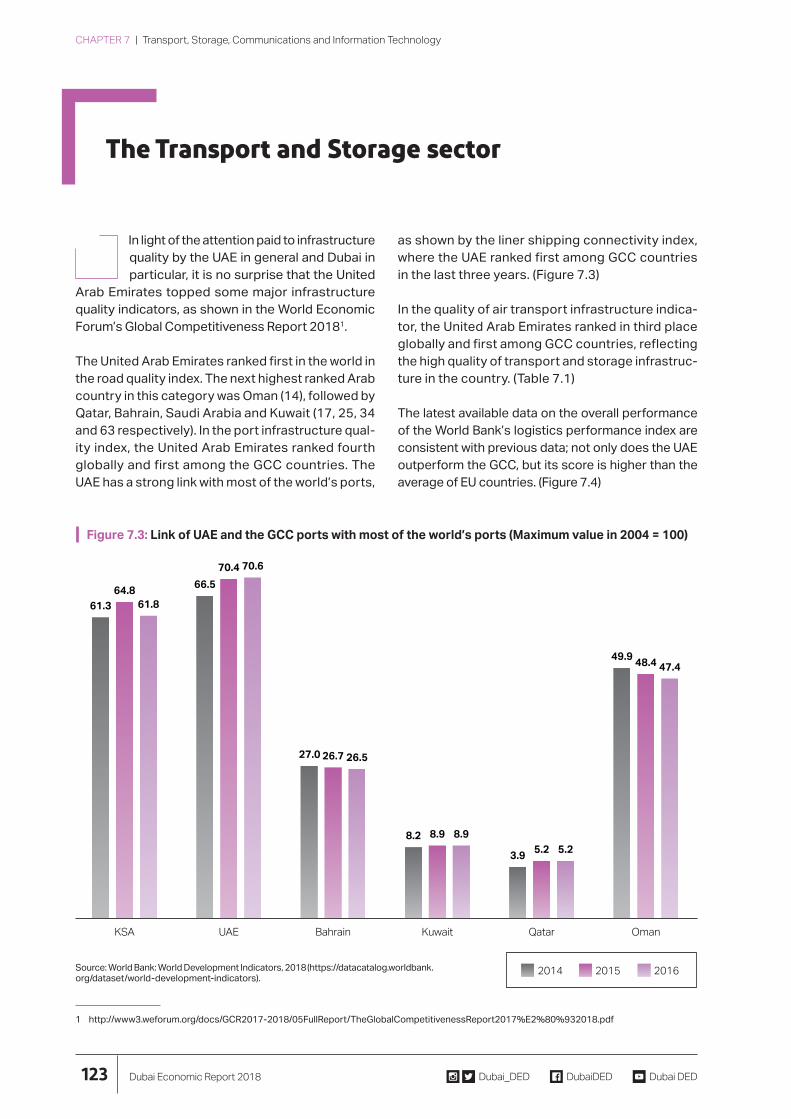
The United Arab Emirates ranked first in the world in the road quality index. The next highest ranked Arab country in this category was Oman (14), followed by Qatar, Bahrain, Saudi Arabia and Kuwait (17, 25, 34 and 63 respectively). In the port infrastructure qual-ity index, the United Arab Emirates ranked fourth globally and first among the GCC countries. The UAE has a strong link with most of the world’s ports,
as shown by the liner shipping connectivity index, where the UAE ranked first among GCC countries in the last three years. (Figure 7.3)
In the quality of air transport infrastructure indica-tor, the United Arab Emirates ranked in third place globally and first among GCC countries, reflecting the high quality of transport and storage infrastruc-ture in the country. (Table 7.1)
The latest available data on the overall performance of the World Bank’s logistics performance index are consistent with previous data; not only does the UAE outperform the GCC, but its score is higher than the average of EU countries. (Figure 7.4)
Figure 7.3: Link of UAE and the GCC ports with most of the world’s ports (Maximum value in 2004 = 100)
70.4 70.6 66.5
49.9
3.9
47.4
123
2014 2015 2016
KSA UAE Bahrain Kuwait Qatar Oman
8.2 8.9 8.9 5.2 5.2
26.5
48.4
27.0 26.7
org/dataset/world-development-indicators). Source: World Bank: World Development Indicators, 2018(https://datacatalog.worldbank.
1 http://www3.weforum.org/docs/GCR2017-2018/05FullReport/TheGlobalCompetitivenessReport2017%E2%80%932018.pdf
64.8 61.3 61.8
Dubai_DED DubaiDED Dubai DEDDubai Economic Report 2018
Transport, Storage, Communications and Information Technology | CHAPTER 7
Table 7.1: The Quality of Infrastructure in the UAE and the GCC
Countries Quality of roads Quality of port infrastructure Quality of air transport infrastructure
Rank Value Rank Value Rank Value
UAE 1 6.4 4
Oman 14 5.5 48
Qatar 17 5.5 12
Bahrain 25 5.1 30
KSA 34 4.8 42
Kuwait 63 4.1 78
Source: World Economic Forum: Global Competitiveness Report 2018.
Figure 7.4: GCC Logistics Performance Index for 2016
3.94
3.61
European Arab World KSA UAE Bahrain Kuwait Qatar Oman Union
3.23
3.60
3.153.16
2.71
Source: World Bank: World Development Indicators, 2018
3.21173.8
4.9464.7
4.9495.1
6.365.6
4.7564.6
6.636.2
3.31
Dubai Economic Report 2018dubaided.gov.ae
124

9
CHAPTER 7 | Transport, Storage, Communications and Information Technology
The transport and storage sector in the emirate has seen significant growth in recent years according to a number of sectoral indicators. The number of workers employed in the sector increased from about 232,000 in 2011 to about 241,000 in 2013, then 262,000 in 2015and to 273,000 in 2016.
The average annual growth rate in the number of workers was 4.7 per cent during the period (2007-2016). The year 2016 witnessed a growth of 4.3 per cent. (Figure 7.5)
The transport and storage sector is one of the sectors that is particularly attractive to foreign investment because of its importance in the economy and the growth and expansion opportunities it offers. Total foreign direct investment in the transport and stor-age sector has almost doubled during the last decade (2007-2016), rising from US$ 2,863 million in 2007 to US$ 3,575 million in 2009, to US$ 4,251 million in 2014, and finally to US$ 5,214 million in 2016. (Figure 7.6)
Figure 7.5: Growth rates of transport and storage workforce, 2007-2016
7.9
2007 2008 2009 2010 2011 2012 2013 2014 2015 2016
3.7
7
4.9
6.4
0.8
3.1
6.4
2.1
4.3
0
1
2
3
4
5
6
7
8
Source: Dubai Statistics Center
Figure 7.6: Total FDI stock in Transport and Storage sector (US$ Million)
6,000 5,214
125
4,000
3,000
2,000
1,000
0 2007 2008 2009 2010 2011 2012 2013 2014 2015 2016
3,364
5,000 4,444 4,251 4,177
3,942 4,294
3,575
Dubai_DED DubaiDED Dubai DEDDubai Economic Report 2018
3,282 2,863
Source: Dubai Statistics Center

Dubai Economic Report 2018dubaided.gov.ae
Transport, Storage, Communications and Information Technology | CHAPTER 7
Land transport 7.3 Land transport involves the transport of indi-
viduals and goods. Individuals in Dubai move around using private cars and public transport,
including public buses, metro and taxis, while goods are moved by trucks. The road network is one of the most important public assets that, when developed and improved, offers many economic and social benefits, including quick and safe transport. This reduces the operating costs of running buses, cars and trucks, making transporting goods and individuals more effi-cient raising profits and the welfare of society’s members.
Recognizing the pivotal role played by the road network in the transport sector, the emirate has paid great
attention to it, making it the best globally in terms of safety and efficiency. This has led to an increase in the number of cars and buses that use Dubai’s network, making the emirate one of the most densely populat-ed cities in the world in terms of its car-to-population ratio. This ratio is also high because of other economic factors such as the high level of per capita income and the level of economic prosperity in the emirate. In order to counter the environmental impact of carbon dioxide emissions arising from a high number of cars per capi-ta, the Government of Dubai has undertaken several initiatives in cooperation with local and federal author-ities to help make the emirate a “green economy.”
126

CHAPTER 7 | Transport, Storage, Communications and Information Technology
Mass transit system 7.4 As part of the Government of Dubai’s
efforts to enhance the welfare of its resi-dents and encourage the use of public
transport to preserve the environment, an integrated mass transport network has been developed, cover-ing most areas within the emirate and offering its services to all segments of society efficiently, safely and cost effectively. Not only did the Government of Dubai provide public buses, but it intensified its efforts to reduce environmental pollution and provide alternative high quality means of transport. It has also built two metro lines, the Red Line and the Green Line, with 87 trains in operation covering a distance of 75 km. The tremendous change that Dubai Metro has brought about in terms of a mass transit network can be seen in the growing numbers of metro passengers in recent years. The increase in the number of passengers using the metro was significantly higher
than the number of passengers using public buses. Metro travel increases more than five times during 2010-2017, from about 39,000 passengers in 2010 to close to 201,000 passengers annually in 2017. Public bus use increased from about 110,000 passengers annually to about 155,000 passengers annually during the same period. (Figure 7.7)
RTA has signed a contract to build Route 2020, which will extend the Red Line of Dubai Metro from Nakheel Harbor and Tower Station to the Expo 2020 site, adding 15 km, of track including 11.8 km above ground level and 3.2 km underground. The project comprises seven stations, including an interchange station with the Red Line, a station at the Expo site, three elevated stations and two underground stations, along with the addition of 50 more trains.
Figure 7.7: Number of Metro passengers and public buses (2010-2017)
Metro Passengers
Public Buses Passengers
2010 2011 2012 2013 2014 2015 2016 2017
110,393 107,408 107,806 115,676 128,539 128,931 151,069 155,320
38,888 69,007 109,492 137,760 164,307 178,647 191,326 200,753
127 Dubai_DED DubaiDED Dubai DEDDubai Economic Report 2018
Source: Dubai Statistics Center

Transport, Storage, Communications and Information Technology | CHAPTER 7
Taxis 7.5 As part of the diversification programme of
the transport services for residents and visitors, Dubai offers an excellent transport
service through a huge fleet of taxis managed and supervised by RTA. These vehicles are operated by six companies that are licensed to operate taxis: Dubai Taxi, Arabia Taxi, National Taxi, Cars Taxi, Metro Taxi and City Taxi. The number of taxis in Dubai has increased significantly in recent years, rising from
Figure 7.8: Number of taxis 2010-2017
7,942 in 2011 to 8,702 in 2013, to 9,611 in 2015 and to 11,327 in 2017. (Figure 7.8)
The increase in the number of taxis caters for increas-ing demand, as demonstrated by the rise in the number of trips from about 82 million trips in 2010 to about 96 million trips in 2012, to about 108 million trips in 2015 with a slight decline to around 102 million in 2017. (Figure 7.9)
Figure 7.9: Number of taxi rides 2010-2017
2017
2016
2015
2014
2013
2012
2011
2010 7,944
7,942
8,042
8,702
8,762
9,611
10,216
11,327
81,800,803
91,448,170
95,525,514
81,619,678
106,700,287
107,822,479
101,680,328
101,680,328
128 Dubai Economic Report 2018dubaided.gov.ae
Number of Taxis Number of Taxi rides Source: Roads and Transport Authority (RTA)
Dubai_DED DubaiDED Dubai DEDDubai Economic Report 2018
CHAPTER 7 | Transport, Storage, Communications and Information Technology
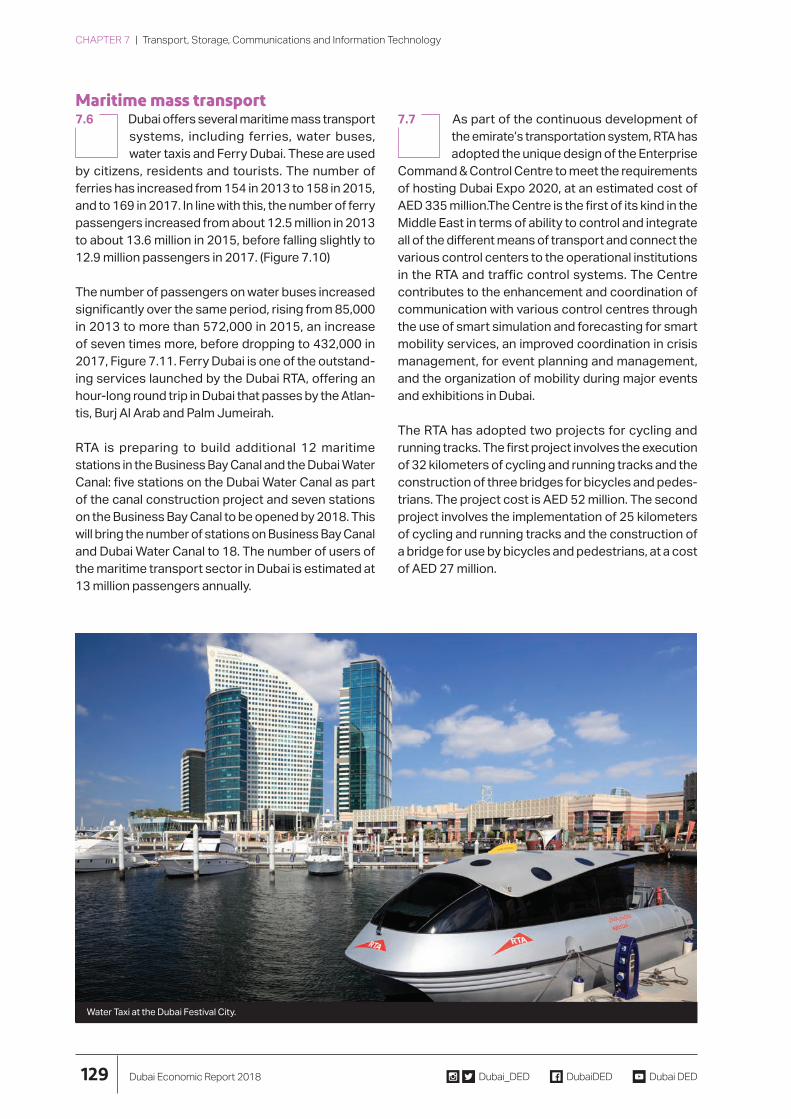
Maritime mass transport 7.6 Dubai offers several maritime mass transport
systems, including ferries, water buses, water taxis and Ferry Dubai. These are used
by citizens, residents and tourists. The number of ferries has increased from 154 in 2013 to 158 in 2015, and to 169 in 2017. In line with this, the number of ferry passengers increased from about 12.5 million in 2013 to about 13.6 million in 2015, before falling slightly to 12.9 million passengers in 2017. (Figure 7.10)
The number of passengers on water buses increased significantly over the same period, rising from 85,000 in 2013 to more than 572,000 in 2015, an increase of seven times more, before dropping to 432,000 in 2017, Figure 7.11. Ferry Dubai is one of the outstand-ing services launched by the Dubai RTA, offering an hour-long round trip in Dubai that passes by the Atlan-tis, Burj Al Arab and Palm Jumeirah.
RTA is preparing to build additional 12 maritime stations in the Business Bay Canal and the Dubai Water Canal: five stations on the Dubai Water Canal as part of the canal construction project and seven stations on the Business Bay Canal to be opened by 2018. This will bring the number of stations on Business Bay Canal and Dubai Water Canal to 18. The number of users of the maritime transport sector in Dubai is estimated at 13 million passengers annually.
7.7 As part of the continuous development of the emirate’s transportation system, RTA has adopted the unique design of the Enterprise
Command & Control Centre to meet the requirements of hosting Dubai Expo 2020, at an estimated cost of AED 335 million.The Centre is the first of its kind in the Middle East in terms of ability to control and integrate all of the different means of transport and connect the various control centers to the operational institutions in the RTA and traffic control systems. The Centre contributes to the enhancement and coordination of communication with various control centres through the use of smart simulation and forecasting for smart mobility services, an improved coordination in crisis management, for event planning and management, and the organization of mobility during major events and exhibitions in Dubai.
The RTA has adopted two projects for cycling and running tracks. The first project involves the execution of 32 kilometers of cycling and running tracks and the construction of three bridges for bicycles and pedes-trians. The project cost is AED 52 million. The second project involves the implementation of 25 kilometers of cycling and running tracks and the construction of a bridge for use by bicycles and pedestrians, at a cost of AED 27 million.
Water Taxi at the Dubai Festival City.
129

Dubai Economic Report 2018dubaided.gov.ae
14.0
12.0
Transport, Storage, Communications and Information Technology | CHAPTER 7
Figure 7.10: Number of ferry passengers (in million)
13.6
13.5
13.1
12.913.0
12.6 12.5
12.512.5
2012 2013 2014 2015 2016 2017 Source: Dubai Statistics Center
Figure 7.11: Number of water bus passengers
700,000
572,202600,000
100,000
200,000
300,000
400,000
500,000
347,530
84,720
533,413 527,025
431,891
2012 2013 2014 2015 2016 2017 Source: Dubai Statistics Center
0
130
Dubai_DED DubaiDED Dubai DEDDubai Economic Report 2018
CHAPTER 7 | Transport, Storage, Communications and Information Technology
Air transport 7.8 The air transport sector is one of the most
important success stories in the Emirate of Dubai. The sector’s progress began in the
mid-1980s and continues to this day constituting one of the cornerstones of the emirate’s economy. It is supervised by the Dubai Civil Aviation Authority.
The exceptional growth of the air transport sector over the past two decades has been due to several factors, including most prominently the air transport infrastructure, represented by Dubai Airports and Emirates Airlines, which have been the driving force of this sector.
7.9 Dubai is home to two of the world’s best airports in terms of efficiency and quality of service:Dubai International Airport and Al
Maktoum International Airport. Their operations are managed by the Dubai Airports Company, which was established in 2007.
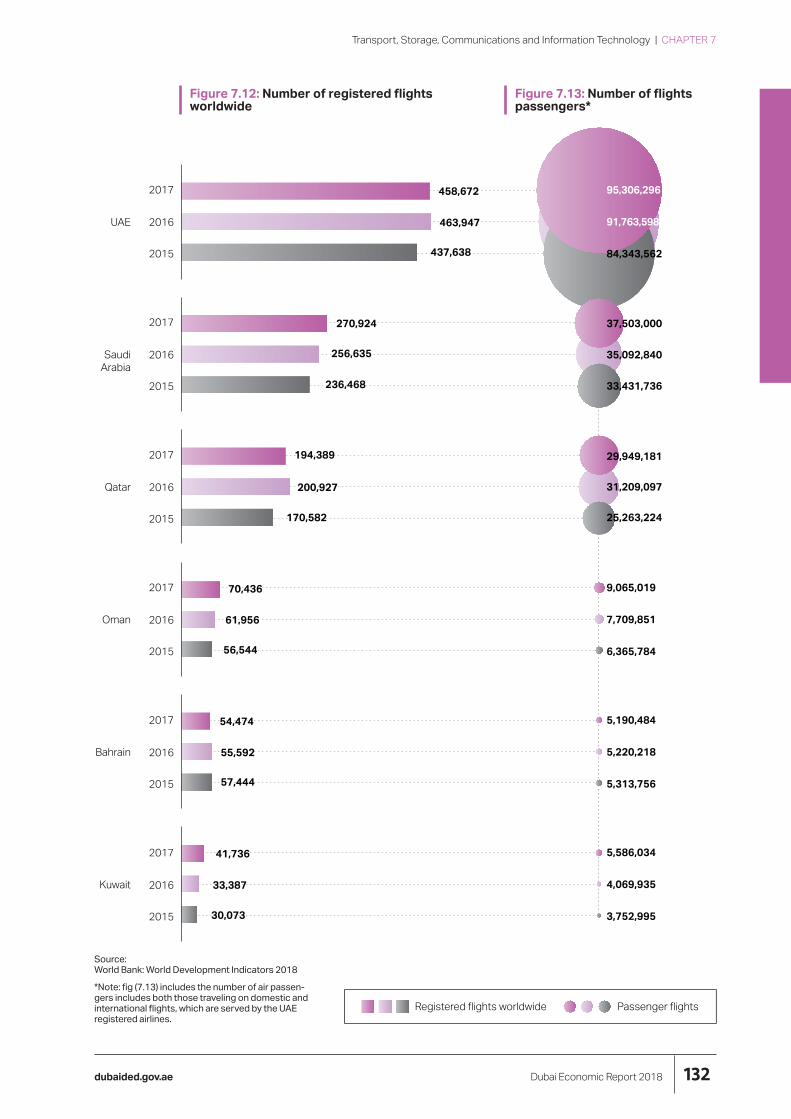
It is unsurprising that the UAE topped the GCC coun-tries in terms of the number of flights of registered airlines worldwide, reaching about 459,000 flights in 2017, down slightly from 464,000 the year before. The UAE was followed by Saudi Arabia with 271,000 flights and by Qatar in third place with 194,000 flights. In rank order Oman, Bahrain and Kuwait generated 167,000 flights between them. The order of the top three countries remained the same over the last three years. (Figure 7.12)
In parallel, the number of air passengers in the UAE has increased from about 84 million in 2015 to about 92 million in 2016 and to about 95 million in 2017. As in the case of the number of registered flights, the UAE ranks first in terms of number of passengers in the GCC region, followed by Saudi Arabia and then Qatar. (Figure 7.13)
The Al Maktoum International
Airport project is part of Dubai World
Central, one of Dubai’s largest air
transport projects, and includes
the construction of the world’s
first fully integrated airport city.
131
Dubai Economic Report 2018dubaided.gov.ae
Transport, Storage, Communications and Information Technology | CHAPTER 7
Figure 7.12: Number of registered flights Figure 7.13: Number of flights worldwide passengers*
UAE
Saudi Arabia
Qatar
Oman
Bahrain
Kuwait
2017
2016
2015
2017
2016
2015
2017
2016
2015
2017
2016
2015
2017
2016
2015
2017
2016
2015
236,468
256,635
270,924
437,638
463,947
458,672
57,444
55,592
54,474
30,073
33,387
41,736
170,582
200,927
194,389
56,544
61,956
70,436
33,431,736
35,092,840
37,503,000
84,343,562
91,763,598
95,306,296
5,313,756
5,220,218
5,190,484
3,752,995
4,069,935
5,586,034
25,263,224
31,209,097
29,949,181
6,365,784
7,709,851
9,065,019
Source: World Bank: World Development Indicators 2018
*Note: fig (7.13) includes the number of air passen-gers includes both those traveling on domestic and international flights, which are served by the UAE registered airlines.
Registered flights worldwide Passenger flights
132

Dubai_DED DubaiDED Dubai DEDDubai Economic Report 2018
CHAPTER 7 | Transport, Storage, Communications and Information Technology
Data shows that Dubai receives the largest share of passengers in the UAE. Dubai International Airport received more than 88 million passengers in 2017, compared to 84 million passengers in 2016 and 78 million passengers in 2015. (Figure 7.14)
7.10 The Al Maktoum International Airport project is part of Dubai World Central, which is one of Dubai’s largest air transport projects, at a
cost of AED 120 billion. It includes the construction of the world’s first fully integrated airport city. The project includes six specialized areas: Al Maktoum Internation-al Airport, which will be the world’s largest airport; Dubai Logistics City: a residential city, a commercial city, a golf city and an aviation city. The total cost of the proj-ect is AED 120 billion which is being executed in phases. The cargo terminal was opened in June 2010 and the passenger terminal was opened in October 2013.
The number of passengers at Al Maktoum International Airport has increased from about 433,000 passengers in 2015 to about 851,000 passengers in 2016, and then to about 905,000 passengers in 2017. (Figure 7.15)
7.11 Developments in Dubai’s air transport sector are linked closely with the leading position of the Emirates Group, which is one of the fast-
est growing airlines in the world and operates a network to more than 150 destinations. Emirates Group includes a number of companies with different activities related to air transport services, including most notably Emirates Airlines, Dnata, Emirates Holi-days, Marhaba, Emirates Air Cargo, Emirates Private Aviation, Emirates Academy for Pilot Training and Emirates Catering.
Figure 7.14: Number of Dubai International Airport passengers 2010-2017 (in million)
100.0 88.2 83.7
78.0 70.580.0 66.5
57.7 50.960.0 47.2
40.0
20.0
0 2010 2011 2012 2013 2014 2015 2016 2017 Source: Dubai Statistics Center
Figure 7.15: Number of Al Maktoum International Airport passengers 2014-2017
904,9401,000,000 844,576
432,876
850,633
400,000
600,000
800,00
200,000
0 2014 2015 2016 2017 Source: Dubai Statistics Center
133
Transport, Storage, Communications and Information Technology | CHAPTER 7
Dubai Economic Report 2018dubaided.gov.ae
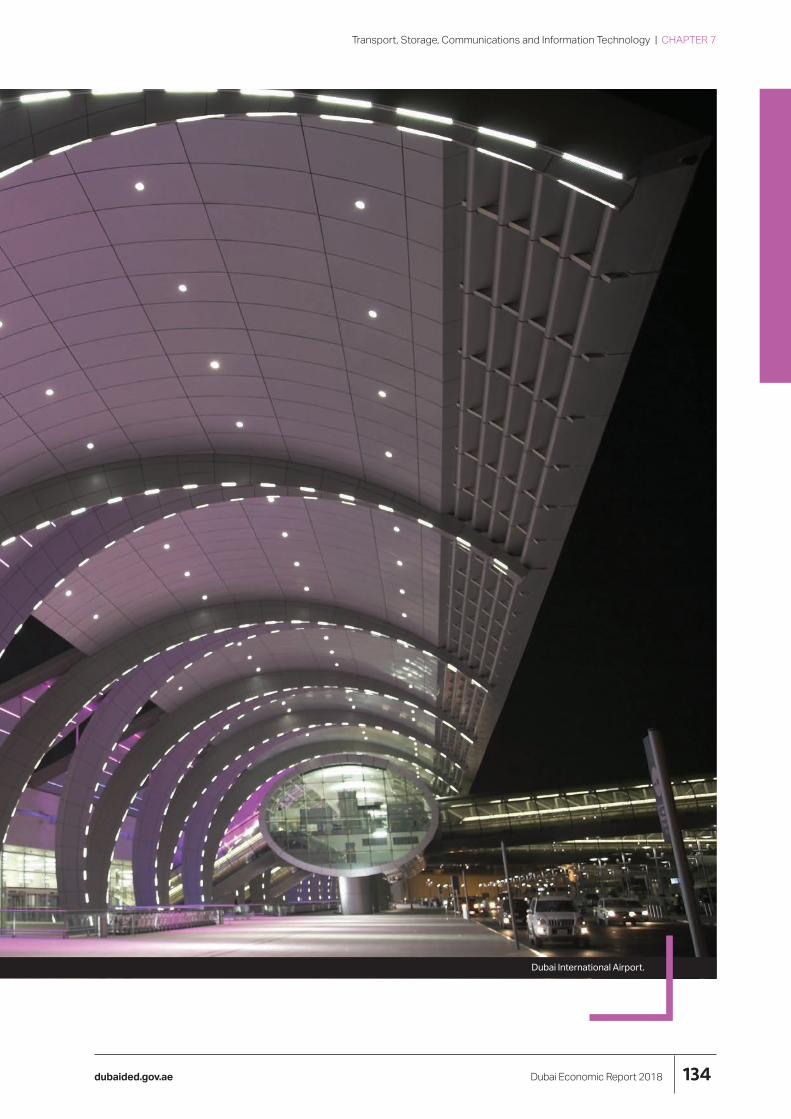
Dubai International Airport.
134
CHAPTER 7 | Transport, Storage, Communications and Information Technology
ICT sector
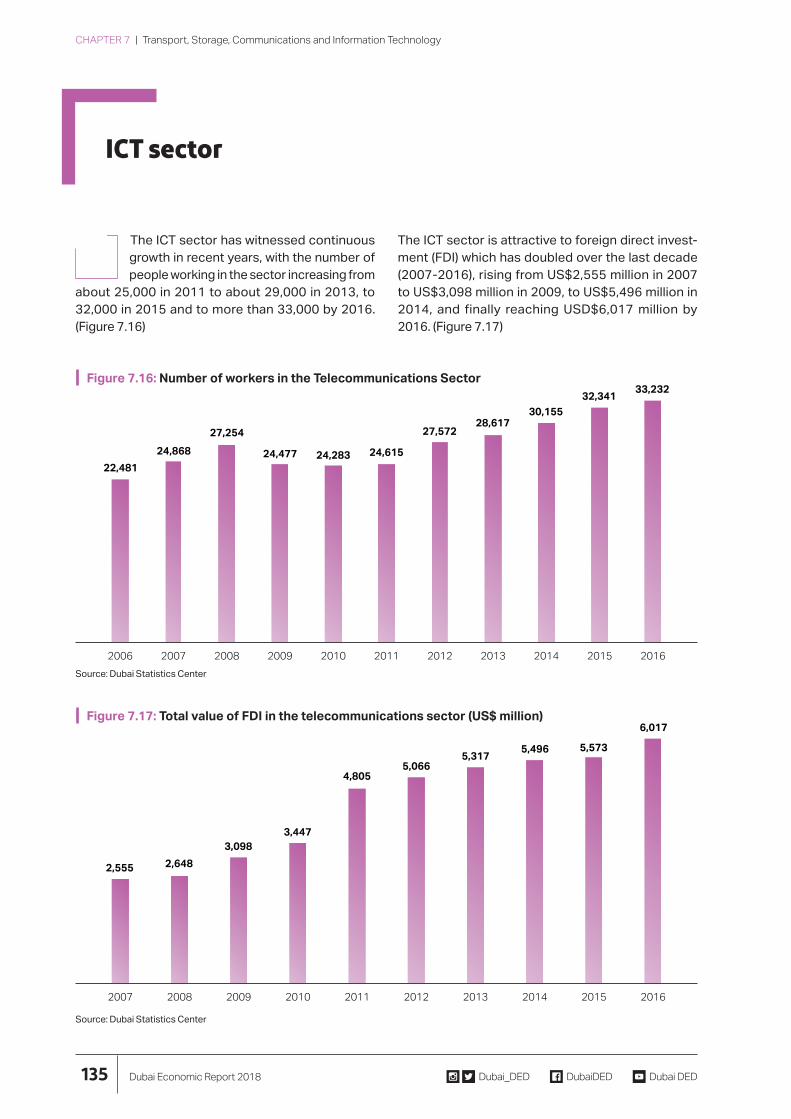
7.12 The ICT sector has witnessed continuous The ICT sector is attractive to foreign direct invest-growth in recent years, with the number of ment (FDI) which has doubled over the last decade people working in the sector increasing from (2007-2016), rising from US$2,555 million in 2007
about 25,000 in 2011 to about 29,000 in 2013, to to US$3,098 million in 2009, to US$5,496 million in 32,000 in 2015 and to more than 33,000 by 2016. 2014, and finally reaching USD$6,017 million by (Figure 7.16) 2016. (Figure 7.17)
Figure 7.16: Number of workers in the Telecommunications Sector 33,23232,341
30,155 28,617
24,283 22,481
135
6,017
5,496 5,5735,317
5,0664,805
3,447 3,098
2,6482,555
2007 2008 2009 2010 2011 2012 2013 2014 2015 2016
2006 2007 2008 2009 2010 2011 2012 2013 2014 2015 2016
Source: Dubai Statistics Center
Source: Dubai Statistics Center
Figure 7.17: Total value of FDI in the telecommunications sector (US$ million)
27,254 27,572
24,868 24,615 24,477
Dubai_DED DubaiDED Dubai DEDDubai Economic Report 2018

10
20
30
40
50
60
70
Transport, Storage, Communications and Information Technology | CHAPTER 7
7.13 According to the Global Competitiveness Report (2017-2018) issued by the World Economic Forum, the UAE ranks first global-
ly in terms of government procurement of high tech-nology products”, 13th globally and the first among Arab countries in terms of the availability of the latest technology, and 15th globally and the first in the Arab world in terms of innovation capacity.
The United Arab Emirates ranked first among Arab countries on the network readiness Index, which
measures the ability of a particular economy to use ICT to increase competition and enhance development. The UAE was ranked 26th among all 139 countries on this index. (Figure 7.18)
According to the ICT Development Index, which measures the level of ICT development, the UAE ranked 40th globally and third in the GCC region in 2017. (Figure 7.19)
Figure 7.18: International ranking of GCC countries according to the Network Readiness Index
Ranking
26 27 28
33
52
61
136
30
40
50
60
70
80
54
40
31
39
71
Dubai Economic Report 2018dubaided.gov.ae
80 UAE Qatar Bahrain KSA Oman Kuwait
Source: Global Competitiveness Report - World Economic Forum, Network Readiness Index
Figure 7.19: International ranking of the GCC countries according to the ICT Development Index
Ranking
10
20
62
UAE Qatar Bahrain KSA Oman Kuwait Source: ITU - ICT Development Index

Dubai_DED DubaiDED Dubai DEDDubai Economic Report 2018
CHAPTER 7 | Transport, Storage, Communications and Information Technology
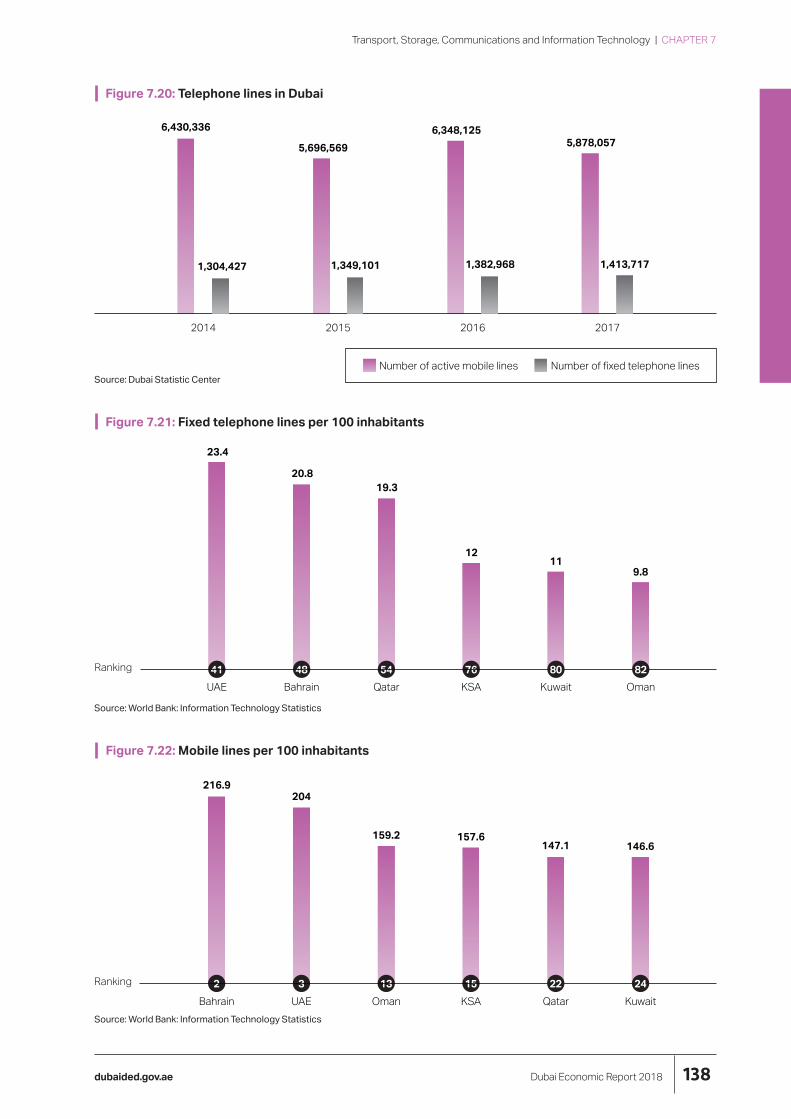
7.14 According to the Dubai Statistics Center, the number of fixed lines in Dubai has grown strongly over the last four years, rising from
about 1.304 million in 2014 to about 1.349 million in 2015 and then to 1.414 in 2017. The available data also indicates that the number of active mobile lines was about 5.8 million in 2017. (Figure 7.20)
In terms of the density of lines according to the World Bank’s Fixed Line Index for lines for every
100 inhabitants in 2017, the United Arab Emirates ranked 41st globally and first among the GCC coun-tries. (Figure 7.21)
Regarding the penetration of mobile phone usage the World Bank’s Mobile Phone Index for every 100 inhab-itants in 2017 showed that the United Arab Emirates was third in the world and second among the GCC region, Figures (7.22)
Technology exhibition in Dubai.
137
Transport, Storage, Communications and Information Technology | CHAPTER 7
Figure 7.20: Telephone lines in Dubai
6,430,336 6,348,125
3 13 15
147.1 146.6
76
9.8
54
11
48
12
1,304,427 1,349,101 1,382,968 1,413,717
Ranking
Bahrain UAE Oman KSA Qatar Kuwait 2
204
159.2 157.6
216.9
Ranking
UAE Bahrain Qatar KSA Kuwait Oman 41
19.3
23.4
20.8
Number of active mobile lines Number of fixed telephone lines
2014 2015 2016 2017
5,696,569
Source: World Bank: Information Technology Statistics
Source: World Bank: Information Technology Statistics
Source: Dubai Statistic Center
Figure 7.22: Mobile lines per 100 inhabitants
Figure 7.21: Fixed telephone lines per 100 inhabitants
5,878,057
Dubai Economic Report 2018dubaided.gov.ae
80 82
22 24
138
Dubai_DED DubaiDED Dubai DEDDubai Economic Report 2018
CHAPTER 7 | Transport, Storage, Communications and Information Technology
7.15 The number of broadband lines has also grown significantly in recent years in terms of number of individual and business users.
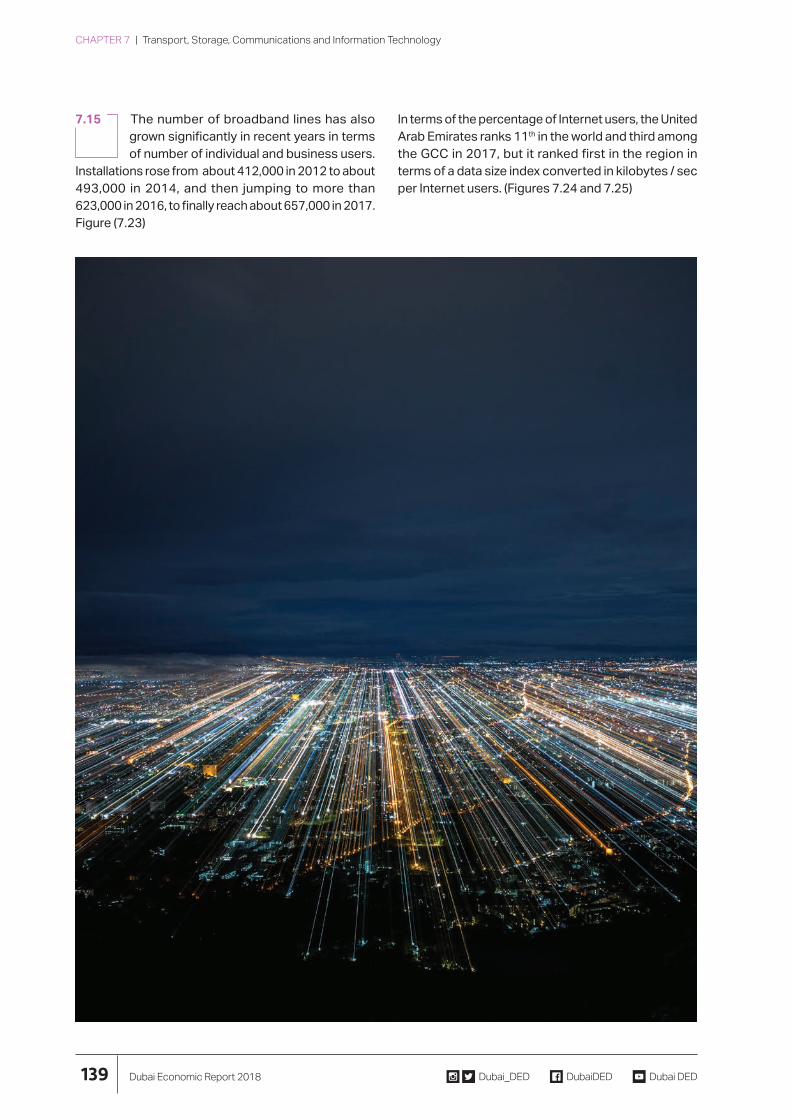
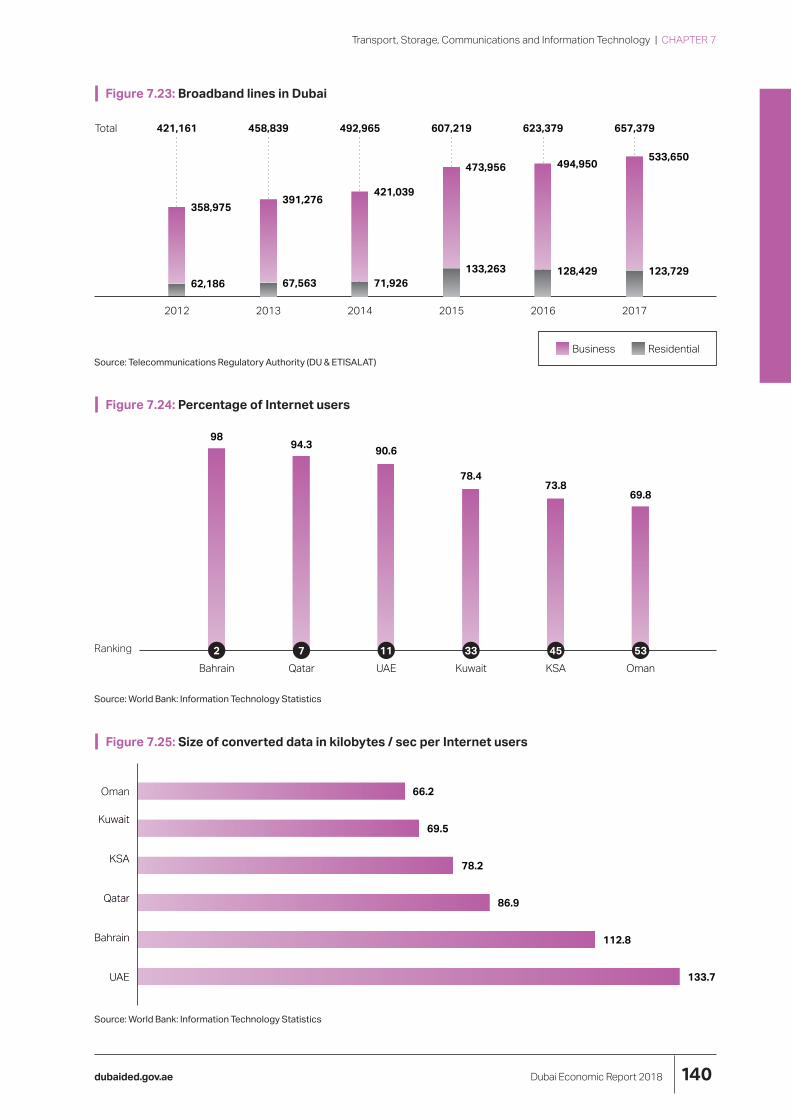
Installations rose from about 412,000 in 2012 to about 493,000 in 2014, and then jumping to more than 623,000 in 2016, to finally reach about 657,000 in 2017. Figure (7.23)
In terms of the percentage of Internet users, the United Arab Emirates ranks 11th in the world and third among the GCC in 2017, but it ranked first in the region in terms of a data size index converted in kilobytes / sec per Internet users. (Figures 7.24 and 7.25)
139
Transport, Storage, Communications and Information Technology | CHAPTER 7
Figure 7.23: Broadband lines in Dubai
Total 421,161 458,839 492,965 607,219 623,379 657,379
533,650494,950
133.7
112.8
86.9
78.2
69.5
Oman
Dubai Economic Report 2018dubaided.gov.ae
473,956
UAE
Bahrain
Qatar
KSA
Kuwait
421,039391,276
358,975
133,263 128,429 123,729 67,563 71,92662,186
2012 2013 2014 2015 2016 2017
Business Residential Source: Telecommunications Regulatory Authority (DU & ETISALAT)
Figure 7.24: Percentage of Internet users
98 94.3
2
90.6
7
78.4
11
73.8
33
69.8
Ranking
Bahrain Qatar UAE Kuwait KSA Oman 45 53
Source: World Bank: Information Technology Statistics
Figure 7.25: Size of converted data in kilobytes / sec per Internet users
66.2
Source: World Bank: Information Technology Statistics
140