Embed Size (px)
Citation preview
MESCOM: ARR / ERC & Tariff Petition for Fy-21: Ch.5-Sales Projection
43
CHAPTER-5
ENERGY SALES PROJECTIONS FOR FY-21
5.1 In the Tariff Order-2019, Hon’be Commission has approved the category wise
energy sales and number of installations for 05th control period i.e., for FY-20,
FY-21 and FY-22 based on mixed CAGR method. However, as the factors affecting
the actual consumption are numerous and often beyond the control of the licensee,
it needs to revise the projections considering the actuals of the immediately
preceding year. Accordingly, the projections in respect of installations and energy
sales are revised for FY-21. Further, since the figures of FY-20 is linearly
dependent for the projections of FY-21, the approved projections of installations &
energy sales for FY-20 are also revised and compared.
The inputs considered for the estimations / projections are detailed in the foregoing
paragraphs.
5.1.1 LT-1: Bhagyajyothi & Kutirajyothi
The category is having two sub categories (i) installations having energy
consumption 40 units and below per month (ii) installations having energy
consumption above 40 units. Government of Karnataka is subsidizing the
consumers of the category for the consumption upto 40 units per month.
For the category, in the Tariff Order-2019, Hon’ble Commission has approved the
number of installations & energy sales for FY-20 and FY-21 as below;
Year Installations with
consumption upto 40
units / month
Installations with
consumption above
40 units / month
Total
No.s MU No.s MU No.s MU
FY-20 179636 34.21 11526 12.60 191162 46.81
FY-21 179636 34.21 11526 12.60 191162 46.81
MESCOM: ARR / ERC & Tariff Petition for Fy-21: Ch.5-Sales Projection
44
However, in the year FY-19 and FY-20 (upto Sep) the actual position is as
indicated below;
Year
Installations with
consumption upto 40
units / month
Installations with
consumption above
40 units / month
Total
No.s MU No.s MU No.s MU
FY-19
(Actual) 175524 37.29 12480 12.08 188004 49.37
FY-20 (Actual)
(upto Sep) 169521 17.39 17648 7.87 187169 25.26
It is to note that numbers of installations are fluctuating between the sub
categories. Hence, MESCOM has retained the number of installations and energy
sales of FY-19 for FY-20 and FY-21.
Accordingly, the projections for FY-20 and FY-21, for LT-1 category, would be
as below;
Year Installations with
consumption upto 40
units / month
Installations with
consumption above
40 units / month
Total
No.s MU No.s MU No.s MU
FY-20 175524 37.29 12480 12.08 188004 49.37
FY-21 175524 37.29 12480 12.08 188004 49.37
5.1.2 LT-2a: Lighting/combined lighting, heating & motive power of residential
houses.
For the category, in the Tariff Order-2019, Hon’ble Commission has approved the
number of installations & energy sales for FY-20 and FY-21 as below;
Year Installations
(Nos.)
Energy Sales
(MU)
FY-20 1576951 1436.69
FY-21 1625051 1502.36
MESCOM: ARR / ERC & Tariff Petition for Fy-21: Ch.5-Sales Projection
45
However, in the year FY-19 and FY-20 (upto Sep) the actual position is as
indicated below;
Year Urban Rural Total
No.s MU No.s MU No.s MU
FY-19
(Actual) 611398 721.91 935899 640.07 1547297 1361.98
FY-20 (Actual)
(upto Sep) 629963 402.88 946563 355.61 1576526 758.49
MESCOM has analyzed the CAGRs of the category during the period ‘FY-15 to
FY-19’ and ‘FY-17 to FY-19’ and also with reference to immediate preceding
year FY-18.
FY-15 to FY-19 FY-17 to FY-19 w.r.t. FY-18
Installations 3.25% 3.21% 3.83%
Energy Sales 3.37% 2.66% 1.74%
It can be noted that the growth rate during the ‘FY-17 to FY-19’ appears to be
consistence for projection for the category. Hence, the same is considered and
projections are arrived as below for FY-20 and FY-21 over the actuals of FY-19;
Year Installations Energy Sales
CAGR Nos. CAGR MU
FY-20 3.21% 1596965 2.66% 1398.21
FY-21 3.21% 1648228 2.66% 1435.40
Further, the category is having two sub categories (i) urban (ii) rural. The above
projections have been sub divided into sub categories in the proportion of actuals
of FY-19, as below;
Year Urban Rural Total
No.s MU No.s MU No.s MU
FY-20 631023 741.11 965942 657.10 1596965 1398.21
FY-21 651279 760.83 996949 674.57 1648228 1435.40
MESCOM: ARR / ERC & Tariff Petition for Fy-21: Ch.5-Sales Projection
46
5.1.3 LT-2b: Private professional and other private educational institutions.
For the category, in the Tariff Order-2019, Hon’ble Commission has approved the
number of installations & energy sales for FY-20 and FY-21 as below;
Year Installations
(Nos.)
Energy Sales
(MU)
FY-20 3715 15.18
FY-21 3845 16.13
However, in the year FY-19 and FY-20 (upto Sep) the actual position is as
indicated below;
Year Urban Rural Total
No.s MU No.s MU No.s MU
FY-19
(Actual) 1681 7.94 1833 5.68 3514 13.62
FY-20 (Actual)
(upto Sep) 1709 4.26 1871 2.87 3580 7.13
MESCOM has analyzed the CAGRs of the category during the period ‘FY-15 to
FY-19’ and ‘FY-17 to FY-19’ and also with reference to immediate preceding
year FY-18.
FY-15 to FY-19 FY-17 to FY-19 w.r.t. FY-18
Installations 3.00% 2.39% 1.44%
Energy Sales 4.39% (-)0.73% (-)1.09%
It can be noted that though the growth rate in respect of energy sales is 4.39%
during ‘FY-15 to FY-19’, it is recording a negative trend since FY-17. Further,
the growth rate in respect of installations is also reducing drastically. Hence, it is
felt appropriate to maintain the proportionate position with reference to the
position as at the end of Sep-2019 of FY-20 for FY-20 and FY-21.
Year Installations Energy Sales
CAGR Nos. CAGR MU
FY-20 - 3580 - 14.24
FY-21 - 3580 - 14.24
MESCOM: ARR / ERC & Tariff Petition for Fy-21: Ch.5-Sales Projection
47
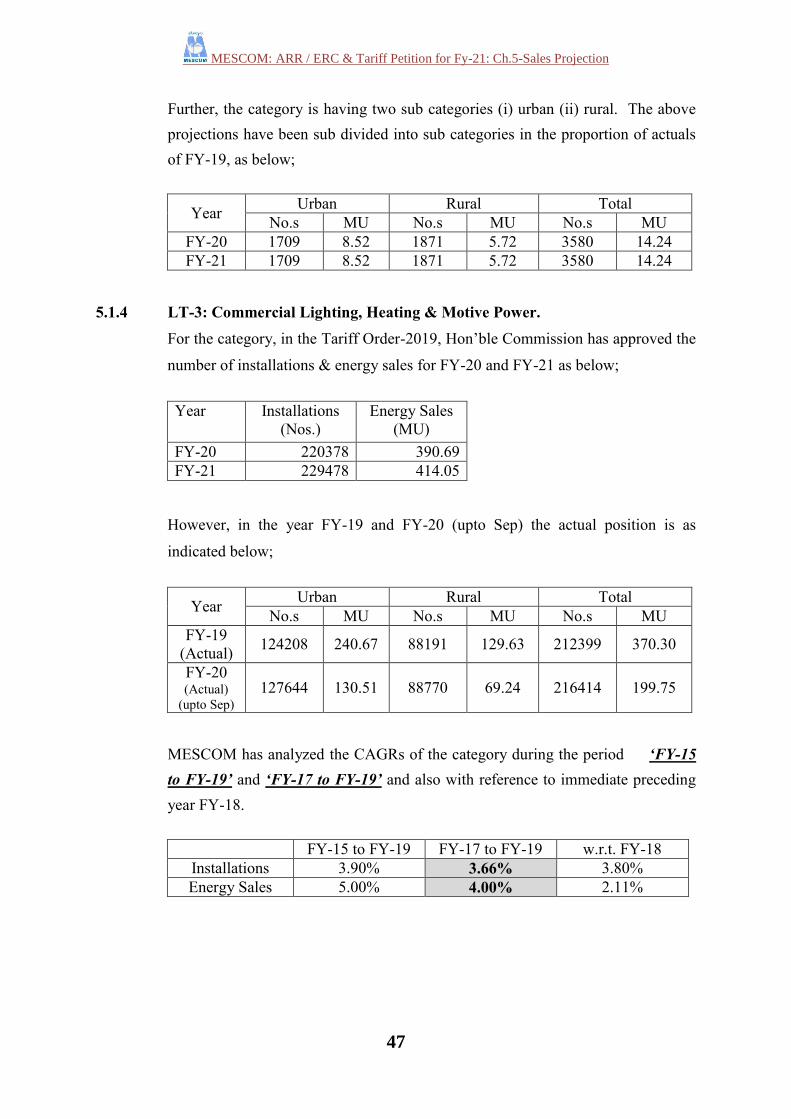
Further, the category is having two sub categories (i) urban (ii) rural. The above
projections have been sub divided into sub categories in the proportion of actuals
of FY-19, as below;
Year Urban Rural Total
No.s MU No.s MU No.s MU
FY-20 1709 8.52 1871 5.72 3580 14.24
FY-21 1709 8.52 1871 5.72 3580 14.24
5.1.4 LT-3: Commercial Lighting, Heating & Motive Power.
For the category, in the Tariff Order-2019, Hon’ble Commission has approved the
number of installations & energy sales for FY-20 and FY-21 as below;
Year Installations
(Nos.)
Energy Sales
(MU)
FY-20 220378 390.69
FY-21 229478 414.05
However, in the year FY-19 and FY-20 (upto Sep) the actual position is as
indicated below;
Year Urban Rural Total
No.s MU No.s MU No.s MU
FY-19
(Actual) 124208 240.67 88191 129.63 212399 370.30
FY-20 (Actual)
(upto Sep) 127644 130.51 88770 69.24 216414 199.75
MESCOM has analyzed the CAGRs of the category during the period ‘FY-15
to FY-19’ and ‘FY-17 to FY-19’ and also with reference to immediate preceding
year FY-18.
FY-15 to FY-19 FY-17 to FY-19 w.r.t. FY-18
Installations 3.90% 3.66% 3.80%
Energy Sales 5.00% 4.00% 2.11%
MESCOM: ARR / ERC & Tariff Petition for Fy-21: Ch.5-Sales Projection
48
It can be noted that though the growth rate in respect of energy sales is 5.00%
during ‘FY-15 to FY-19’, the growth rate with reference to immediate previous
month is only 2.11%. Hence, it is felt appropriate to consider CAGR of the
period ‘FY-17 to FY-19’ for projection of both installations and energy sales for
FY-20 and FY-21 over the actuals of FY-19.
Year Installations Energy Sales
CAGR Nos. CAGR MU
FY-20 3.66% 220090 4.00% 385.11
FY-21 3.66% 228145 4.00% 400.52
Further, the category is having two sub categories (i) urban (ii) rural. The above
projections have been sub divided into sub categories in the proportion of actuals
of FY-19, as below;
Year Urban Rural Total
No.s MU No.s MU No.s MU
FY-20 128754 250.30 91336 134.81 220090 385.11
FY-21 133466 260.31 94679 140.21 228145 400.52
5.1.5 LT-4a: IP Sets upto & inclusive of 10 HP.
For the category, in the Tariff Order-2019, Hon’ble Commission has approved the
number of installations & energy sales for FY-20 and FY-21 as below;
Year Installations
(Nos.)
Energy Sales
(MU)
FY-20 335901 1669.16
FY-21 350825 1745.01
MESCOM: ARR / ERC & Tariff Petition for Fy-21: Ch.5-Sales Projection
49
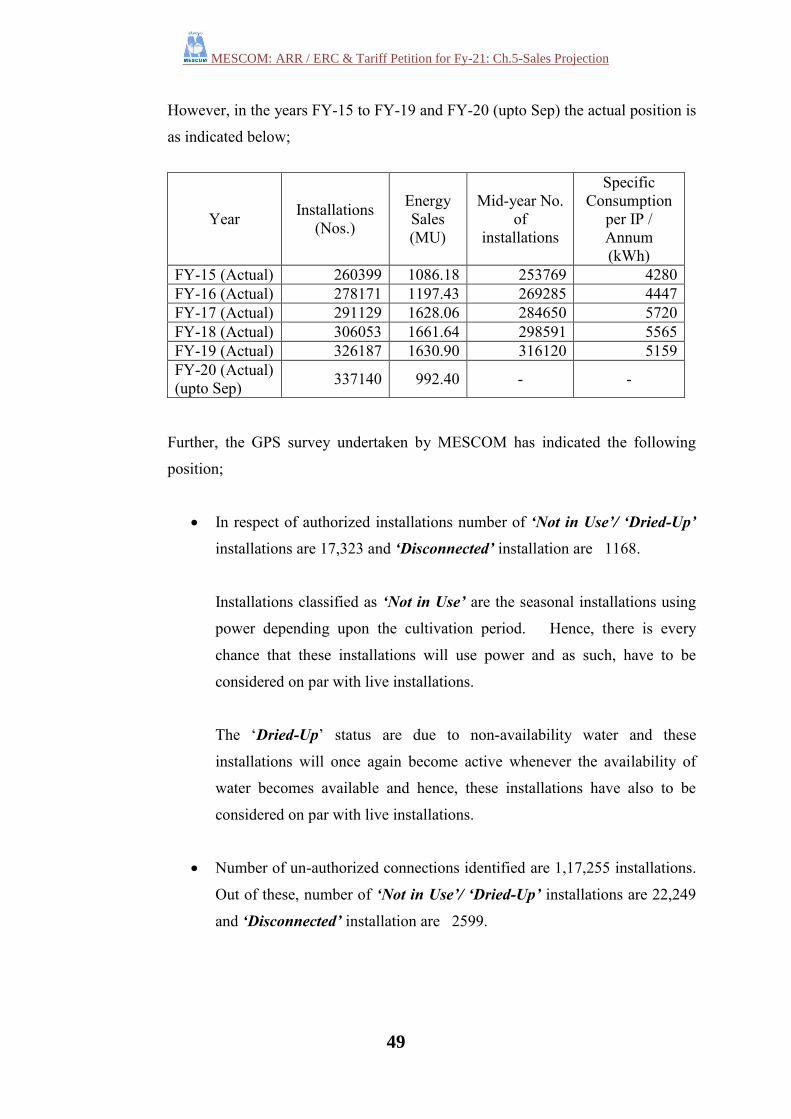
However, in the years FY-15 to FY-19 and FY-20 (upto Sep) the actual position is
as indicated below;
Year Installations
(Nos.)
Energy
Sales
(MU)
Mid-year No.
of
installations
Specific
Consumption
per IP /
Annum
(kWh)
FY-15 (Actual) 260399 1086.18 253769 4280
FY-16 (Actual) 278171 1197.43 269285 4447
FY-17 (Actual) 291129 1628.06 284650 5720
FY-18 (Actual) 306053 1661.64 298591 5565
FY-19 (Actual) 326187 1630.90 316120 5159
FY-20 (Actual)
(upto Sep) 337140 992.40 - -
Further, the GPS survey undertaken by MESCOM has indicated the following
position;
In respect of authorized installations number of ‘Not in Use’/ ‘Dried-Up’
installations are 17,323 and ‘Disconnected’ installation are 1168.
Installations classified as ‘Not in Use’ are the seasonal installations using
power depending upon the cultivation period. Hence, there is every
chance that these installations will use power and as such, have to be
considered on par with live installations.
The ‘Dried-Up’ status are due to non-availability water and these
installations will once again become active whenever the availability of
water becomes available and hence, these installations have also to be
considered on par with live installations.
Number of un-authorized connections identified are 1,17,255 installations.
Out of these, number of ‘Not in Use’/ ‘Dried-Up’ installations are 22,249
and ‘Disconnected’ installation are 2599.
MESCOM: ARR / ERC & Tariff Petition for Fy-21: Ch.5-Sales Projection
50
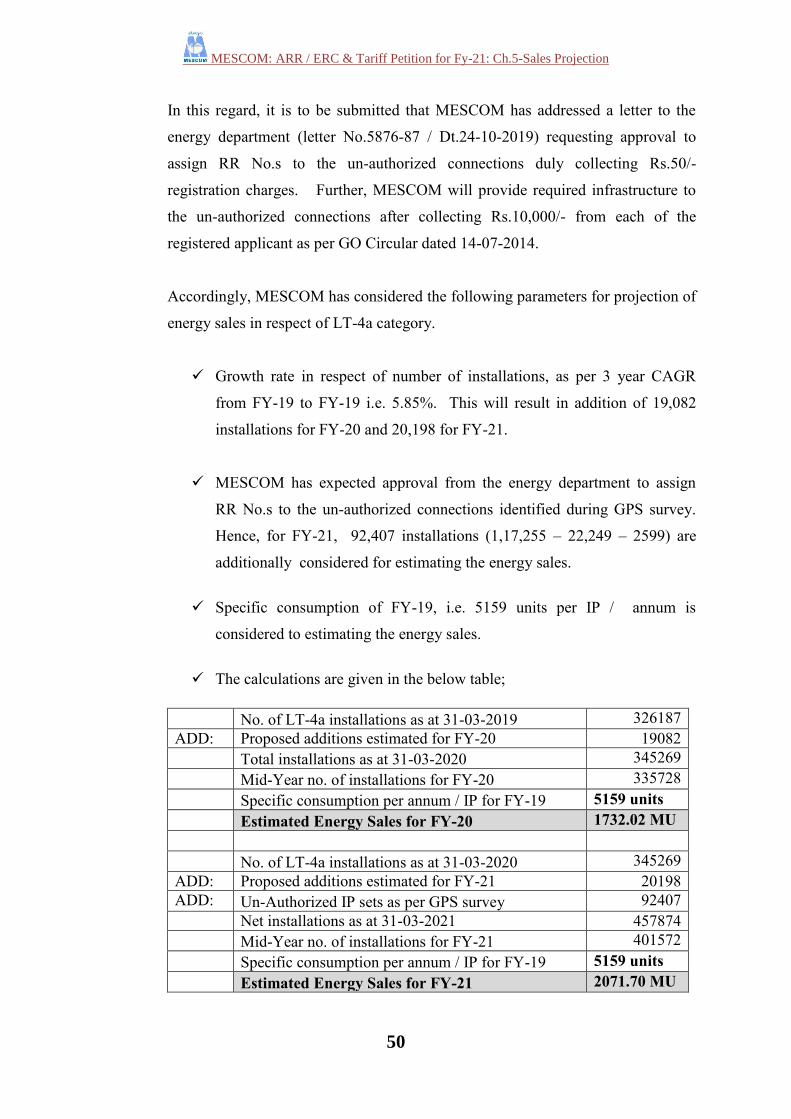
In this regard, it is to be submitted that MESCOM has addressed a letter to the
energy department (letter No.5876-87 / Dt.24-10-2019) requesting approval to
assign RR No.s to the un-authorized connections duly collecting Rs.50/-
registration charges. Further, MESCOM will provide required infrastructure to
the un-authorized connections after collecting Rs.10,000/- from each of the
registered applicant as per GO Circular dated 14-07-2014.
Accordingly, MESCOM has considered the following parameters for projection of
energy sales in respect of LT-4a category.
Growth rate in respect of number of installations, as per 3 year CAGR
from FY-19 to FY-19 i.e. 5.85%. This will result in addition of 19,082
installations for FY-20 and 20,198 for FY-21.
MESCOM has expected approval from the energy department to assign
RR No.s to the un-authorized connections identified during GPS survey.
Hence, for FY-21, 92,407 installations (1,17,255 – 22,249 – 2599) are
additionally considered for estimating the energy sales.
Specific consumption of FY-19, i.e. 5159 units per IP / annum is
considered to estimating the energy sales.
The calculations are given in the below table;
No. of LT-4a installations as at 31-03-2019 326187
ADD: Proposed additions estimated for FY-20 19082
Total installations as at 31-03-2020 345269
Mid-Year no. of installations for FY-20 335728
Specific consumption per annum / IP for FY-19 5159 units
Estimated Energy Sales for FY-20 1732.02 MU
No. of LT-4a installations as at 31-03-2020 345269
ADD: Proposed additions estimated for FY-21 20198
ADD: Un-Authorized IP sets as per GPS survey 92407
Net installations as at 31-03-2021 457874
Mid-Year no. of installations for FY-21 401572
Specific consumption per annum / IP for FY-19 5159 units
Estimated Energy Sales for FY-21 2071.70 MU
MESCOM: ARR / ERC & Tariff Petition for Fy-21: Ch.5-Sales Projection
51
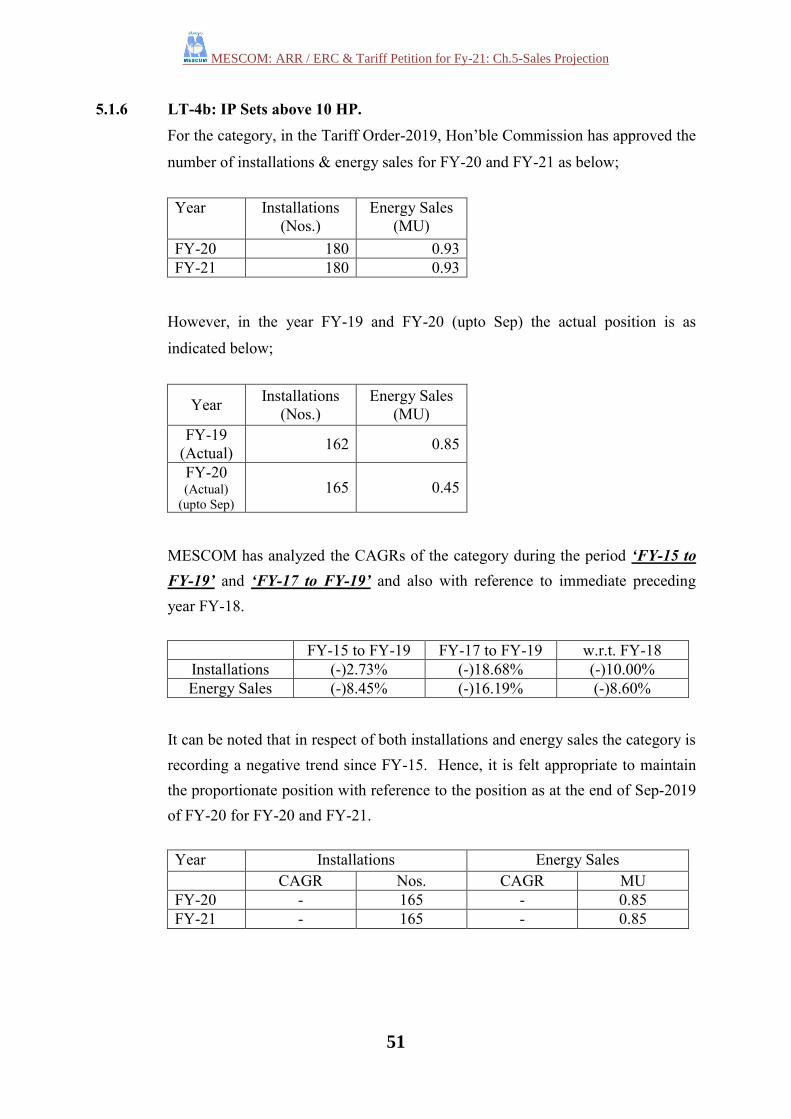
5.1.6 LT-4b: IP Sets above 10 HP.
For the category, in the Tariff Order-2019, Hon’ble Commission has approved the
number of installations & energy sales for FY-20 and FY-21 as below;
Year Installations
(Nos.)
Energy Sales
(MU)
FY-20 180 0.93
FY-21 180 0.93
However, in the year FY-19 and FY-20 (upto Sep) the actual position is as
indicated below;
Year Installations
(Nos.)
Energy Sales
(MU)
FY-19
(Actual) 162 0.85
FY-20 (Actual)
(upto Sep) 165 0.45
MESCOM has analyzed the CAGRs of the category during the period ‘FY-15 to
FY-19’ and ‘FY-17 to FY-19’ and also with reference to immediate preceding
year FY-18.
FY-15 to FY-19 FY-17 to FY-19 w.r.t. FY-18
Installations (-)2.73% (-)18.68% (-)10.00%
Energy Sales (-)8.45% (-)16.19% (-)8.60%
It can be noted that in respect of both installations and energy sales the category is
recording a negative trend since FY-15. Hence, it is felt appropriate to maintain
the proportionate position with reference to the position as at the end of Sep-2019
of FY-20 for FY-20 and FY-21.
Year Installations Energy Sales
CAGR Nos. CAGR MU
FY-20 - 165 - 0.85
FY-21 - 165 - 0.85
MESCOM: ARR / ERC & Tariff Petition for Fy-21: Ch.5-Sales Projection
52
5.1.7 LT-4c(i): Private Horticultural Nurseries, Coffee and Tea plantations of
sanctioned load of 10 HP & below.
In the year FY-19 and FY-20 (upto Sep) the actual position is as indicated below;
Year Installations
(Nos.)
Energy Sales
(MU)
FY-19
(Actual) 3450 3.50
FY-20 (Actual)
(upto Sep) 3642 1.87
MESCOM has analyzed the CAGRs of the category during the period ‘FY-15
to FY-19’ and ‘FY-17 to FY-19’ and also with reference to immediate preceding
year FY-18.
FY-15 to FY-19 FY-17 to FY-19 w.r.t. FY-18
Installations 10.96% 8.96% 9.18%
Energy Sales 10.24% (-)8.60 (-)16.07%
It can be noted that in respect of installations the growth rate is positive whereas
in respect of energy sales it is negative. Hence, it is felt appropriate to maintain
the proportionate position with reference to the position as at the end of Sep-2019
of FY-20 for FY-20 and FY-21.
Year Installations Energy Sales
CAGR Nos. CAGR MU
FY-20 - 3642 - 3.50
FY-21 - 3642 - 3.50
5.1.8 LT-4c(ii): Private Horticultural Nurseries, Coffee and Tea plantations of
sanctioned load of above 10 HP.
In the year FY-19 and FY-20 (upto Sep) the actual position is as indicated below;
Year Installations
(Nos.)
Energy Sales
(MU)
FY-19
(Actual) 861 3.41
FY-20 (Actual)
(upto Sep) 925 1.94
MESCOM: ARR / ERC & Tariff Petition for Fy-21: Ch.5-Sales Projection
53
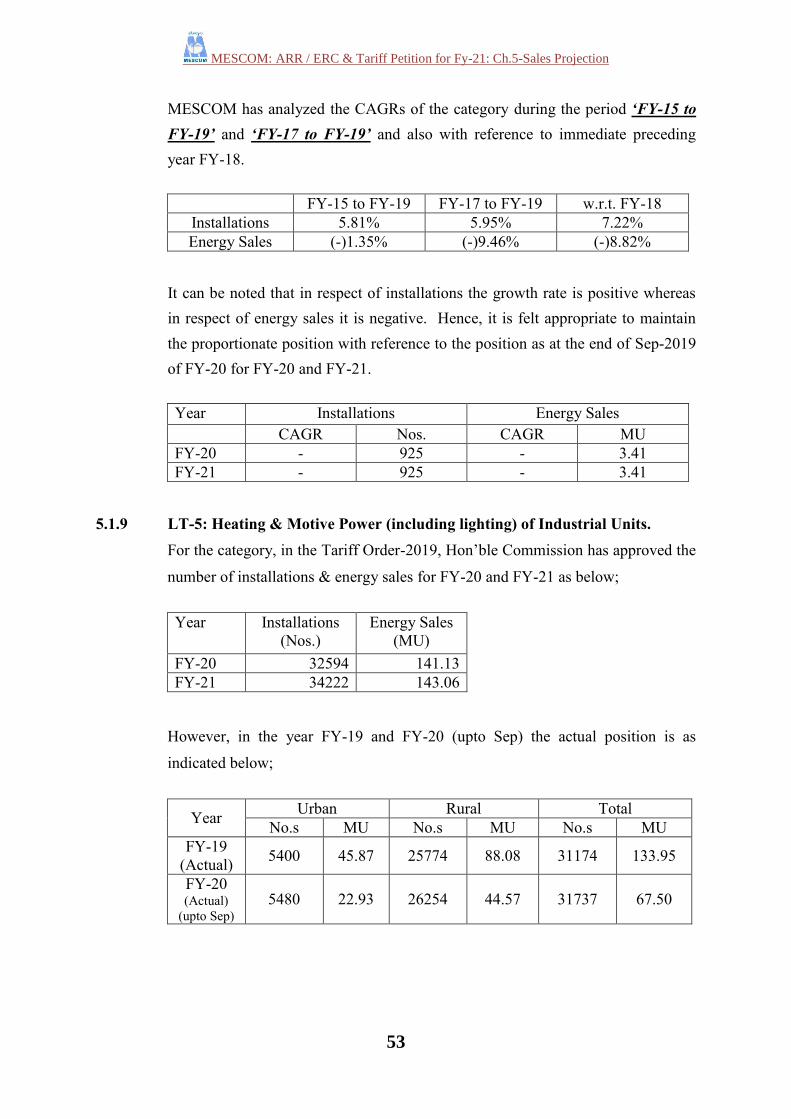
MESCOM has analyzed the CAGRs of the category during the period ‘FY-15 to
FY-19’ and ‘FY-17 to FY-19’ and also with reference to immediate preceding
year FY-18.
FY-15 to FY-19 FY-17 to FY-19 w.r.t. FY-18
Installations 5.81% 5.95% 7.22%
Energy Sales (-)1.35% (-)9.46% (-)8.82%
It can be noted that in respect of installations the growth rate is positive whereas
in respect of energy sales it is negative. Hence, it is felt appropriate to maintain
the proportionate position with reference to the position as at the end of Sep-2019
of FY-20 for FY-20 and FY-21.
Year Installations Energy Sales
CAGR Nos. CAGR MU
FY-20 - 925 - 3.41
FY-21 - 925 - 3.41
5.1.9 LT-5: Heating & Motive Power (including lighting) of Industrial Units.
For the category, in the Tariff Order-2019, Hon’ble Commission has approved the
number of installations & energy sales for FY-20 and FY-21 as below;
Year Installations
(Nos.)
Energy Sales
(MU)
FY-20 32594 141.13
FY-21 34222 143.06
However, in the year FY-19 and FY-20 (upto Sep) the actual position is as
indicated below;
Year Urban Rural Total
No.s MU No.s MU No.s MU
FY-19
(Actual) 5400 45.87 25774 88.08 31174 133.95
FY-20 (Actual)
(upto Sep) 5480 22.93 26254 44.57 31737 67.50
MESCOM: ARR / ERC & Tariff Petition for Fy-21: Ch.5-Sales Projection
54
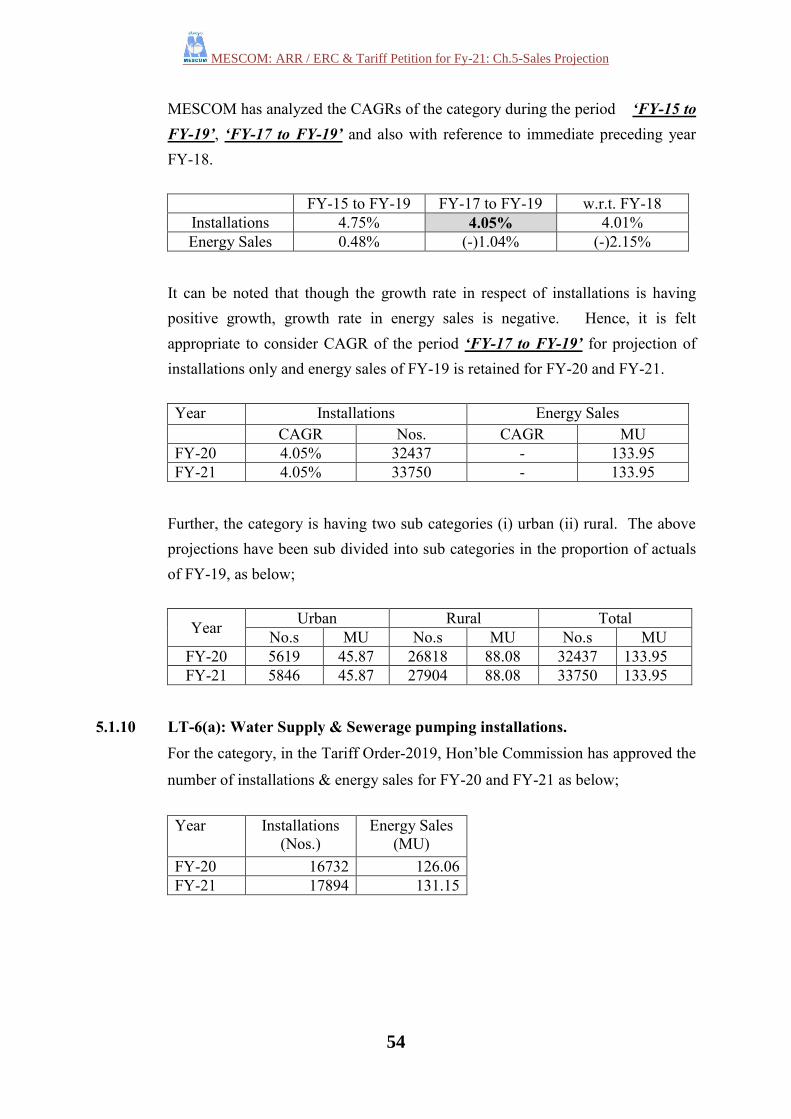
MESCOM has analyzed the CAGRs of the category during the period ‘FY-15 to
FY-19’, ‘FY-17 to FY-19’ and also with reference to immediate preceding year
FY-18.
FY-15 to FY-19 FY-17 to FY-19 w.r.t. FY-18
Installations 4.75% 4.05% 4.01%
Energy Sales 0.48% (-)1.04% (-)2.15%
It can be noted that though the growth rate in respect of installations is having
positive growth, growth rate in energy sales is negative. Hence, it is felt
appropriate to consider CAGR of the period ‘FY-17 to FY-19’ for projection of
installations only and energy sales of FY-19 is retained for FY-20 and FY-21.
Year Installations Energy Sales
CAGR Nos. CAGR MU
FY-20 4.05% 32437 - 133.95
FY-21 4.05% 33750 - 133.95
Further, the category is having two sub categories (i) urban (ii) rural. The above
projections have been sub divided into sub categories in the proportion of actuals
of FY-19, as below;
Year Urban Rural Total
No.s MU No.s MU No.s MU
FY-20 5619 45.87 26818 88.08 32437 133.95
FY-21 5846 45.87 27904 88.08 33750 133.95
5.1.10 LT-6(a): Water Supply & Sewerage pumping installations.
For the category, in the Tariff Order-2019, Hon’ble Commission has approved the
number of installations & energy sales for FY-20 and FY-21 as below;
Year Installations
(Nos.)
Energy Sales
(MU)
FY-20 16732 126.06
FY-21 17894 131.15
MESCOM: ARR / ERC & Tariff Petition for Fy-21: Ch.5-Sales Projection
55
However, in the year FY-19 and FY-20 (upto Sep) the actual position is as
indicated below;
Year Installations
(Nos.)
Energy Sales
(MU)
FY-19
(Actual) 15391 123.02
FY-20 (Actual)
(upto Sep) 15717 63.60
MESCOM has analyzed the CAGRs of the category during the period ‘FY-15 to
FY-19’, ‘FY-17 to FY-19’ and also with reference to immediate preceding year
FY-18.
FY-15 to FY-19 FY-17 to FY-19 w.r.t. FY-18
Installations 6.02% 6.07% 3.57%
Energy Sales 3.40% 1.03% 3.52%
With careful analysis, it is felt appropriate to consider CAGR of the period ‘FY-17
to FY-19’ for projection of both installations and energy sales for FY-20 and FY-
21.
Year Installations Energy Sales
CAGR Nos. CAGR MU
FY-20 6.07% 16325 1.03% 124.29
FY-21 6.07% 17316 1.03% 125.57
5.1.11 LT-6(b): Public Street Lights.
For the category, in the Tariff Order-2019, Hon’ble Commission has approved the
number of installations & energy sales for FY-20 and FY-21 as below;
Year Installations
(Nos.)
Energy Sales
(MU)
FY-20 23433 72.34
FY-21 25381 75.18
MESCOM: ARR / ERC & Tariff Petition for Fy-21: Ch.5-Sales Projection
56
However, in the year FY-19 and FY-20 (upto Sep) the actual position is as
indicated below;
Year Installations
(Nos.)
Energy Sales
(MU)
FY-19
(Actual) 21621 69.82
FY-20 (Actual)
(upto Sep) 23269 32.45
MESCOM has analyzed the CAGRs of the category during the period ‘FY-15 to
FY-19’, ‘FY-17 to FY-19’ and also with reference to immediate preceding year
FY-18.
FY-15 to FY-19 FY-17 to FY-19 w.r.t. FY-18
Installations 7.59% 4.83% 3.67%
Energy Sales 4.66% 0.32% 2.63%
With careful analysis, it is felt appropriate to consider CAGR of the period ‘FY-17
to FY-19’ for projection of both installations and energy sales for FY-20 and
FY-21.
Year Installations Energy Sales
CAGR Nos. CAGR MU
FY-20 4.83% 22665 0.32% 70.04
FY-21 4.83% 23760 0.32% 70.26
5.1.12 LT-7: Temporary Power Supply of all categories including Hoarding &
Advertisement boards.
For the category, in the Tariff Order-2019, Hon’ble Commission has approved the
number of installations & energy sales for FY-20 and FY-21 as below;
Year Installations
(Nos.)
Energy Sales
(MU)
FY-20 16430 20.41
FY-21 16431 20.41
MESCOM: ARR / ERC & Tariff Petition for Fy-21: Ch.5-Sales Projection
57
However, in the year FY-19 and FY-20 (upto Sep) the actual position is as
indicated below;
Year LT-7a LT-7b Total
No.s MU No.s MU No.s MU
FY-19
(Actual) 16379 19.56 717 0.85 17096 20.41
FY-20 (Actual)
(upto Sep) 15746 9.78 705 0.37 16451 10.15
As can be noted from the above table, being the temporary nature of usage, the
growth rate is inconsistent. Hence, it is felt appropriate to retain both installations
and energy sales as recorded in FY-19 for FY-20 and FY-21 also.
Year LT-7a LT-7b Total
No.s MU No.s MU No.s MU
FY-20 16379 19.56 717 0.85 17096 20.41
FY-21 16379 19.56 717 0.85 17096 20.41
5.1.13 HT-1: Water Supply, Drainage / Sewerage water treatment plant and
Sewerage pumping installations.
For the category, in the Tariff Order-2019, Hon’ble Commission has approved the
number of installations & energy sales for FY-20 and FY-21 as below;
Year Installations
(Nos.)
Energy Sales
(MU)
FY-20 118 99.38
FY-21 133 102.16
However, in the year FY-19 and FY-20 (upto Sep) the actual position is as
indicated below;
Year Installations
(Nos.)
Energy Sales
(MU)
FY-19
(Actual) 104 97.81
FY-20 (Actual)
(upto Sep) 109 45.80
MESCOM: ARR / ERC & Tariff Petition for Fy-21: Ch.5-Sales Projection
58
MESCOM has analyzed the CAGRs of the category during the period ‘FY-15 to
FY-19’, ‘FY-17 to FY-19’ and also with reference to immediate preceding year
FY-18.
FY-15 to FY-19 FY-17 to FY-19 w.r.t. FY-18
Installations 10.40% 8.71% 4.00%
Energy Sales 4.08% 6.39% 8.03%
With careful analysis, it is felt appropriate to consider CAGR of the period ‘FY-17
to FY-19’ for projection of both installations and energy sales for FY-20 and
FY-21.
Year Installations Energy Sales
CAGR Nos. CAGR MU
FY-20 8.71% 113 6.39% 104.06
FY-21 8.71% 123 6.39% 110.71
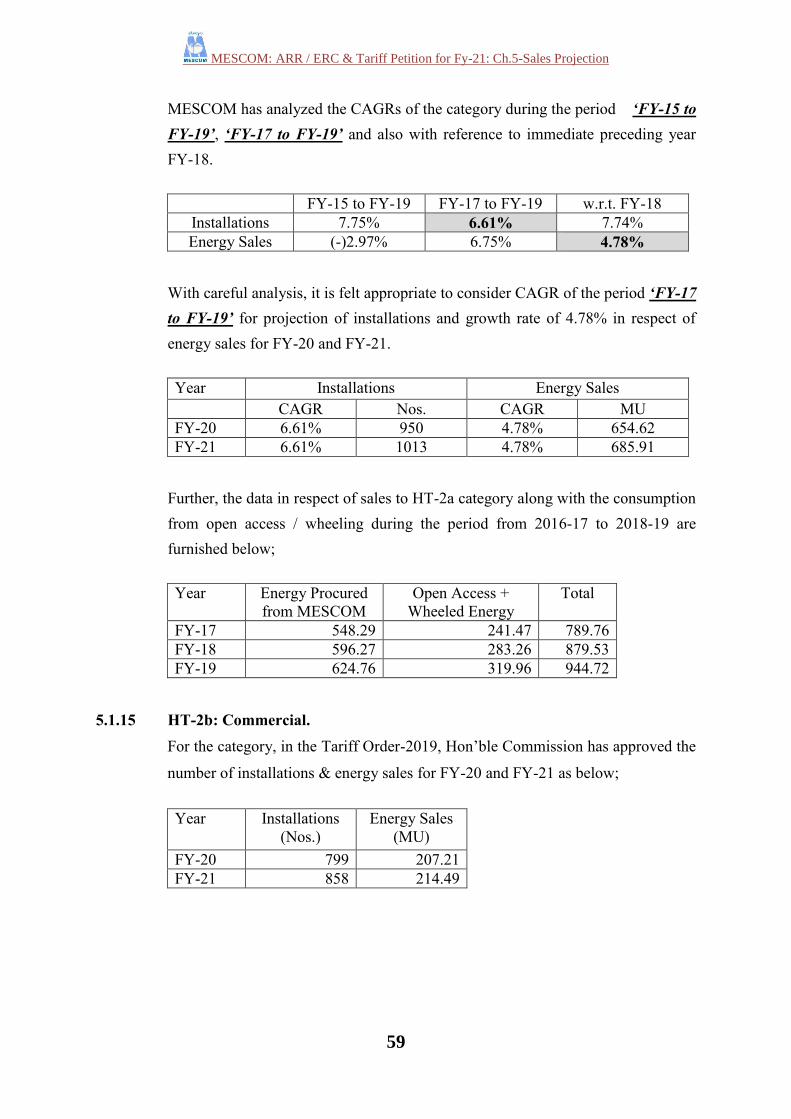
5.1.14 HT-2a: Industries.
For the category, in the Tariff Order-2019, Hon’ble Commission has approved the
number of installations & energy sales for FY-20 and FY-21 as below;
Year Installations
(Nos.)
Energy Sales
(MU)
FY-20 943 606.33
FY-21 1007 590.51
However, in the year FY-19 and FY-20 (upto Sep) the actual position is as
indicated below;
Year Installations
(Nos.)
Energy Sales
(MU)
FY-19
(Actual) 891 624.76(*)
FY-20 (Actual)
(upto Sep) 921 304.88(**)
(*) SEZ Consumption 41.94 MU excluded.
(**)SEZ Consumption 24.06 MU excluded
MESCOM: ARR / ERC & Tariff Petition for Fy-21: Ch.5-Sales Projection
59
MESCOM has analyzed the CAGRs of the category during the period ‘FY-15 to
FY-19’, ‘FY-17 to FY-19’ and also with reference to immediate preceding year
FY-18.
FY-15 to FY-19 FY-17 to FY-19 w.r.t. FY-18
Installations 7.75% 6.61% 7.74%
Energy Sales (-)2.97% 6.75% 4.78%
With careful analysis, it is felt appropriate to consider CAGR of the period ‘FY-17
to FY-19’ for projection of installations and growth rate of 4.78% in respect of
energy sales for FY-20 and FY-21.
Year Installations Energy Sales
CAGR Nos. CAGR MU
FY-20 6.61% 950 4.78% 654.62
FY-21 6.61% 1013 4.78% 685.91
Further, the data in respect of sales to HT-2a category along with the consumption
from open access / wheeling during the period from 2016-17 to 2018-19 are
furnished below;
Year Energy Procured
from MESCOM
Open Access +
Wheeled Energy
Total
FY-17 548.29 241.47 789.76
FY-18 596.27 283.26 879.53
FY-19 624.76 319.96 944.72
5.1.15 HT-2b: Commercial.
For the category, in the Tariff Order-2019, Hon’ble Commission has approved the
number of installations & energy sales for FY-20 and FY-21 as below;
Year Installations
(Nos.)
Energy Sales
(MU)
FY-20 799 207.21
FY-21 858 214.49
MESCOM: ARR / ERC & Tariff Petition for Fy-21: Ch.5-Sales Projection
60
However, in the year FY-19 and FY-20 (upto Sep) the actual position is as
indicated below;
Year Installations
(Nos.)
Energy Sales
(MU)
FY-19
(Actual) 735 200.43
FY-20 (Actual)
(upto Sep) 757 104.90
MESCOM has analyzed the CAGRs of the category during the period ‘FY-15 to
FY-19’, ‘FY-17 to FY-19’ and also with reference to immediate preceding year
FY-18.
FY-15 to FY-19 FY-17 to FY-19 w.r.t. FY-18
Installations 8.06% 8.53% 6.06%
Energy Sales 6.83% 3.79% 3.76%
It can be noted that though the growth in installations and energy sales with
reference to immediate preceding year is lesser compared to CAGR of the period
‘FY-15 to FY-19’ and ‘FY-17 to FY-19’. Hence, it is felt appropriate to consider
CAGR of the period ‘FY-17 to FY-19’ for projection of both installations and
energy sales for FY-20 and FY-21.
Year Installations Energy Sales
CAGR Nos. CAGR MU
FY-20 8.53% 799 3.79% 208.03
FY-21 8.53% 866 3.79% 215.91
Further, the data in respect of sales to HT-2b category along with the consumption
from open access / wheeling during the period from 2016-17 to 2018-19 are
furnished below;
Year Energy Procured
from MESCOM
Open Access +
Wheeled Energy
Total
FY-17 186.06 - 186.06
FY-18 193.17 3.41 196.58
FY-19 200.43 3.82 204.25
MESCOM: ARR / ERC & Tariff Petition for Fy-21: Ch.5-Sales Projection
61
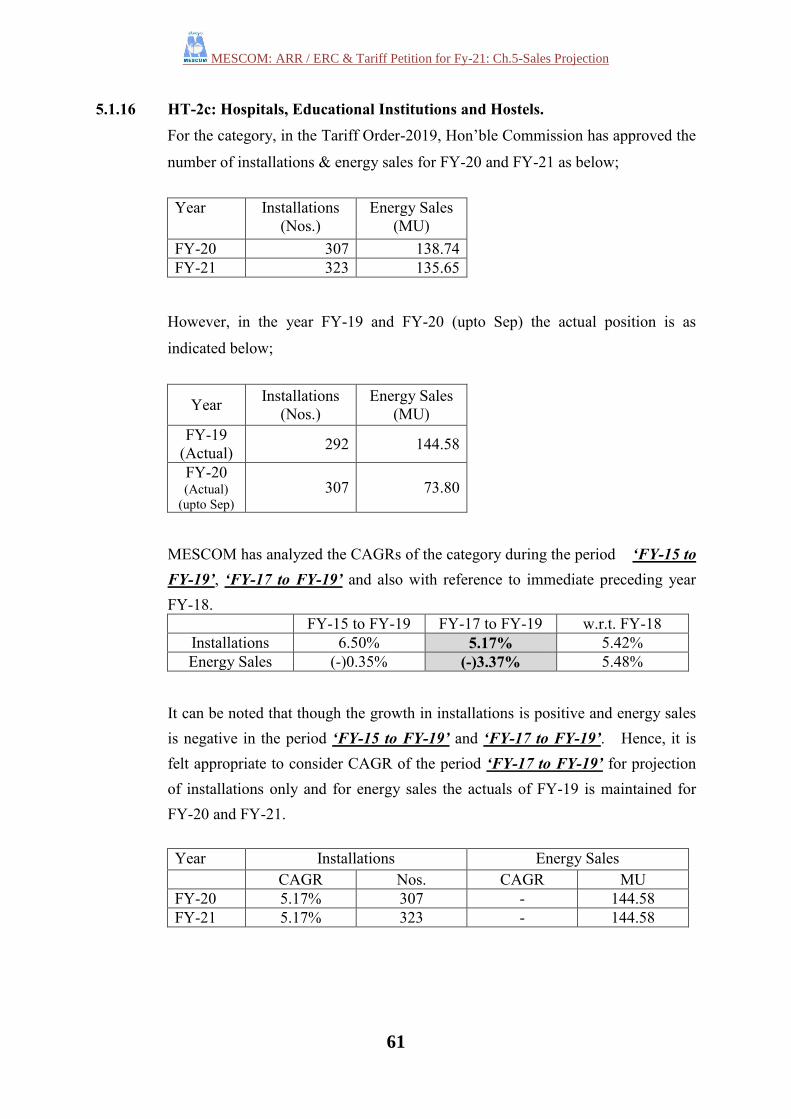
5.1.16 HT-2c: Hospitals, Educational Institutions and Hostels.
For the category, in the Tariff Order-2019, Hon’ble Commission has approved the
number of installations & energy sales for FY-20 and FY-21 as below;
Year Installations
(Nos.)
Energy Sales
(MU)
FY-20 307 138.74
FY-21 323 135.65
However, in the year FY-19 and FY-20 (upto Sep) the actual position is as
indicated below;
Year Installations
(Nos.)
Energy Sales
(MU)
FY-19
(Actual) 292 144.58
FY-20 (Actual)
(upto Sep) 307 73.80
MESCOM has analyzed the CAGRs of the category during the period ‘FY-15 to
FY-19’, ‘FY-17 to FY-19’ and also with reference to immediate preceding year
FY-18.
FY-15 to FY-19 FY-17 to FY-19 w.r.t. FY-18
Installations 6.50% 5.17% 5.42%
Energy Sales (-)0.35% (-)3.37% 5.48%
It can be noted that though the growth in installations is positive and energy sales
is negative in the period ‘FY-15 to FY-19’ and ‘FY-17 to FY-19’. Hence, it is
felt appropriate to consider CAGR of the period ‘FY-17 to FY-19’ for projection
of installations only and for energy sales the actuals of FY-19 is maintained for
FY-20 and FY-21.
Year Installations Energy Sales
CAGR Nos. CAGR MU
FY-20 5.17% 307 - 144.58
FY-21 5.17% 323 - 144.58
MESCOM: ARR / ERC & Tariff Petition for Fy-21: Ch.5-Sales Projection
62
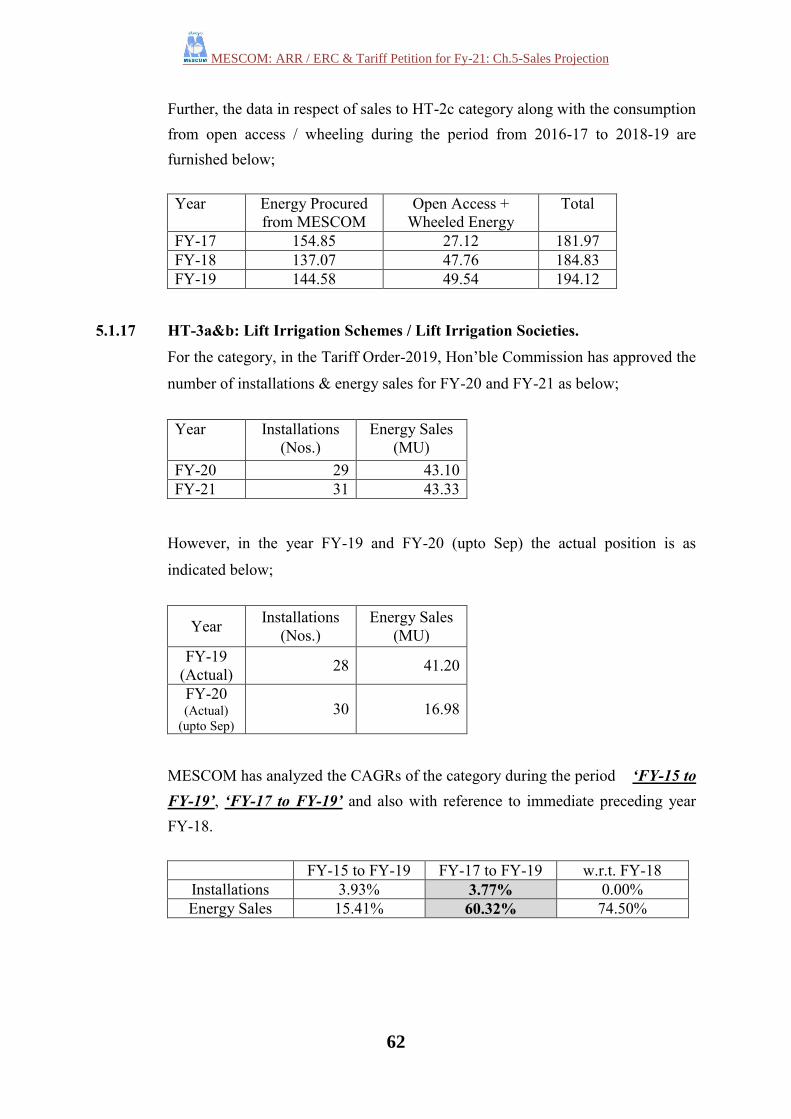
Further, the data in respect of sales to HT-2c category along with the consumption
from open access / wheeling during the period from 2016-17 to 2018-19 are
furnished below;
Year Energy Procured
from MESCOM
Open Access +
Wheeled Energy
Total
FY-17 154.85 27.12 181.97
FY-18 137.07 47.76 184.83
FY-19 144.58 49.54 194.12
5.1.17 HT-3a&b: Lift Irrigation Schemes / Lift Irrigation Societies.
For the category, in the Tariff Order-2019, Hon’ble Commission has approved the
number of installations & energy sales for FY-20 and FY-21 as below;
Year Installations
(Nos.)
Energy Sales
(MU)
FY-20 29 43.10
FY-21 31 43.33
However, in the year FY-19 and FY-20 (upto Sep) the actual position is as
indicated below;
Year Installations
(Nos.)
Energy Sales
(MU)
FY-19
(Actual) 28 41.20
FY-20 (Actual)
(upto Sep) 30 16.98
MESCOM has analyzed the CAGRs of the category during the period ‘FY-15 to
FY-19’, ‘FY-17 to FY-19’ and also with reference to immediate preceding year
FY-18.
FY-15 to FY-19 FY-17 to FY-19 w.r.t. FY-18
Installations 3.93% 3.77% 0.00%
Energy Sales 15.41% 60.32% 74.50%
MESCOM: ARR / ERC & Tariff Petition for Fy-21: Ch.5-Sales Projection
63
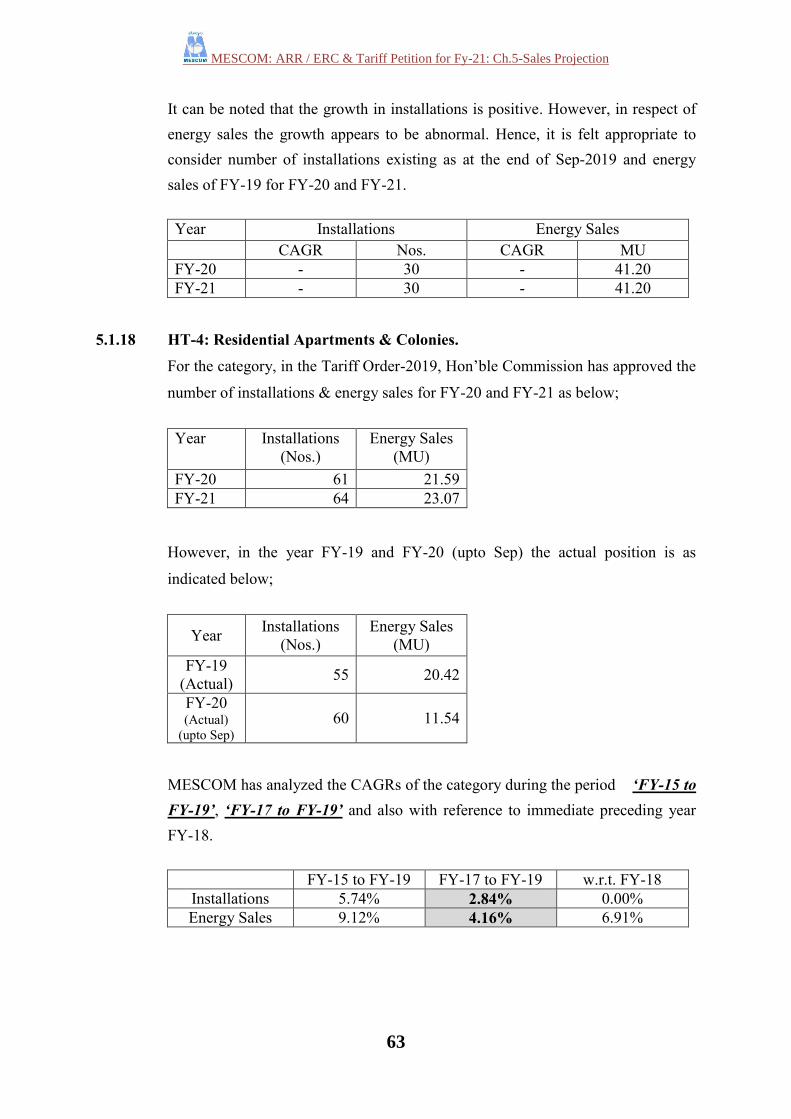
It can be noted that the growth in installations is positive. However, in respect of
energy sales the growth appears to be abnormal. Hence, it is felt appropriate to
consider number of installations existing as at the end of Sep-2019 and energy
sales of FY-19 for FY-20 and FY-21.
Year Installations Energy Sales
CAGR Nos. CAGR MU
FY-20 - 30 - 41.20
FY-21 - 30 - 41.20
5.1.18 HT-4: Residential Apartments & Colonies.
For the category, in the Tariff Order-2019, Hon’ble Commission has approved the
number of installations & energy sales for FY-20 and FY-21 as below;
Year Installations
(Nos.)
Energy Sales
(MU)
FY-20 61 21.59
FY-21 64 23.07
However, in the year FY-19 and FY-20 (upto Sep) the actual position is as
indicated below;
Year Installations
(Nos.)
Energy Sales
(MU)
FY-19
(Actual) 55 20.42
FY-20 (Actual)
(upto Sep) 60 11.54
MESCOM has analyzed the CAGRs of the category during the period ‘FY-15 to
FY-19’, ‘FY-17 to FY-19’ and also with reference to immediate preceding year
FY-18.
FY-15 to FY-19 FY-17 to FY-19 w.r.t. FY-18
Installations 5.74% 2.84% 0.00%
Energy Sales 9.12% 4.16% 6.91%
MESCOM: ARR / ERC & Tariff Petition for Fy-21: Ch.5-Sales Projection
64
It can be noted that the addition in number of installations during FY-20 (upto
Sep-19) is comparatively higher. Hence, it is felt appropriate to maintain the
number of installations existing as at the end of Sep-19 for FY-20 and FY-21 and
for projection of energy sales CAGR of the period ‘FY-17 to FY-19’ is
considered.
Year Installations Energy Sales
CAGR Nos. CAGR MU
FY-20 - 60 4.16% 21.27
FY-21 - 60 4.16% 22.15
5.1.19 HT-5: Temporary Supply.
For the category, in the Tariff Order-2019, Hon’ble Commission has approved the
number of installations & energy sales for FY-20 and FY-21 as below;
Year Installations
(Nos.)
Energy Sales
(MU)
FY-20 14 5.96
FY-21 14 5.96
However, in the year FY-19 and FY-20 (upto Sep) the actual position is as
indicated below;
Year Installations
(Nos.)
Energy Sales
(MU)
FY-19
(Actual) 17 1.73
FY-20 (Actual)
(upto Sep) 16 1.45
MESCOM: ARR / ERC & Tariff Petition for Fy-21: Ch.5-Sales Projection
65
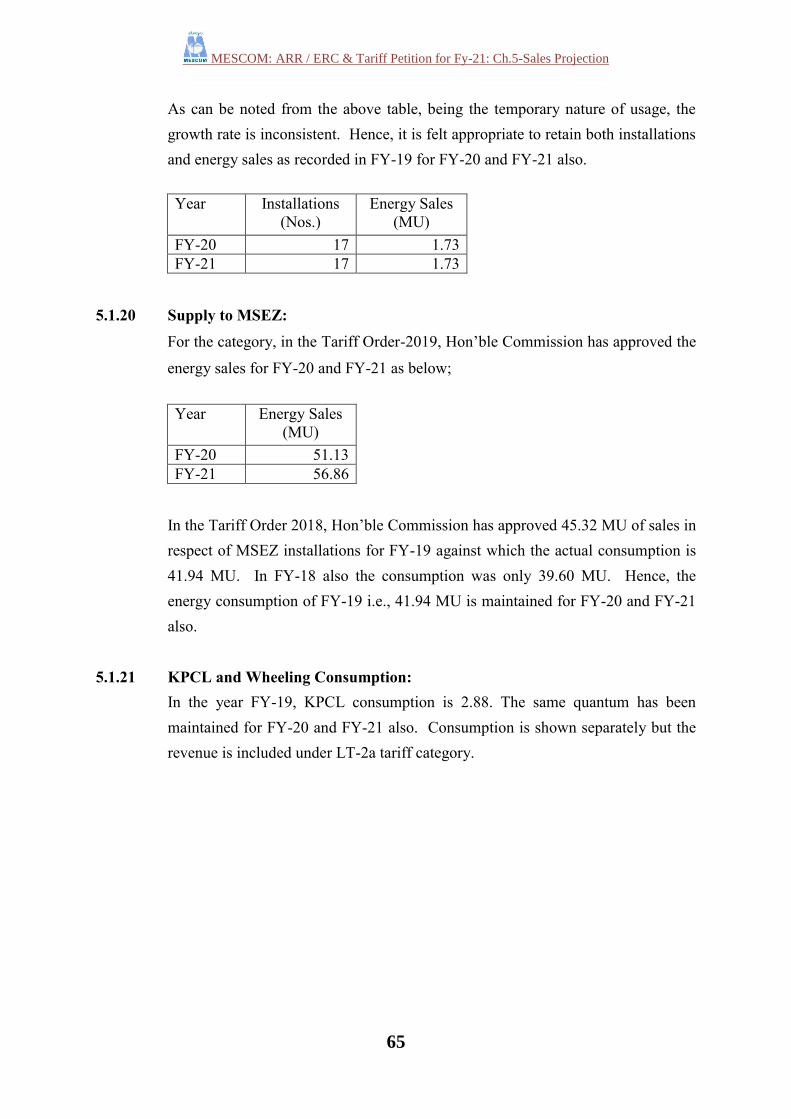
As can be noted from the above table, being the temporary nature of usage, the
growth rate is inconsistent. Hence, it is felt appropriate to retain both installations
and energy sales as recorded in FY-19 for FY-20 and FY-21 also.
Year Installations
(Nos.)
Energy Sales
(MU)
FY-20 17 1.73
FY-21 17 1.73
5.1.20 Supply to MSEZ:
For the category, in the Tariff Order-2019, Hon’ble Commission has approved the
energy sales for FY-20 and FY-21 as below;
Year Energy Sales
(MU)
FY-20 51.13
FY-21 56.86
In the Tariff Order 2018, Hon’ble Commission has approved 45.32 MU of sales in
respect of MSEZ installations for FY-19 against which the actual consumption is
41.94 MU. In FY-18 also the consumption was only 39.60 MU. Hence, the
energy consumption of FY-19 i.e., 41.94 MU is maintained for FY-20 and FY-21
also.
5.1.21 KPCL and Wheeling Consumption:
In the year FY-19, KPCL consumption is 2.88. The same quantum has been
maintained for FY-20 and FY-21 also. Consumption is shown separately but the
revenue is included under LT-2a tariff category.
MESCOM: ARR / ERC & Tariff Petition for Fy-21: Ch.5-Sales Projection
66
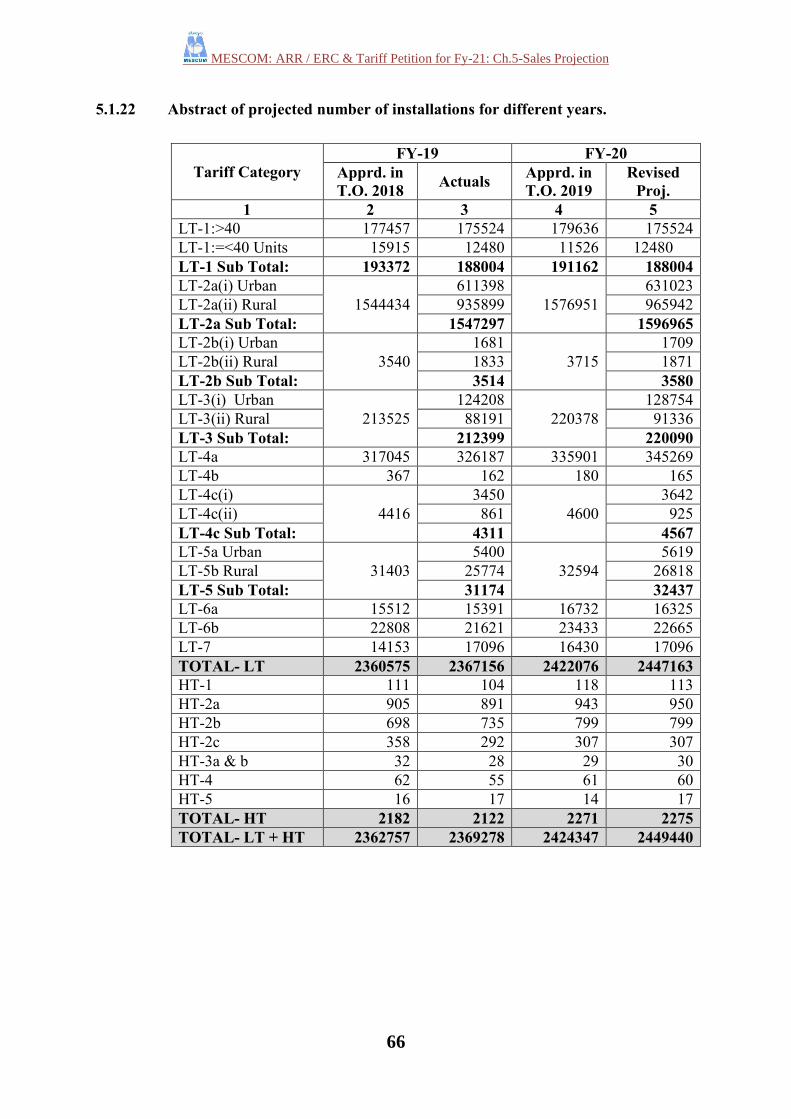
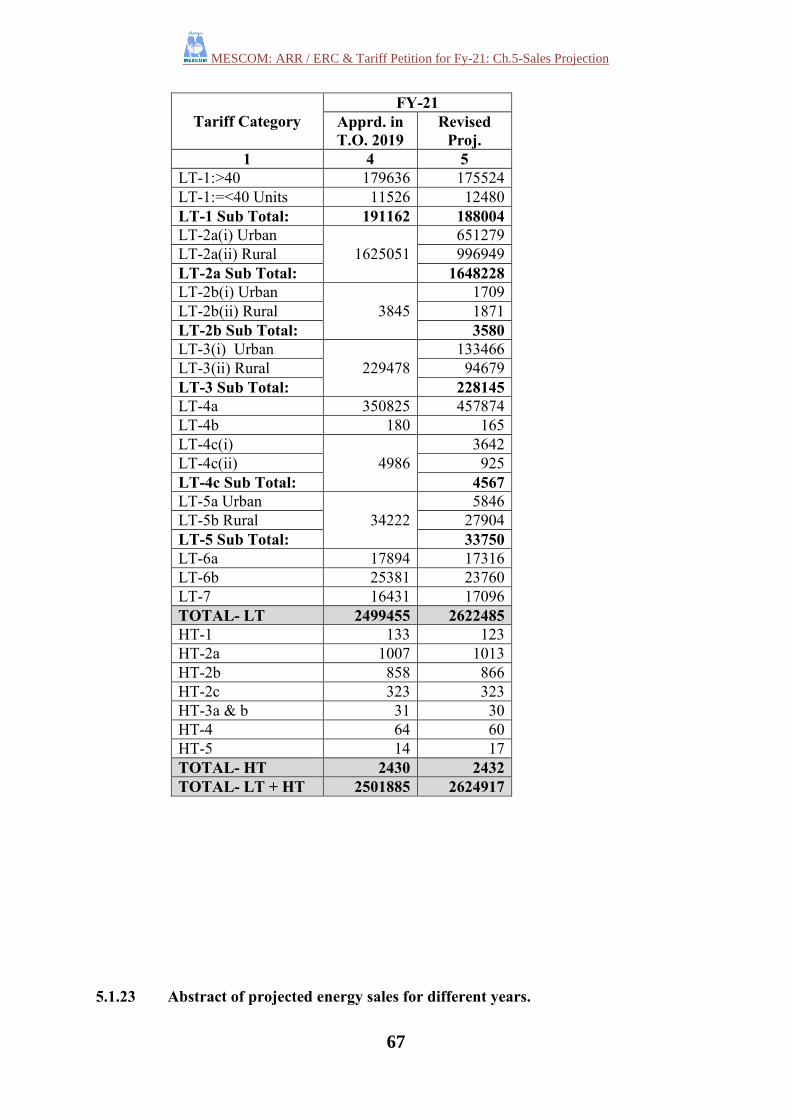
5.1.22 Abstract of projected number of installations for different years.
Tariff Category
FY-19 FY-20
Apprd. in
T.O. 2018 Actuals
Apprd. in
T.O. 2019
Revised
Proj.
1 2 3 4 5
LT-1:>40 177457 175524 179636 175524
LT-1:=<40 Units 15915 12480 11526 12480
LT-1 Sub Total: 193372 188004 191162 188004
LT-2a(i) Urban
1544434
611398
1576951
631023
LT-2a(ii) Rural 935899 965942
LT-2a Sub Total: 1547297 1596965
LT-2b(i) Urban
3540
1681
3715
1709
LT-2b(ii) Rural 1833 1871
LT-2b Sub Total: 3514 3580
LT-3(i) Urban
213525
124208
220378
128754
LT-3(ii) Rural 88191 91336
LT-3 Sub Total: 212399 220090
LT-4a 317045 326187 335901 345269
LT-4b 367 162 180 165
LT-4c(i)
4416
3450
4600
3642
LT-4c(ii) 861 925
LT-4c Sub Total: 4311 4567
LT-5a Urban
31403
5400
32594
5619
LT-5b Rural 25774 26818
LT-5 Sub Total: 31174 32437
LT-6a 15512 15391 16732 16325
LT-6b 22808 21621 23433 22665
LT-7 14153 17096 16430 17096
TOTAL- LT 2360575 2367156 2422076 2447163
HT-1 111 104 118 113
HT-2a 905 891 943 950
HT-2b 698 735 799 799
HT-2c 358 292 307 307
HT-3a & b 32 28 29 30
HT-4 62 55 61 60
HT-5 16 17 14 17
TOTAL- HT 2182 2122 2271 2275
TOTAL- LT + HT 2362757 2369278 2424347 2449440
MESCOM: ARR / ERC & Tariff Petition for Fy-21: Ch.5-Sales Projection
67
Tariff Category
FY-21
Apprd. in
T.O. 2019
Revised
Proj.
1 4 5
LT-1:>40 179636 175524
LT-1:=<40 Units 11526 12480
LT-1 Sub Total: 191162 188004
LT-2a(i) Urban
1625051
651279
LT-2a(ii) Rural 996949
LT-2a Sub Total: 1648228
LT-2b(i) Urban
3845
1709
LT-2b(ii) Rural 1871
LT-2b Sub Total: 3580
LT-3(i) Urban
229478
133466
LT-3(ii) Rural 94679
LT-3 Sub Total: 228145
LT-4a 350825 457874
LT-4b 180 165
LT-4c(i)
4986
3642
LT-4c(ii) 925
LT-4c Sub Total: 4567
LT-5a Urban
34222
5846
LT-5b Rural 27904
LT-5 Sub Total: 33750
LT-6a 17894 17316
LT-6b 25381 23760
LT-7 16431 17096
TOTAL- LT 2499455 2622485
HT-1 133 123
HT-2a 1007 1013
HT-2b 858 866
HT-2c 323 323
HT-3a & b 31 30
HT-4 64 60
HT-5 14 17
TOTAL- HT 2430 2432
TOTAL- LT + HT 2501885 2624917
5.1.23 Abstract of projected energy sales for different years.
MESCOM: ARR / ERC & Tariff Petition for Fy-21: Ch.5-Sales Projection
68
(MU)
Tariff Category
FY-19 FY-20
Apprd. In
T.O. 2018 Actuals
Apprd. In
T.O. 2019
Revised
Proj.
1 2 3 4 5
LT-1:>40 units 14.08 37.29 34.21 37.29
LT-1:=40 Units 33.23 12.08 12.60 12.08
LT-1 Sub Total: 47.31 49.37 46.81 49.37
LT-2a(i) Urban
1406.98
721.91
1436.69
741.11
LT-2a(ii) Rural 640.07 657.10
LT-2a Sub Total: 1361.98 1398.21
LT-2b(i) Urban
14.80
7.94
15.18
8.52
LT-2b(ii) Rural 5.68 5.72
LT-2b Sub Total: 13.62 14.24
LT-3(i) Urban
375.73
240.67
390.69
250.30
LT-3(ii) Rural 129.63 134.81
LT-3 Sub Total: 370.30 385.11
LT-4a 1381.08 1630.90 1669.16 1732.02
LT-4b 1.81 0.85 0.93 0.85
LT-4c(i)
9.69
3.50
8.81
3.50
LT-4c(ii) 3.41 3.41
LT-4c Sub Total: 6.91 6.91
LT-5a Urban
143.13
45.87
141.13
45.87
LT-5b Rural 88.08 88.08
LT-5 Sub Total: 133.95 133.95
LT-6a 131.39 123.02 126.06 124.29
LT-6b 73.72 69.82 72.34 70.04
LT-7 19.40 20.41 20.41 20.41
TOTAL- LT 3605.04 3781.13 3928.21 3935.40
HT-1 90.54 97.81 99.38 104.06
HT-2a 616.10 624.76 606.33 654.62
HT-2b 198.66 200.43 207.21 208.03
HT-2c 172.35 144.58 138.74 144.58
HT-3a & b 19.93 41.20 43.10 41.20
HT-4 21.11 20.42 21.59 21.27
HT-5 5.50 1.73 5.96 1.73
TOTAL- HT 1124.19 1130.93 1122.31 1175.49
MSEZ Supply 45.32 41.94 51.13 41.94
KPCL
Consumption 5.89 2.88 - 2.88
TOTAL- LT + HT 4780.44 4956.88 5101.65 5155.71
Tariff Category FY-21
Apprd. In Revised
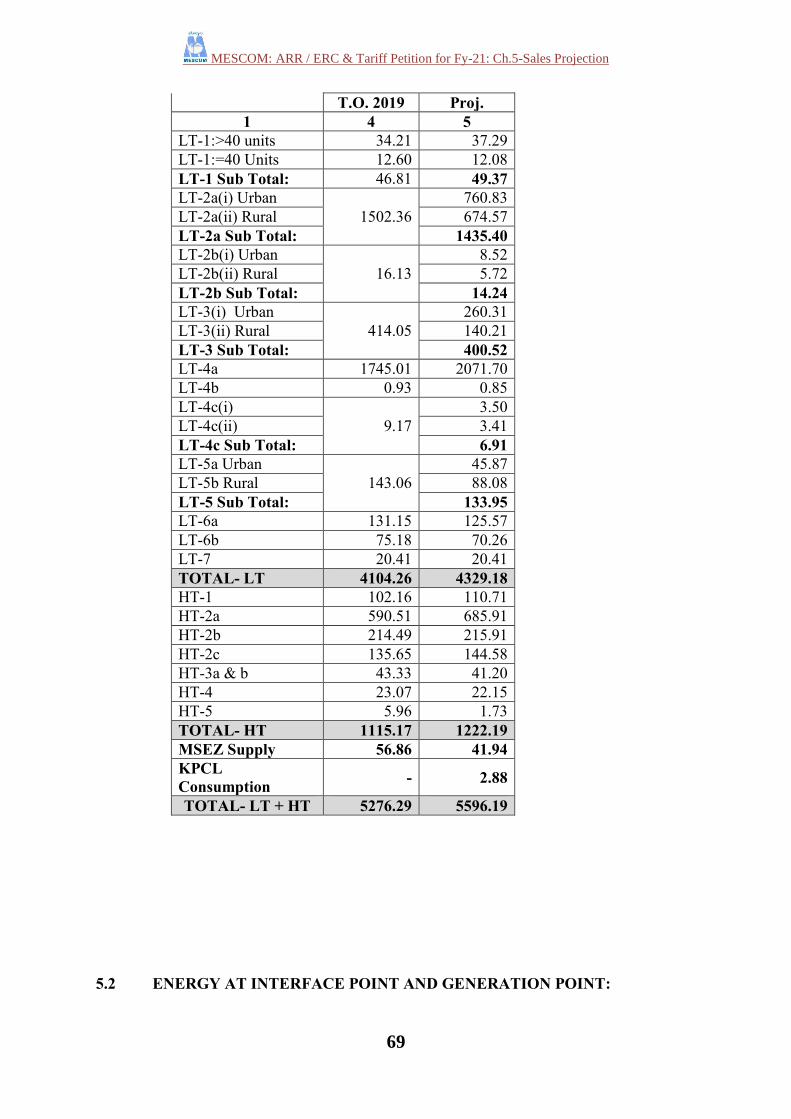
MESCOM: ARR / ERC & Tariff Petition for Fy-21: Ch.5-Sales Projection
69
T.O. 2019 Proj.
1 4 5
LT-1:>40 units 34.21 37.29
LT-1:=40 Units 12.60 12.08
LT-1 Sub Total: 46.81 49.37
LT-2a(i) Urban
1502.36
760.83
LT-2a(ii) Rural 674.57
LT-2a Sub Total: 1435.40
LT-2b(i) Urban
16.13
8.52
LT-2b(ii) Rural 5.72
LT-2b Sub Total: 14.24
LT-3(i) Urban
414.05
260.31
LT-3(ii) Rural 140.21
LT-3 Sub Total: 400.52
LT-4a 1745.01 2071.70
LT-4b 0.93 0.85
LT-4c(i)
9.17
3.50
LT-4c(ii) 3.41
LT-4c Sub Total: 6.91
LT-5a Urban
143.06
45.87
LT-5b Rural 88.08
LT-5 Sub Total: 133.95
LT-6a 131.15 125.57
LT-6b 75.18 70.26
LT-7 20.41 20.41
TOTAL- LT 4104.26 4329.18
HT-1 102.16 110.71
HT-2a 590.51 685.91
HT-2b 214.49 215.91
HT-2c 135.65 144.58
HT-3a & b 43.33 41.20
HT-4 23.07 22.15
HT-5 5.96 1.73
TOTAL- HT 1115.17 1222.19
MSEZ Supply 56.86 41.94
KPCL
Consumption - 2.88
TOTAL- LT + HT 5276.29 5596.19
5.2 ENERGY AT INTERFACE POINT AND GENERATION POINT:
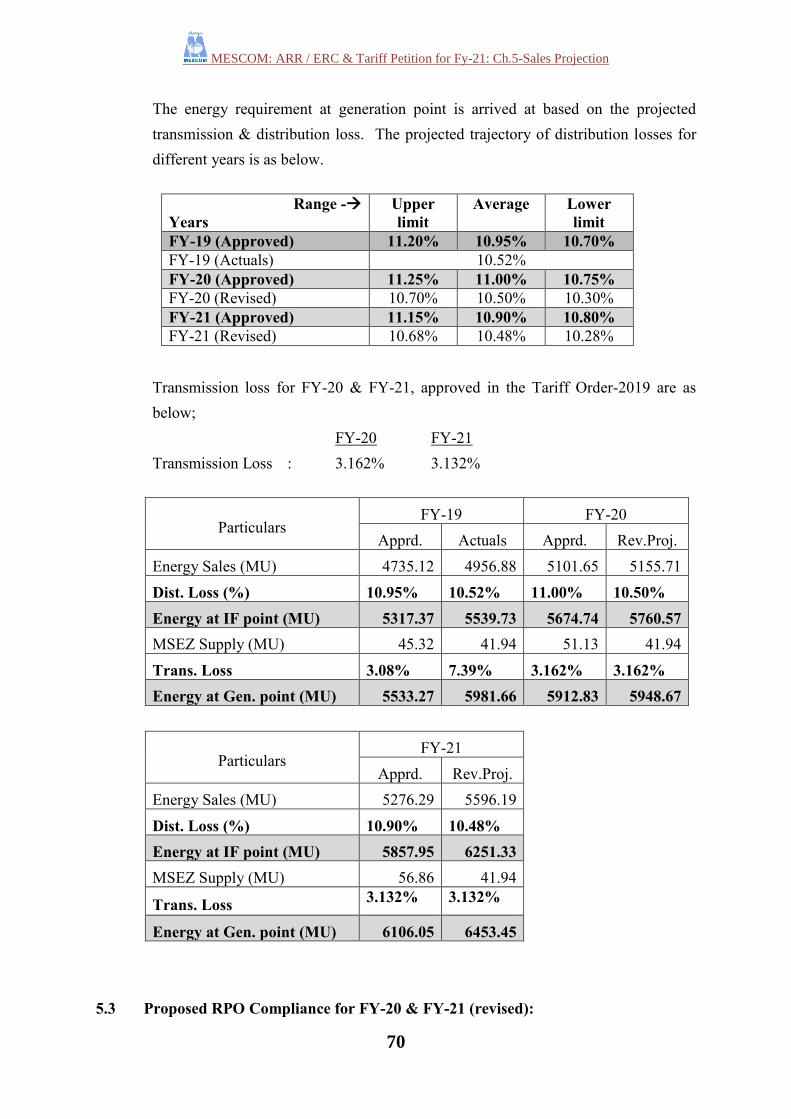
MESCOM: ARR / ERC & Tariff Petition for Fy-21: Ch.5-Sales Projection
70
The energy requirement at generation point is arrived at based on the projected
transmission & distribution loss. The projected trajectory of distribution losses for
different years is as below.
Range -
Years
Upper
limit
Average Lower
limit
FY-19 (Approved) 11.20% 10.95% 10.70%
FY-19 (Actuals) 10.52%
FY-20 (Approved) 11.25% 11.00% 10.75%
FY-20 (Revised) 10.70% 10.50% 10.30%
FY-21 (Approved) 11.15% 10.90% 10.80%
FY-21 (Revised) 10.68% 10.48% 10.28%
Transmission loss for FY-20 & FY-21, approved in the Tariff Order-2019 are as
below;
FY-20 FY-21
Transmission Loss : 3.162% 3.132%
Particulars FY-19 FY-20
Apprd. Actuals Apprd. Rev.Proj.
Energy Sales (MU) 4735.12 4956.88 5101.65 5155.71
Dist. Loss (%) 10.95% 10.52% 11.00% 10.50%
Energy at IF point (MU) 5317.37 5539.73 5674.74 5760.57
MSEZ Supply (MU) 45.32 41.94 51.13 41.94
Trans. Loss 3.08% 7.39% 3.162% 3.162%
Energy at Gen. point (MU) 5533.27 5981.66 5912.83 5948.67
Particulars FY-21
Apprd. Rev.Proj.
Energy Sales (MU) 5276.29 5596.19
Dist. Loss (%) 10.90% 10.48%
Energy at IF point (MU) 5857.95 6251.33
MSEZ Supply (MU) 56.86 41.94
Trans. Loss 3.132% 3.132%
Energy at Gen. point (MU) 6106.05 6453.45
5.3 Proposed RPO Compliance for FY-20 & FY-21 (revised):
MESCOM: ARR / ERC & Tariff Petition for Fy-21: Ch.5-Sales Projection
71
MESCOM here below proposes Non-Solar and Solar RPO Compliance for the years
FY-20 and FY-21.
RPO Compliance projections for FY-20:
a. Non-solar RPO (Projections for FY-20):
Sl.
No. Particulars
Quantum
In MU
Cost
Rs.in Cr
1. Total power purchase quantum from all
sources excluding Hydro-energy 4568.26 2517.92
2.
Non-Solar RE purchased under PPA route at
Generic Tariff including Non-Solar RE
purchased from KPCL
775.99 291.75
3. Non-Solar RE purchased at APPC - -
4. Non-Solar RE (Green Energy) sold to
consumers - -
5. Non-Solar RE purchased from other
ESCOMs - -
6. Non-Solar RE sold to other ESCOMs - -
7. Banked non-solar RE purchased @ 85% of
Generic Tariff. - -
8. Total Non-Solar RE Purchased [1+2+3-4+5-
6+7] 775.99 291.75
9. Non-Solar RPO Target (%) 13%
10. Proposed Non-Solar RPO Compliance (%) 16.99%
b. Solar RPO (Projections for FY-20):
Sl.
No. Particulars
Quantum
In MU
Cost
Rs.in Cr
1. Total power purchase quantum from all
sources excluding Hydro-energy 4568.26 2517.92
2.
Solar RE purchased under PPA route at
Generic Tariff including Solar RE purchased
from KPCL
594.12 293.61
3. Solar RE purchased at APPC - -
4. Solar RE (Green Energy) sold to consumers - -
5. Solar RE purchased from other ESCOMs - -
6. Solar RE sold to other ESCOMs - -
7. Banked solar RE purchased @ 85% of
Generic Tariff. - -
8. Total Solar RE Purchased [1+2+3-4+5-6+7] 594.12 293.61
9. Solar RPO Target (%) 7.25%
10. Proposed Solar RPO Complied (%) 13.01%
RPO Compliance projections for FY-21:
MESCOM: ARR / ERC & Tariff Petition for Fy-21: Ch.5-Sales Projection
72
a. Non-solar RPO (Projections for FY-21):
Sl.
No. Particulars
Quantum
In MU
Cost
Rs.in Cr
1. Total power purchase quantum from all
sources excluding Hydro-energy 4917.72 3071.15
2.
Non-Solar RE purchased under PPA route at
Generic Tariff including Non-Solar RE
purchased from KPCL
751.68 285.80
3. Non-Solar RE purchased at APPC - -
4. Non-Solar RE (Green Energy) sold to
consumers - -
5. Non-Solar RE purchased from other
ESCOMs - -
6. Non-Solar RE sold to other ESCOMs - -
7. Banked non-solar RE purchased @ 85% of
Generic Tariff. - -
8. Total Non-Solar RE Purchased [1+2+3-4+5-
6+7] 751.68 285.80
9. Non-Solar RPO Target (%) 13%
10. Proposed Non-Solar RPO Compliance (%) 15.29%
b. Solar RPO (Projections for FY-21):
Sl.
No. Particulars
Quantum
In MU
Cost
Rs.in Cr
1. Total power purchase quantum from all
sources excluding Hydro-energy 4917.72 3071.15
2.
Solar RE purchased under PPA route at
Generic Tariff including Solar RE purchased
from KPCL
752.63 345.24
3. Solar RE purchased at APPC - -
4. Solar RE (Green Energy) sold to consumers - -
5. Solar RE purchased from other ESCOMs - -
6. Solar RE sold to other ESCOMs - -
7. Banked solar RE purchased @ 85% of
Generic Tariff. - -
8. Total Solar RE Purchased [1+2+3-4+5-6+7] 752.63 345.24
9. Solar RPO Target (%) 8.50%
10. Solar RPO Complied (%) 15.30%
:-:-: -:-: