Embed Size (px)
Citation preview
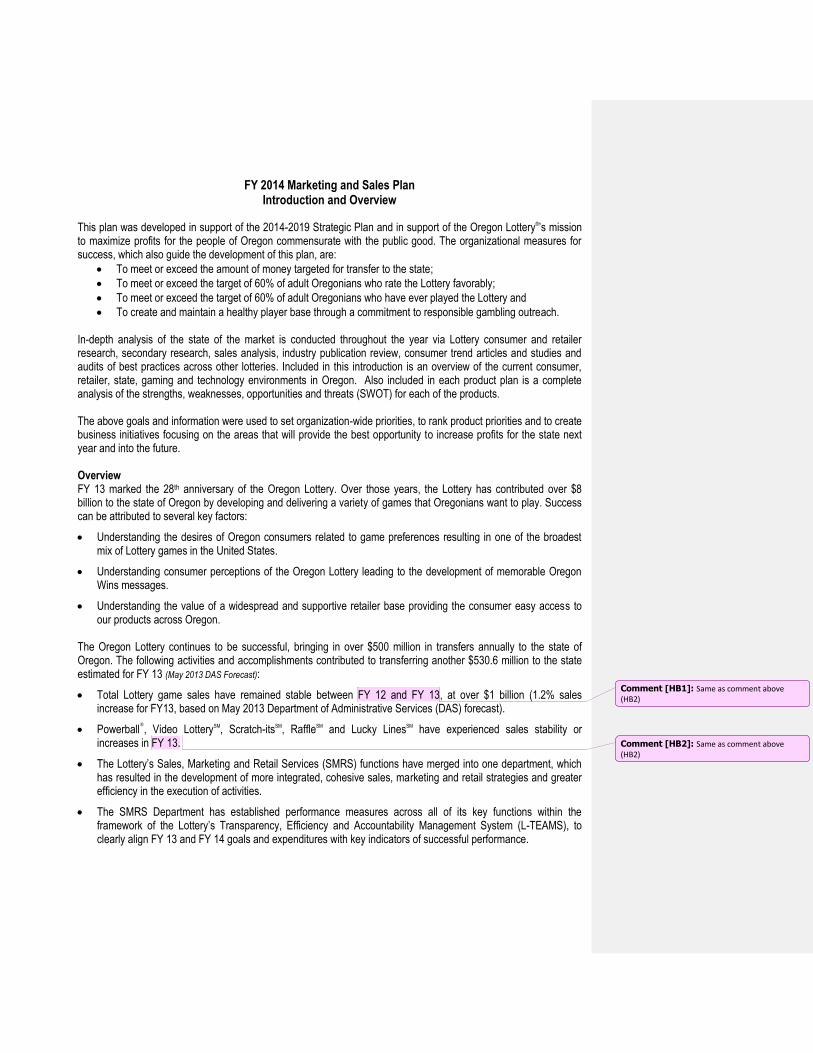
FY 2014 Marketing and Sales Plan Introduction and Overview
This plan was developed in support of the 2014-2019 Strategic Plan and in support of the Oregon Lottery®’s mission to maximize profits for the people of Oregon commensurate with the public good. The organizational measures for success, which also guide the development of this plan, are:
To meet or exceed the amount of money targeted for transfer to the state;
To meet or exceed the target of 60% of adult Oregonians who rate the Lottery favorably;
To meet or exceed the target of 60% of adult Oregonians who have ever played the Lottery and
To create and maintain a healthy player base through a commitment to responsible gambling outreach. In-depth analysis of the state of the market is conducted throughout the year via Lottery consumer and retailer research, secondary research, sales analysis, industry publication review, consumer trend articles and studies and audits of best practices across other lotteries. Included in this introduction is an overview of the current consumer, retailer, state, gaming and technology environments in Oregon. Also included in each product plan is a complete analysis of the strengths, weaknesses, opportunities and threats (SWOT) for each of the products. The above goals and information were used to set organization-wide priorities, to rank product priorities and to create business initiatives focusing on the areas that will provide the best opportunity to increase profits for the state next year and into the future. Overview FY 13 marked the 28th anniversary of the Oregon Lottery. Over those years, the Lottery has contributed over $8 billion to the state of Oregon by developing and delivering a variety of games that Oregonians want to play. Success can be attributed to several key factors:
Understanding the desires of Oregon consumers related to game preferences resulting in one of the broadest mix of Lottery games in the United States.
Understanding consumer perceptions of the Oregon Lottery leading to the development of memorable Oregon Wins messages.
Understanding the value of a widespread and supportive retailer base providing the consumer easy access to our products across Oregon.
The Oregon Lottery continues to be successful, bringing in over $500 million in transfers annually to the state of Oregon. The following activities and accomplishments contributed to transferring another $530.6 million to the state estimated for FY 13 (May 2013 DAS Forecast):
Total Lottery game sales have remained stable between FY 12 and FY 13, at over $1 billion (1.2% sales increase for FY13, based on May 2013 Department of Administrative Services (DAS) forecast).
Powerball®
, Video LotterySM, Scratch-itsSM, RaffleSM and Lucky LinesSM have experienced sales stability or increases in FY 13.
The Lottery’s Sales, Marketing and Retail Services (SMRS) functions have merged into one department, which has resulted in the development of more integrated, cohesive sales, marketing and retail strategies and greater efficiency in the execution of activities.
The SMRS Department has established performance measures across all of its key functions within the framework of the Lottery’s Transparency, Efficiency and Accountability Management System (L-TEAMS), to clearly align FY 13 and FY 14 goals and expenditures with key indicators of successful performance.
Comment [HB1]: Same as comment above (HB2)
Comment [HB2]: Same as comment above (HB2)
Level 1 – Published 2
SMRS made the strategic decision to allocate a greater proportion of its marketing communications budget to more real-time, digital, high-touch tactics - such as digital and in-store advertising – to match consumer media habits and optimize reach cost-effectively. This has resulted in game awareness remaining generally stable (November ’12 Bi-Annual Tracking Study).
A continued focus on high-touch marketing activities – such as mobilizing the Lottery’s sales force to assist retailers during large jackpot draws (“Sales Blitz”) and conducting on-site “Pop-up” promotions at retailer locations to increase awareness regarding Video LotterySM – has allowed the Lottery to maintain a stable retailer base as evidenced by a net increase in the retailer base from 3,904 to 3,921 between April 2012 and 2013 and a 91% retention rate over this period.
The Lottery has successfully launched 2nd Chance Drawings, tied to the Scratch-itSM product, which offers players another chance to win the top prize offered on their losing tickets. Offering 2nd Chance was a strategic effort to extend the life of this mature, flagship game. Over 1.6 million non-winning tickets have been entered through April 2013.
The Lottery also focused efforts on increasing the efficiency of how it manages its Scratch-it product. The Lottery continues to build its strategies for FY 14 based on a cautious optimism. Sales of many of our products have plateaued as they reach a point of maturity in their life cycles. While the Oregon Lottery enjoys a loyal player base, the consumer has many more options of where and how to play games and a wider variety of entertainment options on which to spend their discretionary income. Posed with these challenges, it becomes more critical to broaden our player base by acquiring new customers as well as deepening our existing relationships with current players. This requires re-examining the diversity and points of differentiation across our product portfolio, evaluating the appeal of features offered across our games and enabling players to access our games in the locations they frequent and through the technologies they use. Most of our product objectives have been developed with the intent to reach new players and keep our loyal players engaged. Support plans have been structured to spend the majority of our advertising resources to showcase new products and programs that are being introduced to appeal to new markets. State of the Consumer Environment
Consumers Continue to be Ambivalent about the Economy. According to the Conference Board’s Consumer Research Center, the Consumer Confidence Index has increased from 64.4 in May 2012 to 76.2 in May 2013. While consumers have a moderately positive outlook regarding current business and housing conditions and the U.S. unemployment rate is at its lowest level since December 2008 (7.7%), the Sequester has created uncertainty about the economy that has kept discretionary spending flat. While job growth is observed to be steady, it remains slow. The Lottery has maintained its loyal player base through the recession, but play frequency remains lower than post-2008 levels (Sources: OEA Oregon March 2013 Economic & Revenue Outlook, Conference
Board, Bloomberg.com, PR Newswire, Ipsos Ideas Spotlight).
Current Attitudes and Perceptions about the Oregon Lottery®
. The level of favorable perceptions of the Lottery (64%) continues to surpass the organization’s target of 60%. However, a decline in favorable perceptions has been observed since the November 2011 wave of the Lottery’s Tracking Study (69%). This may be attributable at least in part to changes/reductions in the Lottery’s Brand/Oregon Wins advertising schedule along with an increase in the level of negative media attention focused on the Lottery over the past year and a half.
More “Jackpot Chasing.” While monthly play levels across Video Lottery, Scratch-itsSM, Keno and Pick 4SM have been stable over time, most of the Lottery’s draw games (Powerball
®
, Mega Millions®
, MegabucksSM, etc.) have experienced declines in reported monthly play. Instead, more consumers appear to be waiting to play the Lottery’s most popular draw games until the jackpot is extraordinarily high (for Powerball and Mega Millions, $200 million or more) (Source: November 2012 Tracking Study).
Comment [HB3]: Do we want to update this sentence with more recent information? Maybe as of June 2013?
Comment [HB4]: L. Niswender highlighted in his review of the plan
Comment [HB5]: Same as comment above (HB6)
Level 1 – Published 3
Multiple Generations of Tech-Savvy Players. Consumers across age groups are more tech-savvy, with more devices and entertainment choices than ever before. They engage differently with technology, using it as a tool to enhance their social lives, share their interests with a broader audience and more seamlessly integrate their communications. Consumers have mobile access to virtually everything. There is a greater comfort with viewing multiple screens of entertainment/information at once (e.g., mobile and TV) and there is an increase in content taking the form of video and pictures (e.g., YouTube, Pinterest, Tumblr). These trends are also changing the face of advertising, with U.S. Internet ad spending growing 15% between 2011 and 2012 (Source: mediapost.com).
Customers are More Engaged and Expect Value-Adds that Reflect Their Preferences. Web-based services, such as Groupon and Living Social, reflect an increased receptivity among consumers to receive ongoing, frequent communications from companies that offer deals and special promotions that are tailored to their preferences.
Opportunities for Change. Lotteries continue to explore and evaluate potential new game categories, purchasing channels and game play options that will more effectively meet the needs of players who may feel positively about what lotteries do, but do not currently find games that meet their entertainment preferences.
State of the Retailer Environment
Declining Sales. Retailers, particularly smaller businesses, continue to be hit extremely hard by Oregon’s stalled economy. This has resulted in cash management issues, staffing reductions, reduced hours of operation, questions about whether to continue selling Oregon Lottery® games and whether to keep doors open.
On-Premise Retailers Concerned About the Possibility of Declining Commissions. Concern continues to be expressed by on-premise retailers about upcoming retailer contract renewals and Video Lottery℠
commissions. Most are concerned that their future commissions will continue to erode with reduced commission rates and flat sales.
State of the State Environment
The Lottery’s Contribution to Oregon is Vital. In FY 13, the Lottery transferred over $530 million to the state for parks, watersheds, economic development, public education and responsible gambling programs – the state’s ability to grow and remain vibrant is closely intertwined with the Lottery’s performance and favorability ratings (Source: May 2013 DAS Forecast).
The State of Oregon’s Economy. According to the March 2013 Oregon Economic and Revenue Forecast prepared by the Office of Economic Analysis and Department of Administrative Services, Oregon’s economic outlook will reflect modest improvements in growth rates during the 2013 – 2015 biennium. And “although Oregon’s economic expansion is not expected to match the pace seen during past periods of growth, it is likely that growth will improve somewhat relative to the crawling pace of recent years (Source: March 2013 Oregon Economic
and Revenue Forecast prepared by OEA/DAS).
Gambling Legislation. Concerns regarding the state’s ability to adequately fund social programs, coupled with concerns regarding activities that could increase the incidence of problem gambling in the state have resulted in an increase in legislation related to the Lottery, gambling in general and problem gambling. In 2012, there were no more than a handful of bills proposing legislation related to Lottery, casinos, other forms of gambling or responsible gambling. In 2013, approximately two dozen bills covering these topics have been proposed (Source:
Lottery Director’s Office, Rules & Policy). State of the Gaming Industry and Gaming Technology
Since the U.S. Justice Department delivered its legal opinion in 2009 regarding the New York and Illinois lotteries’ plans to use the Internet, one jurisdiction after another has pursued entrance into Internet (online) gambling. The states that have leveraged the Internet prior to the ruling by offering subscription sales include North Dakota, New
Comment [HB6]: Highlighted by L. Niswender during his review of the plan
Level 1 – Published 4
Hampshire and Minnesota. States that have either begun selling product in-state via the Internet or are positioning to do so include Massachusetts, Michigan, Vermont and Virginia. Offering Lottery games via the Internet is significant because it allows today’s consumer who has been heavily influenced by the Internet to purchase Lottery products the way they want to. The Internet purchase also allows Lottery to become mobile. Purchasing through the use of a smart phone, laptop or other electronic device allows consumers to play Lottery when they want and from where they want. And, it’s not limited to sales. Via the Internet, players are able to set-up an e-wallet and allow their tickets to validate and receive payment through an e-wallet. There is not an expectation that millions and millions of players will instantly gravitate to this new format of play. However, the Internet option opens each jurisdiction to a new opportunity to interact with consumers they never could reach before. Why? Because today’s 18-35 year olds are far more interested in Facebook, Twitter, Pinterest and other electronic forms of communications that for many years were not considered ‘Traditional Marketing’. Some lotteries will now have a leg-up in reaching new markets through new communication channels that allow for a simple click to complete a sale. This is not new-age for many businesses, but it is for Lottery.
Because of the Internet demand, gaming vendors are focusing their technological departments on next generation gaming options that are served through the Internet than those once considered “Traditional” gaming. New games that can be added to traditional game libraries are difficult to configure let alone appeal to new markets and new gaming equipment upgrades are not readily available. Gaming vendors are spending their capitol on the thriving new business of Internet gaming which allows for dynamic gaming content provided on a platform that allows for gaming available through new distribution channels.
Video LotterySM
Over the past couple of years, there has been rapid technological development in the gaming industry which is, and will continue to change the face of the Video Lottery business. Many lottery jurisdictions, particularly in Canada, are currently moving toward these new technologies and gaming trends. The Oregon Lottery
®
is taking a proactive watch and wait stance at this time and leveraging relationships that have been built with other jurisdictions through participation in the Gaming Standards Association (GSA) and Canadian working groups to learn through their experiences. Should the political and economic environment change and the Lottery find it untenable to maintain necessary transfer rates based on the current business model, we will be poised with the knowledge and experience built from our alignment with these influencers in the gaming industry.
Major trends within the gaming industry as it relates to Video Lottery include:
Online and Cross-Platform Gaming Trends. The number of Americans playing digital games has increased from 56 million in 2008 to 135 million in 2011 (source: investorplace.com). This is reflective of the acceptance of, and growing market for, Internet-based games. The re-interpretation of the Wire Wager Act has resulted in a wide range of gaming entities and their vendors exploring new opportunities to develop gaming concepts that cross platforms. For example:
o Lotteries and their vendors are contemplating new ways to offer games across both brick-and-mortar and Internet venues. Examples of activities currently being explored and in some cases in early implementation: social games that can be played at home via mobile phone or tablet device and at a casino or lottery retail location; developing Facebook-specific tie-ins; offering instant ticket games that may be played at a lottery’s website as well as purchased from a retailer’s location; Internet-based game subscriptions and offering new game categories over the Internet
o Vendors serving the casino and lottery markets are acquiring Internet gaming/social gaming companies at a rapid pace to facilitate this move to a cross-platform approach
The Industry is moving to Open Standards Based Gaming Systems that are less proprietary and better able to react to the market. The Lottery is implementing business practices and models that take advantage of these
Comment [HB7]: Need blanks filled in
Level 1 – Published 5
opportunities while maintaining alignment with our need for security. Industry wide adoption of technology standards and protocols, developed and supported by the GSA has led to the availability of gaming systems and devices that remove vendor proprietary components and protocols. As gaming system operators are able to bring these new systems and devices to the market, we will be challenged to support the current investment in older technology as we transition to newer standards based technology
The Lifespan of Technologies Continues to Become Shorter, making it essential to evaluate technology solution providers that may be able to provide services to meet our business needs rather than acquiring technology that may have a short life cycle and require a significant commitment of internal resources to manage
Enhanced Gaming Network. Advanced gaming capabilities will require investments in our gaming network to provide the speed, reliability and security necessary to meet consumer demand and comply with security requirements
Various Forms of Entertainment are Competing More Than Ever for Consumers’ Limited Discretionary Income, particularly in the current economic environment. Oregon tribal casinos and the Internet compete directly with the Oregon Lottery®. The Lottery has additional responsibilities of stewardship related to promoting responsible gambling and enforcing the smoking ban that these other gaming entities do not. However, these competitors also serve as examples from which the Lottery can learn valuable lessons regarding how technology can strengthen our relationship with our players and facilitate offering a wider variety of games more efficiently, nimbly and cost-effectively
Level 1 – Published 6
Introduction to Business Initiatives
Key insights from research and data analytics have shaped the following FY 14 focus and core strategic initiatives:
Consumers don’t know that line games offer a similar gaming experience as the casino games that they know and play
Consumers believe that both Video LotterySM and Keno are inconveniently located and not in venues they frequent
Younger adult consumers think Lottery games are for older people. They want a more social, more technologically relevant experience
Jackpot awareness continues to be the single greatest motivator of draw game sales; however jackpot desensitization has begun to have an effect
Oregonians are fiercely proud of being Oregonian, understanding where Lottery funds go drives favorability and sales
The following organizational and business imperatives have also informed our strategies:
Ongoing integration of the departments within SMRS will be focused on identifying operational efficiencies that drive sales. Tests of processes and programs will occur throughout the year
Adoption of the L-TEAMS program will continue to mature and SMRS outcome measures will begin to provide insight that will inform changes, additions and enhancements to strategies and tactics
Maximizing Traditional product profitability will require process improvements such as end-to-end Scratch-itSM management and portfolio modifications such as changes to jackpot games
Decisions made by the Multi-State Lottery Association (MUSL) will continue to have resource and budget implications that are outside of Lottery control
The need to modernize will continue to drive major business initiatives such as the Video Lottery Technology Modernization Program (VLTMP) and Customer Relationship Management (CRM/HDSS)
The need to maintain a stable revenue source during the modernization process will drive many shorter-term tactics and promotions
Key Product Strategies & Programs Jackpot Games Product Management
Right size the portfolio to deliver optimal game mix based on consumer preference and game profitability o Modify MegabucksSM o Execute MUSL defined changes to Powerball
®
and Mega Millions®
o Reintroduce TRIOSM o Determine optimal number and type of draw games to maximize profitability
Continue to invest in jackpot awareness
Investigate smaller Lottery To Go (LTG) footprint to expand potential retailer base
Remove aged equipment
Level 1 – Published 7
Marketing Communications
Actively promote Oregon’s Game MegabucksSM and cross-promote with other Oregon specific games or promotions
Leverage the game changes to Powerball®
and Mega Millions®
through a TrioSM promotion that includes Megabucks
Test BOGO promotion that includes Megabucks
Increase distribution of jackpot signage
Utilize “real-time” media to promote jackpot amounts Sales
Use “Blitz teams” during high jackpots
Facilitate corporate account sales contests to support BOGO and other promotions
Enable “real-time” collateral placement during BOGO Research/Analytics
Monitor interactions across Powerball, Mega Millions and Megabucks; shifts in play patterns and the effectiveness of advertising and promotions through the ongoing analysis of internal data and the review of results from the Lottery’s Bi-Annual Tracking Studies and quarterly Promotions Surveys
Scratch-itSM and RaffleSM Product Management
Utilize process improvements to drive profitability of the product
Leverage 2nd Chance database to introduce new themes and promotions
Leverage partners to access licensed or branded content for games o Timbers / Thorns o Harley o National Parks o 7-Eleven
Marketing Communications
Use Scratch-ItsSM as “hub” for seasonal promotions o Halloween: Raffle, Halloween Scratch-it ticket and Mystery Manor Video LotterySM game o Valentines: Valentines themed Scratch-it tickets o Holiday: Multiple holiday tickets
Limit use of high-cost broadcast for holiday campaign
Use low cost, real-time media to create urgency for Raffle and holiday Scratch-Its Sales
Engage with retailers and customers with high-touch Surprise & Delight events
Work with corporates such as 7-Eleven to identify opportunities for custom tickets
Work with retailers on effective Scratch-it management including schematics Research/Analytics
Scratch-its Payout Analysis: Statistical analysis aimed at revisiting, confirming and expanding on past analysis related to optimizing Scratch-it payout percentages
2nd Chance Participant Surveys: Invite 2nd Chance Drawing registrants through the Lottery’s 2nd Chance Web site to participate in surveys designed to obtain consumers’ opinions and preferences related to 2nd Chance and the overall Scratch-it product
Level 1 – Published 8
Scratch-itSM Game Indexing Report: Analyze Scratch-it game sales data and maintain index scores that are used to help pinpoint combinations of play styles, themes and key game features that have been more or less successful in the past
Video LotterySM Product Management
Maximize existing technology with strategic software refreshes and equipment management
Modernize the Video Lottery program to provide a stable revenue source o Test and prepare to implement Intelligen Central Gaming System o Deploy 3,000 new Video Lottery terminals (VLTs) in the I-5 corridor o Field the RFO for the second VLT replacement o Integrate new network
Research and identify Player Management System (PMS) to maximize new technology. PMS will support o Responsible Gambling o Recognition and Rewards o Business Intelligence
Marketing Communications
Identify appropriate channels to advertise Video Lottery to new players outside of the retailer locations o Cross promotions with Traditional products o Cooperative marketing with retailers o Age-controlled events
Sales
Focus recruitment efforts on brand consistent on-premise chains
Support player education and product trial with “Pop-up” Promotions
Seek trusted advisor status with Video Lottery retailers to help ensure appropriate support of the Video Lottery program including merchandising and suggestive selling
Service
Utilize the field service teams to drive player trial of new games during software refreshes
Develop additional training for Video Lottery retailers Research/Analytics
Video Lottery Player Trends Research: Ongoing tracking study that monitors the behavior and attitudes of current, lapsed and non-players of Video Lottery to inform game selection and promotional efforts
Cross-Vendor Game Testing: Test new Video Lottery games with consumers to ensure that their preferences are integrated into game selection and launch
Video Lottery Game Mix Optimization: Conduct advanced analytics to model different game mix scenarios to understand their potential impact on sales and profitability
Video Lottery Equipment Management Tracking: Analyze internal data to assist in optimizing the distribution and management of VLTs
KENO Product Management
Continue to investigate opportunities to make the Keno Show more interactive and engaging
Modify Keno rolling jackpot funding (eliminate 6 & 7-spot and push funding into the 8-spot)
Level 1 – Published 9
Marketing Communications
Reposition and rebrand the game to be appealing to a more contemporary audience with the multi-channel Keno Confidential campaign
Sales
Encourage the 500+ Video LotterySM only, on-premise retailers to add Keno
Obtain better monitor placement in both off and on premise retailers Research/Analytics
Monitor the consumer response to game and advertising changes through the ongoing analysis of internal data and the review of programmatic, cross-product surveys such as the Lottery’s Bi-Annual Tracking Studies and quarterly Promotions Surveys
Key Public Information Strategies & Programs
The Oregon Lottery
®
Brand Brand Management
Proactively manage the brand to maintain playership and build advocacy
Sponsor high profile events that support the brand positioning and reach community leaders
Develop mutually beneficial partnerships with like-minded brands Marketing Communications
Utilize proactive public relations tactics for thought leadership, media outreach and promotional support
Enter the social media conversation with a thoughtful Facebook, YouTube and Twitter presence
Refresh oregonlottery.org to better align with consumer preferences and business objectives
Expand Oregon Wins messaging to include education, watershed and infrastructure Research & Analytics
Measure both the quantity and quality of press coverage generated using media monitoring tools
Conduct user acceptance testing to inform the Web site refresh and social media efforts
Measure attitudes and favorability with surveys such as the Bi-Annual Tracker Responsible Gambling Brand Management
Continue to work with the responsible gambling community, both in Oregon and in other jurisdictions, to ensure continuous improvements in responsible gambling programming
Marketing Communications
Refresh the responsible gambling television campaign
Investigate media opportunities to reach at risk populations with responsible gambling messaging
Identify “incidental expense” opportunities to promote the helpline Research/Analytics
Responsible Gambling research will be conducted in FY 14 to ensure that the Oregon Lottery’s ongoing efforts to promote and support responsible gambling are effective
Level 1 – Published 10
FY 2014 Video LotterySM Product Plan Introduction More than 85% of the state’s transfers from Lottery games are derived from Video Lottery℠. Department of
Administrative Services Office of Economic Analysis sales forecast for Video Lottery in FY 14 is over $760 million (based on May 2013 Forecast). This summary discusses the business initiatives that the Lottery believes offer the best potential to meet this goal as well as to position Video Lottery to continue to grow beyond the year 2014. Fiscal Year 2014 The Video Lottery department will continue to focus heavily on the assessment and implementation of near and long-term technologies in order to maintain and grow immediate and future sales. To meet this goal and make informed recommendations will require us to broaden our understanding of the positive and negative factors that are impacting Video Lottery sales. In order to meet revenue objectives, it will be necessary to provide a product that continues to engage the current Video Lottery player and one that will attract a broader audience to help acquire new players. However, sales success will not happen with product introductions alone. Achieving Video Lottery revenue goals will require integrated marketing and sales programs that create consumer awareness and demand which is satisfied by our retail network. Continuing to leverage the alignment between consumer, marketing and retail programs as well as focusing on strengthening the corporate account partnership and seeking new retail partners will be priorities in FY 14. The Video Lottery department will also work to continue to integrate the organization’s performance management philosophy into its day-to-day operations in order to achieve greater efficiencies and accountability through the product management process. Video Lottery Technology Modernization Program FY 14 will be a milestone year for Video Lottery. Several years of strategy development, technology assessment and product planning will culminate into a live product introduction into the market. In FY 14, the Lottery will deploy the first new Video Lottery Terminals (VLTs) as part of a multi-year strategic plan to maintain Video Lottery revenue by migrating to next generation products. To meet future sales and transfer forecasts for the Video Lottery product, the Oregon Lottery® is executing plans that will allow for the introduction of new game styles and features that better fit evolving player preferences. In FY 14, we will also begin the development of a long-term strategy for a comprehensive player management program that will be integrated into the VLT network. This program will provide better informed choices to players related to game play. Players will be encouraged to participate in the responsible gaming program which facilitates setting time and budget limits by offering an incentive for participation. For example, some unique bonus features or game content may only be available to those who register for the player program. We plan to develop these programs using world-wide best practices as adopted by the Gaming Standards Association (GSA) through the Operator’s Advisory Committee (OAC). In order to implement the new game styles and to introduce a player program experience, the Oregon Lottery must also replace its Video Lottery central system. In FY 13, a contract was executed for this system and vendor development of the system will consume most or all of FY 14. Both the central system and the VLTs will use a standards based protocol, “game to system” (G2S), which will ultimately allow Lottery to implement its next generation of Video Lottery gaming products. The new VLTs coupled with a new Video Lottery gaming system and new gaming network will address the current technology obsolescence issues and will give Lottery the ability to remain viable with its product offerings going forward.
Level 1 – Published 11
In preparation for new VLT introductions into the market, analysis and strategies are being developed and implemented around equipment management. The focus will be on revenue generation and will include continuing to optimize the use of equipment while working toward right sizing the market to make informed procurement decisions over the next several years. This will include implementing equipment management sales thresholds across the retailer network to ensure the investment in equipment is managed effectively. Game Performance Value Proposition / Contribution to Lottery Game Portfolio
Seventy percent (70%) of Lottery sales and over 90% of transfers are projected to come from Video LotterySM in FY 13
The Video Lottery product has resumed a positive growth trend in its lifecycle through the introduction of new product features (new poker games, new styles of VLTs, line games, bigger prizes)
The Video Lottery product provides game diversity in the Lottery’s portfolio which is primarily made up of mature draw games. It offers a Lottery game alternative for those consumers who prefer short duration games that offer immediate prizes as well as appealing to consumers who enjoy gambling in a more social setting
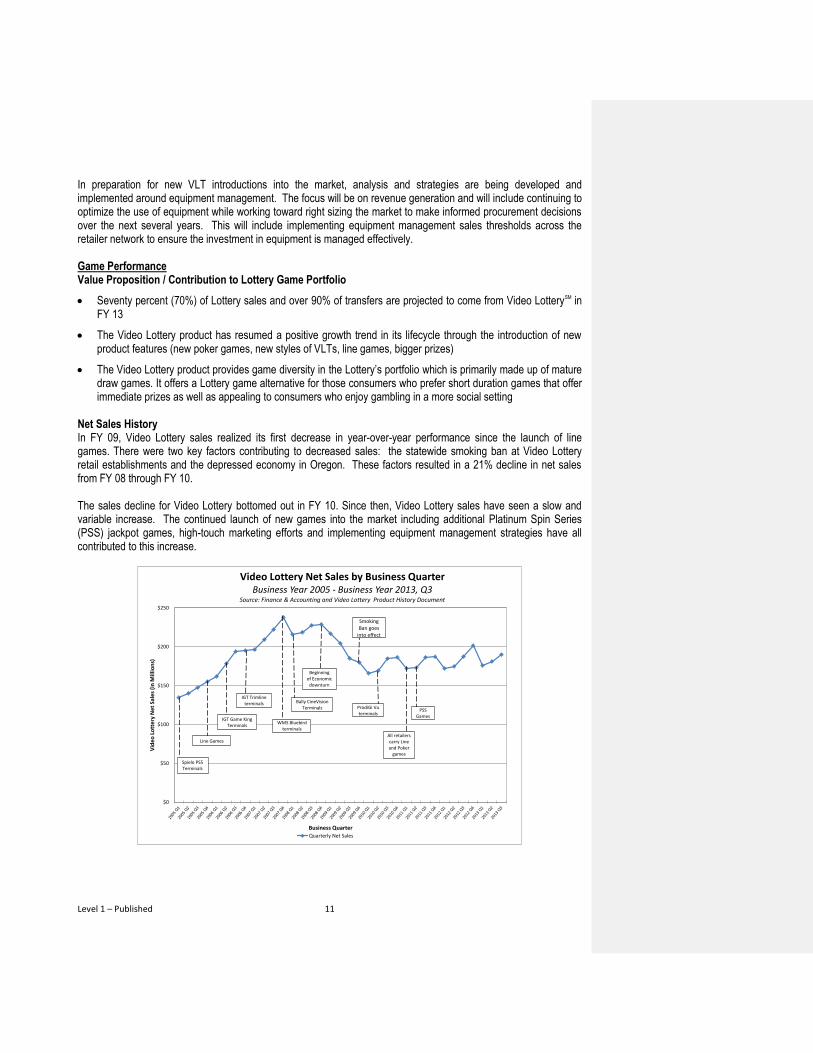
Net Sales History In FY 09, Video Lottery sales realized its first decrease in year-over-year performance since the launch of line games. There were two key factors contributing to decreased sales: the statewide smoking ban at Video Lottery retail establishments and the depressed economy in Oregon. These factors resulted in a 21% decline in net sales from FY 08 through FY 10. The sales decline for Video Lottery bottomed out in FY 10. Since then, Video Lottery sales have seen a slow and variable increase. The continued launch of new games into the market including additional Platinum Spin Series (PSS) jackpot games, high-touch marketing efforts and implementing equipment management strategies have all contributed to this increase.
$0
$50
$100
$150
$200
$250
Vid
eo L
ott
ery
Net
Sal
es (
in M
illio
ns)
Business Quarter
Video Lottery Net Sales by Business QuarterBusiness Year 2005 - Business Year 2013, Q3
Source: Finance & Accounting and Video Lottery Product History Document
Quarterly Net Sales
Smoking Ban goes
into effect
Bally CineVision Terminals
WMS Bluebird terminals
IGT Trimline terminals
Beginning of Economic
downturn
IGT Game King Terminals
Line Games
Spielo PS5 Terminals
ProdiGi Vu terminals
All retailers carry Line and Poker
games
PSS Games

Level 1 – Published 12
Level 1 – Published 13
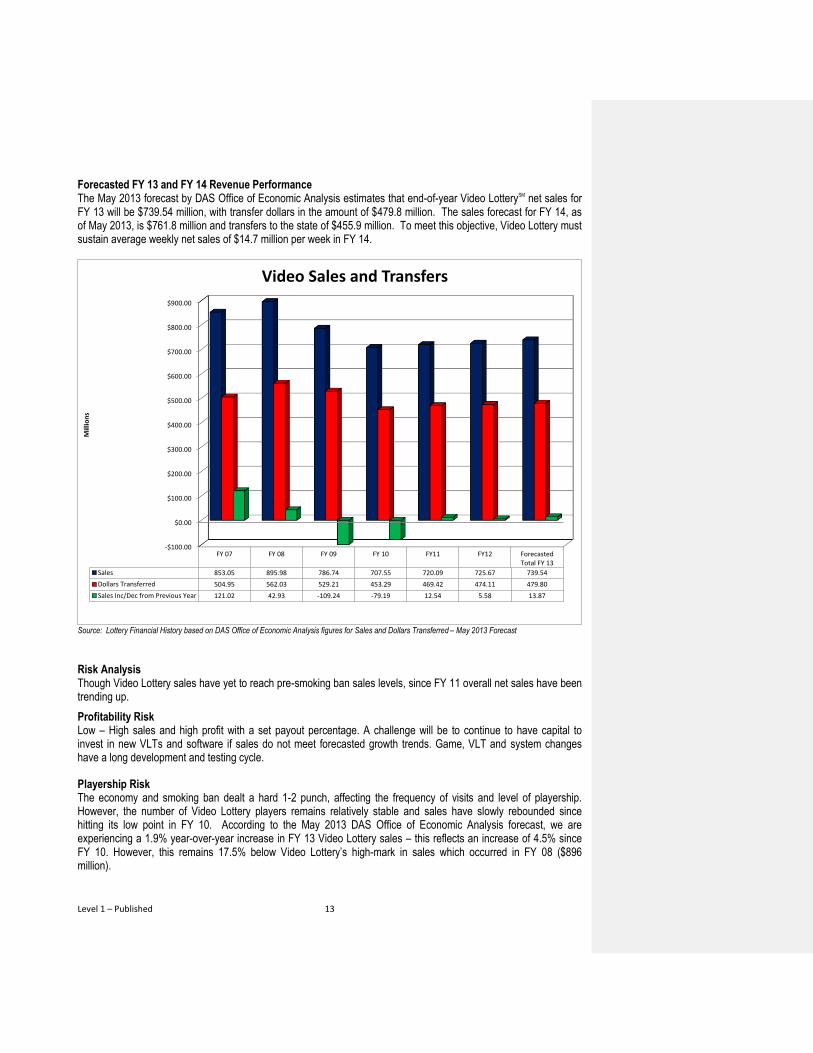
Forecasted FY 13 and FY 14 Revenue Performance The May 2013 forecast by DAS Office of Economic Analysis estimates that end-of-year Video LotterySM net sales for FY 13 will be $739.54 million, with transfer dollars in the amount of $479.8 million. The sales forecast for FY 14, as of May 2013, is $761.8 million and transfers to the state of $455.9 million. To meet this objective, Video Lottery must sustain average weekly net sales of $14.7 million per week in FY 14.
Source: Lottery Financial History based on DAS Office of Economic Analysis figures for Sales and Dollars Transferred – May 2013 Forecast
Risk Analysis Though Video Lottery sales have yet to reach pre-smoking ban sales levels, since FY 11 overall net sales have been trending up.
Profitability Risk Low – High sales and high profit with a set payout percentage. A challenge will be to continue to have capital to invest in new VLTs and software if sales do not meet forecasted growth trends. Game, VLT and system changes have a long development and testing cycle.
Playership Risk The economy and smoking ban dealt a hard 1-2 punch, affecting the frequency of visits and level of playership. However, the number of Video Lottery players remains relatively stable and sales have slowly rebounded since hitting its low point in FY 10. According to the May 2013 DAS Office of Economic Analysis forecast, we are experiencing a 1.9% year-over-year increase in FY 13 Video Lottery sales – this reflects an increase of 4.5% since FY 10. However, this remains 17.5% below Video Lottery’s high-mark in sales which occurred in FY 08 ($896 million).
-$100.00
$0.00
$100.00
$200.00
$300.00
$400.00
$500.00
$600.00
$700.00
$800.00
$900.00
FY 07 FY 08 FY 09 FY 10 FY11 FY12 ForecastedTotal FY 13
Sales 853.05 895.98 786.74 707.55 720.09 725.67 739.54
Dollars Transferred 504.95 562.03 529.21 453.29 469.42 474.11 479.80
Sales Inc/Dec from Previous Year 121.02 42.93 -109.24 -79.19 12.54 5.58 13.87
Mill
ion
s
Video Sales and Transfers
Level 1 – Published 14
Current factors that may hinder the Lottery’s ability to reach FY 08 sales levels for this product include the following:
Limited advertising for Video LotterySM has inhibited the Lottery’s ability to address low awareness regarding the game. Opposition from public interest groups has severely limited the Lottery’s ability to advertise Video Lottery outside of the retailer environment which limits the ability to inform consumers of the variety and convenient locations of retailers offering Video Lottery. This further hinders the Lottery’s ability to increase the player base for this game
The Lottery also continues to be prohibited from offering its line and poker games online which further limits our ability to appeal to a broader, younger market segment
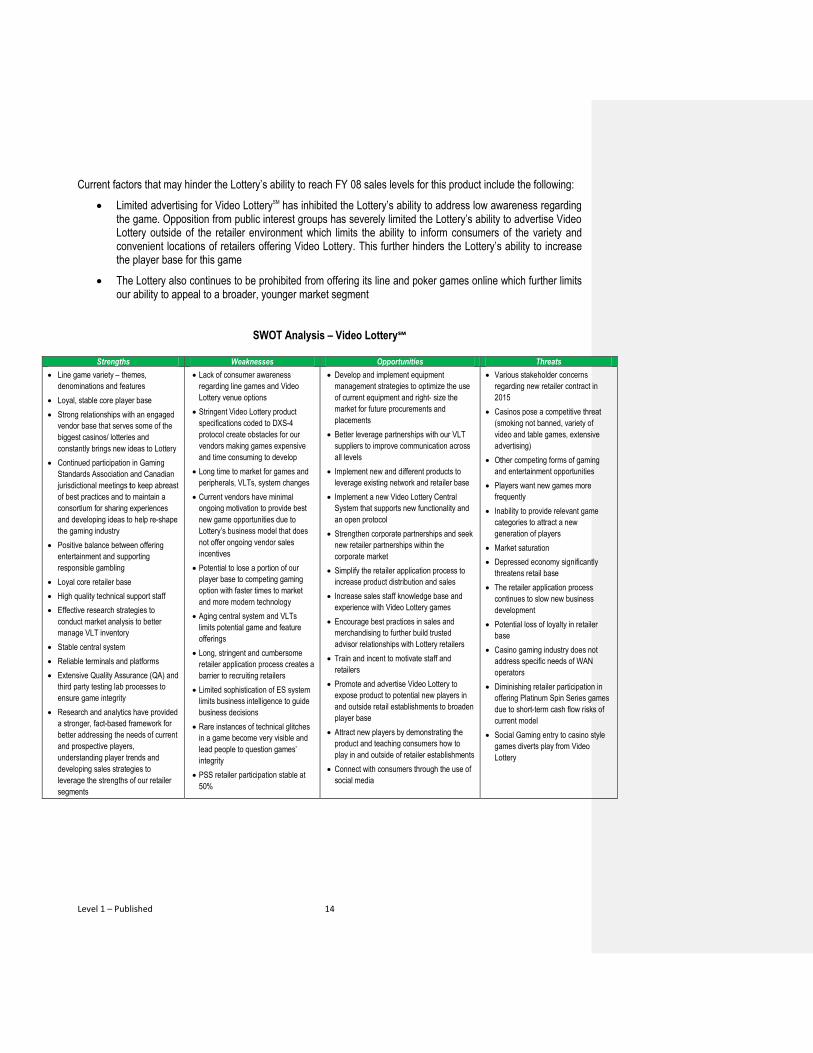
SWOT Analysis – Video Lottery℠
Strengths Weaknesses Opportunities Threats
Line game variety – themes,
denominations and features
Loyal, stable core player base
Strong relationships with an engaged
vendor base that serves some of the
biggest casinos/ lotteries and
constantly brings new ideas to Lottery
Continued participation in Gaming
Standards Association and Canadian
jurisdictional meetings to keep abreast
of best practices and to maintain a
consortium for sharing experiences
and developing ideas to help re-shape
the gaming industry
Positive balance between offering
entertainment and supporting
responsible gambling
Loyal core retailer base
High quality technical support staff
Effective research strategies to
conduct market analysis to better
manage VLT inventory
Stable central system
Reliable terminals and platforms
Extensive Quality Assurance (QA) and
third party testing lab processes to
ensure game integrity
Research and analytics have provided
a stronger, fact-based framework for
better addressing the needs of current
and prospective players,
understanding player trends and
developing sales strategies to
leverage the strengths of our retailer
segments
Lack of consumer awareness
regarding line games and Video
Lottery venue options
Stringent Video Lottery product
specifications coded to DXS-4
protocol create obstacles for our
vendors making games expensive
and time consuming to develop
Long time to market for games and
peripherals, VLTs, system changes
Current vendors have minimal
ongoing motivation to provide best
new game opportunities due to
Lottery’s business model that does
not offer ongoing vendor sales
incentives
Potential to lose a portion of our
player base to competing gaming
option with faster times to market
and more modern technology
Aging central system and VLTs
limits potential game and feature
offerings
Long, stringent and cumbersome
retailer application process creates a
barrier to recruiting retailers
Limited sophistication of ES system
limits business intelligence to guide
business decisions
Rare instances of technical glitches
in a game become very visible and
lead people to question games’
integrity
PSS retailer participation stable at
50%
Develop and implement equipment
management strategies to optimize the use
of current equipment and right- size the
market for future procurements and
placements
Better leverage partnerships with our VLT
suppliers to improve communication across
all levels
Implement new and different products to
leverage existing network and retailer base
Implement a new Video Lottery Central
System that supports new functionality and
an open protocol
Strengthen corporate partnerships and seek
new retailer partnerships within the
corporate market
Simplify the retailer application process to
increase product distribution and sales
Increase sales staff knowledge base and
experience with Video Lottery games
Encourage best practices in sales and
merchandising to further build trusted
advisor relationships with Lottery retailers
Train and incent to motivate staff and
retailers
Promote and advertise Video Lottery to
expose product to potential new players in
and outside retail establishments to broaden
player base
Attract new players by demonstrating the
product and teaching consumers how to
play in and outside of retailer establishments
Connect with consumers through the use of
social media
Various stakeholder concerns
regarding new retailer contract in
2015
Casinos pose a competitive threat
(smoking not banned, variety of
video and table games, extensive
advertising)
Other competing forms of gaming
and entertainment opportunities
Players want new games more
frequently
Inability to provide relevant game
categories to attract a new
generation of players
Market saturation
Depressed economy significantly
threatens retail base
The retailer application process
continues to slow new business
development
Potential loss of loyalty in retailer
base
Casino gaming industry does not
address specific needs of WAN
operators
Diminishing retailer participation in
offering Platinum Spin Series games
due to short-term cash flow risks of
current model
Social Gaming entry to casino style
games diverts play from Video
Lottery
Level 1 – Published 15
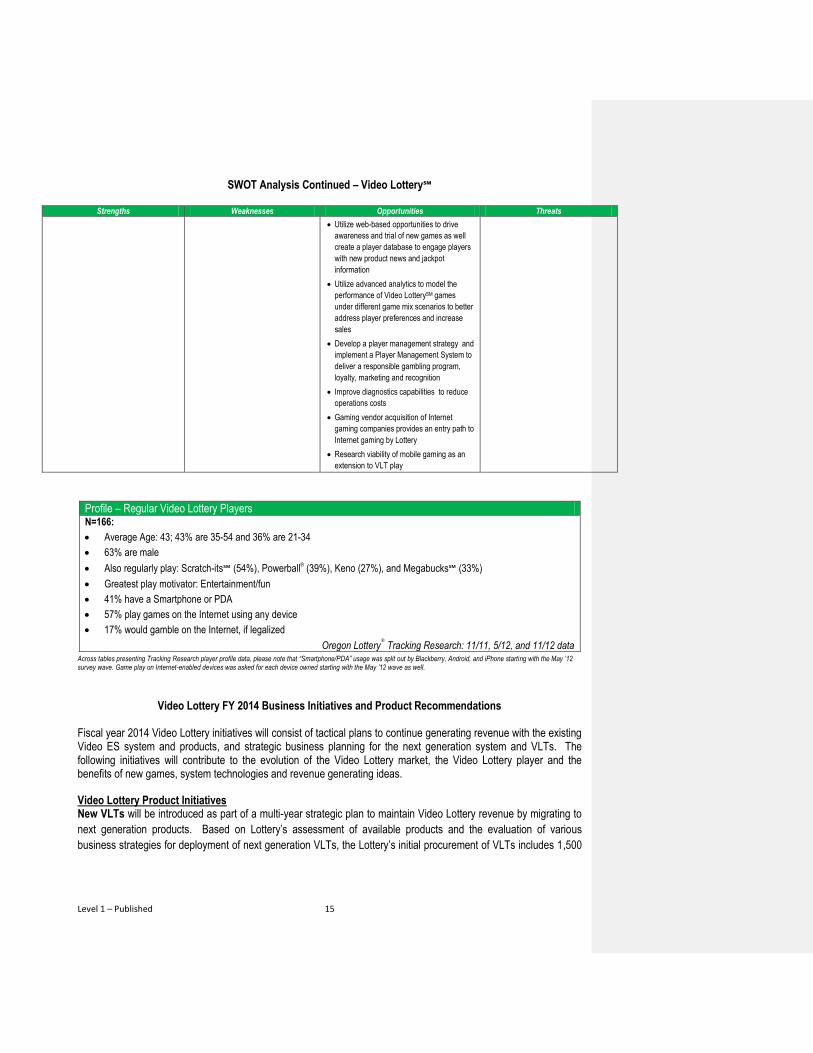
SWOT Analysis Continued – Video Lottery℠
Strengths Weaknesses Opportunities Threats
Utilize web-based opportunities to drive
awareness and trial of new games as well
create a player database to engage players
with new product news and jackpot
information
Utilize advanced analytics to model the
performance of Video LotterySM games
under different game mix scenarios to better
address player preferences and increase
sales
Develop a player management strategy and
implement a Player Management System to
deliver a responsible gambling program,
loyalty, marketing and recognition
Improve diagnostics capabilities to reduce
operations costs
Gaming vendor acquisition of Internet
gaming companies provides an entry path to
Internet gaming by Lottery
Research viability of mobile gaming as an
extension to VLT play
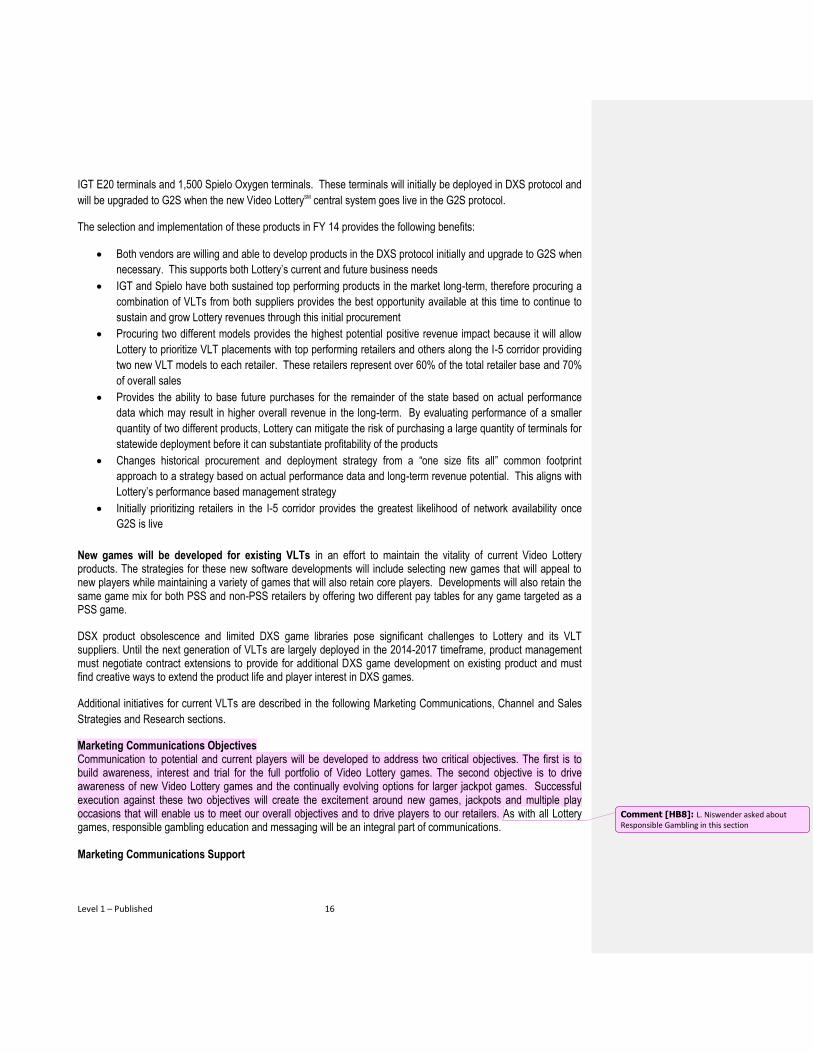
Profile – Regular Video Lottery Players N=166:
Average Age: 43; 43% are 35-54 and 36% are 21-34
63% are male
Also regularly play: Scratch-its℠ (54%), Powerball® (39%), Keno (27%), and Megabucks℠ (33%)
Greatest play motivator: Entertainment/fun
41% have a Smartphone or PDA
57% play games on the Internet using any device
17% would gamble on the Internet, if legalized
Oregon Lottery®
Tracking Research: 11/11, 5/12, and 11/12 data Across tables presenting Tracking Research player profile data, please note that “Smartphone/PDA” usage was split out by Blackberry, Android, and iPhone starting with the May ’12 survey wave. Game play on Internet-enabled devices was asked for each device owned starting with the May ’12 wave as well.
Video Lottery FY 2014 Business Initiatives and Product Recommendations Fiscal year 2014 Video Lottery initiatives will consist of tactical plans to continue generating revenue with the existing Video ES system and products, and strategic business planning for the next generation system and VLTs. The following initiatives will contribute to the evolution of the Video Lottery market, the Video Lottery player and the benefits of new games, system technologies and revenue generating ideas.
Video Lottery Product Initiatives New VLTs will be introduced as part of a multi-year strategic plan to maintain Video Lottery revenue by migrating to
next generation products. Based on Lottery’s assessment of available products and the evaluation of various
business strategies for deployment of next generation VLTs, the Lottery’s initial procurement of VLTs includes 1,500
Level 1 – Published 16
IGT E20 terminals and 1,500 Spielo Oxygen terminals. These terminals will initially be deployed in DXS protocol and
will be upgraded to G2S when the new Video LotterySM central system goes live in the G2S protocol.
The selection and implementation of these products in FY 14 provides the following benefits:
Both vendors are willing and able to develop products in the DXS protocol initially and upgrade to G2S when
necessary. This supports both Lottery’s current and future business needs
IGT and Spielo have both sustained top performing products in the market long-term, therefore procuring a
combination of VLTs from both suppliers provides the best opportunity available at this time to continue to
sustain and grow Lottery revenues through this initial procurement
Procuring two different models provides the highest potential positive revenue impact because it will allow
Lottery to prioritize VLT placements with top performing retailers and others along the I-5 corridor providing
two new VLT models to each retailer. These retailers represent over 60% of the total retailer base and 70%
of overall sales
Provides the ability to base future purchases for the remainder of the state based on actual performance
data which may result in higher overall revenue in the long-term. By evaluating performance of a smaller
quantity of two different products, Lottery can mitigate the risk of purchasing a large quantity of terminals for
statewide deployment before it can substantiate profitability of the products
Changes historical procurement and deployment strategy from a “one size fits all” common footprint
approach to a strategy based on actual performance data and long-term revenue potential. This aligns with
Lottery’s performance based management strategy
Initially prioritizing retailers in the I-5 corridor provides the greatest likelihood of network availability once
G2S is live
New games will be developed for existing VLTs in an effort to maintain the vitality of current Video Lottery products. The strategies for these new software developments will include selecting new games that will appeal to new players while maintaining a variety of games that will also retain core players. Developments will also retain the same game mix for both PSS and non-PSS retailers by offering two different pay tables for any game targeted as a PSS game.
DSX product obsolescence and limited DXS game libraries pose significant challenges to Lottery and its VLT suppliers. Until the next generation of VLTs are largely deployed in the 2014-2017 timeframe, product management must negotiate contract extensions to provide for additional DXS game development on existing product and must find creative ways to extend the product life and player interest in DXS games.
Additional initiatives for current VLTs are described in the following Marketing Communications, Channel and Sales
Strategies and Research sections.
Marketing Communications Objectives Communication to potential and current players will be developed to address two critical objectives. The first is to build awareness, interest and trial for the full portfolio of Video Lottery games. The second objective is to drive awareness of new Video Lottery games and the continually evolving options for larger jackpot games. Successful execution against these two objectives will create the excitement around new games, jackpots and multiple play occasions that will enable us to meet our overall objectives and to drive players to our retailers. As with all Lottery games, responsible gambling education and messaging will be an integral part of communications. Marketing Communications Support
Comment [HB8]: L. Niswender asked about Responsible Gambling in this section
Level 1 – Published 17
Marketing communications for Video Lottery will focus on key areas which the Lottery believes will be most effective at reaching and motivating the target audience.
Promotions - A variety of promotional activities are planned including:
o Game specific on-premise promotions designed to create customer awareness of new Video LotterySM games and to foster interaction with the Video Lottery terminals. Additionally, these promotions may encourage participants to register on a promotion microsite to win a prize. This will facilitate data-collection and enable ongoing education and communication. These promotions will be supported with radio advertising and Point-of-purchase (POP) merchandising
o Event-based promotions conducted by the Lottery Promotions Team. These event promotions will include fairs, festivals and other venues with age-controlled areas. Attendees at these events will have the opportunity to experience the games and win free-play prizes
o Explore the use of new technologies for promotions, such as texting
Web site and Online - Enhancements to our Web site as well as highly targeted online advertising will be deployed including:
o The retailer locator functionality of oregonlottery.org will be enhanced to enable users to search for a specific type of Video Lottery Game Zone™ venue by geography, business code or specific game type
o Oregonlottery.org will have deeper content on Video Lottery and the ability to feature retailers or retailer categories
o E-mail marketing will let players know when a new game is in the market Signage and Point-of-Purchase - High visibility signage and POP materials will be developed to create awareness of our promotions and of the Video Lottery Game Zone and will include:
o Newly designed POP materials that create awareness of new Video Lottery games and jackpots o Promotions will be supported with unique POP materials such as interactive game cards, wait staff
apparel and premium items o Video Lottery brand refresh for the launch of new VLTs
Cross-Marketing – Create opportunities to cross-promote Scratch-itsSM, draw games and Keno brands with Video Lottery to achieve more consumer-facing advertising of the product.
Channel and Sales Strategy Channel strategy refers to the locations that offer Video Lottery products and the activities that support sales. Video Lottery can only be offered in the on-premise market. High-touch interactions within the retailer environment will be a focus in FY 14. Onsite pop-up promotions will provide an opportunity for player interaction and education within the retail environment. The Lottery will focus on strengthening partnerships and promotional opportunities with corporate retailers as well as recruiting new corporate retailer locations.
Retailers will also be encouraged to take a more active role with Lottery in managing and promoting their VLT business. For example, Lottery will offer retailers the opportunity for co-op programs in both advertising and merchandising, and to participate in retail/consumer promotions such as player promotions, etc. Field Sales Representatives will also continue to strive to achieve the role of trusted advisor to retailers and will also focus on opportunities to work with medium volume retailers to increase their Video Lottery player base and Video Lottery sales. Research Initiatives
Level 1 – Published 18
In addition to the ongoing analysis of internal data and conducting programmatic, cross-product research such as the Lottery’s Bi-Annual Tracking Studies and quarterly Promotions Surveys, the following research and analysis will be conducted to gain actionable guidance for decision-making related to Video Lottery:
Video LotterySM Player Trends Research - Ongoing tracking study conducted every other business year which tracks the behavior and attitudes of current, lapsed and non-players of Video Lottery to inform game selection and promotional efforts
Cross-Vendor Game Testing - Test new Video Lottery games with consumers. Game testing labs will be conducted to ensure that consumer preferences are integrated into game selection and launch
Video Lottery Game Mix Optimization – Conduct advanced analytics to model different game mix scenarios to understand their potential impact on sales and profitability
Video Lottery Equipment Management Tracking – Analyze internal data to assist in optimizing the distribution and management of VLTs
Level 1 – Published 19
FY 2014 Traditional Product Plan Introduction In order to achieve greater efficiencies and return on investment (ROI), the Traditional products game portfolio will continue to evolve into a fully operational end-to-end gaming management system. This effort includes reliability on product data sufficient to manage product operations, minimize costs and increase revenues. Expectations include:
Available analytics integral to operating the business and data considered as our strategic competitive asset
Analytics provided rapidly, are agile and provide operational insight
Ensuring analytical tools are available at the point of decision
Culturally, the product team continues to evolve and embeds analytics into decision and operational gaming
processes
In FY 14, the Lottery will focus on player and retailer acquisition. To do so effectively requires that we consider the appropriate products for each venue. Cooperatively working with field teams and the Senior Sales and New Business Manager to provision retailers with products and equipment befitting specific environments and segments is important to our success. We will explore opportunities to work with other lotteries in our region for all Traditional products.
FY 2014 Scratch-itSM Product Plan
Introduction In FY 13, Scratch-itsSM started very strong with a 7% percent lift year-over-year. As we implemented our first phase of end-to-end product management, it was these early results that reinforced our progress and we continued to experience further support for its purpose. Sales continued to climb and costs continue to decline. Cost savings were a result of fewer returns, less manpower to manage the returns and a significant drop in destruction costs. From October 19 through December 31, year-over-year holiday sales totaled over $25 million, however, post-holiday we experienced a dramatic decline in sales with product returns. This phenomenon did not stop until June 2013 and was partly due to the implementation of 2nd Chance Drawings which requires returning the game prior to the actual 2nd chance drawing. Implementing 2nd Chance Drawings allowed us to resume the official ending of games and ensured current games were in the market. For FY 14 and Phase II of end-to-end product management, managing game distribution, game launches, game endings and product fulfillment will be our primary focus. Successfully adding these areas will positively impact Scratch-itSM profitability. Ensuring specific retail segments are carrying Scratch-its and others are not will allow us to better manage game distribution. We have identified one segment, on-premise bars and taverns, that carry Scratch-its with a high return rate. Scratch-its in the on-premise market represent less than 4% of sales and with production and labor costs high, we will develop and implement an exit strategy to remove this product from these types of locations. Over the life-cycle of Scratch-its to date, all game launches have been planned. This has afforded Lottery field staff the opportunity to discuss new games with retailers prior to launch. However, it is also a practice that has long been absent in many lottery jurisdictions across the U.S. Because game introductions should be a result of game endings, which allows for space in product dispensers, planning for a game launch negatively impacts game inventory and production. Instead of waiting for a game to end, pushing another game into the market floods the market with product needlessly. The long-term result equates to high returns and increases production and labor costs. In FY 14, we will change our game launch strategy to game introduction based upon game end.
Comment [HB9]: L. Niswender commented “with a few exceptions?”
Level 1 – Published 20
In FY 13, we began Phase 1 of our product fulfillment change management implementation and on January 1, 2014 we will end terminal orders. All product ordering will be accomplished through a predictive ordering system via our product fulfillment team of specialists. This will minimize ordering points from three to one and allow for better product controls. This includes minimizing production, minimizing returns, minimizing labor costs and maximizing the relationship between the field sales staff and the retailer. We will pursue opportunities to develop Scratch-itSM games with iconic Oregon brands such as Portland Timbers / Thorns. Development of the first Lottery retailer specific Scratch-it (7-Eleven) will launch in early FY 14 with the intent to develop additional retailer specific Scratch-itsSM. Game Performance Value Proposition / Contribution to the Lottery’s Game Portfolio
$118.2 million in sales forecasted for FY 13
Reflects 37% of Traditional game sales
One of the top three Oregon Lottery®
games with the highest level of unaided recall among Oregonians (35%
unaided recall, versus Powerball®
at 41%, MegabucksSM at 39%, Keno at 17% and Mega Millions®
at 17% (Source:
November 2012 Tracking Study)
Introductory game which attracts new players to Lottery. Across several qualitative studies conducted by the
Lottery over the years, Scratch-its is often cited as the first Lottery game consumers played once they became
18 years old
Addresses purchase and play motivators of more visual, impulse purchasers. Of all the Traditional product
games offered, Scratch-its are visible at the point-of-purchase allowing players to choose the games that are
most appealing to them
Appeals to a wide range of ages and player segments. Reflects the highest proportion of core players in the 18-
34 age segment (44% of core Scratch-it players). Research tells us 53% of core Crossword and 49% of core
Bingo Scratch-it players are 18-34 years old (Source: 2011/2012 Tracking Studies)
Appeals to a player segment that is more comfortable with this type of gaming product which is considered more
of a soft form of gaming than some of the Lottery’s other product offerings
The addition of 2nd Chance Drawings in March 2013 increase the player value of Scratch-its in the following
ways:
o Scratch-it management has been made more efficient because tickets are no longer pulled out of the market once the top prize is hit
o Adds to the play experience and provides another chance to win a prize o Increases player loyalty by providing an appealing reason to register and visit the Lottery’s Web site
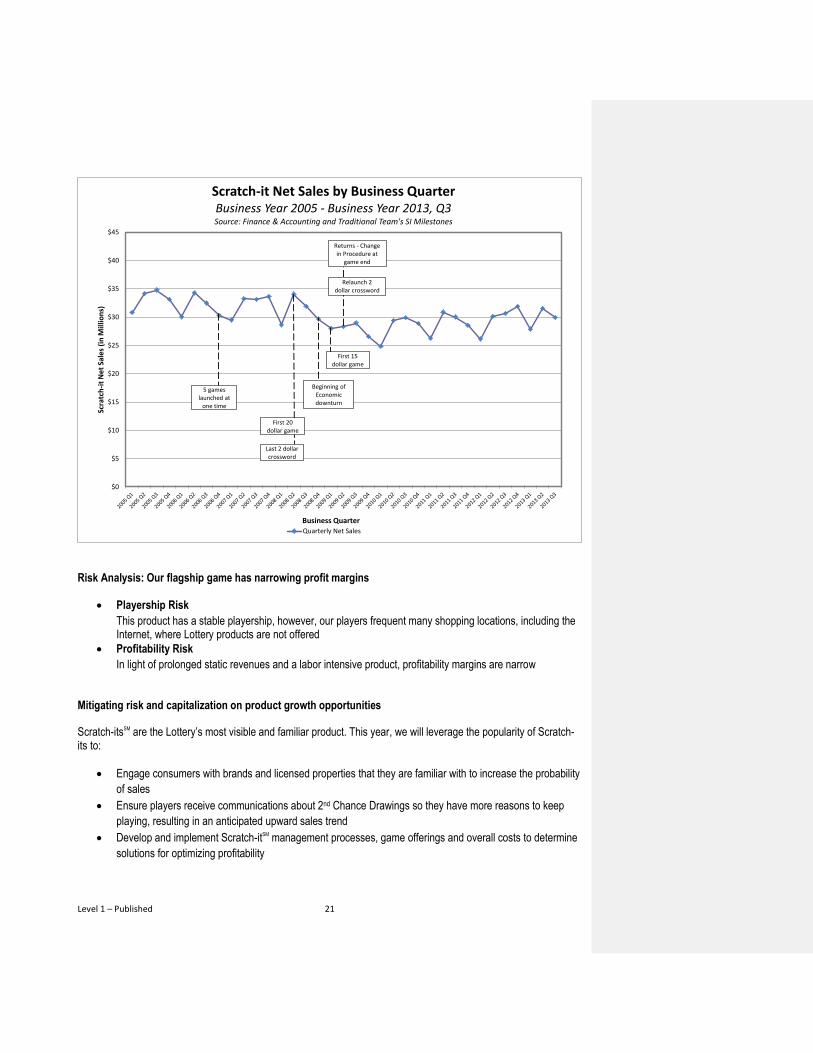
regularly. As of June 2013, over 25,000 players had registered to participate in 2nd Chance Drawings Net Sales History Scratch-it tickets reached their revenue peak in FY 97. Until FY 09, revenue had remained relatively static. However, as with most Lottery games, Scratch-its experienced a decline in sales starting in late FY 08. The DAS Office of Economic Analysis estimates (May 2013 forecast) that Scratch-its will experience a 0.6% increase in sales over FY 12 ($118.2 million in FY13). However, this also reflects a 5.5% increase over FY 09 sales ($112 million) and the continuation of slow, steady sales increases year-over-year.
Comment [HB10]: Do we want to update with a June 2013 number?
Level 1 – Published 21
Risk Analysis: Our flagship game has narrowing profit margins
Playership Risk
This product has a stable playership, however, our players frequent many shopping locations, including the Internet, where Lottery products are not offered
Profitability Risk
In light of prolonged static revenues and a labor intensive product, profitability margins are narrow Mitigating risk and capitalization on product growth opportunities
Scratch-itsSM are the Lottery’s most visible and familiar product. This year, we will leverage the popularity of Scratch-its to:
Engage consumers with brands and licensed properties that they are familiar with to increase the probability
of sales
Ensure players receive communications about 2nd Chance Drawings so they have more reasons to keep
playing, resulting in an anticipated upward sales trend
Develop and implement Scratch-itSM management processes, game offerings and overall costs to determine
solutions for optimizing profitability
$0
$5
$10
$15
$20
$25
$30
$35
$40
$45
Scra
tch
-it
Net
Sal
es (
in M
illio
ns)
Business Quarter
Scratch-it Net Sales by Business QuarterBusiness Year 2005 - Business Year 2013, Q3Source: Finance & Accounting and Traditional Team's SI Milestones
Quarterly Net Sales
Beginning of Economicdownturn
First 20dollar game
Returns - Change in Procedure at
game end
Last 2 dollar crossword
Relaunch 2 dollar crossword
First 15 dollar game
5 games launched at
one time
Level 1 – Published 22
Review and leverage statistics allowing Lottery to take an in-depth approach of analyzing game odds and
product prize payout percent
Continue to evolve roles and responsibilities that maximize overall profitability
Develop a distribution channel and implementation strategy that targets high-traffic retail locations and other
locations where Lottery products are currently not available and that fit within Lottery’s operating model
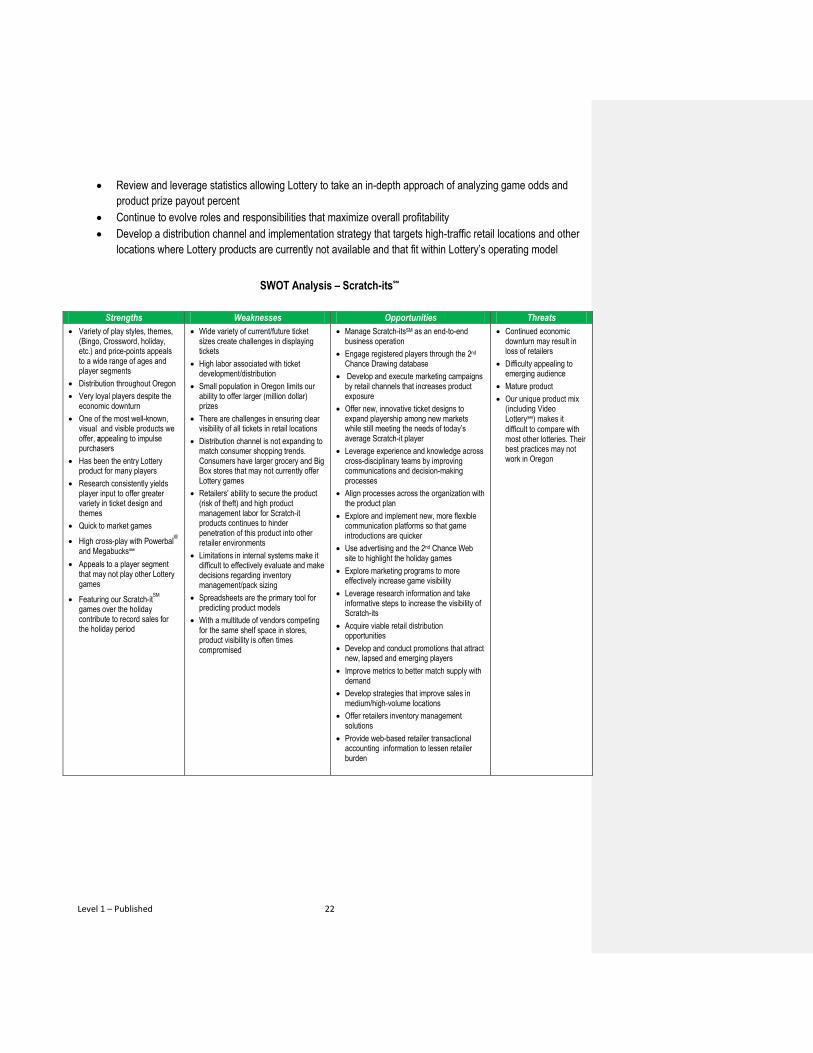
SWOT Analysis – Scratch-its℠
Strengths Weaknesses Opportunities Threats
Variety of play styles, themes, (Bingo, Crossword, holiday, etc.) and price-points appeals to a wide range of ages and player segments
Distribution throughout Oregon
Very loyal players despite the economic downturn
One of the most well-known, visual and visible products we offer, appealing to impulse purchasers
Has been the entry Lottery product for many players
Research consistently yields player input to offer greater variety in ticket design and themes
Quick to market games
High cross-play with Powerball®
and Megabucks℠
Appeals to a player segment that may not play other Lottery games
Featuring our Scratch-itSM
games over the holiday contribute to record sales for the holiday period
Wide variety of current/future ticket sizes create challenges in displaying tickets
High labor associated with ticket development/distribution
Small population in Oregon limits our ability to offer larger (million dollar) prizes
There are challenges in ensuring clear visibility of all tickets in retail locations
Distribution channel is not expanding to match consumer shopping trends. Consumers have larger grocery and Big Box stores that may not currently offer Lottery games
Retailers’ ability to secure the product (risk of theft) and high product management labor for Scratch-it products continues to hinder penetration of this product into other retailer environments
Limitations in internal systems make it difficult to effectively evaluate and make decisions regarding inventory management/pack sizing
Spreadsheets are the primary tool for predicting product models
With a multitude of vendors competing for the same shelf space in stores, product visibility is often times compromised
Manage Scratch-itsSM as an end-to-end business operation
Engage registered players through the 2nd Chance Drawing database
Develop and execute marketing campaigns by retail channels that increases product exposure
Offer new, innovative ticket designs to expand playership among new markets while still meeting the needs of today’s average Scratch-it player
Leverage experience and knowledge across cross-disciplinary teams by improving communications and decision-making processes
Align processes across the organization with the product plan
Explore and implement new, more flexible communication platforms so that game introductions are quicker
Use advertising and the 2nd Chance Web site to highlight the holiday games
Explore marketing programs to more effectively increase game visibility
Leverage research information and take informative steps to increase the visibility of Scratch-its
Acquire viable retail distribution opportunities
Develop and conduct promotions that attract new, lapsed and emerging players
Improve metrics to better match supply with demand
Develop strategies that improve sales in medium/high-volume locations
Offer retailers inventory management solutions
Provide web-based retailer transactional accounting information to lessen retailer burden
Continued economic downturn may result in loss of retailers
Difficulty appealing to emerging audience
Mature product
Our unique product mix (including Video Lottery℠) makes it
difficult to compare with most other lotteries. Their best practices may not work in Oregon
Level 1 – Published 23
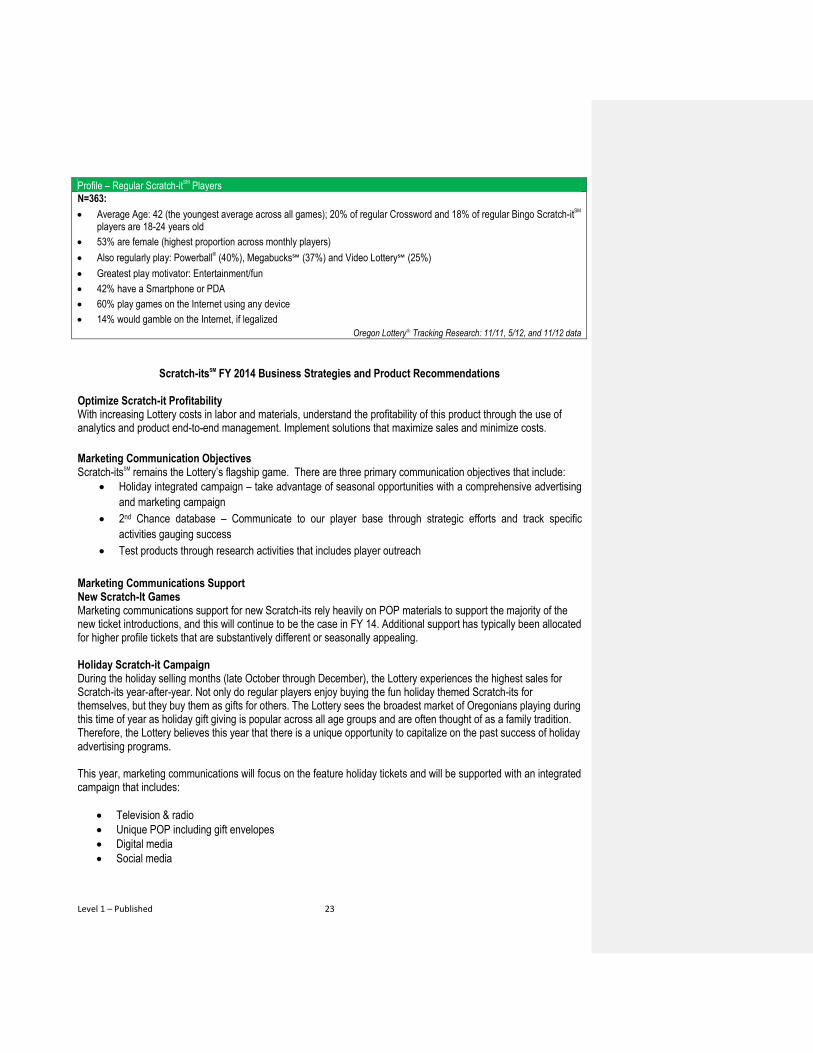
Profile – Regular Scratch-itSM
Players
N=363:
Average Age: 42 (the youngest average across all games); 20% of regular Crossword and 18% of regular Bingo Scratch-itSM
players are 18-24 years old
53% are female (highest proportion across monthly players)
Also regularly play: Powerball® (40%), Megabucks℠ (37%) and Video Lottery℠ (25%)
Greatest play motivator: Entertainment/fun
42% have a Smartphone or PDA
60% play games on the Internet using any device
14% would gamble on the Internet, if legalized
Oregon Lottery® Tracking Research: 11/11, 5/12, and 11/12 data
Scratch-itsSM FY 2014 Business Strategies and Product Recommendations Optimize Scratch-it Profitability With increasing Lottery costs in labor and materials, understand the profitability of this product through the use of analytics and product end-to-end management. Implement solutions that maximize sales and minimize costs.
Marketing Communication Objectives Scratch-itsSM remains the Lottery’s flagship game. There are three primary communication objectives that include:
Holiday integrated campaign – take advantage of seasonal opportunities with a comprehensive advertising
and marketing campaign
2nd Chance database – Communicate to our player base through strategic efforts and track specific
activities gauging success
Test products through research activities that includes player outreach
Marketing Communications Support New Scratch-It Games Marketing communications support for new Scratch-its rely heavily on POP materials to support the majority of the new ticket introductions, and this will continue to be the case in FY 14. Additional support has typically been allocated for higher profile tickets that are substantively different or seasonally appealing. Holiday Scratch-it Campaign During the holiday selling months (late October through December), the Lottery experiences the highest sales for Scratch-its year-after-year. Not only do regular players enjoy buying the fun holiday themed Scratch-its for themselves, but they buy them as gifts for others. The Lottery sees the broadest market of Oregonians playing during this time of year as holiday gift giving is popular across all age groups and are often thought of as a family tradition. Therefore, the Lottery believes this year that there is a unique opportunity to capitalize on the past success of holiday advertising programs. This year, marketing communications will focus on the feature holiday tickets and will be supported with an integrated campaign that includes:
Television & radio
Unique POP including gift envelopes
Digital media
Social media
Level 1 – Published 24
Out-of-home media
Public relations
Events
Channel Strategy Channel strategies refer to the locations that Scratch-itSM products are placed and the activities to support sales. There are two primary channels that sell the majority of the Scratch-it product: Multi-register and Convenience store segments. Over the next year, Lottery will focus on several key channel initiatives:
Retailer recruitment of corporate chain locations / mass marketers
Development and implementation of new contracting models
Implementation of end-to-end product management
Leveraging business intelligence systems to guide retailer and channel strategies
Research Initiatives In addition to the ongoing analysis of internal data and conducting cross-product research such as the Lottery’s Bi-Annual Tracking Studies and quarterly Promotions Surveys, the following research and analysis will also be conducted to gain actionable guidance for decision-making related to the Scratch-it product specifically. Efforts will include:
Scratch-itsSM Payout Analysis - Statistical analysis aimed at revisiting, confirming and expanding on past analysis related to optimizing Scratch-its payout percentages.
Scratch-its Business Intelligence Program – A cross-functional team will work on developing requirements for building a more efficient and comprehensive business intelligence system for easier access to reliable, end-to-end product data.
2nd Chance Drawing Participant Surveys – Invite 2nd Chance Drawing registrants through the Lottery’s 2nd Chance Web site to participate in surveys designed to obtain consumers’ opinions and preferences related to 2nd Chance and the overall Scratch-it product.
Scratch-its Game Indexing Report – Since 2009, Lottery research has analyzed Scratch-it game sales data and maintained index scores that are used to help pinpoint combinations of play styles, themes and key game features that have been more or less successful in the past. Patterns observed across successful past games inform decisions about combinations to consider for future tickets. The Index Report will once again be updated in FY 14.
Level 1 – Published 25
FY 2014 JACKPOT GAMES PRODUCT PLAN
Introduction Our jackpot games will continue to be a key FY 14 product focus. Since Mega Millions
®
was introduced into our product mix in 2010, we have experienced a cannibalization of sales in our jackpot game category. Players are favoring the game with the highest jackpot amount and are not consistently playing all three games: Powerball
®
, Mega Millions and MegabucksSM.
Although Powerball has increased to a $2 price-point, sales have not returned to previous Powerball highs when the ticket price was at $1. This is partly due to cannibalization experienced with the introduction of Mega Millions. MUSL required changes to the Mega Millions matrix and starting jackpot are to be implemented on October 19, 2013. MUSL has requested that the Power Play
®
multiplier for Powerball be changed during this same time with an implementation date to be determined.
Megabucks is Oregon’s favored game. We have experienced significant increases in sales (upwards of 40% year-over-year) when the jackpot increases over $10 million dollars. In fact, Mega Millions starts at $12 million, yet Oregon players will favor Megabucks and purchase this product at lower jackpot amounts. With encouraging sales results and an Oregon following, Megabucks is still suffering the effects of cannibalization as well and with frequent jackpot hits in excess of eight a year, the product is not performing to revenue projections.
Product branding, jackpot visibility, product promotions, retail distribution expansion and a focus on an in-state Lotto game that achieves profitability will be our primary focus. Current efforts in support of jackpot visibility are the Jackpot Blitz program and the Powerball BOGO promotion. We will promote the cross-play of our jackpot games. Jackpot Game Performance Value Proposition / Contribution to the Lottery’s Game Portfolio
Powerball, Mega Millions and Megabucks are projected to account for 30% of Traditional Lottery game revenues in FY 13
Broad, diverse player base. Thirty-six percent (36%) of adult Oregonians have played Powerball, Mega Millions and/or Megabucks in the past year (Source: November 2012 Tracking Study)
High levels of cross-play among core draw game players. For example, 77% of core Powerball players also play Megabucks. Two-thirds of this player segment also play Mega Millions (Source: 2012 Tracking Studies)
Low overhead and administrative cost with a broad player base
Powerball and Mega Millions have a low 50% prize payout percent
Powerball and Megabucks had been less impacted by the economic downturn between FY 08 and FY 09 as compared to “impulse purchase” Lottery games such as Scratch-itsSM or Lottery on-premise games
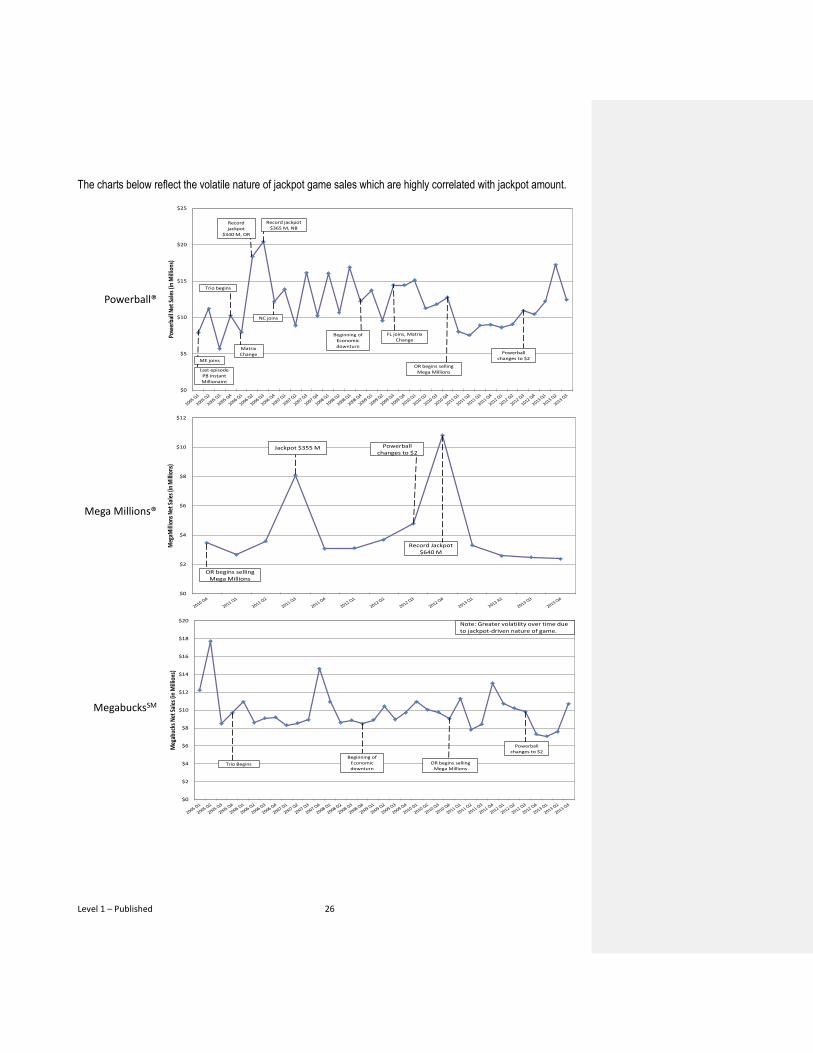
Net Sales History To date, Powerball reached its highest level of net sales in FY 06 at $59.1 million (DAS Office of Economic Analysis). Mega Millions reached its highest level of sales in FY 12 at $22.2 million and Megabucks reached its highest level of sales in FY 11 at $40.9 million.
Level 1 – Published 26
The charts below reflect the volatile nature of jackpot game sales which are highly correlated with jackpot amount.
$0
$2
$4
$6
$8
$10
$12
$14
$16
$18
$20
Meg
abuc
ks N
et S
ales
(in
Mill
ions
)
Business Quarter
Megabucks Net Sales by Business QuarterBusiness Year 2005 - Business Year 2013, Q3Source: Finance & Accounting and Oregon Lottery History website
Quarterly Net Sales
Note: Greater volatility over time due to jackpot-driven nature of game.
Beginning of Economicdownturn
Trio Begins
Powerball changes to $2
OR begins selling Mega Millions
MegabucksSM
$0
$5
$10
$15
$20
$25
Pow
erba
ll N
et S
ales
(in
Mill
ions
)
Business Quarter
Powerball Net Sales by Business QuarterBusiness Year 2005 - Business Year 2013, Q3
Source: Finance & Accounting and Powerball.com History
Quarterly Net Sales
Last episode PB Instant Millionaire
Record jackpot $365 M, NB
FL joins, Matrix Change
ME joins
Trio begins
Matrix Change
Record jackpot
$340 M, OR
NC joins
Beginning of Economicdownturn
Powerball changes to $2
OR begins selling Mega Millions
Powerball®
$0
$2
$4
$6
$8
$10
$12
Meg
aMill
ions
Net
Sal
es (i
n M
illio
ns)
Business Quarter
MegaMillions Net Sales by Business QuarterBusiness Year 2010 - Business Year 2013, Q3Source: Finance & Accounting and Oregon Lottery History website
Quarterly Net Sales
Powerball changes to $2
OR begins selling Mega Millions
Record Jackpot $640 M
Jackpot $355 M
Mega Millions®
Level 1 – Published 27
Risk Analysis Powerball
®
, Mega Millions®
and MegabucksSM continue to make a significant contribution to Lottery Traditional game sales. Powerball and Mega Millions Profitability Risk Very Low – High contribution margin due to 50% prize payout and low overhead. Megabucks Profitability Risk Very High – Low contribution margin due to its 70% prize payout, unpredictable annuity rates and high $1 million base jackpot amount. Jackpot Games Playership / Retailer Risk Overall jackpot games playership has decreased four percentage points since November 2009, from 40% in Nov ’09 (Mega Millions was not yet offered) to 36% in Nov ’12 (Tracking Studies; n=1000, reflecting an error margin of + 3.2% at 95% confidence level). The level of spending since FY 10 has increased by 2.9%. These games appeal to a wide range of age and player segments, however, the introduction of Mega Millions has not resulted in a significant increase in overall sales commensurate with the launching of an additional game. Jackpot Games Risk Analysis With the increase of Powerball to a $2 price-point and the introduction of Mega Millions into the game mix, there is little distinction between game play other than the jackpot amount. Oregon players have been gravitating to Megabucks because the odds are favorable, and only when Powerball or Mega Millions reach significant jackpot levels (over $150 million) do we experience an increase in sales. Jackpot Game Profitability Risk Powerball and Mega Millions provide the least profitability risk because of the low payout percentages and the overhead is equally low. However, Megabucks payout is significantly higher and poses a profitability risk to the agency. Though Megabucks has a solid Oregon player base at a 70% prize payout, it is considered an at-risk game.
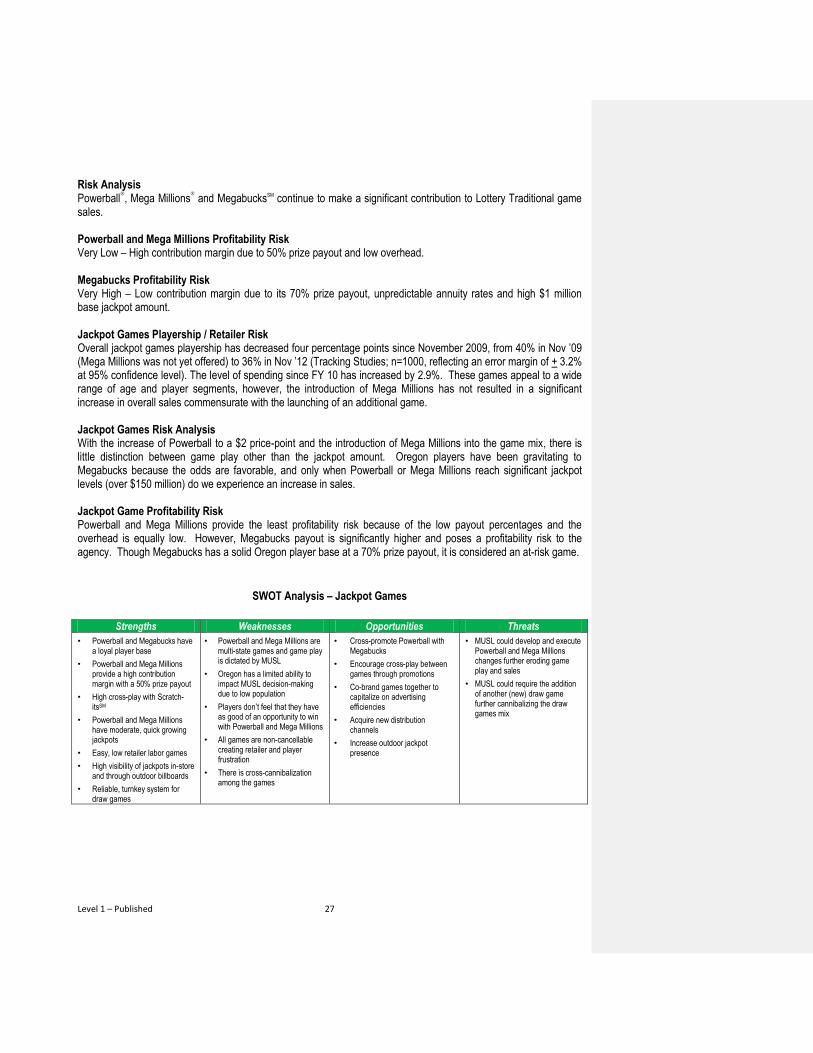
SWOT Analysis – Jackpot Games
Strengths Weaknesses Opportunities Threats
• Powerball and Megabucks have a loyal player base
• Powerball and Mega Millions provide a high contribution margin with a 50% prize payout
• High cross-play with Scratch-itsSM
• Powerball and Mega Millions have moderate, quick growing jackpots
• Easy, low retailer labor games
• High visibility of jackpots in-store and through outdoor billboards
• Reliable, turnkey system for draw games
• Powerball and Mega Millions are multi-state games and game play is dictated by MUSL
• Oregon has a limited ability to impact MUSL decision-making due to low population
• Players don’t feel that they have as good of an opportunity to win with Powerball and Mega Millions
• All games are non-cancellable creating retailer and player frustration
• There is cross-cannibalization among the games
• Cross-promote Powerball with Megabucks
• Encourage cross-play between games through promotions
• Co-brand games together to capitalize on advertising efficiencies
• Acquire new distribution channels
• Increase outdoor jackpot presence
• MUSL could develop and execute Powerball and Mega Millions changes further eroding game play and sales
• MUSL could require the addition of another (new) draw game further cannibalizing the draw games mix
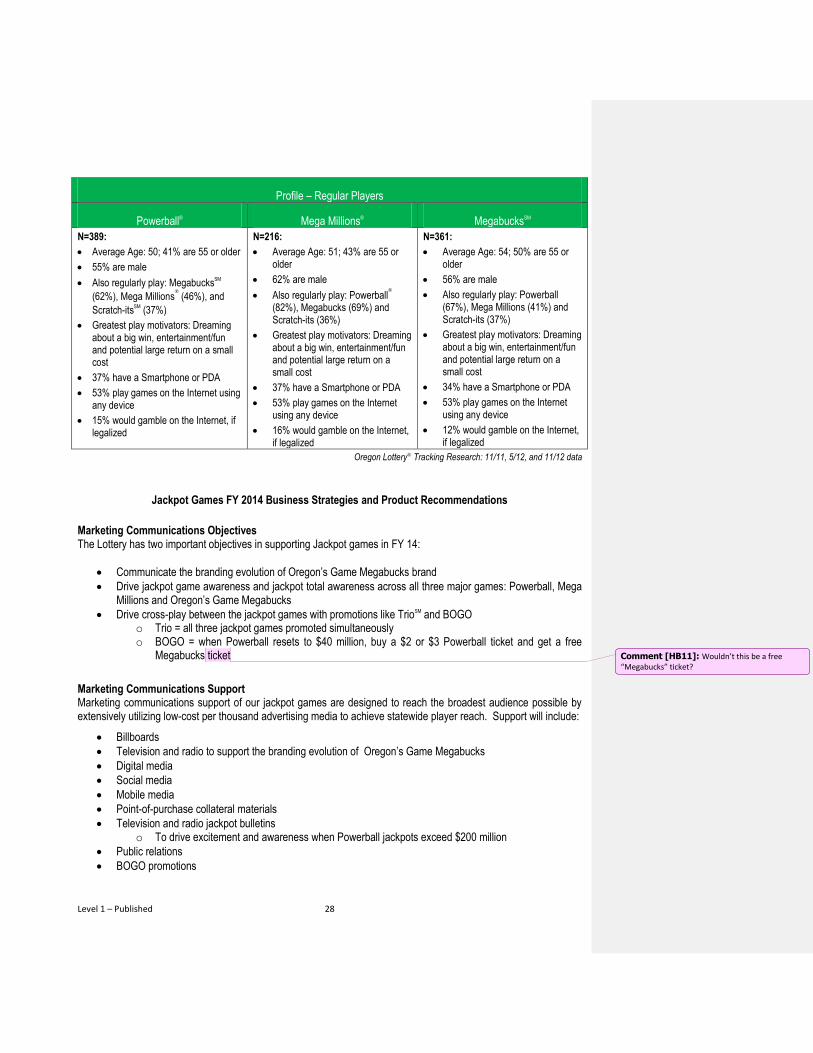
Level 1 – Published 28
Profile – Regular Players
Powerball® Mega Millions® MegabucksSM
N=389:
Average Age: 50; 41% are 55 or older
55% are male
Also regularly play: MegabucksSM
(62%), Mega Millions®
(46%), and
Scratch-itsSM
(37%)
Greatest play motivators: Dreaming about a big win, entertainment/fun and potential large return on a small cost
37% have a Smartphone or PDA
53% play games on the Internet using any device
15% would gamble on the Internet, if legalized
N=216:
Average Age: 51; 43% are 55 or older
62% are male
Also regularly play: Powerball®
(82%), Megabucks (69%) and Scratch-its (36%)
Greatest play motivators: Dreaming about a big win, entertainment/fun and potential large return on a small cost
37% have a Smartphone or PDA
53% play games on the Internet using any device
16% would gamble on the Internet, if legalized
N=361:
Average Age: 54; 50% are 55 or older
56% are male
Also regularly play: Powerball (67%), Mega Millions (41%) and Scratch-its (37%)
Greatest play motivators: Dreaming about a big win, entertainment/fun and potential large return on a small cost
34% have a Smartphone or PDA
53% play games on the Internet using any device
12% would gamble on the Internet, if legalized
Oregon Lottery® Tracking Research: 11/11, 5/12, and 11/12 data
Jackpot Games FY 2014 Business Strategies and Product Recommendations
Marketing Communications Objectives The Lottery has two important objectives in supporting Jackpot games in FY 14:
Communicate the branding evolution of Oregon’s Game Megabucks brand
Drive jackpot game awareness and jackpot total awareness across all three major games: Powerball, Mega Millions and Oregon’s Game Megabucks
Drive cross-play between the jackpot games with promotions like TrioSM and BOGO o Trio = all three jackpot games promoted simultaneously o BOGO = when Powerball resets to $40 million, buy a $2 or $3 Powerball ticket and get a free
Megabucks ticket
Marketing Communications Support Marketing communications support of our jackpot games are designed to reach the broadest audience possible by extensively utilizing low-cost per thousand advertising media to achieve statewide player reach. Support will include:
Billboards
Television and radio to support the branding evolution of Oregon’s Game Megabucks
Digital media
Social media
Mobile media
Point-of-purchase collateral materials
Television and radio jackpot bulletins o To drive excitement and awareness when Powerball jackpots exceed $200 million
Public relations
BOGO promotions
Comment [HB11]: Wouldn’t this be a free “Megabucks” ticket?
Level 1 – Published 29
Channel Strategy Channel strategy refers to the locations that Powerball
®
, Mega Millions®
and MegabucksSM are placed and the activities to support sales. There are two channels that sell the majority of these products: Multi-register and Convenience store segments. Over the next year, we will focus on several key channel initiatives:
Retailer recruitment of corporate chain locations / mass marketers
Development and implementation of new contracting models
Implementation of end-to-end product management
Leveraging business intelligence systems to guide retailer and channel strategies
Research Initiatives
Ongoing analysis of internal data, and results from the Lottery’s Bi-Annual Tracking Studies and quarterly Promotions Surveys will be used to evaluate potential interactions across Powerball, Mega Millions and Megabucks and monitor shifts in playership.
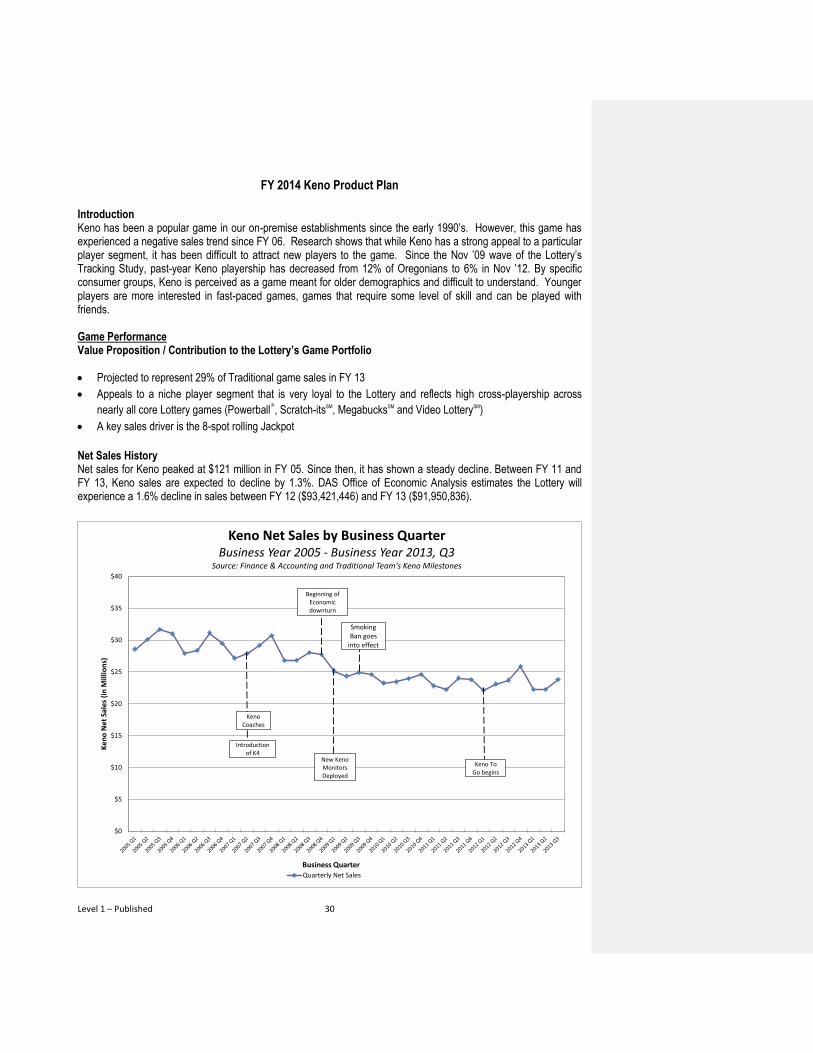
Level 1 – Published 30
$0
$5
$10
$15
$20
$25
$30
$35
$40
Ken
o N
et S
ales
(in
Mill
ion
s)
Business Quarter
Keno Net Sales by Business QuarterBusiness Year 2005 - Business Year 2013, Q3
Source: Finance & Accounting and Traditional Team's Keno Milestones
Quarterly Net Sales
Beginning of Economicdownturn
New Keno Monitors Deployed
Smoking Ban goes
into effect
Introductionof K4
Keno Coaches
Keno To Go begins
FY 2014 Keno Product Plan
Introduction Keno has been a popular game in our on-premise establishments since the early 1990’s. However, this game has experienced a negative sales trend since FY 06. Research shows that while Keno has a strong appeal to a particular player segment, it has been difficult to attract new players to the game. Since the Nov ’09 wave of the Lottery’s Tracking Study, past-year Keno playership has decreased from 12% of Oregonians to 6% in Nov ’12. By specific consumer groups, Keno is perceived as a game meant for older demographics and difficult to understand. Younger players are more interested in fast-paced games, games that require some level of skill and can be played with friends. Game Performance Value Proposition / Contribution to the Lottery’s Game Portfolio
Projected to represent 29% of Traditional game sales in FY 13
Appeals to a niche player segment that is very loyal to the Lottery and reflects high cross-playership across
nearly all core Lottery games (Powerball®
, Scratch-itsSM, MegabucksSM and Video LotterySM)
A key sales driver is the 8-spot rolling Jackpot
Net Sales History Net sales for Keno peaked at $121 million in FY 05. Since then, it has shown a steady decline. Between FY 11 and FY 13, Keno sales are expected to decline by 1.3%. DAS Office of Economic Analysis estimates the Lottery will experience a 1.6% decline in sales between FY 12 ($93,421,446) and FY 13 ($91,950,836).
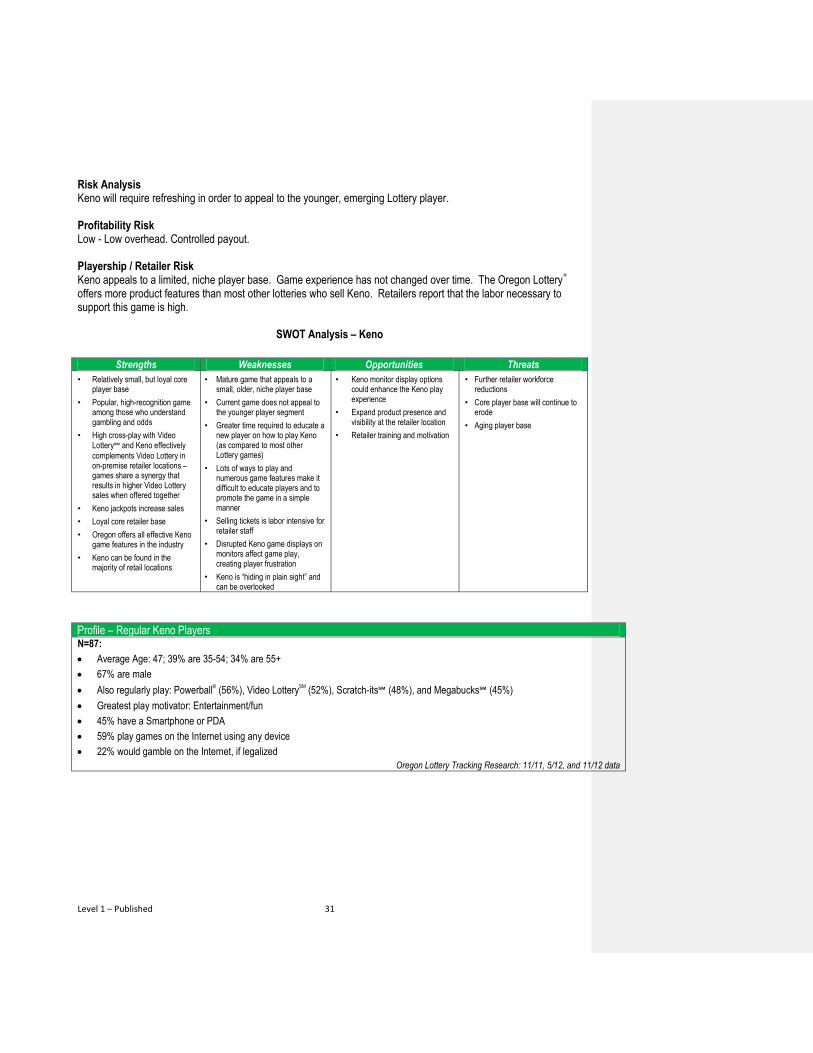
Level 1 – Published 31
Risk Analysis Keno will require refreshing in order to appeal to the younger, emerging Lottery player. Profitability Risk Low - Low overhead. Controlled payout. Playership / Retailer Risk Keno appeals to a limited, niche player base. Game experience has not changed over time. The Oregon Lottery
®
offers more product features than most other lotteries who sell Keno. Retailers report that the labor necessary to support this game is high.
SWOT Analysis – Keno
Strengths Weaknesses Opportunities Threats
• Relatively small, but loyal core player base
• Popular, high-recognition game among those who understand gambling and odds
• High cross-play with Video Lottery℠ and Keno effectively
complements Video Lottery in on-premise retailer locations – games share a synergy that results in higher Video Lottery sales when offered together
• Keno jackpots increase sales
• Loyal core retailer base
• Oregon offers all effective Keno game features in the industry
• Keno can be found in the majority of retail locations
• Mature game that appeals to a small, older, niche player base
• Current game does not appeal to the younger player segment
• Greater time required to educate a new player on how to play Keno (as compared to most other Lottery games)
• Lots of ways to play and numerous game features make it difficult to educate players and to promote the game in a simple manner
• Selling tickets is labor intensive for retailer staff
• Disrupted Keno game displays on monitors affect game play, creating player frustration
• Keno is “hiding in plain sight” and can be overlooked
• Keno monitor display options could enhance the Keno play experience
• Expand product presence and visibility at the retailer location
• Retailer training and motivation
• Further retailer workforce reductions
• Core player base will continue to erode
• Aging player base
Profile – Regular Keno Players N=87:
Average Age: 47; 39% are 35-54; 34% are 55+
67% are male
Also regularly play: Powerball® (56%), Video Lottery
SM (52%), Scratch-its℠ (48%), and Megabucks℠ (45%)
Greatest play motivator: Entertainment/fun
45% have a Smartphone or PDA
59% play games on the Internet using any device
22% would gamble on the Internet, if legalized
Oregon Lottery Tracking Research: 11/11, 5/12, and 11/12 data
Level 1 – Published 32
Keno FY 2014 Business Strategies and Product Recommendations Ensure Product Visibility Through promotional activities, advertising, 8-spot jackpot visibility and Keno monitor upgrades, continue to increase product visibility. Marketing Communications Objectives Lottery will re-energize the Keno brand by creating a new branding campaign designed to attract new players, a younger 21+ adult audience and entice lapsed and infrequent players. The new campaign will focus both on Keno and Keno To Go and will communicate the ease and fun that the Lottery’s Keno game offers players.
With the introduction of Keno To Go, Keno has arguably become the most universally accessible of the Oregon Lottery® games. This presents a significant opportunity to appeal to a more mobile, more social player. Marketing communications will focus on reaching this new audience with a compelling benefit proposition for trial and ongoing playership. Due to the nature of the more mobile, social media savvy player, our choice of marketing channels will change significantly from previous efforts.
Marketing Communications Support Marketing communications support of the new campaign will vary by channel with targeted messaging and communication vehicles specific to the audience we seek to reach and to on and off-premise opportunities.
Advertising Channel Support The advertising channels we will utilize have been selected to reach the younger (21-34 year old) adult consumer with a new Keno branding campaign. This demographic consumes media in a much different pattern than our 35+ adult players; therefore we will focus our efforts in the following channels:
o Digital media o Social media o Mobile Media o Keno brand campaign micro-site o Out-of-home advertising o Point-of-purchase collateral materials o Radio o Television o Public relations
On-Premise Point-of-purchase materials will continue to provide the majority of the support for Keno in on-premise locations. New POP will be developed to target the younger 21+ adult player. The Oregon Lottery will continue to provide cooperative support to on-premise retailers with Keno napkins and pencils. Additionally, Keno Free Play certificates will be distributed on premise during key promotional periods.
Off-Premise Marketing communications efforts will be focused on Keno To Go, with a particular emphasis on convenience stores. The Oregon Lottery will partner with convenience chains and/or beverage distributors to award Keno To Go Free Play certificates.
Channel Strategy Lottery will continue to engage and train retailers and their staff in the on-premise segment to learn Keno game play. The Lottery will also focus on:
Level 1 – Published 33
Retailer recruitment of corporate on-premise chain locations
Development and implementation of new contracting models
Implementation of end-to-end product management
Leveraging business intelligence systems to guide retailer and channel strategies
Research Initiatives In addition to the ongoing analysis of internal data, programmatic, cross-product surveys such as the Lottery’s Bi-Annual Tracking Studies and quarterly Promotions Surveys will be conducted to gain actionable guidance for decision-making related specifically to Keno.
Level 1 – Published 34
FY 2014 RaffleSM Product Plan
Introduction Each Oregon Lottery
®
RaffleSM game that launched in FY 13 sold out. This game continues to create excitement among Oregonians, despite the absence of TV advertising and a less successful track record for this type of game in other lottery jurisdictions. Players and retailers alike appear anxious for each launch. As of November 2011, awareness, ad appeal and playership reported by current Lottery players have remained stable when compared to previous Raffle games (Source: Lottery Fall 2010 and 2011 Promotions Surveys). To effectively offer Raffle games, we will continue to create high awareness and in FY 14 that means a slight change to our current launch pattern and the addition of advertising support including digital advertising and real-time updates on ticket availability.
Game Performance Value Proposition/Contribution to the Lottery’s Game Portfolio
First new Oregon Lottery draw game introduction since FY 06
Projected by the end of FY 13 to represent $7.997 million in total transfers for the state since FY 10
Has created significant, positive word-of-mouth and free media coverage for the Lottery
Net Sales History Raffle represented $5 million in Lottery sales in FY 12 and is projected to represent $5 million in sales in FY 13.
Fiscal Year Sales Transfers to State
FY 13 (DAS May ’13 Forecast) $5.0 million $1.6 million
FY 12 $5.0 million $1.6 million
Risk Analysis Changes to the game, including frequency of game launches, could risk revenue potential.
Profitability Risk High – The nature of Raffle games is unique in that there are a set number of tickets, a limited time to sell them and guaranteed prizes. If we don’t sell all the tickets, the game could be unprofitable. Also, following best practices of other lotteries, it is important to advertise each Raffle introduction to create excitement and ensure sell-out which requires some investment of advertising dollars.
Risk Mitigation with Playership/Retailer Appeals to a wide range of age and player segments. Brings in new players. This product has created renewed excitement about the Lottery among retailers and players.
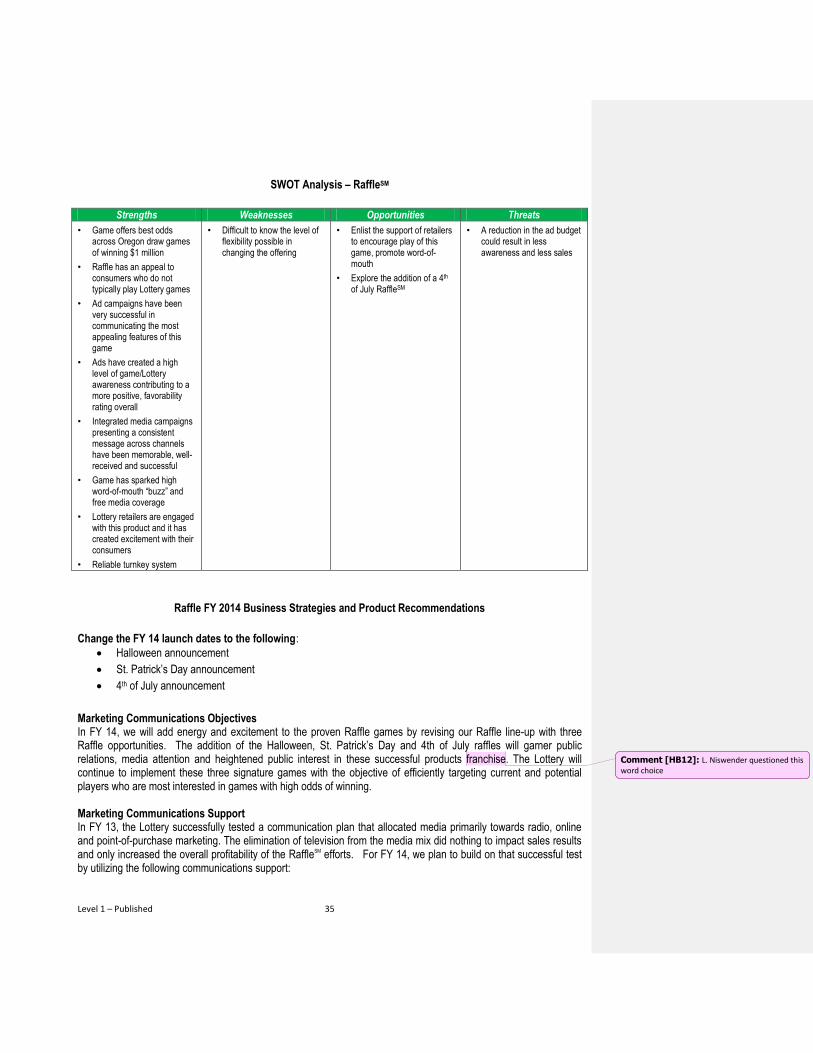
Level 1 – Published 35
SWOT Analysis – RaffleSM
Strengths Weaknesses Opportunities Threats
• Game offers best odds across Oregon draw games of winning $1 million
• Raffle has an appeal to consumers who do not typically play Lottery games
• Ad campaigns have been very successful in communicating the most appealing features of this game
• Ads have created a high level of game/Lottery awareness contributing to a more positive, favorability rating overall
• Integrated media campaigns presenting a consistent message across channels have been memorable, well-received and successful
• Game has sparked high word-of-mouth “buzz” and free media coverage
• Lottery retailers are engaged with this product and it has created excitement with their consumers
• Reliable turnkey system
• Difficult to know the level of flexibility possible in changing the offering
• Enlist the support of retailers to encourage play of this game, promote word-of-mouth
• Explore the addition of a 4th of July RaffleSM
• A reduction in the ad budget could result in less awareness and less sales
Raffle FY 2014 Business Strategies and Product Recommendations
Change the FY 14 launch dates to the following:
Halloween announcement
St. Patrick’s Day announcement
4th of July announcement
Marketing Communications Objectives In FY 14, we will add energy and excitement to the proven Raffle games by revising our Raffle line-up with three Raffle opportunities. The addition of the Halloween, St. Patrick’s Day and 4th of July raffles will garner public relations, media attention and heightened public interest in these successful products franchise. The Lottery will continue to implement these three signature games with the objective of efficiently targeting current and potential players who are most interested in games with high odds of winning. Marketing Communications Support In FY 13, the Lottery successfully tested a communication plan that allocated media primarily towards radio, online and point-of-purchase marketing. The elimination of television from the media mix did nothing to impact sales results and only increased the overall profitability of the RaffleSM efforts. For FY 14, we plan to build on that successful test by utilizing the following communications support:
Comment [HB12]: L. Niswender questioned this word choice
Level 1 – Published 36
Point-of-purchase
Public relations
Events
Radio
Email marketing to player database
Email marketing to prospect and partner databases
Targeted online marketing
Mobile marketing
Social media Research Initiatives In addition to the ongoing analysis of internal data, programmatic, cross-product surveys such as the Lottery’s Bi-Annual Tracking Studies and quarterly Promotions Surveys will be conducted to gain actionable guidance for decision-making related specifically to Raffle. This will include monitoring and analyzing the impact of changes proposed for FY 14.
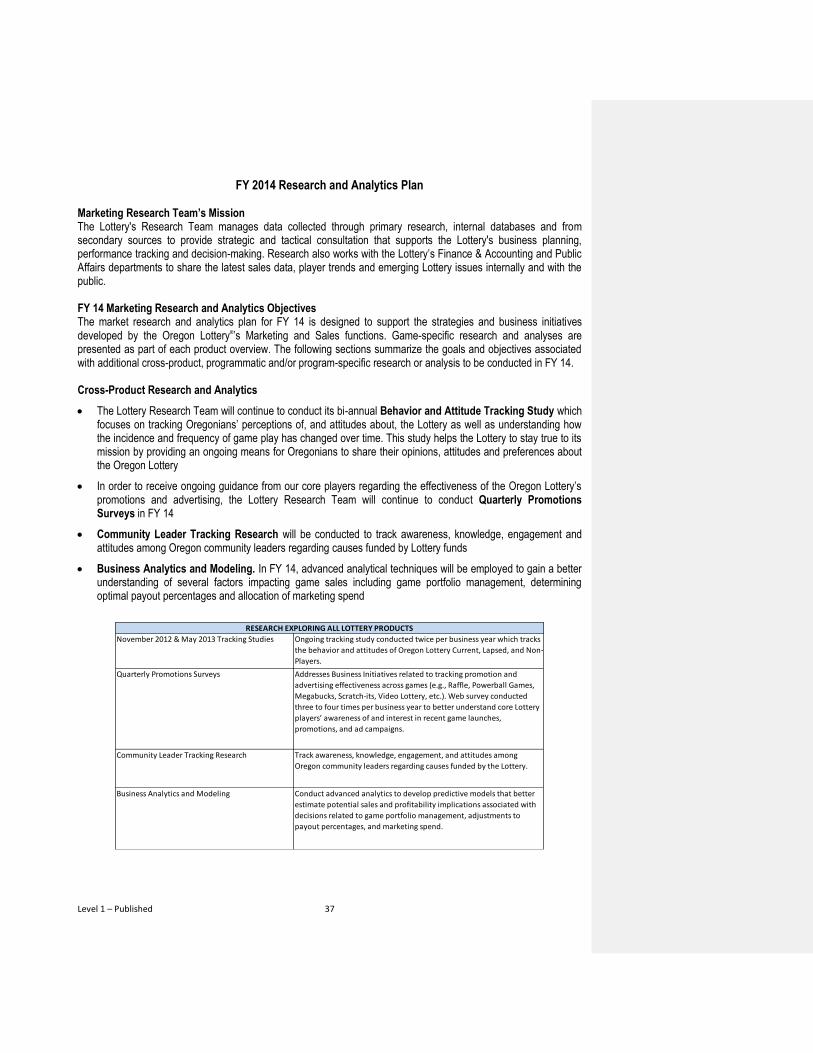
Level 1 – Published 37
FY 2014 Research and Analytics Plan Marketing Research Team’s Mission The Lottery's Research Team manages data collected through primary research, internal databases and from secondary sources to provide strategic and tactical consultation that supports the Lottery's business planning, performance tracking and decision-making. Research also works with the Lottery’s Finance & Accounting and Public Affairs departments to share the latest sales data, player trends and emerging Lottery issues internally and with the public. FY 14 Marketing Research and Analytics Objectives The market research and analytics plan for FY 14 is designed to support the strategies and business initiatives developed by the Oregon Lottery®’s Marketing and Sales functions. Game-specific research and analyses are presented as part of each product overview. The following sections summarize the goals and objectives associated with additional cross-product, programmatic and/or program-specific research or analysis to be conducted in FY 14. Cross-Product Research and Analytics
The Lottery Research Team will continue to conduct its bi-annual Behavior and Attitude Tracking Study which focuses on tracking Oregonians’ perceptions of, and attitudes about, the Lottery as well as understanding how the incidence and frequency of game play has changed over time. This study helps the Lottery to stay true to its mission by providing an ongoing means for Oregonians to share their opinions, attitudes and preferences about the Oregon Lottery
In order to receive ongoing guidance from our core players regarding the effectiveness of the Oregon Lottery’s promotions and advertising, the Lottery Research Team will continue to conduct Quarterly Promotions Surveys in FY 14
Community Leader Tracking Research will be conducted to track awareness, knowledge, engagement and attitudes among Oregon community leaders regarding causes funded by Lottery funds
Business Analytics and Modeling. In FY 14, advanced analytical techniques will be employed to gain a better understanding of several factors impacting game sales including game portfolio management, determining optimal payout percentages and allocation of marketing spend
November 2012 & May 2013 Tracking Studies Ongoing tracking study conducted twice per business year which tracks
the behavior and attitudes of Oregon Lottery Current, Lapsed, and Non-
Players.
Quarterly Promotions Surveys Addresses Business Initiatives related to tracking promotion and
advertising effectiveness across games (e.g., Raffle, Powerball Games,
Megabucks, Scratch-its, Video Lottery, etc.). Web survey conducted
three to four times per business year to better understand core Lottery
players’ awareness of and interest in recent game launches,
promotions, and ad campaigns.
Community Leader Tracking Research Track awareness, knowledge, engagement, and attitudes among
Oregon community leaders regarding causes funded by the Lottery.
Business Analytics and Modeling Conduct advanced analytics to develop predictive models that better
estimate potential sales and profitability implications associated with
decisions related to game portfolio management, adjustments to
payout percentages, and marketing spend.
RESEARCH EXPLORING ALL LOTTERY PRODUCTS
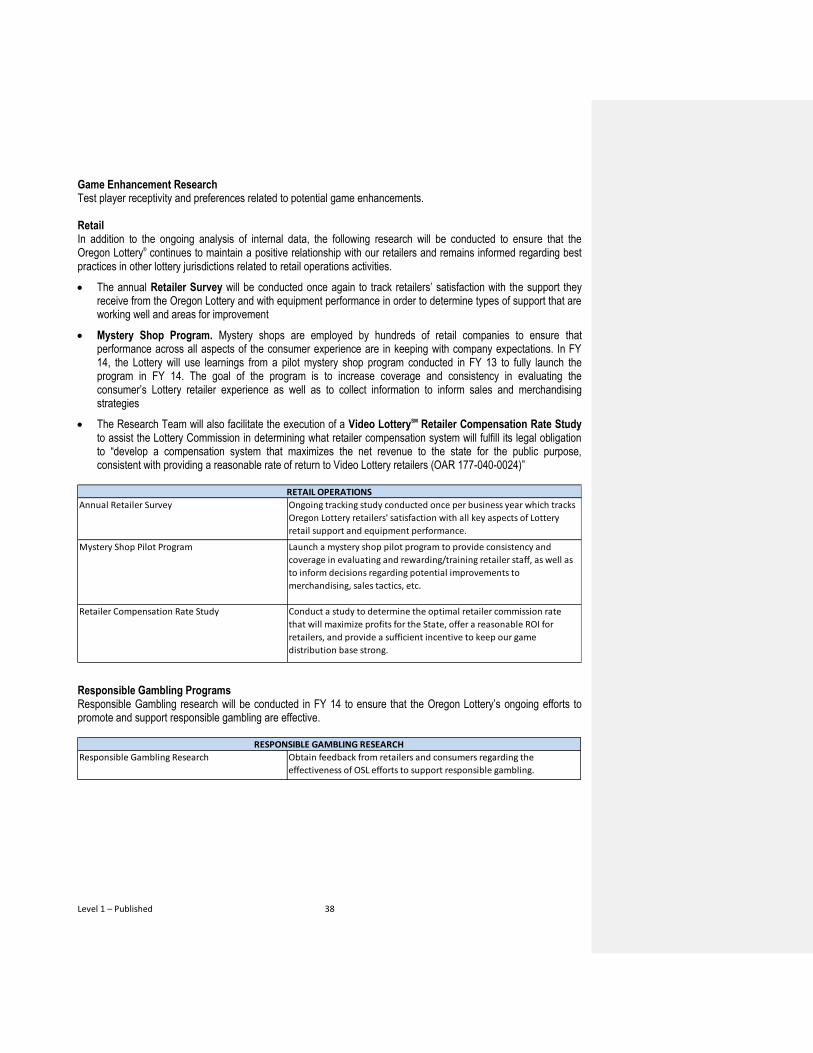
Level 1 – Published 38
Game Enhancement Research Test player receptivity and preferences related to potential game enhancements. Retail In addition to the ongoing analysis of internal data, the following research will be conducted to ensure that the Oregon Lottery® continues to maintain a positive relationship with our retailers and remains informed regarding best practices in other lottery jurisdictions related to retail operations activities.
The annual Retailer Survey will be conducted once again to track retailers’ satisfaction with the support they receive from the Oregon Lottery and with equipment performance in order to determine types of support that are working well and areas for improvement
Mystery Shop Program. Mystery shops are employed by hundreds of retail companies to ensure that performance across all aspects of the consumer experience are in keeping with company expectations. In FY 14, the Lottery will use learnings from a pilot mystery shop program conducted in FY 13 to fully launch the program in FY 14. The goal of the program is to increase coverage and consistency in evaluating the consumer’s Lottery retailer experience as well as to collect information to inform sales and merchandising strategies
The Research Team will also facilitate the execution of a Video LotterySM Retailer Compensation Rate Study to assist the Lottery Commission in determining what retailer compensation system will fulfill its legal obligation to “develop a compensation system that maximizes the net revenue to the state for the public purpose, consistent with providing a reasonable rate of return to Video Lottery retailers (OAR 177-040-0024)”
Responsible Gambling Programs Responsible Gambling research will be conducted in FY 14 to ensure that the Oregon Lottery’s ongoing efforts to promote and support responsible gambling are effective.
Annual Retailer Survey Ongoing tracking study conducted once per business year which tracks
Oregon Lottery retailers' satisfaction with all key aspects of Lottery
retail support and equipment performance.
Mystery Shop Pilot Program Launch a mystery shop pilot program to provide consistency and
coverage in evaluating and rewarding/training retailer staff, as well as
to inform decisions regarding potential improvements to
merchandising, sales tactics, etc.
Retailer Compensation Rate Study Conduct a study to determine the optimal retailer commission rate
that will maximize profits for the State, offer a reasonable ROI for
retailers, and provide a sufficient incentive to keep our game
distribution base strong.
RETAIL OPERATIONS
Responsible Gambling Research Obtain feedback from retailers and consumers regarding the
effectiveness of OSL efforts to support responsible gambling.
RESPONSIBLE GAMBLING RESEARCH
Level 1 – Published 39
FY 2014 Marketing Communications Plan Overview The Marketing Communications Team has the unique task of effectively communicating the many different Oregon Lottery
®
brands across numerous channels simultaneously. We do this at a time when the media world is evolving rapidly and consumer viewing, listening and reading habits are changing at even a faster pace. In order to maximize the number of right decisions we make, we’ve evolved many of our key functions to keep up with marketplace demands. In FY 14, you’ll notice enhancements in many key areas including:
External resources
Social and digital media
Media buying and planning Enhanced External Resources During FY 13, the Oregon Lottery undertook an effort to upgrade our marketing resources in the areas of product marketing, digital marketing, public information advertising, public relations and media buying and planning. As a result of these efforts, the Lottery now has multiple new outside partners to work with, each possessing the experience and capabilities to assist Lottery marketing efforts across every platform.
Marketing Channel Agency Product Marketing R/West Oregon Wins/Public Information BPN Digital/Social Marketing Pollinate Public Relations Coates/Kokes Responsible Gambling Brightwater Media Planning and Buying BPN
Social and Digital Media Digital marketing rapidly ascended to one of the most important media in terms of communicating with consumers across any and all (age, gender, social, income, etc.) demographics. It is now common practice for consumers to research, provide feedback about and even personally engage online with the brands they purchase and patronize. In FY 13, the Oregon Lottery invested in establishing a stronger digital presence by adding an Online Marketing Manager. In FY 14, the Lottery plans to make wholesale strides in engaging consumers (players, retailers, voters) where they spend the majority of their time; online. A social media launch coupled with a re-design of oregonlottery.org comprises the two flagship components planned to support these digital engagement efforts for the Oregon Lottery. There is also considerable growth strategy and traditional marketing campaign tie-ins that should amplify web traffic and audience reach for FY 14.
Media Buying and Planning Beginning in FY 13 and continuing into FY 14, the Marketing Communications Team working with our media buying and planning agency, BPN, revised our media guidelines on how we go about best reaching our consumers. Taking our internal market segmentation study and combining it with the latest media consumption data, we were able to create unique and up-to-date consumer media profiles for each of our products, public information and responsible gambling audiences. These new profiles will allow us to reach the right prospects, efficiently as possible on the media platform that view the most.
Level 1 – Published 40
FY 2014 Public Information Marketing Communication Plan
Oregon Wins
It Does Good Things. This message is at the heart of the Oregon Wins effort, and having more Oregonians
understand that profits from our games fund critical programs and projects that do good things is the central objective
for all our marketing communications. Additionally, our communications are developed to showcase where the
funding is allocated at a tangible level so that every Oregonian understands that Lottery dollars benefit them in a very
real, community specific way.
Storytelling. Over the past four years, the Oregon Wins campaigns have employed integrated media to tell stories of
how Lottery funding has supported the key Lottery beneficiaries of Education, Environment, Economic Development
and Business Infrastructure. The stories are about projects of all sizes and across many counties. In FY 14, Lottery
will continue with this approach, beginning with a featured project on how the Lottery funding has supported K-12
education. Additionally, we will highlight stories on how Lottery dollars have aided State Parks and Economic
Development across Oregon and selected environmental stories that help preserve Oregon for future generations.
These campaigns are supported with television, print, public relations, radio, outdoor, online and event marketing.
Reaching Business Leaders and Community Influencers. Beginning in late FY 12, the Oregon Wins effort was
extended to reach out more purposefully to community business leaders and influencers with our economic
development message. Using a combination of business publications, Web sites, targeted television buys and
community speaking engagements, business leaders are provided with information on how Oregon Lottery® dollars
are directly benefitting their communities and the state as a whole.
Sponsorships. The Oregon Lottery and Oregon Wins messages are further supported with sponsorship of
organizations and events that align with our key areas of funding. Our sponsorships fall into three main categories:
awareness driving opportunities, Oregon Wins related opportunities and diversity/scholastic outreach opportunities.
Sponsorship Category Selected Examples
Awareness Driving Trailblazers, Ducks, Beavers, Thorns, Timbers and State Fair
Oregon Wins Tyron Creek Trillium Festival, Deschutes River Conservancy
Diversity and Scholastic Outreach Black United Fund, Asian Reporter and Mt. Hood C. College
Oregon Lottery will continue to participate in these opportunities and select sponsorships based on audience
composition, size and the value of associated marketing channels that are included in the sponsorship.
Responsible Gambling Outreach
The Oregon Lottery will continue to promote responsible gambling messages tied to Lottery messaging and Web sites. Campaigns will employ broad reach media such as consumer television and collateral encouraging players to “set a budget, set a time limit and play only for fun”. Additionally, we provide our retailers with materials and training to promote and encourage responsible gambling.