Embed Size (px)
Citation preview

F.A. Leckie, D.J. Dal Bello, Strength and Stiffness of Engineering Systems, Mechanical Engineering Series, 23DOI 10.1007/978-0-387-49474-6_2, © Springer Science+Business Media, LLC 2009
Chapter 2 Statics
2.0 Introduction
A Statics analysis is generally the first step in determining how an engineering systemdeforms under load, and how the system supports the load internally. For equilibrium, thevector sum of all the forces Fi that act on a system must equal zero. Likewise, the vectorsum of all the moments Mi that act on a system must equal zero. However complex thesystem, it must support the applied loads without accelerating.
In mathematical terms, equilibrium of forces and equilibrium of moments arerepresented by the vector equations:
[Eq. 2.1]
[Eq. 2.2]
Free body diagrams (FBDs) of theentire system, of individualcomponents, and of parts of individualcomponents, are vital to the solution ofany problem. In a FBD, the body ofinterest is first isolated from itssurroundings. All of the forces andmoments that act on the body from itssurroundings are then represented withforce and moment vectors. Thecoordinate system is also indicated.The examples in this chapter, andthroughout the text, illustrate theimportance of FBDs.
An example of a FBD is given inFigure 2.1. A highway sign is acted onby wind load FW; the weight of thesign and support mast are presentlyignored. A FBD of the support mast isshown in Figure 2.1b. The mast has
Fi∑ 0=
Mi∑ 0=
Figure 2.1. A free body diagram isolates a system or part of a system, and shows the forces acting on it. (a) A highway sign and support mast under a wind load. (b) FBD of the support mast.
24 Ch. 2 Statics
been removed from its surroundings, and all the forces and moments that act on it arerepresented. Here, the wind load causes a force FW at the top of the mast, requiring areaction shear force at the base V. The wind causes torque TW, requiring reaction torque T.In engineering systems, a torque is a moment that causes twisting of an axial member orshaft. Finally, reaction moment M at the base keeps the mast from falling over due to thewind load. All the reactions have been drawn in the positive directions of the axes, notnecessarily in the directions that they physically act. This problem is studied in more detailin Example 2.9.
Carefully drawn FBDs make the loads acting on a structure easier to visualize, andhelp to communicate to others how the system operates. The FBDs are the basis for theequations of equilibrium. Every problem and solution should include an FBD.
2.1 Axial Members
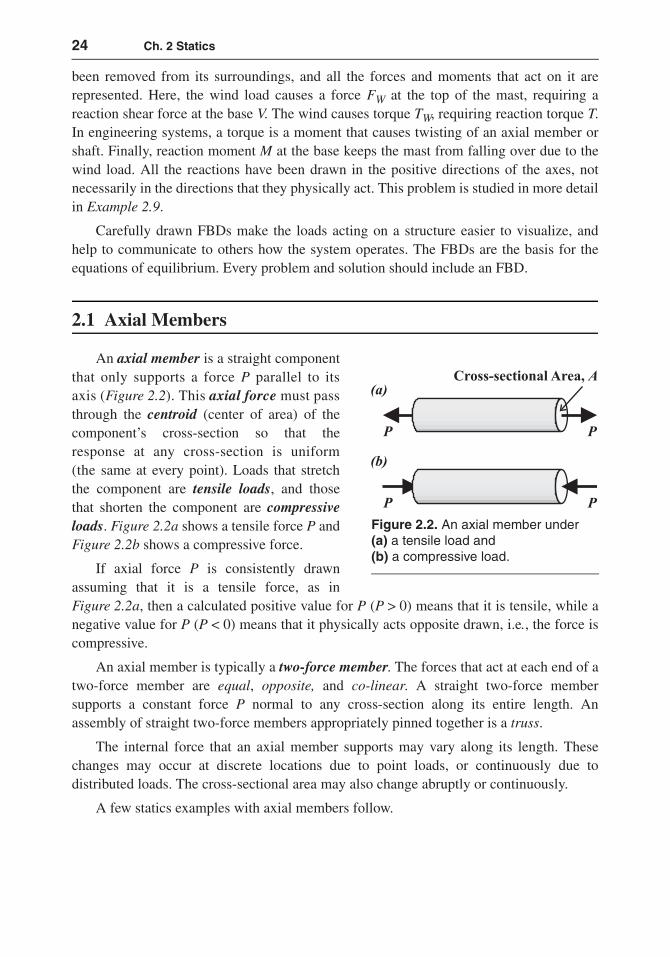
An axial member is a straight componentthat only supports a force P parallel to itsaxis (Figure 2.2). This axial force must passthrough the centroid (center of area) of thecomponent’s cross-section so that theresponse at any cross-section is uniform(the same at every point). Loads that stretchthe component are tensile loads, and thosethat shorten the component are compressiveloads. Figure 2.2a shows a tensile force P andFigure 2.2b shows a compressive force.
If axial force P is consistently drawnassuming that it is a tensile force, as inFigure 2.2a, then a calculated positive value for P (P > 0) means that it is tensile, while anegative value for P (P < 0) means that it physically acts opposite drawn, i.e., the force iscompressive.
An axial member is typically a two-force member. The forces that act at each end of atwo-force member are equal, opposite, and co-linear. A straight two-force membersupports a constant force P normal to any cross-section along its entire length. Anassembly of straight two-force members appropriately pinned together is a truss.
The internal force that an axial member supports may vary along its length. Thesechanges may occur at discrete locations due to point loads, or continuously due todistributed loads. The cross-sectional area may also change abruptly or continuously.
A few statics examples with axial members follow.
Figure 2.2. An axial member under (a) a tensile load and (b) a compressive load.

2.1 Axial Members 25
Example 2.1 Flower Pots on Hanging Shelves
Given: Three shelves are hung from theceiling by means of four rope cords. Plants areevenly distributed on each shelf as shown inFigure 2.3a. The total weight of the plants,pots, and earth on each shelf is W = 100 lb,which is assumed to be uniformly distributedover the shelf area (Figure 2.3b).
Required: Determine the force in eachsegment of each cord.
Solution: Assuming that weight W is evenlydistributed on each shelf, that the cords aresymmetrically placed, and that the shelves arelevel, then the four cords share equally insupporting each shelf.
Step 1. A FBD of the entire system(Figure 2.3b) is made by taking a cut at A,replacing the physical ceiling supports withreaction forces T ; the plants are replaced withtotal weight W on each shelf. Equilibrium inthe vertical (y-) direction gives the reaction ateach ceiling support:
Answer:
Step 2. By taking a cut between levels A and B,the same equation is used to show that eachcord segment AB carries tensile loadTAB = 75 lb. The FBD in 2D is shown inFigure 2.3c.
Step 3. By taking a cut through the cords belowthe top shelf (Figure 2.3d), equilibrium givesthe tension in each cord between B and C:
Fy∑ 0: 4T 3W– 0= =
T 34---= W 75 lb=
Fy∑ 0: 4TBC 2W– 0= =
Figure 2.3. (a) Three hanging shelves. (b) 3D FBD of entire system. (c) 2D FBD of entire system. (d) 2D FBD cut at middle cords. (e) FBD of connector. Copyright ©2008 Dominic J. Dal Bello and licensors. All rights reserved.

26 Ch. 2 Statics
Answer:
Step 4. The reader should verify by cutting the cords between C and D that the tension ineach of the lowest cords is TCD = 25 lb.
A connector is necessary to transfer the load from each shelf to the cord (Figure 2.3e).Each connector supports a load W/4 applied by the shelf, and the connector system mustbe strong enough to transfer that load to the cord. The tension in the cord above theconnector TU equals its share of the weight of the shelf W/4 and the tension in the cordbelow the connector TD .
Example 2.2 Tower Crane – Method of Joints
Given: The tower crane shown in Figure2.4 consists of tower DCE fixed at theground, and two jibs AC and CB. The jibsare supported by tie bars AD and DB, andare assumed to be attached to the tower bypinned connections. The counterweight WCweighs 390 kips and the crane has a liftingcapacity of Wmax = 250 kips. Neglect theweight of the crane itself.
Required: Determine (a) the reactions atthe base of the tower when the crane islifting its capacity, (b) the axial forces in tiebars AD and DB, and jibs AC and CB, and(c) the internal forces and moment in thetower at point F, 40 ft below joint D.
Solution: Step 1. Reactions. The FBD ofthe entire crane lifting load W is shown inFigure 2.4b. Equilibrium requires:
In the moment calculation, moments thatcause counterclockwise rotation are takenas positive.
Substituting the values of a, b, WC, andW = Wmax into the above equations gives:
TBC24---= W 50 lb=
Fy∑ 0: R WC– W– 0= =
Mz∑ 0:=
M WC a×( ) W b×( )–+ 0=Figure 2.4. (a) Tower crane lifting load W with the counterweight WC at its maximum distance, a. (b) FBD of entire crane.

2.1 Axial Members 27
Answer:
Answer:
Note that the calculated moment is relativelysmall. If the base of the crane is 25 ft wide,then the forces of the equivalent couple are20.0 kips (25×20=500), which is smallwhen compared with R = 640 kips. For anygeneral load W, the counterweight WC ismoved along AC to balance the momentcaused by the load. This action minimizesthe moment at the base, reducing thetendency for the tower to overturn. Ideally,the moment at the base is M = 0.
Step 2. Forces in members AC, AD, BD andBC are solved using the Method of Joints byisolating joints A and B, and consideringtheir FBDs (Figures 2.4c and d). The forcesin the tie bars and jibs are assumed to be in tension, so are drawn acting away from thejoint. If a calculation results in a negative force, then the force actually acts opposite thatdrawn; i.e., the force is compressive.
From the geometry, angles θA and θB are found:
Applying force equilibrium at joint A:
Answer:
Answer:
The value of the force in jib AC, PAC , is negative, meaning that the force is compressive(the jib pushes against joint A; if the jib was not there, the counterweight would swingdownward). Force PAD is positive, meaning the force acts in the direction drawn; the tiebar force is tensile.
Step 3. Applying equilibrium at joint B:
R 640 kips=
M 500 kip-ft=
θAtan 80 ft175 ft-------------- 0.4571= = θA 0.4571( )tan 1– 24.57°= =⇒
θBtan 80 ft275 ft-------------- 0.2909 θB 0.2909( )tan 1– 16.22°= =⇒= =
Fy∑ 0: WC– PAD θAsin+ 0= =
PAD390 kips
24.57°( )sin----------------------------- 937 940, lb PAD 938 kips=⇒= =
Fx∑ 0: PAC PAD+ θAcos 0= =
PAC 937.9 kips( ) 24.57°( )cos– PAC 853 kips–=⇒=
Figure 2.4. (c) FBD of joint A. (d) FBD of joint B. (e) FBD of DF ; point F is 40 ft below point D.
28 Ch. 2 Statics
Answer:
Answer:
At point F, 40 ft below joint D on member DC (Figure 2.4e), equilibrium requires that:
Answer:
Answer:
Answer:
Note that PF = 640 kips is the vertical reaction force at the base. The downward forces ofweights W and WC are carried up through the tie bars to joint D, and the tower carries thevertical load to ground. The negative result for HF indicates that it acts in the oppositedirection drawn.
Example based on the K10000 tower crane by Kroll Giant Towercranes, as cited at: http://www.towercrane.com/ Accessed May 2008. Values are approximate.
Example 2.3 Truss System – Method of Joints and Method of Sections
Background: Trusses are used in such applications as cranes, railway bridges,supermarket roofs, ships, aircraft, and space structures. Axial members are pinnedtogether to form a beam-like structure. Trusses are a very effective means of spanninglarge distances.
Given: A simple truss bridge is shown in Figure 2.5a. Two plane trusses are constructedof 15 ft long axial members assembled with pins into equilateral triangles. Crossbeamsconnected to the trusses at the pin (node) locations maintain the spacing between thetrusses, while diagonal bracing keeps them from moving laterally with respect to eachother. The lower crossbeams support a roadway (deck) 20 ft wide. For the design, theroadway is to carry a uniformly distributed load of 80 lb per square foot (psf). Neglect theweight of the bridge itself.
Fy∑ 0: W– PBD θBsin+ 0= =
PBD250 kips
16.22°( )sin----------------------------- 895.0 kips PBD 895 kips=⇒= =
Fx∑ 0: P– BC PBD– θBcos 0= =
PBC 895.0 kips( ) 16.22°( )cos– kips PBC 859 kips–=⇒=
Fy∑ 0: P– AD θAsin PBD– θBsin PF+ 0= =
PF 938( ) 24.57°( )sin 895( ) 16.22°( )sin+ PF 640 kips=⇒=
Fx∑ 0: P– AD θAcos PBD+ θBcos HF+ 0= =
HF 938( ) 24.57°( )cos 895( )– 16.22°( )cos HF 6.3 kips–=⇒=
Mz F,∑ 0: PAD θAcos( ) DF( ) PBD– θBcos( ) DF( ) MF+ 0= =
MF 252 kip-ft=

2.1 Axial Members 29
Required: Considering only the roadway load, determine the forces (a) in members AB andAC using the Method of Joints and (b) in DF, EF and EG using the Method of Sections.
Solution: Step 1. Load path. Each lower crossbeam supports a deck area of 15×20 ft – atributary area of 300 ft2 (Figure 2.5b). The force on each crossbeam is
Each end of the crossbeam is supported by a truss. Since the load is uniformly distributedon the roadway, and the geometry is symmetric about the center of the roadway, bothtrusses carry the same load; only one truss needs to be analyzed.
The force supported at any lower pin is half the value of the load on each crossbeam, or12,000 lb = 12.0 kips. At the supports, the tributary area on the crossbeams is half thestandard tributary area, so the downward force at each support is 6.0 kips (Figure 2.5c).
300 ft2( ) 80 psf( ) 24 000 lb, 24.0 kips= =
Figure 2.5. (a) A truss-bridge. The roadway rests on crossbeams that are connected to the trusses at the lower joints (e.g., joints A, C, E, G, K, etc.). (b) Top view of roadway supported by the lower crossbeams, showing tributary area of each crossbeam and of each pin. (c) 2D view of front truss.

30 Ch. 2 Statics
Step 2. Reactions. From equilibrium and symmetry considerations, the vertical reactionloads are:
RAy = RKy = 30,000 lb = 30.0 kips
Because one end of the truss is supported by a roller and no horizontal loads are applied tothe truss, the horizontal reactions are RAx = RKx = 0.
Step 3. Forces in members AB and AC (Figure 2.5d). Applying the method of joints at jointA, the forces in members AB and AC are determined:
Answer:
Answer:
Since PAB is negative, member AB is in compression.
Step 4. Forces in DF, EF, and EG, (Figure 2.5e). The method of joints can be used to solvefor the forces in all of the members, one joint at a time. However, using the method ofsections, the force in any inner member can be determined directly. For example, take acut through members DF, EF and EG, as shown in Figure 2.5e.
Considering moment equilibrium about joint E to eliminate forces PEF and PEG :
Answer:
To solve for PEG , take moments about joint F, eliminating PEF and PDF from thecalculation. Note that the horizontal distance from point A to point F is 2.5L = 37.5 ft.
Fy∑ 0: 30 kips PAB 60°( ) 6 kips– 0=sin+=
PAB 6 30 kips–( )
60°( )sin------------------------------- PAB 27.7–= kips⇒=
Fx∑ 0: PAC PAB 60°( )cos+ 0= =
PAC12---PAB PAC 13.86 kips=⇒–=
Mz E,∑ 0: 6 30 kips–( ) 30 ft( ) 12 kips( ) 15 ft( ) PDF– 15 ft( ) 60°sin+ 0= =
PDF 540 kips-ft–
15 ft( ) 60°sin--------------------------------- PDF 41.6– kips (compression)=⇒=
Figure 2.5. (d) FBD of joint A. (e) FBD of truss cut through members DF, EF, and EG .

2.2 Torsion Members 31
Answer:
Vertical equilibrium requires:
Answer:
In general, the force in diagonal member EF is not zero; it is zero here because the shearforce goes to zero at the center of a symmetrically loaded simply-supported truss (beam).
As a check, consider horizontal equilibrium in Figure 2.5e:
OK
2.2 Torsion Members
A torsion member is a component that transmits torque T (Figure 2.6). The torquetwists the member about its axis, which passes through the centroid (center of area) of itscross-section.
Example 2.4 Drive Shaft in a Machine Shop
Given: The individual machines of classical machine shops were powered by belts drivenby drive shafts. An example is shown in Figure 2.7, in which three machines, B, C, and D,draw torque from the main shaft according to Table 2.1. Bearing E is assumed to befrictionless, and therefore draws no torque.
Mz F,∑ 0: 6 30–( ) 37.5( ) 12( ) 22.5( ) 12( ) 7.5( ) PEG 15( ) 60°sin+ + + 0= =
PEG 540 kip-ft–15 ft( ) 60°sin
---------------------------------– PEG 41.6 kips (tension)=⇒=
Fy∑ 0: 30 6– 12– 12–( ) PEF 60°sin( )+ 0= =
PEF 0 kips=
Fx∑ 0: PEG PDF PEF 60°cos+ + 41.6– 41.6 0+ + 0= = =
Figure 2.6. Torsion members. (a) A positive torque represented alternatively by a double-headed vector or a curved arrow. A torque within a torsion member is termed positive if it points in the same direction as the outward-pointing normal vector of the cross-section on which it acts (e.g., on a positive face in a positive direction or on a negative face in a negative direction). If torque is consistently drawn positive, a negative value indicates that it physically acts as shown in (b).

32 Ch. 2 Statics
Required: (a) Determine the torqueanywhere along the drive shaft and (b) drawthe torque diagram, T(x) vs. x.
Solution: Step 1. The FBD of the entire driveshaft is shown in Figure 2.7b. Torque TA isthe input torque. From equilibrium, the sumof the torques about the x-axis must be zero:
Step 2. The internal torque supported at anycross-section is found by taking a cut at thatsection, and a FBD of the remainingstructure is considered. The torque carriedinside the shaft between A and B, TAB , isfound by taking a cut between A and B(Figure 2.7c) and applying equilibrium tothe external and internal torques.
Answer:
Step 3. Likewise, the internal torquebetween B and C (Figure 2.7d) is:
Answer:
Step 4. Verify for yourself that the torque in segment CD is TCD = 20 lb-ft.
Note that cuts to determine the torque in a torsion member should never be taken at thepoint of application of a point torque; always take cuts between the point loads.
Tx∑ 0: TA– TB TC TD+ + + 0= =
T⇒ A 15 30 20+ +( )lb-ft 65 lb-ft= =
Tx∑ 0: T– A TAB+ 0= =
TAB TA 65 lb-ft= =
Tx∑ 0: T– A TB TBC+ + 0= =
TBC⇒ 65 15–( ) lb-ft=
TBC 50 lb-ft=
Figure 2.7. (a) Rotating shaft powering three machines. (b) FBD of the entire shaft. (c) FBD of shaft cut between points A and B. Internal torque TAB is drawn in its positive sense – counterclockwise about the positive x-axis. (d) FBD of shaft cut between points B and C; torques represented with double-headed vectors. (e) Torque diagram.
Table 2.1. Torque drawn by each machine.
Machine Torque (lb-ft)B 15C 30D 20
2.3 Beams 33
Step 5. The torque diagram in Figure 2.7e is used to display the internal torque carried bythe shaft. The torque diagram is analogous to the shear force and moment diagrams forbeams.
Example 2.5 Classic Lug Wrench
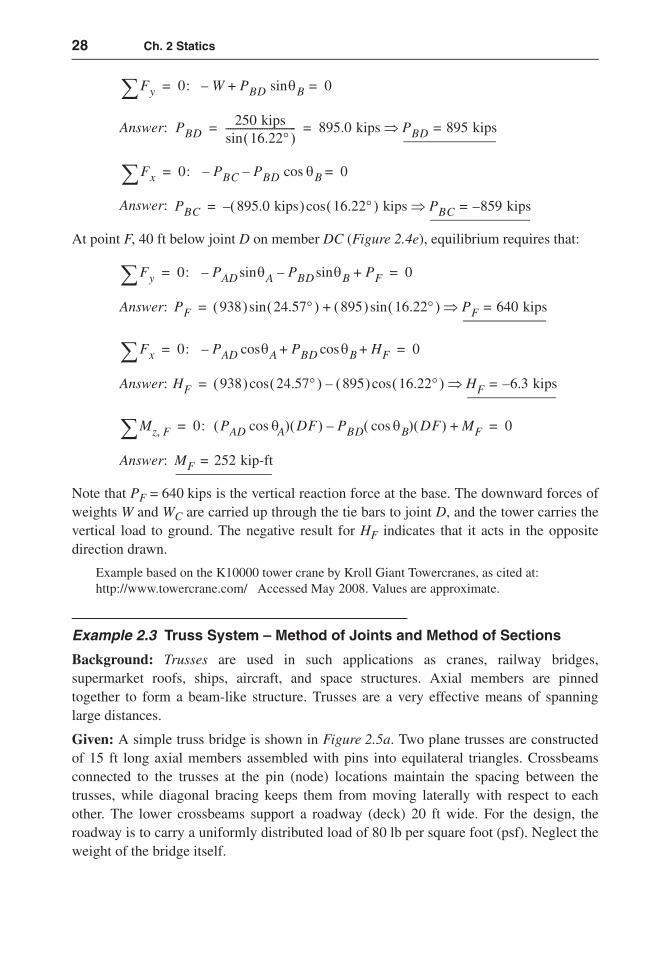
Given: A lug nut is tightened by applying adownward force F on the lug wrench’s rightarm and an upward force F on the wrench’sleft arm (Figure 2.8a). Linear motion isconverted into angular motion; force isconverted into torque. The forces areassumed to be of equal magnitude.
Required: Determine the magnitude of thetorque applied to the lug nut.
Solution: The torque, or couple, applied tothe wrench stem at point A is:
and is clockwise with respect to the +x-axis.The reaction torque TB applied by the lug nutagainst the wrench’s stem is shown inFigure 2.8b. The torque applied to the lugnut by the stem is equal and opposite to thereaction torque TB.
The torque applied by the wrench to the nutis the same as that applied by the user to thewrench. The magnitude of this torque is:
Answer:
Note that since the applied forces are equal and opposite, there is no shear force acting inthe lug wrench stem; the two forces form a couple.
2.3 Beams
Beams are components that support loads transverse to their main structural axis.Examples include aircraft wings, floor, and ceiling joists in buildings, bridges, atomicforce microscopes, robotic arms in space structures, tree branches, etc. (Figure 2.9). Theinternal loads in beams are bending moments and shear forces (Figure 2.10).
TA 2 F( ) d2--- ⎝ ⎠
⎛ ⎞ Fd= =
Tnut Fd=
Figure 2.8. (a) Tightening a lug nut with a classic lug wrench. (b) Torque T = Fd is applied at point A. The curved arrow at point A represents the direction that the applied torque physically acts, so its value is written as positive. Copyright ©2008 Dominic J. Dal Bello and licensors. All rights reserved.

34 Ch. 2 Statics
In general, the internal bendingmoment M and shear force V vary withdistance x along the beam. InFigure 2.10b, they are drawn in theirpositive senses as defined by theconvention of this text, and described inthe following paragraphs.
The internal bending moment ispositive if it causes compression on thetop of the beam; the moment is negativeif it causes compression at the bottom ofthe beam.
The shear force is positive if it actson a positive face in a positive direction,or on a negative face in a negativedirection. Otherwise, the shear force isnegative.
Figure 2.10b is a FBD of a length ofthe beam exposing a cross-section thatfaces in the +x-direction – a positiveface. At the cut, a positive moment M isdrawn acting about the +z-axis, out ofthe paper (check this with the right-handrule), and a positive shear force V isdrawn acting in the +y-direction. Drawnin their positive senses, moment andshear force both act on a positive face ina positive direction.
Figure 2.10c is the complementaryFBD of Figure 2.10b. The FBD of L–xexposes a cross-section that faces in thenegative x-direction. Drawn in theirpositive senses, moment and shear forceboth act on a negative face in a negativedirection: the moment about the −z-axisand the shear force in the −y-direction.
Calculations that determine the signof the internal moment and shear forcethus determine the directions in whichthey act. Internal axial forces andtorques follow the same convention.
Figure 2.10. (a) A simply-supported beam (supported by a pin and a roller) loaded by central force W. (b) A FBD of length x of the beam, and (c) a FBD of complementary length L–x. Internal moment M and shear force V are drawn in their positive senses per the convention of this text: (b) positive face–positive direction and (c) negative face–negative direction.
Figure 2.9. (a) Airplane wings act as beams loaded by air pressure to keep the plane aloft. (b) An atomic force microscope is a cantilever beam (built-in at one end, free at the other) loaded at its tip.
2.3 Beams 35
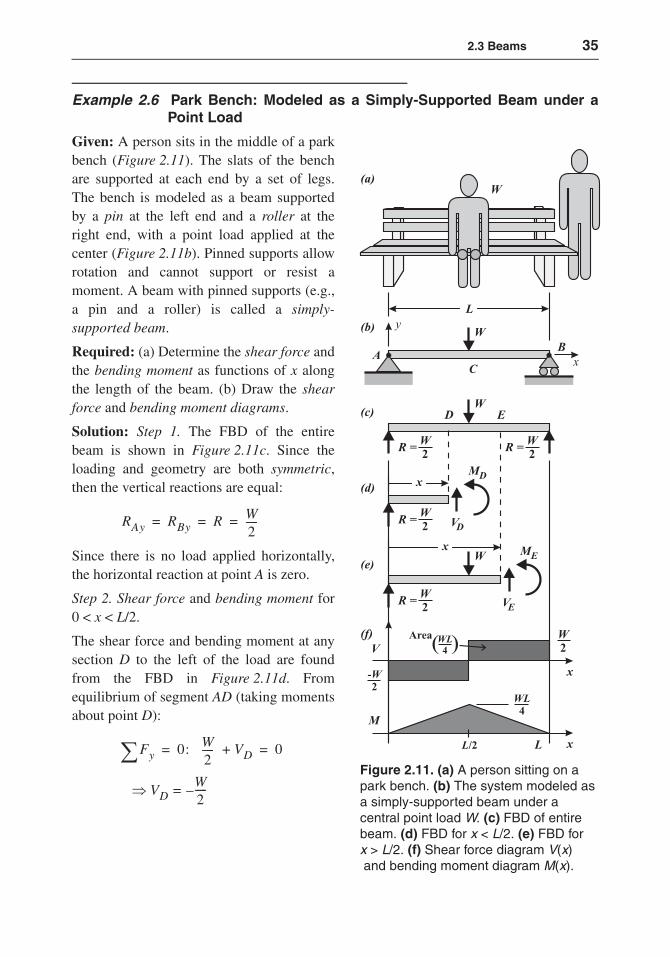
Example 2.6 Park Bench: Modeled as a Simply-Supported Beam under aPoint Load
Given: A person sits in the middle of a parkbench (Figure 2.11). The slats of the benchare supported at each end by a set of legs.The bench is modeled as a beam supportedby a pin at the left end and a roller at theright end, with a point load applied at thecenter (Figure 2.11b). Pinned supports allowrotation and cannot support or resist amoment. A beam with pinned supports (e.g.,a pin and a roller) is called a simply-supported beam.
Required: (a) Determine the shear force andthe bending moment as functions of x alongthe length of the beam. (b) Draw the shearforce and bending moment diagrams.
Solution: Step 1. The FBD of the entirebeam is shown in Figure 2.11c. Since theloading and geometry are both symmetric,then the vertical reactions are equal:
Since there is no load applied horizontally,the horizontal reaction at point A is zero.
Step 2. Shear force and bending moment for0 < x < L/2.
The shear force and bending moment at anysection D to the left of the load are foundfrom the FBD in Figure 2.11d. Fromequilibrium of segment AD (taking momentsabout point D):
RAy RBy R W2-----= = =
Fy∑ 0: W2----- VD+ 0= =
VDW2----- –=⇒
Figure 2.11. (a) A person sitting on a park bench. (b) The system modeled as a simply-supported beam under a central point load W. (c) FBD of entire beam. (d) FBD for x < L/2. (e) FBD for x > L/2. (f) Shear force diagram V(x) and bending moment diagram M(x).

36 Ch. 2 Statics
If equilibrium of the right-hand FBD (a FBD from point D to point B) is considered, thenthe same results are obtained. Check this statement.
Step 3. Shear force and bending moment for L/2 < x < L.
The shear force and bending moment on any cross-section E to the right of the load arefound from the FBD in Figure 2.11e. From equilibrium of segment AE:
In summary:
Answer:
Note that cuts to determine the shear and moment in a beam should never be taken at thepoint of application of a point load (force or moment); always take cuts between pointloads.
Step 4. The variations of shear force and bending moment along the beam are shown inFigure 2.11f. These plots are the shear force and bending moment diagrams.
A simply-supported beam under a central point load is referred to as three-pointbending. This form of loading is often used in experiments to determine the strength of amaterial.
Example 2.7 Park Bench: Modeled as a Simply-Supported Beam; UniformlyDistributed Load
Given: The park bench in the previous example is now completely full (Figure 2.12). Thebeam is assumed to have the same geometric boundary conditions (simple supports). Sincethe beam is full, the load is modeled as a uniformly distributed load (force per unit length).The distributed load is:
Mz D,∑ 0: W2-----x– MD+ 0= =
MDW2-----x =⇒
Fy∑ 0: W2----- W– VE+ 0= =
VE⇒ W2----- =
Mz E,∑ 0: W2-----x– W x L
2---–⎝ ⎠
⎛ ⎞ ME+ + 0= =
ME⇒ W2----- L x–( )=
• For 0 x L2---< < : V x( ) W
2----- M x( );– W
2-----x= =
• For L2--- x L< < : V x( ) W
2----- M x( ); W
2----- L x–( )= =

2.3 Beams 37
where n is the number of people on thebench, W is the weight of each person(assumed to be the same), and L is thedistance between supports. The beam modelis shown in Figure 2.12b.
Required: (a) Determine the shear force andthe bending moment along the length of thebeam. (b) Draw the shear force and bendingmoment diagrams.
Solution: Step 1. The FBD of the entirebeam is shown in Figure 2.12c. Since theloading and geometry are both symmetric,RAy = RBy = R. From vertical equilibrium:
Step 2. The internal shear force and bendingmoment at any section D distance x from theorigin may be found from the FBD shown inFigure 2.12d. From vertical equilibrium:
Answer:
Moment equilibrium about point D gives:
Answer:
Note that the second term in the momentequilibrium equation is the product of theequivalent force wx due to the distributed
w nWL
--------=
Fy∑ 0: wL R+– Ay RBy+ 0= =
R⇒ Ay RBy R wL2
-------= = =
Fy∑ 0: wL2
------- wx– VD+ 0= =
VD V x( ) w x L2---–⎝ ⎠
⎛ ⎞= =
Mz D,∑ 0=
wL2
-------–⎝ ⎠⎛ ⎞ x wx( )
x2---
⎝ ⎠⎛ ⎞ MD++ 0=
MD M x( ) w2----= Lx x2–( )=
Figure 2.12. (a) A fully-loaded park bench. (b) The bench modeled as a simply-supported beam under uniformly distributed load w (force per unit length). (c) FBD of entire beam. (d) FBD at any distance x from the left end. (e) Shear force diagram V(x) and bending moment diagram M(x).

38 Ch. 2 Statics
load and its lever arm (x/2) with respect to the cut at point D.
Step 3. The shear force and bending moment diagrams are shown in Figure 2.12e.
For this problem, the shear force is linear, with a maximum magnitude of wL/2 that occursat each support. The bending moment is parabolic, with a maximum value of wL2/8 at thecenter of the beam. The maximum bending moment occurs when the shear force is equalto zero. Because of the symmetry of the geometry and applied load, the response (shearforce and moment) are symmetric.
Note that only one equation each for the shear and moment was required. In the previousexample (Example 2.6), two equations for each load type were required. The difference isthat the loading in this example is constant over the entire length of the beam. Wheneverthere is a sudden change in the beam’s loading (e.g., at the point load in Example 2.6), anadditional set of shear and moment equations must be considered.
Example 2.8 Atomic Force Microscope: A Cantilever with a Point Load
Background: The principal component ofthe atomic force microscope (AFM), used tomeasure the micro-geometry of surfaces andthe forces in biological systems, consists ofa cantilever beam. A cantilever beam isbuilt-in (fixed against displacement androtation) at one end and free at the other end(Figure 2.13).
Given: Force P is applied at the free end ofthe AFM cantilever. A representative load atthis scale is P = 20 nN (20×10–9 N) and thebeam length is L = 60 μm (60×10–6 m).
Required: (a) Determine the shear forceand the bending moment along the length ofthe beam. (b) Draw the shear force andmoment diagrams.
Solution: Step 1. The FBD of the entirebeam is shown in Figure 2.13c.
From force equilibrium in the y-directionand moment equilibrium about the z-axis,the reaction force and reaction moment are:
Fy∑ 0: R P+ 0= =
R⇒ P–=
Figure 2.13. (a) An atomic force microscope scans a material surface. (b) The AFM modeled as a cantilever beam under tip load P. (c) FBD of entire beam. (d) Left-hand FBD at any distance x from the left end. (e) Right-hand FBD at any distance x from the left end.

2.4 Combined Loading 39
Step 2. To investigate how the shear forceand moment vary with distance x along thebeam, a cut is taken at an arbitrary cross-section D. Since the load on the beam doesnot change over its length, only one cutneeds to be taken.
Taking equilibrium of the right-hand FBD,segment DB (Figure 2.13e):
Answer:
The shear force is constant throughout the beam.
The moment along the beam is given by:
Answer:
Note that the moment equation checks with the expected values at each end of the beam: atthe clamped end M(x = 0) = PL and at the free end M(x = L) = 0. The general FBD ofFigure 2.13e reduces to Figure 2.13c for x = 0.
If equilibrium of the left-hand side of the beam AD was considered (Figure 2.13d), thenthe same results for the shear force and moment would be obtained.
Step 3. The shear force and moment diagrams are shown in Figure 2.13f. Using the givenrepresentative values, the maximum bending moment is Mmax = PL = (20 nN)(60 μm) =1.2×10⁻¹² N·m. Shear force VD is plotted as positive since it acts upward on a +x-face (ordownward on a −x-face). Moment MD is plotted positive as it causes compression on thetop of the beam (it is a +z-moment on the +x-face or a −z-moment on a −x-face).
2.4 Combined Loading
Components are frequently subjected to several types of loading at the same time. Twoexamples of combined loading follow.
Mz A,∑ 0: Mo– PL+ 0= =
Mo⇒ PL=
Fy∑ VD– P+ 0= =
VD V x( ) P= =
Mz D,∑ MD– P L x–( )+ 0= =
MD M x( ) P= = L x–( )
Figure 2.13. (f) shear force diagram V(x), and bending moment diagram M(x).
40 Ch. 2 Statics
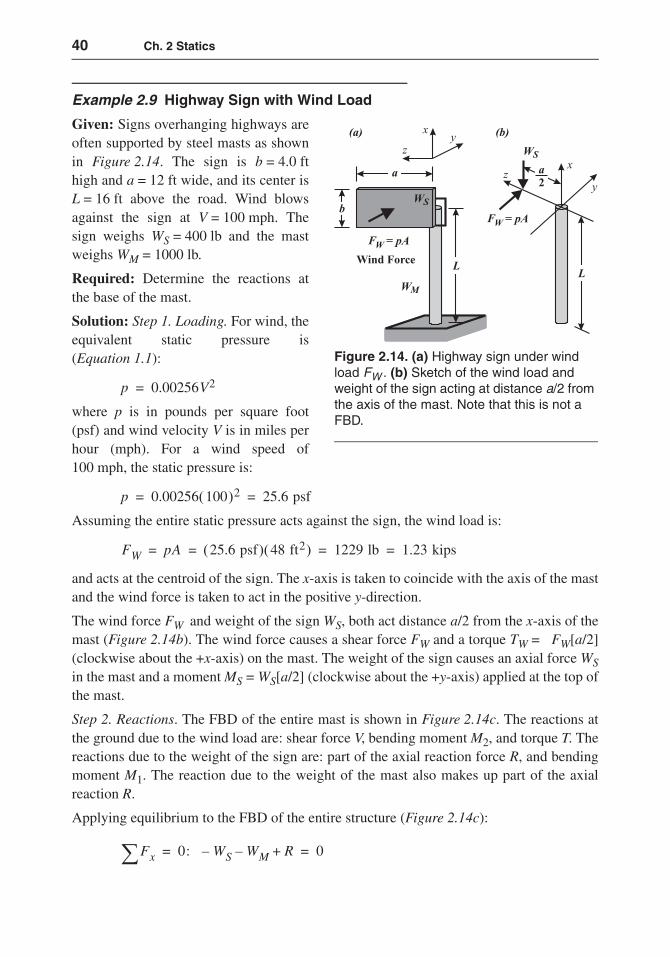
Example 2.9 Highway Sign with Wind Load
Given: Signs overhanging highways areoften supported by steel masts as shownin Figure 2.14. The sign is b = 4.0 fthigh and a = 12 ft wide, and its center isL = 16 ft above the road. Wind blowsagainst the sign at V = 100 mph. Thesign weighs WS = 400 lb and the mastweighs WM = 1000 lb.
Required: Determine the reactions atthe base of the mast.
Solution: Step 1. Loading. For wind, theequivalent static pressure is(Equation 1.1):
where p is in pounds per square foot(psf) and wind velocity V is in miles perhour (mph). For a wind speed of100 mph, the static pressure is:
Assuming the entire static pressure acts against the sign, the wind load is:
and acts at the centroid of the sign. The x-axis is taken to coincide with the axis of the mastand the wind force is taken to act in the positive y-direction.
The wind force FW and weight of the sign WS, both act distance a/2 from the x-axis of themast (Figure 2.14b). The wind force causes a shear force FW and a torque TW = FW[a/2](clockwise about the +x-axis) on the mast. The weight of the sign causes an axial force WSin the mast and a moment MS = WS[a/2] (clockwise about the +y-axis) applied at the top ofthe mast.
Step 2. Reactions. The FBD of the entire mast is shown in Figure 2.14c. The reactions atthe ground due to the wind load are: shear force V, bending moment M2, and torque T. Thereactions due to the weight of the sign are: part of the axial reaction force R, and bendingmoment M1. The reaction due to the weight of the mast also makes up part of the axialreaction R.
Applying equilibrium to the FBD of the entire structure (Figure 2.14c):
p 0.00256V2=
p 0.00256 100( )2 25.6 psf= =
FW pA 25.6 psf( ) 48 ft2( ) 1229 lb 1.23 kips= = = =
Fx∑ 0: WS– WM– R+ 0= =
Figure 2.14. (a) Highway sign under wind load FW . (b) Sketch of the wind load and weight of the sign acting at distance a/2 from the axis of the mast. Note that this is not a FBD.

2.4 Combined Loading 41
Answer:
Answer:
A negative sign indicates that force V actsopposite drawn.
Taking moments about the x-axis:
Answer:
Taking moments about the base, first about the y-axis, and then about the z-axis:
Answer:
Answer:
Moment M2 acts opposite drawn. Note that the shear force, torque, and bending momentabout the y-axis are constant along the length of the mast. The bending moment about thez-axis increases from zero at the top of the mast to its maximum at ground level.
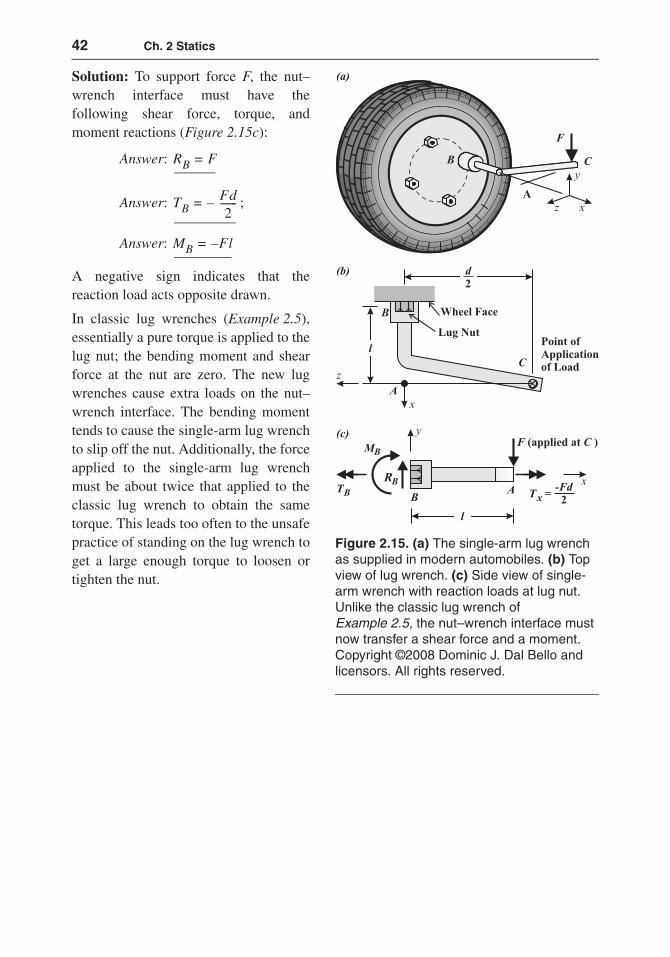
Example 2.10 Single-Arm Lug Wrench
Given: The loading on the compact lug wrenches that come in modern automobiles issimilar to the wind loading on the sign of the previous example (Figure 2.15). In these lugwrenches, the lug nut is tightened by applying a downward force F at point C when thewrench arm is on the right side of the stem AB.
Required: Determine the reactions at the lug nut.
R 400 1000+ R 1.40 kips=⇒=
Fy∑ 0: FW V+ 0= =
V FW– V 1.23– kips=⇒=
Mx∑ 0: FWa2--- ⎝ ⎠
⎛ ⎞– T+ 0= =
T 1.23 kips( ) 6 ft( )=⇒
T 7.38 kip-ft=
My∑ 0: WSa2--- ⎝ ⎠
⎛ ⎞– M1 0=+=
M1⇒ 400 lb( ) 6 ft( )=
M1 2.40 kip-ft=
Mz∑ 0: FWL M2 0=+=
M2⇒ 1.23kips( )– 16 ft( )=
M2 19.7 kip-ft–=
Figure 2.14. (c) FBD of the mast. Although the weight of the mast WM is distributed along its length, its equivalent force acts at the center of gravity. At the ground, all the reactions are drawn acting in the positive direction of the appropriate axis, not necessarily in the directions that they physically act.
42 Ch. 2 Statics
Solution: To support force F, the nut–wrench interface must have thefollowing shear force, torque, andmoment reactions (Figure 2.15c):
Answer:
Answer: ;
Answer:
A negative sign indicates that thereaction load acts opposite drawn.
In classic lug wrenches (Example 2.5),essentially a pure torque is applied to thelug nut; the bending moment and shearforce at the nut are zero. The new lugwrenches cause extra loads on the nut–wrench interface. The bending momenttends to cause the single-arm lug wrenchto slip off the nut. Additionally, the forceapplied to the single-arm lug wrenchmust be about twice that applied to theclassic lug wrench to obtain the sametorque. This leads too often to the unsafepractice of standing on the lug wrench toget a large enough torque to loosen ortighten the nut.
RB F=
TB – Fd2
-------=
MB F– l=
Figure 2.15. (a) The single-arm lug wrench as supplied in modern automobiles. (b) Top view of lug wrench. (c) Side view of single-arm wrench with reaction loads at lug nut. Unlike the classic lug wrench of Example 2.5, the nut–wrench interface must now transfer a shear force and a moment. Copyright ©2008 Dominic J. Dal Bello and licensors. All rights reserved.