Embed Size (px)
Citation preview
CHAPTER 12
INFANT AND CHILD MORTALITY
The estimation of levels, differentials, and recent trends in infant and child mortality is a primary objective of both the DHS and PAPCHILD programs, as they represent key indicators of the health and living conditions in a country. These indicators measure the end result of the interaction of a complex web of factors that include macro structural variables (e.g., basic health services and food security) and household and individual-level characteristics. Further, identification of the direction and magnitude of infant and child mortality is an essential first step toward an understanding of the determinants of child survival and well- being.
Interest in infant and child mortality is twofold. First, it is a key indicator of health and living conditions; the level of mortality is one of the yardsticks used to measure the effectiveness of primary health care programs and of socioeconomic and environmental policies. Even when mortality is high, there are generally substantial variations in survival chances according to economic, environmental, and geographic criteria. As mortality declines, differences in knowledge of and access to the means of survival reflect the persistence of societal inequalities, despite socioeconomic policies designed to promote the welfare of all equally.
The second interest in mortality relates to the fertility implications of increasing or decreasing mortality. The transition from a traditional pattem of family building is usually marked by increased motivation and the ability to decide on the timing of births and the ultimate size of families. The traditional stereotype for developing countries is one in which children are inevitable, though some pregnancies are delayed by factors such as prolonged breastfceding, and some are terminated, often under circumstances involving considerable risk to the woman's health. When a child is born, its survival is by no means certain and the experience of losing a child through death is common to many women. Important in the concept of controlled fertility is the raised confidence in the survival of each child induced by a decline in mortality. At the same time, the practical aspects of coping with more surviving children, along with raised economic aspirations for the parents, can stimulate a desire to regulate fertility and control family size and a demand for effective means to do so.
The conditions which lead to mortality reduction also result in improved maternal health and nutritional status. A consequcncc of this may be an increase in the number of full-term pregnancies ending in a live birth. This would tend to stimulate a desire to control fertility. Thus, it is important that information about mortality be included in any study of fertility change, regulation, and differentials.
The data collected in the 1991/92 Yemen Demographic and Maternal and Child Health Survey (YDMCHS) permit the direct and indirect estimation of infant and child mortality. This chapter presents information dealing with: assessment of data quality, prevalence of child loss; levels and trends in infant and child mortality; differentials in infant and child mortality; reproductive factors and infant and child mortality; environmental factors; and causes of death.
12.1 A S S E S S M E N T O F D A T A Q U A L I T Y
The reliability of infant and childhood mortality estimates depends on the completeness and accuracy of reporting of births and deaths. Omission of births and deaths directly affects mortality estimates, and displacement of dates has an impact on mortality trends. To determine the quality of data collected in the
145
YDMCHS, the distribution of all children by calendar year of birth and of dead children by age at death was examined (see Appendix D, Tables D.4 and D.6). Table D.4 indicates the presence of a slight deficit of births in the fifth year prior to the survey, and an excess of births in the sixth year preceding the survey.
The most common source of error in the reporting of child's age at death is the tendency of mothers to report age at death in multiples of six months. Partly to minimize this error, interviewers were instructed to record deaths under one month in days, and under two years of age in months. Although misreporting of age at death can result in biased estimates of infant and childhood mortality, a study using DHS data from a number of countries indicates that heaping of age at death at 12 months would bias the estimates by no more than 5 percent (Sullivan, et al, 1990). Thus, the rates presented in this report are unadjusted, i.e., no efforts were made to average out the heaping present in the data as shown in Appendix Tables D.5 and D.6.
12.2 P R E V A L E N C E O F C H I L D LOSS
In societies that have achieved very low levels of mortality, which is generally accompanied by low fertility, a woman's present family size (measured by the number of surviving children) and the number of children ever born are practically synonymous. However, in many populations the death of a child remains a common feature of the family building process, with the result that there is a sizeable disparity between the number of children who are bom and the number who survive to adulthood. Most of this loss occurs early in life.
The impact of infant and child mortality in the family building proccss is analyzed in this section in two ways. First, the differences are examined between lifetime fcrtility, defined as the mean number of live births per woman, and family size, defined as the mean number of children at the time of the survey. Table 12.1 shows mean number of children evcr born and the proportion dead among children ever bom by current
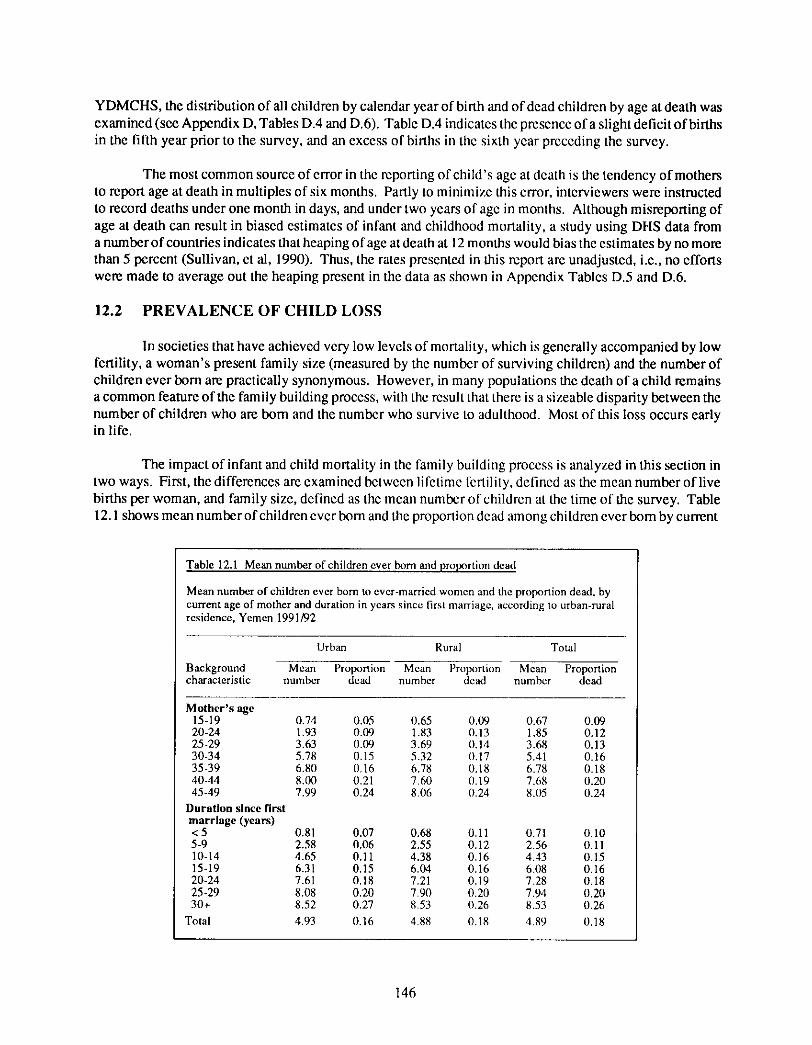
Table 12.1 Mean number of children ever born and prolxmion dead
Mean number of children ever born to ever-married women and the proportion dead, by current age of mother and duration in years since first marriage, according to urban-rural residence, Yemen 1991/92
Urban Rural Total
Background Mean Proportion Mean Proportion Mean Proportion characteristic number dead number dead number dead
Mothe r ' s age 15-19 0.74 0.05 0.65 0.09 0.67 0.09 20-24 1.93 0.09 1.83 0.13 1.85 0.12 25-29 3.63 0.09 3.69 0.14 3.68 0.13 30-34 5.78 0.15 5.32 0.17 5.41 0.16 35-39 6.80 0.16 6.78 0.18 6.78 I).18 40-44 8 .(/13 0.21 7.60 0.19 7.68 0.20 45-49 7.99 0.24 8.06 0.24 8.1)5 0.24
Duration since first mar r i age (years) < 5 0.81 0.07 0.68 0.11 0.71 0.10 5-9 2.58 0.06 2.55 0.12 2.56 0.11 10-14 4.65 0.11 4.38 0.16 4.43 0.15 15-19 6.31 0.15 6.04 0.16 6.08 0.16 20-24 7.61 0.18 7.21 0.19 7.28 0.18 25 -29 8.08 0.20 7.90 0.20 7.94 0.20 30+ 8.52 0.27 8.53 I).26 8.53 0.26
Total 4.93 0.16 4.88 I).18 4.89 I).18
146
age of mother and duration since first marriage, according to urban-rural residence. These data are used to examine the prevalence of child loss over the lifetime of the women interviewed in the survey. The accuracy of such data is affected by underreporting of dead children, especially by older women as a result of recall problems.
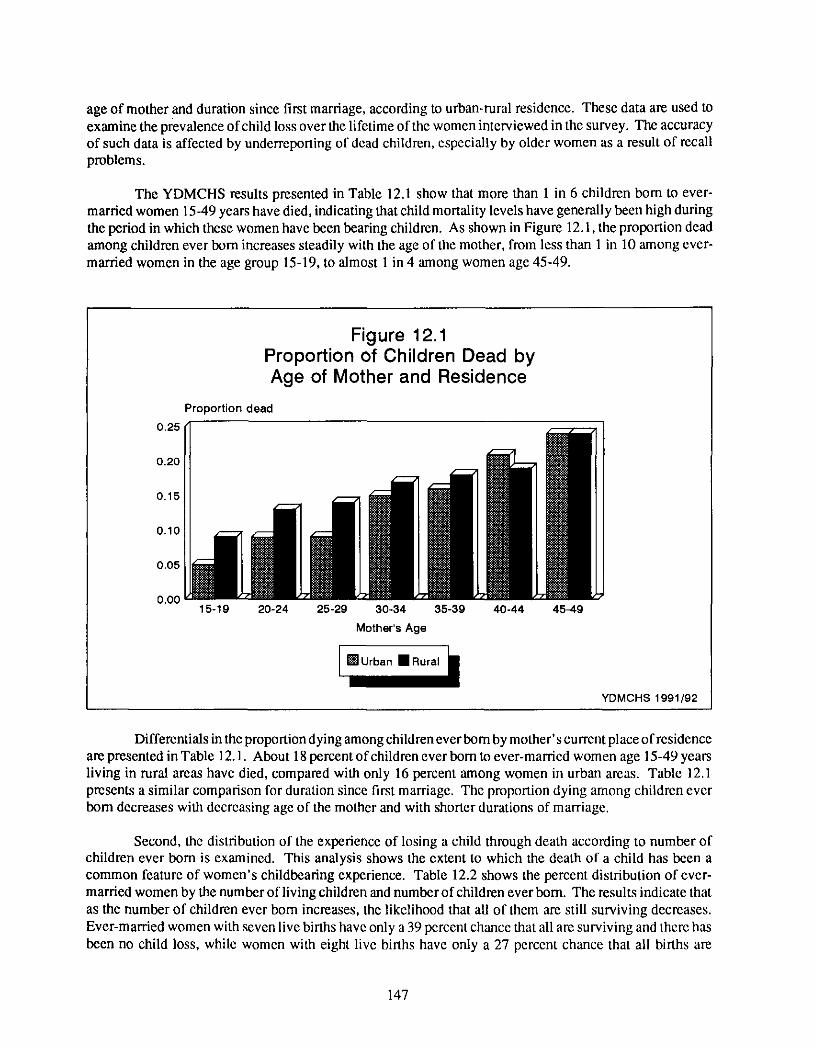
The YDMCHS results presented in Table 12.1 show that more than 1 in 6 children bom to ever- married women 15-49 years have died, indicating that child mortality levels have generally been high during the period in which these women have been bearing children. As shown in Figure 12.1, the proportion dead among children ever born increases steadily with the age of the mother, from less than 1 in 10 among ever- married women in the age group 15-19, to almost 1 in 4 among women age 45-49.
0.25
Figure 12.1 Proportion of Children Dead by Age of Mother and Residence
Proportion dead
0.20
0.15
0.10
0,05
0.00 15-19 20-24 25-29 30*34 35-39 40-44 45-49
Mother's Age
YDMCHS 1991/92
Differentials in the proportion dying among children ever born by mother' s current place of residence are presented in Table 12.1. About 18 percent of children ever bom to ever-married women age 15-49 years living in rural areas have died, compared with only 16 percent among women in urban areas. Table 12.1 presents a similar comparison for duration since first marriage. The proportion dying among children ever bom decreases with decreasing age of the mother and with shorter durations of marriage.
Second, the distribution of the experience of losing a child through death according to number of children ever bom is examined. This analysis shows the extent to which the death of a child has been a common feature of women's childbearing experience. Table 12.2 shows the percent distribution of ever- married women by the number of living children and number of children ever bom. The results indicate that as the number of children ever born increases, the likelihood that all of them are still surviving decreases. Ever-married women with seven live births have only a 39 percent chance that all are surviving and there has been no child loss, while women with eight live births have only a 27 percent chance that all births are
147
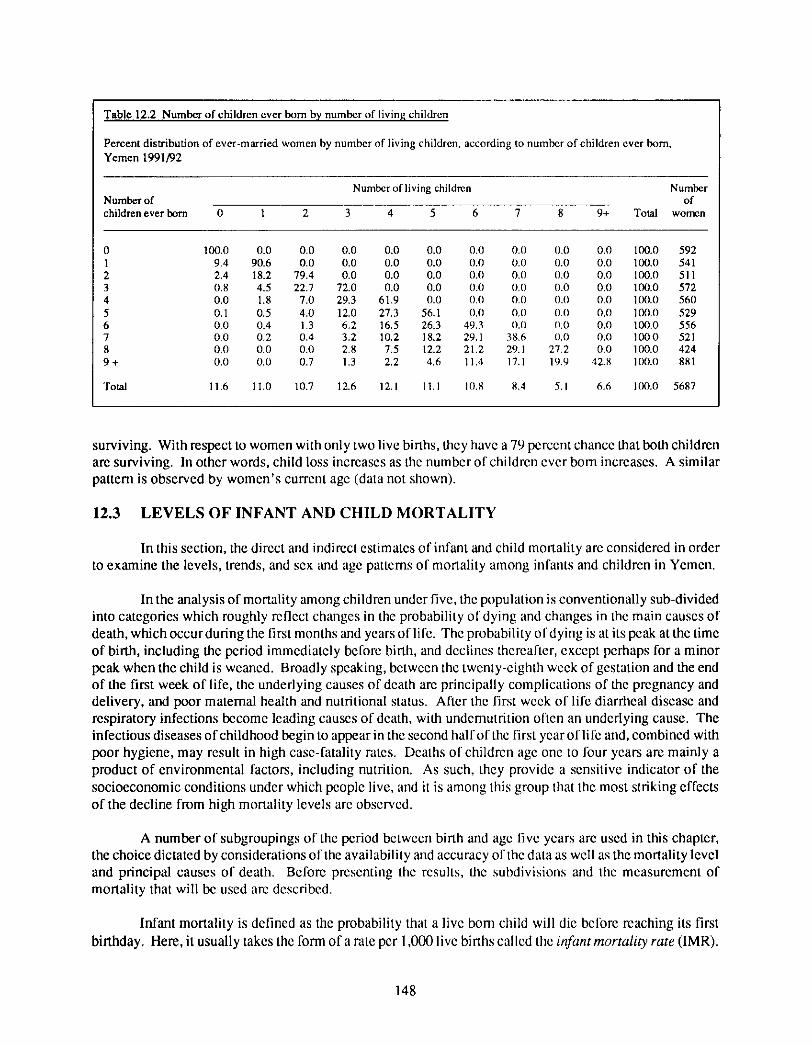
Table 12.2 N u m b e r o f ch i ldren ever bo rn by n u m b e r of l iving ch i ldren
Percent distxibution o f ever -m arried w o m e n by n u m b e r of l iving chi ldren, according to n u m b e r o f chi ldren ever born , Y e m e n 1991/92
Number of living children Number Number of of children ever born 0 1 2 3 4 5 6 7 8 9+ Total women
0 100.0 0.0 0.0 0.0 0.0 0.0 0.0 0.0 0.0 0.0 100.0 592 1 9.4 90.6 0.0 0.0 0.0 0.0 0.0 0.0 0.0 0.0 100.0 541 2 2.4 18.2 79.4 0.0 0.0 0.0 0.11 0.0 0.0 0.0 100.0 511 3 0.8 4.5 22.7 72.0 0.0 0.0 0.0 0,0 0.0 0.0 100.0 572 4 0.0 1.8 7.0 29.3 61.9 0.0 0.0 0.0 0.0 0.0 100.0 560 5 0.1 0.5 4.0 12.0 27.3 56.1 0.0 0.0 0.0 0.0 100.0 529 6 0.0 0.4 1.3 6.2 16.5 26.3 49.3 0.0 0.0 0.0 100.0 556 7 0.0 0.2 0.4 3.2 10.2 18.2 29.1 38.6 0.0 0.0 lO0.O 521 8 0.0 0.0 0.0 2.8 7.5 12.2 21,2 29.1 27.2 0.0 100.0 424 9 + 0.0 0.0 0.7 1.3 2.2 4.6 11,4 17.1 19.9 42.8 100.0 881
Total 11.6 11,0 10.7 12.6 12.1 II .1 IO,S 8.4 5,1 6.6 100.0 5687
surviving. With respect to women with only two live births, they have a 79 percent chance that both children are surviving. In other words, child loss increases as the number of children ever born increases. A similar pattern is observed by women's current age (data not shown).
12.3 L E V E L S O F I N F A N T A N D C H I L D M O R T A L I T Y
In this section, the direct and indirect estimates of infant and child mortality are considered in order to examine the levels, trends, and sex and age pattcms of mortality among infants and children in Yemen.
In the analysis of mortality among children under five, the population is conventionally sub-divided into categories which roughly reflect changes in the probability of dying and changes in the main causes of death, which occur during the first months and years of life. The probability of dying is at its peak at the time of birth, including the period immediately before birth, and declines thereafter, except perhaps for a minor peak when the child is weaned. Broadly speaking, between the twenty-eighth week of gestation and the end of the first week of life, the underlying causes of death are principally complications of the pregnancy and delivery, and poor maternal health and nutritional status. After the first weck of life diarrheal disease and respiratory infections become leading causes of death, with undemutrition often an underlying cause. The infectious diseases o f childhood begin to appear in the second half of the first year of life and, combined with poor hygiene, may result in high case-fatality rates. Deaths of children age one to four years are mainly a product of environmental factors, including nutrition. As such, they provide a sensitive indicator of the socioeconomic conditions under which people live, and it is among this group that the most striking effects of the decline from high mortality levels arc observed.
A number of subgroupings of the period between birth and age five years are used in this chapter, the choice dictated by considerations of the availability and accuracy of the data as well as the mortality level and principal causes of death. Before presenting the results, the subdivisions and the measurement of mortality that will be used arc described.
Infant mortality is defined as the probability that a live bom child will die belore reaching its first birthday. Here, it usually takes the form of a rate per 1,000 live births called the infant mortality rate (IMR).
148
In order to isolate most of the deaths associated with pregnancy and delivery and with maternal health status, infant deaths are further divided into those occurring in the neonatal and posmeonatal periods, where the neonatal period refers to the first month of life. The rates are called the neonatal mortality rate (NNMR) and the postneonatal mortality rate (PNNMR), respectively.
Childhood mortality is defined as the probability of dying before or between selected ages of childhood. It refers variously to the probability that a child will die in the first two years of life (21to) or in the five years of life (sqo), or between the first and fifth (4q~) birthdays. The rates are presented in terms of deaths per 1,000 live births or per 1,000 survivors to the earlier birthday. These rates are called the under-two mortality rate (U2MR), under-five mortality rate (U5MR), and non-infant child mortality rate (NICMR), respectively.
Cohort Direct Measures of Mortality
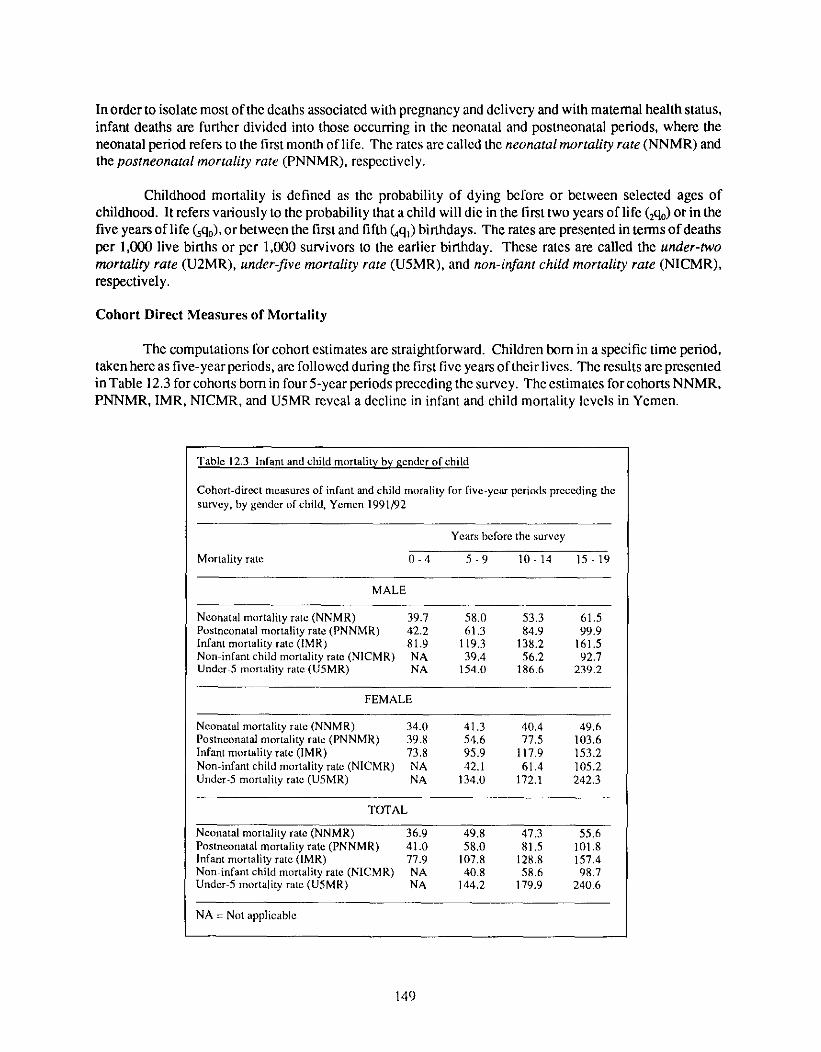
The computations for cohort estimates are straightforward. Children born in a specific time period, taken here as five-year periods, are followed during the first five years oftheirlives. The results are presented in Table 12.3 for cohorts born in four 5-year periods preceding the su rvey. The estimates for cohorts NNMR, PNNMR, IMR, NICMR, and U5MR reveal a decline in infant and child mortality levels in Yemen.
Table 12.3 Infant and child mortality by gender of child
Cohort-direct measures of infant and child morality for five-yem" periods preceding the survey, by gender of child, Yemen 1991/92
Years before the survey
Mortality rate 0 - 4 5 - 9 10 - 14 15 - 19
MALE
Neonatal mortality rate (NNMR) 39.7 58.0 53.3 61.5 Postneonatal mortality rate (PNNMR) 42.2 61.3 84.9 99.9 Infant mortality rate (IMR) 81.9 119.3 138.2 161.5 Non infant child mortality rate (NICMR) NA 39.4 56.2 92.7 Under 5 mortality rate (U5MR) NA 154.O 186.6 239.2
FEMALE
Neonatal mortality rate (NNMR) 34.0 41.3 40.4 49.6 Postneonatal mortality rate (PNNMR) 39.8 54.6 77.5 1113.6 lnfant mot tality rate (IMR) 73.8 95.9 117.9 153.2 Non-infant child mortality rate (NICMR) NA 42.1 61.4 105.2 Under-5 mortality rate (U5MR) NA 134.0 172.1 242.3
TOTAL
Neonatal mortality rate (NNMR) 36.9 49.8 47.3 55.6 Postneonatal mortality rate (PNNMR) 41,0 58,0 81.5 101.8 Infant mortality rate (IMR) 77.9 107.8 128.8 157.4 Non infant child mortality rate (NICMR) NA 40.8 58.6 98.7 Under 5 mortality rate (U5MR) NA 144.2 179.9 240.6
NA = Not applicable
149
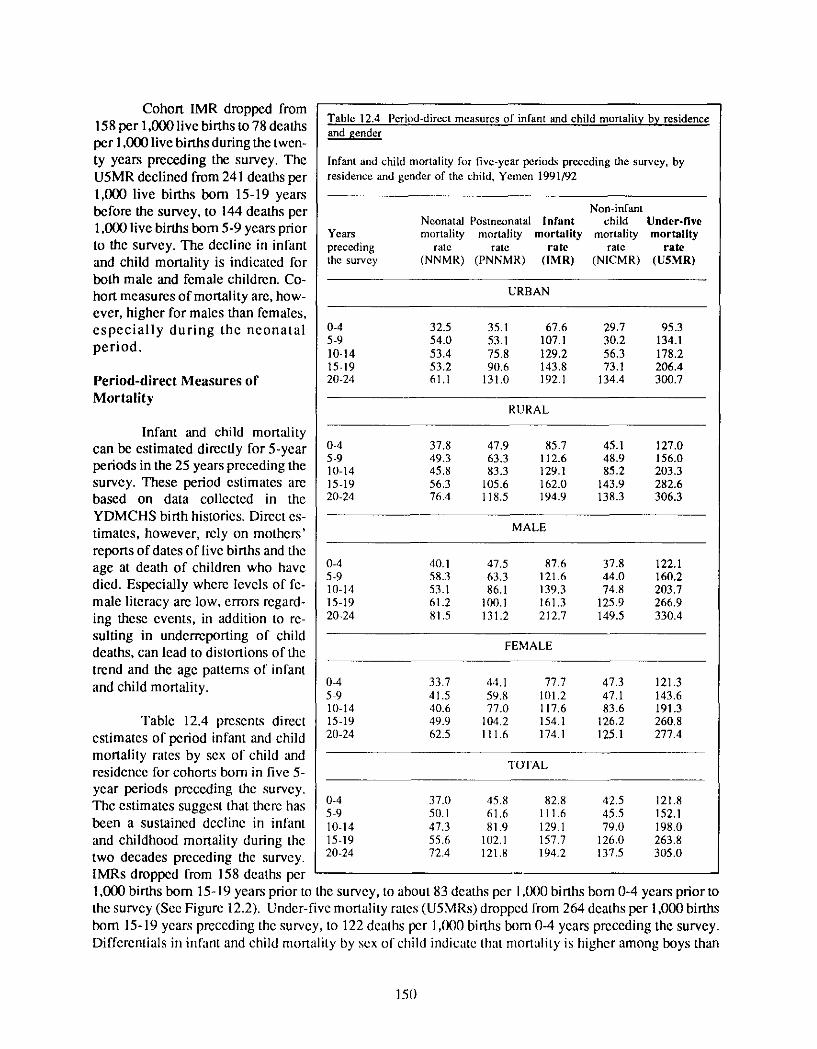
Cohort IMR dropped from 158 per 1,000 live births to 78 deaths per 1,000 live births during the twen- ty years preceding the survey. The U5MR declined from 241 deaths per 1,1300 live births born 15-19 years before the survey, to 144 deaths per 1,000 live births born 5-9 years prior to the survey. The decline in infant and child mortality is indicated for both male and female children. Co- hort measures of mortality are, how- ever, higher for males than females, e s p e c i a l l y d u r i n g the n e o n a t a l p e r i o d .
Period-direct Measures of Morta l i ty
Infant and child mortality can be estimated directly for 5-year periods in the 25 years preceding the survey. These period estimates are based on data collected in the YDMCHS birth histories. Direct es- timates, however, rely on mothers' reports of dates of live births and the age at death of children who have died. Especially where levels of fe- male literacy are low, errors regard- ing these events, in addition to re- suiting in underreporting of child deaths, can lead to distortions of the trend and the age patterns of infant and child mortality.
Table 12.4 presents direct estimates of period infant and child mortality rates by sex of child and residence for cohorts born in five 5- year periods preceding the survey. The estimates suggest that there has been a sustained decline in infant and childhood mortality during the two decades preceding the survey. IMRs dropped from 158 deaths per
Table 12.4 Period-direct measures of infant and child mortality by residence and gender
Infant and child mortality for five-year periods preceding the survey, by residence and gender of the child, Yemen 1991/92
Non-infant Neonatal Posmeonatal Infant child Under-five
Years mortality mortality raortality mortality mortal i ty preceding rate rate rate rate rate the survey (NNMR) (PNNMR) (IMR) (NICMR) (U5MR)
URBAN
0-4 32.5 35. l 67.6 29.7 95.3 5-9 54.0 53.1 107.1 30.2 134.1 10-14 53.4 75.8 129.2 56.3 178.2 15-19 53.2 9(I.6 143.8 73.1 206.4 20-24 61.1 131.0 192.1 134.4 300.7
RURAL
0-4 37.8 47.9 85.7 45.1 127.0 5-9 49.3 63.3 112.6 48.9 156.0 10-14 45.8 83.3 129.1 85.2 203.3 15-19 56.3 105.6 162.0 143.9 282.6 20-24 76.4 118.5 194.9 138.3 306.3
MALE
0-4 40.1 47.5 87,6 37.8 122.1 5-9 58.3 63.3 121.6 44.0 160.2 10-14 53.1 86.1 139.3 74.8 203.7 15-19 61.2 100.1 161.3 125.9 266.9 20-24 81.5 131.2 212.7 149.5 330.4
FEMALE
0-4 33.7 44.1 77.7 47.3 121.3 5 9 41.5 59.8 101.2 47.1 143.6 11/-14 40.6 77.0 117.6 83.6 191.3 15-19 49.9 104.2 154.1 126.2 260.8 211-24 62.5 111.6 174.1 125.1 277.4
TOTAL
0-4 37.0 45.8 82.8 42.5 121.8 5 9 50.1 61.6 111.6 45.5 152.1 10-14 47.3 81.9 129.1 79.0 198.0 15-19 55.6 102.1 157.7 126.0 263.8 20-24 72.4 121.8 194.2 137.5 305.0
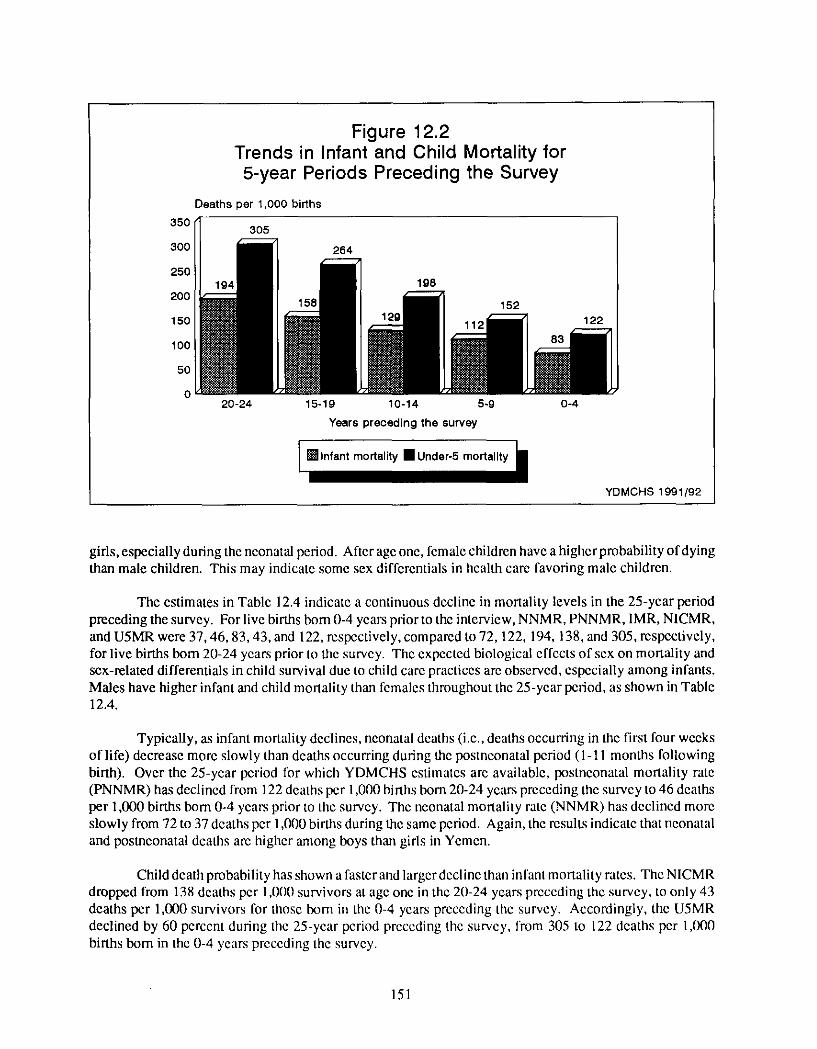
1,000 births bom 15-19 years prior to the survey, to about 83 deaths per 1 ,(X)(I births born 0-4 years prior to the survey (See Figure 12.2). Under-five mortality rates (U5MRs) droppcd from 264 deaths per 1,000 births born 15-19 years preceding the survey, to 122 deaths per 1 ,(X)0 births born 0-4 years preceding the survey. Differentials in infant and child mortality by sex of child indicate that mortality is higher among boys than
150
350
300
250
200
150
100
50
0
Figure 12.2 Trends in Infant and Child Mortality for 5-year Periods Preceding the Survey
Deaths per 1,000 births
20-24 15-19 10-14 5-g 0-4
Years preceding the survey
YDMCHS 1991/92
girls, especially during the neonatal period. After age one, female children have a higher probability of dying than male children. This may indicate some sex differentials in health care favoring male children.
The estimates in Table 12.4 indicate a continuous decline in mortality levels in the 25-year period preceding the survey. For live births bom 0-4 years prior to the interview, NNMR, PNNMR, IMR, NICMR, and U5MR were 37, 46, 83, 43, and 122, respectively, compared to 72,122, 194, 138, and 305, respectively, for live births born 20-24 years prior to the survey. The expected biological effccts of sex on mortality and sex-related differentials in child survival due to child care practices are observed, especially among infants. Males have higher infant and child mortality than females throughout the 25-year period, as shown in Table 12.4.
Typically, as infant mortality declines, neonatal deaths (i.e., deaths occurring in the first four weeks of life) decrease more slowly than deaths occurring during the posmeonatal period (1-11 months following birth). Over the 25-year period tbr which YDMCHS estimates are available, postneonatal mortality rate (PNNMR) has declined from 122 deaths per 1,000 births born 20-24 years preceding the survey to 46 deaths per 1,000 births born 0-4 years prior to the survey. The neonatal mortality rate (NNMR) has declined more slowly from 72 to 37 deaths per 1,000 births during the same period. Again, the results indicate that neonatal and postneonatal deaths are higher among boys than gids in Yemen.
Child death probability has shown a laster and larger decline than inlant mortality rates. The NICMR dropped from 138 deaths per 1,000 survivors at age one in the 20-24 years preccding the survey, to only 43 deaths per 1,000 survivors for those born in the 0-4 years preceding thc survey. Accordingly, the U5MR declined by 60 percent during the 25-ycar period preceding the survey, from 305 to 122 deaths per 1,l)00 births born in the 0-4 years prcceding the survey.
151
Differentials in infant and child mortality by residence are significant. The direct estimates show that mortality levels in rural areas are much higher than in urban areas. This is tme regardless of the time period or the child age at death. In addition, infant and child mortality (except neonatal mortality) declined at a faster pace in urban areas than in rural areas.
Indirect Estimates of Mortality
Estimates of mortality can also be derived from the proportion of children who died by five-year age groups of women or by five-year intervals since first marriage. These indirect estimates are based on the total number of children ever born and the number of living children, and do not require the sophisticated level of reporting used for direct estimates. Instead, they rely on demographic models and assume that the infant and childhood age schedule of mortality conforms approximately to that of a model life table.
The level of mortality implied by indirect rates is generally higher than for direct period rates. The upward bias, which usually occurs for young mothers (age 15-19) or mothers with short duration of marriage (0-4 years)--since mortality is generally higher for first births than for higher-order bir ths--can extend into the next age group or duration group (Ewbank, 1982; Preston, 1985).
Indirect techniques were applied to data on the proportion dead among children ever bom by age of mother and duration of marriage, according to number of ycars since first marriage. Howevcr, because of the problems that might arise whcn the duration of marriage is not accurately measured, and when entrance into (leg'd) marriage predates the initiation of cohabitation--as may occur in Yemen--the duration wlriant is expected to be less accurate than the age variant.
Table 12.5 prescnts indirect estimates of infant and child mortality according to place of residence and specified reference dates for the age and duration variants, assuming the Coale-Dcmcny 119661 South model life tables and Trusscll (1975) multipliers, which map these proportions to probabilities of dying. The YDMCHS results indicate a downward trend in infant and child mortality since the late 1970s. The estimated indirect infant mortality rate declined from 131) dcaths per 1,000 live births in 1978 to 101 deaths in 1988. For non-infant child mortality, the declinc observed for the same period was morc pronounced. The indirect non-infant child mortality rate declined by 4(1 percent, from 89 deaths per 1 ,l/00 children one year of age in 1978 to only 53 deaths in 1988 (scc Age Modcl, Table 12.51.
The under-five mortality rate, which is the overall summary measure, shows that while 1 of every 5 live births was cxpected to die before the fifth birthday in 1978, only 1 of 7 was cxpcctcd to die in 1988, a decline of about 30 percent over the ten-year period from 1978 to 1988. This figure, however, is much higher than the target set by the United Nations--an under-five mortality rate of 70 by the year 211(1l). If Yemen is to achieve this target, greatcr cflort and resourccs arc required. With the pace of decline observed during the period 1978-88, it is more likely that thc under-five mortality rate in the year 2000 will bc in the mid- to upper 70s per 1 ,(ll10 livc births. The results of the duration model arc consistent with the age model, though slightly higher.
Differentials in the level of infant and child mortality by place of residence are substantial. As shown in Table 12.5, the indircct rates for infant mortality, non-infant child mortality, and under-five mortality in rural areas are higher than the corrcsponding rates in urban areas.
152
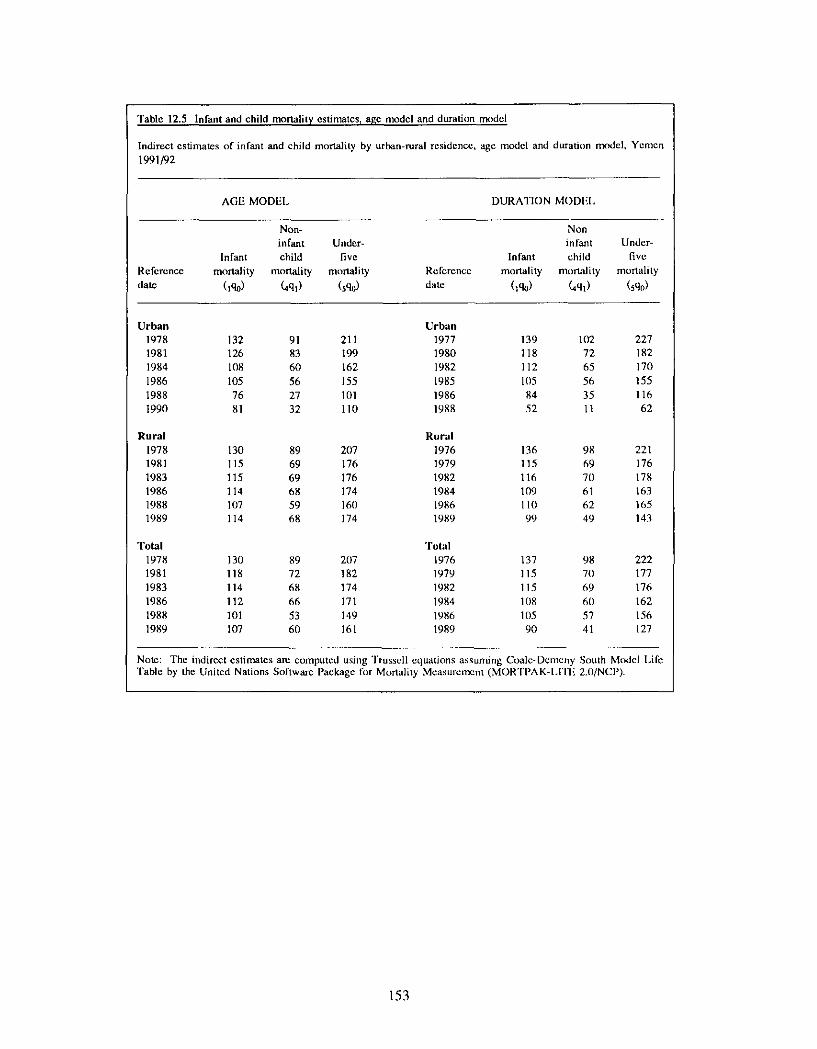
Table 12.5 Infant and child mortality estimates~ age model and duration model
Indirect estimates of infant and child mortality by urban-rural residence, age model and duration model, Yemen 1991/92
AGE MODEl. DURATION MODEl.
Non- Non infant Under- infant Under-
Infant child five Infant child five Reference mortality mortality mortality Reference mortality mortality mortality
date (1%) (4ql) (sq0) date (1%) (aql) (sq0)
Urban Urban 1978 132 91 211 1977 139 102 227 1981 12~5 83 199 1980 118 72 182 1984 108 60 162 1982 112 65 1711 1986 105 56 155 1985 1(15 56 155 1988 76 27 101 1986 84 35 116 1990 81 32 110 1988 52 11 62
Rural Rural 1978 130 89 207 1976 136 98 221 1981 115 69 176 1979 115 69 176 1983 115 69 176 1982 116 70 178 1986 114 68 174 1984 109 61 163 1988 107 59 160 1986 110 62 165 1989 114 68 174 1989 99 49 143
Total 'rolal 1978 130 89 207 1976 137 98 222 1981 118 72 182 1979 115 70 177 1983 114 68 174 1982 115 69 176 1986 112 66 171 1984 108 611 162 1988 101 53 149 1986 11)5 57 156 1989 107 60 161 1989 90 41 127
Note: The indirect estimates am computed using Trussell equations assuming Coale-Dcmeny South Model Life 'Fable by the United Nations Software Package for Mortality Measurement (MORTPAK-I.ITE 2.0/NCP).
153
12.4 DIFFERENTIALS IN INFANT AND CHILD MORTALITY
Infant and child mortality is often thought to be higher among certain socioeconomic groups than others because of differences in living standards and health conditions in general, and differential availability and access to public health facilities in particular. In this section, differentials in infant and child mortality are examined with special attention given to selected background characteristics: place of residence, mother 's level of education, region, and maternal health care.
Place of Residence and Region
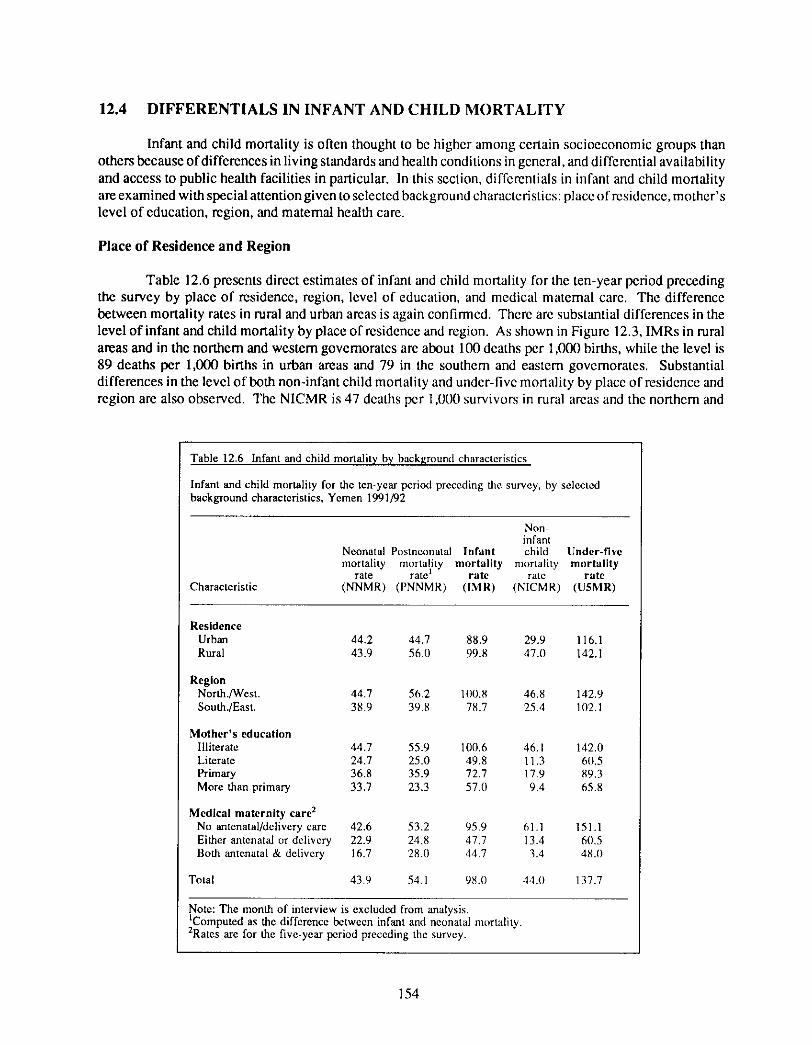
Table 12.6 presents direct estimates of infant and child mortality for the ten-year period preceding the survey by place of residence, region, level of education, and medical matemal care. The difference between mortality rates in rural and urban areas is again confirmed. There are substantial differences in the level of infant and child mortality by place of residence and region. As shown in Figure 12.3, IMRs in rural areas and in the northern and western govemorates are about 100 deaths per 1,000 births, while the level is 89 deaths per 1,000 births in urban areas and 79 in the southem and eastern govemorates. Substantial differences in the level of both non-infant child mortality and undcr-five mortality by place of residence and region are also observed. The NICMR is 47 deaths per 1,0l/0 survivors in rural areas and the northern and
Table 12.6 Infant and child mortality by background characteristics
Infant and child mortality for the ten-year period preceding the survey, by selected background characteristics, Yemen 1991/92
Characteristic
Non infant
Neonatal Posmeonatal Infant child Under-five mortality mortality mortali ty mortality mortali ty
rate rate I rate rate rate (NNMR) (PNNMR) ([MR) (NICMR) (U5MR)
Residence Urban 44.2 44.7 88.9 29.9 116.1 Rural 43.9 56.1) 99.8 47.11 142.1
Region Nor th./West. 44.7 56.2 100.8 46.8 142.9 South.lEast. 38.9 39.8 78.7 25.4 102.1
Mother's education Illiterate 44.7 55.9 100.6 46.1 142.0 Literate 24.7 25.0 49.8 11.3 611.5 Primary 36.8 35.9 72.7 17.9 89.3 More than primary 33.7 23.3 57.11 9.4 65.8
Medical maternity care 2 No antenatal/delivery care 42.6 53.2 95.9 61.1 151.1 Either antenatal cJr delivery 22.9 24.8 47.7 13.4 61/.5 Both antenatal & delivery 16.7 28.0 44.7 3.4 48.11
Total 43.9 54.1 98./) 44.0 137.7
Note: The month of interview is excluded from analysis. IComputed as the difference between infant and neonatal mortality. 2Rates are for the five-year period preceding the survey.
154
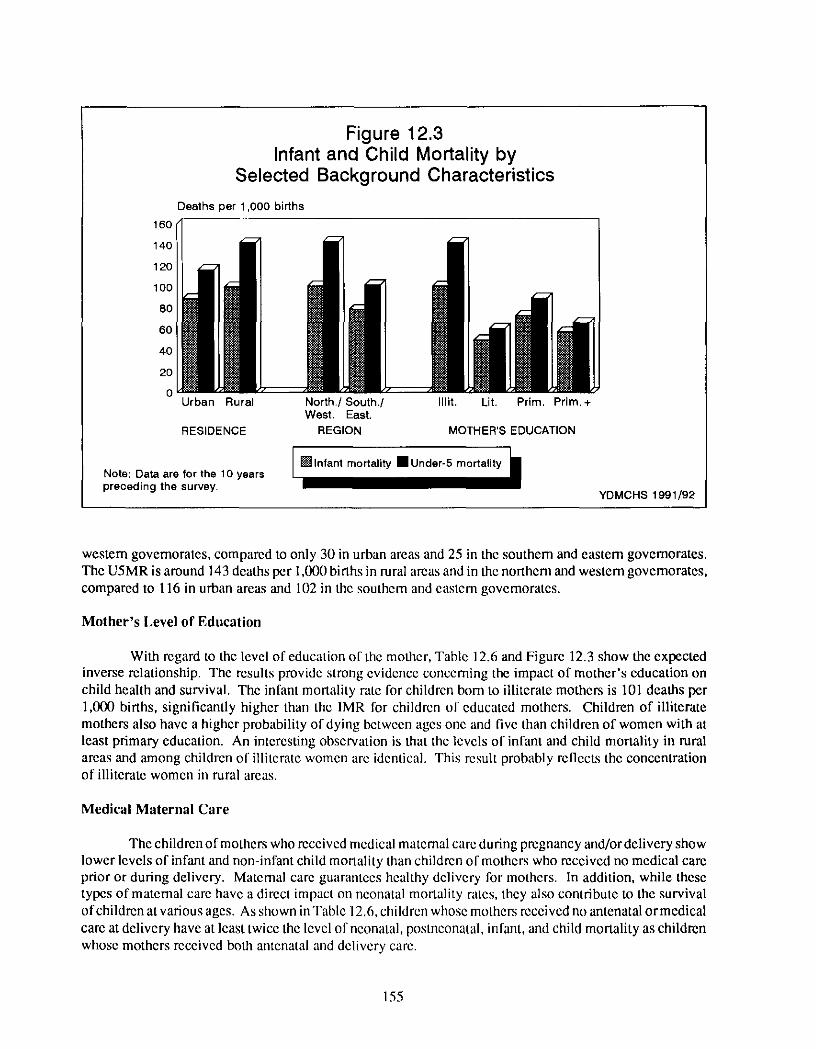
Figure 12.3 Infant and Child Mortality by
Selected Background Characteristics
160
140
120
100
80
60
40
20
Deaths per 1,000 births
Urban Rural North,/South./ West. East.
RESIDENCE REGION
Illit, Lit. Prim, Prim.+
MOTHER'S EDUCATION
Note: Data are for the 10 years preceding the survey.
YDMCHS 1991/92
western govemorates, compared to only 30 in urban areas and 25 in the southern and eastem governorates. The U5MR is around 143 deaths per 1,000 births in rural areas and in the northern and western governorates, compared to 116 in urban areas and 102 in the southern and eastern governoratcs.
Mother's Level of Education
With regard to the level of education of the mother, Table 12.6 and Figure 12.3 show the expected inverse relationship. The results provide strong evidence concerning the impact of mother's education on child health and survival. The infant mortality rate for children born to illiterate mothers is 101 deaths per 1,000 births, significantly higher than the 1MR for children of educated mothers. Children of illiterate mothers also have a higher probability of dying between ages one and five than children of women with at least primary education. An interesting observation is that the levels of infant and child mortality in rural areas and among children of illiterate women are identical. This result probably reflects the concentration of illiterate women in rural areas.
Medical Maternal Care
The children of mothers who received medical maternal care during pregnancy and/or delivery show lower levels of infant and non-infant child mortality than children of mothers who received no medical care prior or during delivery. Maternal care guarantees healthy delivery for mothers. In addition, while these types of maternal care have a direct impact on nconatal monality rates, they also contribute to the survival of children at various ages. As shown in Table 12.6, children whose mothers received no antenatal or medical care at delivery have at least twice the level of nconatal, posmeonatal, infant, and child mortality as children whose mothers received both antenatal and delivery care.
155
12.5 R E P R O D U C T I V E F A C T O R S AND C H I L D S U R V I V A L
The interaction of factors associated with individual women, and more specifically with individual children, and the role of the woman's reproductive life cycle in infant and child survival, are considered in this section. Infant and child mortality are closely related to reproductive behavior, especially in the context of the traditional family building process. Four bio-demographic factors have been found to be particularly associated with infant and child mortality. These are: sex of child, age of mother at maternity, birth order, and birth spacing.
It is well-established that male children are at increased mortality risk both before and shortly after birth compared with female children, presumably due to genetic factors. However, mortality after the first month should not be affected by the sex of the child.
Children born to women under 20 years of age and to older women at the end of their reproductive cycle are much more likely to die in the first five years of life than are those born to women in their twenties or thirties. The pattern of high mortality among children born to women at the extremes of the reproductive ages is fairly universal. It is associated with selectivity in respect to socioeconomic factors, though it is principally and directly an effect of physiological determinants. Children born to younger mothers are at risk in the neonatal period for a range of causes associated with pregnancy and delivery; in addition, the larger proportion of low birth weight children born to younger mothers inw)lves a disadvantage which extends beyond the neonatal period.
The chances of surviving infancy and childhood decrease according to the number of live births the mother has already experienced. It is also often found that first births are subject to especially high neonatal mortality. Mortality among children bom to women of high parity is especially elevated in the neonatal and postneonatal periods. Increasing maternal age is associated with physiological hlctors exacerbated by the effects of socioeconomic variables.
The factor that most strikingly differentiates alternative survival chances is the length of the preceding birth interval. Infant mortality among births that occurred after an interval of less than two years is usually much higher than among children who were born after an interval of two years or more. The relationship tends to hold even after restricting the comparison to children born after a short interval in which the previous child survived. Pregnancy coming too soon after the previous confinement leaves the mother little time to recover her bealth (maternal depletion), especially ira child is still unweaned when the next child is conceived. Indeed, a continuous cycle of pregnancy and lactation leads to progressively higher risks of low birth weight babies with heightened chances of death.
Young children of women with high parity and/or short intervals between births are in competition for the mother 's care and attention. It is likely that these factors account for some of the higher mortality at different stages of childhood.
The effects of these reproductive factors on infant and child mortality are cxamincd in the following section. The analysis is based on birth history estimates of infant and child mortality for the ten-year period preceding the survey, by sex of child, matcmal age, birth order, and the length of the preceding birth interval.
Sex of Child
Table 12.7 shows the direct estimates of infant and child mortality by selected demographic characteristics for the ten-year period preceding the survey. For Yemcni children, infant mortality is higher for boys than for girls (106 versus 90 deaths per 1,000 births). The higher male IMRs are largely duc tn
156
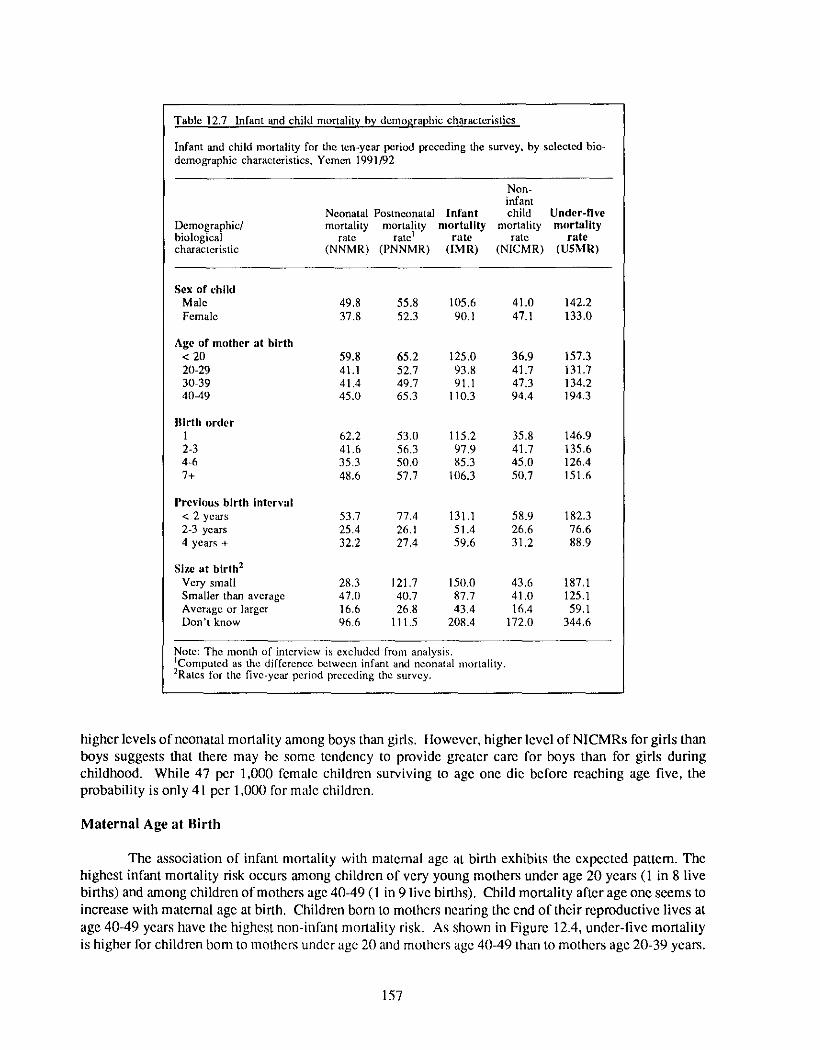
Table 12.7 Infant and child mortality by demographic characteristics
Infant and child mortality for die ten-year period preceding the survey, by selected bio- demographic characteristics, Yemen 1991/92
Non- infant
Neonatal Postneonatal Infant child Under-l ive Demographic/ mortality mortality mortali ty mortality mortali ty biological rate rate ~ rate rate rate characteristic (NNMR) (PNNMR) (IMR) (NICMR) (U5MRI
Sex of child Male 49.8 55.8 105,6 41.0 142.2 Female 37.8 52.3 90.1 47.1 133.0
Age of mother at birth < 20 59.8 65.2 125.0 36.9 157.3 20-29 41,1 52.7 93.8 41,7 131.7 30-39 41.4 49.7 91.1 47.3 134.2 40-49 45.0 65.3 110.3 94.4 194.3
Ilirth order 1 62.2 53.0 115.2 35.8 146.9 2-3 41.6 56.3 97.9 41,7 135.6 4-6 35.3 50.0 85.3 45.0 126.4 7+ 48.6 57.7 106.3 50.7 151.6
Prevhms bir th interval < 2 years 53.7 77.4 131.1 58,9 182.3 2-3 years 25.4 26.1 51.4 26.6 76.6 4 years + 32.2 27.4 59.6 31.2 88.9
Size at birth 2 Very small 28.3 121.7 150.0 43.6 187,l Smaller than average 47.0 40.7 87.7 41.0 125.1 Average or larger 16.6 26.8 43,4 16,4 59,1 Don't know 96.6 111.5 208.4 172.0 344.6
Note: The month of interview is excluded from analysis. IComputed as fl~e difference between infant and neonatal mortality. 2Rates for the five-year perind preceding the survey.
higher levels of neonatal mortality among boys than girls. However, higher level of NICMRs for girls than boys suggests that there may be some tendency to provide greater care for boys than for girls during childhood. While 47 per 1,000 femalc children surviving to age one die before reaching age five, the probability is only 41 per 1,000 for male childrcn.
Maternal Age at Birth
The association of infant mortality with maternal age at birth exhibits the expected pattem. The highest infant mortality risk occurs among children of very young mothers under age 20 years (1 in 8 live births) and among children of mothers age 40-49 (1 in 9 live births). Child mortality after age one seems to increase with maternal age at birth. Children born to mothers nearing the end of their reproductive lives at age 40-49 years have the highest non-infant mortality risk. As shown in Figure 12.4, under-five mortality is higher for children born to mothers under age 2(1 and mothcrs age 40-49 than to mothers age 2(I-39 years.
157
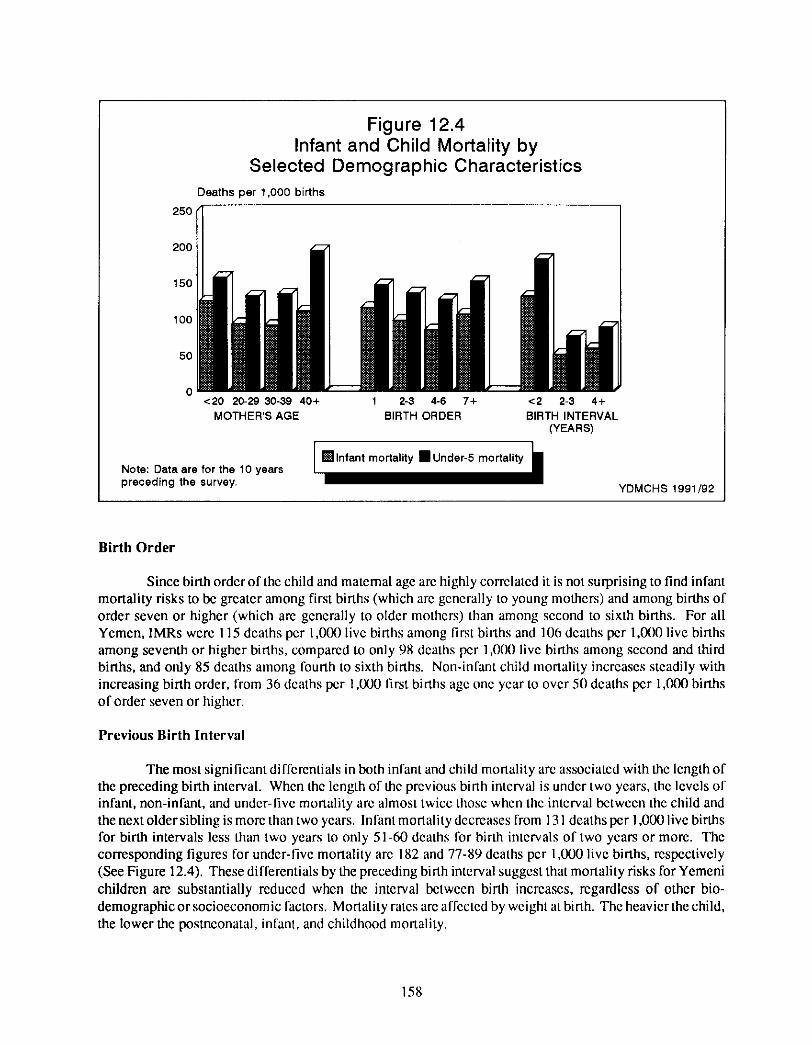
Figure 12.4 Infant and Child Mortality by
Selected Demographic Characteristics Deaths per 1,000 births
250
200
150
100
50
0 <20 20-29 30-39 40+ 1 2-3 4-6 7+ <2 2-3 4+
MOTHER'S AGE BIRTH ORDER BIRTH INTERVAL (YEARS)
Note: Data are for the 10 years preceding the survey.
YDMCHS 1991/92
Birth Order
Since birth order of the child and maternal age are highly correlated it is not surprising to find infant mortality risks to be greater among first births (which are gcnerally to young mothers) and among births of order seven or higher (which are generally to older mothers) than among second to sixth births. For all Yemen, 1MRs were 115 deaths per 1,000 live births among first births and 106 deaths per 1,000 live births among seventh or higher births, compared to only 98 deaths per ] ,000 live births among second and third births, and only 85 deaths among fourth to sixth births. Non-infant child mortality increases steadily with increasing birth order, from 36 deaths per 1,000 first births age one year to over 50 deaths per 1,000 births of order seven or higher.
Previous Birth Interval
The most significant differentials in both infant and child mortality are associated with the length of the preceding birth interval. When the length of the previous birth interval is under two years, the levels of infant, non-infant, and under-five mortality are almost twice those when the interval between the child and the next older sibling is more than two years. In fant mortality decreases from 131 deaths per 1,000 live births for birth intervals less than two years to only 51-60 deaths lbr birth intervals of two years or more. The corresponding figures for under-five mortality are 182 and 77-89 deaths per 1,000 live births, respectively (See Figure 12.4). These differentials by the preceding birth interval suggest that mortality risks for Yemeni children are substantially reduced when the interval between birth increases, regardless of other bio- demographic or socioeconomic factors. Mortality rates are affected by weight at binh. The heavier the child, the lower the posmeonatal, infant, and childhood mortality.
158
12.6 E N V I R O N M E N T A L F A C T O R S AND C H I L D M O R T A L I T Y
Differentials in child health by selected demographic and socioeconomic variables were examined in previous subsections. In addition to the various socioeconomic factors influencing the levels of mortality and morbidity, another important group of factors deserves analysis. Environmental factors are key variables in explaining the large differentials in level of health and nutrition seen in urban and rural areas and across different regions of the country. The environmental factors investigated in this chapter operate at the household level. These factors are broadly divided into two categories. The first is strongly influenced by community infrastructure. These include: source of drinking water and type of toilet facilities. The second is more strongly influenced by socioeconomic level of the household. These include: flooring material, crowding, cleanliness of the area around the house, and whether farm animals and household members are in the same dwelling.
This section focuses on one of the more direct determinants of health: environmental conditions. The level of environmental conditions influences children's exposure to disease and is expected to be directly associated with morbidity and mortality. The main results describing the relationship between environmental factors and infant and child mortality and morbidity are presented below.
Environmental conditions are one of the most direct determinants of infant and child health. In the presence of deteriorated environmental conditions, children are exposed to diseases which may ultimately result in higher rates of mortality. Table 12.8 presents direct estimates of infant and child mortality for the ten-year period preceding the interview according to selected environmental factors.
For infant and non-infant child mortality, the YDMCHS findings, shown in Table 12.8 indicate that only the rates for flooring material and type of toilet facility conform to expected patterns. Better flooring material and toilet facilities are associated, in general, with lower rates of infant and non-infant child mortality. Infant and non-infant child mortality rates vary in the expected direction with source of drinking water and cleanliness of the area around the house. An interesting observation is that the difference between infant mortality levels seems to disappear when the source of drinking water is controlled. Moreover, the presence of stagnant water or sewage problems cause infant and child mortality to increase to alarming high levels, especially in urban areas. While the IMR in urban areas is only 72 deaths per 1,000 live births when the area around the house is clean, it reaches 163 deaths per 1,0130 with the presence of stagnant or sewage water. The two corresponding figures for NICMRs are 18 and 118 deaths per 1,000 live births, respectively. While a similar pattern is observed for 1MRs in rural areas, the figures for presence of clean water and stagnant water/sewage overflow are not far apart (86 and 81 deaths, respectively. However, when the area is dirty around the house, the IMR is 107. These results raise the possibility that a significant cause of high infant and child mortality levels in Yemen are sanitary and environmental conditions.
On the other hand, crowding (measured by the average number of persons per room) and the presence of farm animals in the same dwelling did not exhibit the expected pattern. For example, the infant mortality rate was 111 deaths per 1,000 live births among children residing in houses with two persons or fewer per room compared to only 92 deaths among children residing in houses with at least five persons per room. Additionally, in rural areas, the IMR among children living in houses with farm animals present is lower (99 deaths per 1 ,(X)0 live births) than among children living in houses with no farm animals present (102 deaths per 1,000 live births), an unexpected result.
159
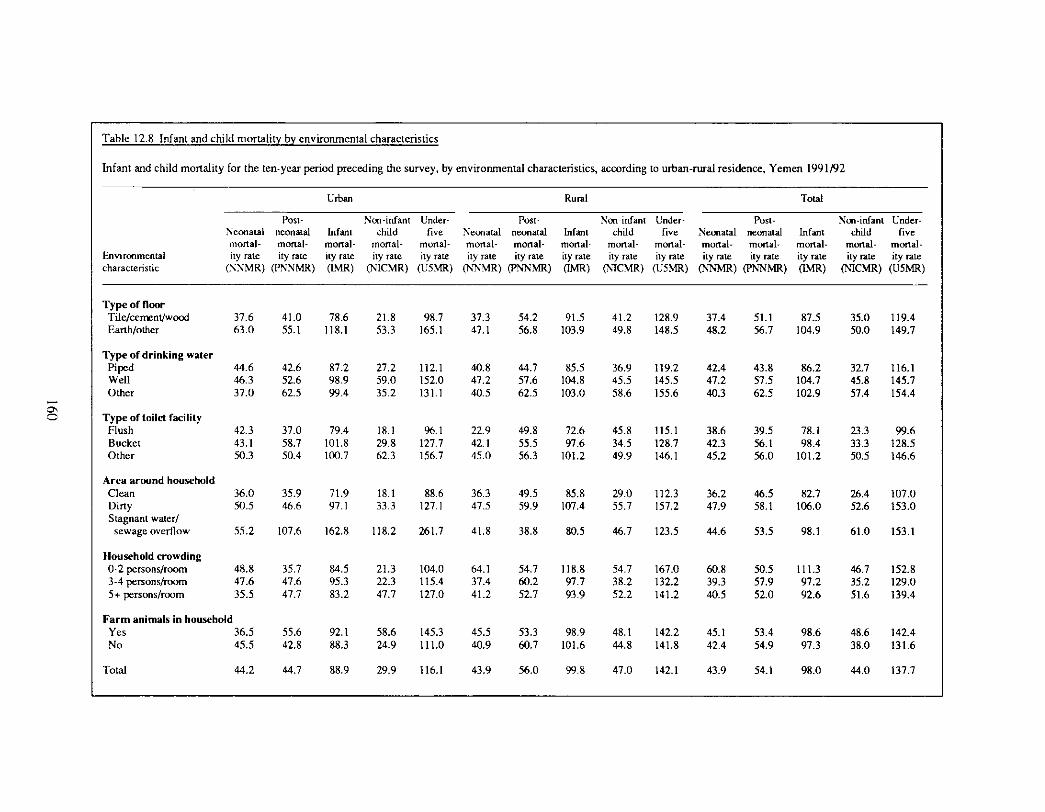
Table 12.8 Infant and child mortality by environmental characteristics
Infant and child mortality for the ten-year period preceding the survey, by environmental characteristics, according to urban-rural residence, Yemen 1991/92
Envlronmelltal characteristic
Urban Rural Total
Post- Non-infant Under- Post- Non infant Under- Post- Non-infant Under- Neonatal neonatal Infant child five Neonatal neonatal Infant child five Neonatal neonatal Infant child five mortal- mortal- mortal- mortal- mortal- mortal- mortal- mortal- mortal- mortal- mortal- mortal- mortal- mortal- mortal- ity rate ity rate ity rate ity rate ity rate ity rate ity rate ity rate ity rate ity rate ity rate ity rate ity rate ity rate ity rate
(N.'NMR) (PNNMR) (LMR) (NICMR) (U5MR) (N'NMR) (PN~MR) 0MR) (NqCMR) (U5MR) (N'NMR) (PN~rMR) CLMR) (N1CMR) (U5MR)
Type of floor Tile/cemenVwood 37.6 41.0 78.6 21.8 98.7 37.3 54.2 91.5 41.2 128.9 37.4 51.1 87.5 35.0 119.4 Earth/other 63.0 55.1 118.1 53.3 165.1 47.1 56.8 103.9 49.8 148.5 48.2 56.7 104.9 50.0 149.7
Type of drinking water Piped 44.6 42.6 87.2 27.2 112.1 40.8 44.7 85.5 36.9 119.2 42.4 43.8 86.2 32.7 116.1 Well 46.3 52.6 98.9 59.0 152.0 47.2 57.6 104.8 45.5 145.5 47.2 57.5 104.7 45.8 145.7 Other 37.0 62.5 99.4 35.2 131.1 40.5 62.5 103.0 58.6 155.6 40.3 62.5 102.9 57.4 154.4
Type of toilet facility Flush 42.3 37.0 79.4 18.1 96.1 22.9 49.8 72.6 45.8 115.1 38.6 39.5 78.1 23.3 99.6 Bucket 43.1 58.7 101.8 29.8 127.7 42.1 55.5 97.6 34.5 128.7 42.3 56.1 98.4 33.3 I28.5 Other 50.3 50.4 100.7 62.3 156.7 45.0 56.3 101.2 49.9 146.1 45.2 56.0 101.2 50.5 146.6
Area around household Clean 36.0 35.9 71.9 18.1 88.6 36.3 49.5 85.8 29.0 112.3 36.2 46.5 82.7 26.4 107.0 Dirty 50.5 46.6 97.1 33.3 127.1 47.5 59.9 107.4 55.7 157.2 47.9 58.1 106.0 52.6 153.0 Stagnant water/
sewage overflow 55.2 107.6 162.8 118.2 261.7 41.8 38.8 80.5 46.7 123.5 44.6 53.5 98.1 61.0 153.1
Household crowding 0-2 persons/room 48.8 35.7 84.5 21.3 104.0 64.1 54.7 118.8 54.7 167.0 60.8 50.5 111.3 46.7 152.8 3-4 persons/room 47.6 47.6 95.3 22.3 115.4 37.4 60.2 97.7 38.2 132.2 39.3 57.9 97.2 35.2 129.0 5+ persons/room 35.5 47.7 83.2 47.7 127.0 41.2 52.7 93.9 52.2 141.2 40.5 52.0 92.6 51.6 139.4
Farm animals in household Yes 36.5 55.6 92.1 58.6 145.3 45.5 53.3 98.9 48.1 142.2 45.1 53.4 98.6 48.6 142.4 No 45.5 42.8 88.3 24.9 111.0 40.9 60.7 101.6 44.8 141.8 42.4 54.9 97.3 38.0 131.6
Total 44.2 44.7 88.9 29.9 116.1 43.9 56.0 99.8 47.0 142.1 43.9 54.1 98.0 44.0 137.7
12.7 C A U S E S O F D E A T H
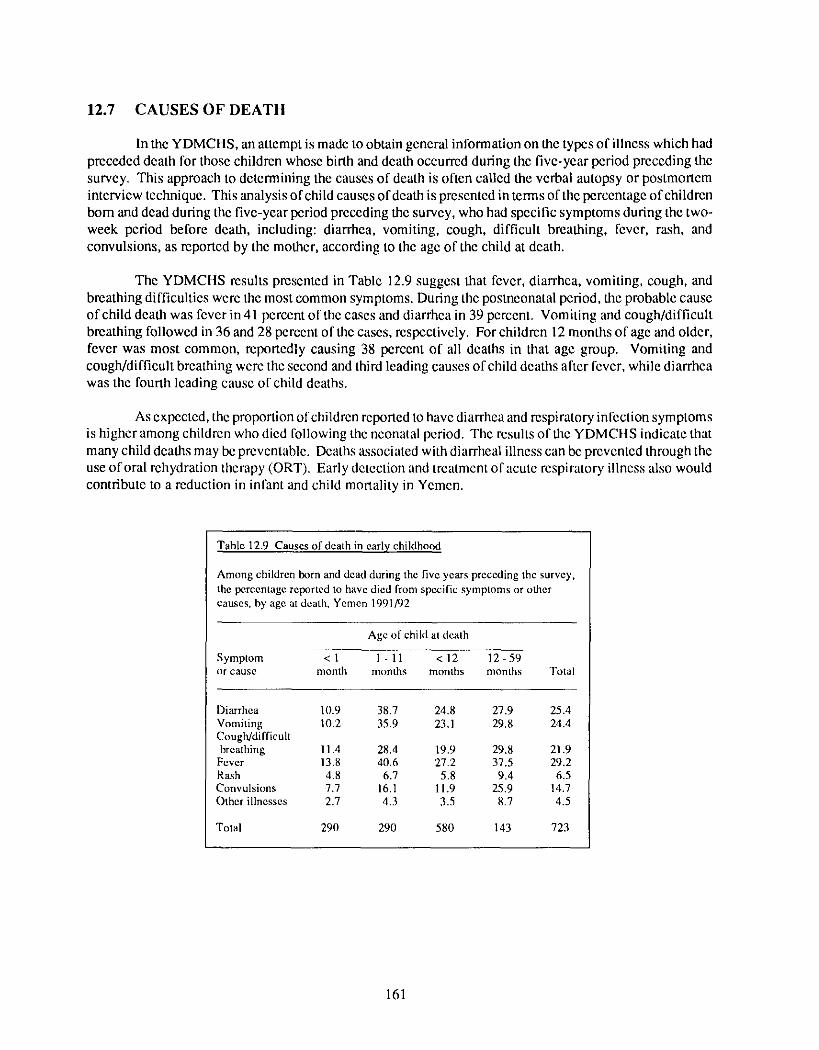
In the YDMCHS, an attempt is made to obtain general information on the types of illness which had preceded death for those children whose birth and death occurred during the five-year period preceding the survey. This approach to determining the causes of death is often called the verbal autopsy or postmortem interview technique. This analysis of child causes of death is presented in terms of the percentage of children born and dead during the five-year period preceding the survey, who had specific symptoms during the two- week period before death, including: diarrhea, vomiting, cough, difficult breathing, fever, rash, and convulsions, as reported by the mother, according to the age of the child at death.
The YDMCHS results presented in Table 12.9 suggest that fever, diarrhea, vomiting, cough, and breathing difficulties were the most common symptoms. During the posmeonatal period, the probable cause of child death was fever in41 percent of the cases and diarrbea in 39 percent. Vomiting and cough/difficult breathing followed in 36 and 28 percent ofthe cases, respectively. For children 12 months of age and older, fever was most common, reportedly causing 38 percent of all deaths in that age group. Vomiting and cough/difficult breathing were the second and third leading causes of child deaths after fever, while diarrhea was the fourth leading cause of child deaths.
As expected, the proportion of children reported to have diarrhea and respiratory infection symptoms is higher among children who died following the neonatal period. The results of the YDMCHS indicate that many child deaths may be preventable. Deaths associated with diarrheal illness can be prevented through the use of oral rehydration therapy tORT). Early detection and treatment of acute respiratory illness also would contribute to a reduction in infant and child mortality in Yemen.
Table 12.9 Causes of death in early childhood
Among children born and dead during the five years preceding the survey, the percentage reported to have died from specific symptoms or other causes, by age at death, Yemen 1991/92
Age of child at death
Symptom <1 1 -11 < 1 2 12 59 or cause month months months months Total
Diarrhea 10.9 38.7 24.8 27.9 25.4 Vomiting 10.2 35.9 23.1 29.8 24.4 Cough/difficult breathing 11.4 28.4 19.9 29.8 21.9
Fever 13.8 40.6 27.2 37.5 29.2 Rash 4.8 6.7 5.8 9.4 6.5 Convulsions 7.7 16.1 11.9 25.9 14.7 Other illnesses 2.7 4.3 3.5 8.7 4.5
Total 290 290 580 143 723
161