Embed Size (px)
DESCRIPTION
gg
Citation preview
1
Supply Chain Strategy
2
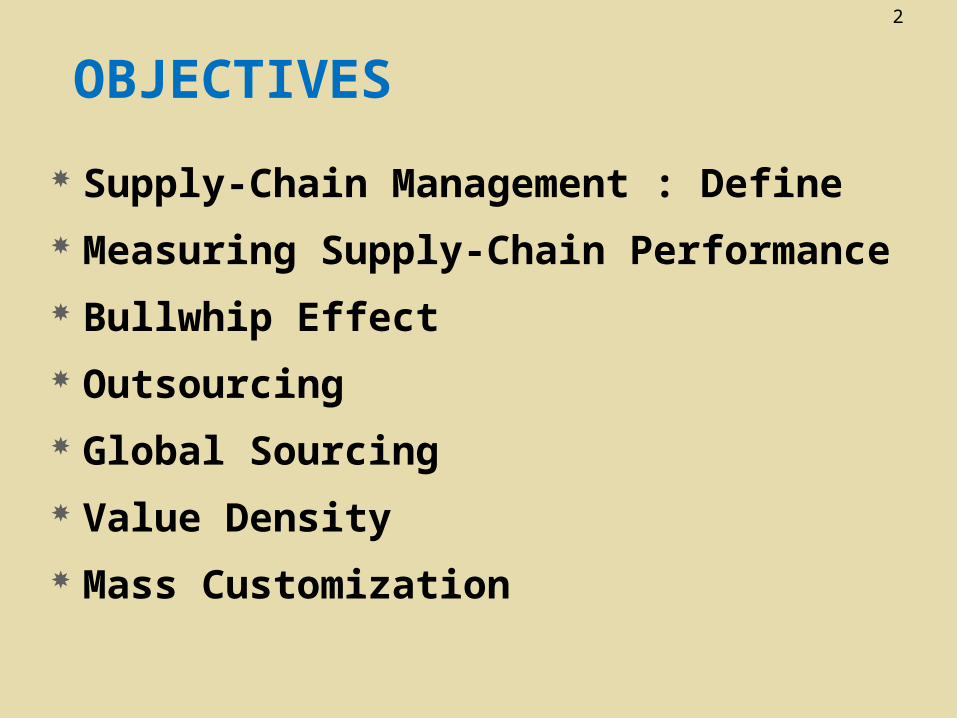
Supply-Chain Management : Define
Measuring Supply-Chain Performance
Bullwhip Effect
Outsourcing
Global Sourcing
Value Density
Mass Customization
OBJECTIVES
3
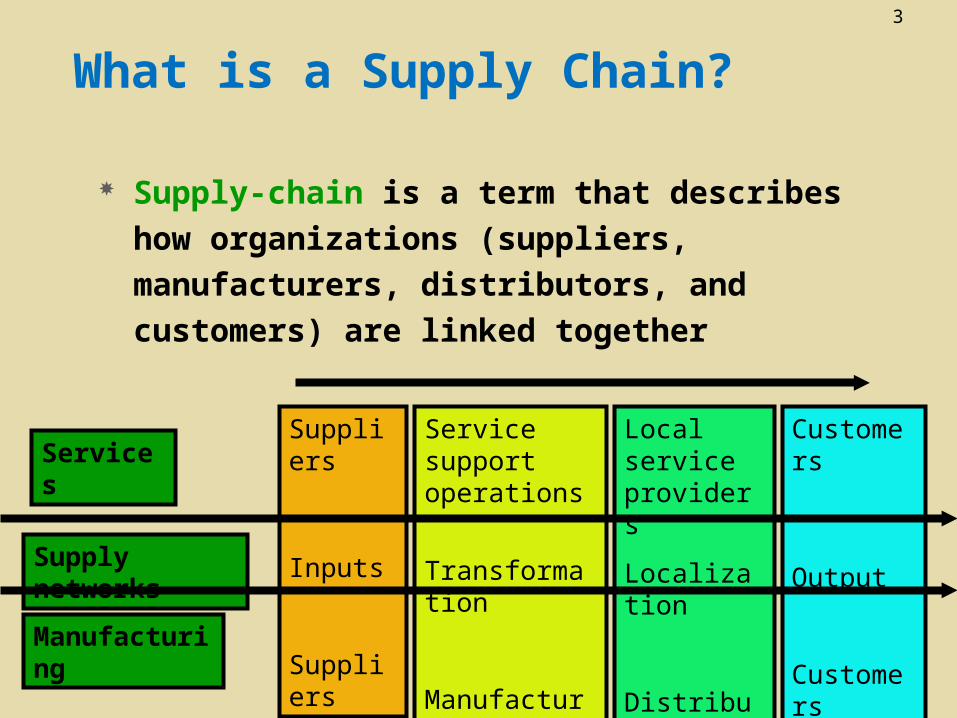
Supply-chain is a term that describes how
organizations (suppliers, manufacturers,
distributors, and customers) are linked together
What is a Supply Chain?
Suppliers
Inputs
Suppliers
Service support operations
Transformation
Manufacturing
Local service providers
Localization
Distribution
Customers
Output
Customers
Services
Supply networks
Manufacturing
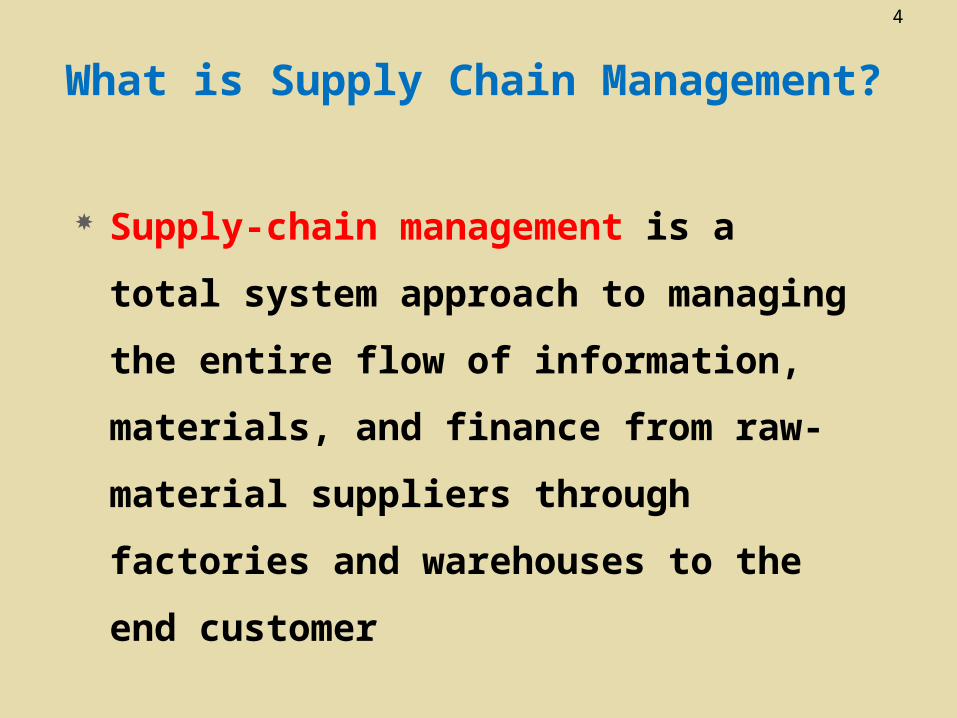
4What is Supply Chain Management?
Supply-chain management is a total
system approach to managing the entire
flow of information, materials, and finance
from raw-material suppliers through
factories and warehouses to the end
customer
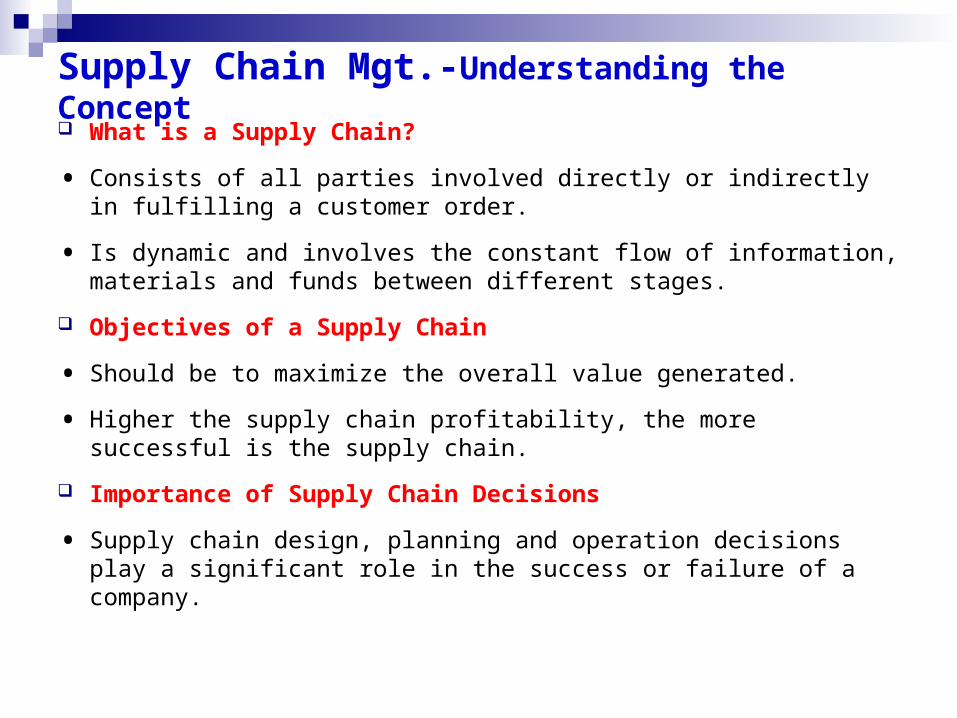
Supply Chain Mgt.-Understanding the Concept What is a Supply Chain?
• Consists of all parties involved directly or indirectly in fulfilling a customer order.
• Is dynamic and involves the constant flow of information, materials and funds between different stages.
Objectives of a Supply Chain
• Should be to maximize the overall value generated.
• Higher the supply chain profitability, the more successful is the supply chain.
Importance of Supply Chain Decisions
• Supply chain design, planning and operation decisions play a significant role in the success or failure of a company.
6
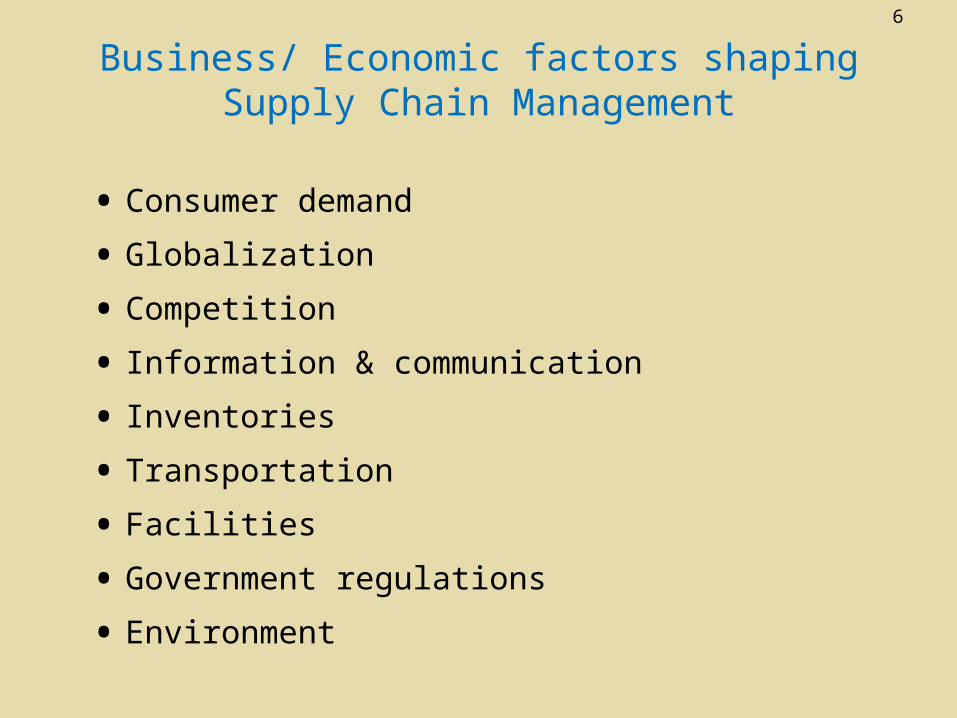
Business/ Economic factors shaping Supply Chain Management
• Consumer demand
• Globalization
• Competition
• Information & communication
• Inventories
• Transportation
• Facilities
• Government regulations
• Environment
7
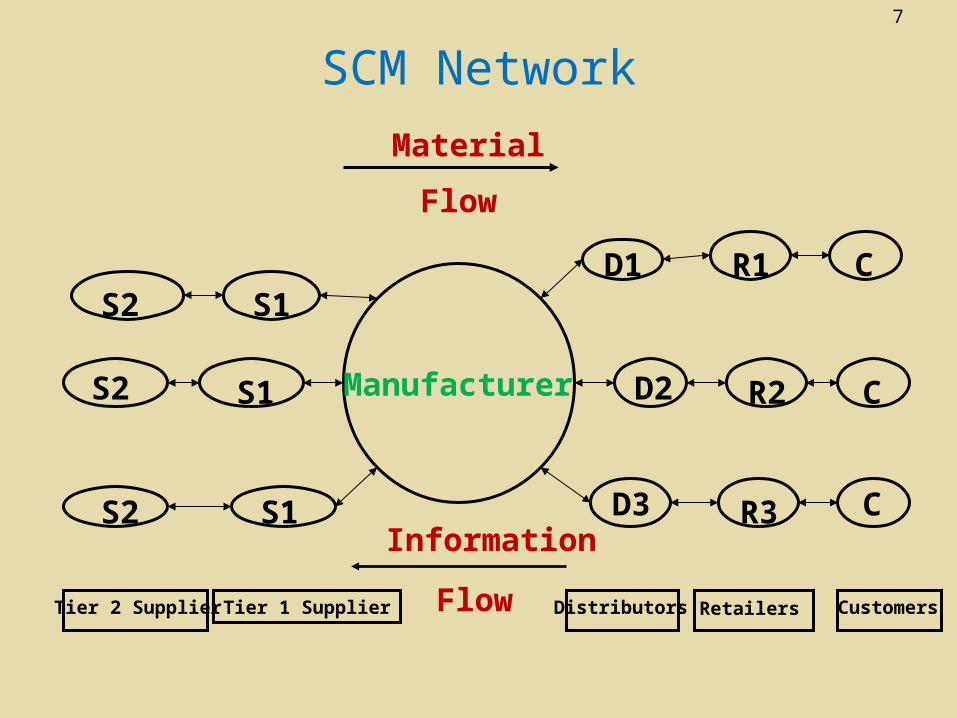
SCM Network
Manufacturer
S2 S1
S2 S1
S2 S1 D3
R1
R2
R3
C
C
C
Tier 2 Supplier Tier 1 Supplier Distributors Retailers Customers
Information
Flow
D2
D1
Material
Flow
8
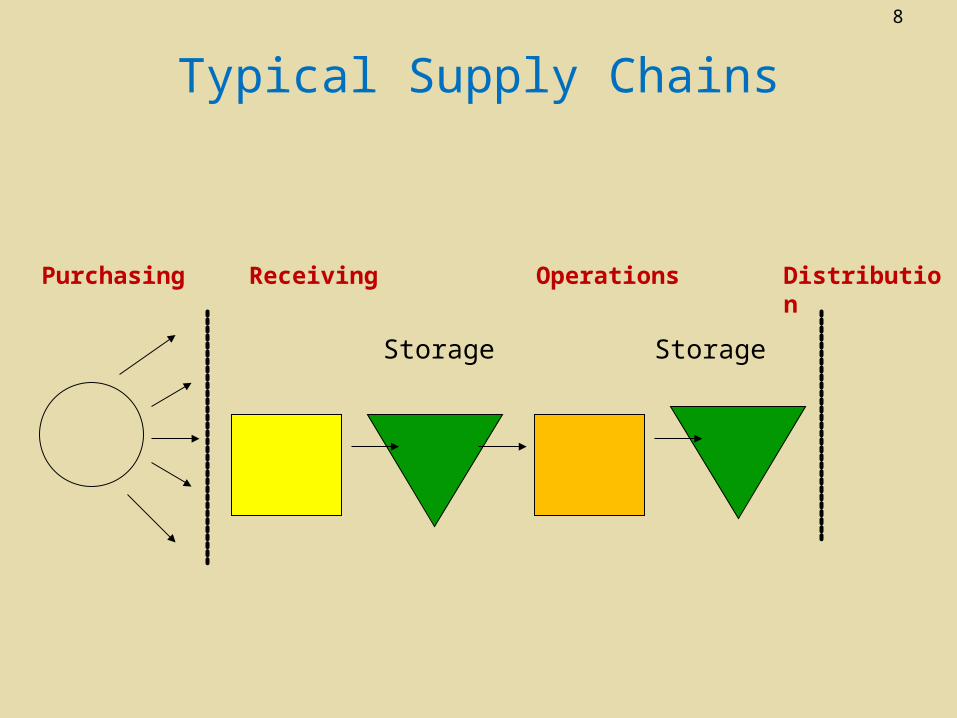
Typical Supply Chains
Receiving Operations Distribution
Storage Storage
Purchasing
9
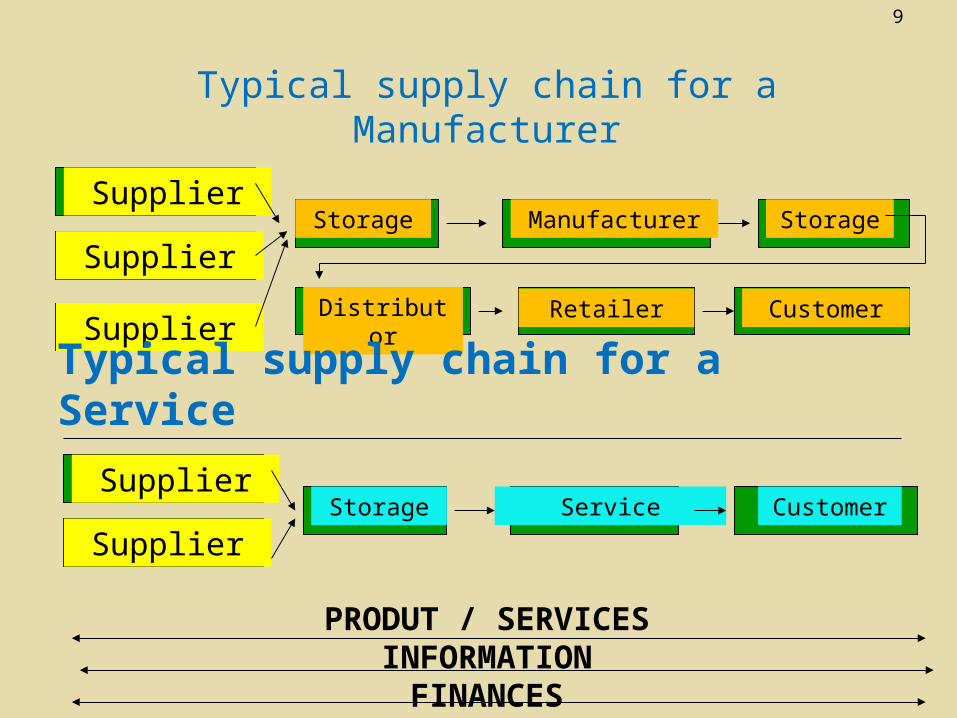
Typical supply chain for a Manufacturer
Supplier
Supplier
Supplier
Storage Manufacturer Storage
Distributor Retailer Customer
Typical supply chain for a Service
Supplier
SupplierStorage Service Customer
PRODUT / SERVICESINFORMATION
FINANCES
10
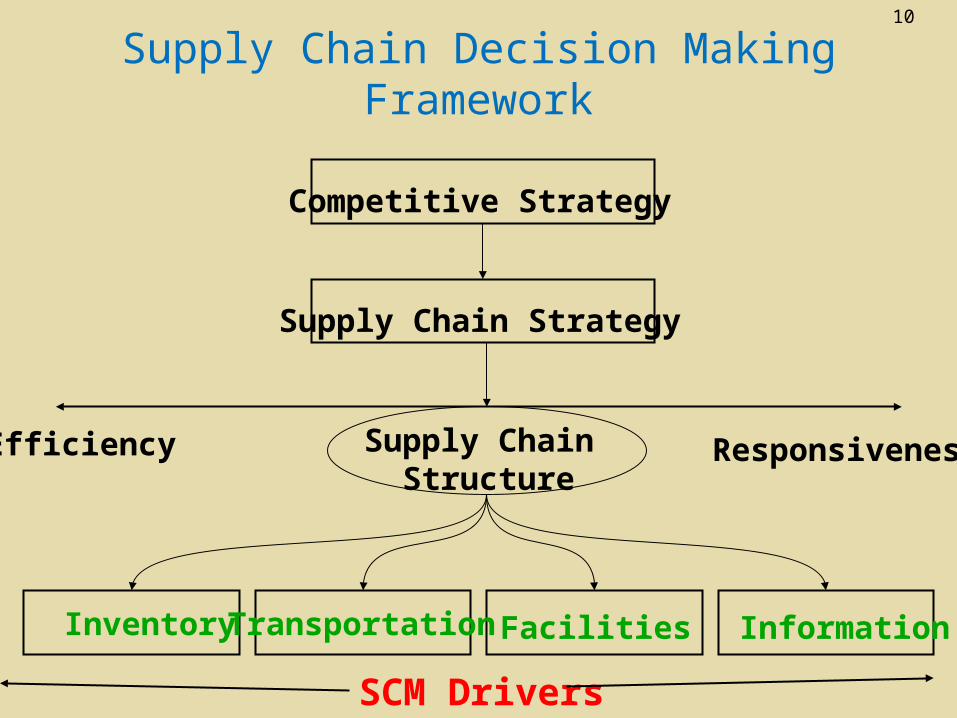
Supply Chain Decision Making Framework
Competitive Strategy
Supply Chain Strategy
Inventory Transportation Facilities Information
Supply Chain Structure
Efficiency Responsiveness
SCM Drivers
11
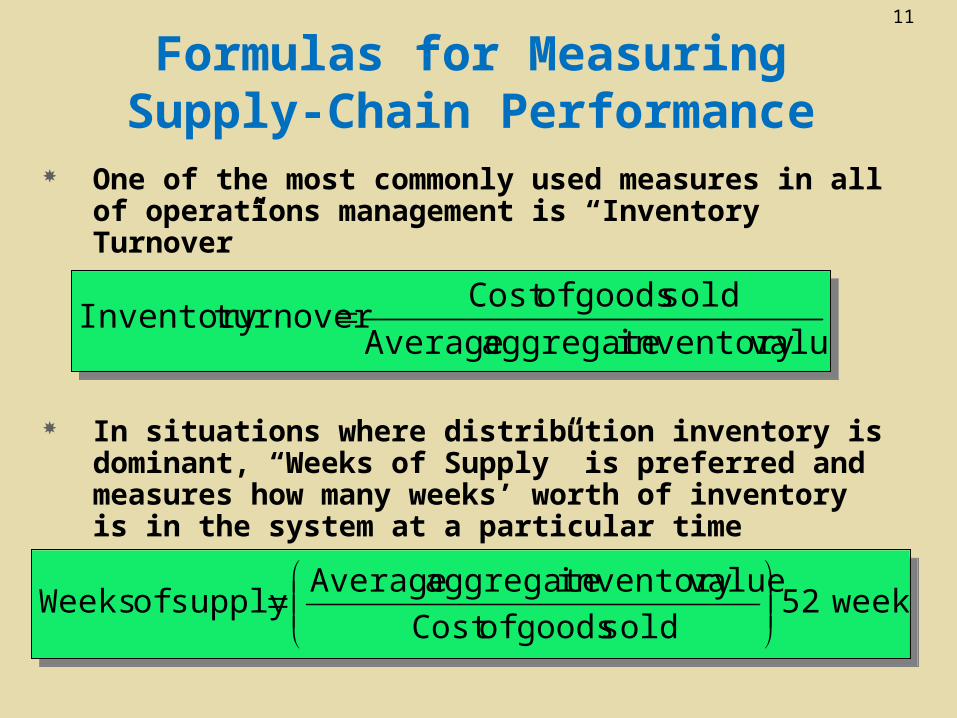
Formulas for Measuring Supply-Chain Performance
One of the most commonly used measures in all of operations management is “Inventory Turnover”
In situations where distribution inventory is dominant, “Weeks of Supply” is preferred and measures how many weeks’ worth of inventory is in the system at a particular time
valueinventory aggregate Average
sold goods ofCost turnoverInventory valueinventory aggregate Average
sold goods ofCost turnoverInventory
weeks52 sold goods ofCost
valueinventory aggregate Averagesupply of Weeks
weeks52
sold goods ofCost
valueinventory aggregate Averagesupply of Weeks
12
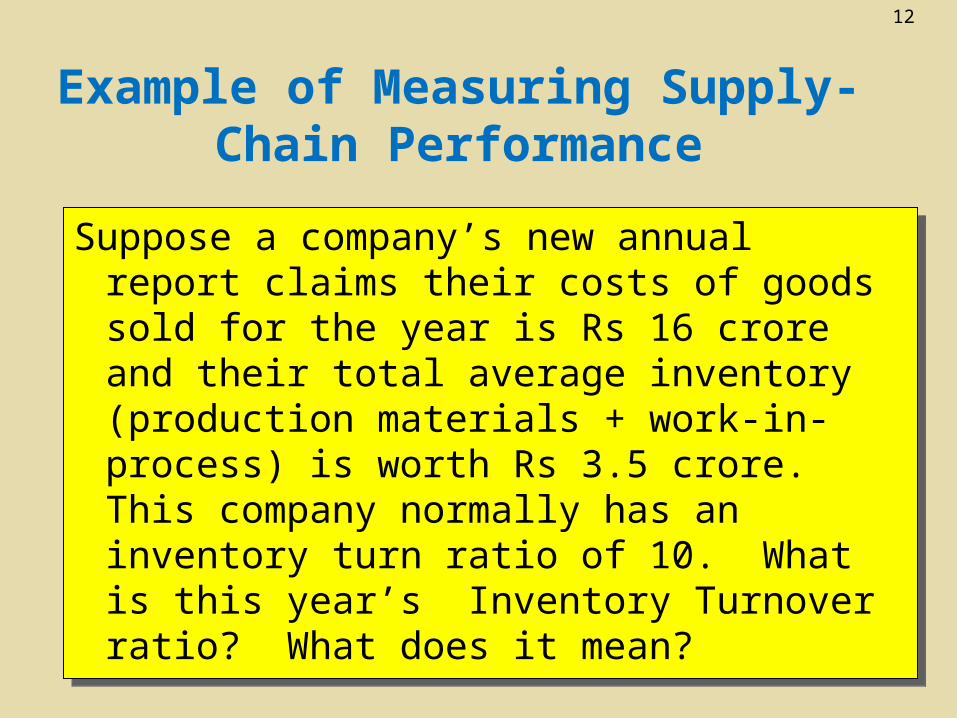
Example of Measuring Supply-Chain Performance
Suppose a company’s new annual report claims their costs of goods sold for the year is Rs 16 crore and their total average inventory (production materials + work-in-process) is worth Rs 3.5 crore. This company normally has an inventory turn ratio of 10. What is this year’s Inventory Turnover ratio? What does it mean?
Suppose a company’s new annual report claims their costs of goods sold for the year is Rs 16 crore and their total average inventory (production materials + work-in-process) is worth Rs 3.5 crore. This company normally has an inventory turn ratio of 10. What is this year’s Inventory Turnover ratio? What does it mean?
13
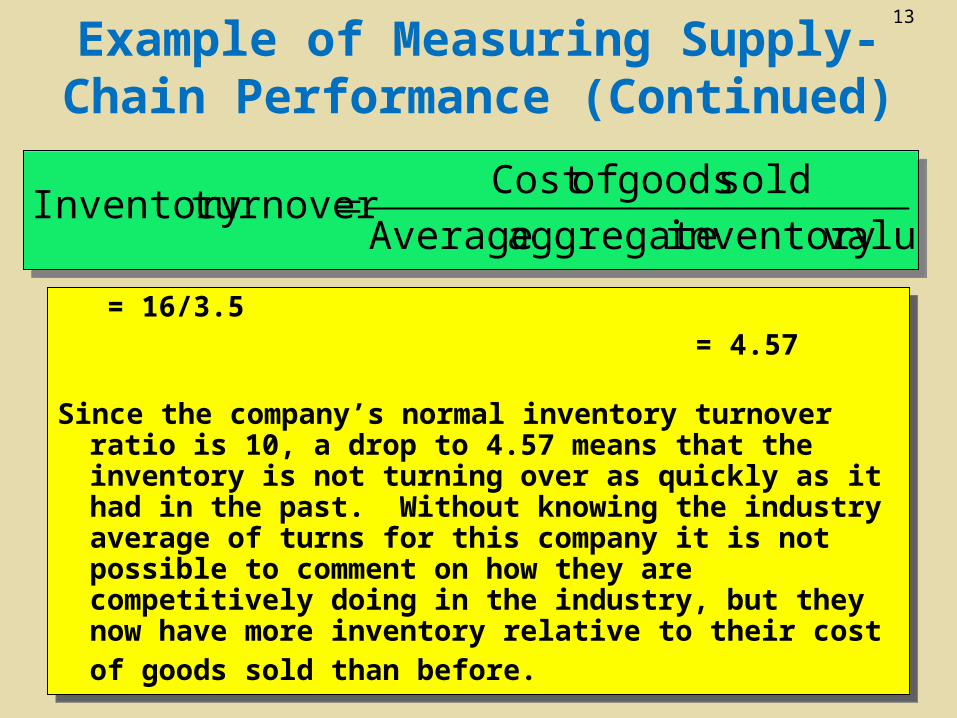
Example of Measuring Supply-Chain Performance (Continued)
= 16/3.5 = 4.57
Since the company’s normal inventory turnover ratio is 10, a drop to 4.57 means that the inventory is not turning over as quickly as it had in the past. Without knowing the industry average of turns for this company it is not possible to comment on how they are competitively doing in the industry, but they now have more inventory relative to their cost of goods sold than before.
valueinventory aggregate Average
sold goods ofCost turnoverInventory
valueinventory aggregate Average
sold goods ofCost turnoverInventory
14
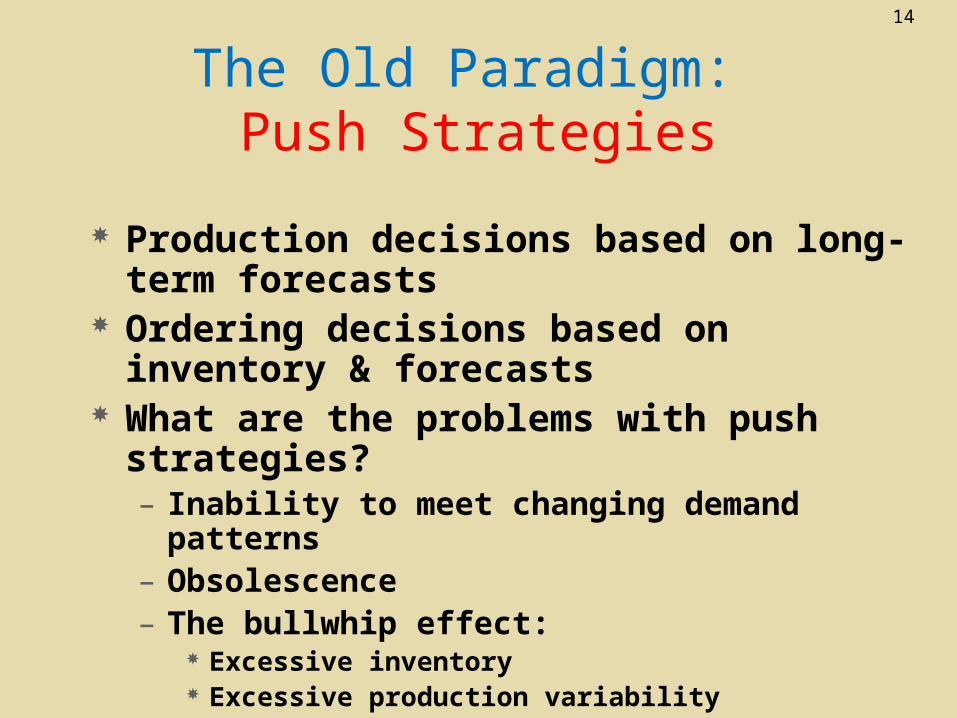
The Old Paradigm: Push Strategies
Production decisions based on long-term forecasts
Ordering decisions based on inventory & forecasts
What are the problems with push strategies?– Inability to meet changing demand patterns– Obsolescence– The bullwhip effect:
Excessive inventory Excessive production variability Poor service levels
15
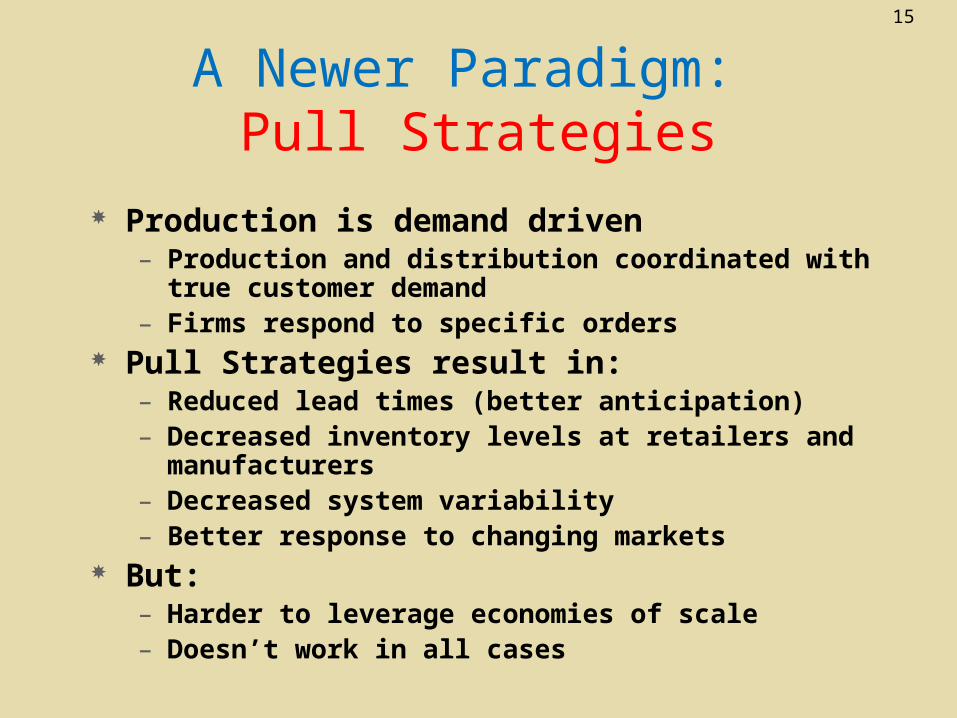
A Newer Paradigm: Pull Strategies
Production is demand driven– Production and distribution coordinated with true customer
demand– Firms respond to specific orders
Pull Strategies result in:– Reduced lead times (better anticipation)– Decreased inventory levels at retailers and manufacturers– Decreased system variability– Better response to changing markets
But: – Harder to leverage economies of scale– Doesn’t work in all cases
16
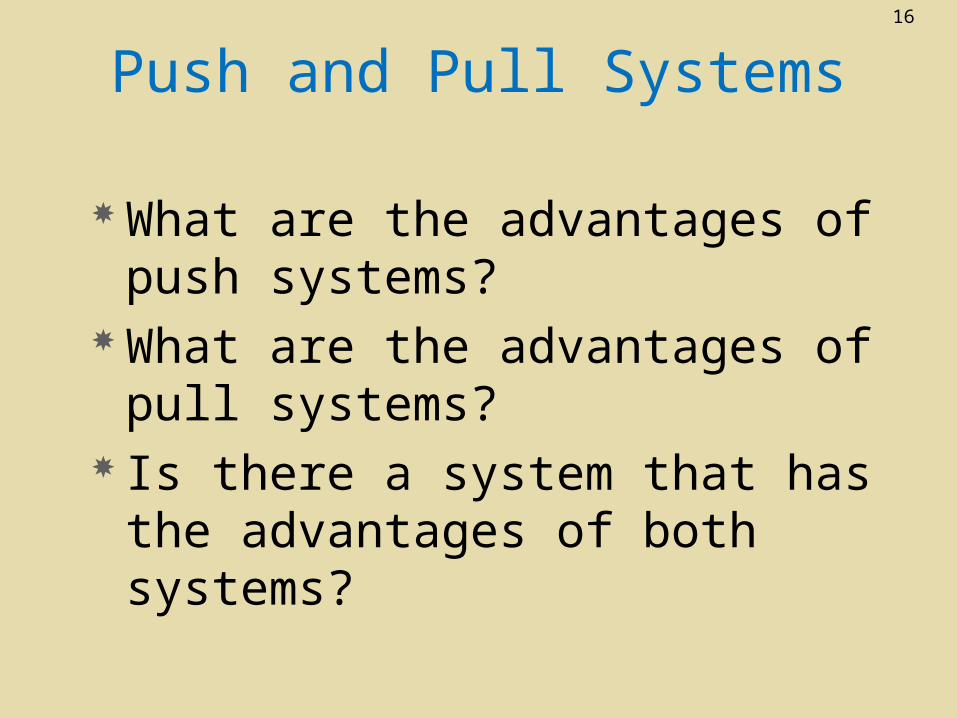
Push and Pull Systems
What are the advantages of push systems?
What are the advantages of pull systems?
Is there a system that has the advantages of both systems?
17
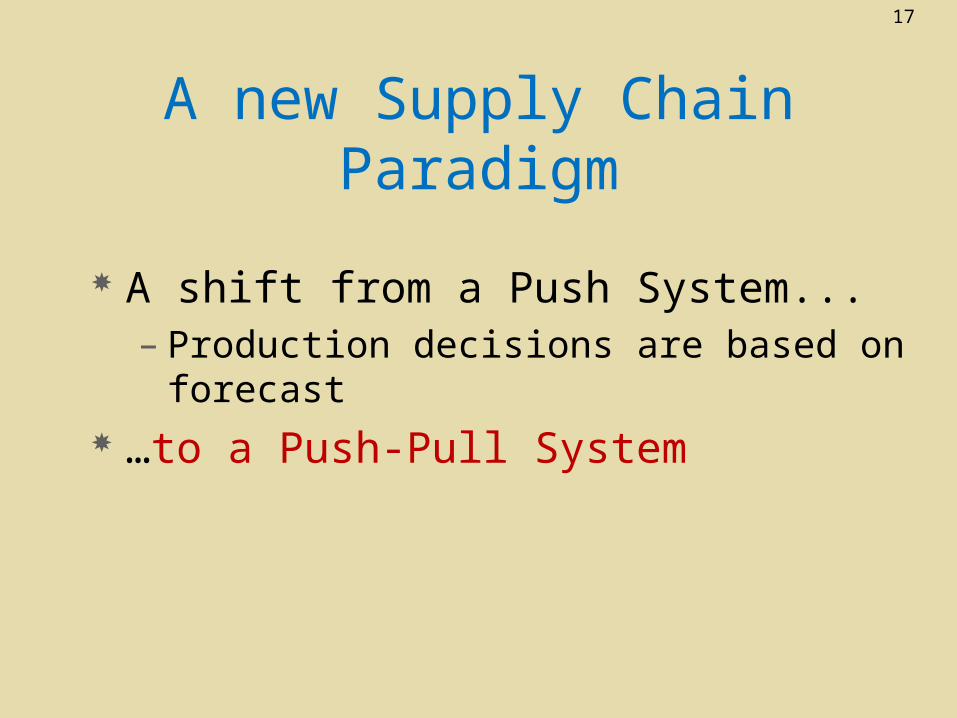
A new Supply Chain Paradigm
A shift from a Push System...– Production decisions are based on forecast
…to a Push-Pull System
18
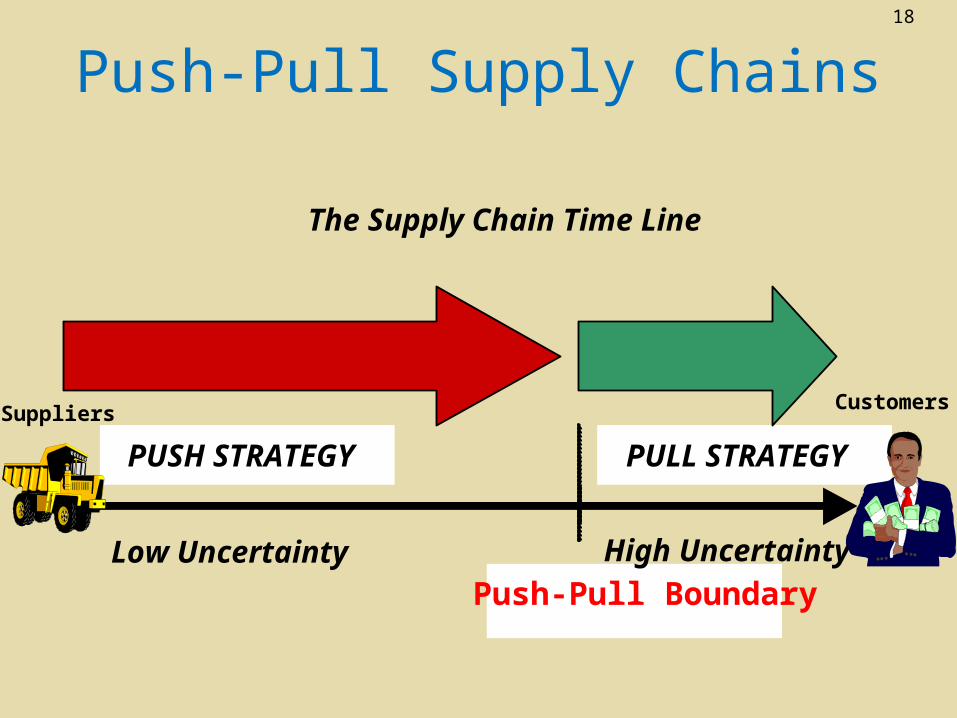
Push-Pull Supply Chains
Push-Pull Boundary
PUSH STRATEGY PULL STRATEGY
Low Uncertainty High Uncertainty
The Supply Chain Time Line
CustomersSuppliers
19
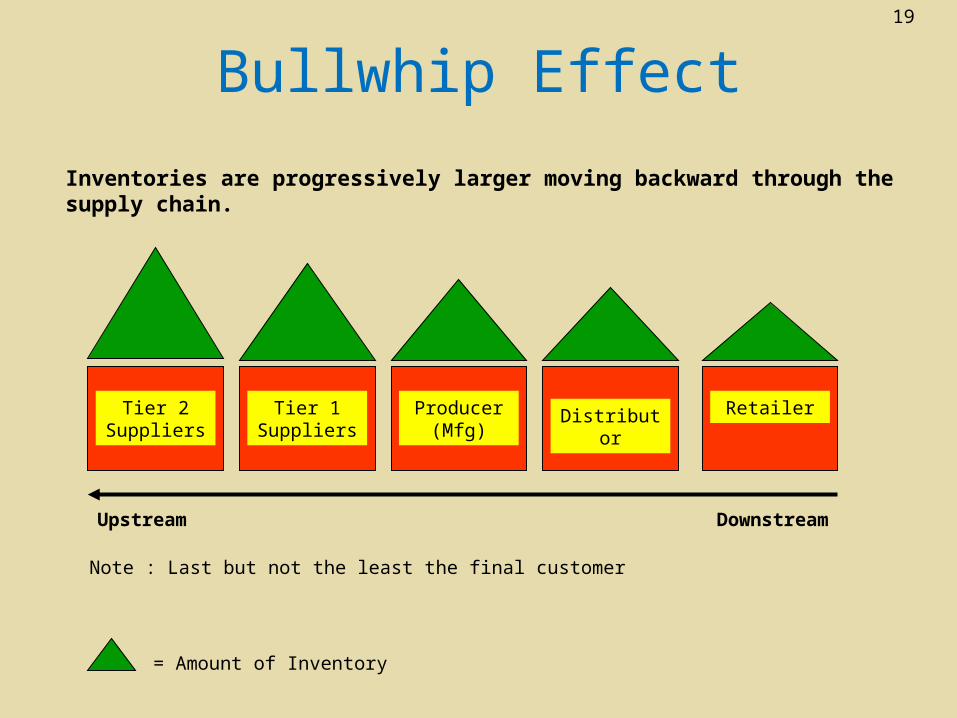
Bullwhip Effect
Inventories are progressively larger moving backward through the supply chain.
Tier 2Suppliers
Tier 2Suppliers
Tier 1Suppliers
Producer(Mfg)
Distributor Retailer
Upstream Downstream
Note : Last but not the least the final customer
= Amount of Inventory
20
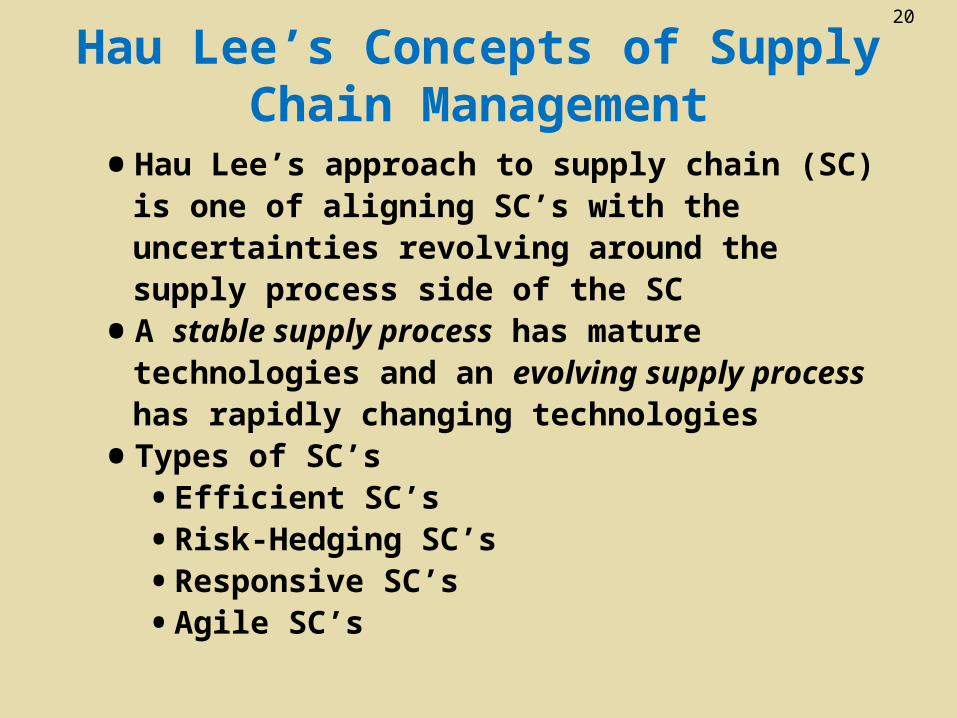
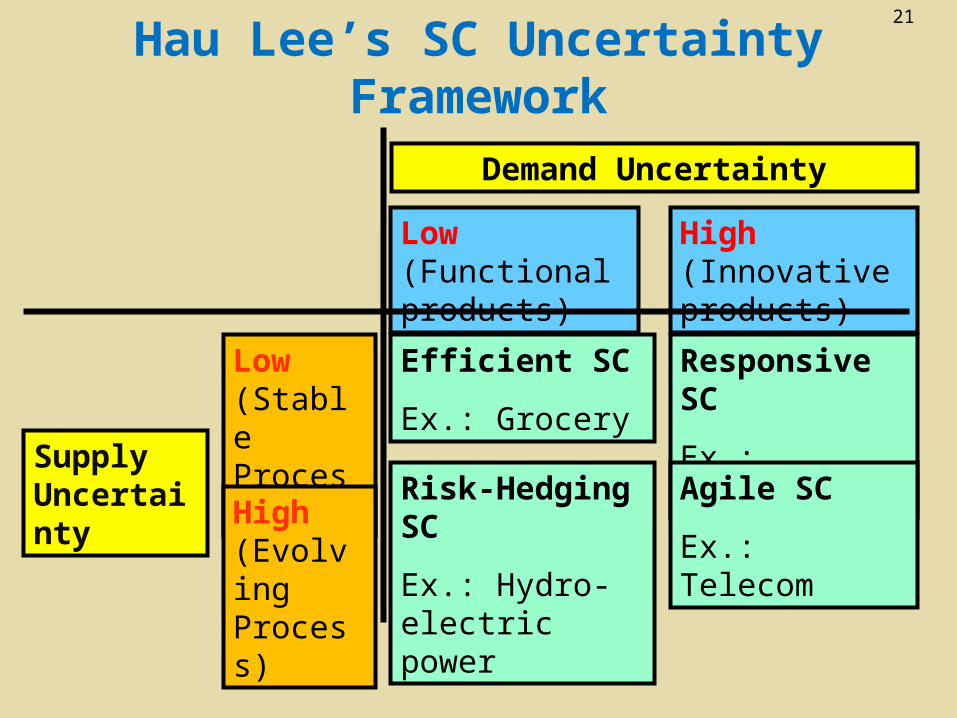
Hau Lee’s Concepts of Supply Chain Management
• Hau Lee’s approach to supply chain (SC) is one of aligning SC’s with the uncertainties revolving around the supply process side of the SC
• A stable supply process has mature technologies and an evolving supply process has rapidly changing technologies
• Types of SC’s
• Efficient SC’s
• Risk-Hedging SC’s
• Responsive SC’s
• Agile SC’s
21
Hau Lee’s SC Uncertainty Framework
Demand Uncertainty
Low (Functional products)
High (Innovative products)
Efficient SC
Ex.: Grocery
Responsive SC
Ex.: Computers
Risk-Hedging SC
Ex.: Hydro-electric power
Agile SC
Ex.: Telecom
Low(Stable Process)
High(Evolving Process)
SupplyUncertainty
22
What is Outsourcing?
Outsourcing is defined as the act of moving a firm’s internal activities and decision responsibility to outside providers
23
Reasons to Outsource
• Organizationally-driven
• Improvement-driven
• Financially-driven
• Revenue-driven
• Employee-driven
• Cost-driven
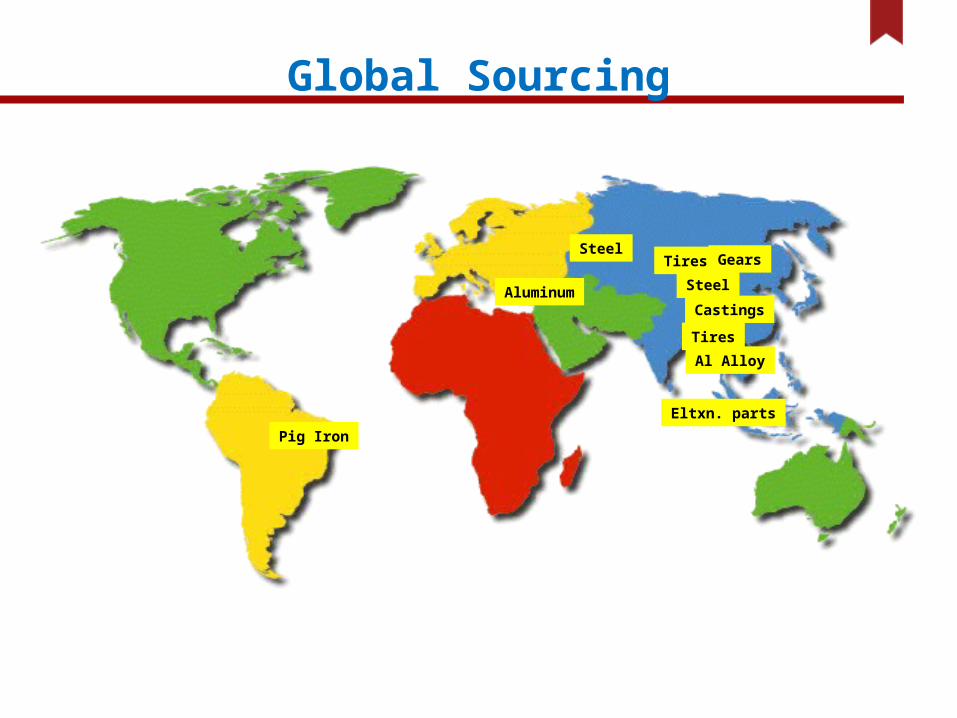
Global Sourcing
Aluminum
Tires
Steel
Tires
Castings
Pig Iron
Al Alloy
Eltxn. parts
SteelGears
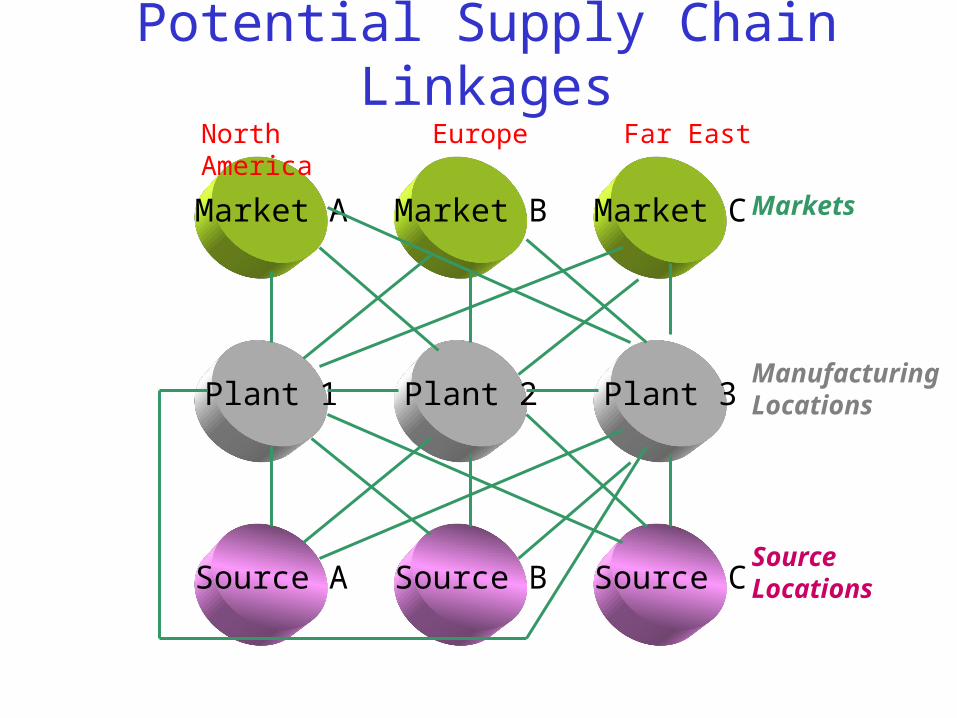
Potential Supply Chain Linkages
Plant 1
Market A
Source A Source B
Plant 2
Market B
Source C
Plant 3
Market C Markets
Manufacturing Locations
Source Locations
Far EastEuropeNorth America
Figure 16.3
26
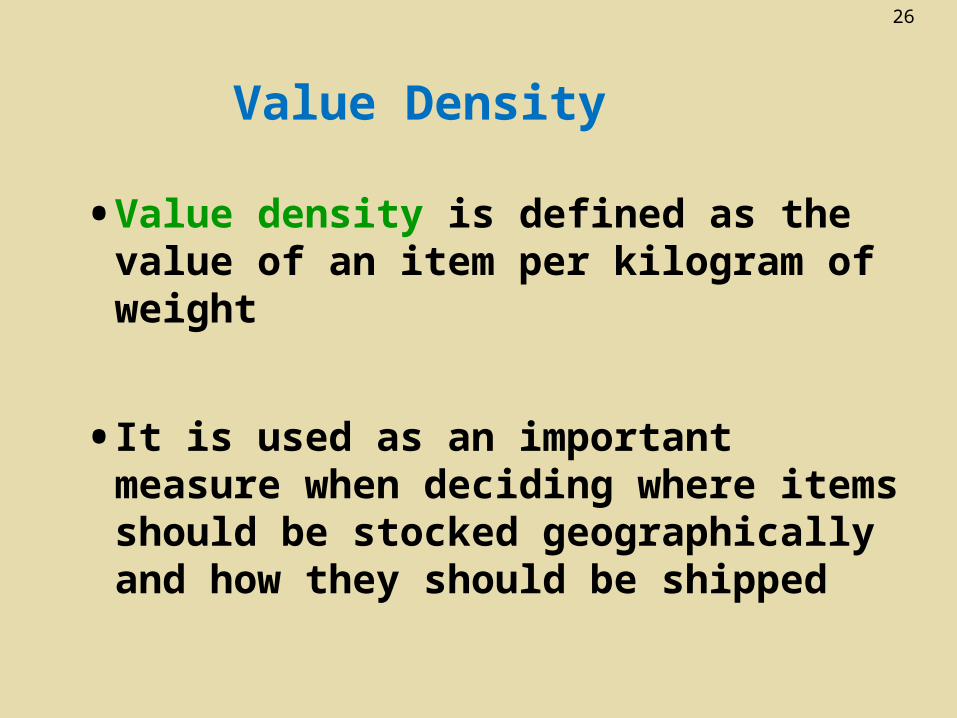
Value Density
• Value density is defined as the value of an item per kilogram of weight
• It is used as an important measure when deciding where items should be stocked geographically and how they should be shipped
27
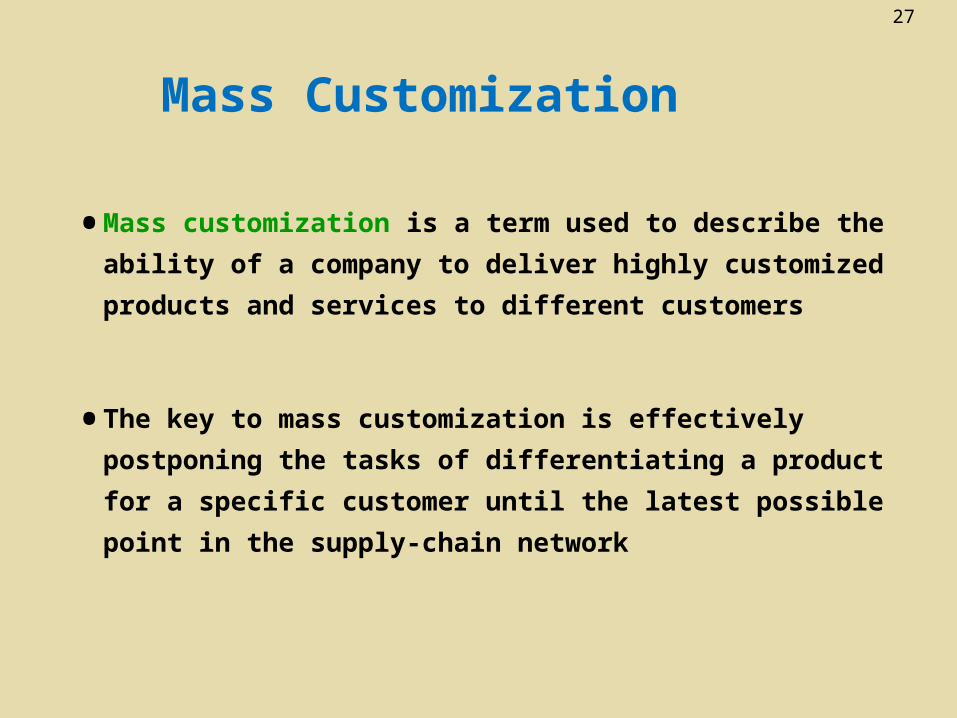
Mass Customization
• Mass customization is a term used to describe the
ability of a company to deliver highly customized
products and services to different customers
• The key to mass customization is effectively
postponing the tasks of differentiating a product for
a specific customer until the latest possible point in
the supply-chain network