Embed Size (px)
DESCRIPTION
Mahesh Dasar
Citation preview
CFD Simulation of Pickup Van
Mahesh H. Dasara, Deepak J. Patil
b, Raviraj M
c
a Assistant Professor, Annasaheb Dange College of Engineering & Technology, Ashta, Sangli, Maharastra, India,
b Project Lead, Zeus Numerix Pvt. Ltd. Pune, India,
c Assistant Professor, Fabtech College of Engineering & Research, Sangola, Pandarpur road, Maharastra,
ABSTRACT
Broadly, the objective of this study is to
carry out 3-Dimensional, incompressible,
steady-state CFD simulation of a simplified
pickup van with smooth underbody and without
side mirrors, by employing pressure based
commercial software CFDExpert-LiteTM
to
carry out Reynolds Averaged Navier-Stokes
(RANS) based computations to investigate the
aerodynamics of pickup van. k-ε turbulence
model with standard wall functions and
structured CFD domain is used in the
simulation to study the flow parameters in and
around the wake region and a detailed study of
the quantitative data set for validation of
numerical simulations has been conducted.
Simulations were carried out at moderate
Reynolds numbers (~3×10⁵) and the measured
quantities include: the pressure distributions on
the symmetry plane and the velocity profiles
near the wake.
The good comparisons obtained for
experimental and numerical data throughout
this study mean that CFD analysis could be
profitably used instead of wind tunnel test.
Keywords: CFD, CFDExpert-LiteTM
, 3
Dimensional, Turbulence model, wind tunnel.
1. INTRODUCTION
Pickup vans are one of the more popular vehicles
in use today yet it has received very little attention in car
aerodynamics literature. The aerodynamics of pickup vans
is more complex than any other open bed trucks, because
the short length of the bed can result in interaction of the
bed walls and tailgate with the separated shear layer
formed at the edge of the cab. The present study is to gain
a better understanding of the flow structure near the wake
region, since the theories on the aerodynamics are yet to
mature and wind tunnel experiments cost long periods and
great expenses, the numerical simulation based on
computational fluid dynamics (CFD) is a good approach
to adopt.
The complexity of the flow makes drag
prediction tools, including CFD based methods,
unreliable. The main goal of the present research is to gain
a better understanding of pickup truck aerodynamics
using detailed flow field measurements
Computational Fluid Dynamics (CFD) has
gained popularity as a tool for many airflow situations
including road vehicle aerodynamics. This trend, to bring
CFD to bear on vehicle aerodynamic design issues, is
appropriate and timely in view of the increasing
competitive and regulative pressures being faced by the
automotive industry. Three-dimensional transient
1995
International Journal of Engineering Research & Technology (IJERT)
Vol. 2 Issue 12, December - 2013
IJERT
IJERT
ISSN: 2278-0181
www.ijert.orgIJERTV2IS120775

aerodynamic flow model development occurs in an
environment influenced by numerical and turbulence
modeling uncertainties, among others. In order to assess
the accuracy of the aerodynamic CFD flow computations,
a comprehensive comparison between the CFD results
and measurements of the aerodynamic flow structures
over generic pickup truck geometry is undertaken.
Detailed flow field comparison includes surface pressures
and velocity fields in the near-wake region.
2. METHODOLOGY
Vehicle Geometry
The model represents a 1:12 scale of the full-scale
pickup truck. Schematics of the pickup truck model with
the pertinent dimensions are depicted in Figure 2.1. The
length of the model is 0.432 m, the width is 0.152 m, and
the height is 0.1488 m [1] [5]. The model was designed
with a smooth underbody, enclosed wheel-wells and
without openings for cooling airflow. An identical surface
model was generated for the CFD simulations. Once the
surfaces for the model are created, they are used to
generate a three-dimensional grid for the CFD
calculations.
Fifure 2.1 Pickup Van Dimensions
Figure 2.2 Pickup van geometry
Figure 2.3 Pickup van geometry.
Meshing:
In the computational domain, the vehicle is kept such
that the point lying on the ground in the plane of
symmetry is the origin. The length of the domain
upstream of the vehicle, up to the inlet boundary, is 5
times the length of the vehicle (0.432 m). Length of the
domain in the downstream direction, up to the outlet
boundary, 10 times the length of the vehicle. Height of the
domain measured from the topmost point of the vehicle is
5 times the length of the vehicle. In the lateral direction,
boundary of the domain is located 5 times the length of
the vehicle.
Figure 2.4 Flow Domain Side View
1996
International Journal of Engineering Research & Technology (IJERT)
Vol. 2 Issue 12, December - 2013
IJERT
IJERT
ISSN: 2278-0181
www.ijert.orgIJERTV2IS120775

Figure 2.5 Flow Domain Front View
Generation of multi-block structured grids for the
simulation requires the topology of the domain (i.e.
position and neighborhood of blocks around the vehicle as
shown in figure 2.6). Finer grids are required at the areas
of importance, which include regions close to the surface
of the vehicle and the region behind the cab and the
tailgate. A topology of 270 surface blocks covered the
entire vehicle. A total of 2158530 cells were put on the
surface of the vehicle. A topology with 270 three-
dimensional blocks commensurate with 98 surface blocks
was arrived at for the current problem. The grids were
then smoothened using the Laplace smoothener.
Exponential clustering function was used to put 2nd
grid
points close to the wall within 0.011 mm (Table: 2.1). The
clustered grids in one of such block are shown in Figure:
09. The total number of mesh points used in this study
was about 2.1 Million.
Figure 2.6 Neighborhood of blocks around the vehicle
Table 2.1 Computational meshes Considered for the Pickup van simulation.
Test Case Number of
Cells
Total Grid
Points
Avg. First
Cell
Distance
Pickup
Van_18 2158530 2221690 0.011
Pickup
Van_25 2158530 2221690 0.011
Pickup
Van_30 2158530 2221690 0.011
Figure 2.7 Clustered mesh on bonnet of the pickup van
Figure 2.8 Clustered mesh on tailgate of the pickup van
Solver:
In the present study all the computations for the
computational domain have been carried out using a three
dimensional RANS model with an industry standard finite
volume based CFD code, CFDExpert-Lite. The set of
equations solved by CFDExpert-Lite are the unsteady
1997
International Journal of Engineering Research & Technology (IJERT)
Vol. 2 Issue 12, December - 2013
IJERT
IJERT
ISSN: 2278-0181
www.ijert.orgIJERTV2IS120775

Navier Stokes equation in their conservation form for
turbulent flows, the instantaneous equations are averaged
leading to additional terms. Assuming the flow to be
steady, incompressible and turbulent the governing
equations are solved based on finite volume approach
Governing equations
General governing equations for incompressible flows are
as follows:
Continuity
Momentum
(7.4)
Turbulence Modeling
The standard k model is used for the simulations.
Since the boundary condition for k is not well
defined near the wall, one uses the law of the wall as the
relation between velocity and surface shear stress.
Evaluation of shear stress depends on whether the near
wall cell lies in the viscous sub layer or in the fully
turbulent region as decided by non-dimensional distance
y+
.
Boundary and Initial Conditions
The inlet boundary was based on constant total pressure
and enthalpy. Static pressure at the inlet is 101300 Pa and
the inlet Mach No is 0.1, these quantities are used to
calculate the total pressure. Similarly density of air was
set to 1.225 kg/m3 for calculation of inlet enthalpy. The
outlet static pressure is held constant at 101300 Pa.
All the grid points in the domain are given a uniform
value of 18, 25, & 30.0 m/s (Three test cases) as initial
velocity values in the x direction, whereas y-velocity and
z-velocity components are kept zero initially. Solution
moves towards steady-state from the specified initial
conditions by marching in pseudo time.
Figure 2.9 Boundary conditions: Inlet & Outlet
Figure 2.10 Boundary conditions: Inviscid walls
Figure 2.11 Boundary conditions: Viscous Floor & Viscous Body
Table 2.2 Boundary Conditions
FACES BOUNDARY CONDITIONS
Front Face Inflow
Inviscid Walls
Viscous Body & Floor
Inflow & Outflow
1998
International Journal of Engineering Research & Technology (IJERT)
Vol. 2 Issue 12, December - 2013
IJERT
IJERT
ISSN: 2278-0181
www.ijert.orgIJERTV2IS120775

Rear Face Inflow
Right Face Inviscid Wall
Left Face Inviscid Wall
Top Face Inviscid Wall
Floor Viscous Wall
Vehicle Body Viscous Wall
Solver Setup
Fluid Properties:
1. Density = 1.225 kg/m³
2. Dynamic Viscosity = 1.7894*10⁻⁵
3. Pressure Velocity Coupling – SIMPLE {Semi-
Implicit Method for Pressure-Linked
Equations}
Reconstructing:
4. Upwind Scheme = UDS
5. Scheme Order = SECOND
6. Turbulence Model: k-ɛ High Reynolds number
with Std. wall function
Initial conditions:
7. Initial Pressure = 0.0
8. Initial Velocity X = 30, 25, 18 Y=0 Z=0
9. Initial Turbulence Intensity = 2.0
10. Initial Eddy Viscosity Ratio =10.0
3. RESULTS AND DISCUSSION
Mean pressure measurements
The mean pressure coefficient measured along
the symmetry plane of the model is shown in Figures at
Reynolds numbers 1.74 × 10⁵, 2.36 × 10⁵ and 2.88 × 10⁵,
respectively, which correspond to wind tunnel speeds of
18, 25 and 30 m/s, respectively, and the results are
validated with the experimental results.
Figure 3.1 (a) Mean pressure coefficient distribution measured on the
symmetry plane of the pickup At 18 m/s
Figure 3.1 (b): Pressure distributions measured on the symmetry plane of
the back surface of the cabin at 18 m/s
Figure 3.1 (c): Pressure coefficient distribution measured on the
symmetry plane of the inside and outside surfaces of the tailgate of the pickup truck at 18 m/s
Figure 3.2 (a) Mean pressure coefficient distribution measured on the
symmetry plane of the pickup At 25 m/s
Hood
Underbody
Inside Tailgate Outside Tailgate
Bed
13
09
Bed
Inside Tailgate
Hood
Underbody
Bed 13
09
1999
International Journal of Engineering Research & Technology (IJERT)
Vol. 2 Issue 12, December - 2013
IJERT
IJERT
ISSN: 2278-0181
www.ijert.orgIJERTV2IS120775

Figure 3.2 (b): Pressure distributions measured on the symmetry plane of
the back surface of the cabin at 25 m/s
Figure 3.2 (c): Pressure coefficient distribution measured on the
symmetry plane of the inside and outside surfaces of the tailgate of the pickup truck at 25 m/s
Figure 3.3 (a) Mean pressure coefficient distribution measured on the
symmetry plane of the pickup At 30 m/s
Figure 3.3 (b): Pressure distributions measured on the symmetry plane of
the back surface of the cabin at 30 m/s
Figure 3.3 (c): Pressure coefficient distribution measured on the symmetry plane of the inside and outside surfaces of the tailgate of the
pickup truck at 30 m/s
The mean pressure distribution on the engine
hood and passenger cabin is marked “Cab.” It shows the
expected features. At the front bumper there is a
stagnation point, Cp = 1. The flow accelerates to a local
maximum velocity around the front of the engine
compartment where the local pressure coefficient is ~ -
0.4. On the hood the flow speed decreases and the
pressure increases to a local maximum of the pressure
coefficient, Cp = 0.5, at the lower corner of the
windshield (point 9 in Figure 3.1(a), 3.2(a), 3.3(a)). On
the windshield the flow speed increases and the pressure
coefficient decrease to a minimum value of -0.9 at the top
of the windshield (point 13 in Figure 3.1(a), 3.2(a),
3.3(a)).
On the top of the cabin, the flow speed decreases
and the pressure coefficient increases to -0.2. The pressure
distribution on the bottom of the pickup truck is marked
“Underbody” in Figure 3.1(a), 3.2(a), 3.3(a). The pressure
coefficient varies slightly with local minima (Cp ~ -0.2) at
x ~ 100 mm and x ~ 350 mm, which correspond to the
locations of the wheels. The local decrease of the pressure
on the bottom surface at the location of the wheels is
attributed to the local acceleration of the underbody flow
due to the reduced flow cross section area at the wheels.
The pressure coefficient in the pickup truck bed is marked
“Bed” in Figure 3.1(a), 3.2(a), 3.3(a). The pressure
coefficient is approximately -0.3 and increases to ~-0.2
towards the tailgate. The pressure coefficient in the bed
shows a weak but significant Reynolds number
dependence. At the lowest Reynolds number tested the
Hood Bed
Underbod
y
Inside Tailgate
Inside Tailgate
Outside Tailgate
Outside Tailgate
13
Inside Tailgate
09
2000
International Journal of Engineering Research & Technology (IJERT)
Vol. 2 Issue 12, December - 2013
IJERT
IJERT
ISSN: 2278-0181
www.ijert.orgIJERTV2IS120775

pressure coefficient is lower by ~0.05 compared to the
results at higher Reynolds numbers.
The pressure coefficients measured on the back
surface of the cab are shown in Figure 3.1(b), 3.2(b),
3.3(b). At high Reynolds number the pressure coefficient
has a minimum value (Cp ~ -0.35) at approximately the
center of the base (z ~ 50 mm). The pressure coefficient
increases towards the top of the cab and towards the bed
surface. There is a significant decrease of the pressure
coefficient (~- 0.05) at the lowest Reynolds number in the
lower two thirds of the cab base (0 < z < 70 mm). This
trend is reversed near the top of the cab base were the
pressure coefficient increases to -0.14 at the lowest
Reynolds number compared to Cp values of -0.30 and -
0.32 at the intermediate and high Reynolds numbers,
respectively.
The pressure coefficient distribution on the
symmetry plane of the tailgate is shown in Figure 3.1(c),
3.2(c), 3.3(c). The results on the outside and inside
surfaces of the tailgate are shown in the figure as marked.
The pressure coefficient outside the bed shows good
collapse of the data at the three Reynolds numbers tested.
The minimum pressure coefficient of -0.17 is found at z ~
25 mm and increases slightly to –0.12 at the top and the
bottom edges of the tailgate. In contrast the pressure
coefficient distribution on the inside surface of the tailgate
shows slightly lower values (~ -0.025) at the lower
Reynolds number.
In addition there is rapid decrease of the pressure
coefficient at the edge of the tailgate, indicating a rapid
acceleration of the flow in this region. Finally note that
the mean pressure on the inside surface of the tailgate
is lower than on the outside surface suggesting that the
force acting on the tailgate is in the forward direction,
reducing aerodynamic drag.
Velocity Measurements
Bed Flow
Figure 3.4(a) & Figure 3.4 (b) shows the mean
velocity profiles in the symmetry plane of the flow over
the bed for the three Reynolds number considered in this
investigation. The plots shows the results of two separate
tests one for the flow outside the bed and the other for the
flow inside the bed. The data at different Reynolds
numbers collapse on a single curve indicating that
Reynolds number effects are very small at the present
flow conditions.
Figure 3.4 (a) Mean velocity profiles of the flow in the symmetry plane
of the wake over the bed: streamwise velocity at 30 m/s
2001
International Journal of Engineering Research & Technology (IJERT)
Vol. 2 Issue 12, December - 2013
IJERT
IJERT
ISSN: 2278-0181
www.ijert.orgIJERTV2IS120775
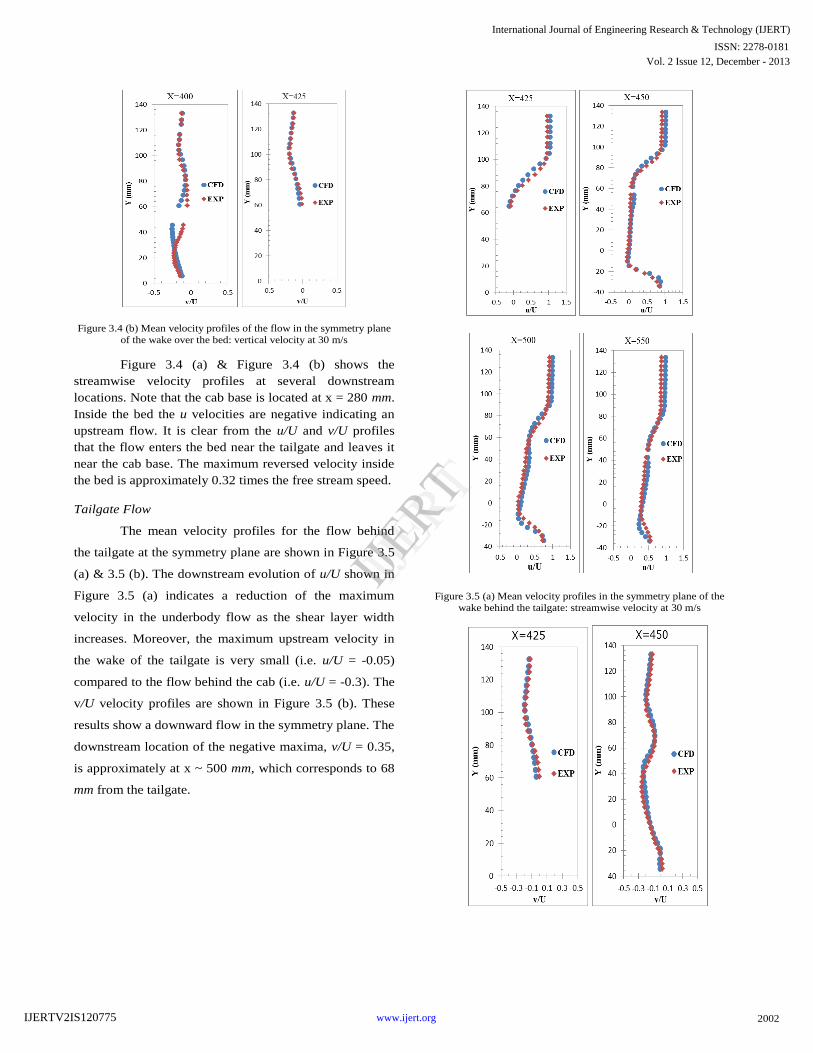
Figure 3.4 (b) Mean velocity profiles of the flow in the symmetry plane
of the wake over the bed: vertical velocity at 30 m/s
Figure 3.4 (a) & Figure 3.4 (b) shows the
streamwise velocity profiles at several downstream
locations. Note that the cab base is located at x = 280 mm.
Inside the bed the u velocities are negative indicating an
upstream flow. It is clear from the u/U and v/U profiles
that the flow enters the bed near the tailgate and leaves it
near the cab base. The maximum reversed velocity inside
the bed is approximately 0.32 times the free stream speed.
Tailgate Flow
The mean velocity profiles for the flow behind
the tailgate at the symmetry plane are shown in Figure 3.5
(a) & 3.5 (b). The downstream evolution of u/U shown in
Figure 3.5 (a) indicates a reduction of the maximum
velocity in the underbody flow as the shear layer width
increases. Moreover, the maximum upstream velocity in
the wake of the tailgate is very small (i.e. u/U = -0.05)
compared to the flow behind the cab (i.e. u/U = -0.3). The
v/U velocity profiles are shown in Figure 3.5 (b). These
results show a downward flow in the symmetry plane. The
downstream location of the negative maxima, v/U = 0.35,
is approximately at x ~ 500 mm, which corresponds to 68
mm from the tailgate.
Figure 3.5 (a) Mean velocity profiles in the symmetry plane of the
wake behind the tailgate: streamwise velocity at 30 m/s
2002
International Journal of Engineering Research & Technology (IJERT)
Vol. 2 Issue 12, December - 2013
IJERT
IJERT
ISSN: 2278-0181
www.ijert.orgIJERTV2IS120775

Figure 3.5 (b) Mean velocity profiles in the symmetry plane of the
wake behind the tailgate: vertical velocity at 30 m/s
Figure 3.6 (a) Mean velocity profiles of the flow in the z = 15 mm plane
of the wake behind the tailgate: streamwise velocity component at 30 m/s
Figure 3.6 (b) Mean velocity profiles of the flow in the z = 15 mm plane of the wake behind the tailgate: lateral velocity component at 30 m/s
Mean velocity profiles in horizontal plane z = 15
mm behind the tailgate are shown in Figure 3.6 (a) & 3.6
(b). The downstream evolution of u/U in Figure 3.6 (a)
shows the evolution of shear layers at the side edges of
the tailgate and a region of high velocity at the symmetry
plane. The velocity in the symmetry plane increases very
rapidly with downstream distance reaching a value of 0.74
at x = 700 mm (not shown in the plot). Reversed flow
regions are found at x = 500 mm on both sides of the
2003
International Journal of Engineering Research & Technology (IJERT)
Vol. 2 Issue 12, December - 2013
IJERT
IJERT
ISSN: 2278-0181
www.ijert.orgIJERTV2IS120775
symmetry plane. Profiles of the normalized mean lateral
velocity, w/U, are shown in Figure 3.6 (b).
The magnitude increases with downstream
distance reaching a maximum value of approximately
±0.15 at x = 600 mm and decreasing farther downstream.
The results shown for pressure measurements
and velocity measurements are closely matching the
experimental results [1] [5] and hence we can conclude
that CFD can be adopted as the alternative for the
experimentations which are most expensive in all the
ways.
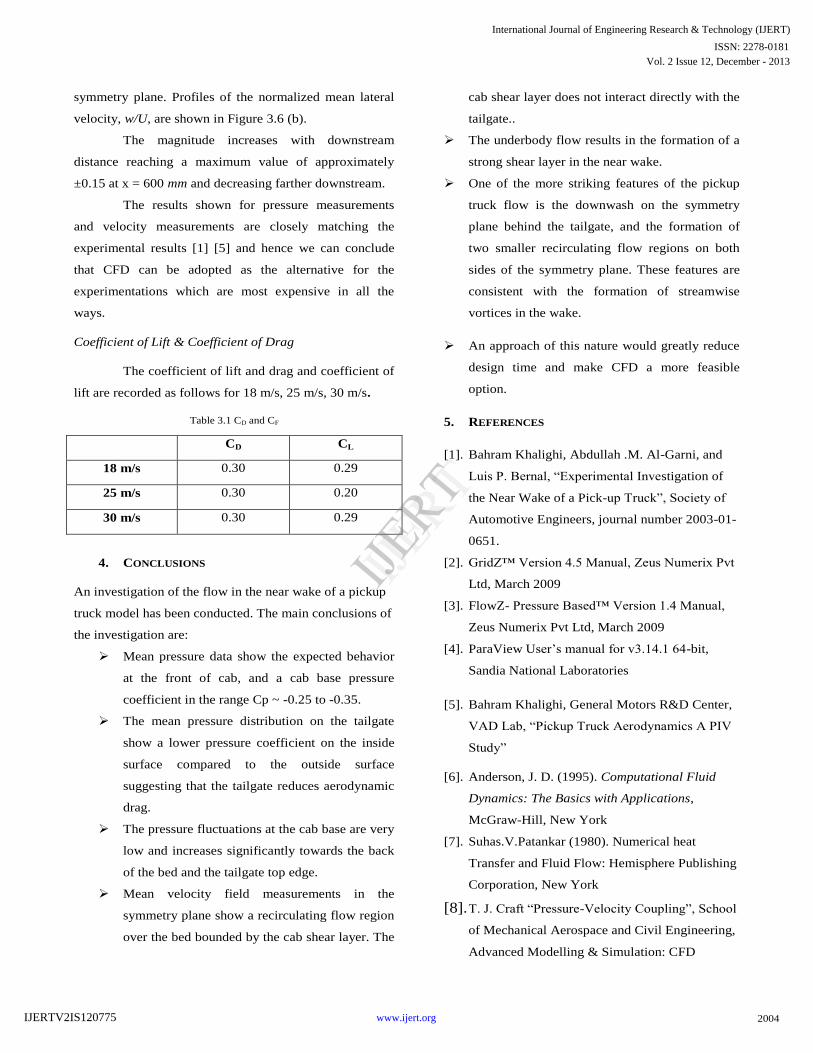
Coefficient of Lift & Coefficient of Drag
The coefficient of lift and drag and coefficient of
lift are recorded as follows for 18 m/s, 25 m/s, 30 m/s.
Table 3.1 CD and CF
CD CL
18 m/s 0.30 0.29
25 m/s 0.30 0.20
30 m/s 0.30 0.29
4. CONCLUSIONS
An investigation of the flow in the near wake of a pickup
truck model has been conducted. The main conclusions of
the investigation are:
Mean pressure data show the expected behavior
at the front of cab, and a cab base pressure
coefficient in the range Cp ~ -0.25 to -0.35.
The mean pressure distribution on the tailgate
show a lower pressure coefficient on the inside
surface compared to the outside surface
suggesting that the tailgate reduces aerodynamic
drag.
The pressure fluctuations at the cab base are very
low and increases significantly towards the back
of the bed and the tailgate top edge.
Mean velocity field measurements in the
symmetry plane show a recirculating flow region
over the bed bounded by the cab shear layer. The
cab shear layer does not interact directly with the
tailgate..
The underbody flow results in the formation of a
strong shear layer in the near wake.
One of the more striking features of the pickup
truck flow is the downwash on the symmetry
plane behind the tailgate, and the formation of
two smaller recirculating flow regions on both
sides of the symmetry plane. These features are
consistent with the formation of streamwise
vortices in the wake.
An approach of this nature would greatly reduce
design time and make CFD a more feasible
option.
5. REFERENCES
[1]. Bahram Khalighi, Abdullah .M. Al-Garni, and
Luis P. Bernal, “Experimental Investigation of
the Near Wake of a Pick-up Truck”, Society of
Automotive Engineers, journal number 2003-01-
0651.
[2]. GridZ™ Version 4.5 Manual, Zeus Numerix Pvt
Ltd, March 2009
[3]. FlowZ- Pressure Based™ Version 1.4 Manual,
Zeus Numerix Pvt Ltd, March 2009
[4]. ParaView User’s manual for v3.14.1 64-bit,
Sandia National Laboratories
[5]. Bahram Khalighi, General Motors R&D Center,
VAD Lab, “Pickup Truck Aerodynamics A PIV
Study”
[6]. Anderson, J. D. (1995). Computational Fluid
Dynamics: The Basics with Applications,
McGraw-Hill, New York
[7]. Suhas.V.Patankar (1980). Numerical heat
Transfer and Fluid Flow: Hemisphere Publishing
Corporation, New York
[8]. T. J. Craft “Pressure-Velocity Coupling”, School
of Mechanical Aerospace and Civil Engineering,
Advanced Modelling & Simulation: CFD
2004
International Journal of Engineering Research & Technology (IJERT)
Vol. 2 Issue 12, December - 2013
IJERT
IJERT
ISSN: 2278-0181
www.ijert.orgIJERTV2IS120775