Embed Size (px)
Citation preview
ISSN 2042-2695
CEP Discussion Paper No 1109
December 2011
Management Practices Across Firms and Countries
Nicholas Bloom, Christos Genakos,
Rafaella Sadun and John Van Reenen
Abstract For the last decade we have been using double-blind survey techniques and randomized sampling to
construct management data on over 10,000 organizations across twenty countries. On average, we
find that in manufacturing American, Japanese, and German firms are the best managed. Firms in
developing countries, such as Brazil, China and India tend to be poorly managed. American retail
firms and hospitals are also well managed by international standards, although American schools are
worse managed than those in several other developed countries. We also find substantial variation in
management practices across organizations in every country and every sector, mirroring the
heterogeneity in the spread of performance in these sectors. One factor linked to this variation is
ownership. Government, family, and founder owned firms are usually poorly managed, while
multinational, dispersed shareholder and private-equity owned firms are typically well managed.
Stronger product market competition and higher worker skills are associated with better management
practices. Less regulated labor markets are associated with improvements in incentive management
practices such as performance based promotion.
JEL Classifications: L2, M2, O14, O32, O33
Keywords: management, organization, and productivity
This paper was produced as part of the Centre’s Productivity and Innovation Programme. The Centre
for Economic Performance is financed by the Economic and Social Research Council.
Acknowledgements Financial support was provided by the Alfred Sloan Foundation; the Anglo-German Foundation, the
Economic and Social Research Council, and the National Science Foundation. We want to thank Don
Siegel and an anonymous referee for extremely helpful comments. We are indebted to Rebecca
Homkes, Renata Lemos, Mimi Qi and Daniela Scur for their help in this research project. Our
partnership with McKinsey & Company (who we received no funding from) has been essential for the
development of the project, in particular Pedro Castro, Stephen Dorgan, John Dowdy and Dennis
Layton. We have also recently benefited tremendously from working closely with Accenture (who we
also received no funding from), in particular Ashutosh Tyagi and Shaleen Chavda. We thank James
Milway at the IPC for the Canadian and Retail data, Renu Agarwal and Roy Green at UTS for
collecting the Australian and New Zealand data, and Andrea Tokman at the IPP for the Chilean data.
Nicholas Bloom is an Associate at the Centre for Economic Performance, London School of
Economics. He is also Assistant Professor, Department of Economics, Stanford University. Christos
Genakos is a Research Economist with the Centre for Economic Performance, London School of
Economics. He is also an Assistant Professor (Lecturer) in the Department of Economics, Athens
University of Economics and Business. Rafaella Sadun is a Centre for Economic Performance
Associate and Assistant Professor, Harvard Business School. John Van Reenen is Director of the
Centre for Economic Performance and Professor of Economics, London School of Economics.
Published by
Centre for Economic Performance
London School of Economics and Political Science
Houghton Street
London WC2A 2AE
All rights reserved. No part of this publication may be reproduced, stored in a retrieval system or
transmitted in any form or by any means without the prior permission in writing of the publisher nor
be issued to the public or circulated in any form other than that in which it is published.
Requests for permission to reproduce any article or part of the Working Paper should be sent to the
editor at the above address.
N. Bloom, C. Genakos, R. Sadun and J. Van Reenen, submitted 2011
2
As four Europeans, we are used to hearing American firms regarded as the world’s best
managed. American companies, such as GE, Apple, IBM, McDonalds and Wal-Mart are
icons of business. U.S. business schools, which train top-level managers of these firms,
dominate global rankings. This was not always the case; for example, Japanese firms in
the 1980s were regarded by many as the best managed in the world, powered by the
Toyota inspired Lean manufacturing system.1
The chief purpose of our ongoing research program is to understand how and why
management practices vary across countries but also across firms and industries. To
address this we must first tackle a serious challenge: how to measure and define
management practices? We believe that management practices can be systematically
measured, which then allows us to investigate their role in explaining the astounding
differences in performance across firms and countries.
To measure management practices, we use a new double-blind survey tool. This survey is
run on randomly drawn samples of organizations across a range of different industries
and countries and uses open questions to obtain accurate responses regarding the quality
of managerial practices inside each firm. By systematically executing this approach on
over 10,000 organizations over the last decade, we have assembled one of the first large
internationally comparable management data sets.2 In this paper we will both describe
this dataset and present some preliminary results. An anonymized version of the full data
is available on-line at www.worldmanagementsurvey.org3
We begin by describing this new survey approach, which focuses on measuring
management practices along three operations focused dimensions: (1) performance
1 See, for example, Appelbaum and Batt (1994) for a historical review on the cross country evolution of some of the managerial concepts that are included in our survey. And note that while US manufacturing firms are struggling domestically due to high employment costs, US multinationals have been very successful abroad over the last couple of decades (see Bloom, Sadun and Van Reenen, 2012). 2 Other international management datasets include the Global Manufacturing Research Group Survey, the GLOBE survey (House et al. 2004, Javidan et al 2006), and the World Bank/EBRD establishment surveys. 3 We can only provide the anonymized data because we committed to confidentiality during the interviews. Anyone that has access to a US Census Research Data Center can apply to us to gain access to the full dataset since data within the RDCs is protected by US Federal law.
3
monitoring; (2) target setting; and (3) incentives/people management. Within these three
areas of management we define “best” management practices as those that continuously
collect and analyze performance information, that set challenging and interlinked short
and long run targets, and that reward high performers and retrain or fire low performers.
There is a vast literature on the theory and measurement of management practices.4 There
is a wide spread of opinions over the definition, scope and impact of different practices,
and even a debate whether “best practices” exist or whether every management practice
is contingent. Our management scoring grid has a very practical origin; it was developed
by a large international consulting firm as a first-contact guide to firms’ management
quality (what consultants call an initial “diagnostic”). As such it targets a set of core
operational management practices that have a direct impact on firm performance based
on the consultants’ experience, and which can be easily measured in an initial appraisal.
As we discuss below, we also test (and confirm) that these practices are indeed strongly
linked to higher productivity, profitability and growth.
Our main findings on management practices can be summarized in ten bullet points (with
the corresponding figures in the main text referenced):
1. US manufacturing firms score higher than any other country. Companies based in
Canada, Germany, Japan and Sweden are also well managed. Firms in developing
countries, such as Brazil, China and India are typically less well managed (Figure 1).
4 The details of the survey questions can be found in Table 1 and online at www.worldmanagementsurvey.com. This was developed by a leading international consulting firm, but most of the concepts included in the questionnaire overlap with the existing management literature. For example, the emphasis on repeated and persistent organizational processes is very similar in spirit to the literature on static and dynamic routines (Eisenhardt & Martin, 2000; Nelson & Winter, 1982; Winter, 2003;, see Becker, 2004, for a review). Conceptually, the survey is also related to idea that intangible firm specific assets and organizational processes are crucial in determining firm performance, which constitutes a key foundational element of the Resource Based view of the firm (Barney & Arikan, 2001; see Barney & Griffin, 1992, for a review). Finally, the section of the survey dedicated to HR practices—and in particular the attention to the selection, rewards and training given to employees—is consistent with the set of best practices emphasized in the literature dedicated to “High Performance Work Systems” (for example, Lengnick-Hall, Lengnick-Hall, Andrade, & Drake, 2009; Lepak, Liao, Chung, & Harden, 2006; Pfeffer, 1999a, 1999b; Pfeffer & Veiga, 1999). Bloom &Van Reenen (2010) discuss the links between their work and the more general HRM literature. In terms of methodology, our work shares the same emphasis on data and econometric identification issues discussed in Becker & Huselid (1998) and Huselid & Becker (1996).

4
2. In manufacturing, there is a wide spread of management practices within every
country. This spread is particularly notable in developing countries, such as Brazil
and India, which have a large tail of very badly managed firms (Figure 2).
3. Looking at other sectors, US firms in retail and hospitals also appear to be the best
managed internationally, but US schools score poorly (Figure 3).
4. There is also a wide spread of management practices in non-manufacturing sectors
(Figure 4).
5. Publicly (Government) owned organizations have worse management practices across
all sectors we studied. They are particularly weak at incentives: promotion is more
likely to be based on tenure (rather than performance), and persistent low-performers
are much less likely to be retrained or moved (Figures 5 and 6).
6. Amongst private sector firms, those owned and run by their founder or their family
descendants, especially firstborn sons, tend to be badly managed. Firms with
professional (external, non-family) CEOs tend to be well managed (Figure 7).
7. Multinationals appear able to adopt good management practices in almost every
country in which they operate (Figure 8).
8. There is strong evidence that tough product market competition is associated with
better management practices, within both the private and public sectors (Figure 9).
9. Light labor market regulation is correlated with the systematic use of monetary and
non monetary incentives (related to hiring, firing, pay and promotions), but not
monitoring or targets management (Figure 10).
10. The level of education of both managers and non-managers is strongly linked to
better management practices (Figure 11).
5
As mentioned above, one immediate concern with all our work is that measuring
management is impossible because it is unclear which management practices are “good”
or “bad”. Maybe, all management practices are contingent on the business situation. For
example, firms in India may not adopt performance measurement because wages are so
low that measuring workers’ output is unnecessary. We find that for at least our core set
of management practices around monitoring, targets and incentives, there does appear to
be a concept of “best” practices. Firms adopting these practices are more profitable, more
productive, grow faster and survive longer, not just in the Anglo-Saxon nations, but in
every region we have looked at. Moreover, in recent experimental studies randomly
chosen treatment firms that were helped to adopt these practices demonstrate large causal
improvements in profitability compared to the control firms5.
There are several caveats to this. First, there are distinct styles of management, and some
firms and countries do specialize in some clusters of our practices rather than others.
Second, there are many management practices that are contingent such as strategy,
finance, M&A and marketing. We deliberately focus in our work on a narrow subset of
basic management practices for which best practices most likely exist, that is those
practices that seem likely to raise the efficiency firms’ production of goods and services6.
Thirdly, there are other types of management such as leadership that are undoubtedly
important to business success, but are much harder to quantify (House et al, 2004, is the
most ambitious attempt). Finally, even this core set of best-practices almost surely
changes over time. For example, the advent of cheap computers now makes it relatively
more attractive to undertake continuous performance measurement and related analysis.
5 See, for example, Bloom, Eifert, Mahajan, McKenzie and Roberts (2011). 6 In our view it is an open question whether high scores on our management practices grid are beneficial, neutral or detrimental to innovation (the generation of new goods and services). On the one hand, our management practices may be complements to innovation as efficiently organizing a research team is likely to get more “bang” for every “R&D buck” spent. On the other hand, the kind of careful monitoring and managerial oversight we emphasis could potentially frustrate a more freewheeling innovative culture. Ultimately, this is an empirical issue.
6
How Can Management Practices Be Measured?
To measure management practices, we developed a new survey methodology described
in detail in Bloom and Van Reenen (2007). In summary, we use an interview-based
evaluation tool that defines and scores from one (“worst practice”) to five (“best
practice”) 18 key management practices. Table 1 lists the management questions for
manufacturing, and it also gives some sense of how each is mapped onto the scoring grid.
We then average the individual question scores for each firm into a single indicator that is
meant to reflect “good management”, as commonly understood. For retail, schools and
hospitals we use a very similar methodology.7
As mentioned, this evaluation tool was developed by an international consulting firm, and
broadly interpreted, it attempts to measure management practices in three key areas. First,
monitoring - how well do organizations monitor what goes on inside the firm, and use
this information for continuous improvement. Second, targets - do organizations set the
right targets, track the right outcomes, and take appropriate action if the two are
inconsistent. Third, incentives - are organizations promoting and rewarding employees
based on performance, priotitzing hiring and trying to keep their best employees?8
Our methodology defines a badly managed organization as one that fails to track
performance, has no effective targets, and bases promotions on tenure with no system to
address persistent employee underperformance. In contrast, a well managed organization
is defined as continuously monitoring and trying to improve its processes, setting
comprehensive and stretching targets, and promoting high-performing employees and
fixing (by training or exit) underperforming employees.
To collect the data, we hired teams of MBA students to conduct the telephone interviews,
as they had some business experience and training. These students were all from the 7 For the full survey grids for each industry see http://worldmanagementsurvey.org/?page_id=187. The differences across industry are primarily to reflect different organizational structures – for example using the word “nurse manager” and “unit” in hospitals as compared to “plant manager” and “factory” in manufacturing firms. As the management practices we survey are so fundamental, the survey approach transfers readily across industries. 8 These practices are similar to those emphasized in earlier work on management practices, by for example Osterman (1994), Macduffie (1995), Delery & Doty (1996) and Ichniowski, Shaw, & Prennushi (1997).
7
countries we surveyed (so could interview managers in their native language), but were
studying at top US or European universities. The survey was completed by plant
managers in manufacturing, retail store managers, clinical service leads in hospitals and
school principals or headmasters. This level of middle managers was purposely selected,
as they were senior enough to have an overview of management practices, but not so
senior as to be detached from day-to-day operations.
We interviewed these managers using a “double-blind” survey technique. The first part of
this double-blind technique is that managers are not told they are being scored or shown
the scoring grid. They are only told they are being “interviewed about management
practices.” To do this, we asked “open” questions in the survey. For example, on the first
monitoring dimension in manufacturing, we start by asking the open question “tell me
how you monitor your production process”, rather than closed questions such as “do you
monitor your production daily [yes/no]”.
We continue with open questions focusing on actual practices and examples until the
interviewer can make an accurate assessment of the firm’s practices. For example, the
second question on that performance tracking dimension is “what kinds of measures
would you use to track performance?” and the third is “If I walked round your factory
what could I tell about how each person was performing?” The combined response to this
dimension are scored against a grid which goes from 1 (out of 5) which is defined as
“Measures tracked do not indicate directly if overall business objectives are being met.
Tracking is an ad-hoc process (certain processes aren’t tracked at all).” up to 5 which is
defined as “Performance is continuously tracked and communicated, both formally and
informally, to all staff using a range of visual management tools.” The full list of
dimensions and questions used to score these in each industry are given on
http://www.worldmanagementsurvey.org/
The other side of our “double-blind” approach is that our interviewers are not told in
advance anything about the organization’s performance; they are only provided with the
organization’s name, telephone number and industry. We randomly sample medium-
8
sized firms (employing between 100 and 5,000 workers) in manufacturing and retail,
acute care hospitals and schools who offered general education to 15 year olds (which
correspond to high schools in most of the countries we surveyed). These organizations
are large enough that the type of systematic management practices chosen are likely to
matter. However, these are small enough that they are not usually reported in the business
press. Thus, the interviewers generally have not heard of them before, so they should
have no preconceptions.
We used a variety of procedures to obtain a high success rate and to remove potential
sources of bias from our estimates. First, we obtained government endorsements for the
surveys in most countries and industries. Second, we positioned the surveys as “an
interview on management” never using the word “survey” or “research”, as telephone
switchboards usually block surveys and market research. Third, we never ask
interviewees for performance or financial data; instead, we obtained such data from
independent sources such as company accounts or hospital and school league tables.
Fourth, the interviewers were encouraged to be persistent – so they ran about two
interviews a day lasting 45 minutes each on average, with the rest of the time spent
repeatedly contacting managers to schedule interviews.9 We also ran interviews in the
managers native language to make the process as comfortable as possible. These steps
helped to yield a response rate of about 50% across industries, which was uncorrelated
with the (independently collected) performance measures for the firm—thus, we were not
disproportionately interviewing successful or failing organizations.
We also collected a series of “noise controls” on the interview process itself (such as the
time of day and the day of the week), characteristics of the interviewee (such as tenure in
firm) and the identity of the interviewer (so we can include a full set of dummy variables
for the interviewer to deal with interviewer bias). Including these in our regression
analysis typically helps to improve the precision of our estimates by stripping out some of
the measurement error.
9 As a result these management surveys are expensive to run. Our interviews cost about $150 each (including all overheads) across all the survey waves. To help defray costs we have actively collaborated several different research teams and Governments, and welcome any interest in future collaboration.
9
Validating the Management Data
Before showing the management data, it is important to ask if our survey procedure
appears to be measuring meaningful differences in management across firms. To do this
we carry out two validation exercises. The first is internal validation, which evaluates to
what extent our management data appears internally consistent across questions and
interviews. The second is external validation, which evaluates to what extent our
management data is correlated with independently collected performance data from
company accounts and national census. That is, do the firms our interview says are well
managed also perform better? The short answer is yes, and we discuss this in detail in the
section “the effect of management quality on firm performance” below.
Internal validation:
To undertake internal validation, we performed two separate exercises. First, for almost
three quarters of all interviews we had a second person listening in on another phone
extension as a “silent monitor” to independently double score the interview. For these
double-scored interviews we found the correlation across scores was 0.887, which shows
that two interviewers are typically given the same score to the same interview.
The much tougher test was the second interviews we conducted. We re-surveyed 222
(about three percent) of the manufacturing sample to arrange a second interviewer on a
second plant manager in the same firm using a second MBA interviewer. This should
help to reveal how consistently we are measuring management practices within firms by
interviewing one manager. We found that the correlation between our independently run
first and second interview scores was 0.51. Part of this difference across plants within the
same firms is likely to be real internal variations in management practices: no two plants
within the same firm will have the same identical management practices. The rest of this
difference across plants within firms will reflect measurement error in the survey process.
Nevertheless, this 0.51 correlation across different plants within the same firm, which is
highly significant (p-value< 0.001), suggests that while our management score is clearly
noisy, it is picking up significant management differences across firms. Similar high
10
correlations are found in the hospital surveys (see Bloom, Propper, Seiler, & Van
Reenen, 2010)10.
International Patterns of Management
Below we summarize some of the main findings from the management data.11
Manufacturing
Figure 1 presents the average management practice score across countries (details in
Appendix 1). These firms were randomly sampled from the population of all
manufacturing firms with 100 to 5,000 employees. The median firm is privately owned,
employs around 350 workers and operates two production plants.
The United States has the highest management practice scores, on average, followed by
Germany and Japan. At the bottom of the rankings are countries in Southern Europe
(Greece and Portugal) along with developing countries, such as Brazil, China and India.
As introduced above, we can separate these overall management scores into three broad
categories: monitoring, targets and incentives, and the country level scores are shown in
Table 2. For ease of comparison, average scores are given in the bottom row of the table.
U.S. management has by far the largest advantage in incentives (with Canada and
Germany following), and the second-largest advantage in the category of monitoring and
target-setting (behind Sweden and Japan respectively). However, this data also describes
how management styles differ across countries. In the United States, India and China,
managerial use of incentives (relative to the average country) are substantially greater
than the use of monitoring and target-setting, while in Japan, Sweden and Germany,
managerial use of monitoring and target setting (relative to the average) far exceeds the
use of incentives (relative to the average). There could be many reasons for this pattern of 10 Further evidence of the consistency of the management scores is in Grous (2011). His team conducted extensive factory visits of 19 British aerospace firms conducting both the Bloom & Van Reenen (2007) telephone survey on the plant manager and also face to face interviews with several employees including the CEO, plant manager and shopfloor workers. The management scores from his site visits where highly correlated with the scores from the telephone interviews. 11 The full anonymized dataset and Stata do-files to replicate these results are available on www.worldmanagementsurvey.org/

11
specialization across countries. One factor we will examine below is that the lighter labor
market regulations in the United States make it easier to remove poor performers and to
reward high performers.
What does the distribution of management practices look like within countries? We can
plot a firm-level histogram of management practices as shown in Figure 2. The first
histogram shows this data for the United States, where the bars show the actual data and
the dark line is a smoothed (kernel) fit of the data. Other advanced economies in Western
Europe, like the UK, have some resemblance to the US distribution, except they have a
somewhat thicker left “tail” of badly managed firms. In comparison, firms in developing
countries such as Brazil and India have a much thicker left tail of badly managed firms.
These diagrams also show the smoothed value for the U.S. economy, so that management
in these countries can be readily compared to the United States. Another key finding is
that China has a more compressed distribution, which could be due to the fact that
Chinese firms are relatively young, so there is less variation in managerial “vintages”.12
This cross-country ranking is perhaps not surprising, since it approximates the cross-
country productivity ranking. Although we cannot offer a rigorous argument here about
the magnitude of any causal effect, it certainly appears plausible that management
practices should be viewed as part of the determinants of national productivity. A
regression of GDP per capita on management practices across 17 countries yields an R-
squared of 0.81.
Hospitals, Schools and Retail
In Figure 3, we report management scores for three service sectors: healthcare, where we
interviewed clinical service leads in cardiology and orthopedics units in acute care
hospitals; education, where we interviewed principals in secondary (high) schools; and
retail, where we worked with the Institute for Competitiveness and Prosperity to
interview store and district managers in firms with 100 to 5000 employees. Because of
12 Chinese firms are 18 years old on average compared to the sample average of 43.7 years. India has the second youngest firms at 30.3 years old on average, while Germany has the oldest at 55.2 years.
12
funding constraints this survey data covers fewer countries than for manufacturing,
although we are continuing to extend these surveys across countries and industries.13
An analysis of Figure 3 reveals that US hospitals and retailers are again the best managed
across our international sample. What is potentially more surprising is that US schools
are notably poorly managed by international standards. US schools in particular tend to
be particularly poor at incentives management – that is promoting and rewards high
performing teachers, and retraining and/or firing badly performing teachers. This may be
because the US schooling system is dominated by the public sector with strong union
representation, which is in contrast to the other three sectors we have examined. In
contrast, UK schools are the best managed within our sample of countries. One reason
appears to be that UK schools have undergone a series of reforms in recent years to
improve management (for example, see McNally, 2010).
As in manufacturing, we also see a wide spread of management practices. For example,
Figure 4 plots the distributions of management scores for hospitals, schools and retail
firms and again we see wide dispersions in each country studied. These spreads in
management practices appear to mimic the wide dispersions in performance in these
sectors as reported in, for example, Skinner and Staiger (2009) for hospitals, Foster,
Haltiwanger, and Krizan (2006) for retail, and Hoxby (2000) for schools.
Our management scoring method has also been used by other research teams to study
sectors beyond manufacturing, retail, schools and hospitals. For example, McConnell et
al (2009) looked at 147 substance abuse clinics; Delfgaauw, Dur, Propper & Smith
(2011) looked at around 200 fostering, adoption and nursing homes, McKinsey (2009)
studied around 100 tradable service firms in Ireland; Dohrmann & Pinshaw’s (2009)
survived around 20 tax agencies across OECD countries; and Homkes’ (2011) studied
around 200 global public-private partnerships. In every case they also found extremely
wide variations in management practices across the organizations studied.
13 For example, we are talking to a number of Governments about them funding the extension of the manufacturing survey to their country.
13
What Factors are Associated with Differences in Management Practices?
Based on our sample of over 10,000 management interviews, we can identify some
stylized facts regarding quality of managerial practices.
Public (Government) Ownership
One factor that seems to be strongly linked to management practices is ownership. Figure
5 demonstrates publicly-owned organizations have consistently lower management scores
in each sector, even after controlling for country and size.14 This gap is quantitatively
large: the average gap in management scores between public and private ownership is
0.14, similar, for example, to the overall management gap between the US and Sweden.
As shown in Figure 6, the overriding reason why publicly-owned institutions score
substantially lower is that they weaker incentive management practices. In particular,
within many public sector agencies promotion is based on time served, and persistent
under-performers are not retrained or moved positions. One explanation for this is the
strength of unions who place a great emphasis on equity, fairness and political criteria.
Family and Founder Ownership and Management
The privately owned firms in our manufacturing and retail sample can be divided up by
ultimate ownership: including dispersed shareholders, family ownership with an external
chief executive officer, family ownership with a family chief executive officer; owned by
the founder, or the managers of the firm; and owned by private equity or private
individuals. Figure 7 plots the average management practices by ownership type,
including Government-owned firms as well for comparison. Because of wide differences
in ownership patterns across countries, industries and firm size, we report the
management scores after controlling for size, country and industry dummies.
One interesting group that emerges are family firms, which our research defines as firms
owned by the descendants of the founder, that is, sons, grandsons, great grandsons and
14 Note that retail is excluded here as we observed no publicly owned retail firms in Canada, the UK or US.

14
more rarely, daughters, granddaugthers etc. Those that are family owned and also family
managed (“Family, family CEO”) have a large tail of badly managed firms, while the
family owned but externally managed (“Family, external CEO”) look very similar to
dispersed shareholders. The reason appears to be that many family firms typically adopt a
rule of primogeniture, so that the eldest son becomes the chief executive officer,
regardless of merit considerations. Many governments around the world also provide tax
subsidies for family firms. For example, the United Kingdom has many more family-run
owned firms than the United States, which is likely to be related to the estate tax
exemption for inherited business assets in the United Kingdom.
Since family firms typically have less debt, product market competition may not be as
effective in driving them out of business if they are badly managed. Without debt firms
only have to cover operating costs (e.g. salaries and wages) but not capital costs (e.g. the
rent on property or equipment since these were typically bought outright many years
ago). Hence, family firms can continue to generate positive cash-flow while generating
economic losses, because their family owners are subsidizing them through cheap capital.
Firms with private equity ownership appear well managed, in particular when compared
to family and government-owned firms (Bloom, Sadun, & Van Reenen, 2009b). These
findings are consistent with empirical studies indicating that private equity transactions in
the U.S. and U.K. result in a substantial increase in productivity (Siegel & Simons, 2010;
Cumming, Siegel, & Wright, 2007; Harris, Siegel, & Wright, 2005; Lichtenberg &
Siegel, 1990). Thus, the pattern in recent years of private equity firms purchasing firms in
Europe and Asia that were previously under family or government management may
make some economic sense.
A perhaps surprising result is that “Founder owned, founder CEO firms”—where the
current chief executive officer founded the firm—are the worst managed on average. We
are still trying to understand this phenomenon, but one potential explanation is that the
entreprenuerial skills required of a start up (e.g. creativity and risk taking) are not the
same skills required when a firm grows large enough to enter our sample (at least 100
15
employees). A mature firm needs to move beyond informal rules and these may be
implemented more effectively by a professional manager (see, for example, Boeker and
Karichalil (2002), Washburn, Waldman, & Sully de Luque (2009) and Davila, Foster &
Jia (2010)).
Multinational Firms
Figure 8 plots management scores by country for domestic firms (those with no
production facilities abroad) and foreign multinationals. Two results stand out. First,
foreign multinationals are better managed than domestic firms. Second, foreign
multinationals seem able to partially “transport” their better practices abroad despite
often difficult local circumstances. We also find that multinationals transplant other
features of their organizational form overseas such as the average degree of
decentralization (Bloom, Sadun & Van Reenen, 2009b). We also distinguished by export
status revealing a clear pecking order: average management scores were lowest for non-
exporters (2.62), next lowest for non-multinational exporters (2.89) and highest for
multinationals (3.25).
Product Market Competition
In our interviews, we asked the manufacturing and retail managers to identify the number
of competitors they faced in the marketplace. We found the average management score
was significantly higher when firms reported facing more competitors (see Figure 9).
Using other measures of competition for manufacturing firms not reported by managers,
such as the import penetration rates (measured by imports as a share of domestic
production) or Lerner indices of competition yields a similar general result that
management quality tends to increase with competitive intensity.15 We also collected
competition data for hospitals and schools and found a similar correlation; that is,
organizations reporting they faced more competitors appear to adopt better management
practices.
15 We defined the inverse Lerner index is one minus the average profits/sales ratio of all other firms in the country industry cell over the last five years. High values suggest low long-run profits, suggestive of tough competition. When we used this and the import measure data we add country and industry dummies to control for factors like country size and different reporting requirements—see Bloom & Van Reenen (2007) for details.
16
A concern with all of the associations of management with “driving factors” such as
competition is that the correlation is spurious and not causal. In the case of competition,
this would be likely to cause an underestimate of the positive effect of competition as a
particularly well-managed organization would be likely to drive other badly managed
rivals out of business and so reduce the number of rivals, lowering measured competition.
This idea can sometimes be directly tested; for example, Bloom, Propper, Seiler, & Van
Reenen (2010) do so based on a “natural experiment,” involving the closing of hospitals
in the UK. Politicians control exit and entry and tend to keep hospitals open in politically
marginal districts, and this creates some random variation in the number of hospitals
across different areas. Using this exogenous variation we find that the positive causal
effect of competition on management (and clinical outcomes like survival rates) is indeed
stronger than the simple correlation would suggest.
In general, we interpret this finding as showing that more competitive markets are
associated with better management practices. This result could arise through a variety of
channels. For example, one route for competition to improve management practices may
be through selection, with badly run firms, hospitals or schools exiting more speedily in
competitive markets. A second route may be through incentives to improve practices,
which could be sharper when competition “raises the stakes” either because efficiency
improvements have a larger impact on shifting market share or because managers are
more fearful of losing their jobs.16
Labor Market Regulation
Labor market regulations can constrain the ability of managers to hire, fire, pay and
promote employees. Figure 10 plots each country’s average manufacturing management
scores on incentives management (survey questions 13 to 18 on hiring, firing, pay and 16 The competition impact fits well with the evolutionary economics paradigm, (Nelson &Winter, 1982). When competition is measured by the number of firms, more firms could also improve the ability of owners or regulators to implement “yardstick” competition and improve management. Underperformance is often easier to spot when organizations have local competitors to be evaluated against.
17
promotions) against an employment rigidity index from the World Bank, which focuses
on the difficulties that firms face in hiring workers, firing workers and changing their
hours and pay. Tougher labor markets regulation is indeed significantly negatively
correlated with the management scores on incentives. In contrast, more restrictive labor
market regulations are not significantly correlated with management practices in other
dimensions like monitoring or targets.
Obviously there are a number of other factors which vary across countries, so the pattern
shown in Figure 10 does not conclusively demonstrate labor market regulations constrain
some forms of management practices. It is, however, certainly suggestive of this effect.
Human Capital
As shown in Figure 11, the education of managers and workers is strongly correlated
with high management scores. Of course, we cannot infer a causal relationship from this
association. However, it is plausible that managers with a college degree are more likely
to be aware of the benefits of modern management practices, such as lean manufacturing.
More surprisingly perhaps, is that worker level education is also positively associated
with management scores, suggesting that implementing many of these practices may be
easier when the workforce is more knowledgeable. Many of the best practices in Table 1
require significant initiative from workers, such as the Japanese inspired lean
manufacturing techniques.
Our belief is that more basic business education – for example, around capital budgeting,
data analysis, and standard human resources practices – could help improve management
in many countries. This holds particularly true in developing countries, and recent field
work we have been doing with firms in India has provided supportive evidence on this
(see below).
18
Non-experimental evidence on Management Quality and Firm Performance
While it appears likely that effective monitoring, targets and incentives should be
associated with better performance, we want to confirm this empirically in our sample.
To do this, we first examined the correlation between our measure of management
practices and organizational performance. For manufacturing and retail firms this
performance is in terms of productivity, profitability, growth rates, exit rates and market
value; for hospitals this is in terms of patient outcomes such as heart-attack survival rates;
and for schools it is in terms of pupil outcomes like standardized test-scores.
For the manufacturing firms we obtained this data from company accounts, which were
available for 2,927 of the firms.17 For 251 hospitals we had performance data in the U.S.
and U.K., while we obtained this for 354 schools in the US, UK, Canada and Sweden.
We found that higher management scores are robustly associated with better
performance.
Table 3 reports the results of the ordinary least squares (OLS) regressions. Our dependent
variables are different measures of firm performance, including sales per employee,
profitability, the growth of sales and survival. Our key explanatory variable is the
measure of the company’s management quality. In some of the regressions, we control
for capital per employee and the share of the workforce with a college degree. We also
include control variables for country and industry (a full set of dummy variables)18, firm-
level controls for hours worked and firm age, and a set of “noise controls” that (as
discussed earlier) include a dummy variables for our interviewers, as well as for the job
tenure of the manager, the day of the week the interview was conducted, the time of day
17 We had at sales and employment accounting data for 3900 firms, but complete data for sales, employment, capital, ROCE and sales growth for 2,927 firms. Our sample contained 90 percent private firms and 10 percent publicly listed firms. In most countries around the world, both public and private firms publish basic accounts. In the United States, Canada and India, however, private firms do not publish (sufficiently detailed) accounts, so while we still surveyed these firms no accounting performance data is available for them. Hence, these performance regressions use data for all firms except privately held ones in the United States, Canada and India. 18 We should note that including a full set of dummies for variables like country and industry is exactly the same as removing the country and industry means from all variables (see, for example, Greene 2002). Hence, these results compare the performance of firms to other firms in the same country and industry, with additional controls for size, capital intensity, hours, firm-age, skill intensity etc.
19
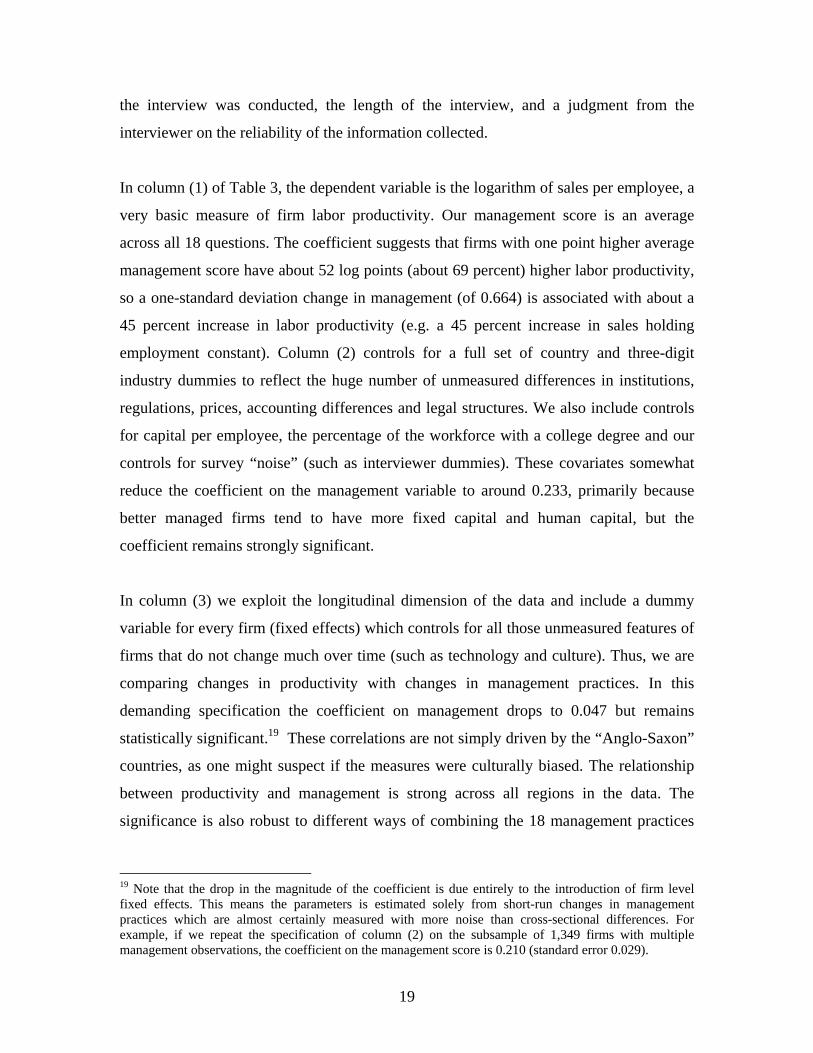
the interview was conducted, the length of the interview, and a judgment from the
interviewer on the reliability of the information collected.
In column (1) of Table 3, the dependent variable is the logarithm of sales per employee, a
very basic measure of firm labor productivity. Our management score is an average
across all 18 questions. The coefficient suggests that firms with one point higher average
management score have about 52 log points (about 69 percent) higher labor productivity,
so a one-standard deviation change in management (of 0.664) is associated with about a
45 percent increase in labor productivity (e.g. a 45 percent increase in sales holding
employment constant). Column (2) controls for a full set of country and three-digit
industry dummies to reflect the huge number of unmeasured differences in institutions,
regulations, prices, accounting differences and legal structures. We also include controls
for capital per employee, the percentage of the workforce with a college degree and our
controls for survey “noise” (such as interviewer dummies). These covariates somewhat
reduce the coefficient on the management variable to around 0.233, primarily because
better managed firms tend to have more fixed capital and human capital, but the
coefficient remains strongly significant.
In column (3) we exploit the longitudinal dimension of the data and include a dummy
variable for every firm (fixed effects) which controls for all those unmeasured features of
firms that do not change much over time (such as technology and culture). Thus, we are
comparing changes in productivity with changes in management practices. In this
demanding specification the coefficient on management drops to 0.047 but remains
statistically significant.19 These correlations are not simply driven by the “Anglo-Saxon”
countries, as one might suspect if the measures were culturally biased. The relationship
between productivity and management is strong across all regions in the data. The
significance is also robust to different ways of combining the 18 management practices
19 Note that the drop in the magnitude of the coefficient is due entirely to the introduction of firm level fixed effects. This means the parameters is estimated solely from short-run changes in management practices which are almost certainly measured with more noise than cross-sectional differences. For example, if we repeat the specification of column (2) on the subsample of 1,349 firms with multiple management observations, the coefficient on the management score is 0.210 (standard error 0.029).
20
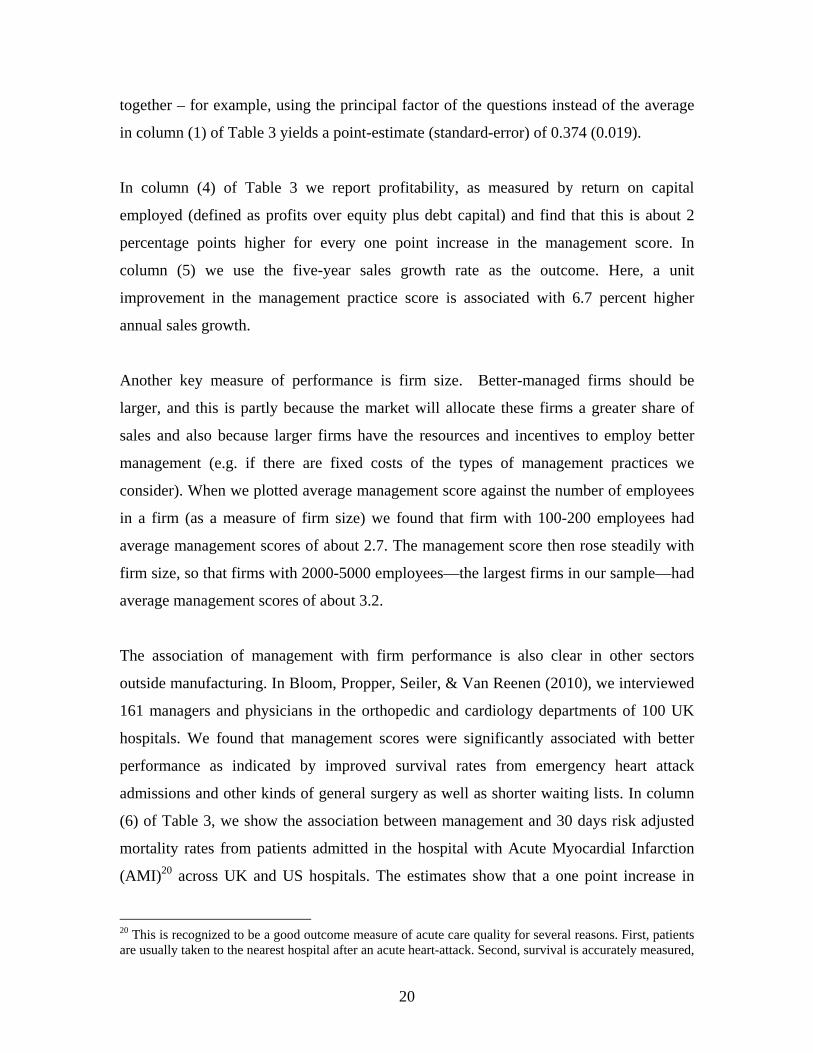
together – for example, using the principal factor of the questions instead of the average
in column (1) of Table 3 yields a point-estimate (standard-error) of 0.374 (0.019).
In column (4) of Table 3 we report profitability, as measured by return on capital
employed (defined as profits over equity plus debt capital) and find that this is about 2
percentage points higher for every one point increase in the management score. In
column (5) we use the five-year sales growth rate as the outcome. Here, a unit
improvement in the management practice score is associated with 6.7 percent higher
annual sales growth.
Another key measure of performance is firm size. Better-managed firms should be
larger, and this is partly because the market will allocate these firms a greater share of
sales and also because larger firms have the resources and incentives to employ better
management (e.g. if there are fixed costs of the types of management practices we
consider). When we plotted average management score against the number of employees
in a firm (as a measure of firm size) we found that firm with 100-200 employees had
average management scores of about 2.7. The management score then rose steadily with
firm size, so that firms with 2000-5000 employees—the largest firms in our sample—had
average management scores of about 3.2.
The association of management with firm performance is also clear in other sectors
outside manufacturing. In Bloom, Propper, Seiler, & Van Reenen (2010), we interviewed
161 managers and physicians in the orthopedic and cardiology departments of 100 UK
hospitals. We found that management scores were significantly associated with better
performance as indicated by improved survival rates from emergency heart attack
admissions and other kinds of general surgery as well as shorter waiting lists. In column
(6) of Table 3, we show the association between management and 30 days risk adjusted
mortality rates from patients admitted in the hospital with Acute Myocardial Infarction
(AMI)20 across UK and US hospitals. The estimates show that a one point increase in
20 This is recognized to be a good outcome measure of acute care quality for several reasons. First, patients are usually taken to the nearest hospital after an acute heart-attack. Second, survival is accurately measured,
21
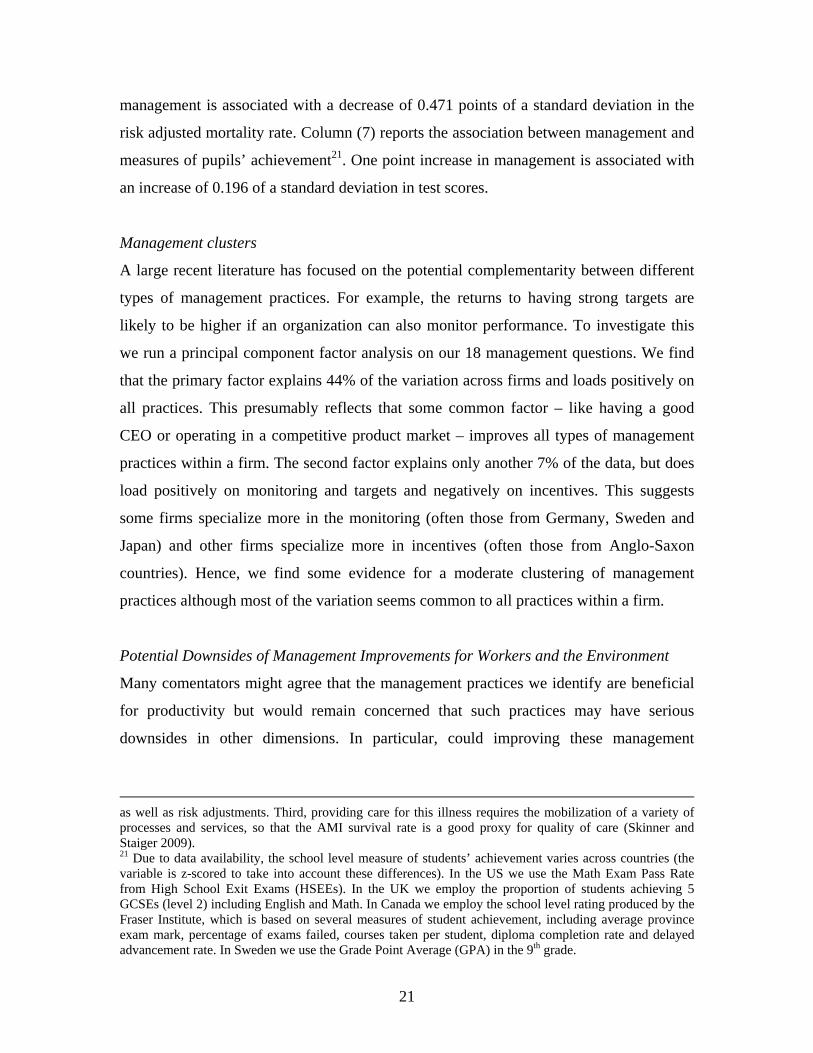
management is associated with a decrease of 0.471 points of a standard deviation in the
risk adjusted mortality rate. Column (7) reports the association between management and
measures of pupils’ achievement21. One point increase in management is associated with
an increase of 0.196 of a standard deviation in test scores.
Management clusters
A large recent literature has focused on the potential complementarity between different
types of management practices. For example, the returns to having strong targets are
likely to be higher if an organization can also monitor performance. To investigate this
we run a principal component factor analysis on our 18 management questions. We find
that the primary factor explains 44% of the variation across firms and loads positively on
all practices. This presumably reflects that some common factor – like having a good
CEO or operating in a competitive product market – improves all types of management
practices within a firm. The second factor explains only another 7% of the data, but does
load positively on monitoring and targets and negatively on incentives. This suggests
some firms specialize more in the monitoring (often those from Germany, Sweden and
Japan) and other firms specialize more in incentives (often those from Anglo-Saxon
countries). Hence, we find some evidence for a moderate clustering of management
practices although most of the variation seems common to all practices within a firm.
Potential Downsides of Management Improvements for Workers and the Environment
Many comentators might agree that the management practices we identify are beneficial
for productivity but would remain concerned that such practices may have serious
downsides in other dimensions. In particular, could improving these management
as well as risk adjustments. Third, providing care for this illness requires the mobilization of a variety of processes and services, so that the AMI survival rate is a good proxy for quality of care (Skinner and Staiger 2009). 21 Due to data availability, the school level measure of students’ achievement varies across countries (the variable is z-scored to take into account these differences). In the US we use the Math Exam Pass Rate from High School Exit Exams (HSEEs). In the UK we employ the proportion of students achieving 5 GCSEs (level 2) including English and Math. In Canada we employ the school level rating produced by the Fraser Institute, which is based on several measures of student achievement, including average province exam mark, percentage of exams failed, courses taken per student, diploma completion rate and delayed advancement rate. In Sweden we use the Grade Point Average (GPA) in the 9th grade.
22
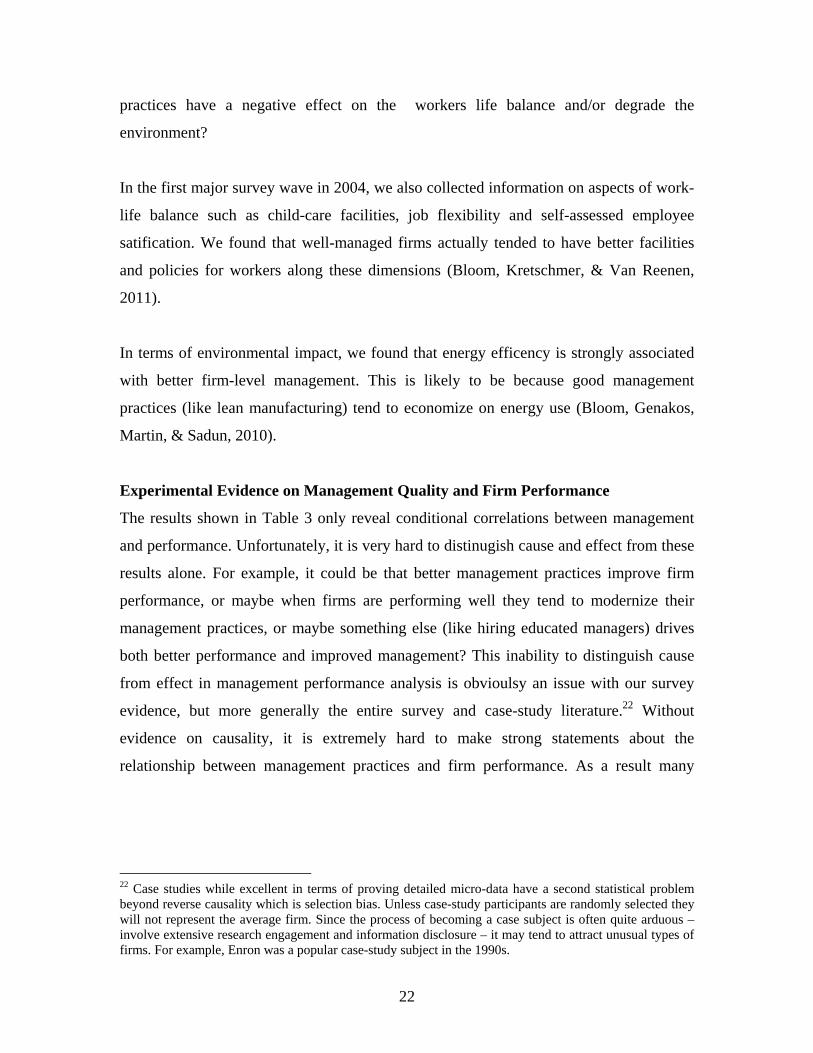
practices have a negative effect on the workers life balance and/or degrade the
environment?
In the first major survey wave in 2004, we also collected information on aspects of work-
life balance such as child-care facilities, job flexibility and self-assessed employee
satification. We found that well-managed firms actually tended to have better facilities
and policies for workers along these dimensions (Bloom, Kretschmer, & Van Reenen,
2011).
In terms of environmental impact, we found that energy efficency is strongly associated
with better firm-level management. This is likely to be because good management
practices (like lean manufacturing) tend to economize on energy use (Bloom, Genakos,
Martin, & Sadun, 2010).
Experimental Evidence on Management Quality and Firm Performance
The results shown in Table 3 only reveal conditional correlations between management
and performance. Unfortunately, it is very hard to distinugish cause and effect from these
results alone. For example, it could be that better management practices improve firm
performance, or maybe when firms are performing well they tend to modernize their
management practices, or maybe something else (like hiring educated managers) drives
both better performance and improved management? This inability to distinguish cause
from effect in management performance analysis is obvioulsy an issue with our survey
evidence, but more generally the entire survey and case-study literature.22 Without
evidence on causality, it is extremely hard to make strong statements about the
relationship between management practices and firm performance. As a result many
22 Case studies while excellent in terms of proving detailed micro-data have a second statistical problem beyond reverse causality which is selection bias. Unless case-study participants are randomly selected they will not represent the average firm. Since the process of becoming a case subject is often quite arduous – involve extensive research engagement and information disclosure – it may tend to attract unusual types of firms. For example, Enron was a popular case-study subject in the 1990s.
23
researchers remain skeptical about the importance of management practices for
explaining variations in firm performance.23
One way to investigate the causal impact of different management practices is to run a
randomized management field experiment. The idea is similar to the way scientists
evaluate drugs – providing drugs to a randomly selected treatment group and comparing
their outcome to the excluded control group.
One such experiment was recently conducted on 28 large Indian textile factories in India
by a Stanford-World Bank research team. They provided free management consulting to
a set of randomly selected treatment plants to help them adopt modern management
practices and compared their performance to another randomly chosen set of control
plants (see Bloom, Eifert, Mahajan, McKenzie, & Roberts, 2011).24
The Indian experiment revealed that the adoption of these management practices for
monitoring, targets and incentives was highly profitable, leading to an average increase in
productivity of 18%. This took several months to occur as the firms slowly improved
productivity with the gradual adoption of these new management practices, as shown in
Figure 12.
Interestingly, the Indian experiment also found that the adoption of these types of modern
management practices was more likely to occur when production conditions were bad.
When facing tough times, firms were more likely to try to upgrade their management
practices; in contrast, when conditions were better, firms were reluctant to change or
adjust management practices. As a result, the correlation evidence in the experiment
23 See, for example, the discussion in Stigler (1976) and Syverson (2011). The argument against the importance of management is that profit maximization will lead firms to reduce costs. As a result any residual variations in management practices will reflect firms’ optimal responses to differing market conditions. Hence, different management practices are not “good” or “bad”, but the optimal response to different market circumstances. This view also underlies the contingency theory of Woodward (1958). 24 Note while drugs trials are double blind (neither the administering doctor nor the patient knows whom is treatment and who is control), due to logistical constraints this experiment was single-blind (only the firms were not informed about the existence of different treatment and control groups). Even so these types of randomized experiments are clearly much more reliable at identifying the causal impact of better management on firm outcomes than correlations from surveys.
24
dramatically underestimated the productivity impact of better management practices (by
almost two thirds) compared to the correctly estimated treatmend effect.
Hence, this suggests that management practices can dramatically improve firm
performance, and further that the correlation results in the literature based on the survey
data may be severely understimating this magnitude. This highlights the need for more
experimental research to identify the causal impact of changing management practices on
firm performance.
Contingent Management
Thus far, we have assumed that certain management practices are, on average,
productivity enhancing. From this perspective, management resembles a technology and
there can be technical progress in management, just as there is for machines. An
alternative perspective is that all management practices are contingent on the firm’s
environment (e.g. Woodward, 1958). Every organization is optimally adopting its own
best practices given the circumstance it finds itself in.
There is certainly some element of contingency in management choices in at least three
respects. First, different countries specialize in different aspects of the managerial
practices. For example, Japan focuses more on monitoring than incentives/ people
management. There are few possible explanations. This may be due to cultural
differences across countries (possibly because Asian culture is claimed to be more
“collectivist”) or historical differences (the lack of capital after World War II is argued to
have forced Japanese firms to develop monitoring focused Lean production techniques).
Second, many aspects of strategic management – such as pricing or takeover decisions –
will be very contingent on specific circumstances the organization faces, with no typical
or generally accepted “good” or “bad” practice. This is why our survey looks only at a
subset of the more process-oriented management practices where it is more likely that
best practices exist. Third, the management practices we assess have not been equally
beneficial throughout history. For example, rigorously and systematically using data to
25
deal with issues and make decisions is facilitated by the dramatic fall in the real cost of
information technology.
Even with these elements of contingency readily acknowledged, our work suggests that
this is not the whole story. As Table 3 showed, better managed organizations within the
same country and industry are earning more profits, growing faster, reducing patient
mortality rates and improving students test scores, among other performance measures.
This is hard to square with the idea that all the differences in management practices
reflect optimal responses to different circumstances.
It thus seems much more likely that many aspects of management style are not
contingent. For example, basing promotion on nepotism or keeping workers at the same
job without any regard to their performance are unlikely to be productivity-enhancing in
any economy. Moreover, in every country in our survey, multinationals do bring a
stronger management approach, even though the multinationals need to work with most
of the same constraints that domestic firms face.
Future Research
Empirical research on the international aspects of management practices is somewhat
embryonic; there are several fruitful areas for additional research. One such area is the
use of field experiments. We would like to run more management experiments in firms,
hospitals and schools to clearly identify the causal impacts of better management
practices. Another area is longer-run management panel data, which will help to identify
the dynamics of managerial change and make stronger statements about cause and effect.
Doing this latter issue is part of our ongoing research, as we have sampled a set of 2,094
firms across three time periods already (2004, 2006 and 2009) and are hoping to soon run
another large survey wave to continue to build the panel dimension of the data. This will
help us match the data more closely to different theories of why we observe such huge
heterogeneity of management practices.
26
A third methodological area to explore is whether we can simplify our methods of
quantifying management so they can be used without our in-depth telephone interview
technique. We have developed a more traditional set of interview questions that can be
incorporated into a set of “closed questions” on a paper survey (a sub-set of Table 1).
Working with the European Bank of Reconstruction and Development, we piloted this on
a sample of twelve countries (mainly from Communist Transition countries such as
Russia) and firms in Germany and Poland, in which we had already run our standard
management survey. Although the “paper and pen” responses had more noise, there was
a good correlation with the original measures, and results on ownership, competition and
skills consistent with what we have found and discussed here (see Bloom, Schweiger, &
Van Reenen, 2011).
Fourth, this research has mainly focused on operational practices like improved
monitoring, tougher targets and stronger incentives, around which a general consensus
that these can be beneficial for performance seems to be forming. We would like to
widen our focus to a broader range of practices, for example human-resource practices
over flexi-time, flexi-place and job-sharing. There is very little consensus over the costs
and benefits of these human-resource practices, with firms and researchers taking a wide
range of positions (e.g. Bloom, Kretschmer and Van Reenen, 2011). So experimental
evidence on their impact would be particularly helpful, something we are now working
on (see Bloom, Liang, Roberts & Ying, 2011). More generally, we hope our work
encourages other researchers to rigorously quantify further aspects of management
practices.
Fifth, we are experimenting on ways to bring our research into the classroom as a
possible complement to case study evidence. As a first step in this direction, we have
conducted in-depth interviews with multiple managerial figures (from the CEO down to
nurse managers) within a small sample of US and European hospitals for which a case
study existed. We are now using this type of material in specialized MBA and
management courses at Harvard and Stanford Business Schools and LSE, and we hope to
27
continue to develop the use of quantitative data on management as a support tool for the
class teaching.
Finally, we are currently working with the US Census Bureau to build large scale public
access management datasets. Based on the EBRD questions, a management survey on
around 48,000 plants was carried out in Spring 2011 and will be accessible by 2012 via
the Census Research Data Centers by researchers and matched into Census performance
data. We hope this will be the first of several such survey waves, slowly building large-
scale publicly accessible management panel datasets.
Conclusions
Studying the causes and implications of variation in productivity across firms has become
an important theme in social science. While several fields have been studying
management for many decades, economists have traditionally ignored management as a
driving factor explaining differences in productivity. We believe the discipline would
benefit from more interaction with the management field. We have started to bridge this
gap by developing a simple methodology to quantify some basic aspects of management
practices across sectors and countries, and use experiments to identify causal impact.
The patterns we find in our large samples of management data lead us to believe that an
important explanation for these large differences in productivity between firms and
countries are variations in management practices. These are hard, but not impossible, to
measure, and we hope the methodology we have developed will be refined and used by
other researchers to help draw the international map of management in finer detail in
additional countries, industries and practices. To facilitate this, this methodology and the
data we collected and used in this paper are also freely available on
www.worldmanagementsurvey.org.
From a policy perspective, several factors seem important in influencing management
quality. Product market competition has a critical influence in increasing aggregate
28
management quality by thinning the ranks of the badly managed and incentivizing the
survivors to improve (e.g. Bloom, Draca and Van Reenen, 2011). Indeed, much of the
cross-country variation in management appears to be due to the presence or absence of
this tail of bad performers. One reason for higher average management scores in the US
is that better managed firms appear to be rewarded more quickly with greater market
share and the worse managed forced to rapidly shrink and exit. This appears to have led
American firms to rapidly copy management best practices from around the world, with
most large US manufacturing firms now routinely adopting Japanese-originated Lean
manufacturing.
We have also uncovered many other policy relevant effects. For example, taxes and other
distortive policies that favor family run firms appear to hinder better management, while
general education and multinational presence seem valuable in improving management
practices.
The patterns described here support many new theories developed to explain productivity
dispersion, but they also pose many puzzles. So the empirical and theoretical foundations
of management economics should continue to be a fertile and exciting area for future
research.
29
REFERENCES
Appelbaum, E., & Batt, R. L. (1994). The new American workplace: transforming work
systems in the United States. Ithaca, NY: ILR Press.
Barney, J. B., & Arikan, A. M. (2001). The resource-based view origins and implications.
In M. A. Hitt, R. E. Freeman & J. S. Harrison (Eds.), The Blackwell handbook of
strategic management (Chapter 5). Oxford, UK; Malden, MA: Blackwell.
Barney, J. B., & Griffin, R. W. (1992). The management of organizations: Strategy,
structure, behavior. Boston: Houghton Mifflin Co.
Becker, B. E., & Huselid, M. A. (1998). High performance work systems and firm
performance: A synthesis of research and managerial implications. Research in
Personnel and Human Resources Journal, 16(1), 53–101.
Becker, M. C. (2004). Organizational routines: A review of the literature. Industrial and
Corporate Change, 13(4), 643–678.
Bloom,N. Draca, M. and Van Reenen, J. (2011) “Trade induced technical change? The
impact of Chinese imports on Innovation, IT and Productivity” Centre for
Economic Performance Discussion Paper No. 1000.
Bloom, N., Eifert, B., Mahajan, A., McKenzie, D., & Roberts, J. (2011). Does
management matter? Evidence from india. National Bureau of Economic
Research Working Paper Series, No. 16658. Retrieved from
http://www.nber.org/papers/w16658.pdf
Bloom, N., Genakos, C., Martin, R., & Sadun, R. (2010). Modern management: Good for
the environment or just hot air? The Economic Journal, 120(544), 551–572.
30
Bloom, N., Kretschmer, T., & Van Reenen, J. (2011). Are family-friendly workplace
practices a valuable firm resource? Strategic Management Journal, 32(4), 343–
367.
Bloom, N., Liang, J., Roberts., J and Ying, Z. (2011). Can IT improve work-life balance?
Evidence from a Chinese field experiment. Stanford mimeo.
Bloom, N., Propper, C., Seiler, S., & Van Reenen, J. (2010). The impact of competition
on management quality: Evidence from public hospitals. National Bureau of
Economic Research Working Paper Series, No. 16032.
Bloom, N., Sadun, R., & Van Reenen, J. (2009b). Do private equity-owned firms have
better management practices? In A. Gurung & J. Lerner (Eds.), The Global
Economic Impact of Private Equity Report 2009 (pp. 1–23). Geneva, Switzerland:
World Economic Forum. Available from
http://www.weforum.org/pdf/cgi/pe/Full_Report2.pdf
Bloom, Nicholas, Raffaella Sadun, and John Van Reenen. (2009a). “The Organization of
Firms across Countries.” National Bureau of Economic Research Working Paper
Series, No.15129. Retrieved from http://www.nber.org/papers/w15129.pdf
Bloom, Nicholas, Raffaella Sadun, and John Van Reenen. (2012). “Americans do I.T.
better: US multinationals and the productivity miracle”, forthcomming American
Economic Review.
Bloom, N., Schweiger, H., & Van Reenen, J. (2011). The land that lean manufacturing
forgot? Management practices in transition countries. National Bureau of
Economic Research Working Paper Series, No. 17231.
31
Bloom, N., & Van Reenen, J. (2007). Measuring and explaining management practices
across firms and countries. Quarterly Journal of Economics, 122(4), 1351–1408.
Bloom, N., & Van Reenen, J. (2011) “Human Resource Management and Productivity”,
Handbook of Labor Economics Volume 4B in Orley Ashenfelter and David Card
(eds), Chapter 19 1697-1769.
Boeker, W and Karichalil, R. (2002). Entrepreneurial Transitions: Factors Influencing
Founder Departure. The Academy of Management Journal. 45(4), 818-826.
Cumming, D., Siegel, D. S., & Wright, M. (2007). Private equity, leveraged buyouts and
governance. Journal of Corporate Finance, 13(4), 439–460.
Davila, A., Foster, G., & Jia, N. (2010). Building sustainable high-growth startup
companies: Management systems as an accelerator. California Management
Review, 52(3), 79–105.
Delery, J. E., & Doty, D. H. (1996). Modes of theorizing in strategic human resource
management: Tests of universalistic, contingency, and configurations.
Performance predictions. Academy of Management Journal, 39(4), 802–835.
Delfgaauw, J., Dur, R., Proper, C. and Smith, S. (2011), “Management practices: are not
for profits different?”, CMPO working paper 11/263.
Dohrmann, T. and G. Pinshaw. 2009. The road to improved compliance: A McKinsey
benchmarking study of tax administrations 2008-2009. New York: McKinsey &
Company.
Eisenhardt, K. M., & Martin, J. A. (2000). Dynamic capabilities: What are they?
Strategic Management Journal, 21(10/11), 1105–1121.
32
Foster, L., Haltiwanger, J., & Krizan, C. J. (2006). Market selection, reallocation, and
restructuring in the U.S. Retail trade sector in the 1990s. Review of Economics &
Statistics, 88(4), 748–758.
Foster, L., Haltiwanger, J., & Syverson, C. (2008). Reallocation, firm turnover, and
efficiency: Selection on productivity or profitability? American Economic Review,
98(1), 394–425.
Grous, A. (2011) “Management Practices in the UK Aerospace Sector”, LSE mimeo
Greene, William, (2002). Econometric Analysis (fifth edition). Prentice Hall
Harris, R., Siegel, D. S., & Wright, M. (2005). Assessing the impact of management
buyouts on economic efficiency: Plant-level evidence from the United Kingdom.
Review of Economics & Statistics, 87(1), 148–153.
Homkes, Rebecca. 2011. The missing management link: Why Management Matters in
global public-private partnerships, LSE mimeo
Hoxby, C. M. (2000). Does competition among public schools benefit students and
taxpayers? American Economic Review, 90(5), 1209–1238.
House, R. J., Hanges, P.M., Javidan, M., Dorfman, P., and Gupta, V. (2004). Culture,
leadership, and organizations: The GLOBE study of 62 societies. Thousand
Oaks, CA: SAGE Publications.
Huselid, M. A., & Becker, B. E. (1996). Methodological issues in cross-sectional and
panel estimates of the human resource-firm performance. Industrial Relations,
35(3), 400–422.
33
Ichniowski, C., Shaw, K., & Prennushi, G. (1997). The effects of human resource
management practices on productivity: A study of steel finishing lines. The
American Economic Review, 87(3), 291–313.
Javidan, M., Dorfman, P., Sully de Luque, M., & House, R. J. (2006). In the eye of the
beholder: Cross-cultural lessons in leadership from Project GLOBE. Academy of
Management Perspectives, 20(3): 67–91.
Lengnick-Hall, M. L., Lengnick-Hall, C. A., Andrade, L. S., & Drake, B. (2009).
Strategic human resource management: The evolution of the field. Human
Resource Management Review, 19(2), 64–85.
Lepak, D. P., Liao, H., Chung, Y., & Harden, E. (2006). A conceptual review of human
resource management systems in strategic human resource management research.
In J. Martocchio (Ed.), Research in personnel and human resource management
(pp. 217–271). Stamford, CT: JAI Press.
Lichtenberg, F. R., & Siegel, D. (1990). The effects of leveraged buyouts on productivity
and related aspects of firm behavior. Journal of Financial Economics, 27(1), 165–
194.
Macduffie, J. P. (1995). Human resource bundles and manufacturing performance:
Organizational logic and flexible production systems in the world auto industry.
Industrial & Labor Relations Review, 48(2), 197–221.
McConnell, J., Hoffman, K., Quanbeck., A, and McCarty, D. (2009). Management
practices in substance abuse treatment programs. Journal of Substance Abuse.
34
McNally, S. (2010). Evaluating education policies: The evidence from economic
research. CEP Election Analysis, (Paper No: CEPEA008). Retrieved from
http://cep.lse.ac.uk/pubs/download/ea008.pdf
McKinsey & Company. 2009. “Management Matters in Northern Ireland and the
Republic of Ireland.”, http://www.delni.gov.uk/managementmatters
Nelson, R. R., & Winter, S. G. (1982). An evolutionary theory of economic change.
Cambridge, MA: Belknap Press of Harvard University Press.
Osterman, P. (1994). How common is workplace transformation and who adopts it?
Industrial & Labor Relations Review, 47(2), 173–188.
Pfeffer, J. (1999a). Seven practices of successful organizations. Health Forum Journal,
42(1), 24–27.
Pfeffer, J. (1999b). Seven practices of successful organizations: Part 2: Invest in training
reduce status differences don’t keep secrects. Health Forum Journal, 42(2), 55.
Pfeffer, J., & Veiga, J. F. (1999). Putting people first for organizational success. Academy
of Management Executive, 13(2), 37–48.
Siegel, Jordan I., Amir N. Licht, and Shalom H. Schwartz. (2011). "Egalitarianism and
International Investment." Journal of Financial Economics (forthcoming).
Siegel, D. S. & Simons. K. (2010). Assessing the effects of mergers and acquisitions on
firm performance, plant productivity, and workers: New evidence from matched
employer-employee data. Strategic Management Journal, 31, 903-916
Skinner, J., & Staiger, D. (2009). Technology diffusion and productivity growth in health care. National Bureau of Economic Research Working Paper Series, (No. 14865). Retrieved from http://www.nber.org/papers/w14865.pdfSyverson, Chad (2011) “What determines productivity?”, Journal of Economic Literature, 49(2) 326–365
35
Washburn, N., Waldman, D, Sully de Luque, M. (2009). Agents behaving like stewards:
Executive discretion and the display of steward behaviors. Paper presented at the
69th Annual Meeting of the Academy of Management, Chicago, IL, August.
Winter, S. G. (2003). Understanding Dynamic Capabilities. Strategic Management
Journal, 24(10), 991–995.
Woodward, J. (1958). Management and technology. London: H. M. Stationery Office.
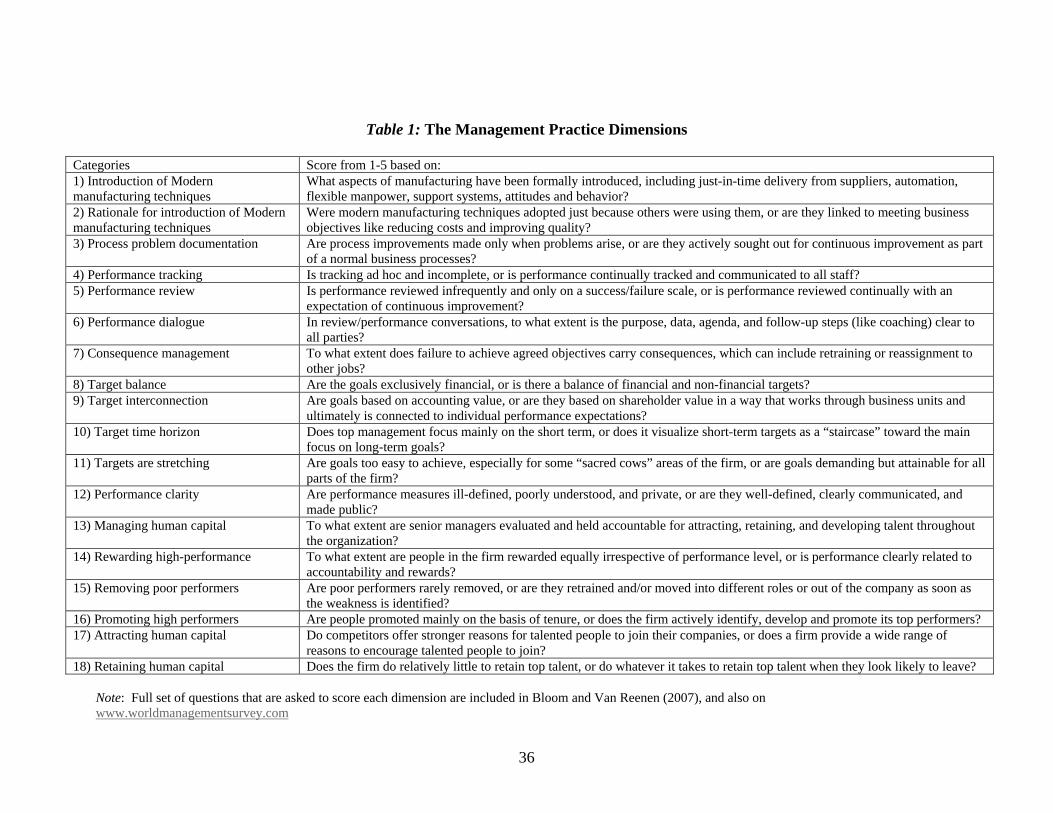
36
Table 1: The Management Practice Dimensions
Categories Score from 1-5 based on: 1) Introduction of Modern manufacturing techniques
What aspects of manufacturing have been formally introduced, including just-in-time delivery from suppliers, automation, flexible manpower, support systems, attitudes and behavior?
2) Rationale for introduction of Modern manufacturing techniques
Were modern manufacturing techniques adopted just because others were using them, or are they linked to meeting business objectives like reducing costs and improving quality?
3) Process problem documentation Are process improvements made only when problems arise, or are they actively sought out for continuous improvement as part of a normal business processes?
4) Performance tracking Is tracking ad hoc and incomplete, or is performance continually tracked and communicated to all staff? 5) Performance review Is performance reviewed infrequently and only on a success/failure scale, or is performance reviewed continually with an
expectation of continuous improvement? 6) Performance dialogue In review/performance conversations, to what extent is the purpose, data, agenda, and follow-up steps (like coaching) clear to
all parties? 7) Consequence management To what extent does failure to achieve agreed objectives carry consequences, which can include retraining or reassignment to
other jobs? 8) Target balance Are the goals exclusively financial, or is there a balance of financial and non-financial targets? 9) Target interconnection Are goals based on accounting value, or are they based on shareholder value in a way that works through business units and
ultimately is connected to individual performance expectations? 10) Target time horizon Does top management focus mainly on the short term, or does it visualize short-term targets as a “staircase” toward the main
focus on long-term goals? 11) Targets are stretching Are goals too easy to achieve, especially for some “sacred cows” areas of the firm, or are goals demanding but attainable for all
parts of the firm? 12) Performance clarity Are performance measures ill-defined, poorly understood, and private, or are they well-defined, clearly communicated, and
made public? 13) Managing human capital To what extent are senior managers evaluated and held accountable for attracting, retaining, and developing talent throughout
the organization? 14) Rewarding high-performance To what extent are people in the firm rewarded equally irrespective of performance level, or is performance clearly related to
accountability and rewards? 15) Removing poor performers Are poor performers rarely removed, or are they retrained and/or moved into different roles or out of the company as soon as
the weakness is identified? 16) Promoting high performers Are people promoted mainly on the basis of tenure, or does the firm actively identify, develop and promote its top performers? 17) Attracting human capital Do competitors offer stronger reasons for talented people to join their companies, or does a firm provide a wide range of
reasons to encourage talented people to join? 18) Retaining human capital Does the firm do relatively little to retain top talent, or do whatever it takes to retain top talent when they look likely to leave?
Note: Full set of questions that are asked to score each dimension are included in Bloom and Van Reenen (2007), and also on www.worldmanagementsurvey.com
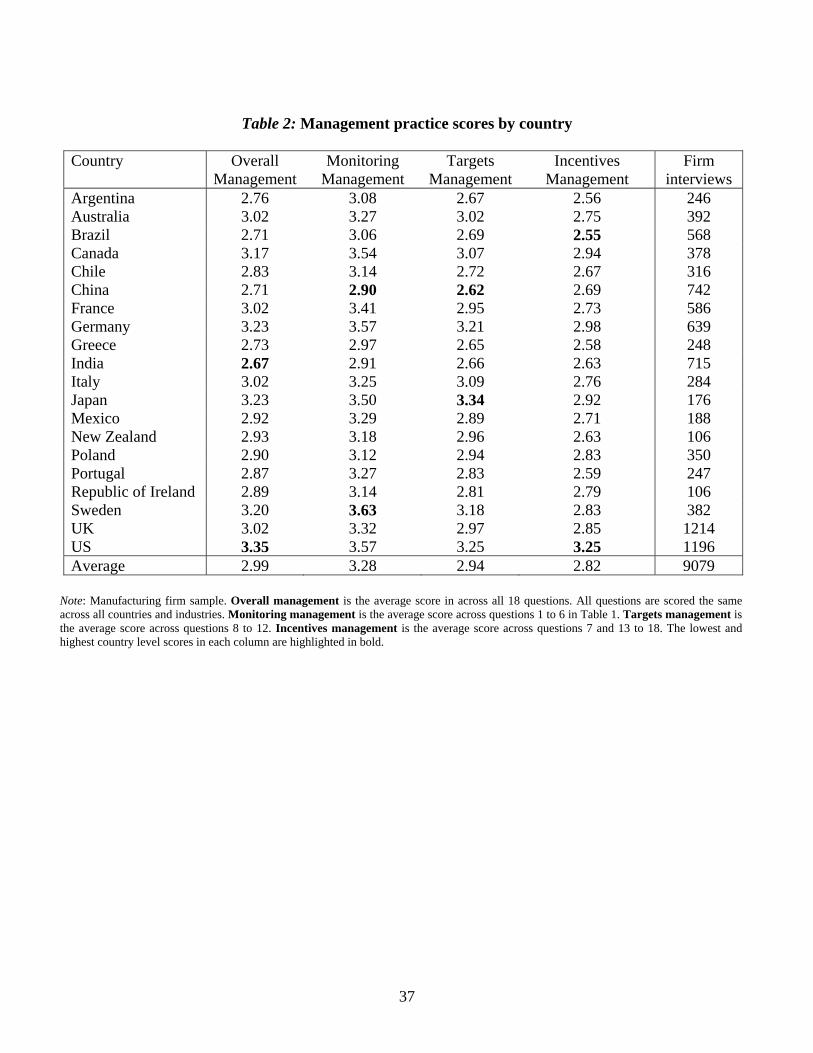
37
Table 2: Management practice scores by country
Country Overall
Management Monitoring
Management Targets
ManagementIncentives
Management Firm
interviews Argentina 2.76 3.08 2.67 2.56 246 Australia 3.02 3.27 3.02 2.75 392 Brazil 2.71 3.06 2.69 2.55 568 Canada 3.17 3.54 3.07 2.94 378 Chile 2.83 3.14 2.72 2.67 316 China 2.71 2.90 2.62 2.69 742 France 3.02 3.41 2.95 2.73 586 Germany 3.23 3.57 3.21 2.98 639 Greece 2.73 2.97 2.65 2.58 248 India 2.67 2.91 2.66 2.63 715 Italy 3.02 3.25 3.09 2.76 284 Japan 3.23 3.50 3.34 2.92 176 Mexico 2.92 3.29 2.89 2.71 188 New Zealand 2.93 3.18 2.96 2.63 106 Poland 2.90 3.12 2.94 2.83 350 Portugal 2.87 3.27 2.83 2.59 247 Republic of Ireland 2.89 3.14 2.81 2.79 106 Sweden 3.20 3.63 3.18 2.83 382 UK 3.02 3.32 2.97 2.85 1214 US 3.35 3.57 3.25 3.25 1196 Average 2.99 3.28 2.94 2.82 9079
Note: Manufacturing firm sample. Overall management is the average score in across all 18 questions. All questions are scored the same across all countries and industries. Monitoring management is the average score across questions 1 to 6 in Table 1. Targets management is the average score across questions 8 to 12. Incentives management is the average score across questions 7 and 13 to 18. The lowest and highest country level scores in each column are highlighted in bold.
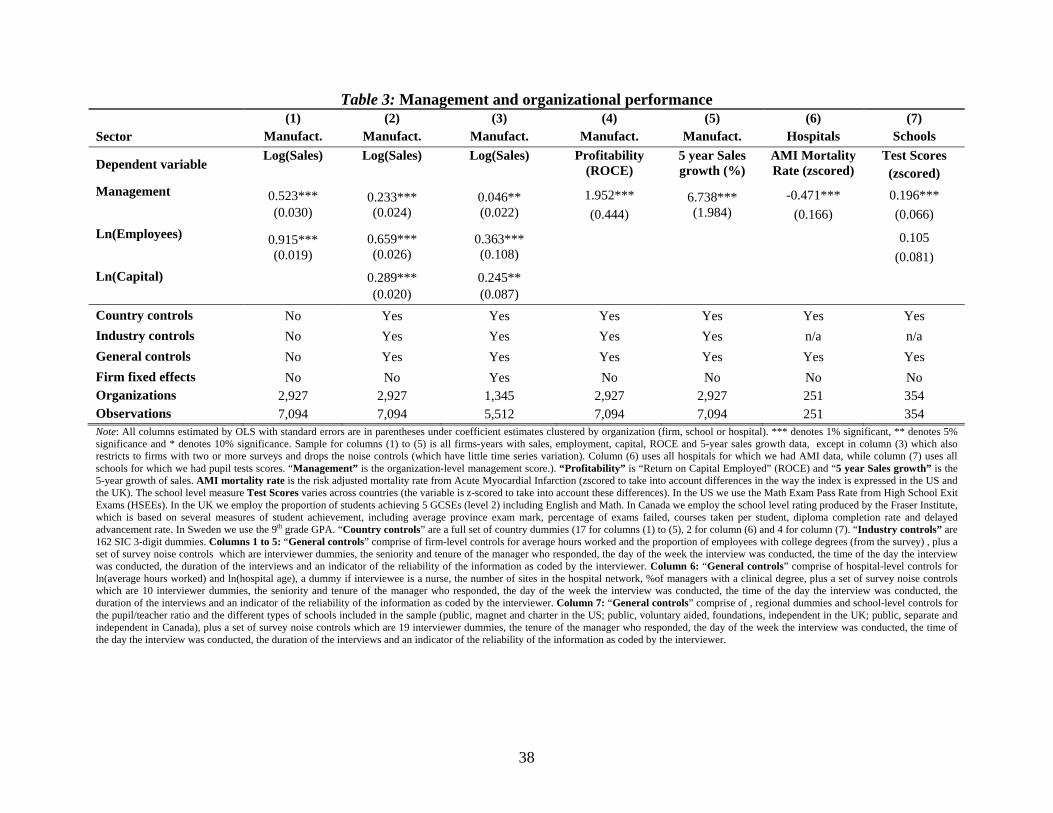
38
Table 3: Management and organizational performance (1) (2) (3) (4) (5) (6) (7) Sector Manufact. Manufact. Manufact. Manufact. Manufact. Hospitals Schools
Dependent variable Log(Sales) Log(Sales) Log(Sales) Profitability
(ROCE) 5 year Sales growth (%)
AMI Mortality Rate (zscored)
Test Scores (zscored)
Management
0.523*** (0.030)
0.233*** (0.024)
0.046** (0.022)
1.952***
(0.444) 6.738*** (1.984)
-0.471***
(0.166)
0.196***
(0.066)
Ln(Employees) 0.915*** (0.019)
0.659*** (0.026)
0.363*** (0.108)
0.105
(0.081)
Ln(Capital) 0.289*** (0.020)
0.245** (0.087)
Country controls No Yes Yes Yes Yes Yes Yes
Industry controls No Yes Yes Yes Yes n/a n/a
General controls No Yes Yes Yes Yes Yes Yes
Firm fixed effects No No Yes No No No No Organizations 2,927 2,927 1,345 2,927 2,927 251 354 Observations 7,094 7,094 5,512 7,094 7,094 251 354 Note: All columns estimated by OLS with standard errors are in parentheses under coefficient estimates clustered by organization (firm, school or hospital). *** denotes 1% significant, ** denotes 5% significance and * denotes 10% significance. Sample for columns (1) to (5) is all firms-years with sales, employment, capital, ROCE and 5-year sales growth data, except in column (3) which also restricts to firms with two or more surveys and drops the noise controls (which have little time series variation). Column (6) uses all hospitals for which we had AMI data, while column (7) uses all schools for which we had pupil tests scores. “Management” is the organization-level management score.). “Profitability” is “Return on Capital Employed” (ROCE) and “5 year Sales growth” is the 5-year growth of sales. AMI mortality rate is the risk adjusted mortality rate from Acute Myocardial Infarction (zscored to take into account differences in the way the index is expressed in the US and the UK). The school level measure Test Scores varies across countries (the variable is z-scored to take into account these differences). In the US we use the Math Exam Pass Rate from High School Exit Exams (HSEEs). In the UK we employ the proportion of students achieving 5 GCSEs (level 2) including English and Math. In Canada we employ the school level rating produced by the Fraser Institute, which is based on several measures of student achievement, including average province exam mark, percentage of exams failed, courses taken per student, diploma completion rate and delayed advancement rate. In Sweden we use the 9th grade GPA. “Country controls” are a full set of country dummies (17 for columns (1) to (5), 2 for column (6) and 4 for column (7). “Industry controls” are 162 SIC 3-digit dummies. Columns 1 to 5: “General controls” comprise of firm-level controls for average hours worked and the proportion of employees with college degrees (from the survey) , plus a set of survey noise controls which are interviewer dummies, the seniority and tenure of the manager who responded, the day of the week the interview was conducted, the time of the day the interview was conducted, the duration of the interviews and an indicator of the reliability of the information as coded by the interviewer. Column 6: “General controls” comprise of hospital-level controls for ln(average hours worked) and ln(hospital age), a dummy if interviewee is a nurse, the number of sites in the hospital network, %of managers with a clinical degree, plus a set of survey noise controls which are 10 interviewer dummies, the seniority and tenure of the manager who responded, the day of the week the interview was conducted, the time of the day the interview was conducted, the duration of the interviews and an indicator of the reliability of the information as coded by the interviewer. Column 7: “General controls” comprise of , regional dummies and school-level controls for the pupil/teacher ratio and the different types of schools included in the sample (public, magnet and charter in the US; public, voluntary aided, foundations, independent in the UK; public, separate and independent in Canada), plus a set of survey noise controls which are 19 interviewer dummies, the tenure of the manager who responded, the day of the week the interview was conducted, the time of the day the interview was conducted, the duration of the interviews and an indicator of the reliability of the information as coded by the interviewer.
39
Appendix A: Extensive details of the survey procedure are contained in Bloom and Van Reenen (2007), which we summarize and update below. Sample Population: The manufacturing management survey was targeted at the population of firms with 100 to 5000 employees across 20 countries. These populations of firms were drawn from national firm databases and company registries – for example, Companies House in the UK, Dunn and Bradstreet in the US and the Registrar of Companies in India. From comparisons with national census databases these firm populations appear to provide good coverage (50% of more) in every country we analyze. Survey organization: We ran management surveys primarily from the London School of Economics during the summer. The reason is we can obtain space for the survey team (class-rooms are empty in the summer) and hire high quality survey team members (MBA and PhD students during their summer break). London is an excellent survey location because it lies midway between the US and Asian time-zones and is in the European time-zone, and it is easy to hire interviewers with a range of language skills. We organized the survey team into groups, with four interviewers in each group overseen by a group manager. The interviewers were paid by interview completed with the group manager silently listening in to each interview to ensure interview quality. The group managers were people we could trust, such ourselves or PhD students. After some initial experimentation we found this combination of piece-rate pay for the interviewers with extensive monitoring to be particularly effective in both generating a large number of interviews and ensuring high interview quality (since the group managers would provide feedback after each interview). Cross-country management calibration We operated the survey team from one location to harmonize cross country data comparison. In particular all team members had the same initial training, they all sat in one large survey room and they all attended weekly survey calibration meetings at which we would collectively discuss one interview and compare scores. Interviewers were also all required to run 10 interviews in at least two different countries. This typically involved running 10 or more interviews in each of the UK and US (since all interviewers spoke English) plus at least one other country (for example France for the French speaking interviewers). As a result our median interviewer ran interviews on managers in three different countries. Hence, when we report low management scores in Indian firms this is based on the survey evidence from interviewers who are regularly using the same grid to interview managers in India, the UK and the US, so are well positioned to make an accurate international assessment. Finally, 25.4% of our sample are affiliates of foreign multinationals – for example, a Japanese owned firm operating in France. These firms were always interviewed in the
40
native language (French in this example) but we can also compare their management practices to those of their parent country (Japan in our example). We found interestingly that multinational subsidiaries tend to adopt about 50% of their practices from their country of location and about 50% from their country of origin. This suggests that our methodology is able to pick up cross-country differences in management practices despite the language of the interview, the location of the firm and the nationality of our interviewer. In our example, despite interviewing a French MBA student interviewing a French manager (in French) in a firm located in France we would still find on average a significant number of Japanese management practices being adopted in this firm when it is owned by a Japanese parent company. Variation of management practices by country, industry and firm Overall we find that in our manufacturing sample that around 11.1% of our management practices can be explained by country of location and about 11.9% by industry of operation (using 254 SIC 1987 3-digit industry codes). Hence, the majority of the variation in management practices cannot be explained by either country or industry. In part this presumably reflects the presence of substantial measurement error in our management scores. But in part it probably reflects the large variation in management practices in firms operating in the same country and industry, consistent with the incredibly dispersion of productivity of firms in these country-industry cells reported by Foster, Haltiwanger, and Syverson (2008) and others.
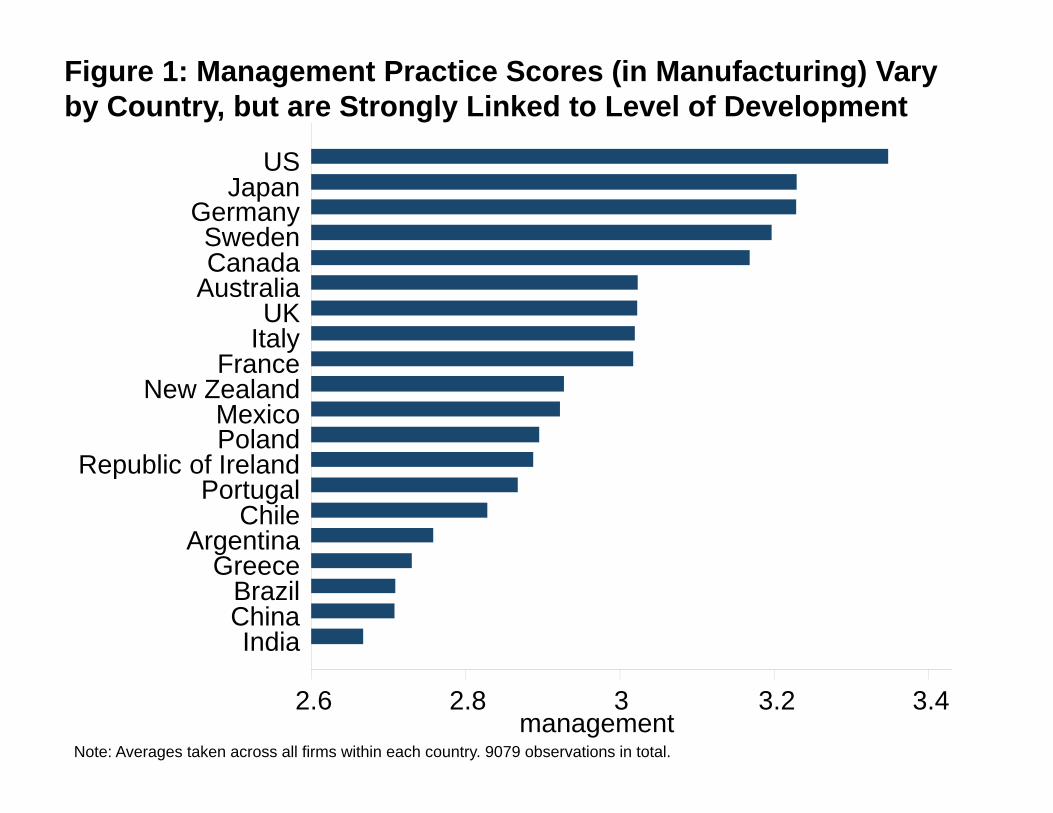
Figure 1: Management Practice Scores (in Manufacturing) Vary by Country, but are Strongly Linked to Level of Development
Note: Averages taken across all firms within each country. 9079 observations in total.
2.6 2.8 3 3.2 3.4management
USJapan
GermanySwedenCanada
AustraliaUK
ItalyFrance
New ZealandMexicoPoland
Republic of IrelandPortugal
ChileArgentina
GreeceBrazilChinaIndia
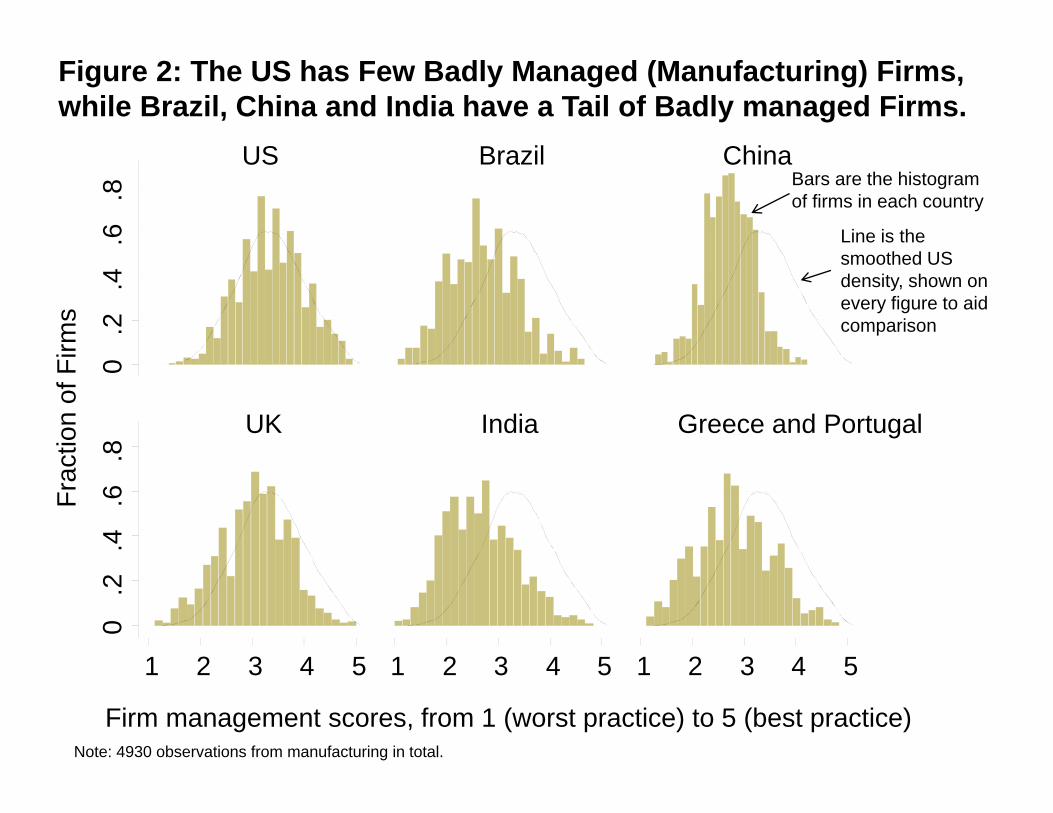
Figure 2: The US has Few Badly Managed (Manufacturing) Firms, while Brazil, China and India have a Tail of Badly managed Firms.
Fra
ctio
n of
Firm
s
Firm management scores, from 1 (worst practice) to 5 (best practice)
0.2
.4.6
.80
.2.4
.6.8
1 2 3 4 5 1 2 3 4 5 1 2 3 4 5
US Brazil China
UK India Greece and Portugal
Line is the smoothed US density, shown on every figure to aid comparison
Bars are the histogram of firms in each country
Note: 4930 observations from manufacturing in total.
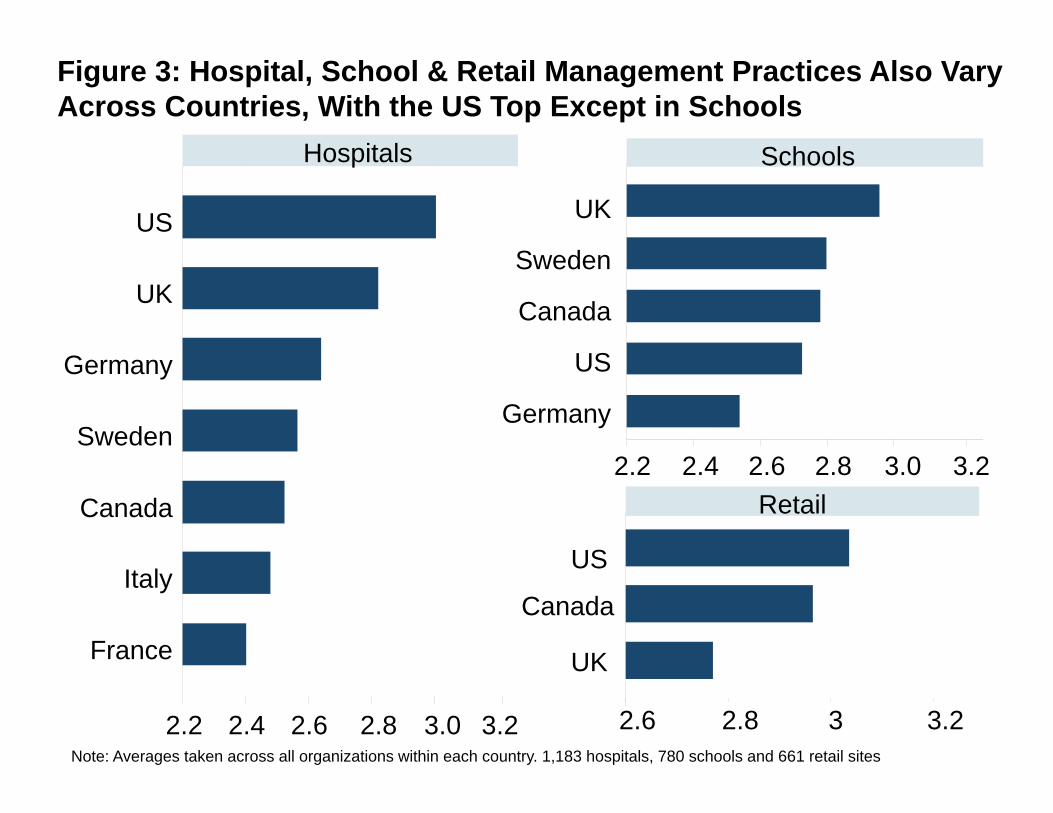
US
UK
Germany
Sweden
Canada
Italy
France
Hospitals
2.2 2.4 2.6 2.8 3.0 3.2
Figure 3: Hospital, School & Retail Management Practices Also Vary Across Countries, With the US Top Except in Schools
Note: Averages taken across all organizations within each country. 1,183 hospitals, 780 schools and 661 retail sites
2.2 2.4 2.6 2.8 3.0 3.2
UK
Sweden
Canada
US
Germany
Schools
Canada
2.6 2.8 3 3.2
US
UK
Retail
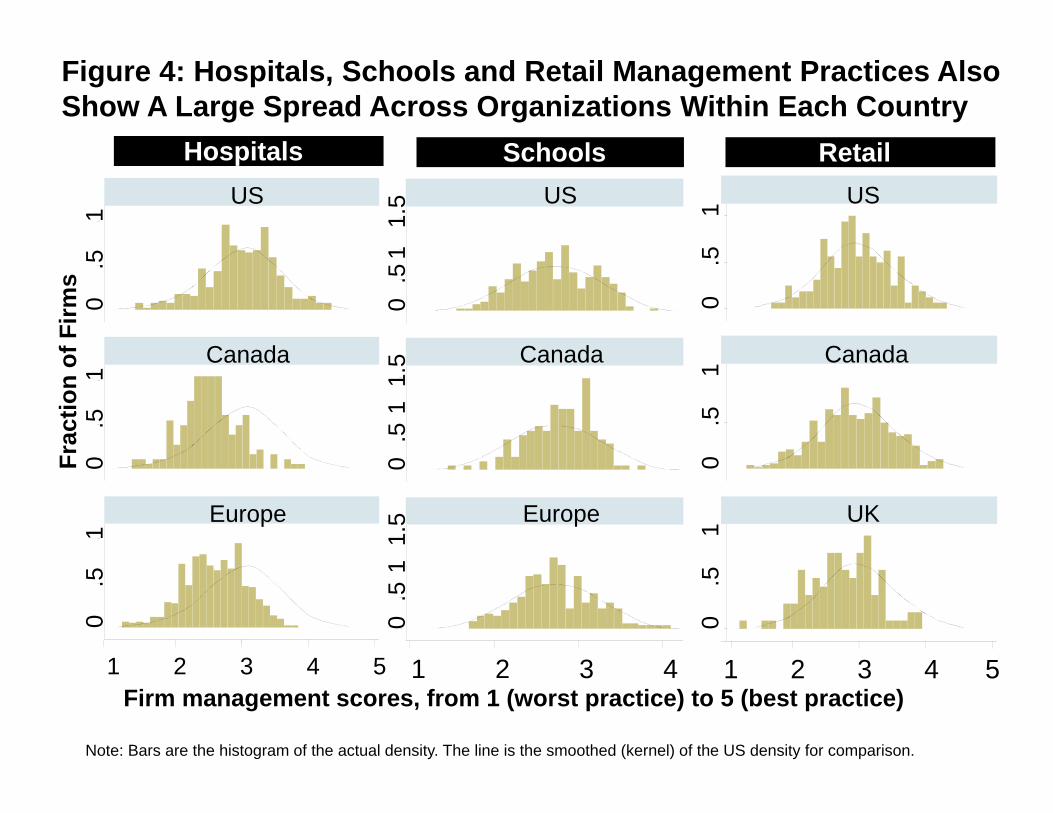
Frac
tion
of F
irms
Firm management scores, from 1 (worst practice) to 5 (best practice)
Note: Bars are the histogram of the actual density. The line is the smoothed (kernel) of the US density for comparison.
0.5
10
.51
0.5
1
1 2 3 4 5
US
Canada
UK
Retail
0.5
11.
50
.51
1.5
0.5
11.
5
1 2 3 4
US
Canada
Europe
Schools
0.5
10
.51
0.5
1
1 2 3 4 5
US
Canada
Europe
Hospitals
Figure 4: Hospitals, Schools and Retail Management Practices Also Show A Large Spread Across Organizations Within Each Country
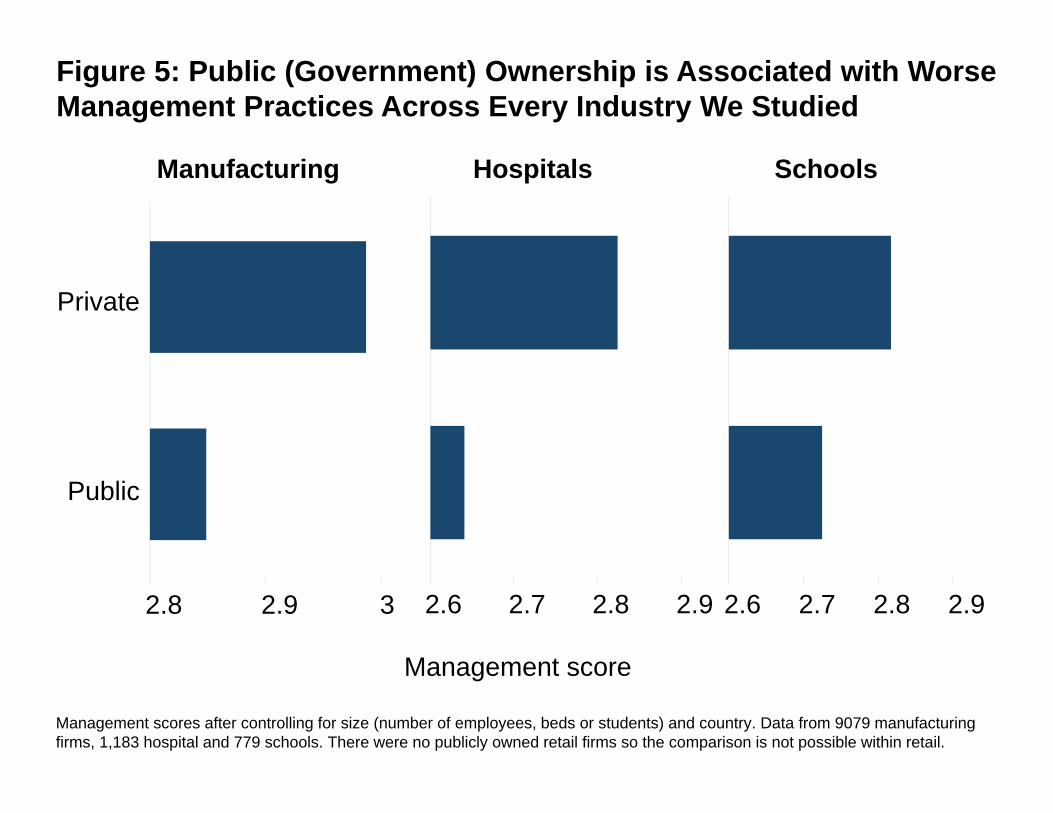
Management scores after controlling for size (number of employees, beds or students) and country. Data from 9079 manufacturing firms, 1,183 hospital and 779 schools. There were no publicly owned retail firms so the comparison is not possible within retail.
Management score
Hospitals
2.6 2.7 2.8 2.9
Public
Private
Schools
2.6 2.7 2.8 2.9
Figure 5: Public (Government) Ownership is Associated with Worse Management Practices Across Every Industry We Studied
Manufacturing
2.8 2.9 3
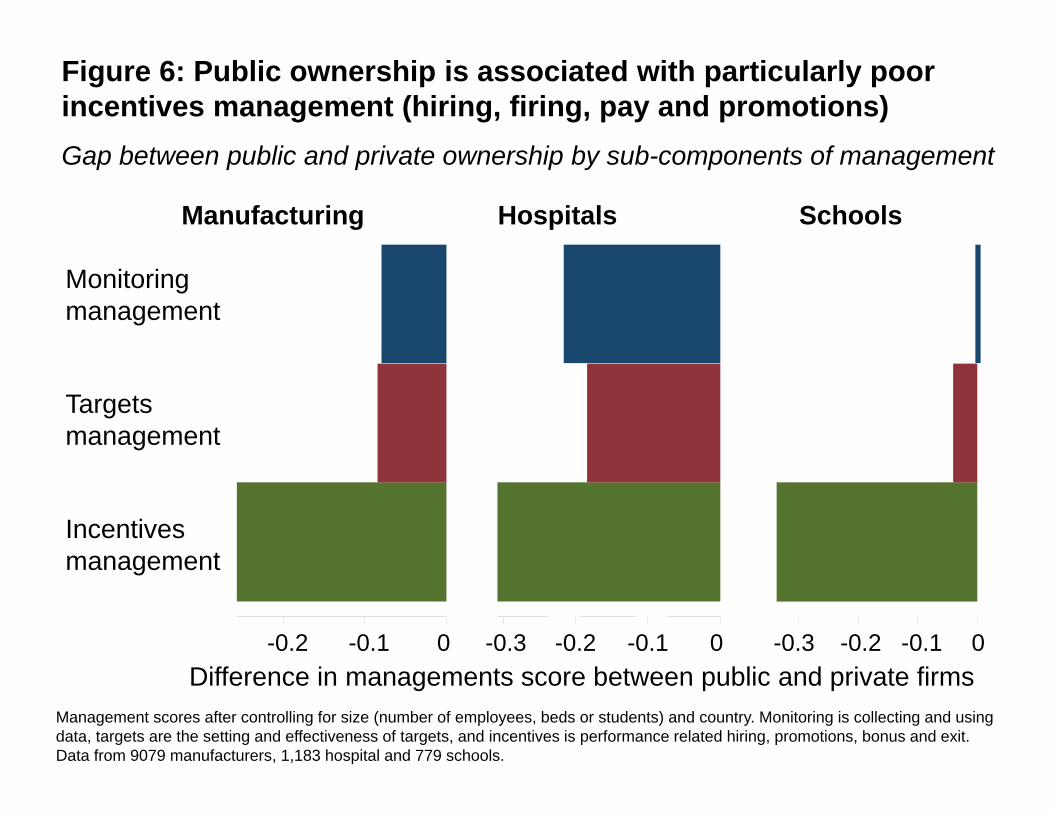
Figure 6: Public ownership is associated with particularly poor incentives management (hiring, firing, pay and promotions)
Monitoring management
Targetsmanagement
Incentivesmanagement
0-0.1-0.2 0-0.1-0.2-0.3 0-0.1-0.2-0.3
Hospitals SchoolsManufacturing
Gap between public and private ownership by sub-components of management
Management scores after controlling for size (number of employees, beds or students) and country. Monitoring is collecting and using data, targets are the setting and effectiveness of targets, and incentives is performance related hiring, promotions, bonus and exit. Data from 9079 manufacturers, 1,183 hospital and 779 schools.
Difference in managements score between public and private firms
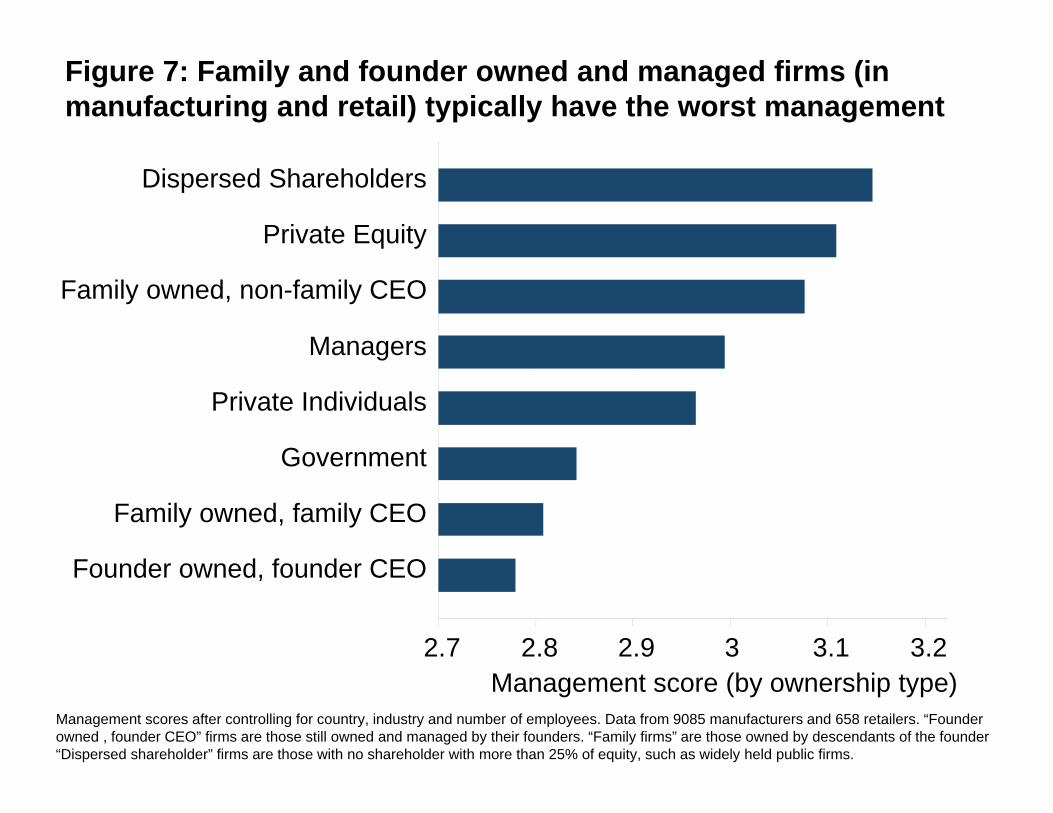
Figure 7: Family and founder owned and managed firms (in manufacturing and retail) typically have the worst management
2.7 2.8 2.9 3 3.1 3.2
Dispersed Shareholders
Private Equity
Family owned, non-family CEO
Managers
Private Individuals
Government
Family owned, family CEO
Founder owned, founder CEO
Management scores after controlling for country, industry and number of employees. Data from 9085 manufacturers and 658 retailers. “Founder owned , founder CEO” firms are those still owned and managed by their founders. “Family firms” are those owned by descendants of the founder “Dispersed shareholder” firms are those with no shareholder with more than 25% of equity, such as widely held public firms.
Management score (by ownership type)
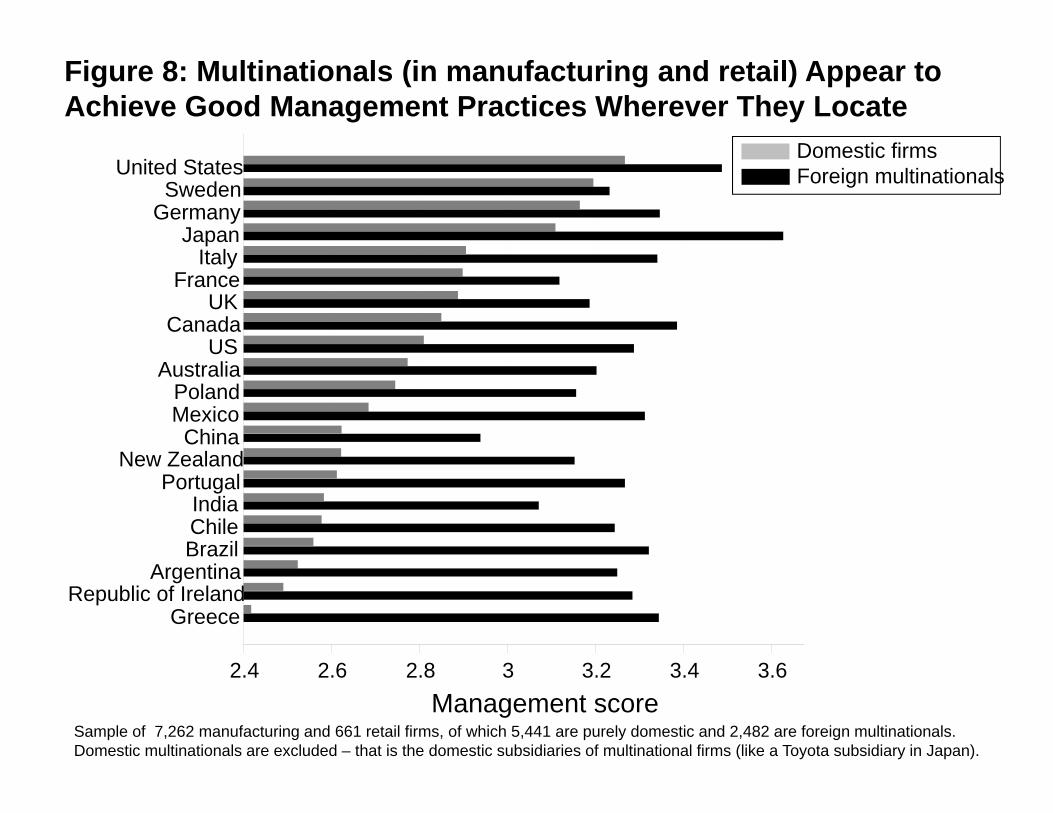
2.4 2.6 2.8 3 3.2 3.4 3.6
United StatesSweden
GermanyJapan
ItalyFrance
UKCanada
USAustralia
PolandMexico
ChinaNew Zealand
PortugalIndiaChileBrazil
ArgentinaRepublic of Ireland
Greece
Foreign multinationalsDomestic firms
Figure 8: Multinationals (in manufacturing and retail) Appear to Achieve Good Management Practices Wherever They Locate
Sample of 7,262 manufacturing and 661 retail firms, of which 5,441 are purely domestic and 2,482 are foreign multinationals.Domestic multinationals are excluded – that is the domestic subsidiaries of multinational firms (like a Toyota subsidiary in Japan).
Management score
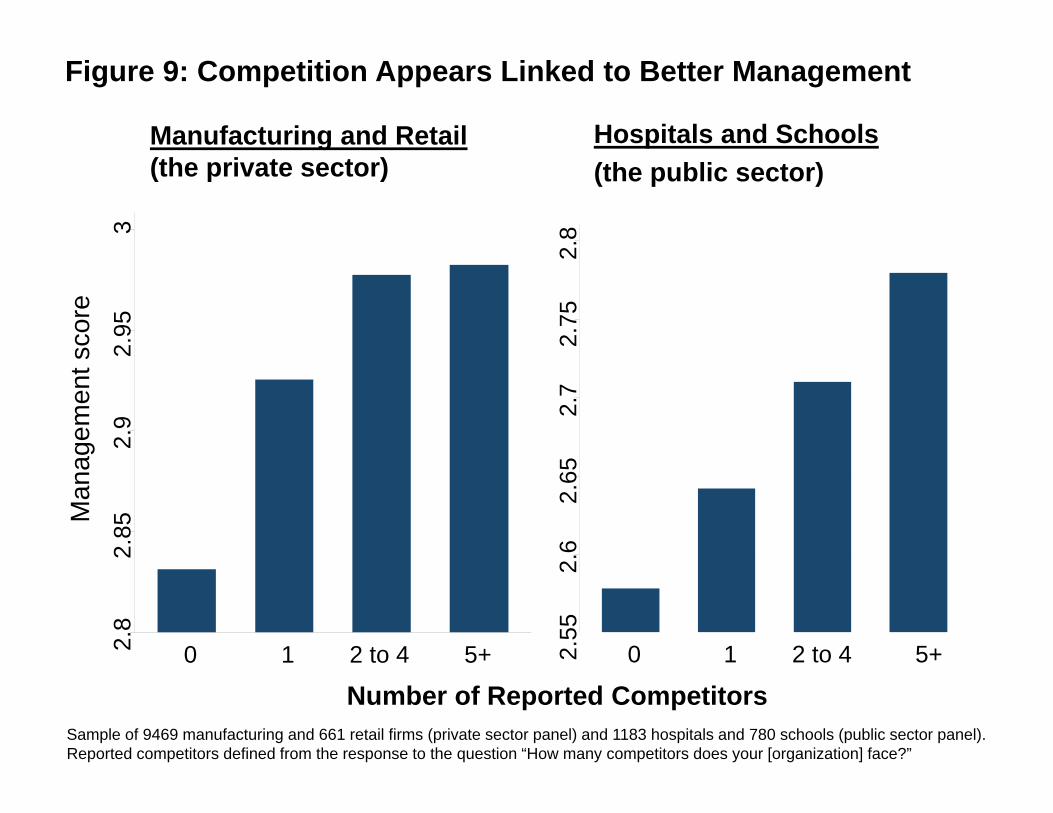
Figure 9: Competition Appears Linked to Better Management
Sample of 9469 manufacturing and 661 retail firms (private sector panel) and 1183 hospitals and 780 schools (public sector panel). Reported competitors defined from the response to the question “How many competitors does your [organization] face?”
2.55
2.6
2.65
2.7
2.75
2.8
0 1 2 to 4 5+2.8
2.85
2.9
2.95
3
0 1 2 to 4 5+
Manufacturing and Retail (the private sector)
Man
agem
ent s
core
Hospitals and Schools(the public sector)
Number of Reported Competitors
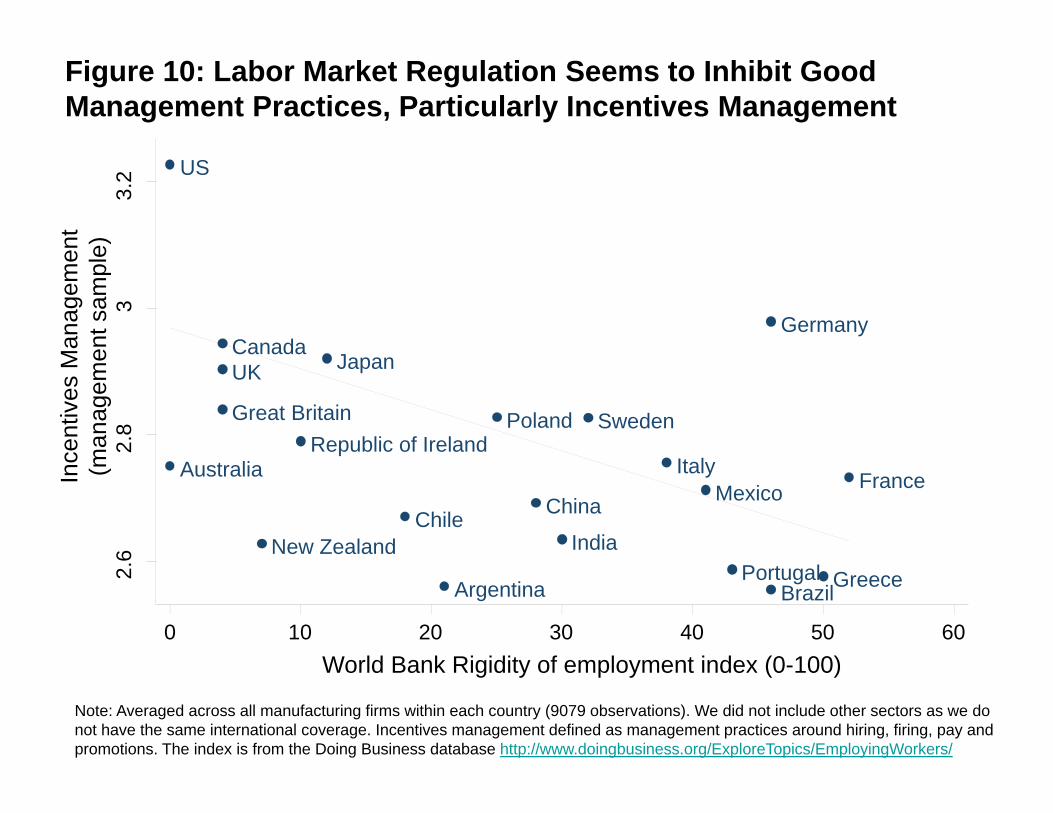
Figure 10: Labor Market Regulation Seems to Inhibit Good Management Practices, Particularly Incentives Management
Note: Averaged across all manufacturing firms within each country (9079 observations). We did not include other sectors as we donot have the same international coverage. Incentives management defined as management practices around hiring, firing, pay and promotions. The index is from the Doing Business database http://www.doingbusiness.org/ExploreTopics/EmployingWorkers/
Argentina
Australia
Brazil
Canada
ChileChina
France
Germany
Great Britain
Greece
India
Italy
Japan
Mexico
New Zealand
Poland
Portugal
Republic of IrelandSweden
UK
US
2.6
2.8
33.
2
0 10 20 30 40 50 60
World Bank Rigidity of employment index (0-100)
Ince
ntiv
es M
anag
emen
t (m
anag
emen
t sam
ple)
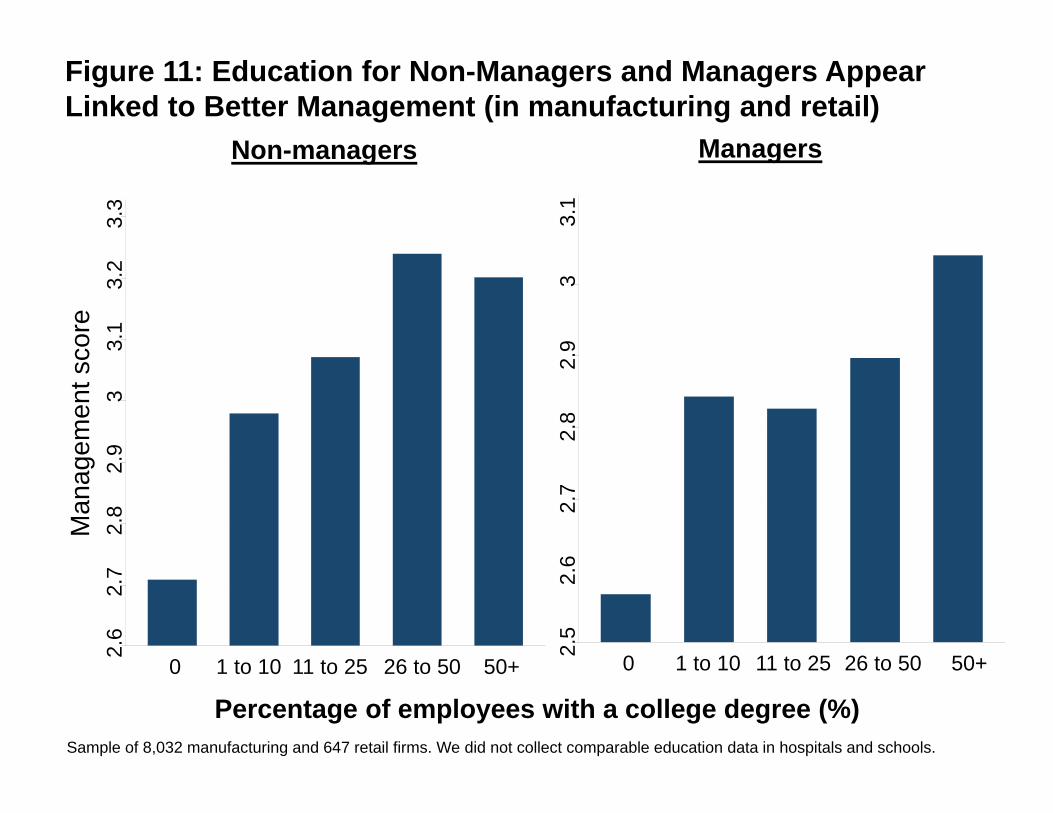
Figure 11: Education for Non-Managers and Managers Appear Linked to Better Management (in manufacturing and retail)
Sample of 8,032 manufacturing and 647 retail firms. We did not collect comparable education data in hospitals and schools.
Non-managers
Man
agem
ent s
core
Managers
Percentage of employees with a college degree (%)
2.6
2.7
2.8
2.9
33.
13.
23.
3
0 1 to 10 11 to 25 26 to 50 50+
2.5
2.6
2.7
2.8
2.9
33.
1
0 1 to 10 11 to 25 26 to 50 50+
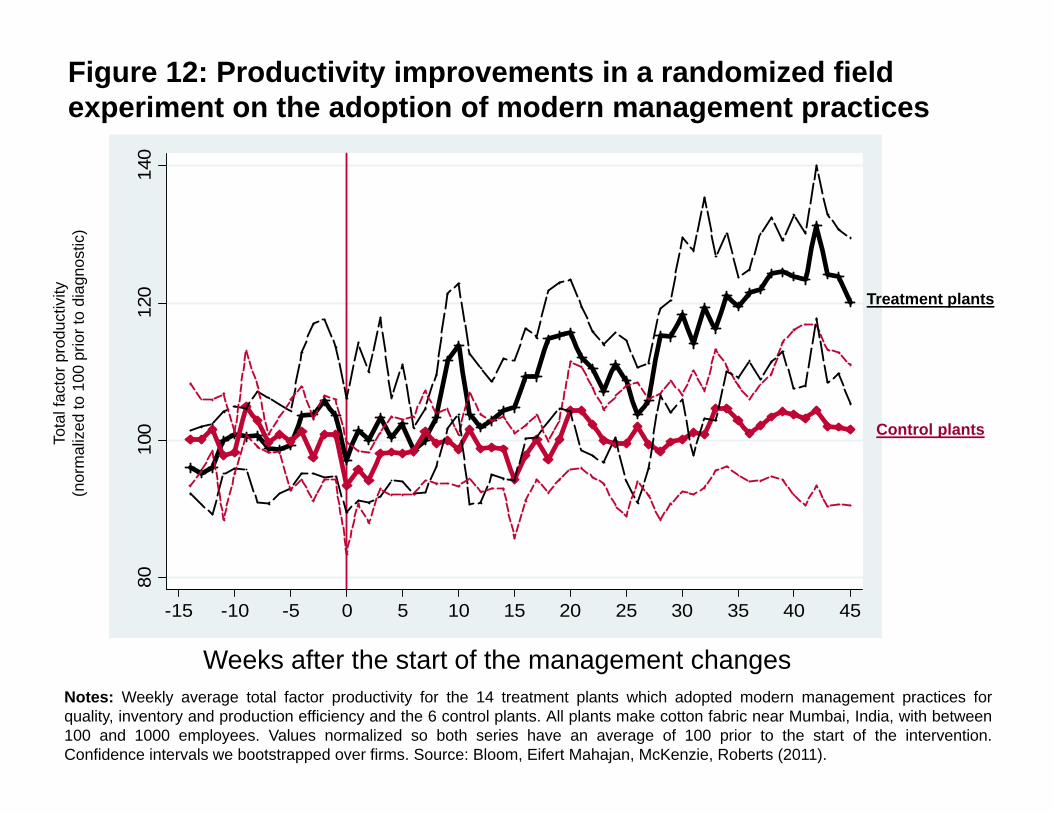
80
100
120
140
-15 -10 -5 0 5 10 15 20 25 30 35 40 45
Figure 12: Productivity improvements in a randomized field experiment on the adoption of modern management practices
Notes: Weekly average total factor productivity for the 14 treatment plants which adopted modern management practices forquality, inventory and production efficiency and the 6 control plants. All plants make cotton fabric near Mumbai, India, with between100 and 1000 employees. Values normalized so both series have an average of 100 prior to the start of the intervention.Confidence intervals we bootstrapped over firms. Source: Bloom, Eifert Mahajan, McKenzie, Roberts (2011).
Control plants
Treatment plants
Tota
l fac
tor
prod
uctiv
ity
(nor
mal
ized
to 1
00 p
rior
to d
iagn
ostic
)
Weeks after the start of the management changes
CENTRE FOR ECONOMIC PERFORMANCE
Recent Discussion Papers
1108 Khristian Behrens
Giordano Mion
Yasusada Murata
Jens Südekum
Spatial Frictions
1107 Andrea Ariu
Giordano Mion
Service Trade and Occupational Tasks: An
Empirical Investigation
1106 Verónica Amarante
Marco Manacorda
Edward Miguel
Andrea Vigorito
Do Cash Transfers Improve Birth Outcomes?
Evidence from Matched Vital Statistics,
Social Security and Program Data
1105 Thomas Sampson Assignment Reversals: Trade, Skill
Allocation and Wage Inequality
1104 Brian Bell
Stephen Machin
Immigrant Enclaves and Crime
1103 Swati Dhingra Trading Away Wide Brands for Cheap
Brands
1102 Francesco Caselli
Antonio Ciccone
A Note on Schooling in Development
Accounting
1101 Alan Manning
Barbara Petrongolo
How Local Are Labour Markets? Evidence
from a Spatial Job Search Model
1100 Fabrice Defever
Benedikt Heid
Mario Larch
Spatial Exporters
1099 John T. Addison
Alex Bryson
André Pahnke
Paulino Teixeira
Change and Persistence in the German Model
of Collective Bargaining and Worker
Representation
1098 Joan Costa-Font
Mireia Jofre-Bonet
Anorexia, Body Image and Peer Effects:
Evidence from a Sample of European Women
1097 Michal White
Alex Bryson
HRM and Workplace Motivation:
Incremental and Threshold Effects
1096 Dominique Goux
Eric Maurin
Barbara Petrongolo
Worktime Regulations and Spousal Labor
Supply
1095 Petri Böckerman
Alex Bryson
Pekka Ilmakunnas
Does High Involvement Management
Improve Worker Wellbeing?
1094 Olivier Marie
Judit Vall Castello
Measuring the (Income) Effect of Disability
Insurance Generosity on Labour Market
Participation
1093 Claudia Olivetti
Barbara Petrongolo
Gender Gaps Across Countries and Skills:
Supply, Demand and the Industry Structure
1092 Guy Mayraz Wishful Thinking
1091 Francesco Caselli
Andrea Tesei
Resource Windfalls, Political Regimes, and
Political Stability
1090 Keyu Jin
Nan Li
Factor Proportions and International Business
Cycles
1089 Yu-Hsiang Lei
Guy Michaels
Do Giant Oilfield Discoveries Fuel Internal
Armed Conflicts?
1088 Brian Bell
John Van Reenen
Firm Performance and Wages: Evidence from
Across the Corporate Hierarchy
1087 Amparo Castelló-Climent
Ana Hidalgo-Cabrillana
The Role of Educational Quality and Quantity
in the Process of Economic Development
1086 Amparo Castelló-Climent
Abhiroop Mukhopadhyay
Mass Education or a Minority Well Educated
Elite in the Process of Development: the Case
of India
1085 Holger Breinlich Heterogeneous Firm-Level Responses to
Trade Liberalisation: A Test Using Stock
Price Reactions
1084 Andrew B. Bernard
J. Bradford Jensen
Stephen J. Redding
Peter K. Schott
The Empirics of Firm Heterogeneity and
International Trade
1083 Elisa Faraglia
Albert Marcet
Andrew Scott
In Search of a Theory of Debt Management
1082 Holger Breinlich
Alejandro Cuñat
A Many-Country Model of Industrialization
1081 Francesca Cornaglia
Naomi E. Feldman
Productivity, Wages and Marriage: The Case
of Major League Baseball
1080 Nicholas Oulton The Wealth and Poverty of Nations: True
PPPs for 141 Countries
The Centre for Economic Performance Publications Unit
Tel 020 7955 7673 Fax 020 7955 7595
Email [email protected] Web site http://cep.lse.ac.uk