Embed Size (px)
Citation preview
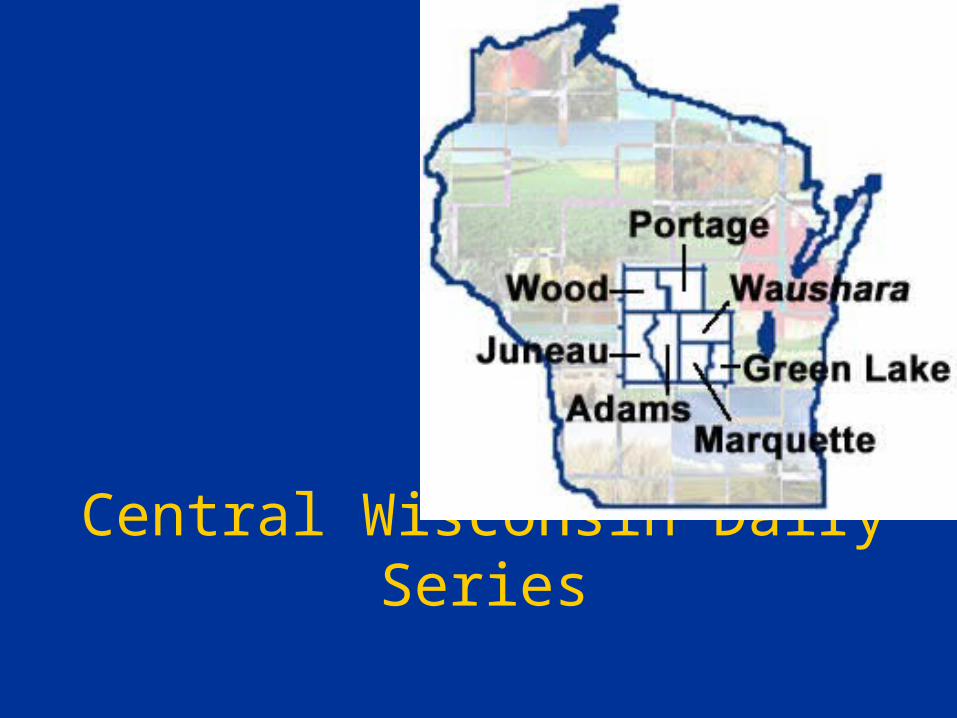
Central Wisconsin Dairy Series
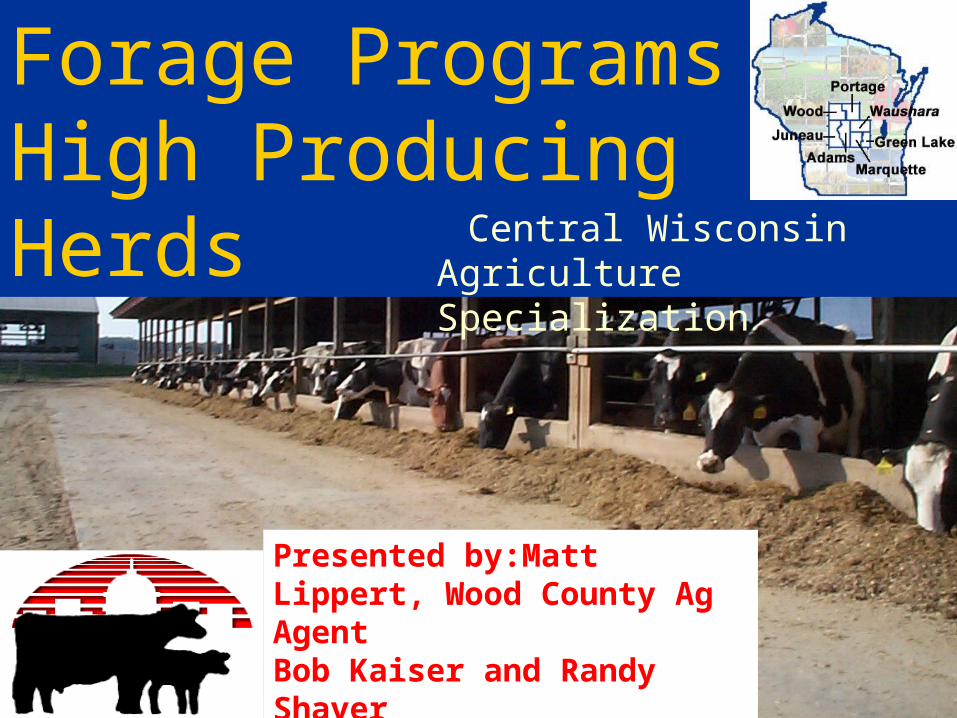
Presented by:Matt Lippert, Wood County Ag Agent Bob Kaiser and Randy ShaverDepartment of Dairy ScienceUniversity of Wisconsin – Madison
Forage Programs in High Producing Herds
Central Wisconsin Agriculture Specialization
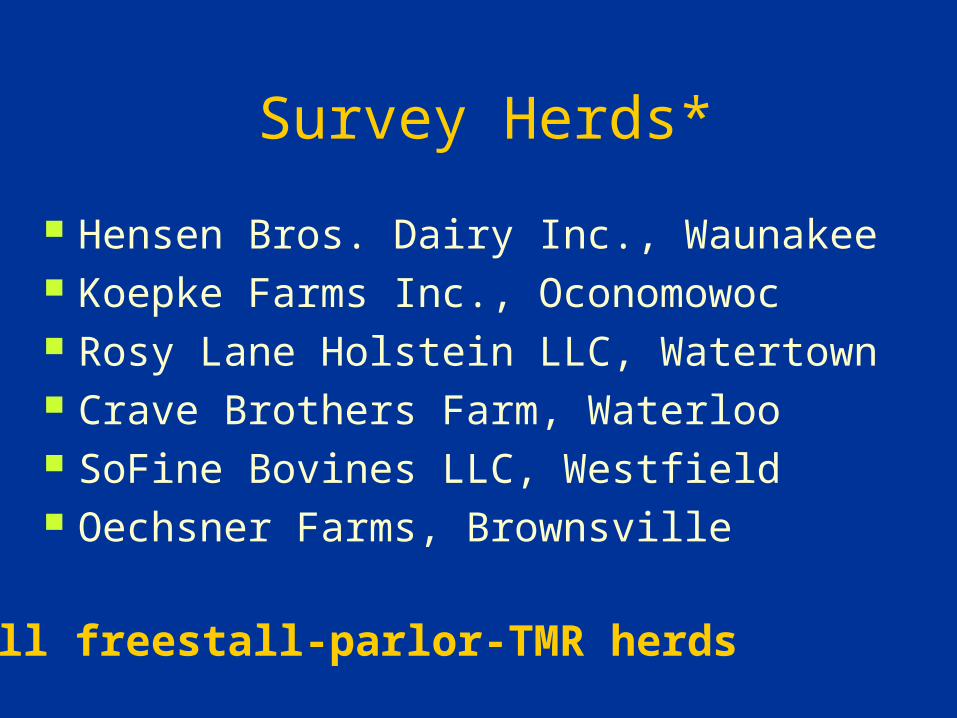
Survey Herds*
Hensen Bros. Dairy Inc., Waunakee Koepke Farms Inc., Oconomowoc Rosy Lane Holstein LLC, Watertown Crave Brothers Farm, Waterloo SoFine Bovines LLC, Westfield Oechsner Farms, Brownsville
*All freestall-parlor-TMR herds
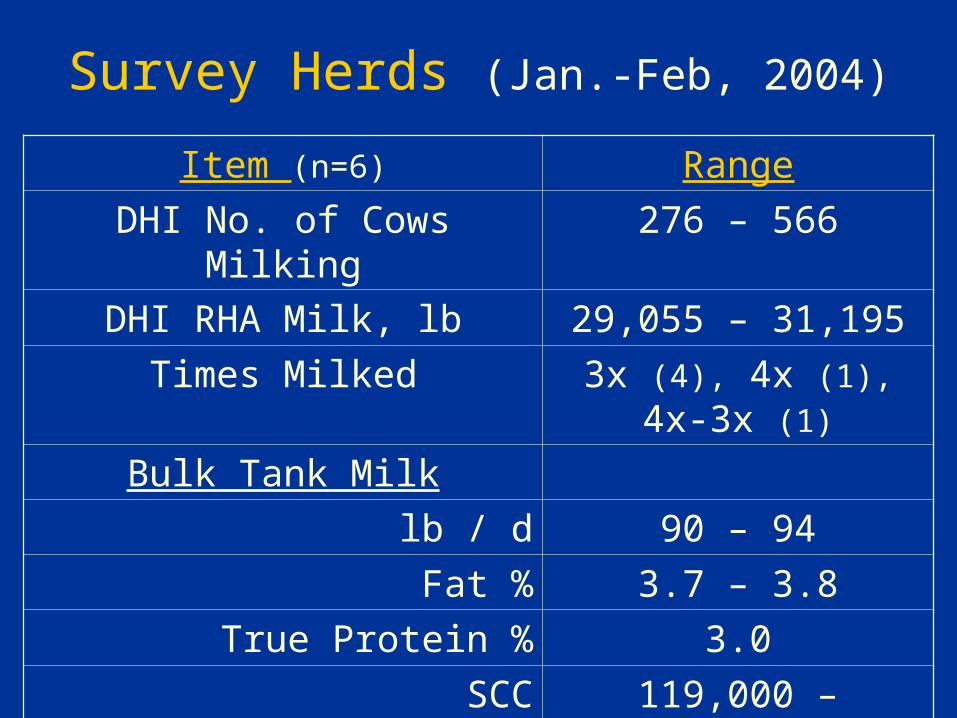
Survey Herds (Jan.-Feb, 2004)
Item (n=6) Range
DHI No. of Cows Milking 276 – 566
DHI RHA Milk, lb 29,055 – 31,195
Times Milked 3x (4), 4x (1), 4x-3x (1)
Bulk Tank Milk
lb / d 90 – 94
Fat % 3.7 – 3.8
True Protein % 3.0
SCC 119,000 – 225,000
Days in Milk 173 – 198
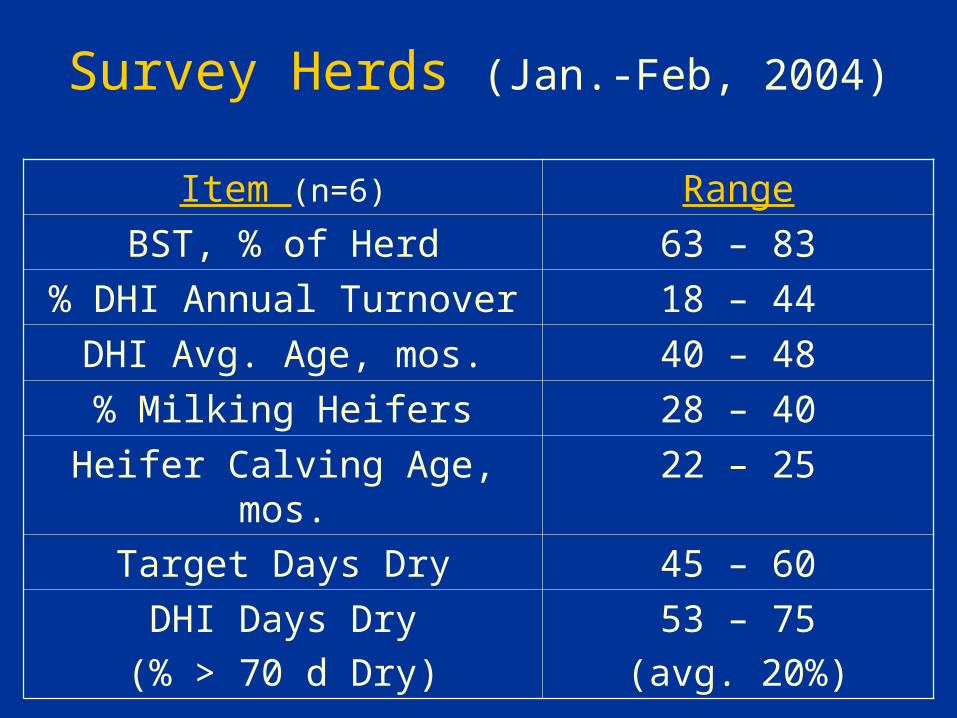
Survey Herds (Jan.-Feb, 2004)
Item (n=6) Range
BST, % of Herd 63 – 83
% DHI Annual Turnover 18 – 44
DHI Avg. Age, mos. 40 – 48
% Milking Heifers 28 – 40
Heifer Calving Age, mos. 22 – 25
Target Days Dry 45 – 60
DHI Days Dry
(% > 70 d Dry)
53 – 75
(avg. 20%)
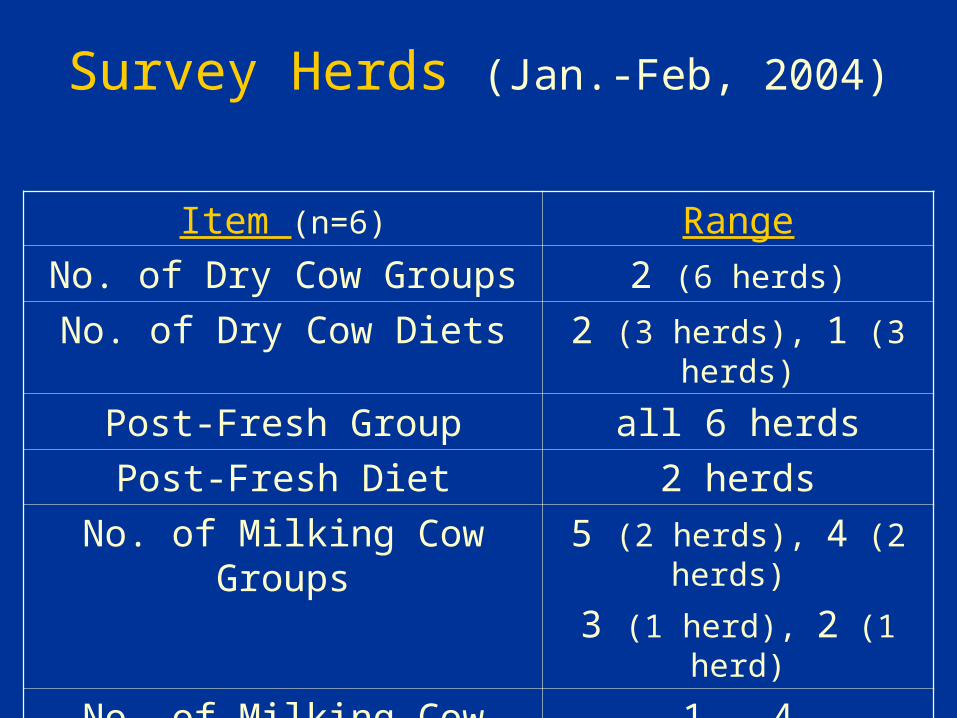
Survey Herds (Jan.-Feb, 2004)
Item (n=6) Range
No. of Dry Cow Groups 2 (6 herds)
No. of Dry Cow Diets 2 (3 herds), 1 (3 herds)
Post-Fresh Group all 6 herds
Post-Fresh Diet 2 herds
No. of Milking Cow Groups 5 (2 herds), 4 (2 herds)
3 (1 herd), 2 (1 herd)
No. of Milking Cow Diets 1 – 4
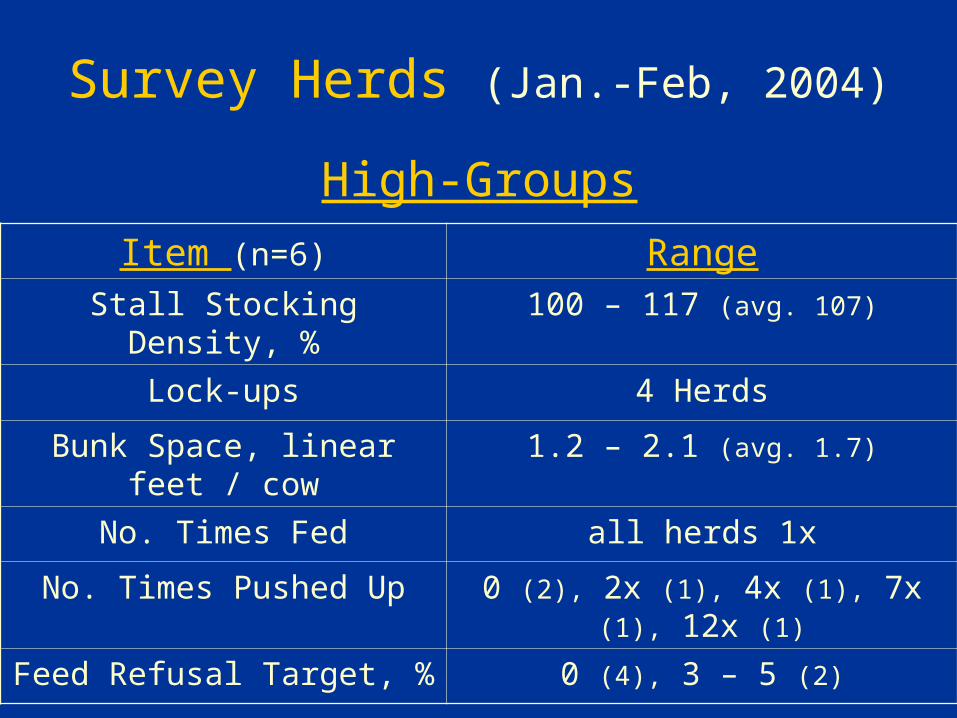
Survey Herds (Jan.-Feb, 2004)
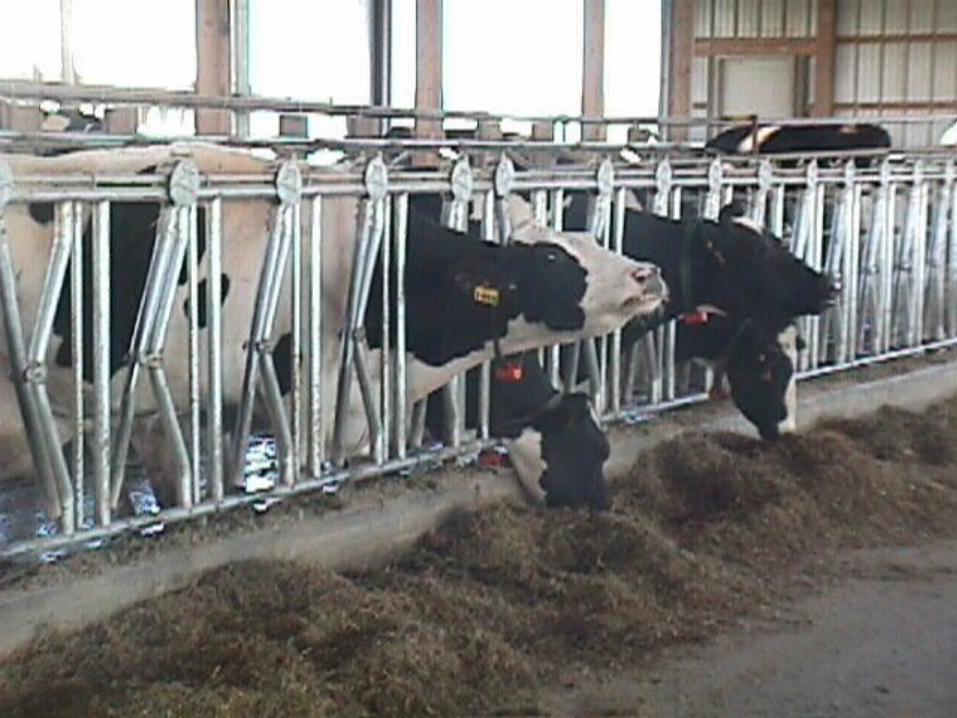
Item (n=6) RangeStall Stocking Density, % 100 – 117 (avg. 107)
Lock-ups 4 Herds
Bunk Space, linear feet / cow 1.2 – 2.1 (avg. 1.7)
No. Times Fed all herds 1x
No. Times Pushed Up 0 (2), 2x (1), 4x (1), 7x (1), 12x (1)
Feed Refusal Target, % 0 (4), 3 – 5 (2)
High-Groups
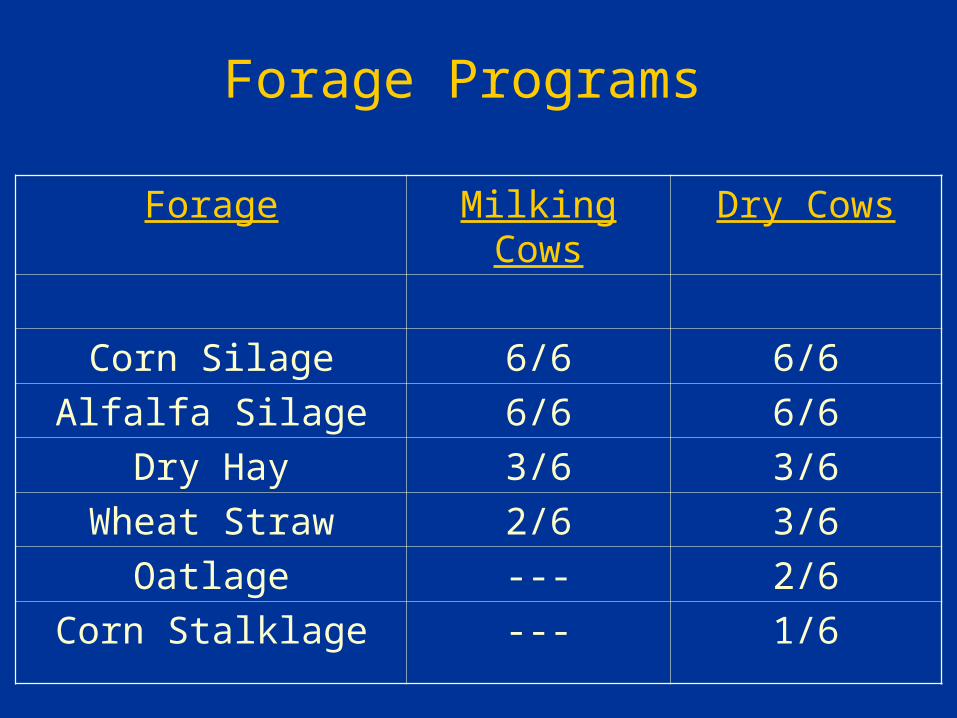
Forage Programs
Forage Milking Cows Dry Cows
Corn Silage 6/6 6/6
Alfalfa Silage 6/6 6/6
Dry Hay 3/6 3/6
Wheat Straw 2/6 3/6
Oatlage --- 2/6
Corn Stalklage --- 1/6
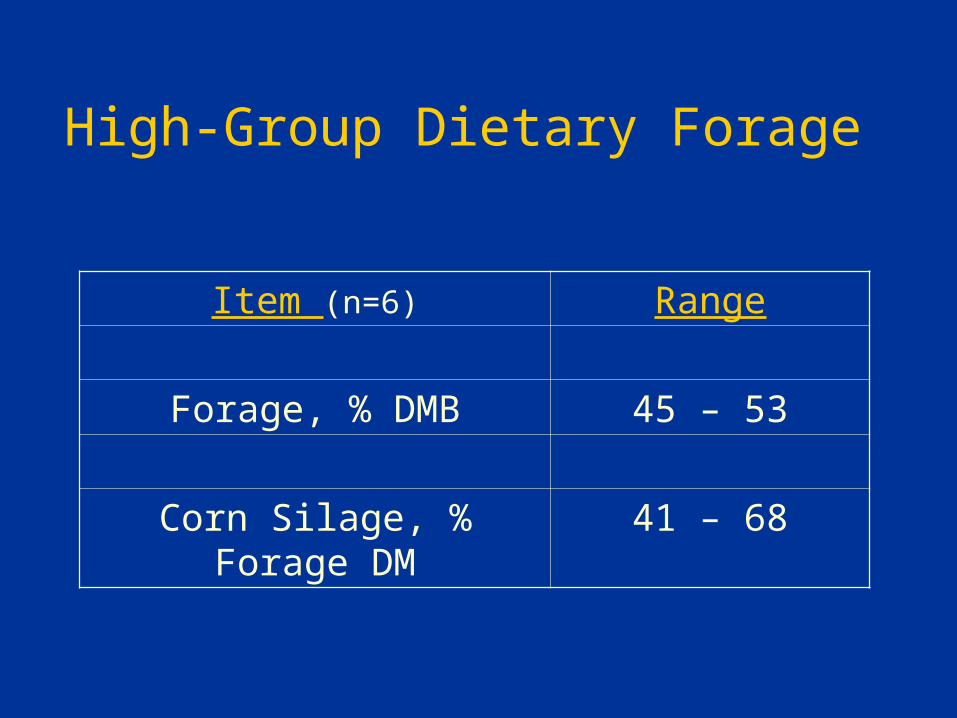
High-Group Dietary Forage
Item (n=6) Range
Forage, % DMB 45 – 53
Corn Silage, % Forage DM 41 – 68
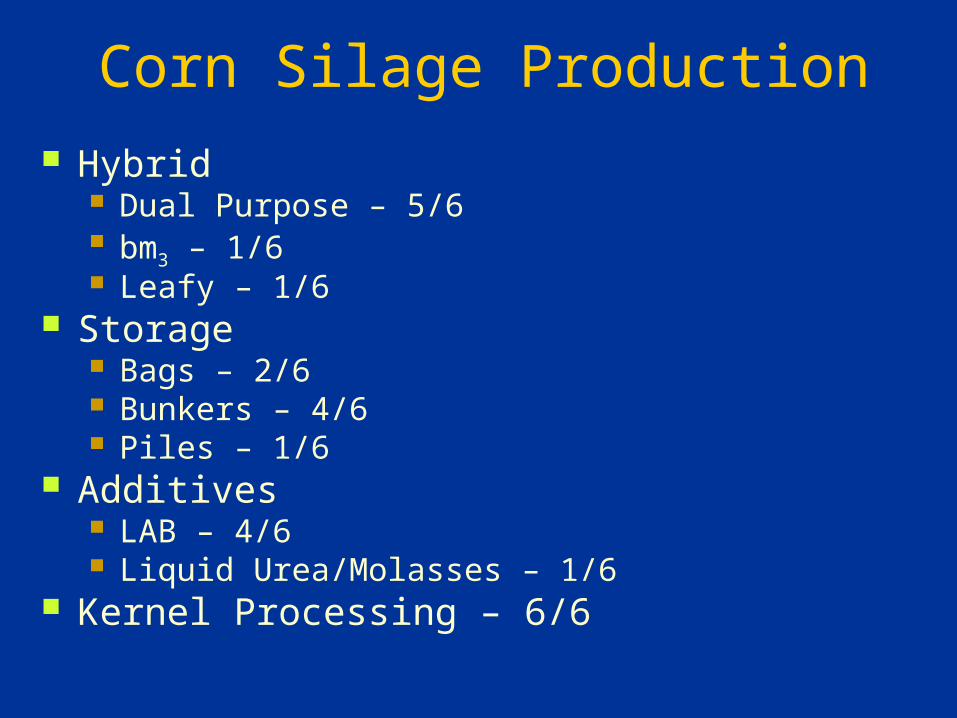
Corn Silage Production Hybrid
Dual Purpose – 5/6 bm3 – 1/6 Leafy – 1/6
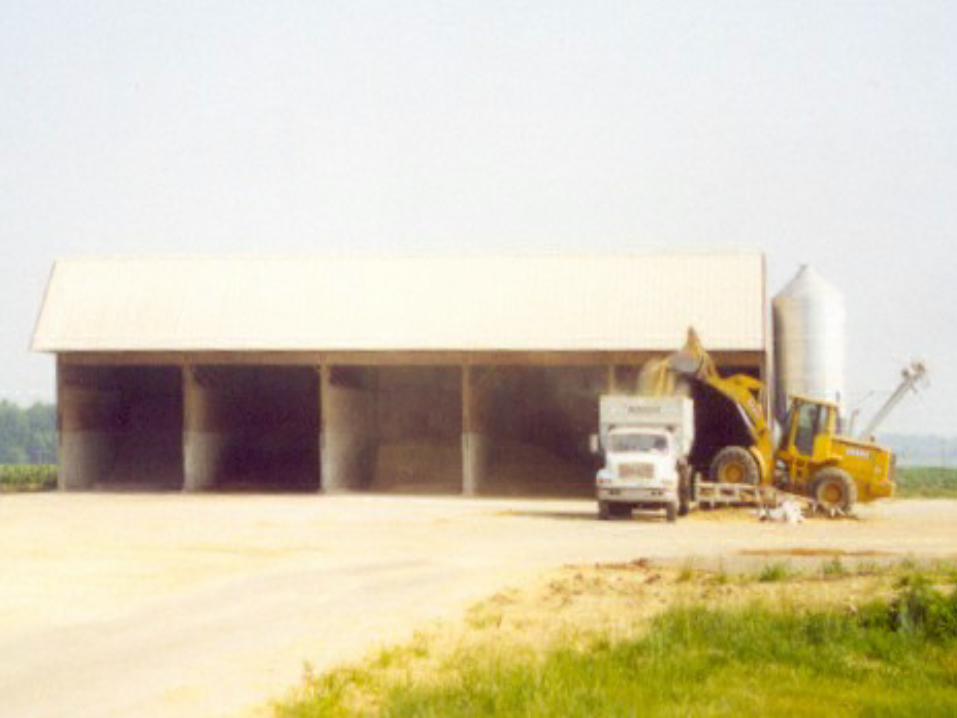
Storage Bags – 2/6 Bunkers – 4/6 Piles – 1/6
Additives LAB – 4/6 Liquid Urea/Molasses – 1/6
Kernel Processing – 6/6
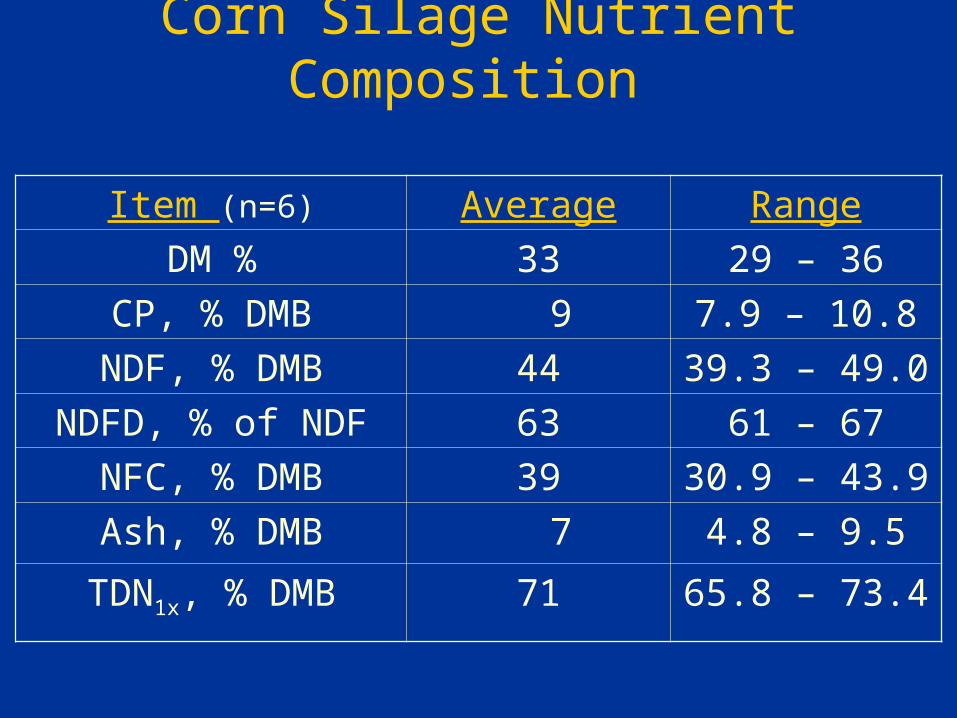
Corn Silage Nutrient Composition
Item (n=6) Average Range
DM % 33 29 – 36
CP, % DMB 9 7.9 – 10.8
NDF, % DMB 44 39.3 – 49.0
NDFD, % of NDF 63 61 – 67
NFC, % DMB 39 30.9 – 43.9
Ash, % DMB 7 4.8 – 9.5
TDN1x, % DMB 71 65.8 – 73.4
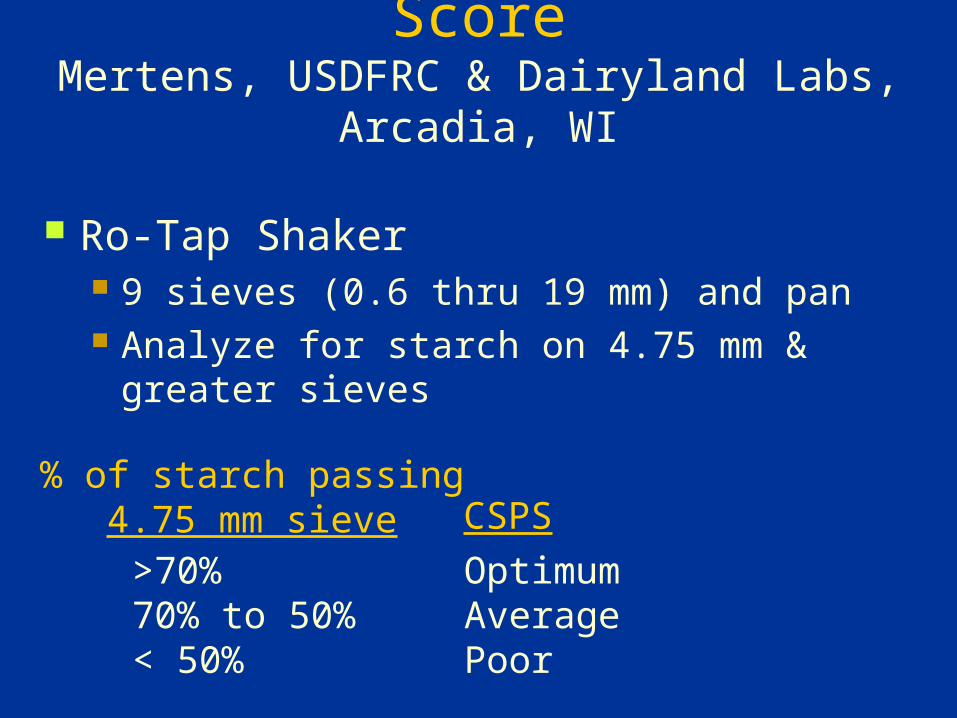
Corn Silage Processing ScoreMertens, USDFRC & Dairyland Labs, Arcadia, WI
Ro-Tap Shaker 9 sieves (0.6 thru 19 mm) and pan Analyze for starch on 4.75 mm & greater sieves
% of starch passing4.75 mm sieve CSPS
>70%70% to 50%< 50%
OptimumAveragePoor
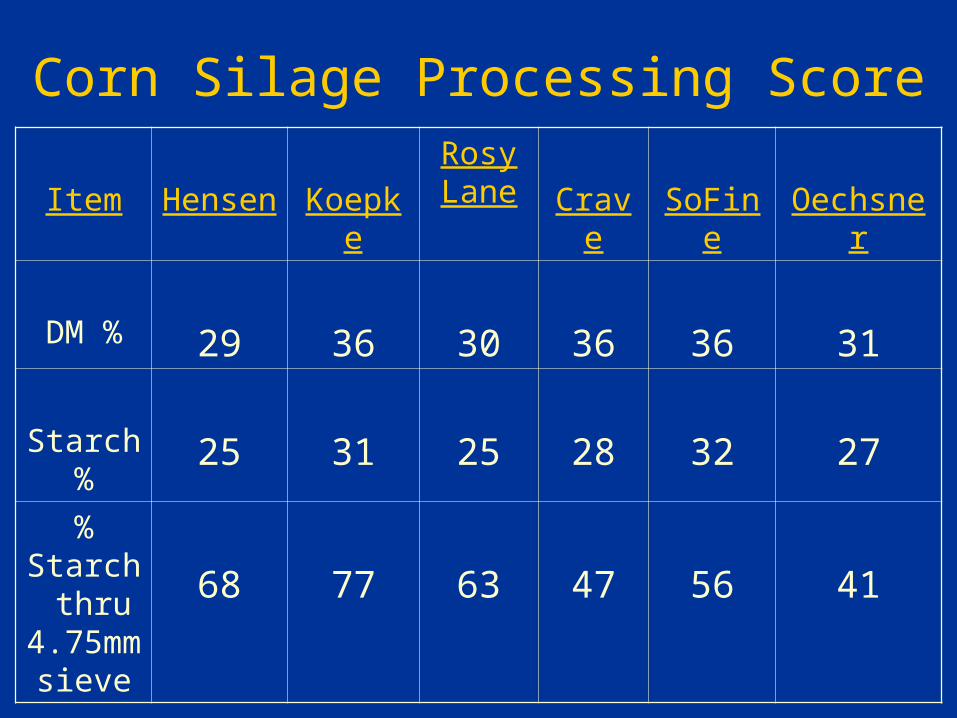
Corn Silage Processing Score
Item Hensen Koepke
Rosy Lane Crave SoFine Oechsner
DM % 29 36 30 36 36 31
Starch%
25 31 25 28 32 27
% Starch
thru 4.75mm
sieve
68 77 63 47 56 41
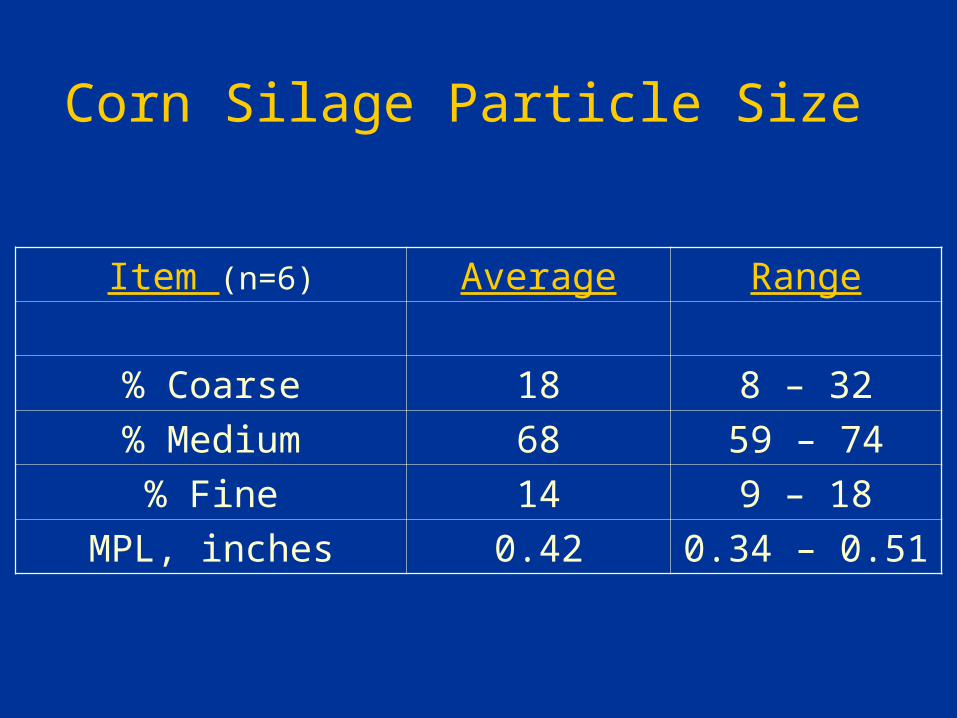
Corn Silage Particle Size
Item (n=6) Average Range
% Coarse 18 8 – 32
% Medium 68 59 – 74
% Fine 14 9 – 18
MPL, inches 0.42 0.34 – 0.51
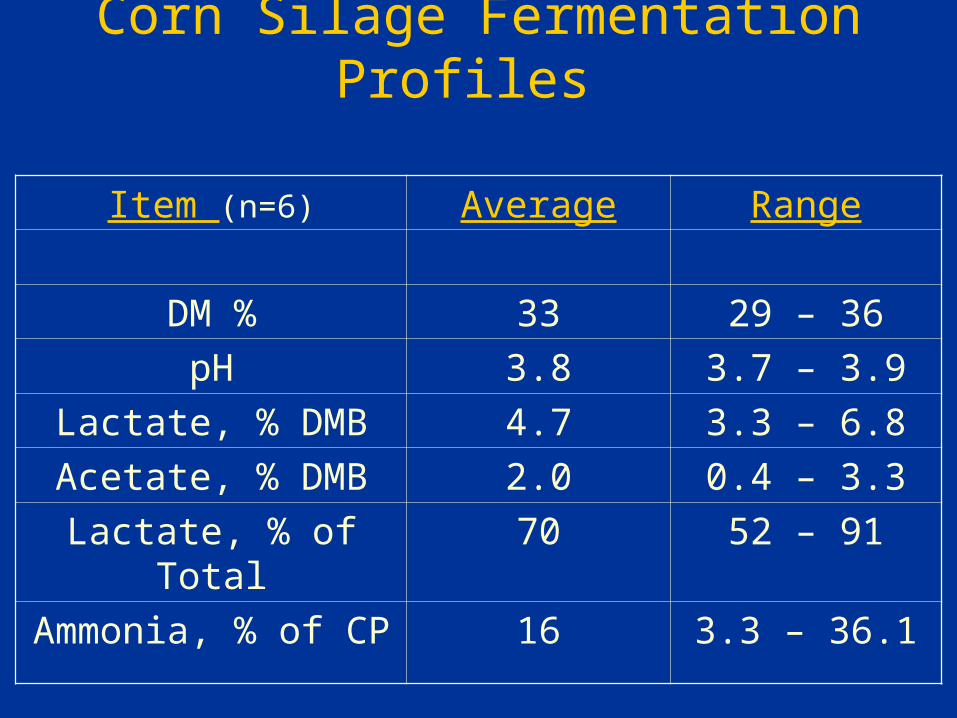
Corn Silage Fermentation Profiles
Item (n=6) Average Range
DM % 33 29 – 36
pH 3.8 3.7 – 3.9
Lactate, % DMB 4.7 3.3 – 6.8
Acetate, % DMB 2.0 0.4 – 3.3
Lactate, % of Total 70 52 – 91
Ammonia, % of CP 16 3.3 – 36.1
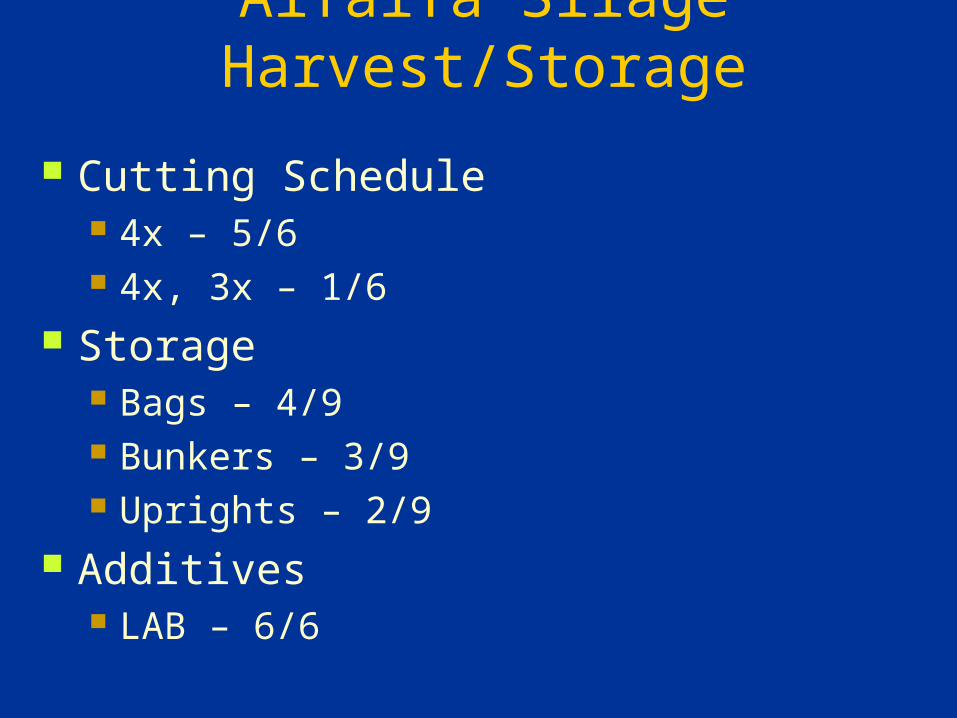
Alfalfa Silage Harvest/Storage
Cutting Schedule 4x – 5/6 4x, 3x – 1/6
Storage Bags – 4/9 Bunkers – 3/9 Uprights – 2/9
Additives LAB – 6/6
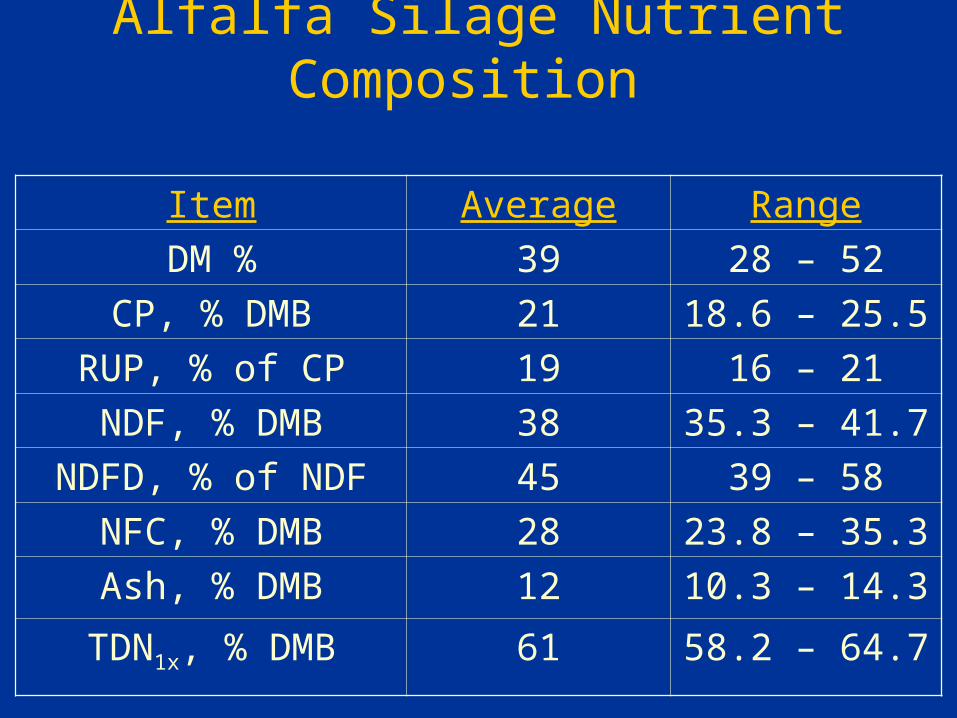
Alfalfa Silage Nutrient Composition
Item Average Range
DM % 39 28 – 52
CP, % DMB 21 18.6 – 25.5
RUP, % of CP 19 16 – 21
NDF, % DMB 38 35.3 – 41.7
NDFD, % of NDF 45 39 – 58
NFC, % DMB 28 23.8 – 35.3
Ash, % DMB 12 10.3 – 14.3
TDN1x, % DMB 61 58.2 – 64.7
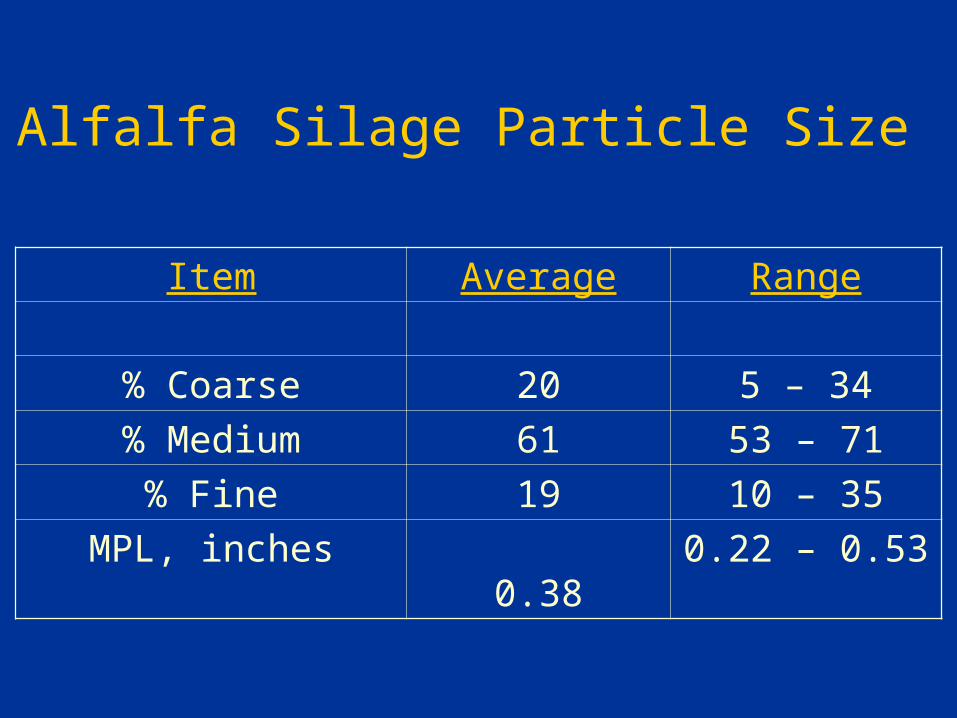
Alfalfa Silage Particle Size
Item Average Range
% Coarse 20 5 – 34
% Medium 61 53 – 71
% Fine 19 10 – 35
MPL, inches 0.38 0.22 – 0.53

Alfalfa Silage Fermentation Profiles
Item (n=9) Average Range
DM % 39 28 – 52
pH 4.5 4.2 – 5.3
Lactate, % DMB 3.7 0.6 – 5.2
Acetate, % DMB 2.4 0.4 – 5.5
Butyrate, % DMB 0.1 0 – 1.0
Lactate, % of Total 61 8 – 91
Ammonia, % of CP 18 10.8 – 44.0
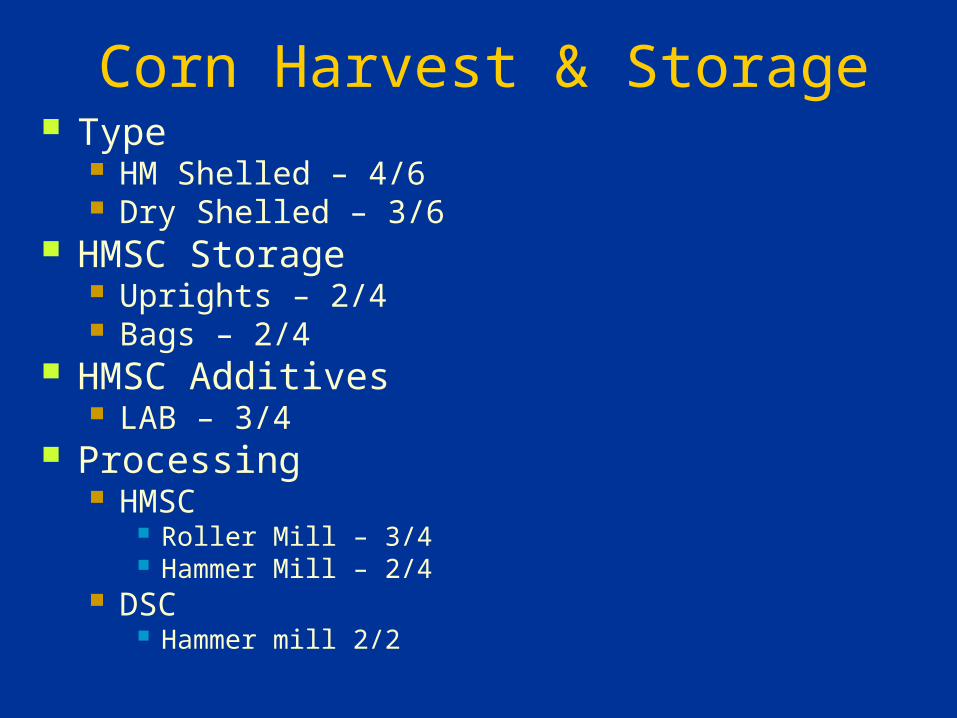
Corn Harvest & Storage Type
HM Shelled – 4/6 Dry Shelled – 3/6
HMSC Storage Uprights – 2/4 Bags – 2/4
HMSC Additives LAB – 3/4
Processing HMSC
Roller Mill – 3/4 Hammer Mill – 2/4
DSC Hammer mill 2/2
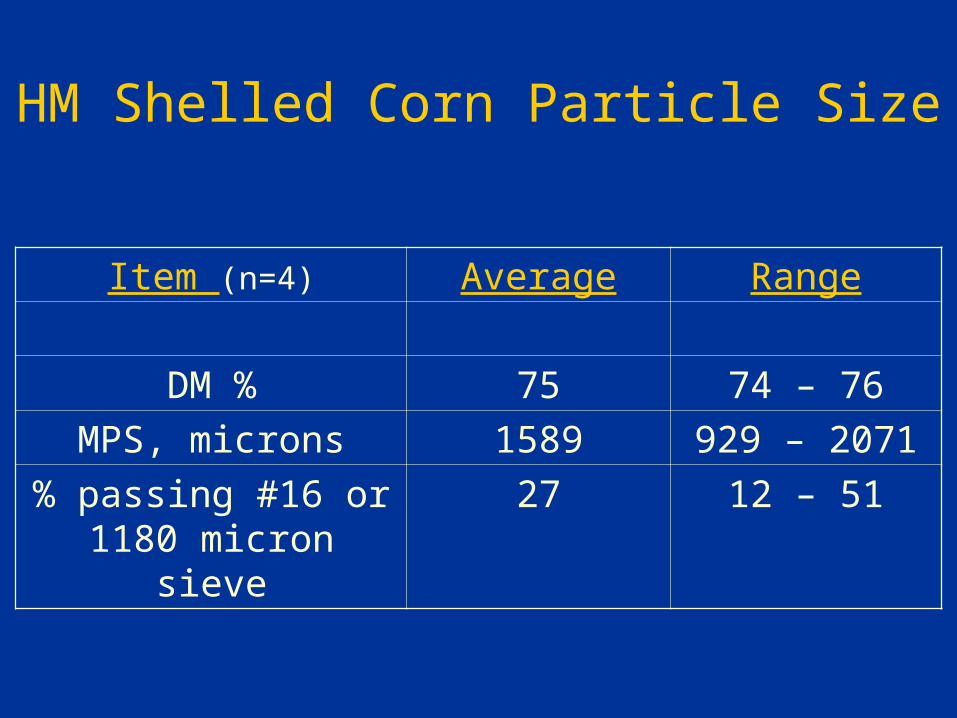
HM Shelled Corn Particle Size
Item (n=4) Average Range
DM % 75 74 – 76
MPS, microns 1589 929 – 2071
% passing #16 or 1180 micron sieve
27 12 – 51
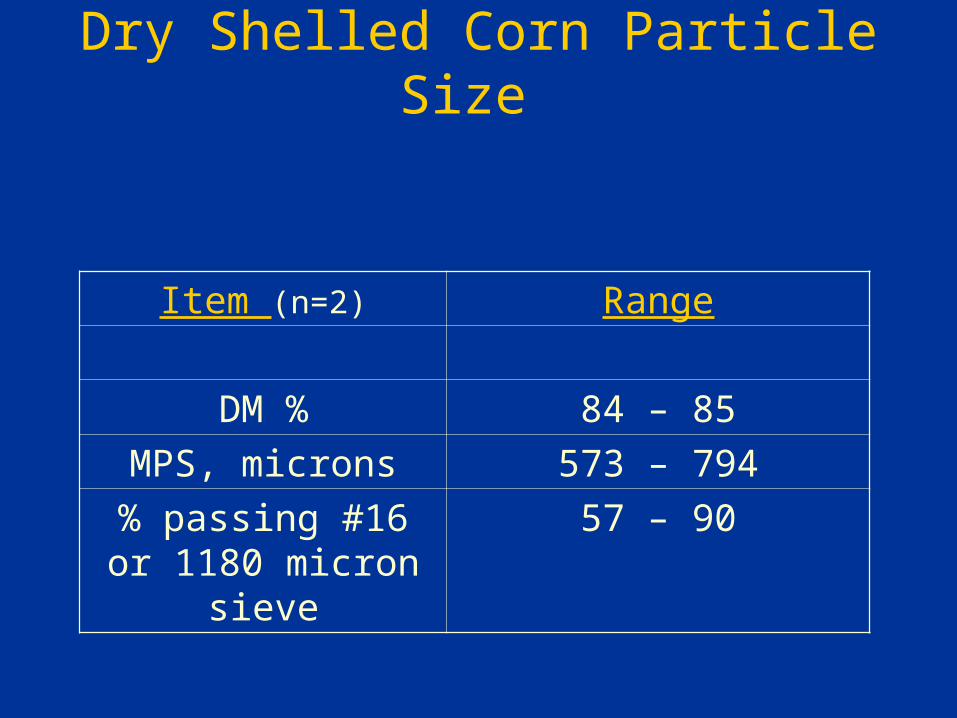
Dry Shelled Corn Particle Size
Item (n=2) Range
DM % 84 – 85
MPS, microns 573 – 794
% passing #16 or 1180 micron sieve
57 – 90
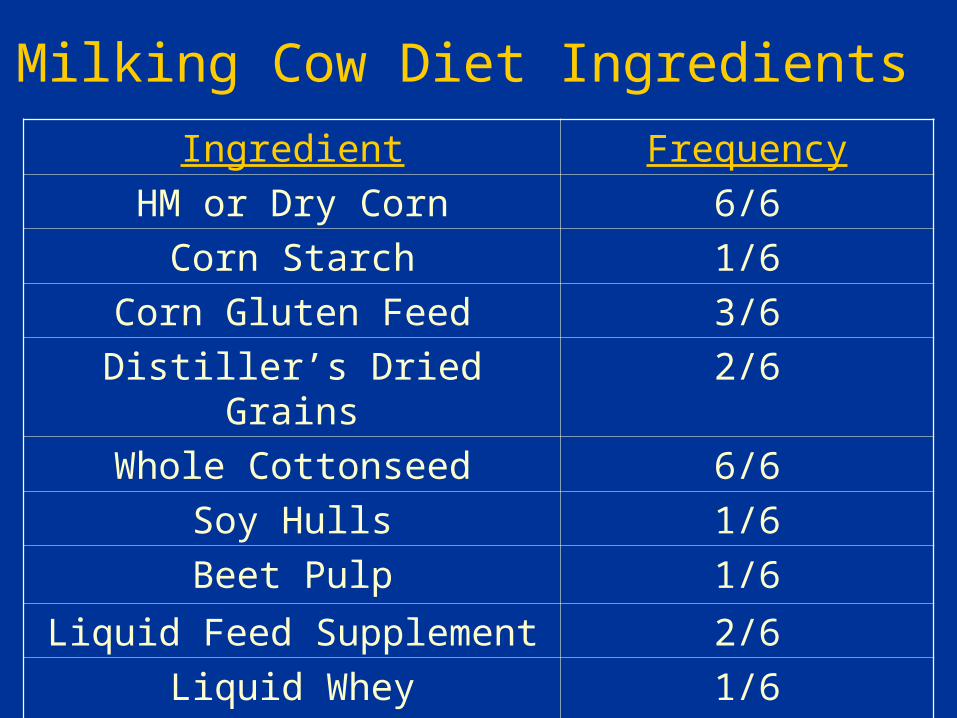
Milking Cow Diet Ingredients
Ingredient Frequency
HM or Dry Corn 6/6
Corn Starch 1/6
Corn Gluten Feed 3/6
Distiller’s Dried Grains 2/6
Whole Cottonseed 6/6
Soy Hulls 1/6
Beet Pulp 1/6
Liquid Feed Supplement 2/6
Liquid Whey 1/6
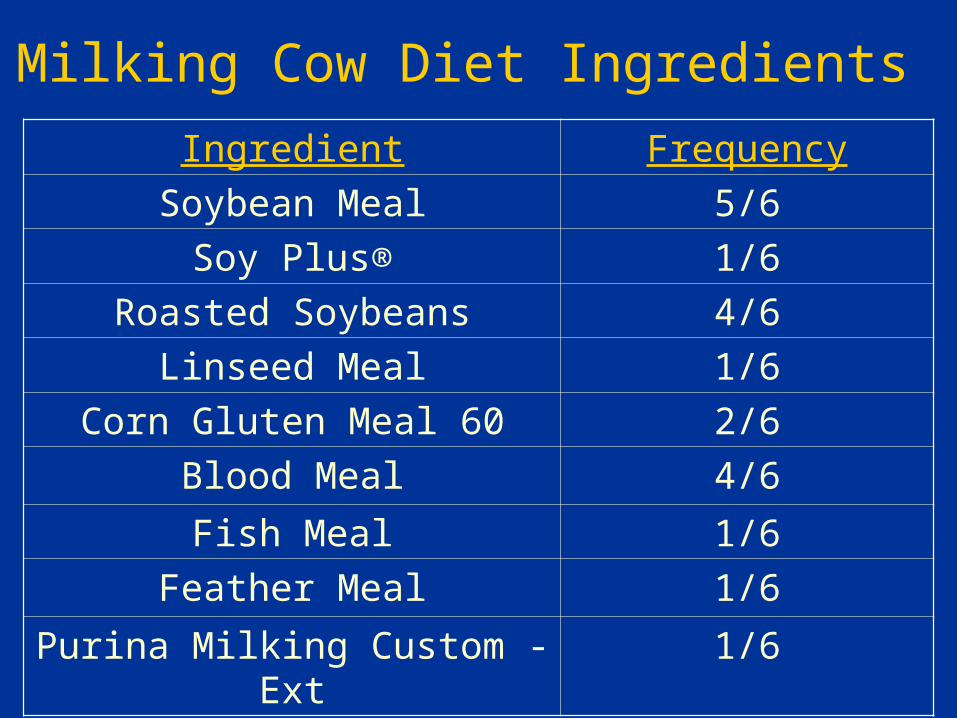
Milking Cow Diet Ingredients
Ingredient Frequency
Soybean Meal 5/6
Soy Plus® 1/6
Roasted Soybeans 4/6
Linseed Meal 1/6
Corn Gluten Meal 60 2/6
Blood Meal 4/6
Fish Meal 1/6
Feather Meal 1/6
Purina Milking Custom - Ext 1/6

Milking Cow Diet Ingredients Ingredient Frequency
Urea 3/6
Tallow 3/6
Energy Booster® 1/6
Megalac® 1/6
Megalac-R® 1/6
Sodium Bicarbonate 4/6
Yeast 6/6
Zinpro® 2/6
4-Plex® 3/6
Sel-Plex® 1/6
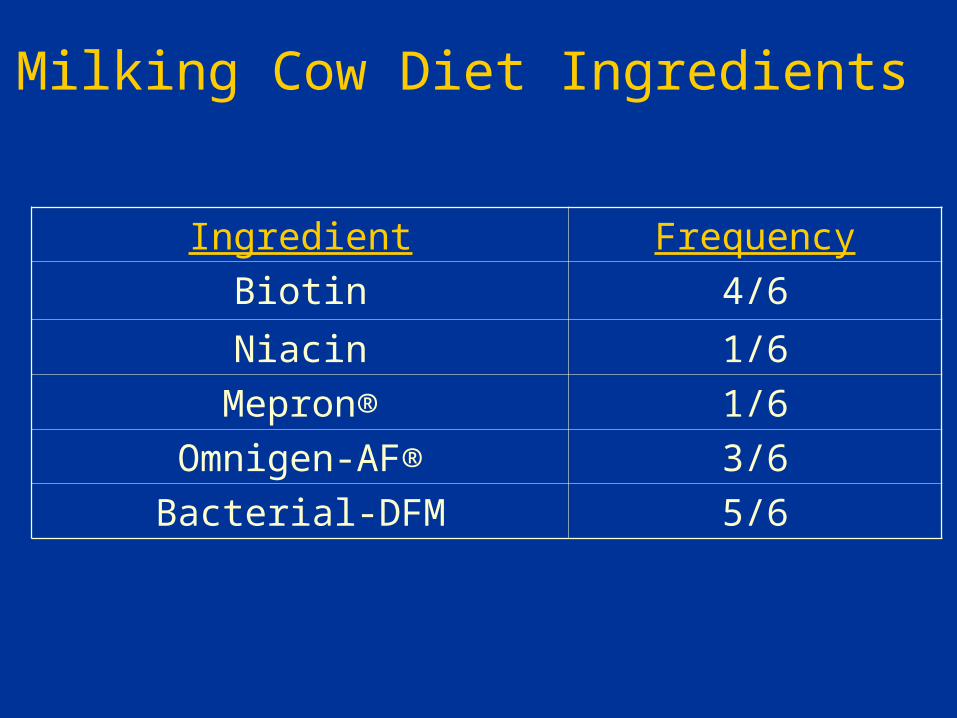
Milking Cow Diet Ingredients
Ingredient Frequency
Biotin 4/6
Niacin 1/6
Mepron® 1/6
Omnigen-AF® 3/6
Bacterial-DFM 5/6
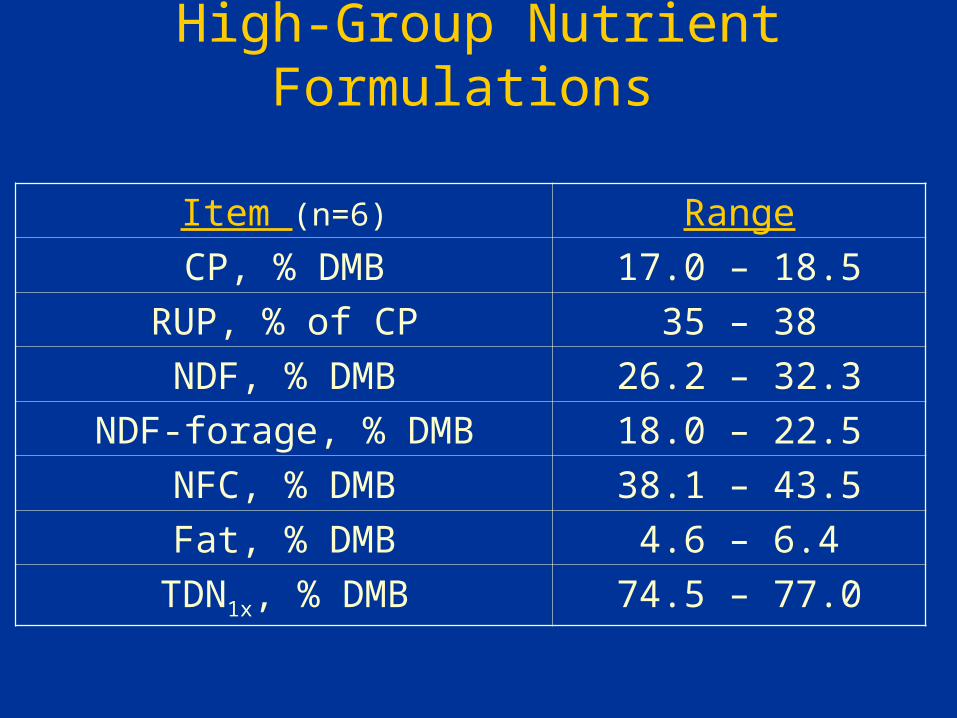
High-Group Nutrient Formulations
Item (n=6) Range
CP, % DMB 17.0 – 18.5
RUP, % of CP 35 – 38
NDF, % DMB 26.2 – 32.3
NDF-forage, % DMB 18.0 – 22.5
NFC, % DMB 38.1 – 43.5
Fat, % DMB 4.6 – 6.4
TDN1x, % DMB 74.5 – 77.0
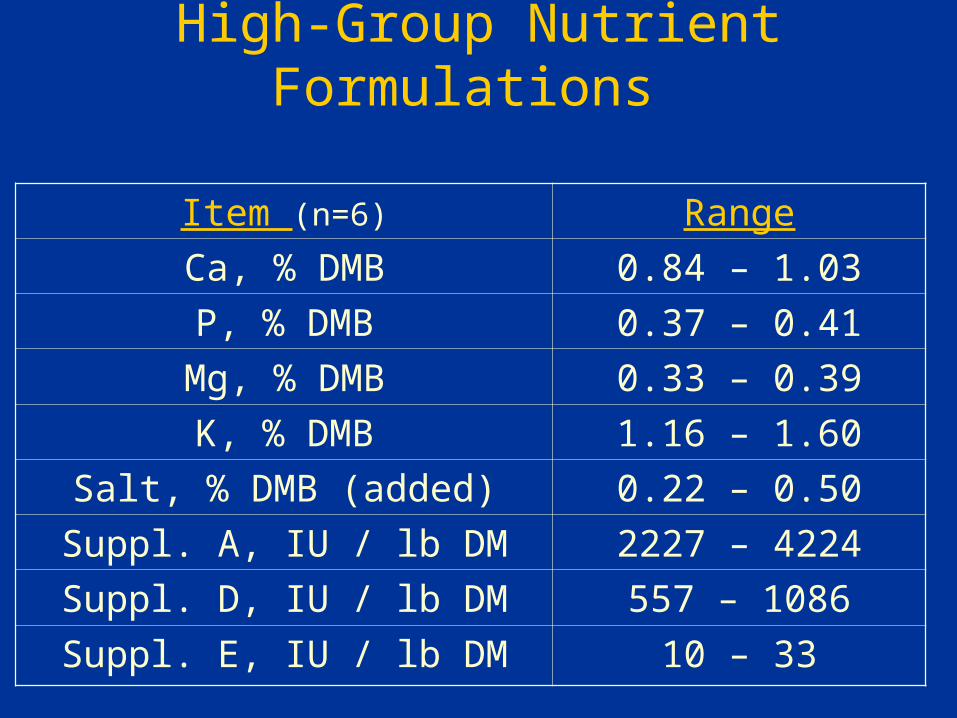
High-Group Nutrient Formulations
Item (n=6) Range
Ca, % DMB 0.84 – 1.03
P, % DMB 0.37 – 0.41
Mg, % DMB 0.33 – 0.39
K, % DMB 1.16 – 1.60
Salt, % DMB (added) 0.22 – 0.50
Suppl. A, IU / lb DM 2227 – 4224
Suppl. D, IU / lb DM 557 – 1086
Suppl. E, IU / lb DM 10 – 33
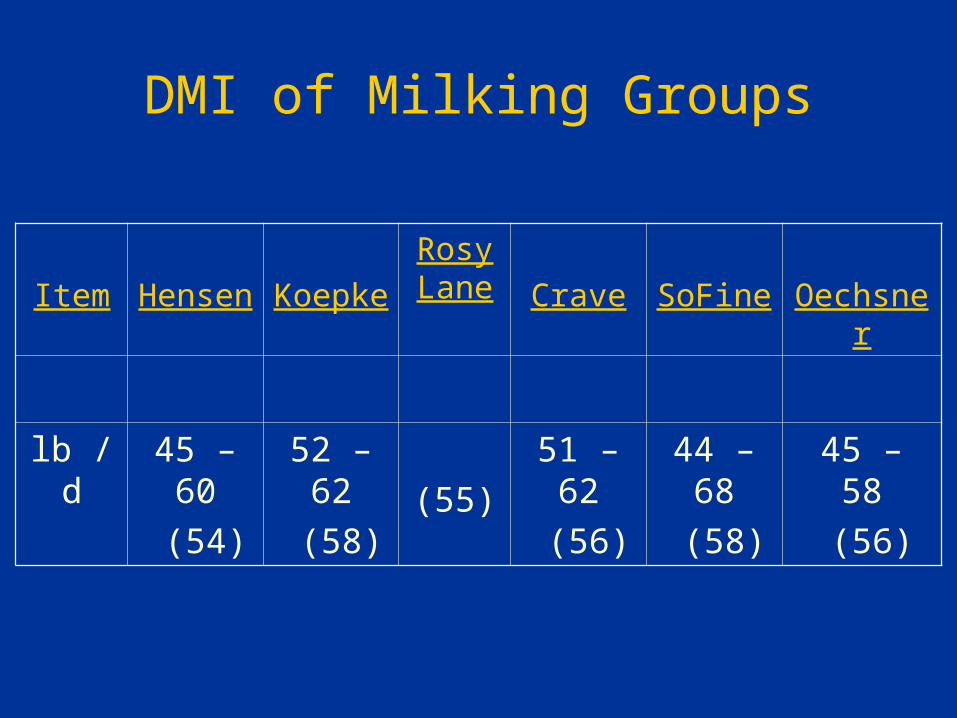
DMI of Milking Groups
Item Hensen Koepke
Rosy Lane Crave SoFine Oechsner
lb / d 45 – 60
(54)
52 – 62
(58) (55)
51 – 62
(56)
44 – 68
(58)
45 – 58
(56)
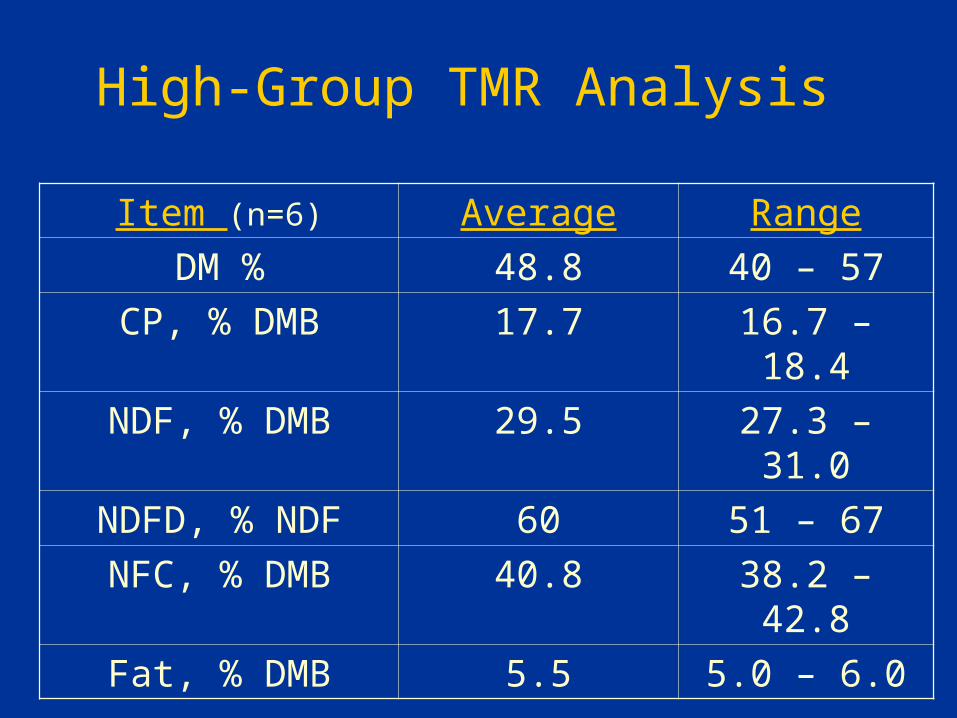
High-Group TMR Analysis
Item (n=6) Average Range
DM % 48.8 40 – 57
CP, % DMB 17.7 16.7 – 18.4
NDF, % DMB 29.5 27.3 – 31.0
NDFD, % NDF 60 51 – 67
NFC, % DMB 40.8 38.2 – 42.8
Fat, % DMB 5.5 5.0 – 6.0
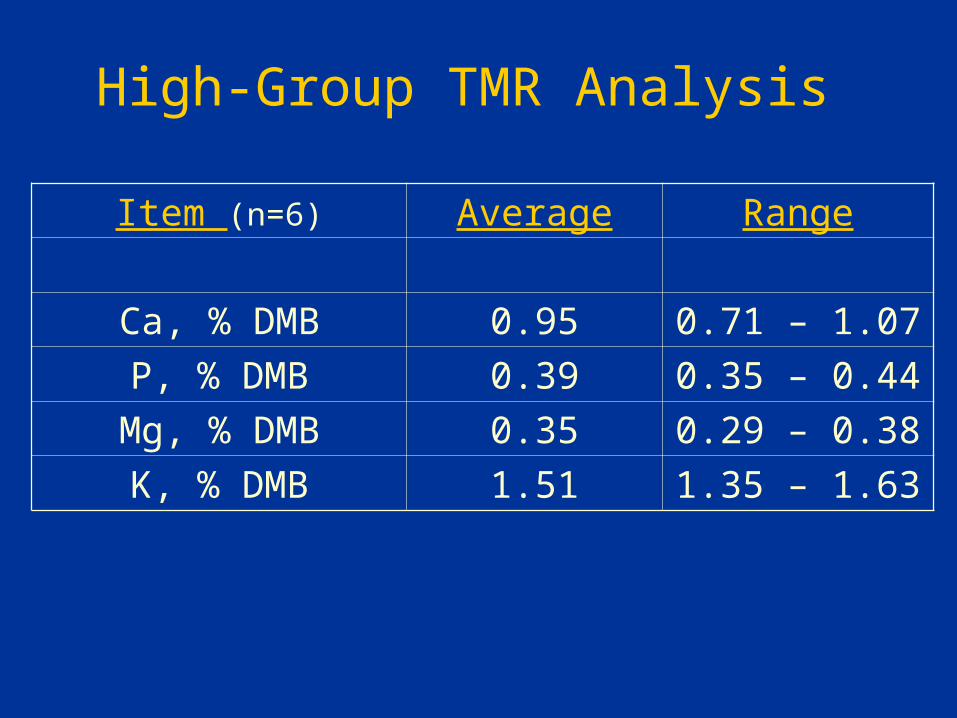
High-Group TMR Analysis
Item (n=6) Average Range
Ca, % DMB 0.95 0.71 – 1.07
P, % DMB 0.39 0.35 – 0.44
Mg, % DMB 0.35 0.29 – 0.38
K, % DMB 1.51 1.35 – 1.63
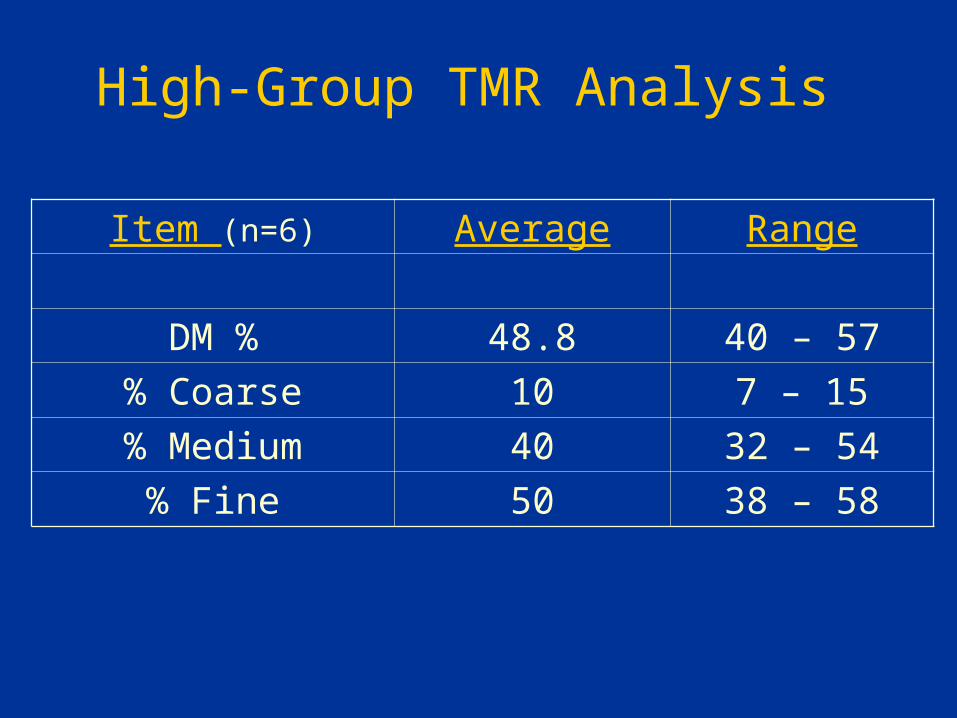
High-Group TMR Analysis
Item (n=6) Average Range
DM % 48.8 40 – 57
% Coarse 10 7 – 15
% Medium 40 32 – 54
% Fine 50 38 – 58
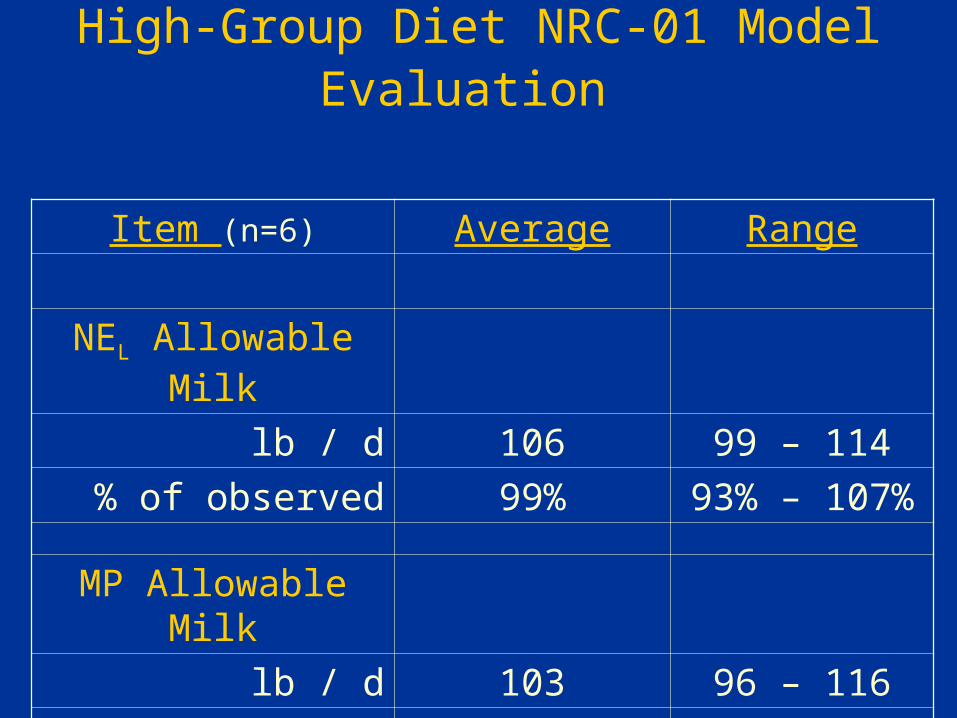
High-Group Diet NRC-01 Model Evaluation
Item (n=6) Average Range
NEL Allowable Milk
lb / d 106 99 – 114
% of observed 99% 93% – 107%
MP Allowable Milk
lb / d 103 96 – 116
% of observed 96% 92% – 100%
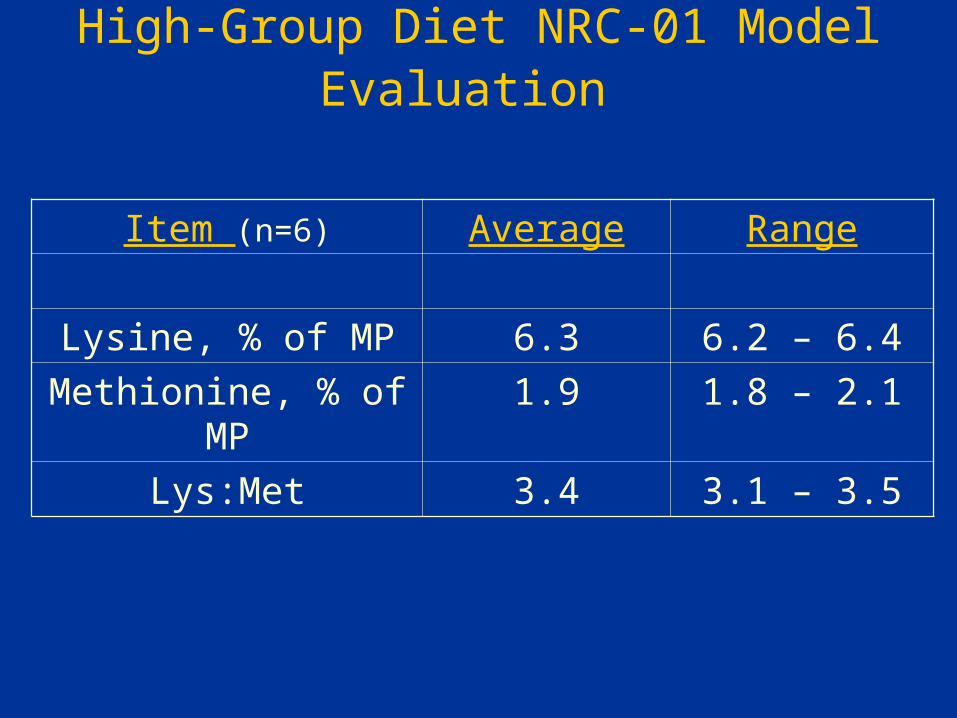
High-Group Diet NRC-01 Model Evaluation
Item (n=6) Average Range
Lysine, % of MP 6.3 6.2 – 6.4
Methionine, % of MP 1.9 1.8 – 2.1
Lys:Met 3.4 3.1 – 3.5
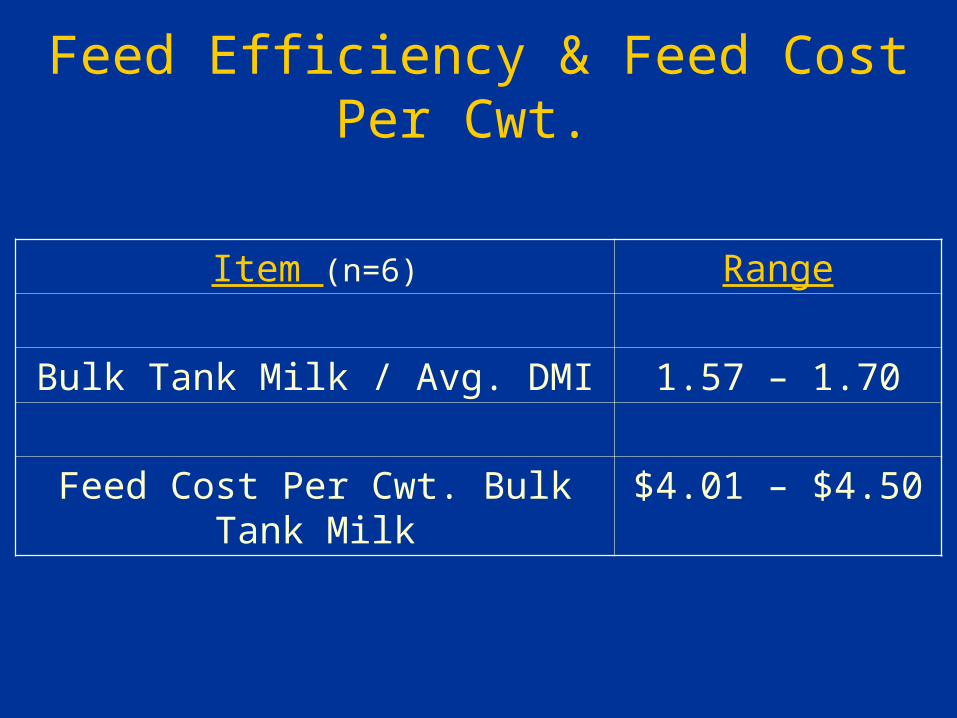
Feed Efficiency & Feed Cost Per Cwt.
Item (n=6) Range
Bulk Tank Milk / Avg. DMI 1.57 – 1.70
Feed Cost Per Cwt. Bulk Tank Milk $4.01 – $4.50
Visit UW-Madison Dairy Science Department Website
http://www.wisc.edu/dysci/