Embed Size (px)
Citation preview

CDP CDP 2015 Climate Change 2015 Information Request Coca-Cola HBC AG
Module: Introduction
Page: Introduction
CC0.1
Introduction Please give a general description and introduction to your organization. We are the world’s second-largest bottler of the brands of The Coca-Cola Company in terms of volume, with sales of more than 2 billion unit cases, or 50 billion servings, annually, and the largest bottler based in Europe. We have operations in 28 countries spanning 3 continents, reaching 589 million people. We work closely with The Coca-Cola Company to market brands and beverage categories to customers ranging from large retailers and discounters to thousands of smaller outlets. We source ingredients, raw materials, equipment and services from around 130.000 suppliers to produce sparkling beverages, fruit juices, mineral waters, sports and energy drinks and ready-to-drink teas. Together, these represent a strong and diverse portfolio, led by the Coca-Cola brand. Our net sales revenue is 6.51 billion Euro in 2014. We manage our business responsibly, sustainably, and with a passion for creating value for our customers, our shareholders and the consumers and communities we serve. The opportunity we see is superior business growth, particularly through our presence in fast-growing emerging markets, coupled with cost efficiencies and infrastructure optimisation. We have the most diversified footprint in the Coca-Cola System. No single country dominates our portfolio. In fact, no country represents more than 20% of sales volume. We manage and report on our business using three segments: Emerging, Developing and Established markets. These segments account for 51%, 18% and 31%, respectively, of our total sales volume. We produce, sell and distribute Coca-Cola, the world’s most recognised beverage brand and the world’s leading brand of non-alcoholic ready-to-drink beverages in terms of sales volume. The other brands licensed to our Group by The Coca-Cola Company are also among the leading brands in their market categories. Coca-Cola Light, Sprite and Fanta, together with Coca-Cola, are four of the world’s five best-selling non-alcoholic ready-to-drink beverages. Our overall sparkling volume share in our markets is in excess of 40%. This gives us a very solid foundation and offers further growth potential as consumers switch from local brands and home-mixed drinks to our branded goods. The strength of our portfolio of sparkling drinks is complemented by a still drinks portfolio which has grown to 30% of our volume. This combination is quite unique in the bottling landscape. It makes us a stronger partner to our customers and ensures consumer choice. Our future plans include adding local brands with high brand equity to our portfolio. Our business strategy recognises the critical importance of creating shared value for employees, consumers, customers and communities. Over the last decade, we have integrated corporate responsibility and sustainability into all aspects of business management, making long-term investments that aim to build value over time. Consumer health and wellness is a key issue for our business and our communities, but we also continue to focus on minimising our environmental impact and managing sustainability in our value chain. Our efforts have been recognised by the Dow Jones Sustainability and FTSE4Good Indices since 2008 and 2001, respectively. Our Company was named the industry leader amongst beverage companies in the 2014 Dow Jones World and Europe Sustainability Indices (DJSI).

We have also been awarded an A rating by the Carbon Disclosure Project (CDP) and a place in the CDP Global Climate Performance Leadership Index 2014. Coca-Cola HBC AG (LSE: CCH) was admitted to the premium listing segment of the Official List of the UK Listing Authority and to trading on the London Stock Exchange’s main market for listed securities on 29 April 2013. With effect from 29 April 2013, Coca-Cola HBC AG’s shares are also admitted on the Athens Exchange (ATHEX: EEE). Coca Cola HBC AG has been included as a constituent of the FTSE 100 and FTSE All-Share indices from 20 September 2013. For more information, please visit http://www.coca-colahellenic.com/.
CC0.2
Reporting Year Please state the start and end date of the year for which you are reporting data. The current reporting year is the latest/most recent 12-month period for which data is reported. Enter the dates of this year first. We request data for more than one reporting period for some emission accounting questions. Please provide data for the three years prior to the current reporting year if you have not provided this information before, or if this is the first time you have answered a CDP information request. (This does not apply if you have been offered and selected the option of answering the shorter questionnaire). If you are going to provide additional years of data, please give the dates of those reporting periods here. Work backwards from the most recent reporting year. Please enter dates in following format: day(DD)/month(MM)/year(YYYY) (i.e. 31/01/2001).
Enter Periods that will be disclosed
Wed 01 Jan 2014 - Wed 31 Dec 2014
CC0.3
Country list configuration Please select the countries for which you will be supplying data. If you are responding to the Electric Utilities module, this selection will be carried forward to assist you in completing your response.
Select country

Select country
Armenia Austria Belarus Bosnia and Herzegovina Bulgaria Croatia Cyprus Czech Republic Estonia The former Yugoslav Republic of Macedonia Hungary Greece Ireland Italy Latvia Lithuania Moldova Montenegro Nigeria Poland Romania Russia Serbia Slovakia Slovenia Switzerland Ukraine United Kingdom
CC0.4
Currency selection

Please select the currency in which you would like to submit your response. All financial information contained in the response should be in this currency. EUR(€)
CC0.6
Modules As part of the request for information on behalf of investors, electric utilities, companies with electric utility activities or assets, companies in the automobile or auto component manufacture sub-industries, companies in the oil and gas sub-industries, companies in the information technology and telecommunications sectors and companies in the food, beverage and tobacco industry group should complete supplementary questions in addition to the main questionnaire. If you are in these sector groupings (according to the Global Industry Classification Standard (GICS)), the corresponding sector modules will not appear below but will automatically appear in the navigation bar when you save this page. If you want to query your classification, please email [email protected]. If you have not been presented with a sector module that you consider would be appropriate for your company to answer, please select the module below. If you wish to view the questions first, please see https://www.cdp.net/en-US/Programmes/Pages/More-questionnaires.aspx.
Further Information
Module: Management
Page: CC1. Governance
CC1.1
Where is the highest level of direct responsibility for climate change within your organization? Board or individual/sub-set of the Board or other committee appointed by the Board
CC1.1a
Please identify the position of the individual or n ame of the committee with this responsibility

The highest level of responsibility for climate change topics is Mr. George A. David, the Chairman of the Company’s Board of Directors in his role as a member of the Company’s Social Responsibility Committee. The Social Responsibility Committee is chaired by Sir Michael Llewellyn-Smith who is also non-executive Director of the Company’s Board. The Social Responsibility Committee has 1 more member who is non-executive Directors: Mr. José Octavio Reyes. During the year, the Committee considered the Group’s approach to packaging, climate change and carbon emissions and as well as health and wellness. The Social Responsibility Committee met four times during 2014 and discharged the responsibilities as defined under Annex C of the Organisational Regulations. The Chief Executive Officer, the Director of Public Affairs and Communication and the Operational Sustainability Director regularly attend the meetings of the Social Responsibility Committee. During 2014 the Social Responsibility Committee reviewed and provided guidance and insights to advance the Group’s environmental and social strategies in the following areas: • The Group’s approach to regulations regarding packaging and packaging waste in the context of the EU Circular Economy (zero waste programme for Europe) and to extended producer responsibilities for used packaging; • Efforts to address climate change and reduce carbon emissions were discussed in the context of the 2014 UN Intergovernmental Panel on Climate Change’s report calling for drastic reductions in carbon emissions (Specifically, discussions included the Group’s renewable energy strategy, carbon pricing opportunities and increased societal expectations from, for example, the Carbon Disclosure Project); • Tax transparency and natural capital accounting. The Social Responsibility Committee reviewed, and endorsed, the process for the annual assessment of material issues. The materiality assessment conducted in 2014 included input from stakeholders (received both online and at the Annual Stakeholder Engagement Forum), input from employee surveys and business risks identified by the Business Resilience Function. Key elements of the Social Responsibility Committee’s role include: • Establishing the principles governing the Group’s policies on social responsibility and the environment to guide management’s decisions and actions; • Overseeing the development and supervision of procedures and systems to ensure the achievement of the Group’s social responsibility and environmental goals; • Ensuring the necessary and appropriate transparency and openness in the Group’s business conduct in pursuit of its social responsibility and environmental goals; • Ensuring and overseeing the Group’s communications with stakeholders of its social responsibility and environmental policies, goals and achievements, including the level of compliance with internationally accepted standards; and • Reviewing Company policies on environmental issues, human rights, and other topics as they relate to social responsibility issues. See 2014 Integrated Annual Report, section on Governance, page 87. http://www.coca-colahellenic.com/~/media/Files/C/CCHBC/Annual%20Reports/Annual%20Integrated%20Report_2014.pdf In addition to the Social Responsibility Committee, at every Board meeting in 2014, the Board reviewed the Group’s performance against its sustainability and community trust targets to ensure that these initiatives are fully integrated in our operating framework.
CC1.2
Do you provide incentives for the management of cli mate change issues, including the attainment of tar gets? Yes
CC1.2a

Please provide further details on the incentives pr ovided for the management of climate change issues
Who is entitled to benefit from these incentives?
The type of incentives
Incentivized performance indicator
Comment
Energy managers Monetary reward
Emissions reduction project Energy reduction project Energy reduction target
Group Energy Manager has objectives in his/her MBO (Management Business Objectives) related to: reduction of energy use in our plants, providing guideline for energy saving initiatives and proposing alternative solutions (renewable, clean etc). Implementation of these objectives determines bonus, merit increase and career progression.
Environment/Sustainability managers
Monetary reward
Emissions reduction project Emissions reduction target Energy reduction project Energy reduction target Behaviour change related indicator
Group Sustainability and Primary Packaging Director has objectives in his/her MBO related to: energy, water, packaging reduction, implementation/sustain of ISO 14001 standards in the organization. In addition, he/she has an objective for "driving Sustainability culture and maintaining Sustainability leadership position", which includes Environment as well. Implementation of these objectives determines bonus, merit increase and career progression.
Environment/Sustainability managers
Monetary reward
Emissions reduction project Emissions reduction target Energy reduction project Energy reduction target Behaviour change related indicator
Group Environmental Manager has objectives in his/her MBO related to: energy, water, packaging reduction, decreasing of landfilled waste, cascading Top Energy/Water saving initiatives/projects and promoting a Near Loss programme (behavioral programme). Implementation of these objectives determines bonus, merit increase and career progression.
Facility managers Monetary reward
Emissions reduction project Energy reduction project Energy reduction target Efficiency target Behaviour change related indicator
Plant Managers have in their MBO targets to reduce energy/water usage in their plants, implementation rate of the mandatory Top 18 Energy projects, increasing of production efficiency and Near Loss programme (behavioral programme). It is part of their bonus scheme.
Public affairs managers Monetary reward
Other: Environmental projects with Communities, promote packaging recovery
Public Affair Managers have in their MBO targets to work with communities for different Environmental projects, to promote packaging recovery in their countries. It is part of their bonus scheme, merit increase and career progression.

Who is entitled to benefit from these incentives?
The type of incentives
Incentivized performance indicator
Comment
All employees Recognition (non-monetary)
Efficiency project Behaviour change related indicator Other: Best Environmental performance competition
In most of our countries, there are different programs for recognition related to Environment: best idea for water/energy reduction, best essay for Environment protection, best Near Loss (behavioral programme). In addition, in January 2014 we launched a competition between all our countries: "Best Environmental performance": the main criteria were energy and water ratios reduction vs. the prior year. The winning country in 2014 was Greece; 2nd place: Austria; 3rd place: Switzerland.
Other: Production Managers and Supervisors
Monetary reward
Energy reduction target As part of their objectives they have energy reduction target.
Further Information
Page: CC2. Strategy
CC2.1
Please select the option that best describes your r isk management procedures with regard to climate ch ange risks and opportunities Integrated into multi-disciplinary company wide risk management processes
CC2.1a
Please provide further details on your risk managem ent procedures with regard to climate change risks and opportunities

Frequency
of monitoring
To whom are
results reported?
Geographical areas considered
How far into
the future are risks
considered?
Comment
Six-monthly or more frequently
Board or individual/sub-set of the Board or committee appointed by the Board
All countries in which we operate, all important project we handle, all business functions. Additionally, as part of Supplier Risk assessment process, we cover geographic area of Supplier’s operation.
> 6 years
The Board, its Committees, our Operating Committee, and the Group Chief Risk Officer monitor the risks and opportunities to which the Company is exposed. Function, project and BU General Managers own the risk and opportunity responses in the field (point of occurrence). Our strategic priorities – the 4Cs – provide a strategic framework to address risks and opportunities faced by the business. Monthly, senior country, business function and major project management review meetings verify the progress of the management of the identified risk exposure. The significant risks from these reviews, together with progress on agreed management actions, are reported quarterly to the Regional Directors and Group Chief Risk Officer for critical review. The Group Risk Forum on a bi annual basis evaluates operational responses and macroeconomic/strategic issues for escalation to the Operational Committee and Board Audit Committee.
CC2.1b
Please describe how your risk and opportunity ident ification processes are applied at both company and asset level CCHBC utilises a standardised Enterprise Risk Management (ERM) framework for the management of risks & opportunities. Outputs from this process are embedded into our business-planning activities. Climate change presents a significant long-term risk. This includes the risk of rising energy costs, threats to our agricultural supply chain, availability of water to our production facilities and suppliers, carbon taxes. Adverse weather conditions could reduce demand for our products and affect the price and availability of key crops. Increased regulation on carbon emissions could increase the cost of doing business. Carbon Emission regulatory risks: Future regulation may affect packaging, product delivery and distribution, it could increase the cost of doing business: at Corporate and production plant level. Manufact&Logistics risks: Production capabilities, resource availability (e.g. water) could impact operations and could interrupt the product supply at country level. Commodity cost risks: Price and availability of key crops could be affected and would impact specific countries. Other risks: Lack of leadership in combating climate change could harm our reputation. Sustainability opportunities: Our investments in onsite CHP units and energy efficiency may yield increased returns as energy prices rise. Our new cold drink equipment prepares us for possible limitations on energy or coolants and is a competitive advantage with customers tackling their own footprint. Warmer weather could lead to greater demand for our beverages at country and Corporate level. Manufacturing&Logistics opportunities: Water stewardship programmes protect our physical& social licence to operate. Other opportunities: Helping customers/consumers reduce their own footprint and promoting our efforts could deliver reputation benefits and more consumers. At plant level we have Risk process as part of Environmental Management system: 99.5% of our production volume is certified in ISO 14001.

CC2.1c
How do you prioritize the risks and opportunities i dentified? The Enterprise Risk Management (ERM) approach is used consistently across all business units and operations: the process documents all business related and financial risks against impact, likelihood, vulnerability, etc. The process also documents responsible mitigation plans and accountable managers. Risks are assessed qualitatively and quantitatively across business units, functions and projects. The qualitative assessments are graphically depicted in two ways, as heat maps and risk maps. The quantitative assessment produces cumulative probability curves, sensitivity and correlation analysis in bar chart and/or tornado forms. The Group Business Resilience Function aggregates risks for reviews by the Group Chief Risk Officer, Regional Directors and the Group Risk Forum. Risks, irrespective of classification, are also evaluated in a quantified risk model. This stage of the risk assessment process is distinct from the qualitative assessment described above as it assesses the residual exposure post management actions as opposed to the pre-management or inherent risk exposure. The ERM Framework and ERM Management approach documents outline the standardised assessment methodologies utilised. Standardised methodologies enables aggregation and detailed strategic evaluation. Risks monitoring is performed Monthly in Business Units, Quarterly reporting to Group Chief Risk Officer and Bi-Annual by Group Risk Forum.
CC2.1d
Please explain why you do not have a process in pla ce for assessing and managing risks and opportuniti es from climate change, and whether you plan to introduce such a process in future
Main reason for not having a process
Do you plan to introduce a process?
Comment
CC2.2
Is climate change integrated into your business str ategy? Yes
CC2.2a

Please describe the process of how climate change i s integrated into your business strategy and any ou tcomes of this process i. Our “Play to Win” strategic framework incorporates our values, key people enablers and 4 strategic objectives: Community Trust, Consumer Relevance, Customer Preference and Cost Leadership (4Cs). Climate change is integrated in Community Trust &Cost Leadership pillars. At every Board meeting in 2014, the Board reviewed the Group’s performance against its sustainability and community trust targets to ensure that these initiatives are fully integrated in our operating framework and in 2014 these were: our approach to regulations regarding packaging and packaging waste in the context of the EU Circular Economy and EPR; Efforts to address climate change and reduce carbon emissions in the context of 2014 UN IPCC report calling for drastic reductions in carbon emissions, discussions for our renewable energy strategy, carbon pricing opportunities and increased societal expectations; Tax transparency and natural capital accounting. The Social Responsibility Committee reviewed, and endorsed, the process for the annual assessment of material issues. The materiality assessment conducted in 2014 included input from stakeholders, employee surveys and business risks identified by the Business Resilience Function. Carbon&Energy, Water and Packaging Waste are part of our material issues. ii. Aspects: Strategy is influenced by the identified material issues and risks&opportunities related to climate change. This includes the risk of rising energy costs, threats to our agricultural supply chain, availability of water to our production facilities and suppliers, carbon taxes. Adverse weather conditions could reduce demand for our products and affect the price and availability of key crops. Increased regulation on carbon emissions could increase the cost of doing business; future regulation may affect packaging, product delivery and distribution, it could increase the cost of doing business: at Corporate and production plant level. Manufacturing&Logistics risks: Production capabilities, resource availability (water) could impact operations and could interrupt the product supply at country level. Commodity cost risks: Price and availability of key crops could be affected and would impact specific countries. Lack of leadership in combating climate change could harm our reputation. Opportunities: Our investments in onsite CHP units and energy efficiency may yield increased returns as energy prices rise. Our new cold drink equipment prepares us for possible limitations on energy or coolants and is a competitive advantage with customers tackling their own footprint. Warmer weather could lead to greater demand for our beverages at country level. Manufacturing&Logistics opportunities: Water stewardship programmes protect our physical & social license to operate. Other opportunities: Helping customers/consumers reduce their own footprint and promoting our efforts could deliver reputation benefits and more consumers. iii. Climate change influence of the short-term strategy: in operational practices: we introduced top 18 energy& Top 10 water savers mandatory for all production sites (we track quarterly their implementation); we started updating all of our Group Engineering standards (for different processes/production equipment) in order to incorporate the new Environmental requirements. In the new Global Fleet tender we introduced Environmental criteria (CO2 emissions and fuel consumption). iv. Climate change is part of our strategy since long time: we set our long-term carbon commitment in 2006 and they included: reduction of absolute Scope 1+2 emissions by 20% and intensity by 40% in 2020 vs.2004, reduction of Operational water footprint by 75% in 2020 vs.2004, energy and water ratio reduction by 40%, reduction of Total waste landfilled by 80% in 2020 vs.2004. In 2013 we set 1 more target: reduction of carbon intensity (Scope 1+2+3) by 25% in 2020 vs.2010. At market place we aim all of our newly purchased cold drink equipment in 2015 to be HFC-free and we are quite on track. Since 2008 and despite the challenging economic climate, we have been deploying combined heat and power technology in several of our bottling plants. CHP unit produces electricity, heating, cooling and carbon dioxide for product carbonation. It provides a cheaper, more consistent and cleaner source of electricity and thermal energy for our operations. Till 2014 we have 10 CHP units. The project is particularly relevant to our Nigerian business where main electricity supply is challenging and operating generators is expensive and not efficient. In addition to the CHP, we have 5 Italian plants with photovoltaic rooftop panels. In 2014 we invested € 4.3 million in energy savings activities in plants which avoided 5’463 tonnes of CO2, CHPs saved 49’400 tonnes CO2. Packaging light-weighting projects led to 31’920 tonnes and purchasing climate friendly coolers for our customers saved 157’170 tonnes of CO2. For water we performed every 5 years for each production site, a formal identification and assessment of social, environmental, economic, regulatory& political risks to sources of process water and develop a management plan designed to reduce risks to water used in manufacturing. We use Global Water Tool to project the annual renewable water supply per person (year 2025) for each of our bottling sites. In our Procurement strategy is also the support of capacity expansion in the Russian sugar beet industry, which will eliminate our need to import sugar in this important market by 2015. v. Our Italian plants with photovoltaic rooftop panels saved 4.2 million kWh of electricity in 2014, providing us with significant cost savings and enhancing our progress on cost leadership in the marketplace. Energy savings activities in plants saved € 2.1 million, Packaging light-weighting projects saved €2.13 million.

Purchasing climate friendly coolers for our customers gives us advantage over our competitors and we helped our customers to save energy and cost at their premises. Our support to the Russian beet sugar comprised 57% of our Russian sugar needs in 2013, 85% in 2014 and is expected to reach 100% in 2015: it is with cost benefit and sustainability benefits on the local farming communities. vi. We continue working and investing towards our long-term Carbon, Water, Waste, Sustainable supply targets (please see 2014 Integrated Annual Report). We joined Sedex in 2014 (platform for ethical and sustainable supply chains). We started evaluating the concept of natural capital accounting (including true cost of water and internal carbon pricing). We began actively hedging energy input costs in 11 of our markets in 2014, and we have joined forces with our CHP (Combined Heat and Power) strategic suppliers to negotiate rates together. These actions, capitalising on excellent market opportunities created in 2014, have positioned us well for the future.
CC2.2b
Please explain why climate change is not integrated into your business strategy
CC2.2c
Does your company use an internal price of carbon? No, but we anticipate doing so in the next 2 years
CC2.2d
Please provide details and examples of how your com pany uses an internal price of carbon
CC2.3
Do you engage in activities that could either direc tly or indirectly influence public policy on climat e change through any of the following? (tick all th at apply) Direct engagement with policy makers Trade associations

Other
CC2.3a
On what issues have you been engaging directly with policy makers?
Focus of legislation
Corporate Position
Details of engagement
Proposed legislative solution
Other: ERP (Extended Producer Responsibility), landfill taxes and circular economy
Support with minor exceptions
We take part in stakeholder roundtable on all the legal changes at EU level - with DG environment and we chaired the EPR (Extended Producer Responsibility) development.
We influence policy positions and work to achieve consensus amongst relevant stakeholders. We also work internally with experts across the system to share best practice. We support Extended Producer Responsibility and believe it is the most sustainable solution for packaging waste. We also support enhanced collection targets which results in diversion of landfill. On landfill taxes and landfill gate fees, we support incentivized selective collection and closing the loop. We support the concept of the circular economy provided it allows opportunities for growth and flexibility.
CC2.3b
Are you on the Board of any trade associations or pr ovide funding beyond membership? Yes
CC2.3c
Please enter the details of those trade association s that are likely to take a position on climate cha nge legislation

Trade association
Is your position on
climate change
consistent with
theirs?
Please explain the trade association's position
How have you, or are you attempting to, influence the position?
UNESDA, The Union of European Beverages Associations
Consistent
UNESDA represents a major part of the innovative and dynamic non-alcoholic beverages industry, uniting major producers as well as national beverage associations in 27 EU and two non-EU countries as well as the major international beverage companies. UNESDA members recognise that environmental protection is a joint effort of society and therefore requires a common, consistent and co-ordinated approach. Energy – a commitment to conservation: reduce energy use, reduce emissions, report and communicate our footprint. Packaging: reduce, recover, recycle.
We support the positions and commitments and participate in the working groups. They are integrated in our strategy and are regularly presented to our Board Social Responsibility Committee.
BIER (Beverage Industry Environmental Round Table)
Consistent
The mission of BIER is to bring together leading global beverage companies to define a common framework for stewardship, drive continuous improvement in industry practices and performance, and inform public policy in the areas of Water Conservation and Resource Protection, Energy Efficiency and Climate Change Mitigation. BIER has been leading in developing methodologies for calculating water and carbon footprinting and is working closely with the Carbon Trust, the World Resources Institute and the World Business Council for Sustainable Development.
We support the positions and commitments and participate in the working groups. They are integrated in our strategy and are regularly presented to our Board Social Responsibility Committee.
CC2.3d
Do you publicly disclose a list of all the research organizations that you fund?
CC2.3e
Do you fund any research organizations to produce o r disseminate public work on climate change?
CC2.3f
Please describe the work and how it aligns with you r own strategy on climate change
CC2.3g
Please provide details of the other engagement acti vities that you undertake We also work closely together through specific environmental platforms such as the European Organisation for Packaging and the Environment (EUROPEN), World Business Council for Sustainable Development (WBCSD) and the Water Footprint Network. Since 2005, we have partnered with the International Commission for the Protection of the Danube River (ICPDR), conducting conservation, advocacy, awareness and education in 11 countries. We now have partnerships to conserve and promote the following rivers, water bodies and watersheds: Danube Basin, Danube River, Tisza River, Vistula River, Volga River, Sava River, Vrbas River, Yelnya Bog, Lake Baïkal, in addition to beaches and sea shores in Greece, Ireland and the Baltics. Coca-Cola HBC is a founder signatory of the UN Global Compact's CEO Water Mandate. An in-depth discussion of our water stewardship strategy and progress can be found in our 2014 Integrated Annual Report and COP section of it. Coca-Cola HBC is a founder signatory of the UN Global Compact's Caring for Climate initiative. We provide detailed information on our approach and results in our 2014 Integrated Annual Report and in COP section of the same Report.
CC2.3h
What processes do you have in place to ensure that all of your direct and indirect activities that inf luence policy are consistent with your overall clim ate change strategy? All activities and positions are aligned with the Group Sustainability Council which is at Operational Committee level and they meet quarterly. Group Sustainability Council reports and makes updates every quarter to the Board Social Responsibility Committee. The outputs are integrated in our strategy: in Community Trust part of the "4C's" strategic framework. During 2014 the Social Responsibility Committee reviewed and provided guidance and insights to advance the Group’s environmental and social strategies in the following areas: • The Group’s approach to regulations regarding packaging and packaging waste in the context of the EU Circular Economy (zero waste programme for Europe) and to extended producer responsibilities for used packaging; • Efforts to address climate change and reduce carbon emissions were discussed in the context of the 2014 UN Intergovernmental Panel on Climate Change’s report calling for drastic reductions in carbon emissions, specifically, discussions included the Group’s renewable energy strategy, carbon pricing opportunities and increased societal expectations; • Tax transparency and natural capital accounting. The Social Responsibility Committee reviewed, and endorsed, the process for the annual assessment of material issues. The materiality assessment conducted in 2014 included input from stakeholders (received both online and at the Annual Stakeholder Engagement Forum), input from employee surveys and business risks identified by the Business Resilience Function.

CC2.3i
Please explain why you do not engage with policy ma kers
CC2.4
Would your organization's board of directors suppor t an international agreement between governments on climate change, which seeks to limit global temperature rise to under two degree Celsius from pr e-industrial levels in line with IPCC scenarios such as RCP2.6? No opinion
CC2.4a
Please describe your board's position on what an ef fective agreement would mean for your organization and activities that you are undertaking to help deliver this agreement at the 2015 United Nations Clim ate Change Conference in Paris (COP 21) We are working to issue our position on some of the 6 initiative of the "Road to Paris": - Report climate change information in mainstream reports: we already have all information in our Integrated Annual Report; - Adopt a science-based GHG emissions reduction target: we participated in the beta-testing of Sectoral Decarbonization Approach (SDA) tool developed by WWF, CDP and WRI; - Put a price on carbon: we started working on that and we will have soon our internal carbon price; - Deforestation (not applicable for our business).
Further Information
Page: CC3. Targets and Initiatives
CC3.1
Did you have an emissions reduction target that was active (ongoing or reached completion) in the repo rting year? Absolute and intensity targets

CC3.1a
Please provide details of your absolute target
ID
Scope
% of emissions in
scope
% reduction from base
year
Base year
Base year emissions
(metric tonnes CO2e)
Target year
Comment
Abs1 Scope 1+2 100% 20% 2004 830095.68 2020
20% reduction in 2020 vs. 2004 - it is communicated in all our CSR and Integrated Annual Reports. (In 2014 reporting we included the energy from all our remote properties and we did a historical recalculation for all the rest years - that's why the figure for baseline year is different than the figure in previous year CDP submission).
CC3.1b
Please provide details of your intensity target
ID
Scope
% of emissions in scope
% reduction from base
year
Metric
Base year
Normalized base year emissions
Target year
Comment
Int1 Scope 1+2
100% 40%
Other: Grams CO2 per litre produced beverage
2004 95.16 2020
40% reduction in 2020 vs. 2004 is communicated in all our CSR and Integrated Annual Reports. (In 2014 reporting we included the energy from all our remote properties and we did a historical recalculation for all the rest years - that's why the figure for baseline year is different than the figure in previous year CDP submission).
Int2 Scope 1+2+3
100% 25%
Other: Grams CO2 per litre produced beverage
2010 441.44 2020 It is a commitment done in 2013: to reduce the intensity of all our emissions (Scope 1+2+3) per litre of produced beverages in 2020 vs. 2010 by 25%.

CC3.1c
Please also indicate what change in absolute emissi ons this intensity target reflects
ID
Direction of change
anticipated in absolute Scope
1+2 emissions at target
completion?
% change anticipated in
absolute Scope 1+2 emissions
Direction of change
anticipated in absolute Scope 3
emissions at target
completion?
% change anticipated in absolute
Scope 3 emissions
Comment
Int1 Decrease 15 Decrease 0 As the target is for Scope 1+2 only, we don't expect change to Scope 3 emissions. The figures are approximate, based on the current production/logistics setting and historical trends.
Int2 Decrease 3 Decrease 10
Scope 3 is the biggest part of our emissions, so we expect more impact there. The figures are approximate, based on the current production/logistics setting, packaging optimization initiatives, coolers at market place strategy and historical trends.
CC3.1d
For all of your targets, please provide details on the progress made in the reporting year
ID
% complete (time)
% complete (emissions)
Comment
Abs1 62.5% 67.1% We have 13.4% less Absolute emissions Scope 1+2 in 2014 vs. baseline year 2004. The production volume has been increased by 31.5% in that period (recalculation based on all aquisitions is included in the volume as well).
Int1 62.5% 85.4% We have 34.2% less emissions in our Scope 1+2 Intensity in 2014 vs. baseline year 2004. Int2 40% 57.9% We have 14.5% less emissions in our Scope 1+2+3 intensity in 2014 vs. the baseline year of 2010.

CC3.1e
Please explain (i) why you do not have a target; an d (ii) forecast how your emissions will change over the next five years
CC3.2
Does the use of your goods and/or services directly enable GHG emissions to be avoided by a third part y? Yes
CC3.2a
Please provide details of how the use of your goods and/or services directly enable GHG emissions to b e avoided by a third party As part of our climate change strategy, we offer to our customers energy efficient coolers and HFC-free coolers. For the old coolers at market place which are not so energy efficient as the new ones, we perform retrofitting by installing Energy Management Devices (EMD), LED lights, insulation etc. In 2014, we spent € 86.5 million in new energy efficient coolers and these coolers generated 234.7 Million kWh energy saving for our customers which saved also 157'172 tonnes of CO2e. We also continued to roll out Plantbottle™, the first fully recyclable PET bottle to use renewable plant-based content. The package was developed by The Coca-Cola Company and includes up to 30% plant-based material. Plantbottle™ now is used in Bulgaria, Serbia, Italy, Switzerland, Russia, Romania and we plan to reach 12 countries in 2015. All our Juices packed in bricks use FSC certified packaging from our suppliers Tetrapak and Elopak. PET light-weighting initiatives in 2014 allowed our consumers to avoid 2’342 tonnes of PET waste. In 2014 we invested 6.96 million EUR in packaging optimization initiatives. For our bottled mineral water we developed a new PET bottle called Twist, which uses, on average, 22% less plastic- it was launched in Greece and Hungary in 2014 and the plan is to be implemented in other countries in 2015. We are also increasing our use of recycled or renewable content. Since recycling of metal and glass is well-established, we focus on increasing the recycled content of our PET bottles. In 2014 our use of recycled PET (rPET) was 13’267 tonnes and rose by 31.5% vs. 2013 - it also avoid CO2 emissions on post-consumer waste.
CC3.3

Did you have emissions reduction initiatives that w ere active within the reporting year (this can incl ude those in the planning and/or implementation phases) Yes
CC3.3a
Please identify the total number of projects at eac h stage of development, and for those in the implem entation stages, the estimated CO2e savings
Stage of development
Number of projects
Total estimated annual CO2e savings in metric tonne s CO2e (only for rows marked *)
Under investigation 10
To be implemented* 97 13600 Implementation commenced* 32 2600 Implemented* 420 194600 Not to be implemented 111 3900
CC3.3b
For those initiatives implemented in the reporting year, please provide details in the table below

Activity type
Description of activity
Estimated annual CO2e
savings (metric tonnes CO2e)
Scope
Voluntary/ Mandatory
Annual monetary savings
(unit currency
- as specified in CC0.4)
Investment required
(unit currency -
as specified in CC0.4)
Payback period
Estimated lifetime of
the initiative
Comment
Energy efficiency: Processes
Our Top 18 energy savers are obligatory for all production sites. In 2014 we implemented: cooling equipment improvements in eight countries, improvements in lighting efficiency in 12 countries, electrical power optimisation in 3 countries, ceramic reflectors usage for PET blowing machines in 6 countries, insulation upgrades in most of our countries etc. .
5000
Scope 1 Scope 2
Voluntary 2100000 4200000 1-3
years 6-10 years
Product design
Packaging optimization initiatives: light weighting projects in 10 countries, using bio-PET material in 6 countries, increased recycling content in PET material.
31000 Scope 3
Voluntary
2128900 6960000 4-10 years
6-10 years
Fugitive emissions reductions
Air and steam leakage prevention programmes are obligatory for implementation in all our sites and they are monitored regularly.
400
Scope 1 Scope 2
60000 50000 <1 year 3-5 years
Transportation: fleet
Green IT initiatives: avoiding traveling by plane and cars when using videoconferencing for our meetings and projects - 8'680 Video Conferences are performed in 2014.
8000
Scope 1 Scope 3
Voluntary 8600000 2600000 1-3
years 3-5 years
The investment in video conferencing facilities is done in several years. In addition, there is a cost which is opex, not capex (it is cost

Activity type
Description of activity
Estimated annual CO2e
savings (metric tonnes CO2e)
Scope
Voluntary/ Mandatory
Annual monetary savings
(unit currency
- as specified in CC0.4)
Investment required
(unit currency -
as specified in CC0.4)
Payback period
Estimated lifetime of
the initiative
Comment
(fee) paid per user) and it is not considered in the figure presented in the table.
Behavioral change
We have different recognition programmes in our countries related to Environment, including the Best Environmental Performance Award per country. To further engage our people in eco-efficiency initiatives and strengthen focus on natural resource use, we developed a new leading environmental indicator, Near Loss. All water and energy saving ideas and waste minimisation ideas are considered Near Losses. Since its launch in all our 66 plants in 2014, more than 1,370 Near Losses have been reported and 78% of these have been solved.
200
Scope 1 Scope 2
Voluntary 60000 20000 <1 year 3-5 years
Other
Energy efficiency of the coolers we provide to our customers: new energy efficient coolers and retrofitting of the old ones. These provide saving at customers' site.
150000 Scope 3
Voluntary
86500000 0 4-10 years
6-10 years
No saving for us, as the saving in electricity remains for our customers. It is rather competitive advantage for us and sustainability

Activity type
Description of activity
Estimated annual CO2e
savings (metric tonnes CO2e)
Scope
Voluntary/ Mandatory
Annual monetary savings
(unit currency
- as specified in CC0.4)
Investment required
(unit currency -
as specified in CC0.4)
Payback period
Estimated lifetime of
the initiative
Comment
commitment.
CC3.3c
What methods do you use to drive investment in emis sions reduction activities?
Method
Comment
Compliance with regulatory requirements/standards
We reaffirm our commitment to transforming Coca-Cola Hellenic into a low-carbon business. We also would like to be among the companies which are leaders in Sustainability. Carbon management is a strategic priority for the Company and we are already seeing business benefits resulting from ongoing investments in energy efficiency.
Compliance with regulatory requirements/standards Future regulation may affect packaging, product delivery and distribution.
Internal incentives/recognition programs
We have dedicated Energy/Water improvement teams in each of our plants. They have objectives to propose energy/water saving initiatives. Additionally we have Best Environmental Performance award: the winning country is the one with the biggest % improvement in energy and water use vs. the previous year result.
Dedicated budget for low carbon product R&D
We not only invest in low-carbon technologies but actively promote these solutions. We mark the opening of each CHP unit with a climate-themed event for local stakeholders, demonstrating the technology and emphasising the need for action. In 2014 CO2 saving from CHP plants are 49'388 tonnes.
Dedicated budget for low carbon product R&D
Our comprehensive packaging and recycling strategy eliminated an estimated more than 31'000 tonnes of embedded carbon in 2014. In 2014 we invested 6.96 million EUR in packaging reduction initiatives.
Other We work with our suppliers in order to be able to buy less intensive carbon products like for our carbon reduction programme for coolers and other cold drink equipment. In 2014 we saved more than 150'000 tonnes CO2 from climate-friendly coolers. Also, together with our packaging suppliers we develop new pack design which allow light-weighting of our PET bottles.
Method
Comment
Other
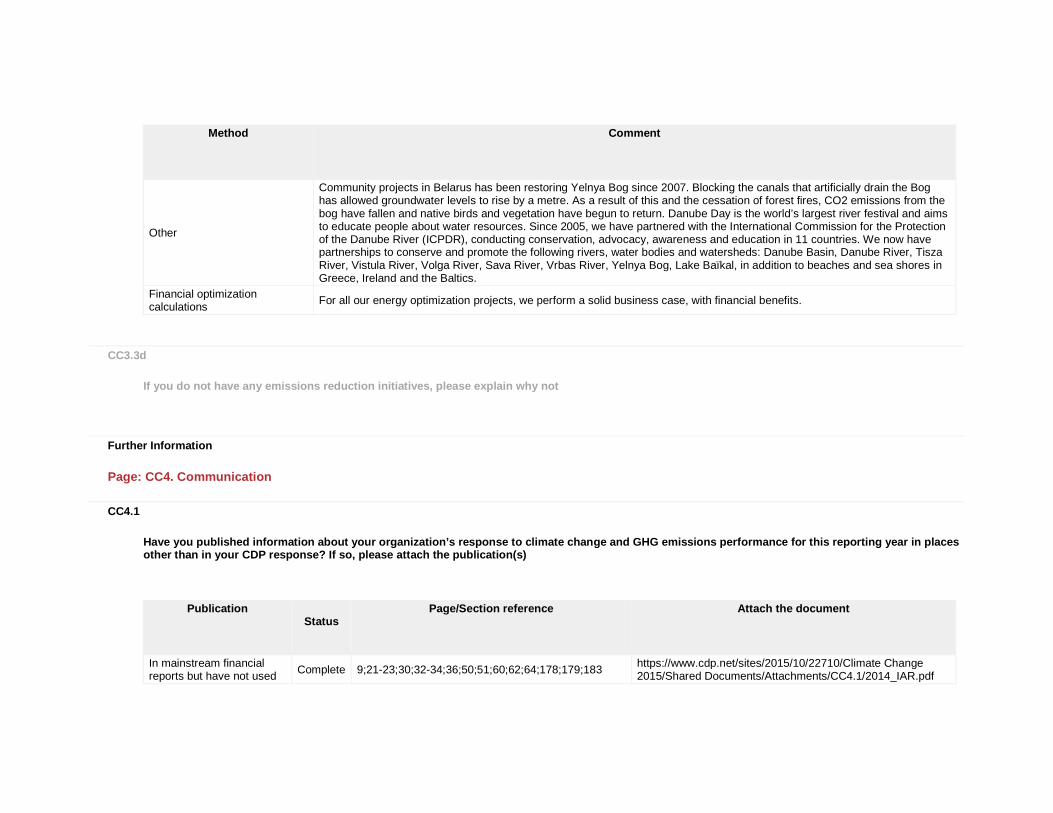
Community projects in Belarus has been restoring Yelnya Bog since 2007. Blocking the canals that artificially drain the Bog has allowed groundwater levels to rise by a metre. As a result of this and the cessation of forest fires, CO2 emissions from the bog have fallen and native birds and vegetation have begun to return. Danube Day is the world’s largest river festival and aims to educate people about water resources. Since 2005, we have partnered with the International Commission for the Protection of the Danube River (ICPDR), conducting conservation, advocacy, awareness and education in 11 countries. We now have partnerships to conserve and promote the following rivers, water bodies and watersheds: Danube Basin, Danube River, Tisza River, Vistula River, Volga River, Sava River, Vrbas River, Yelnya Bog, Lake Baïkal, in addition to beaches and sea shores in Greece, Ireland and the Baltics.
Financial optimization calculations
For all our energy optimization projects, we perform a solid business case, with financial benefits.
CC3.3d
If you do not have any emissions reduction initiati ves, please explain why not
Further Information
Page: CC4. Communication
CC4.1
Have you published information about your organizat ion’s response to climate change and GHG emissions p erformance for this reporting year in places other than in your CDP response? If so, please attach the publication(s)
Publication
Status
Page/Section reference
Attach the document
In mainstream financial reports but have not used Complete 9;21-23;30;32-34;36;50;51;60;62;64;178;179;183
https://www.cdp.net/sites/2015/10/22710/Climate Change 2015/Shared Documents/Attachments/CC4.1/2014_IAR.pdf

Publication
Status
Page/Section reference
Attach the document
the CDSB Framework
In voluntary communications
Complete GRI COP report (Communication on Progress) for UN Global Compact in 2014 was part of our Integrated Report (page 182 to 186)
https://www.cdp.net/sites/2015/10/22710/Climate Change 2015/Shared Documents/Attachments/CC4.1/2014_IAR.pdf
Further Information
Module: Risks and Opportunities
Page: CC5. Climate Change Risks
CC5.1
Have you identified any inherent climate change ris ks that have the potential to generate a substantiv e change in your business operations, revenue or expenditure? Tick all that apply Risks driven by changes in regulation Risks driven by changes in physical climate parameters Risks driven by changes in other climate-related developments
CC5.1a
Please describe your inherent risks that are driven by changes in regulation

Risk driver
Description
Potential impact
Timeframe
Direct/ Indirect
Likelihood
Magnitude of impact
Estimated financial
implications
Management method
Cost of
management
Carbon taxes
The risk of introduction of carbon taxes is more and more on the agenda, especially for EU countries. We also expect this risk to be increased after the United Nations Climate Change Conference, COP21 in Paris, France in 2015. The carbon taxes would be on Scope 1 and 2 gross emissions and would increase our operational cost. We estimate 17 EUR/tonne of CO2.
Increased operational cost
3 to 6 years
Direct Very likely Medium
17 EUR per tonne CO2 emissions (Scope 1 and 2) = 12'200'000 EUR per year.
We aim to reduce our absolute scope 1+2 carbon emissions by 20% by 2020 vs. 2004 and to reduce relative (intensity) Scope 1+2 emissions by 40% by 2020 vs. 2004. Also we are working currently to set new, more ambitious, science based carbon reduction targets. We have invested in a range of projects and technology to reduce our carbon emissions. Across all of CCH’s operations actions taken to mitigate scope 1 and 2 energy use: •Investment in Photovoltaics in 5 Italian plants which saved more than 4.2 million kWh energy every year and 1'664 tonnes CO2; •Investment in 10 CHP plants which saves every year appr. 49'500 tonnes of CO2; •Investment in energy efficiency practices and processes in our plants: 4.3 million EUR
12 million EUR

Risk driver
Description
Potential impact
Timeframe
Direct/ Indirect
Likelihood
Magnitude of impact
Estimated financial
implications
Management method
Cost of
management
investment in 2014 lead to 5'463 tonnes of CO2 saving; •We are in a process of developing an internal price on carbon in order to invest those money in renewable energy, energy efficiency etc.
Product efficiency regulations and standards
Future regulation may affect packaging, product delivery and distribution.
Increased operational cost
3 to 6 years
Indirect (Supply chain)
Very likely Medium-high
57'000'000 EUR.
Our investment in packaging minimization and maximizing volumes of recycled content in our packaging will serve to mitigate the exposure to future regulation around these areas. Every year we have solid packaging reduction programmes in each country: in 2014 we invested 6.96 million EUR in those initiatives and we saved >31'900 tonnes CO2. We are also increasing our use of recycled or renewable content. In 2014, our use of recycled PET (rPET) rose by 31.5%. We also continued to roll out Plantbottle™, the first fully recyclable PET
70'000'000 EUR

Risk driver
Description
Potential impact
Timeframe
Direct/ Indirect
Likelihood
Magnitude of impact
Estimated financial
implications
Management method
Cost of
management
bottle to use renewable plant-based content - in 2014 we have 6 countries which use Plantbottle™. Collection, recovery and recycling of our packages is another key focus. To date, we have helped to set up 19 recovery organisations. As a result, more than 128.5 million people have access to collection and recycling infrastructure- in some countries, this marks the first residential collection of any waste stream in rural communities. In 2014, these organisations recycled or recovered the equivalent of 73% of our packaging.
CC5.1b
Please describe your inherent risks that are driven by change in physical climate parameters

Risk driver
Description
Potential impact
Timeframe
Direct/ Indirect
Likelihood
Magnitude of impact
Estimated financial
implications
Management method
Cost of
management
Induced changes in natural resources
Production capabilities, supply chain, consumer demand could be affected. Increased climate uncertainty and changing weather patterns are likely to have an impact on the supply chain of key raw materials required by CCH to manufacture our products. We consider an increase in the costs of many of our raw materials likely in the medium term with a 5% increase in sugar costs.
Increased operational cost
>6 years Indirect (Supply chain)
Likely Medium-high
5% increasing of the sugar price. Sugar represents 12.5% of our COGS (Cost of Goods Sold). COGS is publically available in our Annual reports.
We work with our suppliers to create joint value and reduce costs, complexity and minimize impact on environment. We help the Russian sugar industry to develop its beet sugar capacity, eliminating the need to import sugar for our operations in the country by 2015. We worked together with suppliers to invest over $100million to increase local production of high-quality beet sugar. As a result, Russian beet sugar comprised 85% of our supply in 2014 and we aim to grow this to 100% in 2015. All suppliers are required to comply with the Coca-Cola Supplier Guiding Principles (SGP), including areas such as workplace and human rights, environment and management systems. For 2014, 85% of all contracts were SGP compliant and plans to address the remaining 15% are in place for
100'000'000

Risk driver
Description
Potential impact
Timeframe
Direct/ Indirect
Likelihood
Magnitude of impact
Estimated financial
implications
Management method
Cost of
management
2015. Further, supply points were audited in 2014. Tier 1 suppliers required to achieve ISO 14001 certification. Supplier Risk Assessment (Supply Base Assessment) which we performed annually, include water stress and energy use risks.
Change in precipitation extremes and droughts
Water scarcity could restrict the ability of individual sites to produce product for sales. Production is distributed across 28 countries so the chances of a proportion of our global production being effected over the longer term are high.
Inability to do business
>6 years Direct Very likely High
1% of sales revenue (sales revenue is publically available in our 2014 Integrated Annual Report).
We use Global Water Tool and we populated our plant water data. For 2014, 17.4% of our plants are in water-stressed areas (<1,700 m3/person/year). We have solid water reduction programme: we have our Top 10 water savers which are obligatory for all plants, at the end of 2014 the implementation ratio of Top 10 water savers were 56.5%. We invested more than €5.8 million in water saving projects in more than 20 countries during 2014. These efforts saved more than 1.1 million cubic metres of water. Our target is
10'000'000 EUR (water saving programmes, community programmes).

Risk driver
Description
Potential impact
Timeframe
Direct/ Indirect
Likelihood
Magnitude of impact
Estimated financial
implications
Management method
Cost of
management
to reduce water use ratio by 40% in 2020 vs. 2004 and in 2014 we achieved 26% reduction vs. 2004. In each plant we have in-depth Source Vulnerability Assessment and Source Water Protection Programme to ensure we are water sustainable in the future. Since 2011, 100% of our wastewater has been treated to a level that supports aquatic life. Also we are partnering with communities: The Green Danube Partnership comprises Coca-Cola HBC, The Coca-Cola Company, the International Commission for the Protection of the Danube River (ICPDR) and various national partners. The partnership has been running since 2005 and is active Austria, Bosnia & Herzegovina, Slovakia, Hungary, Croatia, Serbia, Romania, Bulgaria,

Risk driver
Description
Potential impact
Timeframe
Direct/ Indirect
Likelihood
Magnitude of impact
Estimated financial
implications
Management method
Cost of
management
Ukraine, Slovenia and Czech Republic.
CC5.1c
Please describe your inherent risks that are driven by changes in other climate-related developments
Risk driver
Description
Potential impact
Timeframe
Direct/ Indirect
Likelihood
Magnitude of impact
Estimated financial
implications
Management method
Cost of
management
Fluctuating socio-economic conditions
Price and availability of key crops (e.g. sugar beet) could be affected by a combination of the destabilizing effect of changing weather patterns along with growing populations, increasing demand from a growing middle class consumer and other trends is likely to impact the costs and availability of a variety of the raw materials required
Increased operational cost
3 to 6 years
Indirect (Supply chain)
Likely Medium-high
5% increasing of the sugar price. Sugar represents 12.5%.of our COGS (Cost of Goods Sold). COGS is publically available in our Annual report.
We work with our suppliers to create joint value and reduce costs, complexity and minimize impact on environment. We help the Russian sugar industry to develop its beet sugar capacity, eliminating the need to import sugar for our operations in the country by 2015. We worked together with suppliers to invest over $100million to increase local production of high-quality beet sugar. As a result, Russian beet sugar comprised 85%
100'000'000

Risk driver
Description
Potential impact
Timeframe
Direct/ Indirect
Likelihood
Magnitude of impact
Estimated financial
implications
Management method
Cost of
management
to produce our product.
of our supply in 2014 and we aim to grow this to 100% in 2015. All suppliers are required to comply with the Coca-Cola Supplier Guiding Principles (SGP), including areas such as workplace and human rights, environment and management systems. For 2014, 85% of all contracts were SGP compliant and plans to address the remaining 15% are in place for 2015. Further, supply points were audited in 2014. Tier 1 suppliers required to achieve ISO 14001 certification. Supplier Risk Assessment (Supply Base Assessment) which we performed annually, include water stress and energy use risks.
Changing consumer behaviour
Poor/increment weather conditions could reduce demand
Reduced demand for goods/services
>6 years Direct About as likely as not
High
Average impact of 1 degree per month in 1

Risk driver
Description
Potential impact
Timeframe
Direct/ Indirect
Likelihood
Magnitude of impact
Estimated financial
implications
Management method
Cost of
management
for our beverages. Average impact of 1 degree per month in 1 country: 115'000 Unit Cases
country: 115'000 Unit Cases which can lead to appr. 0.2% decrease in sold cases/sales revenue.
Reputation
Lack of leadership in combatting climate change could harm our reputation. CCH paces a high value on customer confidence in the business and acknowledges that we need to be a good corporate citizen across all our markets to continue to operate. Any reputational harm could be significant with a 1% reduction in sales volumes.
Reduced stock price (market valuation)
>6 years Indirect (Client)
More likely than not Medium
1% reduction in sales volume.
Our target is to reduce our absolute scope 1+2 carbon emissions by 20% by 2020 vs. 2004 and to reduce relative scope (intensity) 1+2 emissions by 40% by 2020 vs. 2004. We built 10 CHP plants and 5 PV roof panels in our plants. We invested 4.3 million in energy saving programmes in our plants in 2014. All initiatives led to 4.2% reduction of absolute Scope 1+2 emissions in 2014 vs. 2013. Also we aim to reduce our Scope 3 emissions: Together with suppliers, we developed hydrofluorocarbon-free (HFC-free)
86'000'000 EUR in new energy efficient and eco-friendly coolers; 8'000'000 EUR for energy saving projects in the plants; 70'000'000 EUR for packaging initiatives and recovery.

Risk driver
Description
Potential impact
Timeframe
Direct/ Indirect
Likelihood
Magnitude of impact
Estimated financial
implications
Management method
Cost of
management
coolers which are up to 63% more efficient than 2004 models. In 2014, HFC-free models accounted for 86% of the new coolers purchased. All of our new equipment will be HFC-free by 2015. We are also working to retrofit existing equipment in the marketplace with Energy Management Devices, LED Lighting and insulation. For packaging, we work to light-weighting the packaging we used, to use more recycled content and renewable sources (like plant PET bottle (Plantbottle™), the first fully recyclable PET bottle to use renewable plant-based content).
CC5.1d
Please explain why you do not consider your company to be exposed to inherent risks driven by changes in regulation that have the potential to generate a substantive change in your business oper ations, revenue or expenditure

CC5.1e
Please explain why you do not consider your company to be exposed to inherent risks driven by physical climate parameters that have the potential to generate a substantive change in your business oper ations, revenue or expenditure
CC5.1f
Please explain why you do not consider your company to be exposed to inherent risks driven by changes in other climate-related developments that have the potential to generate a substantive change in your business operations, revenue or expenditur e
Further Information
Page: CC6. Climate Change Opportunities
CC6.1
Have you identified any inherent climate change opp ortunities that have the potential to generate a su bstantive change in your business operations, revenue or expenditure? Tick all that apply Opportunities driven by changes in regulation Opportunities driven by changes in physical climate parameters Opportunities driven by changes in other climate-related developments

CC6.1a
Please describe your inherent opportunities that ar e driven by changes in regulation
Opportunity driver
Description
Potential impact
Timeframe
Direct/Indirect
Likelihood
Magnitude of impact
Estimated financial
implications
Management method
Cost of
management
Carbon taxes
If we are among the leaders in carbon reduction, we would avoid taxes compared to other less efficient companies (or at least we will pay much less).
Reduced operational costs
3 to 6 years Direct Very likely Medium
17 EUR per tonne CO2 emissions (Scope 1 and 2) = 12'200'000 EUR per year
We aim to reduce our absolute scope 1+2 carbon emissions by 20% by 2020 vs. 2004 and to reduce relative (intensity) Scope 1+2 emissions by 40% by 2020 vs. 2004. CCH is working to limit both our environmental impact and the introduction of carbon taxes by investing in a range of projects and technology to reduce our carbon emissions. Across all of CCH’s operations actions taken to mitigate scope 2 energy use: •Investment in Photovoltaics in Italy which saved more than 4.2 million kWh energy every year and 1'664 tonnes CO2; •Investment in 10 CHP plants which saves every year appr. 49'500 tonnes of CO2; •Investment in energy efficiency
12 million EUR

Opportunity driver
Description
Potential impact
Timeframe
Direct/Indirect
Likelihood
Magnitude of impact
Estimated financial
implications
Management method
Cost of
management
practices and processes in our plants: 4.3 million EUR investment in 2014 lead to 5'463 tonnes of CO2 saving; •We are in a process of developing an internal price on carbon in order to invest those money in renewable energy, energy efficiency projects etc; •We are working currently on setting new, very ambitious, science based carbon reduction target.
CC6.1b
Please describe the inherent opportunities that are driven by changes in physical climate parameters
Opportunity driver
Description
Potential impact
Timeframe
Direct/ Indirect
Likelihood
Magnitude of impact
Estimated financial
implications
Management method
Cost of
management
Induced changes in natural resources
Water stewardship programmes protect our physical and social license
Other: Guarantees our well licenses to
1 to 3 years
Direct Virtually certain
High
18% of total sales volume (it is the % of water SKUs
Across our production sites we invest in technology and water efficiency practice to
10'000'000 EUR (water saving programmes,

Opportunity driver
Description
Potential impact
Timeframe
Direct/ Indirect
Likelihood
Magnitude of impact
Estimated financial
implications
Management method
Cost of
management
to operate. Continued and growing uncertainty in rainfall patterns, combined with growing demand for limited water resource make it increasingly important for CCH to demonstrate commitment to protecting the natural and man-made infrastructure which sustains our water supplies.
operate in our portfolio).
continue to improve our water efficiency (litres per litre product bottled). Our target is to reduce our water footprint by 75% in 2020 vs.2004 and in 2014 we reached 64.4% reduction vs. 2004. We have solid water reduction programme: Top 10 water savers are obligatory for all plants, at the end of 2014 the implementation ratio of Top 10 water savers were 56.5%. We invested more than €5.8 million in water saving projects in more than 20 countries in 2014. These efforts saved > 1.1 million cubic metres of water. Our target is to reduce water use ratio by 40% in 2020 vs.2004 and in 2014 we achieved 26% reduction vs. 2004. In 2013, European Water Stewardship (EWS) Gold Level certification was awarded to Coca-
community programmes).

Opportunity driver
Description
Potential impact
Timeframe
Direct/ Indirect
Likelihood
Magnitude of impact
Estimated financial
implications
Management method
Cost of
management
Cola HBC’s Romanian plant in Ploiesti- our company was one of the first to gain certification in EWS. In 2014 we achieved 8 more Gold certificates in European Water Stewardship in our plants in Switzerland, Serbia, Hungary, Poland, Austria, Romania. We have commitment to certify all our plants in Water Stewardship standards till 2020. The Green Danube Partnership comprises Coca-Cola HBC, The Coca-Cola Company, International Commission for the Protection of the Danube River (ICPDR) and various national partners. The partnership has been running since 2005 and is active Austria, Bosnia& Herzegovina, Slovakia, Hungary, Croatia, Serbia, Romania, Bulgaria, Ukraine, Slovenia and Czech Republic.

CC6.1c
Please describe the inherent opportunities that are driven by changes in other climate-related develop ments
Opportunity driver
Description
Potential impact
Timeframe
Direct/ Indirect
Likelihood
Magnitude of impact
Estimated financial
implications
Management method
Cost of
management
Fluctuating socio-economic conditions
Our new cold drink equipment is a competitive advantage with customers tackling their own footprint.
Wider social benefits
1 to 3 years
Direct Very likely Medium-high
25.9 million EUR saving at customers' site due to energy saving from our energy efficient coolers.
We have target to reduce our Scope 1+2+3 relative emissions by 25% by 2020 vs. 2010. Together with suppliers, we developed hydrofluorocarbon-free (HFC-free) coolers which are up to 63% more efficient than 2004 models. In 2014, HFC-free models accounted for 86% of the new coolers purchased. All of our new equipment will be HFC-free by 2015. We are also working to retrofit existing equipment in the marketplace with Energy Management Devices, LED Lighting and insulation.
86'000'000 EUR in new energy efficient and eco-friendly coolers.
Changing consumer behaviour
Warmer weather could lead to greater demand for our
Increased demand for existing products/services
>6 years Direct About as likely as not
High
Average impact of 1 degree per month in 1 country: 115'000 Unit
Opportunity driver
Description
Potential impact
Timeframe
Direct/ Indirect
Likelihood
Magnitude of impact
Estimated financial
implications
Management method
Cost of
management
beverages. Cases which can lead to appr. 0.2% increase in sold cases/sales revenue.
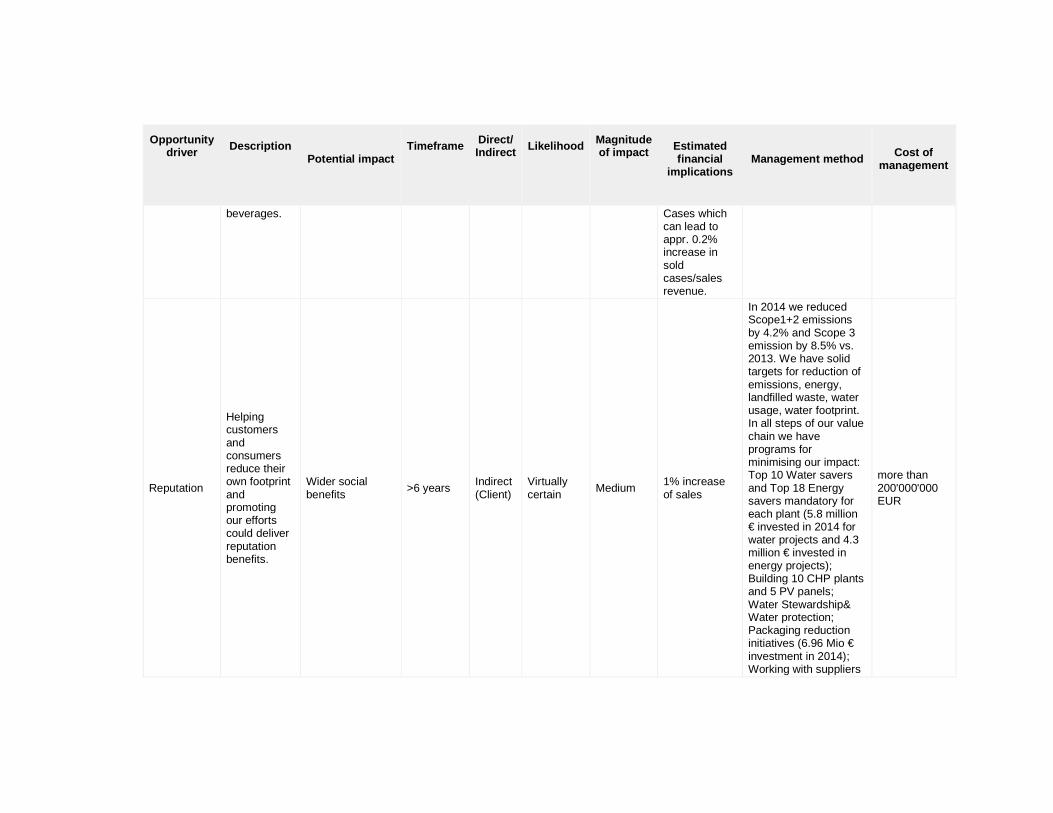
Reputation
Helping customers and consumers reduce their own footprint and promoting our efforts could deliver reputation benefits.
Wider social benefits
>6 years Indirect (Client)
Virtually certain
Medium 1% increase of sales
In 2014 we reduced Scope1+2 emissions by 4.2% and Scope 3 emission by 8.5% vs. 2013. We have solid targets for reduction of emissions, energy, landfilled waste, water usage, water footprint. In all steps of our value chain we have programs for minimising our impact: Top 10 Water savers and Top 18 Energy savers mandatory for each plant (5.8 million € invested in 2014 for water projects and 4.3 million € invested in energy projects); Building 10 CHP plants and 5 PV panels; Water Stewardship& Water protection; Packaging reduction initiatives (6.96 Mio € investment in 2014); Working with suppliers
more than 200'000'000 EUR

Opportunity driver
Description
Potential impact
Timeframe
Direct/ Indirect
Likelihood
Magnitude of impact
Estimated financial
implications
Management method
Cost of
management
of ingredients & packaging; Providing eco-friendly coolers for our customers (86.5 Mio €); Green IT projects; In 2014 our use of recycled PET rose by 31.5% vs. 2013. We also continued to roll out Plantbottle™, the first fully recyclable PET bottle to use renewable plant-based content. Collection, recovery and recycling: to date, we have helped to set up 19 recovery organisations. As a result, more than 128.5 million people across now have access to collection and recycling infrastructure. In 2014, these organisations recycled or recovered the equivalent of 73% of our packaging.
CC6.1d
Please explain why you do not consider your company to be exposed to inherent opportunities driven by changes in regulation that have the potential to generate a substantive change in your business oper ations, revenue or expenditure
CC6.1e
Please explain why you do not consider your company to be exposed to inherent opportunities driven by physical climate parameters that have the potential to generate a substantive change in your business operations, revenue or expenditure
CC6.1f
Please explain why you do not consider your company to be exposed to inherent opportunities driven by changes in other climate-related developments that have the potential to generate a substantive c hange in your business operations, revenue or expen diture
Further Information
Module: GHG Emissions Accounting, Energy and Fuel U se, and Trading
Page: CC7. Emissions Methodology
CC7.1
Please provide your base year and base year emissio ns (Scopes 1 and 2)

Scope
Base year
Base year emissions (metric tonnes CO2e)
Scope 1 Thu 01 Jan 2004 - Fri 31 Dec 2004
516427.6
Scope 2 Thu 01 Jan 2004 - Fri 31 Dec 2004
313668.1
CC7.2
Please give the name of the standard, protocol or m ethodology you have used to collect activity data a nd calculate Scope 1 and Scope 2 emissions
Please select the published methodologies that you use
The Greenhouse Gas Protocol: A Corporate Accounting and Reporting Standard (Revised Edition)
CC7.2a
If you have selected "Other" in CC7.2 please provide details of the standard, protocol or methodology y ou have used to collect activity data and calculate Scope 1 and Scope 2 emissions
CC7.3
Please give the source for the global warming poten tials you have used

Gas
Reference
CO2 IPCC Fourth Assessment Report (AR4 - 100 year) CH4 IPCC Fourth Assessment Report (AR4 - 100 year) HFCs IPCC Fourth Assessment Report (AR4 - 100 year) Other: CFC & HCFC IPCC Fourth Assessment Report (AR4 - 100 year)
CC7.4
Please give the emissions factors you have applied and their origin; alternatively, please attach an E xcel spreadsheet with this data at the bottom of th is page
Fuel/Material/Energy
Emission Factor
Unit
Reference
Further Information
Please find the emission factors we use for energy (fuel used in manufacturing) and fuel used for our own transport.
Attachments
https://www.cdp.net/sites/2015/10/22710/Climate Change 2015/Shared Documents/Attachments/ClimateChange2015/CC7.EmissionsMethodology/Stationary_combustion_tool_(Version4).xlsx https://www.cdp.net/sites/2015/10/22710/Climate Change 2015/Shared Documents/Attachments/ClimateChange2015/CC7.EmissionsMethodology/co2-mobile.xlsx
Page: CC8. Emissions Data - (1 Jan 2014 - 31 Dec 2 014)

CC8.1
Please select the boundary you are using for your S cope 1 and 2 greenhouse gas inventory Operational control
CC8.2
Please provide your gross global Scope 1 emissions figures in metric tonnes CO2e 344631.7
CC8.3
Please provide your gross global Scope 2 emissions figures in metric tonnes CO2e 374134.0
CC8.4
Are there are any sources (e.g. facilities, specifi c GHGs, activities, geographies, etc.) of Scope 1 a nd Scope 2 emissions that are within your selected reporting boundary which are not included in your d isclosure? No
CC8.4a

Please provide details of the sources of Scope 1 an d Scope 2 emissions that are within your selected r eporting boundary which are not included in your disclosure
Source
Relevance of Scope 1 emissions
from this source
Relevance of Scope 2 emissions
excluded from this source
Explain why the source is excluded
CC8.5
Please estimate the level of uncertainty of the tot al gross global Scope 1 and 2 emissions figures tha t you have supplied and specify the sources of uncertainty in your data gathering, handling and ca lculations
Scope
Uncertainty range
Main sources of
uncertainty
Please expand on the uncertainty in your data
Scope 1
More than 2% but less than or equal to 5%
Data Gaps Assumptions Extrapolation Metering/ Measurement Constraints Data Management
All material sources of scope 1 emissions have been included and, where possible, sources verified. Fuel used in the plants (for Energy) is measured and reported each month in our system. Fuel used from our own fleet, including management cars, is reported based on the data by fuel stations. For coolants leakages from our coolers, we use some estimations, as not each country is able to provide the real quantity. Since 2014 we started reporting the energy from all Remote properties (remote Distribution Centers, Sales offices etc) and we did a recalculation of the baseline year and all the rest years by using some assumptions and extrapolations.
Scope 2
Less than or equal to 2%
Data Gaps Assumptions Extrapolation Metering/ Measurement Constraints Data Management
All material sources of scope 2 emissions have been included and consumption figures based upon calibrated meters have been used. For CHP electricity we received figures from the supplier/owner. CHP calculation is based on energy content method as we use steam, cool water, hot water and CO2. Since 2014 we started reporting the energy from all Remote properties (remote Distribution Centers, Sales offices etc) and we did a recalculation of the baseline year and all the rest years by using some assumptions and extrapolations.
CC8.6

Please indicate the verification/assurance status t hat applies to your reported Scope 1 emissions Third party verification or assurance complete
CC8.6a
Please provide further details of the verification/ assurance undertaken for your Scope 1 emissions, an d attach the relevant statements
Type of verification or
assurance
Attach the statement
Page/section
reference
Relevant standard
Proportion of reported Scope 1
emissions verified (%)
Moderate assurance
https://www.cdp.net/sites/2015/10/22710/Climate Change 2015/Shared Documents/Attachments/CC8.6a/150505_Verification GHG_CCHBC_final.pdf All ISAE3000 100
Moderate assurance
https://www.cdp.net/sites/2015/10/22710/Climate Change 2015/Shared Documents/Attachments/CC8.6a/150505_Verification GHG_CCHBC_final.pdf
All ISAE 3410 100
Moderate assurance
https://www.cdp.net/sites/2015/10/22710/Climate Change 2015/Shared Documents/Attachments/CC8.6a/150505_Verification GHG_CCHBC_final.pdf All AA1000AS 100
CC8.6b
Please provide further details of the regulatory re gime to which you are complying that specifies the use of Continuous Emissions Monitoring Systems (CEMS)
Regulation
% of emissions covered by the system
Compliance period
Evidence of submission
CC8.7
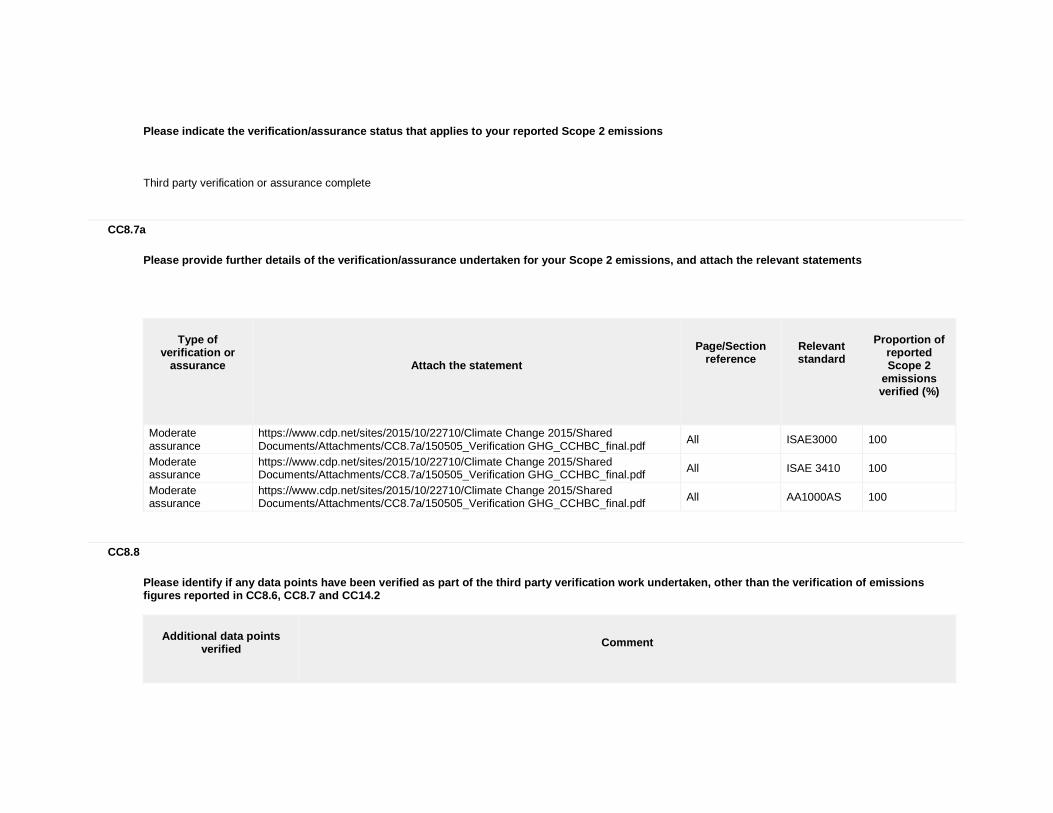
Please indicate the verification/assurance status t hat applies to your reported Scope 2 emissions Third party verification or assurance complete
CC8.7a
Please provide further details of the verification/ assurance undertaken for your Scope 2 emissions, an d attach the relevant statements
Type of verification or
assurance
Attach the statement
Page/Section reference
Relevant standard
Proportion of
reported Scope 2
emissions verified (%)
Moderate assurance
https://www.cdp.net/sites/2015/10/22710/Climate Change 2015/Shared Documents/Attachments/CC8.7a/150505_Verification GHG_CCHBC_final.pdf
All ISAE3000 100
Moderate assurance
https://www.cdp.net/sites/2015/10/22710/Climate Change 2015/Shared Documents/Attachments/CC8.7a/150505_Verification GHG_CCHBC_final.pdf All ISAE 3410 100
Moderate assurance
https://www.cdp.net/sites/2015/10/22710/Climate Change 2015/Shared Documents/Attachments/CC8.7a/150505_Verification GHG_CCHBC_final.pdf All AA1000AS 100
CC8.8
Please identify if any data points have been verifi ed as part of the third party verification work und ertaken, other than the verification of emissions figures reported in CC8.6, CC8.7 and CC14.2
Additional data points
verified
Comment

Additional data points
verified
Comment
Progress against emission reduction target
We have several long term goals and the progress made against them was verified. All data were verified during the process of verification of our Integrated Annual Report 2014 - verification statement is at the end of the Report. Carbon emissions and additional data points verified are available on a separate verification statement which is attached for the questions 8.6a and 8.7a.
Change in Scope 1 emissions against a base year (not target related)
We have several carbon reduction targets, also energy and waste reduction targets. Reported changes in emissions compared with our base years (2004 and 2010) are verified during the process of verification of our Integrated Annual Report 2014 - verification statement is at the end of the Report. Carbon emissions and additional data points verified are available on a separate verification statement which is attached for the questions 8.6a and 8.7a.
Change in Scope 2 emissions against a base year (not target related)
We have several carbon reduction targets, also energy and waste reduction targets. Reported changes in emissions compared with our base years (2004 and 2010) are verified during the process of verification of our Integrated Annual Report 2014 - verification statement is at the end of the Report. Carbon emissions and additional data points verified are available on a separate verification statement which is attached for the questions 8.6a and 8.7a.
Change in Scope 3 emissions against a base year (not target related)
We have several carbon reduction targets, also energy and waste reduction targets. Reported changes in emissions compared with our base years (2004 and 2010) are verified during the process of verification of our Integrated Annual Report 2014 - verification statement is at the end of the Report. Carbon emissions and additional data points verified are available on a separate verification statement which is attached for the questions 8.6a and 8.7a.
Other: emissions intensity figures for 2014
Our intensity is calculated as grams of CO2 per litre of produced beverage. Our absolute emissions and volume in litre are verified, so intensity figure is also verified.
CC8.9
Are carbon dioxide emissions from biologically sequ estered carbon relevant to your organization? No
CC8.9a
Please provide the emissions from biologically sequ estered carbon relevant to your organization in met ric tonnes CO2

Further Information
Page: CC9. Scope 1 Emissions Breakdown - (1 Jan 201 4 - 31 Dec 2014)
CC9.1
Do you have Scope 1 emissions sources in more than one country? Yes
CC9.1a
Please break down your total gross global Scope 1 e missions by country/region
Country/Region
Scope 1 metric tonnes CO2e
Armenia 2592 Austria 9664 Belarus 6617 Bosnia and Herzegovina 2095 Bulgaria 6499 Croatia 4072 Cyprus 2917 Czech Republic 7859 Estonia 292 Greece 11843 Hungary 11280 Ireland 2020 Italy 28937 Latvia 554

Country/Region
Scope 1 metric tonnes CO2e
Lithuania 1263 The former Yugoslav Republic of Macedonia 1324 Moldova 748 Nigeria 34530 Poland 20731 Romania 12723 Russia 129848 Slovakia 3706 Slovenia 604 Switzerland 6926 Serbia 8739 Ukraine 14963 Montenegro 181 United Kingdom 8168
CC9.2
Please indicate which other Scope 1 emissions break downs you are able to provide (tick all that apply) By GHG type By activity
CC9.2a
Please break down your total gross global Scope 1 e missions by business division

Business division
Scope 1 emissions (metric tonnes CO2e)
CC9.2b
Please break down your total gross global Scope 1 e missions by facility
Facility
Scope 1 emissions (metric tonnes CO2e)
Latitude
Longitude
CC9.2c
Please break down your total gross global Scope 1 e missions by GHG type
GHG type
Scope 1 emissions (metric tonnes CO2e)
CO2 324318.8 HFCs 20312.9
CC9.2d
Please break down your total gross global Scope 1 e missions by activity

Activity
Scope 1 emissions (metric tonnes CO2e)
Bottling plants (fossil fuels) 133469.3 Transp. fleet (fossil fuels) 135731.1 Coolants in Cold Drink Equipment (CDE) 20312.9 Losses of CO2 (product) 44584.5 Remote properties energy 10533.9
CC9.2e
Please break down your total gross global Scope 1 e missions by legal structure
Legal structure
Scope 1 emissions (metric tonnes CO2e)
Further Information
Page: CC10. Scope 2 Emissions Breakdown - (1 Jan 20 14 - 31 Dec 2014)
CC10.1
Do you have Scope 2 emissions sources in more than one country? Yes
CC10.1a
Please break down your total gross global Scope 2 e missions and energy consumption by country/region
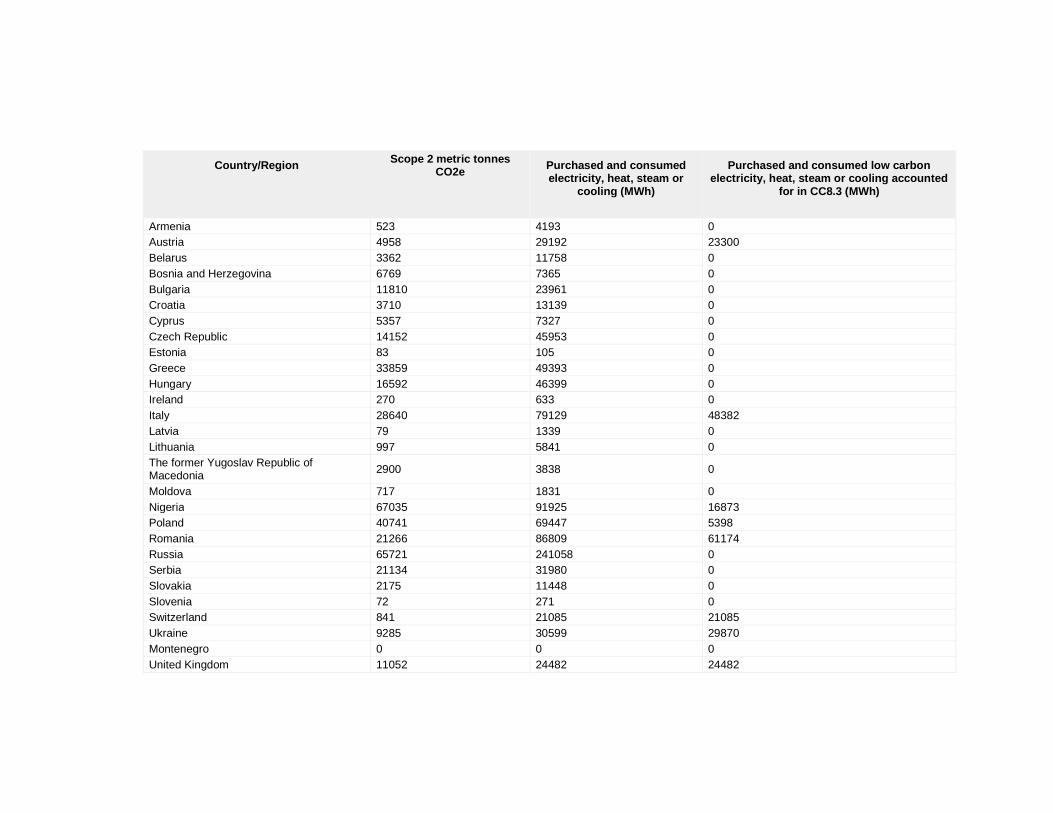
Country/Region
Scope 2 metric tonnes CO2e
Purchased and consumed electricity, heat, steam or
cooling (MWh)
Purchased and consumed low carbon electricity, heat, steam or cooling accounted
for in CC8.3 (MWh)
Armenia 523 4193 0 Austria 4958 29192 23300 Belarus 3362 11758 0 Bosnia and Herzegovina 6769 7365 0 Bulgaria 11810 23961 0 Croatia 3710 13139 0 Cyprus 5357 7327 0 Czech Republic 14152 45953 0 Estonia 83 105 0 Greece 33859 49393 0 Hungary 16592 46399 0 Ireland 270 633 0 Italy 28640 79129 48382 Latvia 79 1339 0 Lithuania 997 5841 0 The former Yugoslav Republic of Macedonia 2900 3838 0
Moldova 717 1831 0 Nigeria 67035 91925 16873 Poland 40741 69447 5398 Romania 21266 86809 61174 Russia 65721 241058 0 Serbia 21134 31980 0 Slovakia 2175 11448 0 Slovenia 72 271 0 Switzerland 841 21085 21085 Ukraine 9285 30599 29870 Montenegro 0 0 0 United Kingdom 11052 24482 24482

CC10.2
Please indicate which other Scope 2 emissions break downs you are able to provide (tick all that apply) By activity
CC10.2a
Please break down your total gross global Scope 2 e missions by business division
Business division
Scope 2 emissions (metric tonnes CO2e)
CC10.2b
Please break down your total gross global Scope 2 e missions by facility
Facility
Scope 2 emissions (metric tonnes CO2e)
CC10.2c
Please break down your total gross global Scope 2 e missions by activity

Activity
Scope 2 emissions (metric tonnes CO2e)
Emissions from supplied electricity 324535 Emissions from supplied steam, hot water, cooling 33557 Emissions from electricity consumption in Remote Properties 16042
CC10.2d
Please break down your total gross global Scope 2 e missions by legal structure
Legal structure
Scope 2 emissions (metric tonnes CO2e)
Further Information
Page: CC11. Energy
CC11.1
What percentage of your total operational spend in the reporting year was on energy? More than 5% but less than or equal to 10%
CC11.2
Please state how much fuel, electricity, heat, stea m, and cooling in MWh your organization has purchas ed and consumed during the reporting year

Energy type
MWh
Fuel 1168409 Electricity 825442 Heat 31312 Steam 0 Cooling 212
CC11.3
Please complete the table by breaking down the tota l "Fuel" figure entered above by fuel type
Fuels
MWh
Other: Light Fuel Oil 40245 Other: Heavy Fuel Oil 29641 Liquefied petroleum gas (LPG) 41390 Natural gas 545101 Motor gasoline 155855 Diesel/Gas oil 356177
CC11.4
Please provide details of the electricity, heat, st eam or cooling amounts that were accounted at a low carbon emission factor in the Scope 2 figure reported in CC8.3
Basis for applying a low carbon emission factor
MWh associated with low carbon electricity, heat, steam
or cooling
Comment

Basis for applying a low carbon emission factor
MWh associated with low carbon electricity, heat, steam
or cooling
Comment
Non-grid connected low carbon electricity not owned by company, no instruments created 186179
Emissions from the CHP plants we use, as there is a capturing of CO2 and using of it for carbonation of our beverages.
Supplier specific, backed by instruments 23300 Energy purchased by our plant in Austria is by Water (Hydro); document from supplier exists and it is with 0 gr CO2e/kWh).
Other 21085 Swiss grid where carbon factor is around 41 gCO2/kWh
Further Information
Page: CC12. Emissions Performance
CC12.1
How do your gross global emissions (Scope 1 and 2 c ombined) for the reporting year compare to the prev ious year? Decreased
CC12.1a
Please identify the reasons for any change in your gross global emissions (Scope 1 and 2 combined) and for each of them specify how your emissions compare to the previous year
Reason
Emissions value
(percentage)
Direction of
change
Comment
Emissions reduction activities 3 Decrease
We launched our Top 18 Energy savers, mandatory for implementation in each plant. We invested €4.3 million in energy efficiency projects which reduced energy consumption by 300 million MJ; projects contributed to this: cooling improvements in eight countries, improvements in lighting efficiency in 12 countries, electrical power optimisation in three countries and heat recovery from ground water in Hungary. Air and steam leakage prevention programmes were also implemented at all 66 of our production sites during the year. For our own transport, we reduced the emissions per kilometer driven by eco-driving programs, buying more fuel-efficient

Reason
Emissions value
(percentage)
Direction of
change
Comment
cars, optimizing the routes and recognition programmes for the "best driver". CO2 saved from energy used in our plants = 7'800 tonnes which contributes to 1.1% decrease of total Scope1+2, CO2 saved from purchased steam/cooling = 2'050 tonnes (0.3% contribution), 1'980 tonnes CO2 less from the energy used in Remote properties (0.3% contribution) and 9’500 tonnes CO2 saved from transport optimization (1.3% contribution to Scope 1+2 decrease).
Divestment Acquisitions Mergers
Change in output
Change in methodology 0.9 Increase
Previously we had an assumption about the CO2 losses during carbonation of our beverages (we used a formula to calculate this). Since 2014 reporting cycle, we have a real measurement and we extract all the data from SAP: 6'645 tonnes CO2 more due to that change in the methodology which is 0.9% increase of the Scope 1+2 emissions.
Change in boundary Change in physical operating conditions
Unidentified Other 1.5 Decrease Outsourcing of the heavy fleet in some countries - it decreased Scope 1 emissions (fuel) but increased Scope
3 emissions. Decrease in total figure of Scope 1+2 is 11'000 tonnes of CO2.
CC12.2
Please describe your gross global combined Scope 1 and 2 emissions for the reporting year in metric to nnes CO2e per unit currency total revenue

Intensity figure
Metric numerator
Metric denominator
% change from
previous year
Direction of change from previous year
Reason for change
0.0001104 metric tonnes CO2e
unit total revenue 1 Increase
Drop of Net Sales Revenue by 5.3% in 2014 vs. 2013 - big part of it is due to the Russian currency volatility as we need to convert Russian Ruble in Euro for the Corporate Report. Regardless of this drop in sales revenue, the CO2 emissions per unit of revenue are increased only by 1%.
CC12.3
Please describe your gross global combined Scope 1 and 2 emissions for the reporting year in metric to nnes CO2e per full time equivalent (FTE) employee
Intensity figure
Metric numerator
Metric denominator
% change from
previous year
Direction of change from
previous year
Reason for change
19.79 metric tonnes CO2e
FTE employee
0.8 Increase
FTE are decreased by 5% in 2014 vs. 2013. This is the reason the intensity figure of emissions per FTE to be higher vs. previous year. Regardless of this, our Energy saving initiatives lead to overall Scope 1+2 emissions reduction by 4.2% in 2014. In 2014 we started reporting the energy from all Remote properties and we did a historical recalculation for all previous years.
CC12.4
Please provide an additional intensity (normalized) metric that is appropriate to your business operat ions

Intensity figure
Metric numerator
Metric denominator
% change from
previous year
Direction of change
from previous
year
Reason for change
62.6 metric tonnes CO2e
liter of product
2.1 Decrease
1. Emissions reduction activities: We launched our Top 18 Energy savers, mandatory for implementation in each plant. We invested €4.3 million in energy efficiency projects which reduced energy consumption by 300 million MJ; projects contributed to this: cooling improvements in eight countries, improvements in lighting efficiency in 12 countries, electrical power optimisation in three countries and heat recovery from ground water in Hungary. Air and steam leakage prevention programmes were also implemented at all 66 of our production sites during the year. For our own transport, we reduced the emissions per kilometer driven by eco-driving programs, buying more fuel-efficient cars and recognition programmes for the "best driver". 2. Outsourcing of the heavy fleet in some countries - it decreased Scope 1 emissions (fuel) but increased Scope 3 emissions.
Further Information
Page: CC13. Emissions Trading
CC13.1
Do you participate in any emissions trading schemes ? No, and we do not currently anticipate doing so in the next 2 years
CC13.1a
Please complete the following table for each of the emission trading schemes in which you participate

Scheme name
Period for which data is supplied
Allowances allocated
Allowances purchased
Verified emissions in metric tonnes CO2e
Details of ownership
CC13.1b
What is your strategy for complying with the scheme s in which you participate or anticipate participat ing?
CC13.2
Has your organization originated any project-based carbon credits or purchased any within the reportin g period? No
CC13.2a
Please provide details on the project-based carbon credits originated or purchased by your organizatio n in the reporting period
Credit origination
or credit purchase
Project type
Project identification
Verified to which standard
Number of credits (metric
tonnes of CO2e)
Number of credits (metric tonnes
CO2e): Risk adjusted volume
Credits cancelled
Purpose, e.g. compliance
Further Information
Page: CC14. Scope 3 Emissions

CC14.1
Please account for your organization’s Scope 3 emis sions, disclosing and explaining any exclusions
Sources of Scope 3
emissions
Evaluation status
metric tonnes CO2e
Emissions calculation methodology
Percentage of
emissions calculated using data obtained
from suppliers or value chain
partners
Explanation
Purchased goods and services
Relevant, calculated 1642563
Ingredients and Pack materials (including secondary packaging) purchased for all our operations. We use our Entropy software and SAP to report the quantity of materials purchased and we multiply the quantity of each material by the respective ingredients/packaging GHG emissions factor. We use Ecoinvent Database, also for some of the factors we use IFEU LCA assigned by TCCC. For Tetrapak material GHG factor we use supplier database.
5.00% For Tetrapak material GHG factor we use supplier database.
Capital goods Relevant, not yet calculated
Capital equipment includes many metallic vessels, pipework, conveyor belts and automated packaging solutions. Unitary GHG data from equipment manufacturers is not available for the time being.
Fuel-and-energy-related activities (not included in Scope 1 or 2)
Relevant, calculated
16194
Emissions from CO2 used for beverage carbonation and which is produced in the CHPs plants. The quantity of CO2 is reported in our system and after that is multiplied by GHG factor.
100.00%
Upstream transportation and distribution
Not relevant, explanation provided
The LCA made for our ingredients and packaging materials includes the transportation of those ingredients and pack materials. So, in the GHG factors we used for ingredients and packaging

Sources of Scope 3
emissions
Evaluation status
metric tonnes CO2e
Emissions calculation methodology
Percentage of
emissions calculated using data obtained
from suppliers or value chain
partners
Explanation
materials it is already included (under Purchased goods and services).
Waste generated in operations
Not relevant, explanation provided
The biggest part of the waste generated in our operations is coming from packaging materials and ingredients we use. They are already included under Purchased goods and services: we have the quantity of materials purchased and it is multiplied by the GHG factors (which are based on LCA done by IFEU assigned by The Coca-Cola Company).
Business travel Not relevant, calculated 1224
From corporate flights: we have flight primary data from the travel agencies with which we work and we use GHG factors based on the distance travelled and the travel class (from Defra guideline).
100.00%
Employee commuting
Not relevant, explanation provided
The total emissions from employee commuting is considered not relevant from life cycle point of view. Employees who work in Commercial function and Managers are provided with company cars and these emissions are reported under Scope 1. The emissions from all the rest employees are not relevant.
Upstream leased assets
Not relevant, explanation provided
Emissions from upstream assets are considered not relevant, as they are already included in Scope 1.
Downstream transportation and distribution
Relevant, calculated 186429
3rd party fleet, including kilometers driven for Haulage and Distribution. In our internal quarterly reports we estimate the kilometers driven by the 3rd party fleet and we multiply by the GHG factor
100.00%

Sources of Scope 3
emissions
Evaluation status
metric tonnes CO2e
Emissions calculation methodology
Percentage of
emissions calculated using data obtained
from suppliers or value chain
partners
Explanation
(emissions based on distance from the calculation tool of WRI-WBCSD GHG Protocol Initiative).
Processing of sold products
Not relevant, explanation provided
Our products are sold in a finished, ready-to-consume state. No further processing is required.
Use of sold products
Relevant, calculated 68058
CO2 (carbonation) in our carbonated soft drinks. In our SAP system we report the quantity of CO2 used for the carbonation of our beverages and we multiply by the GHG factor,
100.00%
End of life treatment of sold products
Relevant, not yet calculated
We have the quantity of our packaging materials and also the average recycling rate per material- the rest is landfilled waste. It will be considered for future calculations.
Downstream leased assets
Relevant, calculated 1698628
Electricity used by our cold drink equipment (use of leased coolers) which we provide to our customers. We use SAP as database for all cold drink equipment. For each country, for each type of cooler, we get the figure on electricity consumption by the coolers suppliers. Then the electricity per cooler type is multiplied by the number of the coolers and the total electricity consumption is multiplied by the country (location-based) grid factor (this factor is taken from IEA database).
50.00%
Franchises Not relevant, explanation provided
We don't operate any franchises.
Investments Not relevant, explanation
Coca-Cola Hellenic does not engage in project finance or other investment

Sources of Scope 3
emissions
Evaluation status
metric tonnes CO2e
Emissions calculation methodology
Percentage of
emissions calculated using data obtained
from suppliers or value chain
partners
Explanation
provided activities in specific GHG generating assets.
Other (upstream)
Other (downstream)
CC14.2
Please indicate the verification/assurance status t hat applies to your reported Scope 3 emissions Third party verification or assurance complete
CC14.2a
Please provide further details of the verification/ assurance undertaken, and attach the relevant state ments
Type of
verification or assurance
Attach the statement
Page/Section
reference
Relevant standard
Proportion of
Scope 3 emissions verified (%)

Type of
verification or assurance
Attach the statement
Page/Section
reference
Relevant standard
Proportion of
Scope 3 emissions verified (%)
Moderate assurance
https://www.cdp.net/sites/2015/10/22710/Climate Change 2015/Shared Documents/Attachments/CC14.2a/150505_Verification GHG_CCHBC_final.pdf All ISAE3000 100
Moderate assurance
https://www.cdp.net/sites/2015/10/22710/Climate Change 2015/Shared Documents/Attachments/CC14.2a/150505_Verification GHG_CCHBC_final.pdf All ISAE 3410 100
Moderate assurance
https://www.cdp.net/sites/2015/10/22710/Climate Change 2015/Shared Documents/Attachments/CC14.2a/150505_Verification GHG_CCHBC_final.pdf All AA1000AS 100
CC14.3
Are you able to compare your Scope 3 emissions for the reporting year with those for the previous year for any sources? Yes
CC14.3a
Please identify the reasons for any change in your Scope 3 emissions and for each of them specify how your emissions compare to the previous year
Sources of Scope 3
emissions
Reason for
change
Emissions
value (percentage)
Direction of change
Comment
Purchased goods & services
Emissions reduction activities
8.9 Decrease Our packaging optimization projects and using of more rPET and bio-PET are the main drivers of that change. In addition, very small decrease only (0.5%) was due to lower production volume (change in output) /production volume is
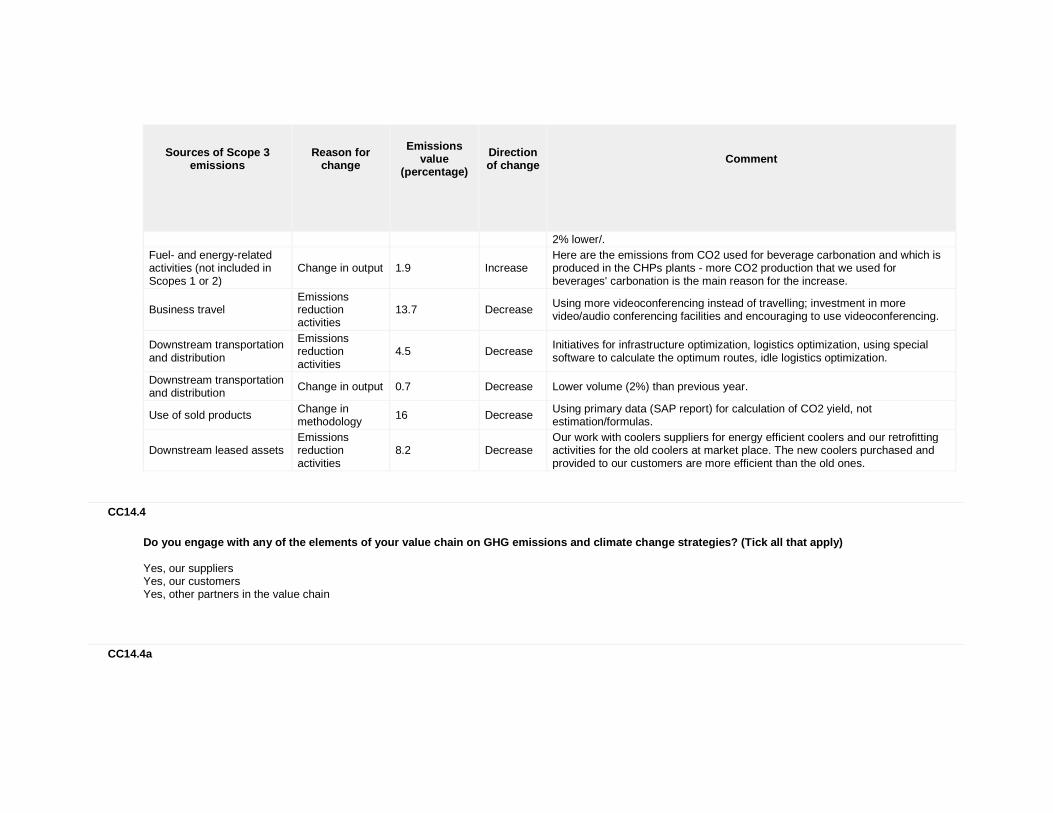
Sources of Scope 3
emissions
Reason for
change
Emissions
value (percentage)
Direction of change
Comment
2% lower/. Fuel- and energy-related activities (not included in Scopes 1 or 2)
Change in output 1.9 Increase Here are the emissions from CO2 used for beverage carbonation and which is produced in the CHPs plants - more CO2 production that we used for beverages' carbonation is the main reason for the increase.
Business travel Emissions reduction activities
13.7 Decrease Using more videoconferencing instead of travelling; investment in more video/audio conferencing facilities and encouraging to use videoconferencing.
Downstream transportation and distribution
Emissions reduction activities
4.5 Decrease Initiatives for infrastructure optimization, logistics optimization, using special software to calculate the optimum routes, idle logistics optimization.
Downstream transportation and distribution Change in output 0.7 Decrease Lower volume (2%) than previous year.
Use of sold products Change in methodology
16 Decrease Using primary data (SAP report) for calculation of CO2 yield, not estimation/formulas.
Downstream leased assets Emissions reduction activities
8.2 Decrease Our work with coolers suppliers for energy efficient coolers and our retrofitting activities for the old coolers at market place. The new coolers purchased and provided to our customers are more efficient than the old ones.
CC14.4
Do you engage with any of the elements of your valu e chain on GHG emissions and climate change strateg ies? (Tick all that apply) Yes, our suppliers Yes, our customers Yes, other partners in the value chain
CC14.4a

Please give details of methods of engagement, your strategy for prioritizing engagements and measures of success We have Joint Value Creation initiatives with main suppliers (can, glass, PET, sugar suppliers and coolers supplier). Together with suppliers, we developed hydrofluorocarbon-free (HFC-free) coolers which are up to 63% more efficient than 2004 models. In 2014, 86% of all coolers purchases were HFC-free and we have a commitment to purchase 100% of our new equipment HFC-free by 2015. We developed the lightest and most environmentally friendly can in Europe through partnership with Ball Packaging Europe. The new 330ml can weighs only 9.45g compared to its 9.9g predecessor and potentially would avoid some 850 metric tonnes of aluminium each year. With PET suppliers we work for development of light-weighting bottles, new bottle’s design which facilitates recycling and using more recycled PET content and bio-PET materials. Together with equipment suppliers we work for water and energy usage optimization. All suppliers are required to comply with the Coca-Cola Supplier Guiding Principles (SGP), including areas such as workplace and human rights, environment and management systems. For 2014, 85% of all contracts were SGP compliant and plans to address the remaining 15% are in place for 2015. Further, supply points were audited in 2014. Tier 1 suppliers required to achieve ISO 14001 certification. We continued working with the Russian sugar industry to develop its beet sugar capacity, with the goal of eliminating the need to import sugar for our Russian operations by 2015. As a result, Russian beet sugar comprised 57% of our Russian sugar needs in 2013, 85% in 2014 and is expected to reach 100% in 2015. We began actively hedging energy input costs in 11 of our markets in 2014, and we have joined forces with our CHP (Combined Heat and Power) strategic suppliers to negotiate rates together. We perform supplier sustainability training for Tier 1 suppliers as all of them have a component on minimizing environmental impacts. Communities and Municipalities: to date, we have helped to set up 19 recovery organisations. As a result, more than 128.5 million people across 18,500 municipalities now have access to collection and recycling infrastructure - in some countries, this marks the first residential collection of any waste stream in rural communities. With the communities in which we have plants, we engage in water stewardship initiatives (in total, we conduct community water partnerships in 24 countries). Customers: we train our sales force to raise awareness among our customers on the use of our coolers in order to save energy and carbon.
CC14.4b
To give a sense of scale of this engagement, please give the number of suppliers with whom you are eng aging and the proportion of your total spend that they represent
Number of suppliers
% of total spend
Comment
237 82% These are our all Tier 1 suppliers - we perform supplier sustainability training for Tier 1 suppliers as all of them have a component on minimizing environmental impacts. With most of them we have Joint Value Creation initiatives, as mentioned in the previous question.
CC14.4c
If you have data on your suppliers’ GHG emissions a nd climate change strategies, please explain how yo u make use of that data

How you make use of the data
Please give details
Use in supplier scorecards In suppliers evaluation we have included Sustainability category: Suppliers who has in place advanced program including active energy reduction programme & primary and secondary packaging materials reduction programs, receive more points. Sustainable suppliers have higher preference status.
Identifying GHG sources to prioritize for reduction actions
As coolers energy represents 40% of our total carbon emissions and packaging represents 28% carbon emissions, we work very close with these 2 categories of suppliers in order to develop carbon reduction activities.
CC14.4d
Please explain why you do not engage with any eleme nts of your value chain on GHG emissions and climat e change strategies, and any plans you have to develop an engagement strategy in the future
Further Information
Module: Sign Off
Page: CC15. Sign Off
CC15.1
Please provide the following information for the pe rson that has signed off (approved) your CDP climate change response
Name
Job title
Corresponding job category
Galya Tsonkova Group Environment Manager Environment/Sustainability manager
Further Information
Module: FBT

Page: FBT1. Agriculture
FBT1.1
Are agricultural activities, whether in your direct operations or elsewhere in your value chain, relev ant to your climate change disclosure? Yes
FBT1.1a
Please explain why agricultural activities are not relevant to your climate change disclosure
FBT1.2
Are the agricultural activities that you have ident ified as relevant undertaken on your own farm(s), e lsewhere in your value chain, or both? Elsewhere in value chain
FBT1.2a
Please explain why agricultural emissions from your own farms are not relevant We buy from our suppliers the ingredients needed for our production: sugar, sweeteners, juice concentrates. We don't have our own farms, neither we have used directly something from the farms.
FBT1.3
Do you account for greenhouse gas emissions from ag ricultural activities undertaken on your own farm(s ) as part of the global gross Scope 1 emissions figure reported in CC8.2, and/or the Scope 2 figure r eported in CC8.3 of the core climate change question naire?
FBT1.3a

Please select the form(s) in which you wish to repo rt the greenhouse gas emissions produced by agricul tural activities (agricultural emissions) undertaken on your own farm(s)
FBT1.3b
Please report your total agricultural emissions pro duced on your own farm(s) and identify any exclusio ns in the table below
Scope
Agricultural emissions (metric
tonnes CO2e)
Methodology
Exclusions
Explanation
Comment
FBT1.3c
Please report your agricultural emissions produced on your own farm(s), disaggregated by category, and identify any exclusions in the table below
Emissions category
Agricultural
emissions (metric tonnes CO2e)
Methodology
Exclusions
Explanation
Comment
FBT1.3d
Please explain why you do not account for greenhous e gas emissions from agricultural activities undert aken on your own farm(s), and describe any plans for the collection of this data in the future
FBT1.4
Do you implement agricultural management practices on your own farm(s) with a climate change mitigatio n and/or adaptation benefit?

FBT1.4a
Please identify agricultural management practices u ndertaken on your own farm(s) with a climate change mitigation and/or adaptation benefit. Complete the table
Activity ID
Agricultural
management practice
Description of agricultural management practice
Climate change related benefit
Comment
FBT1.4b
Does your implementation of these agricultural mana gement practices have other impacts? Complete the t able
Activity ID
Impact on yield
Impact on cost
Impact on soil quality
Impact on biodiversity
Impact on water
Other impact
Description of impacts
Comment
FBT1.4c
Do you have any plans to implement agricultural man agement practices in the future?
FBT1.4d
Please detail your plans to implement agricultural management practices in the future
FBT1.5
Is biogenic carbon pertaining to your own farm(s) r elevant to your climate change disclosure?

FBT1.5a
Please report biogenic carbon data pertaining to yo ur own farm(s) in the table below
CO2 flux
Emissions/
Removals (metric tonnes CO2e)
Methodology
Exclusions
Explanation
Comment
FBT1.6
Do you account for greenhouse gas emissions from ag ricultural activities in your value chain as part o f the Scope 3 category "Purchased goods and services" reported in CC14.1 of the core climate cha nge questionnaire? Yes
FBT1.6a
Please report these agricultural emissions from you r value chain and identify any exclusions in the ta ble below
Scope
Agricultural emissions (% of the
emissions reported in the category “Purchased goods and
services”)
Exclusions
Explanation
Comment
Scope 3 91-100% Our main agricultural ingredient is sugar and we consider it in our Scope 3 calculations.
FBT1.6b

Please explain why you do not account for greenhous e gas emissions from agricultural activities in you r value chain as part of the Scope 3 category “Purchased goods and services” reported in CC14.1 of the core climate change questionnaire
FBT1.7
Do you encourage your agricultural suppliers to und ertake any agricultural management practices with a climate change mitigation and/or adaptation benefit? Yes
FBT1.7a
Please identify agricultural management practices w ith a climate change mitigation and/or adaptation b enefit that you encourage your suppliers to implement. Complete the table
Activity ID
Agricultural
management practice
Description of agricultural management practice
Your role in the implementation of this practice
Explanation of how you encourage implementation
Climate change
related benefit
Comment
1 Water Management
Water quality protection - To avoid contamination of water with fertilizers: reduce the volume of phosphorus, potash + nitrogen; Reduce and minimize dosage of fertilizer. To avoid the contamination of water with the plant protection product: reduce stock of weed seeds in the topsoil; establish weeding program adapted to the situation; reduce dosage of chemicals per hectare when possible. In addition: practices reducing water pollution.
Knowledge sharing Procurement
It is a Joint Value Creation initiative with our sugar supplier in Russia. We train the farmers to use sustainable practices. Sustainable suppliers have a higher preference status.
Increasing resilience to climate change (adaptation)
2
Other: Reach an optimum level of fertility on sugar beets
To maintain or increase the potential of the top soil and maintain a good environment for farming while respecting the water and air quality - knowledge management.
Knowledge sharing Procurement
It is a Joint Value Creation initiative with our sugar supplier in Russia. We train the farmers to use sustainable practices. Sustainable suppliers have a higher
Emissions reductions (mitigation) Increasing resilience to climate change

Activity ID
Agricultural
management practice
Description of agricultural management practice
Your role in the implementation of this practice
Explanation of how you encourage implementation
Climate change
related benefit
Comment
preference status. (adaptation)
FBT1.7b
Does the implementation of these agricultural manag ement practices in your value chain have other impa cts? Complete the table
Activity ID
Impact on yield
Impact on cost
Impact on soil quality
Impact on biodiversity
Impact on water
Other impact
Description of impacts
Comment
1 Evaluated - beneficial impact
Evaluated - beneficial impact
Evaluated - beneficial impact
Not evaluated
Evaluated - beneficial impact Not evaluated
2 Evaluated - beneficial impact
Evaluated - beneficial impact
Evaluated - beneficial impact
Not evaluated
Evaluated - beneficial impact
Not evaluated
FBT1.7c
Do you have any plans to engage with your suppliers on their implementation of agricultural management practices? Yes
FBT1.7d
Please detail these plans to engage with your suppl iers on their implementation of agricultural manage ment practices All suppliers are required to comply with the Coca-Cola Supplier Guiding Principles, including areas such as workplace and human rights, environment and management systems: Human and Workplace Rights: freedom of association and collective bargaining; prohibit child labor, eliminate discrimination; work hours and wages; safe and healthy workplaces; community and traditional rights; Environment: water management; energy management and climate protection; conservation of natural habitats and ecosystems; soil management; crop protection; Management Systems: harvest and postharvest handling; reproductive material identity, selection and handling; management systems, record keeping and

transparency; business integrity.
Further Information
Page: FBT2. Processing
FBT2.1
Are processing activities, whether in your direct o perations or elsewhere in your value chain, relevan t to your climate change disclosure? No
FBT2.1a
Please explain why processing activities are not re levant to your climate change disclosure We do not transform raw agricultural inputs into final products ready for human consumption. The emissions from processing activities are not in our direct operations and account for scope 3 emissions in our carbon footprint (coming from ingredients: sugar, juice concentrate, sweeteners and from Tetrapak packaging material for our juice beverages).
FBT2.2
Are the processing activities that you have identif ied as relevant undertaken in your direct operation s, elsewhere in your value chain, or both?
FBT2.2a
Please explain why emissions from processing activi ties in your direct operations are not relevant
FBT2.3

Do you account for emissions from processing activi ties in your direct operations as part of the globa l gross Scope 1 emissions figure reported in CC8.2 and/or the Scope 2 figure reported in CC8.3 of the c ore climate change questionnaire?
FBT2.3a
Please report these emissions from processing activ ities in your direct operations and identify any ex clusions in the table below
Scope
Emissions from processing activities (metric tonnes CO2e)
Exclusions
Explanation
Comment
FBT2.3b
Please explain why you do not account for emissions from processing activities in your direct operatio ns, and describe any plans for the collection of this data in the future
FBT2.4
Do you account for emissions from processing activi ties in your value chain as part of the Scope 3 cat egory "Purchased goods and services" and/or "Processing of sold products" reported in CC14.1 of the core climate change questionnaire?
Further Information
Page: FBT3. Distribution
FBT3.1
Are distribution activities, whether in your direct operations or elsewhere in your value chain, relev ant to your climate change disclosure? Yes

FBT3.1a
Please explain why distribution activities are not relevant to your climate change disclosure
FBT3.2
Are the distribution activities that you have ident ified as relevant undertaken in your direct operati ons, elsewhere in your value chain, or both? Both direct operations and elsewhere in value chain
FBT3.2a
Please explain why emissions from distribution acti vities in your direct operations are not relevant
FBT3.3
Do you account for emissions from distribution acti vities in your direct operations as part of the glo bal gross Scope 1 emissions figure reported in CC8.2 and/or the Scope 2 figure reported in CC8.3 of the core climate change questionnaire? Yes
FBT3.3a
Please report these emissions from distribution act ivities in your direct operations and identify any exclusions in the table below
Scope
Emissions from distribution
activities (metric tonnes CO2e)
Exclusions
Explanation
Comment

Scope
Emissions from distribution
activities (metric tonnes CO2e)
Exclusions
Explanation
Comment
Scope 1 135731 No.
These are all emissions from our own fleet, including our own Haulage and Distribution trucks and Sales and Management cars.
These are all emissions from our own fleet, including our own Haulage and Distribution trucks and Sales and Management cars.
Scope 2
0 Not Applicable.
We don't have emissions from distribution activities in our direct operations which to be reported in Scope 2. All of them are reported in Scope 1.
We don't have emissions from distribution activities in our direct operations which to be reported in Scope 2. All of them are reported in Scope 1.
FBT3.3b
Please explain why you do not account for emissions from distribution activities in your direct operat ions, and describe any plans for the collection of this data in the future
FBT3.4
Do you account for emissions from distribution acti vities in your value chain as part of the Scope 3 c ategory "Upstream transportation and distribution" and/or "Downstream transportation and distribution" in CC14.1 of the core climate change questionnaire? Yes
Further Information
Third party Fleet that we use for transport and distribution of our products to the customers is in Scope 3 emissions and for 2014 those emissions are 186'429 tonnes of CO2.
Page: FBT4. Consumption
FBT4.1

Are emissions from the consumption of your products relevant to your climate change disclosure? Yes
FBT4.1b
Please explain why emissions from the consumption o f your products are not relevant to your climate ch ange disclosure
FBT4.1a
Do you account for emissions from the consumption o f your products as part of the Scope 3 category "Use of sold products" and/or "End of life treatment of sold products" in CC14.1 of the core cli mate change questionnaire? Yes
Further Information
Use of sold products: CO2 (carbonation) in our carbonated soft drinks. CDP 2015 Climate Change 2015 Information Request