Embed Size (px)
Citation preview
Cassadaga Wind
Project
Bird and Bat Survey
Report, 2013-2014
Chautauqua County, New York
Prepared for:
EverPower Wind Holdings, Inc.
1251 Waterfront Place, 3rd Floor
Pittsburgh, PA 15222
Prepared by:
Stantec Consulting
30 Park Drive
Topsham, ME 04086
15 January 2015
Executive Summary
EverPower Wind Holdings, Inc. (EverPower) is considering the construction of the Cassadaga
Wind Project (Project) in Chautauqua County, New York. The proposed Project would include up
to 70 wind turbines located west of Route 83 in the towns of Stockton, Charlotte, Cherry Creek,
and Arkwright (Figure 1). The Project is in the early phase of development and the approximate
size of the area of interest is 24,000 acres. The number and locations of turbines, access roads,
and electrical corridors are preliminary. In 2013 and 2014, EverPower contracted Stantec to
conduct the following:
bird migration surveys (fall 2013)
habitat assessment (fall 2013)
raptor migration surveys (spring 2014)
breeding bird surveys (spring 2014)
acoustic bat surveys (2013–2014)
eagle point count surveys (2013–2014)
Results of the habitat assessment are included in a separate memo report (Cassadaga Wind
Project – Habitat Assessment; 11 February 2014) and results of the eagle point count surveys are
included in a separate memo report (Cassadaga Wind Project 2013-2014 Eagle Use Point Count
Survey Results; 26 November 2014).
Fall Migration Surveys
Stantec conducted migratory point count surveys at 14 survey locations once each week in
September 2013 to assess species composition of songbird or waterfowl stopping over during
migration. The 14 survey locations were the same points sampled during eagle point count
surveys. Survey points were grouped into 3 habitat categories based on dominant vegetation
cover and general habitat characteristics: agricultural, forest edge, and over-grown field. The
biologist detected 27 species and 601 individual birds. In agricultural habitat, Canada goose
(Branta canadensis) had the greatest relative abundance (RA = 4.69), followed by American
crow (Corvus brachyrhynchos) (RA = 2.31). In forest edge habitat, cedar waxwing (Bombycilla
cedrorum) had the greatest relative abundance (RA = 2.00), followed by blue jay (Cyanocitta
cristata) and American crow, which both had RA values of 1.33. In over-grown field habitat, blue
jay had the greatest relative abundance (RA = 2.00), followed by American crow (RA = 1.58).
Diversity indexes among all 3 habitat types were similar, and ranged from 2.62–2.81. Stantec
observed 3 large flocks of Canada geese during migration surveys: a flock of 42 on 4 September
at point count 2, and 2 flocks of 32 and 55 on 11 September at point count 11. Stantec did not
observe any state- or federally listed endangered or threatened species, or state species of
special concern.
Spring Raptor Migration Surveys
To assess species composition and migration patterns of raptors during the spring migration
season, Stantec conducted 8-hour surveys approximately once every 7 days from eagle point
count 7, a centrally located point with good views of the surrounding airspace. Stantec
conducted surveys on 13 days from 1 March to 26 May for a total of 96 survey hours. Stantec
observed 11 raptor species. The seasonal passage rate was 1.64 and ranged from 0 raptors/hr
on 7 May to 5.1 raptors/hr on 1 May. Stantec documented 1 golden eagle (Aquila chrysaetos),
a state-listed endangered species, and 6 observations of bald eagles (Haliaeetus
leucocephalus) and 1 northern harrier (Circus cyaneus), state-listed threatened species (NYSDEC
2014). Observers also documented 3 state species of special concern: osprey (Pandion
haliaetus) (n = 3), red-shouldered hawk (Buteo lineatus) (n = 3) and sharp-shinned hawk
(Accipiter striatus) (n = 4). The overall passage rate was at the low end of the range of passage
rates and below the median rates documented in studies in New York and the Northeast1. The
number of raptor species observed was also within the range, suggesting that raptor activity,
passage rates, and species composition at the Project site is typical of the region.
Spring Breeding Bird Surveys
Stantec conducted breeding bird surveys along 16 transects at 85 bird point count locations: 59
survey points in close proximity to proposed turbine locations and 26 control points in areas
where no impact is expected to occur. Points were chosen using aerial Project photos, and
were positioned based on the following criteria to sample the habitats present. A Stantec
biologist conducted a 5-minute survey at each point from sunrise until 10:00 a.m. Forest edge
habitat had the most individuals observed and the highest species richness for both the survey
points (n = 555, SR = 56) and the control points (n = 257, SR = 36). Agricultural habitat had the
highest relative abundance among survey points (RA = 12.54), and over-grown field habitat had
the highest relative abundance among control points (RA = 15.33). Forest edge habitat had the
highest Shannon Diversity Index among survey points (SDI = 3.18), and mixed forest habitat had
the highest Shannon Diversity Index among control points (SDI = 3.02). Excluding flyovers, the
biologist recorded 67 species and 1,799 individuals within 100 m of the survey points. Excluding
flyovers, the biologist recorded 67 species and 1,799 individuals within 100 m of the survey points.
In the agricultural habitat, forest edge habitat, and over-grown field habitat, red-winged
blackbird had the greatest relative abundance among both survey points (RA = 4.00) and
control points (RA = 5.75). In mixed forest habitat, eastern towhee (Pipilo erythrophthalmus) had
the highest relative abundance among only survey points (RA = 0.96). Eastern towhee (RA =
1.25) and red-eyed vireo (Vireo olivaceus) (RA = 0.58) had the greatest relative abundances
among survey points. Stantec did not detect any state- or federally listed endangered or
threatened species, or state species of special concern.
Acoustic Bat Surveys
Stantec conducted acoustic bat surveys to characterize activity, timing of activity, and when
possible, species composition of bats in the vicinity of the Project area. Passive acoustic
echolocation monitoring surveys were conducted during late summer emergence and fall
migration periods (mid-August to mid-October in 2013 and 2014) and spring migration and
1 Projects in the Northeast include those in the following states: Maine, New Hampshire, and
Vermont.
activity period for bats (mid-April to mid-August in 2014). In fall 2013, Stantec deployed 2 Anabat
model SDI detectors (Titley Electronics Pty Ltd.) in the single on-site met tower at that time at
approximately 45 m above ground level (agl) and 3 m agl. Stantec deployed a third detector at
approximately 3 m agl in a tree adjacent to a stream where bat activity was expected. The tree
detector was deployed in 2013 because the second met tower had not yet been constructed.
In April 2014 Stantec deployed 2 detectors in the second on-site met tower at approximately 45
m agl and 3 m agl.
Met detectors recorded 2,719 call sequences for a detection rate of 3.5 bat call sequences per
detector-night (calls/detector-night). The tree detector recorded 52 call sequences for a
detection rate of 0.8 calls/detector-night. There were 2,771 bat call sequences recorded by all
detectors combined, for an overall detection rate of 3.3 calls/detector-night. The highest level of
activity was recorded during August 2013 at Met 1 Low (n = 1,501 call sequences). Met 1 Low
recorded a peak number of call sequences on 21 August (n = 599) and 22 August (n = 405) 2013,
representing 36% of call sequences recorded by all 5 detectors throughout the 2013–2014 survey
period.
For all met detectors combined, the ‘big brown bat (Eptesicus fuscus) silver-haired bat
(Lasionycteris noctivagans) Guild’ (BBSH) guild represented the majority of calls (n = 1,595; 59%).
Species composition was similar between the Met 1 and Met 2 detectors. The UNKN guild
represented the majority of call sequences recorded by the met high detectors and the Met 2
Low detector (n = 171; 48% of call sequences recorded at Met 1 High; n = 149; 49% of call
sequences recorded at Met 2 High; n = 136; 48% of call sequences recorded at Met 2 Low). The
BBSH guild represented the majority of call sequences recorded by the Met 1 Low detector
(n = 1,264; 71%). Detectors recorded only 39 Myotis calls sequences (1% of total calls recorded).
The UNKN guild represented the majority of calls (n = 42; 81%) recorded at the tree detector.
Sixty-nine percent (n = 29) of call sequences were identified as high-frequency unknown (HFUN)
and 31 % (n = 13) of call sequences were identified as low-frequency unknown (LFUN).
For all detectors combined, 73% of call sequences (n = 2,023) were recorded when mean nightly
wind speeds were 6 m/s or less and 65% of call sequences (n = 1,809) were recorded when
mean nightly temperatures were 18 °C or higher.
CASSADAGA WIND PROJECT
BIRD AND BAT SURVEY REPORT, 2013-2014
i
Table of Contents
EXECUTIVE SUMMARY .............................................................................................................. 3
1.0 INTRODUCTION ............................................................................................................. 5
1.1 PROJECT BACKGROUND ................................................................................................. 5
1.2 PROJECT DESCRIPTION ..................................................................................................... 7
2.0 FALL BIRD MIGRATION SURVEYS ................................................................................... 8
2.1 METHODS ........................................................................................................................... 8 2.1.1 Field Surveys .................................................................................................... 8 2.1.2 Data Summary and Analysis ......................................................................... 8
2.2 RESULTS ............................................................................................................................... 9 2.2.1 Survey Effort and Weather Summary ........................................................... 9 2.2.2 Species and Habitat Results .......................................................................... 9 2.2.3 Species Observed .......................................................................................... 9 2.2.4 Rare, Threatened and Endangered Species ........................................... 10
2.3 DISCUSSION ..................................................................................................................... 10
3.0 SPRING RAPTOR MIGRATION SURVEYS ...................................................................... 11
3.1 METHODS ......................................................................................................................... 11 3.1.1 Field surveys ................................................................................................... 11 3.1.2 Data Summary and Analysis ....................................................................... 11
3.2 RESULTS ............................................................................................................................. 12 3.2.1 Weather Summary ........................................................................................ 13 3.2.2 Raptor Observations and Passage Rates ................................................. 13 3.2.3 Raptor Flight Heights and Behaviors .......................................................... 16 3.2.4 Regional Data Comparisons ....................................................................... 18 3.2.5 Rare, Threatened and Endangered Species ........................................... 23 3.2.6 Incidental Observations............................................................................... 23 3.2.7 Raptor Observations during Eagle Point Count Surveys ......................... 24
3.3 DISCUSSION ..................................................................................................................... 27
4.0 SPRING BREEDING BIRD SURVEYS ............................................................................... 28
4.1 METHODS ......................................................................................................................... 28 4.1.1 Field Surveys .................................................................................................. 28 4.1.2 Data Summary and Analysis ....................................................................... 28
4.2 RESULTS ............................................................................................................................. 28 4.2.1 Survey Effort and Weather Summary ......................................................... 28 4.2.2 Habitat Results ............................................................................................... 29 4.2.3 Species Observed ........................................................................................ 30 4.2.4 Rare, Threatened and Endangered Species ........................................... 31
4.3 DISCUSSION ..................................................................................................................... 31
5.0 ACOUSTIC BAT SURVEYS ............................................................................................. 31
5.1 METHODS ......................................................................................................................... 31
CASSADAGA WIND PROJECT
BIRD AND BAT SURVEY REPORT, 2013-2014
ii
5.1.1 Data Collection ............................................................................................ 31 5.1.2 Site Selection ................................................................................................. 32 5.1.3 Data Analysis ................................................................................................. 35 5.1.4 Weather Data ............................................................................................... 37
5.2 RESULTS ............................................................................................................................. 37 5.2.1 Timing of Activity ........................................................................................... 37 5.2.2 Species Composition ................................................................................... 41 5.2.3 Activity and Weather ................................................................................... 44
5.3 DISCUSSION ..................................................................................................................... 47
6.0 LITERATURE CITED ........................................................................................................ 49
LIST OF TABLES
Table 2-1. Summary of weather parameters during September migration surveys,
Cassadaga Wind Project, Fall, 2013 ..................................................................... 9 Table 2-2. Summary of migration point count results by habitat type, Cassadaga
Wind Project, Fall, 2013 ........................................................................................... 9 Table 3-1. A summary of raptor survey effort and results, Cassadaga Wind Project,
Spring, 2014 ............................................................................................................ 12 Table 3-2. Wind direction and pressure systems during raptor surveys, Cassadaga
Wind Project, Spring, 2014 .................................................................................... 13 Table 3-3. Summary of raptor locations in study area, Cassadaga Wind Project,
Spring, 2014 ............................................................................................................ 17 Table 3-4. Summary of raptor observations by behavior, Cassadaga Wind Project,
Spring, 2014 ............................................................................................................ 18 Table 3-5. Summary of publically available spring raptor data at proposed wind
sites in New York and in the northeastern U.S. (1999-present, listed from
lowest to
highest passage rate) ........................................................................................... 20 Table 3-6. Non-raptor avian species observed incidentally during raptor surveys,
Cassadaga Wind Project, Spring, 2014 .............................................................. 24 Table 3-7. Summary of raptor observations by location during eagle point count
surveys, Cassadaga Wind Project, July 2013 –July 2014 .................................. 25 Table 3-8. Summary of raptor observations by date during eagle point count
surveys, Cassadaga Wind Project, July 2013–July 2014 ................................... 26 Table 4-1. Summary of weather parameters during breeding bird point count
surveys, Cassadaga Wind Project, Spring, 2014 ................................................ 29 Table 4-2. Summary of breeding bird point count results by habitat type, excluding
observations of birds >100 m from the observer and flyovers, Cassadaga
Wind Project, Spring, 2014 .................................................................................... 30 Table 5-1. Habitat descriptions of locations sampled during acoustic bat surveys,
Cassadaga Wind Project, 2013-2014 .................................................................. 34 Table 5-2. Summary of bat detector field survey effort and results, Cassadaga
Wind Project, 2013-2014 ........................................................................................ 37
CASSADAGA WIND PROJECT
BIRD AND BAT SURVEY REPORT, 2013-2014
iii
Table 5-3. Distribution of detections by guild for all detectors, Cassadaga Wind
Project, 2013-2014 .................................................................................................. 42
LIST OF FIGURES
Figure 1. Bird and Bat Survey Locations. .............................................................................. 6 Figure 3-1. Survey day totals of raptor observations, Cassadaga Wind Project,
Spring, 2014 ............................................................................................................ 14 Figure 3-3. Number of observations of raptor species, Cassadaga Wind Project,
Spring, 2014 ............................................................................................................ 15 Figure 3-4. Number of observations of raptors per survey hour, Cassadaga Wind
Project, Spring, 2014 .............................................................................................. 16 Figure 3-5. Number of raptors observed within the Project area at heights above
and below 150 m, Cassadaga Wind Project, Spring, 2014 ............................ 18 Figure 5-1. Met 1 High and Low detectors, Cassadaga Wind Project, 2013-2014 .......... 33 Figure 5-2. Met 2 High and Low detectors, Cassadaga Wind Project, 2014.................... 33 Figure 5-3. Tree detector, Cassadaga Wind Project, 2013 ................................................... 34 Figure 5-4. Total monthly bat call sequence detections recorded by five
detectors, Cassadaga Wind Project, 2013-2014 ............................................... 38 Figure 5-5. Total monthly detection rates recorded by 5 detectors, Cassadaga
Wind Project, 2013-2014 ........................................................................................ 39 Figure 5-6. Number of call sequences recorded during each hour of the night
at met tower detectors, Cassadaga Wind Project, 2013-2014 ....................... 40 Figure 5-7. Number of call sequences recorded during each hour of the night
at the tree detector, Cassadaga Wind Project, Fall, 2013 .............................. 41 Figure 5-8. Histograms showing species composition of recorded bat call sequences
from met detectors, Cassadaga Wind Project, 2013-2014 ............................. 43 Figure 5-9. Histogram showing species composition of recorded bat call sequences
from the tree detector, Cassadaga Wind Project, Fall, 2013 .......................... 44 Figure 5-10. Nightly mean wind speed (m/s) and combined bat call sequence
detections for detectors in 2013 and 2014, Cassadaga Wind Project,
2013-2014 ................................................................................................................ 45 Figure 5-11. Nightly mean temperature (°C) and combined bat call sequence
detections for detectors in 2013 and detectors in 2014, Cassadaga
Wind Project, 2013-2014 ........................................................................................ 46 Figure 5-12. Nightly mean wind speed, and mean temperature versus combined
bat call sequence for detectors, Cassadaga Wind Project, Fall, 2013 ......... 47 Figure 5-13. Nightly mean wind speed, and mean temperature versus combined
bat call sequence for detectors, Cassadaga Wind Project, 2014 ................. 47
APPENDICES
Appendix A Migration Survey Data Tables
Appendix B Raptor Survey Data Tables
Appendix C Breeding Bird Survey Data Tables

CASSADAGA WIND PROJECT
BIRD AND BAT SURVEY REPORT, 2013-2014
iv
Appendix D Acoustic Bat Survey Tables
CASSADAGA WIND PROJECT
BIRD AND BAT SURVEY REPORT, 2013-2014
5
1.0 Introduction
1.1 PROJECT BACKGROUND
EverPower Wind Holdings, Inc. (EverPower) is considering the construction of the Cassadaga
Wind Project (Project) in Chautauqua County, New York. The proposed Project would include up
to 70 wind turbines located west of Route 83 in the towns of Stockton, Charlotte, Cherry Creek,
and Arkwright (Figure 1). The Project is in the early phase of development and the approximate
size of the area of interest is 24,000 acres. The number and locations of turbines, access roads,
and electrical corridors are preliminary.
The planning and survey coordination history for this Project is as follows:
In 2012, EverPower contracted TRC to conduct a Critical Issues Analysis for the Project.
In 2013, EverPower contracted Stantec Consulting Services Inc. (Stantec) to prepare a
Work Plan for Pre-Construction Avian and Bat Surveys (Work Plan; June 2013 REV July
2013) which was presented to biologists at the New York Regional Field Office of the US
Fish and Wildlife Service (USFWS) in Cortland, New York on 18 June 2013 and to the New
York State Department of Environmental Conservation (NYSDEC) via conference call on
27 June 2013; the Work Plan was subsequently revised based on agency feedback2.
In 2013 and 2014, EverPower contracted Stantec to conduct pre-construction bird and
bat studies including surveys detailed in the NYSDEC’s Guidelines for Conducting Bird
and Bat Studies at Commercial Wind Energy Projects (NYSDEC Guidelines; NYSDEC 2009)
and eagle point count surveys consistent with the USFWS’s Land-based Wind Energy
Guidelines (2012) and Eagle Conservation Plan Guidance (ECP Guidance; 2013). These
surveys included:
o bird migration surveys (fall 2013)
o habitat assessment (fall 2013)
o raptor migration surveys (spring 2014)
o breeding bird surveys (spring 2014)
o acoustic bat surveys (2013–2014)
o eagle point count surveys (2013–2014)
In spring 2014, Stantec requested information on known rare plant and animal species
from the New York Natural Heritage Program (NYNHP) database. NYNHP responded on
22 May 2014 (NYNHP 2014).
This report presents the results of the fall 2013 bird migration surveys, spring 2014 raptor migration
surveys, spring 2014 breeding bird surveys, and 2013-2014 acoustic bat surveys.
2 For meeting minutes, please refer to the March 28, 2014 Teleconference with NYSDEC to Discuss
EverPower’s Proposed Cassadaga Wind Project (8 April 2014), June 18, 2013 Meeting to Discuss EverPower’s
Proposed Cassadaga Wind Project (17 July 2013), June 27, 2013 Teleconference with NYSDEC to Discuss
EverPower’s Proposed Cassadaga Wind Project (17 July 2013), and March 24, 2014 Initial Conference for
Northern Long-eared Bat and Fall 2013 Survey Results Review - Cassadaga Wind Project (8 April 2014).
"
%Ia
%Ia
%Ia
MET 2
MET 1
Tree Detector
78
1
34
569
11
12 1314
Bird and Bat Survey Locations1
EverPower Wind Holdings, Inc.Cassadaga Wind Power
Notes1. Base map: ArcGIS Online USA Topo Maps
0 2.5Miles
LegendBreeding Bird SurveyLocationBreeding Bird SurveyControl
%Ia Acoustic Bat SurveyLocation
"Raptor SurveyLocation
Eagle Point CountLocation andSeptember StopoverSurvey LocationEagle Point Count800m BufferGeneral Project Area
V:\19
56\a
ctive
\195
6008
83\d
rawi
ng\m
xd\B
BS\0
0883
_01_
BirdB
atSu
rvey.m
xd
Rev
ised:
2014
-11-21
By: g
carp
entie
r
($$¯
(At page size of 8.5"x11")Chautauqua County, New York
Discla imer: Stantec assumes no responsib ility for data supplied in electronic format. The recip ient accepts full responsib ility for verifying the accuracy and completeness of the data. The recipient releases Stantec, its officers, employees, consultants and agents, from any and a ll claims arising in any way from the content or provision of the data.
195600883Prepared by GAC on 2014-11-20
Reviewed by SB on 2014-11-201 inch = 2 miles
Project Location
Client/Project
Figure No.
Title
CASSADAGA WIND PROJECT
BIRD AND BAT SURVEY REPORT, 2013-2014
7
Results of the fall 2013 habitat assessment are included in a separate memo report (Cassadaga
Wind Project – Habitat Assessment; 11 February 2014) and results of the 2013-2014 eagle point
count surveys are included in a separate memo report (Cassadaga Wind Project 2013-2014
Eagle Use Point Count Survey Results; 26 November 2014).
1.2 PROJECT DESCRIPTION
The Project area is located in the central portion of Chautauqua County and has forest blocks
located on the hilltops and steep slopes and agricultural land in the valleys. Existing
development surrounding the Project area is mainly concentrated in the villages of Cassadaga
and Sinclairville. Land use in the Project area consists of typical usage for Western New York
State and consists mainly of agricultural land, forestland, rural residential areas and low intensity
development. Agricultural land is used to support dairies, small beef farms, and hobby horse
farms. Pastures, hayfields and cornfields comprise the majority of the agricultural land. Forestland
is primarily used for timber production and recreation (TRC 2012).
The Project area is within the Northeastern Mixed Forest Province-Northern Glaciated Allegheny
Plateau Ecological Subregion (McNab and Avers 1994 as cited in TRC 2012). Northern hardwood
forests and Appalachian oak forests are found within this Ecological Subregion and are the
defining vegetative community. More specifically, the Project Area is within the Cattaraugus
Highlands Ecological Subzone (NYSDEC 1998 as cited in TRC 2012). Beech-Maple-Mesic forests
are the dominate forest type within the Project area; dominant tree species are American
beech (Fagus grandifolia) and sugar maple (Acer saccharum) or red maple (Acer rubrum). The
shrubland communities are successional old fields that are abandoned farmland. They range
from being dominated by goldenrods and other herbaceous vegetation with a few scattered
shrubs to having a thick cover of shrubs. Common shrub species found in this community are
arrowwood (Viburnum recognitum), hawthorn (Crateagus sp.) and honeysuckle (Lonicera sp.)
(TRC 2012).
Stantec conducted a ground-based habitat assessment at each of the 14 eagle point count
locations (Figure 1) to inform the Project of the presence of habitat with potential to support
state- or federally listed species (i.e. grassland species such as Henslow’s sparrow (Ammodramus
henslowii), sedge wren (Cistothorus platensis), and northern harrier (Circus cyaneus). We
recorded data at each point including cover type, percent canopy cover, and notes of current
or previous disturbance. Generally, the Project area contains a mixture of hardwood forest,
mixed (hardwood and softwood) forest, and agricultural land. Stantec identified potential
Henslow’s sparrow habitat in 13 locations within the Project area (Stantec 2014a). These areas
are fallow fields with dense cover of grass species and forbs estimated to be 2–4 ft in height with
some standing dead herbaceous vegetation for perching. Stantec surveyed these areas in
spring during the breeding bird surveys (Section 4.0) and did not detect Henslow’s sparrow.
CASSADAGA WIND PROJECT
BIRD AND BAT SURVEY REPORT, 2013-2014
8
2.0 Fall Bird Migration Surveys
2.1 METHODS
2.1.1 Field Surveys
Stantec conducted migratory point count surveys at 14 survey locations once each week in
September 2013. The 14 survey locations were the same points sampled during eagle point
count surveys. They were chosen in order to sample the various available habitat types in the
Project, and took into consideration proposed wind turbine locations and landowner
participation (Figure 1).
A Stantec biologist conducted surveys from sunrise until no later than approximately 10:00 a.m.,
in weather conditions conducive to hearing birdsong and seeing birds move about in
vegetation and in flight. All birds identified by sight or sound, including soaring raptors, waterfowl
and other fly-overs, were recorded during a 5-minute session at each survey point. The biologist
also recorded weather information and general habitat conditions at each survey point.
2.1.2 Data Summary and Analysis
Survey points were grouped into 3 habitat categories based on dominant vegetation cover and
general habitat characteristics: agricultural, forest edge, and over-grown field.
The species and number of individuals documented during surveys were used to calculate
species richness, relative abundance, frequency of occurrence, and community diversity, for all
species for all habitats combined, and for each habitat classification. These indexes are
described in more detail below.
Species richness (SR) is the total number of species detected.
Relative abundance (RA) is a way to quantify the number of individuals of a species in
relation to other species observed. RA takes into account the total number of individuals
detected, the number of times each point count location was surveyed, and the
number of survey points.
Frequency (Fr) of occurrence, expressed as a percentage, measures the percentage of
points where a particular species is detected.
Shannon Diversity Index (SDI) is a measure of species diversity in a community or habitat.
SDI can provide more information about community composition than species richness
alone because it takes into account relative abundance and the evenness of the
distribution of species. It indicates not only the number of species, but also how
abundance is distributed among all the species in the community or habitat.
CASSADAGA WIND PROJECT
BIRD AND BAT SURVEY REPORT, 2013-2014
9
2.2 RESULTS
2.2.1 Survey Effort and Weather Summary
Surveys were conducted on 3–4, 10–12, 17–18 and 25–26 September 2013. Surveys were not
conducted when wind or rain adversely affected the auditory detection of birds. Wind speeds
ranged from 1–12 miles per hour (mph; 0.45–5.36 m/s), average daily temperatures ranged from
3.9–25.2 degrees Celsius (°C), and sky conditions were typically clear to partly cloudy with
occasional fog (Table 2-1).
Table 2-1. Summary of weather parameters during September migration surveys, Cassadaga
Wind Project, Fall, 2013
Date Wind Speed Code(s) Average Temp (°C) Sky Conditions
9/3/2013 2 14.9 mostly cloudy, fog
9/4/2013 2,3 15.6 partly cloudy
9/10/2013 2,3 22.5 partly cloudy
9/11/2013 1,2 25.2 partly cloudy
9/12/2013 1 21 fog
9/17/2013 1,2 3.9 clear
9/18/2013 2 5.5 clear
9/25/2013 1,2 4.6 clear to partly cloudy
9/26/2013 1,2 8.4 partly cloudy
wind speed codes 1 = 0-3 mph; 2 = 4-8 mph; 3 = 9-12 mph; 4 = 13-18 mph; 5 = 19-24 mph
2.2.2 Species and Habitat Results
The biologist detected 27 species and 601 individual birds (Appendix A Table 1). Agricultural
habitat had the most individuals observed (n = 400), the greatest relative abundance (RA =
12.50), the greatest species richness (SR = 21) and the highest diversity index (SDI = 2.81). Error!
Reference source not found. summarizes the results of the surveys and analysis by habitat type
classification.
Table 2-2. Summary of migration point count results by habitat type, Cassadaga Wind Project,
Fall, 2013
Habitat Type
# Survey
Points
Total Birds
Observed
Relative
Abundance
Species
Richness
Shannon
Diversity
Index
Agricultural 8 400 12.50 21 2.81
Forest edge 3 108 9.00 14 2.72
Over-grown field 3 93 7.75 14 2.62
All points 14 601 10.73 27 3.47
CASSADAGA WIND PROJECT
BIRD AND BAT SURVEY REPORT, 2013-2014
10
2.2.3 Species Observed
In agricultural habitat, Canada goose (Branta canadensis) had the greatest relative
abundance (RA = 4.69), followed by American crow (Corvus brachyrhynchos) (RA = 2.31). In
forest edge habitat, cedar waxwing (Bombycilla cedrorum) had the greatest relative
abundance (RA = 2.00), followed by blue jay (Cyanocitta cristata) and American crow, which
both had RA values of 1.33. In over-grown field habitat, blue jay had the greatest relative
abundance (RA = 2.00), followed by American crow (RA = 1.58). Diversity indexes among all 3
habitat types were similar, and ranged from 2.62–2.81. Appendix A Table 2 shows the relative
abundance and frequency of each species observed by habitat type.
Stantec observed 3 large flocks of Canada geese during migration surveys: a flock of 42 on 4
September at point count 2, and 2 flocks of 32 and 55 on 11 September at point count 11. No
flocks of migrating waterbirds or waterfowl were observed.
2.2.4 Rare, Threatened and Endangered Species
Stantec did not observe any state- or federally listed endangered or threatened species, or state
species of special concern (NYSDEC 2014).
2.3 DISCUSSION
The objectives of the September migration point count surveys were to provide baseline data of
songbird species occurring in the Project area during fall migration, to assess the likelihood that
rare bird species occur in the Project area during fall migration, and to evaluate the degree to
which the migratory bird community in the Project area is typical of the region.
There are several factors that can influence the detection probability of migratory song birds,
including time of day, weather, bird behaviors, distance to the observer, and season. Drab
plumage of songbirds in the fall may inhibit an observer’s ability to differentiate among similar
species, and lack of birdsong in the fall may inhibit auditory detection of songbirds. These factors
may affect species composition and species richness estimates.
There were no state- or federally listed endangered or threatened species and no state species
of special concern observed. No flocks of migrating waterbirds or waterfowl were observed. The
species detected are generally common, regionally abundant and typical of the habitats in
which they were observed.
The selected points sampled the various available habitats within the Project area, and have
primary habitat characteristics representative of the Project and surrounding areas. The surveys
were timed to coincide with the peak migration in September, targeted optimal weather
conditions to facilitate the maximum detection of birds, and used standard point count survey
methods. Therefore, the results of the surveys provide a suitable reflection of the fall bird
community within the Project and surrounding areas.
CASSADAGA WIND PROJECT
BIRD AND BAT SURVEY REPORT, 2013-2014
11
3.0 Spring Raptor Migration Surveys
3.1 METHODS
3.1.1 Field surveys
Stantec conducted surveys approximately once every 7 days from eagle point count 7, a
centrally located point that provided a good view of the Project area (Photos 1–4). As stated in
the Work Plan (Stantec 2014b), since there is no specific migratory pathway for raptors near the
southern shore of Lake Erie in the fall and based on the Project’s location near the south shore of
Lake Erie, fall raptor migration surveys were not conducted at the Project.
Photos 1-4. Views from Raptor Survey Location to North (upper left), South (upper right), east
(lower left) and west (lower right), Cassadaga Wind Project, Spring, 2014
Surveys occurred between 9 a.m. and 5 p.m. and targeted days with suitable weather
conditions to support migration (following wind, no precipitation). For each observation, a
Stantec biologist recorded the species, number of individuals, sex and age class (if possible),
behavior, flight height and direction, time of sighting, and location of each bird relative to the
Project area. The biologist recorded hourly weather information, including temperature, wind
speed and direction, percent cloud cover, cloud type and height, and general sky conditions.
Incidental observations of other bird species also were recorded.
3.1.2 Data Summary and Analysis
Raptor observation data were summarized by survey day and for the entire survey period. Data
analysis included a summary of:
CASSADAGA WIND PROJECT
BIRD AND BAT SURVEY REPORT, 2013-2014
12
Daily and seasonal observation rates (raptors observed per hour)
Total number by species observed
Hourly observation totals
Location
Flight behaviors observed
Average minimum flight height of birds inside and outside the Project area
For those birds observed within proposed turbine areas (defined as turbine strings based on
the most current project layout [28 April 2014] plus a 402-m radius [0.25 mile] buffer, the
percentage of birds seen below 150 m (492 ft), the maximum height of the proposed
turbines.
3.2 RESULTS
Stantec conducted surveys on 13 days from 1 March to 26 May 2014 for a total of 96 survey
hours. See Table 3-1 for a results summary of the spring 2014 surveys.
Table 3-1. A summary of raptor survey effort and results, Cassadaga Wind Project, Spring, 2014
Range of survey dates 1 March–26 May
No. survey days 13
No. survey hours 96
No. raptor species observed 11
Raptor species observed (common name) Scientific name
American kestrel Falco sparverius
bald eagle Haliaeetus leucocephalus
broad-winged hawk Buteo platypterus
golden eagle Aquila chrysaetos
northern harrier Circus cyaneus
osprey Pandion haliaetus
red-shouldered hawk Buteo lineatus
red-tailed hawk Buteo jamaicensis
rough-legged hawk Buteo lagopus
sharp-shinned hawk Accipiter striatus
turkey vulture Cathartes aura
unidentified accipiter hawk Accipiter (sp)
unidentified buteo hawk Buteo (sp)
unidentified raptor Accipitridae (gen, sp)
Total no. observations of raptors 157
Seasonal passage rate (raptor
observations/hour) 1.64
Total no. observations of raptors within
turbine area (1/4 mile buffer) (percent of
total observations) 143 (91%)
Total no. of observations of raptors seen in
turbine area and below 150 m turbine height
(percent of total observations) 123 (78%)
CASSADAGA WIND PROJECT
BIRD AND BAT SURVEY REPORT, 2013-2014
13
3.2.1 Weather Summary
Temperatures ranged from -6°–28° C; the average hourly temperature among survey days was
11° C. Sky conditions were generally clear to partly cloudy, with periods of drizzle on 19 March,
14 April, and 7 May, periods of rain on 14 April, 13 May, and 20 May, and periods of fog and
snow flurries on 23 April. Wind direction was predominantly from the south, southwest, and
southeast. Wind speed ranged from 0–24 mph (0–10.7 m/s), and average daily wind speed
among survey days was 4–12 mph (1.8–5.4 m/s) (Table 3-2).
Table 3-2. Wind direction and pressure systems during raptor surveys, Cassadaga Wind Project,
Spring, 2014
Date
Wind
Direction
Wind Speed
Code(s) Daytime Pressure System (High or Low)
3/1/2014 SW 3 high pressure leaving, low pressure building mid-morning
3/14/2014 S 3 high pressure leaving overnight, low pressure building
3/19/2014 S 4,5 low pressure building with mid-day rain
3/27/2014 S 2,3 low pressure building with storm system to the west
4/1/2014 S, SE 2,3 low pressure building
4/10/2014 S 3,4 high pressure
4/14/2014 S 3,4 low pressure with large storm system arriving in afternoon
4/23/2014 SW 1,2 high pressure building
5/1/2014 S, SW 2 low pressure
5/7/2014 E, SE 1,2 low pressure building with small storm system to the west
5/13/2014 NE, SE, SW 1,2 low pressure passing with storm system
5/20/2014 S, SE 1,2 low pressure
5/26/2014 W, SW 2 high pressure
wind speed codes 1 = 0-3 mph; 2 = 4-8 mph; 3 = 9-12 mph; 4 = 13-18 mph; 5 = 19-24 mph
3.2.2 Raptor Observations and Passage Rates
Stantec recorded 157 raptor observations. The overall seasonal passage rate was 1.6 raptor
observations per hour (raptors/hr). The daily passage rates ranged from 0 raptors/hr on May 7 to
5.1 raptors/hr on May 1. Figure 3-1 and Appendix B Table 1 show the daily totals and daily
passage rates of raptors observed.
CASSADAGA WIND PROJECT
BIRD AND BAT SURVEY REPORT, 2013-2014
14
Figure 3-1. Survey day totals of raptor observations, Cassadaga Wind Project, Spring, 2014
Stantec recorded 11 raptor species over the course of the survey period. Observers also
documented individuals that could not be identified to species due to limiting factors including
the bird being too far from the observer, the bird being visible for only a brief period of time,
weather conditions, lighting (time of day) and/or topography limiting the viewshed. Turkey
vulture (Cathartes aura) was the most commonly observed species (n = 64, 41%), followed by
red-tailed hawk (Buteo jamaicensis) (n = 34, 22%) and broad-winged hawk (Buteo platypterus)
(n = 17, 11%) (Figure 3-2, Appendix B Table 1).
15
9 8 8
13
18
12
5
41
0
8
4
16
0
5
10
15
20
25
30
35
40
45
# r
ap
tor
ob
serv
atio
ns
Date
CASSADAGA WIND PROJECT
BIRD AND BAT SURVEY REPORT, 2013-2014
15
Figure 3-2. Number of observations of raptor species, Cassadaga Wind Project, Spring, 2014
Throughout the survey season, raptor observations were most numerous between 1:00–2:00 p.m.
(Figure 3-3, Appendix B Table 2).
7 6
17
1 1 3 3
34
5 4
64
1 5 6
0
10
20
30
40
50
60
70
# r
ap
tor
ob
serv
atio
ns
Species
CASSADAGA WIND PROJECT
BIRD AND BAT SURVEY REPORT, 2013-2014
16
Figure 3-3. Number of observations of raptors per survey hour, Cassadaga Wind Project, Spring,
2014
3.2.3 Raptor Flight Heights and Behaviors
Of the 157 raptors observed, 143 (91%) occurred within the turbine area. The average minimum
flight height of raptors within the turbine area was 60.1 m, compared to 100.4 m for raptors
observed outside the turbine area (Table 3-3). Of the raptors observed within the turbine area,
123 (86% [78% of total observations]) occurred at flight heights below the proposed maximum
turbine blade-tip height of 150 m (492 ft) for at least a portion of their flight. Turkey vultures
represented the greatest number of observations below the maximum turbine blade-tip height
(n = 63, 40% of total observations) (Figure 3-4, Appendix B Table 3).
9
15
21
26
35
18
21
12
0
11.5 13 13 13 13
12 10.5
9
1 0
5
10
15
20
25
30
35
40
9:00-10:00 10:00-11:00 11:00-12:00 12:00-1:00 1:00-2:00 2:00-3:00 3:00-4:00 4:00-5:00 5:00-6:00
Time
# raptor
observations
survey effort in
hours
CASSADAGA WIND PROJECT
BIRD AND BAT SURVEY REPORT, 2013-2014
17
Table 3-3. Summary of raptor locations in study area, Cassadaga Wind Project, Spring, 2014
Species
No. Inside
Turbine Area 1
No. Outside
Turbine Area 2
No. Crossed
Ridge
American kestrel 7
bald eagle 6
broad-winged hawk 17
golden eagle 1
northern harrier 1
osprey 3
red-shouldered hawk 3 1
red-tailed hawk 27 7 3
rough-legged hawk 5 4
sharp-shinned hawk 4
turkey vulture 63 1 2
unidentified accipiter 1
unidentified buteo hawk 5
unidentified raptor 1 5 1
Total 143 14 11
Percent of observations 91% 9% 7%
Average minimum flight
height (m) 60.1 100.4 3 70 1 Single observations inside turbine area may also have been seen outside turbine
area. 2 Single observations outside turbine area only. 3 Includes minimum flight heights outside turbine area for raptors that flew both
inside and outside turbine area.
CASSADAGA WIND PROJECT
BIRD AND BAT SURVEY REPORT, 2013-2014
18
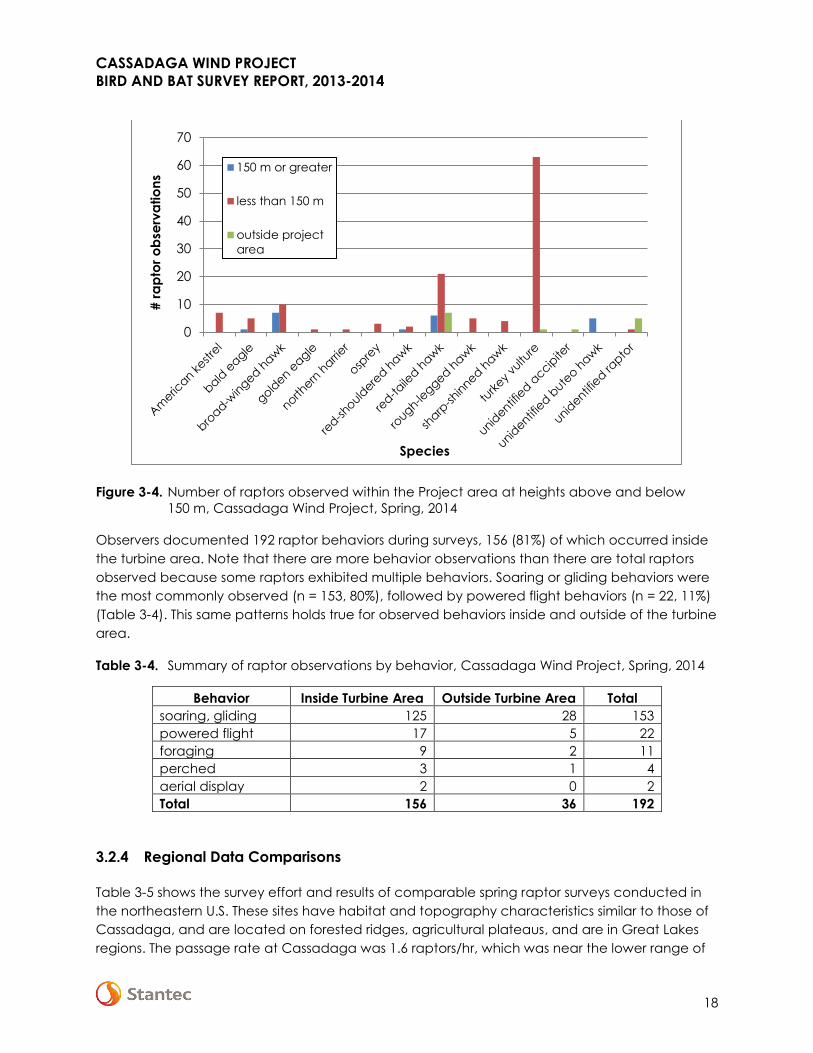
Figure 3-4. Number of raptors observed within the Project area at heights above and below
150 m, Cassadaga Wind Project, Spring, 2014
Observers documented 192 raptor behaviors during surveys, 156 (81%) of which occurred inside
the turbine area. Note that there are more behavior observations than there are total raptors
observed because some raptors exhibited multiple behaviors. Soaring or gliding behaviors were
the most commonly observed (n = 153, 80%), followed by powered flight behaviors (n = 22, 11%)
(Table 3-4). This same patterns holds true for observed behaviors inside and outside of the turbine
area.
Table 3-4. Summary of raptor observations by behavior, Cassadaga Wind Project, Spring, 2014
Behavior Inside Turbine Area Outside Turbine Area Total
soaring, gliding 125 28 153
powered flight 17 5 22
foraging 9 2 11
perched 3 1 4
aerial display 2 0 2
Total 156 36 192
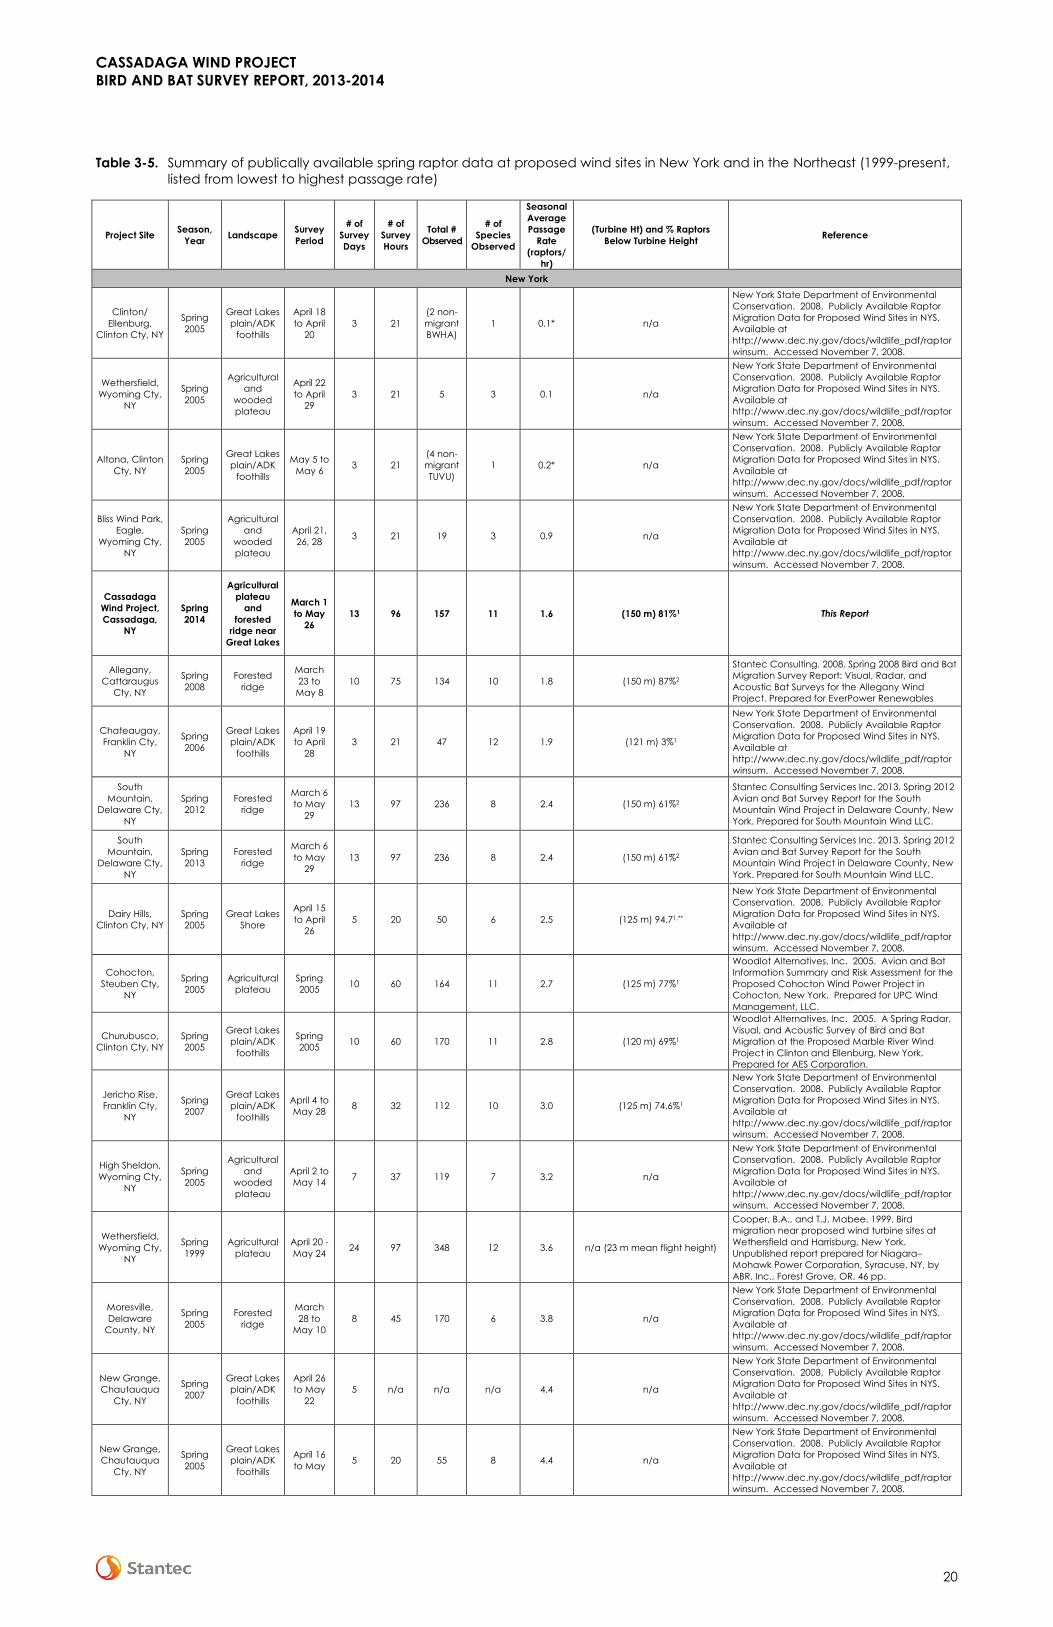
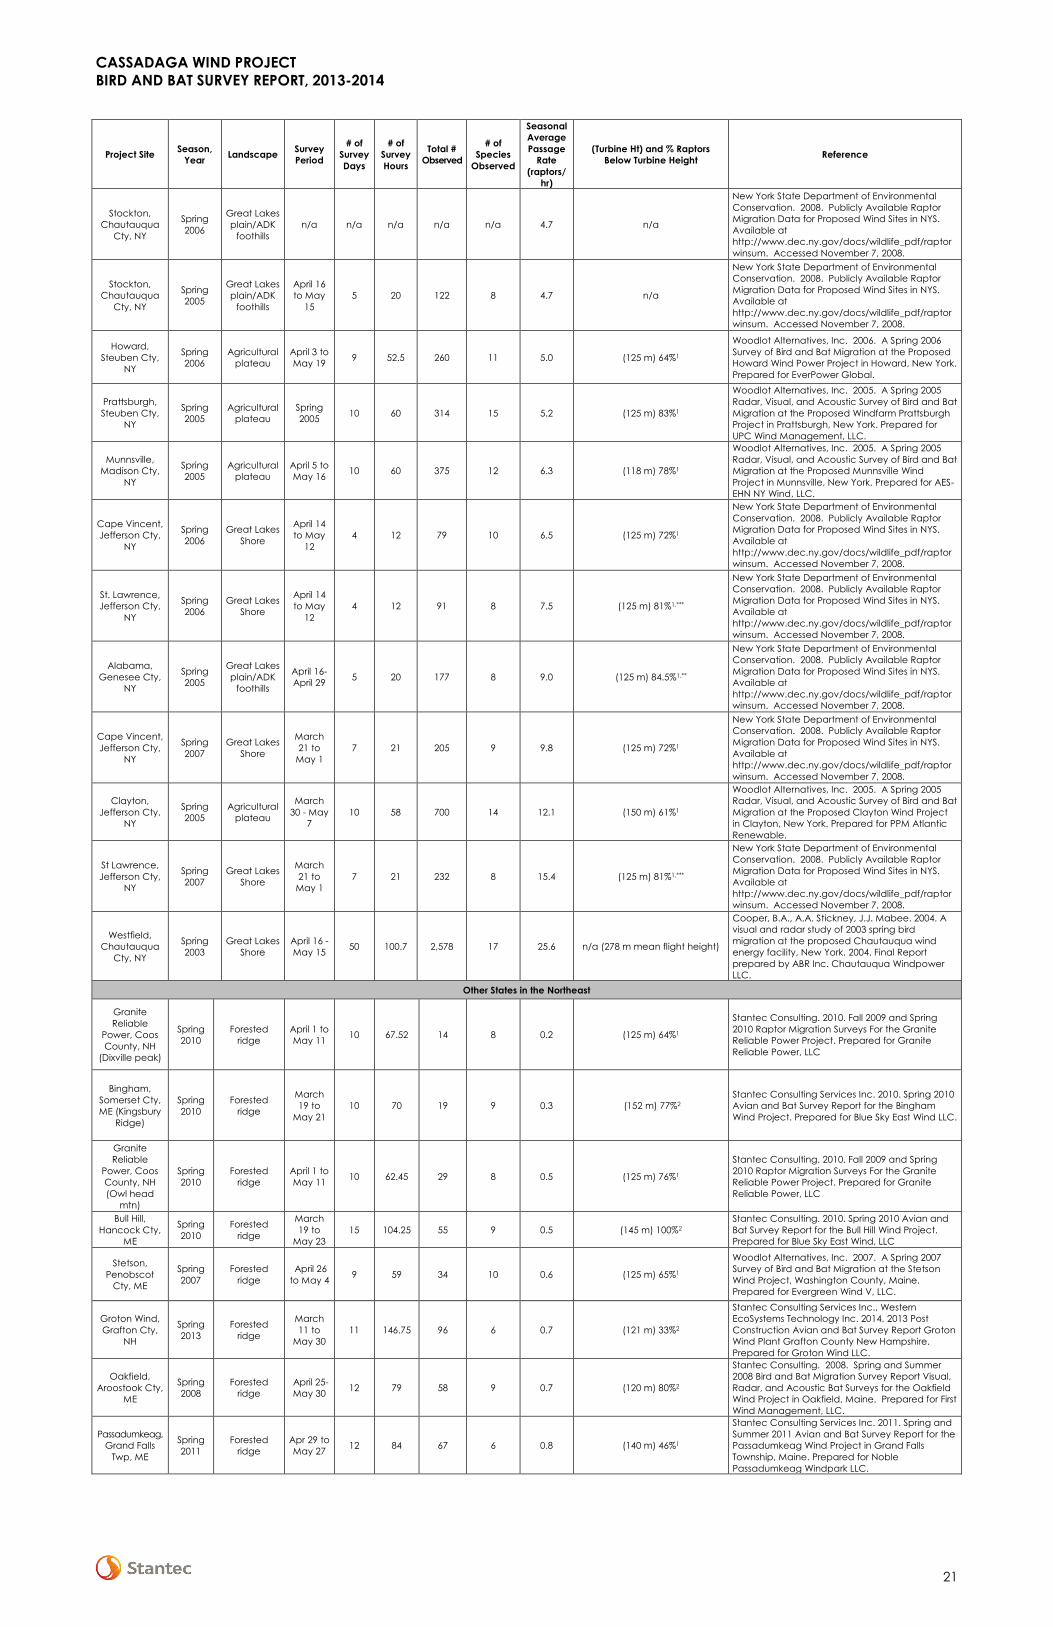
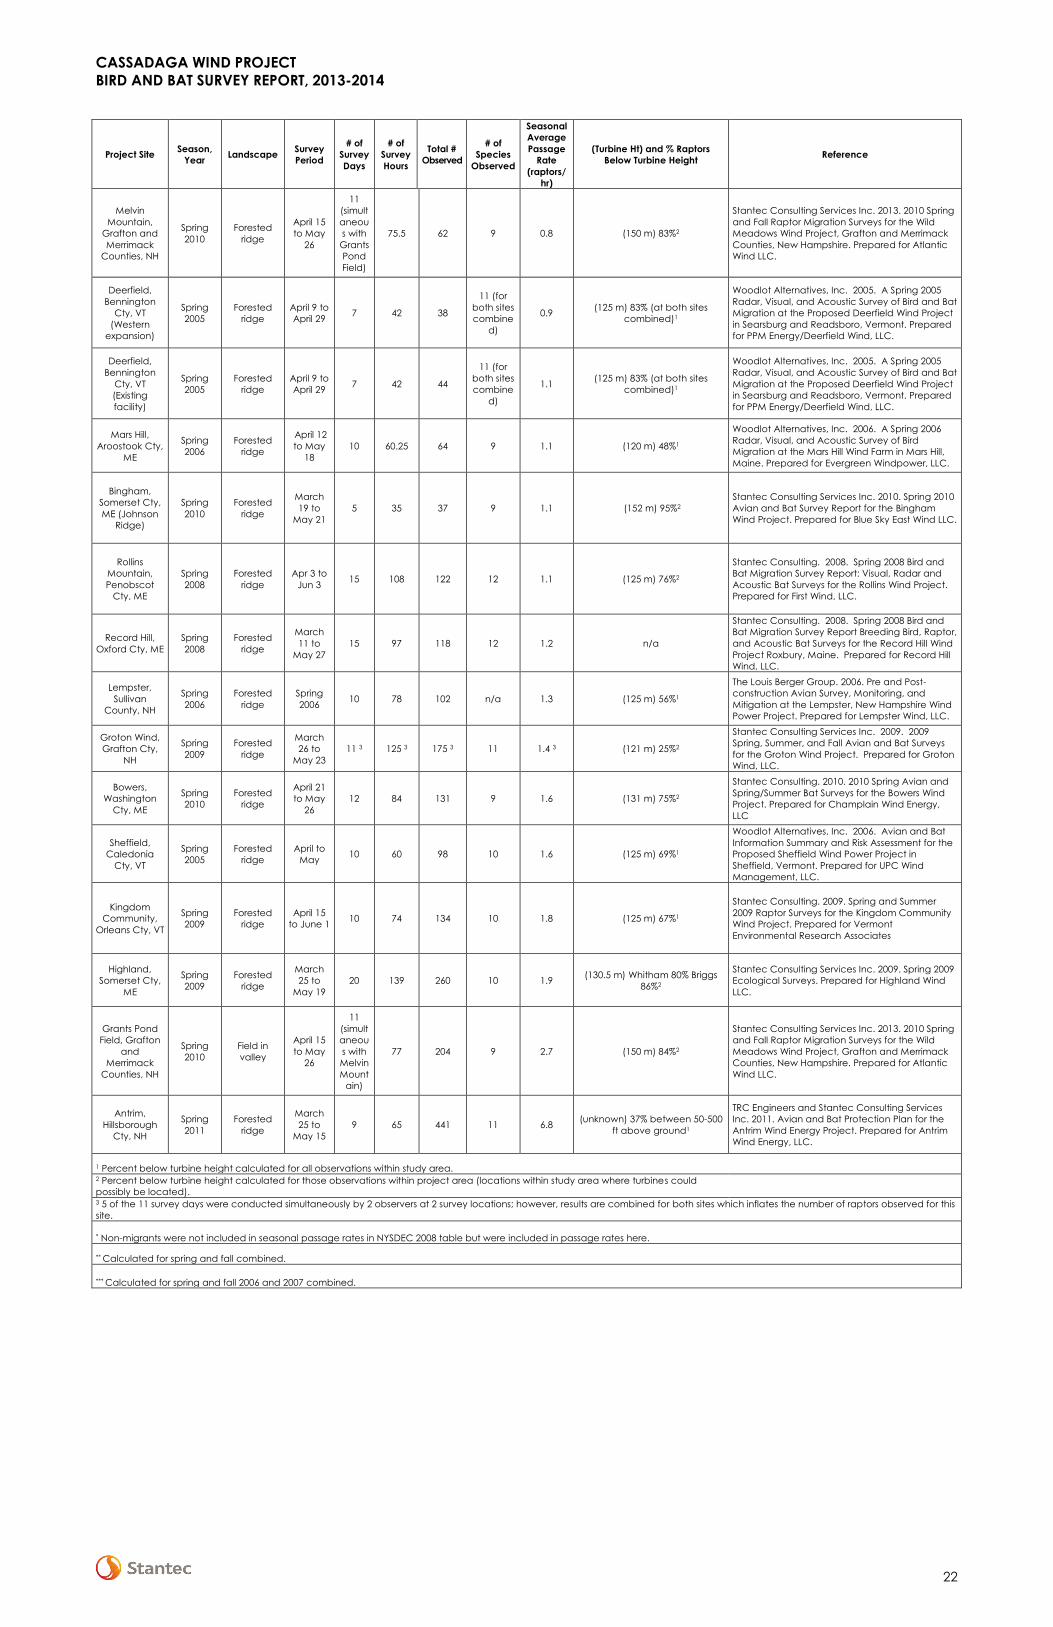
3.2.4 Regional Data Comparisons
Table 3-5 shows the survey effort and results of comparable spring raptor surveys conducted in
the northeastern U.S. These sites have habitat and topography characteristics similar to those of
Cassadaga, and are located on forested ridges, agricultural plateaus, and are in Great Lakes
regions. The passage rate at Cassadaga was 1.6 raptors/hr, which was near the lower range of
0
10
20
30
40
50
60
70
# r
ap
tor
ob
serv
atio
ns
Species
150 m or greater
less than 150 m
outside project
area

CASSADAGA WIND PROJECT
BIRD AND BAT SURVEY REPORT, 2013-2014
19
passage rates documented in New York (0.1–25.6 raptors/hr), and within the range of passage
rates documented in the northeastern U.S. (0.2–6.8 raptors/hour).
CASSADAGA WIND PROJECT
BIRD AND BAT SURVEY REPORT, 2013-2014
20
Table 3-5. Summary of publically available spring raptor data at proposed wind sites in New York and in the Northeast (1999-present,
listed from lowest to highest passage rate)
Project Site Season,
Year Landscape
Survey
Period
# of
Survey
Days
# of
Survey
Hours
Total #
Observed
# of
Species
Observed
Seasonal
Average
Passage
Rate
(raptors/
hr)
(Turbine Ht) and % Raptors
Below Turbine Height Reference
New York
Clinton/
Ellenburg,
Clinton Cty, NY
Spring
2005
Great Lakes
plain/ADK
foothills
April 18
to April
20
3 21
(2 non-
migrant
BWHA)
1 0.1* n/a
New York State Department of Environmental
Conservation. 2008. Publicly Available Raptor
Migration Data for Proposed Wind Sites in NYS.
Available at
http://www.dec.ny.gov/docs/wildlife_pdf/raptor
winsum. Accessed November 7, 2008.
Wethersfield,
Wyoming Cty,
NY
Spring
2005
Agricultural
and
wooded
plateau
April 22
to April
29
3 21 5 3 0.1 n/a
New York State Department of Environmental
Conservation. 2008. Publicly Available Raptor
Migration Data for Proposed Wind Sites in NYS.
Available at
http://www.dec.ny.gov/docs/wildlife_pdf/raptor
winsum. Accessed November 7, 2008.
Altona, Clinton
Cty, NY
Spring
2005
Great Lakes
plain/ADK
foothills
May 5 to
May 6 3 21
(4 non-
migrant
TUVU)
1 0.2* n/a
New York State Department of Environmental
Conservation. 2008. Publicly Available Raptor
Migration Data for Proposed Wind Sites in NYS.
Available at
http://www.dec.ny.gov/docs/wildlife_pdf/raptor
winsum. Accessed November 7, 2008.
Bliss Wind Park,
Eagle,
Wyoming Cty,
NY
Spring
2005
Agricultural
and
wooded
plateau
April 21,
26, 28 3 21 19 3 0.9 n/a
New York State Department of Environmental
Conservation. 2008. Publicly Available Raptor
Migration Data for Proposed Wind Sites in NYS.
Available at
http://www.dec.ny.gov/docs/wildlife_pdf/raptor
winsum. Accessed November 7, 2008.
Cassadaga
Wind Project,
Cassadaga,
NY
Spring
2014
Agricultural
plateau
and
forested
ridge near
Great Lakes
March 1
to May
26
13 96 157 11 1.6 (150 m) 81%1 This Report
Allegany,
Cattaraugus
Cty, NY
Spring
2008
Forested
ridge
March
23 to
May 8
10 75 134 10 1.8 (150 m) 87%2
Stantec Consulting. 2008. Spring 2008 Bird and Bat
Migration Survey Report: Visual, Radar, and
Acoustic Bat Surveys for the Allegany Wind
Project. Prepared for EverPower Renewables
Chateaugay,
Franklin Cty,
NY
Spring
2006
Great Lakes
plain/ADK
foothills
April 19
to April
28
3 21 47 12 1.9 (121 m) 3%1
New York State Department of Environmental
Conservation. 2008. Publicly Available Raptor
Migration Data for Proposed Wind Sites in NYS.
Available at
http://www.dec.ny.gov/docs/wildlife_pdf/raptor
winsum. Accessed November 7, 2008.
South
Mountain,
Delaware Cty,
NY
Spring
2012
Forested
ridge
March 6
to May
29
13 97 236 8 2.4 (150 m) 61%2
Stantec Consulting Services Inc. 2013. Spring 2012
Avian and Bat Survey Report for the South
Mountain Wind Project in Delaware County, New
York. Prepared for South Mountain Wind LLC.
South
Mountain,
Delaware Cty,
NY
Spring
2013
Forested
ridge
March 6
to May
29
13 97 236 8 2.4 (150 m) 61%2
Stantec Consulting Services Inc. 2013. Spring 2012
Avian and Bat Survey Report for the South
Mountain Wind Project in Delaware County, New
York. Prepared for South Mountain Wind LLC.
Dairy Hills,
Clinton Cty, NY
Spring
2005
Great Lakes
Shore
April 15
to April
26
5 20 50 6 2.5 (125 m) 94.71,**
New York State Department of Environmental
Conservation. 2008. Publicly Available Raptor
Migration Data for Proposed Wind Sites in NYS.
Available at
http://www.dec.ny.gov/docs/wildlife_pdf/raptor
winsum. Accessed November 7, 2008.
Cohocton,
Steuben Cty,
NY
Spring
2005
Agricultural
plateau
Spring
2005 10 60 164 11 2.7 (125 m) 77%1
Woodlot Alternatives, Inc. 2005. Avian and Bat
Information Summary and Risk Assessment for the
Proposed Cohocton Wind Power Project in
Cohocton, New York. Prepared for UPC Wind
Management, LLC.
Churubusco,
Clinton Cty, NY
Spring
2005
Great Lakes
plain/ADK
foothills
Spring
2005 10 60 170 11 2.8 (120 m) 69%1
Woodlot Alternatives, Inc. 2005. A Spring Radar,
Visual, and Acoustic Survey of Bird and Bat
Migration at the Proposed Marble River Wind
Project in Clinton and Ellenburg, New York.
Prepared for AES Corporation.
Jericho Rise,
Franklin Cty,
NY
Spring
2007
Great Lakes
plain/ADK
foothills
April 4 to
May 28 8 32 112 10 3.0 (125 m) 74.6%1
New York State Department of Environmental
Conservation. 2008. Publicly Available Raptor
Migration Data for Proposed Wind Sites in NYS.
Available at
http://www.dec.ny.gov/docs/wildlife_pdf/raptor
winsum. Accessed November 7, 2008.
High Sheldon,
Wyoming Cty,
NY
Spring
2005
Agricultural
and
wooded
plateau
April 2 to
May 14 7 37 119 7 3.2 n/a
New York State Department of Environmental
Conservation. 2008. Publicly Available Raptor
Migration Data for Proposed Wind Sites in NYS.
Available at
http://www.dec.ny.gov/docs/wildlife_pdf/raptor
winsum. Accessed November 7, 2008.
Wethersfield,
Wyoming Cty,
NY
Spring
1999
Agricultural
plateau
April 20 -
May 24 24 97 348 12 3.6 n/a (23 m mean flight height)
Cooper, B.A., and T.J. Mabee. 1999. Bird
migration near proposed wind turbine sites at
Wethersfield and Harrisburg, New York.
Unpublished report prepared for Niagara–
Mohawk Power Corporation, Syracuse, NY, by
ABR, Inc., Forest Grove, OR. 46 pp.
Moresville,
Delaware
County, NY
Spring
2005
Forested
ridge
March
28 to
May 10
8 45 170 6 3.8 n/a
New York State Department of Environmental
Conservation. 2008. Publicly Available Raptor
Migration Data for Proposed Wind Sites in NYS.
Available at
http://www.dec.ny.gov/docs/wildlife_pdf/raptor
winsum. Accessed November 7, 2008.
New Grange,
Chautauqua
Cty, NY
Spring
2007
Great Lakes
plain/ADK
foothills
April 26
to May
22
5 n/a n/a n/a 4.4 n/a
New York State Department of Environmental
Conservation. 2008. Publicly Available Raptor
Migration Data for Proposed Wind Sites in NYS.
Available at
http://www.dec.ny.gov/docs/wildlife_pdf/raptor
winsum. Accessed November 7, 2008.
New Grange,
Chautauqua
Cty, NY
Spring
2005
Great Lakes
plain/ADK
foothills
April 16
to May 5 20 55 8 4.4 n/a
New York State Department of Environmental
Conservation. 2008. Publicly Available Raptor
Migration Data for Proposed Wind Sites in NYS.
Available at
http://www.dec.ny.gov/docs/wildlife_pdf/raptor
winsum. Accessed November 7, 2008.
CASSADAGA WIND PROJECT
BIRD AND BAT SURVEY REPORT, 2013-2014
21
Project Site Season,
Year Landscape
Survey
Period
# of
Survey
Days
# of
Survey
Hours
Total #
Observed
# of
Species
Observed
Seasonal
Average
Passage
Rate
(raptors/
hr)
(Turbine Ht) and % Raptors
Below Turbine Height Reference
Stockton,
Chautauqua
Cty, NY
Spring
2006
Great Lakes
plain/ADK
foothills
n/a n/a n/a n/a n/a 4.7 n/a
New York State Department of Environmental
Conservation. 2008. Publicly Available Raptor
Migration Data for Proposed Wind Sites in NYS.
Available at
http://www.dec.ny.gov/docs/wildlife_pdf/raptor
winsum. Accessed November 7, 2008.
Stockton,
Chautauqua
Cty, NY
Spring
2005
Great Lakes
plain/ADK
foothills
April 16
to May
15
5 20 122 8 4.7 n/a
New York State Department of Environmental
Conservation. 2008. Publicly Available Raptor
Migration Data for Proposed Wind Sites in NYS.
Available at
http://www.dec.ny.gov/docs/wildlife_pdf/raptor
winsum. Accessed November 7, 2008.
Howard,
Steuben Cty,
NY
Spring
2006
Agricultural
plateau
April 3 to
May 19 9 52.5 260 11 5.0 (125 m) 64%1
Woodlot Alternatives, Inc. 2006. A Spring 2006
Survey of Bird and Bat Migration at the Proposed
Howard Wind Power Project in Howard, New York.
Prepared for EverPower Global.
Prattsburgh,
Steuben Cty,
NY
Spring
2005
Agricultural
plateau
Spring
2005 10 60 314 15 5.2 (125 m) 83%1
Woodlot Alternatives, Inc. 2005. A Spring 2005
Radar, Visual, and Acoustic Survey of Bird and Bat
Migration at the Proposed Windfarm Prattsburgh
Project in Prattsburgh, New York. Prepared for
UPC Wind Management, LLC.
Munnsville,
Madison Cty,
NY
Spring
2005
Agricultural
plateau
April 5 to
May 16 10 60 375 12 6.3 (118 m) 78%1
Woodlot Alternatives, Inc. 2005. A Spring 2005
Radar, Visual, and Acoustic Survey of Bird and Bat
Migration at the Proposed Munnsville Wind
Project in Munnsville, New York. Prepared for AES-
EHN NY Wind, LLC.
Cape Vincent,
Jefferson Cty,
NY
Spring
2006
Great Lakes
Shore
April 14
to May
12
4 12 79 10 6.5 (125 m) 72%1
New York State Department of Environmental
Conservation. 2008. Publicly Available Raptor
Migration Data for Proposed Wind Sites in NYS.
Available at
http://www.dec.ny.gov/docs/wildlife_pdf/raptor
winsum. Accessed November 7, 2008.
St. Lawrence,
Jefferson Cty,
NY
Spring
2006
Great Lakes
Shore
April 14
to May
12
4 12 91 8 7.5 (125 m) 81%1,***
New York State Department of Environmental
Conservation. 2008. Publicly Available Raptor
Migration Data for Proposed Wind Sites in NYS.
Available at
http://www.dec.ny.gov/docs/wildlife_pdf/raptor
winsum. Accessed November 7, 2008.
Alabama,
Genesee Cty,
NY
Spring
2005
Great Lakes
plain/ADK
foothills
April 16-
April 29 5 20 177 8 9.0 (125 m) 84.5%1,**
New York State Department of Environmental
Conservation. 2008. Publicly Available Raptor
Migration Data for Proposed Wind Sites in NYS.
Available at
http://www.dec.ny.gov/docs/wildlife_pdf/raptor
winsum. Accessed November 7, 2008.
Cape Vincent,
Jefferson Cty,
NY
Spring
2007
Great Lakes
Shore
March
21 to
May 1
7 21 205 9 9.8 (125 m) 72%1
New York State Department of Environmental
Conservation. 2008. Publicly Available Raptor
Migration Data for Proposed Wind Sites in NYS.
Available at
http://www.dec.ny.gov/docs/wildlife_pdf/raptor
winsum. Accessed November 7, 2008.
Clayton,
Jefferson Cty,
NY
Spring
2005
Agricultural
plateau
March
30 - May
7
10 58 700 14 12.1 (150 m) 61%1
Woodlot Alternatives, Inc. 2005. A Spring 2005
Radar, Visual, and Acoustic Survey of Bird and Bat
Migration at the Proposed Clayton Wind Project
in Clayton, New York. Prepared for PPM Atlantic
Renewable.
St Lawrence,
Jefferson Cty,
NY
Spring
2007
Great Lakes
Shore
March
21 to
May 1
7 21 232 8 15.4 (125 m) 81%1,***
New York State Department of Environmental
Conservation. 2008. Publicly Available Raptor
Migration Data for Proposed Wind Sites in NYS.
Available at
http://www.dec.ny.gov/docs/wildlife_pdf/raptor
winsum. Accessed November 7, 2008.
Westfield,
Chautauqua
Cty, NY
Spring
2003
Great Lakes
Shore
April 16 -
May 15 50 100.7 2,578 17 25.6 n/a (278 m mean flight height)
Cooper, B.A., A.A. Stickney, J.J. Mabee. 2004. A
visual and radar study of 2003 spring bird
migration at the proposed Chautauqua wind
energy facility, New York. 2004. Final Report
prepared by ABR Inc. Chautauqua Windpower
LLC.
Other States in the Northeast
Granite
Reliable
Power, Coos
County, NH
(Dixville peak)
Spring
2010
Forested
ridge
April 1 to
May 11 10 67.52 14 8 0.2 (125 m) 64%1
Stantec Consulting. 2010. Fall 2009 and Spring
2010 Raptor Migration Surveys For the Granite
Reliable Power Project. Prepared for Granite
Reliable Power, LLC
Bingham,
Somerset Cty,
ME (Kingsbury
Ridge)
Spring
2010
Forested
ridge
March
19 to
May 21
10 70 19 9 0.3 (152 m) 77%2
Stantec Consulting Services Inc. 2010. Spring 2010
Avian and Bat Survey Report for the Bingham
Wind Project. Prepared for Blue Sky East Wind LLC.
Granite
Reliable
Power, Coos
County, NH
(Owl head
mtn)
Spring
2010
Forested
ridge
April 1 to
May 11 10 62.45 29 8 0.5 (125 m) 76%1
Stantec Consulting. 2010. Fall 2009 and Spring
2010 Raptor Migration Surveys For the Granite
Reliable Power Project. Prepared for Granite
Reliable Power, LLC
Bull Hill,
Hancock Cty,
ME
Spring
2010
Forested
ridge
March
19 to
May 23
15 104.25 55 9 0.5 (145 m) 100%2
Stantec Consulting. 2010. Spring 2010 Avian and
Bat Survey Report for the Bull Hill Wind Project.
Prepared for Blue Sky East Wind, LLC
Stetson,
Penobscot
Cty, ME
Spring
2007
Forested
ridge
April 26
to May 4 9 59 34 10 0.6 (125 m) 65%1
Woodlot Alternatives, Inc. 2007. A Spring 2007
Survey of Bird and Bat Migration at the Stetson
Wind Project, Washington County, Maine.
Prepared for Evergreen Wind V, LLC.
Groton Wind,
Grafton Cty,
NH
Spring
2013
Forested
ridge
March
11 to
May 30
11 146.75 96 6 0.7 (121 m) 33%2
Stantec Consulting Services Inc., Western
EcoSystems Technology Inc. 2014. 2013 Post
Construction Avian and Bat Survey Report Groton
Wind Plant Grafton County New Hampshire.
Prepared for Groton Wind LLC.
Oakfield,
Aroostook Cty,
ME
Spring
2008
Forested
ridge
April 25-
May 30 12 79 58 9 0.7 (120 m) 80%2
Stantec Consulting. 2008. Spring and Summer
2008 Bird and Bat Migration Survey Report Visual,
Radar, and Acoustic Bat Surveys for the Oakfield
Wind Project in Oakfield, Maine. Prepared for First
Wind Management, LLC.
Passadumkeag,
Grand Falls
Twp, ME
Spring
2011
Forested
ridge
Apr 29 to
May 27 12 84 67 6 0.8 (140 m) 46%1
Stantec Consulting Services Inc. 2011. Spring and
Summer 2011 Avian and Bat Survey Report for the
Passadumkeag Wind Project in Grand Falls
Township, Maine. Prepared for Noble
Passadumkeag Windpark LLC.
CASSADAGA WIND PROJECT
BIRD AND BAT SURVEY REPORT, 2013-2014
22
Project Site Season,
Year Landscape
Survey
Period
# of
Survey
Days
# of
Survey
Hours
Total #
Observed
# of
Species
Observed
Seasonal
Average
Passage
Rate
(raptors/
hr)
(Turbine Ht) and % Raptors
Below Turbine Height Reference
Melvin
Mountain,
Grafton and
Merrimack
Counties, NH
Spring
2010
Forested
ridge
April 15
to May
26
11
(simult
aneou
s with
Grants
Pond
Field)
75.5 62 9 0.8 (150 m) 83%2
Stantec Consulting Services Inc. 2013. 2010 Spring
and Fall Raptor Migration Surveys for the Wild
Meadows Wind Project, Grafton and Merrimack
Counties, New Hampshire. Prepared for Atlantic
Wind LLC.
Deerfield,
Bennington
Cty, VT
(Western
expansion)
Spring
2005
Forested
ridge
April 9 to
April 29 7 42 38
11 (for
both sites
combine
d)
0.9 (125 m) 83% (at both sites
combined)1
Woodlot Alternatives, Inc. 2005. A Spring 2005
Radar, Visual, and Acoustic Survey of Bird and Bat
Migration at the Proposed Deerfield Wind Project
in Searsburg and Readsboro, Vermont. Prepared
for PPM Energy/Deerfield Wind, LLC.
Deerfield,
Bennington
Cty, VT
(Existing
facility)
Spring
2005
Forested
ridge
April 9 to
April 29 7 42 44
11 (for
both sites
combine
d)
1.1 (125 m) 83% (at both sites
combined)1
Woodlot Alternatives, Inc. 2005. A Spring 2005
Radar, Visual, and Acoustic Survey of Bird and Bat
Migration at the Proposed Deerfield Wind Project
in Searsburg and Readsboro, Vermont. Prepared
for PPM Energy/Deerfield Wind, LLC.
Mars Hill,
Aroostook Cty,
ME
Spring
2006
Forested
ridge
April 12
to May
18
10 60.25 64 9 1.1 (120 m) 48%1
Woodlot Alternatives, Inc. 2006. A Spring 2006
Radar, Visual, and Acoustic Survey of Bird
Migration at the Mars Hill Wind Farm in Mars Hill,
Maine. Prepared for Evergreen Windpower, LLC.
Bingham,
Somerset Cty,
ME (Johnson
Ridge)
Spring
2010
Forested
ridge
March
19 to
May 21
5 35 37 9 1.1 (152 m) 95%2
Stantec Consulting Services Inc. 2010. Spring 2010
Avian and Bat Survey Report for the Bingham
Wind Project. Prepared for Blue Sky East Wind LLC.
Rollins
Mountain,
Penobscot
Cty, ME
Spring
2008
Forested
ridge
Apr 3 to
Jun 3 15 108 122 12 1.1 (125 m) 76%2
Stantec Consulting. 2008. Spring 2008 Bird and
Bat Migration Survey Report: Visual, Radar and
Acoustic Bat Surveys for the Rollins Wind Project.
Prepared for First Wind, LLC.
Record Hill,
Oxford Cty, ME
Spring
2008
Forested
ridge
March
11 to
May 27
15 97 118 12 1.2 n/a
Stantec Consulting. 2008. Spring 2008 Bird and
Bat Migration Survey Report Breeding Bird, Raptor,
and Acoustic Bat Surveys for the Record Hill Wind
Project Roxbury, Maine. Prepared for Record Hill
Wind, LLC.
Lempster,
Sullivan
County, NH
Spring
2006
Forested
ridge
Spring
2006 10 78 102 n/a 1.3 (125 m) 56%1
The Louis Berger Group. 2006. Pre and Post-
construction Avian Survey, Monitoring, and
Mitigation at the Lempster, New Hampshire Wind
Power Project. Prepared for Lempster Wind, LLC.
Groton Wind,
Grafton Cty,
NH
Spring
2009
Forested
ridge
March
26 to
May 23
11 3 125 3 175 3 11 1.4 3 (121 m) 25%2
Stantec Consulting Services Inc. 2009. 2009
Spring, Summer, and Fall Avian and Bat Surveys
for the Groton Wind Project. Prepared for Groton
Wind, LLC.
Bowers,
Washington
Cty, ME
Spring
2010
Forested
ridge
April 21
to May
26
12 84 131 9 1.6 (131 m) 75%2
Stantec Consulting. 2010. 2010 Spring Avian and
Spring/Summer Bat Surveys for the Bowers Wind
Project. Prepared for Champlain Wind Energy,
LLC
Sheffield,
Caledonia
Cty, VT
Spring
2005
Forested
ridge
April to
May 10 60 98 10 1.6 (125 m) 69%1
Woodlot Alternatives, Inc. 2006. Avian and Bat
Information Summary and Risk Assessment for the
Proposed Sheffield Wind Power Project in
Sheffield, Vermont. Prepared for UPC Wind
Management, LLC.
Kingdom
Community,
Orleans Cty, VT
Spring
2009
Forested
ridge
April 15
to June 1 10 74 134 10 1.8 (125 m) 67%1
Stantec Consulting. 2009. Spring and Summer
2009 Raptor Surveys for the Kingdom Community
Wind Project. Prepared for Vermont
Environmental Research Associates
Highland,
Somerset Cty,
ME
Spring
2009
Forested
ridge
March
25 to
May 19
20 139 260 10 1.9 (130.5 m) Whitham 80% Briggs
86%2
Stantec Consulting Services Inc. 2009. Spring 2009
Ecological Surveys. Prepared for Highland Wind
LLC.
Grants Pond
Field, Grafton
and
Merrimack
Counties, NH
Spring
2010
Field in
valley
April 15
to May
26
11
(simult
aneou
s with
Melvin
Mount
ain)
77 204 9 2.7 (150 m) 84%2
Stantec Consulting Services Inc. 2013. 2010 Spring
and Fall Raptor Migration Surveys for the Wild
Meadows Wind Project, Grafton and Merrimack
Counties, New Hampshire. Prepared for Atlantic
Wind LLC.
Antrim,
Hillsborough
Cty, NH
Spring
2011
Forested
ridge
March
25 to
May 15
9 65 441 11 6.8 (unknown) 37% between 50-500
ft above ground1
TRC Engineers and Stantec Consulting Services
Inc. 2011. Avian and Bat Protection Plan for the
Antrim Wind Energy Project. Prepared for Antrim
Wind Energy, LLC.
1 Percent below turbine height calculated for all observations within study area. 2 Percent below turbine height calculated for those observations within project area (locations within study area where turbines could
possibly be located). 3 5 of the 11 survey days were conducted simultaneously by 2 observers at 2 survey locations; however, results are combined for both sites which inflates the number of raptors observed for this
site.
* Non-migrants were not included in seasonal passage rates in NYSDEC 2008 table but were included in passage rates here.
** Calculated for spring and fall combined.
*** Calculated for spring and fall 2006 and 2007 combined.
CASSADAGA WIND PROJECT
BIRD AND BAT SURVEY REPORT, 2013-2014
23
3.2.5 Rare, Threatened and Endangered Species
Stantec did not observe any federally listed endangered or threatened species. Stantec
observed 1 golden eagle (Aquila chrysaetos), a state-listed endangered species, and state-
listed threatened species bald eagles (Haliaeetus leucocephalus; n = 6) and northern harrier
(Circus cyaneus; n = 1). The eagles were observed between 27 March and 1 May. The golden
eagle exhibited powered flight in a northward direction. The bald eagle observations exhibited
either powered flight or soaring/gliding flight behaviors in generally northward directions (n = 5)
and on one occasion, a southward direction (n = 1). The northern harrier was observed on 1
May, circling at low altitudes, possibly foraging.
Observers also documented 3 state species of special concern: osprey (Pandion haliaetus; n =
3), red-shouldered hawk (Buteo lineatus; n = 3) and sharp-shinned hawk (Accipiter striatus;n = 4)
(Figure 3-2, Appendix B Table 2) (NYSDEC 2014).
3.2.6 Incidental Observations
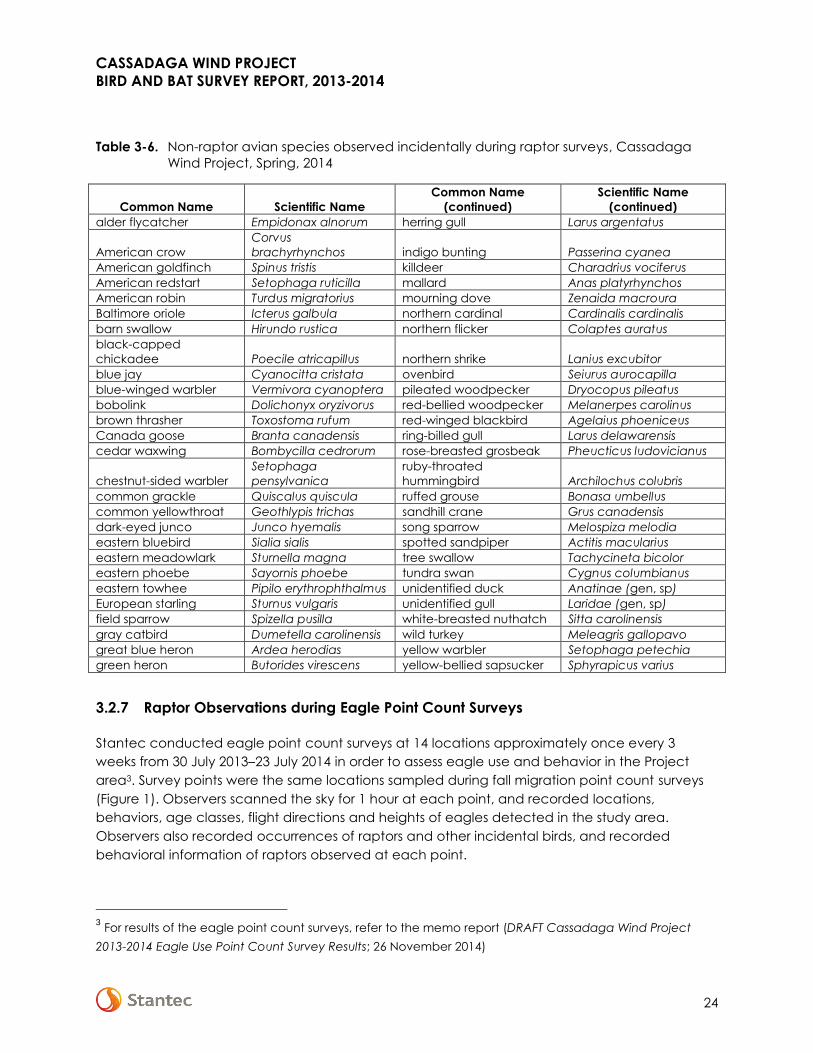
Stantec observed 54 non-raptor avian species during raptor surveys (Table 3-6). None were
federally or state-listed endangered or threatened species, and none were state species of
special concern (NYSDEC 2014).
CASSADAGA WIND PROJECT
BIRD AND BAT SURVEY REPORT, 2013-2014
24
Table 3-6. Non-raptor avian species observed incidentally during raptor surveys, Cassadaga
Wind Project, Spring, 2014
Common Name Scientific Name
Common Name
(continued)
Scientific Name
(continued)
alder flycatcher Empidonax alnorum herring gull Larus argentatus
American crow
Corvus
brachyrhynchos indigo bunting Passerina cyanea
American goldfinch Spinus tristis killdeer Charadrius vociferus
American redstart Setophaga ruticilla mallard Anas platyrhynchos
American robin Turdus migratorius mourning dove Zenaida macroura
Baltimore oriole Icterus galbula northern cardinal Cardinalis cardinalis
barn swallow Hirundo rustica northern flicker Colaptes auratus
black-capped
chickadee Poecile atricapillus northern shrike Lanius excubitor
blue jay Cyanocitta cristata ovenbird Seiurus aurocapilla
blue-winged warbler Vermivora cyanoptera pileated woodpecker Dryocopus pileatus
bobolink Dolichonyx oryzivorus red-bellied woodpecker Melanerpes carolinus
brown thrasher Toxostoma rufum red-winged blackbird Agelaius phoeniceus
Canada goose Branta canadensis ring-billed gull Larus delawarensis
cedar waxwing Bombycilla cedrorum rose-breasted grosbeak Pheucticus ludovicianus
chestnut-sided warbler
Setophaga
pensylvanica
ruby-throated
hummingbird Archilochus colubris
common grackle Quiscalus quiscula ruffed grouse Bonasa umbellus
common yellowthroat Geothlypis trichas sandhill crane Grus canadensis
dark-eyed junco Junco hyemalis song sparrow Melospiza melodia
eastern bluebird Sialia sialis spotted sandpiper Actitis macularius
eastern meadowlark Sturnella magna tree swallow Tachycineta bicolor
eastern phoebe Sayornis phoebe tundra swan Cygnus columbianus
eastern towhee Pipilo erythrophthalmus unidentified duck Anatinae (gen, sp)
European starling Sturnus vulgaris unidentified gull Laridae (gen, sp)
field sparrow Spizella pusilla white-breasted nuthatch Sitta carolinensis
gray catbird Dumetella carolinensis wild turkey Meleagris gallopavo
great blue heron Ardea herodias yellow warbler Setophaga petechia
green heron Butorides virescens yellow-bellied sapsucker Sphyrapicus varius
3.2.7 Raptor Observations during Eagle Point Count Surveys
Stantec conducted eagle point count surveys at 14 locations approximately once every 3
weeks from 30 July 2013–23 July 2014 in order to assess eagle use and behavior in the Project
area3. Survey points were the same locations sampled during fall migration point count surveys
(Figure 1). Observers scanned the sky for 1 hour at each point, and recorded locations,
behaviors, age classes, flight directions and heights of eagles detected in the study area.
Observers also recorded occurrences of raptors and other incidental birds, and recorded
behavioral information of raptors observed at each point.
3 For results of the eagle point count surveys, refer to the memo report (DRAFT Cassadaga Wind Project
2013-2014 Eagle Use Point Count Survey Results; 26 November 2014)
CASSADAGA WIND PROJECT
BIRD AND BAT SURVEY REPORT, 2013-2014
25
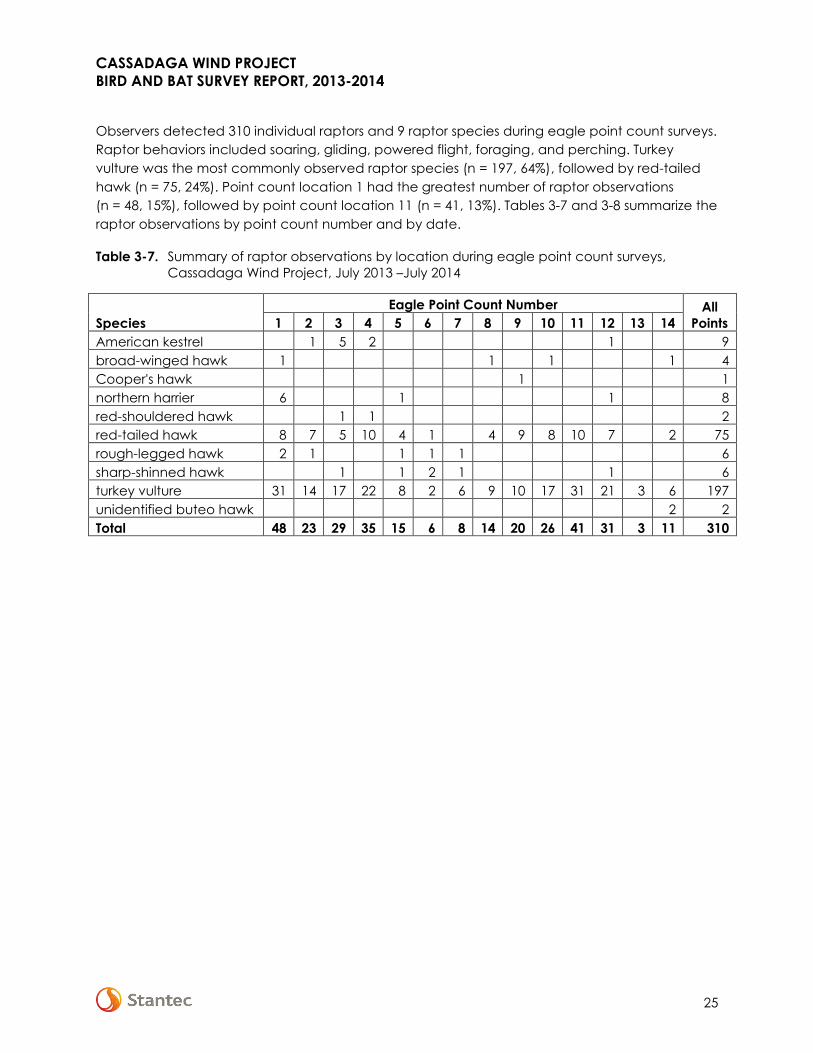
Observers detected 310 individual raptors and 9 raptor species during eagle point count surveys.
Raptor behaviors included soaring, gliding, powered flight, foraging, and perching. Turkey
vulture was the most commonly observed raptor species (n = 197, 64%), followed by red-tailed
hawk (n = 75, 24%). Point count location 1 had the greatest number of raptor observations
(n = 48, 15%), followed by point count location 11 (n = 41, 13%). Tables 3-7 and 3-8 summarize the
raptor observations by point count number and by date.
Table 3-7. Summary of raptor observations by location during eagle point count surveys,
Cassadaga Wind Project, July 2013 –July 2014
Species
Eagle Point Count Number All
Points 1 2 3 4 5 6 7 8 9 10 11 12 13 14
American kestrel 1 5 2 1 9
broad-winged hawk 1 1 1 1 4
Cooper's hawk 1 1
northern harrier 6 1 1 8
red-shouldered hawk 1 1 2
red-tailed hawk 8 7 5 10 4 1 4 9 8 10 7 2 75
rough-legged hawk 2 1 1 1 1 6
sharp-shinned hawk 1 1 2 1 1 6
turkey vulture 31 14 17 22 8 2 6 9 10 17 31 21 3 6 197
unidentified buteo hawk 2 2
Total 48 23 29 35 15 6 8 14 20 26 41 31 3 11 310
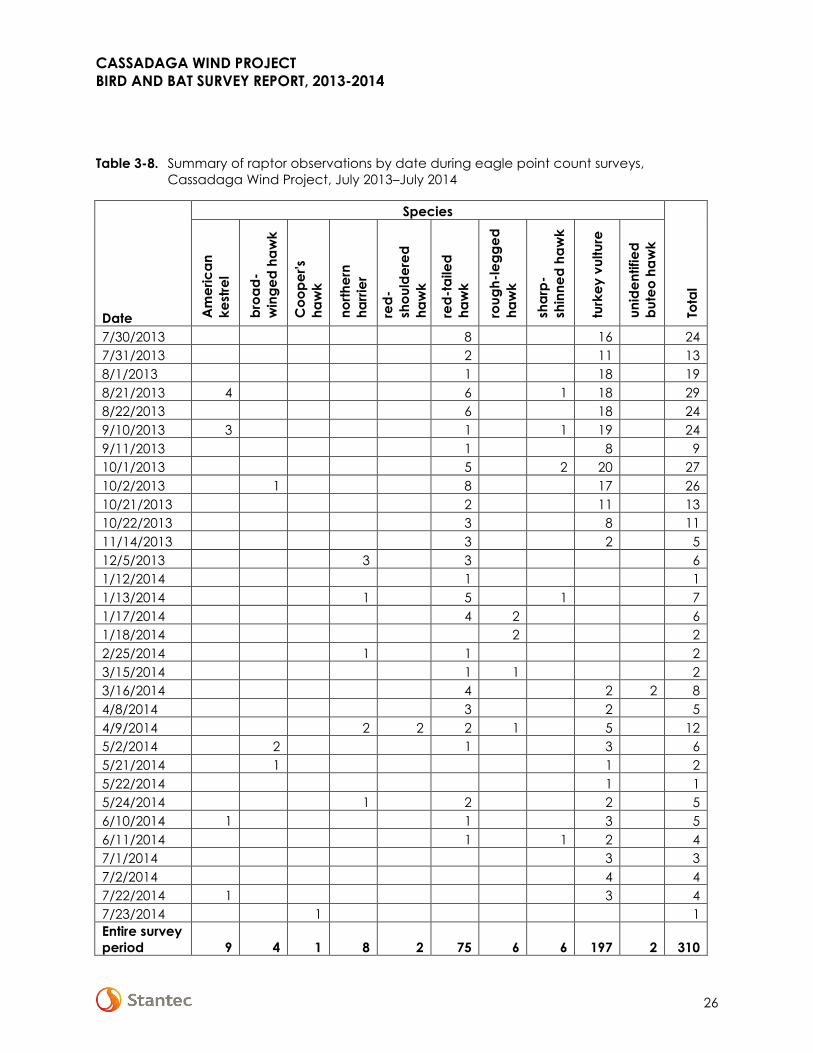
CASSADAGA WIND PROJECT
BIRD AND BAT SURVEY REPORT, 2013-2014
26
Table 3-8. Summary of raptor observations by date during eagle point count surveys,
Cassadaga Wind Project, July 2013–July 2014
Date
Species
Tota
l
Am
eri
ca
n
ke
stre
l
bro
ad
-
win
ge
d h
aw
k
Co
op
er's
ha
wk
no
rth
ern
ha
rrie
r
red
-
sho
uld
ere
d
ha
wk
red
-ta
ile
d
ha
wk
rou
gh
-le
gg
ed
ha
wk
sha
rp-
shin
ne
d h
aw
k
turk
ey
vu
ltu
re
un
ide
ntifie
d
bu
teo
ha
wk
7/30/2013 8 16 24
7/31/2013 2 11 13
8/1/2013 1 18 19
8/21/2013 4 6 1 18 29
8/22/2013 6 18 24
9/10/2013 3 1 1 19 24
9/11/2013 1 8 9
10/1/2013 5 2 20 27
10/2/2013 1 8 17 26
10/21/2013 2 11 13
10/22/2013 3 8 11
11/14/2013 3 2 5
12/5/2013 3 3 6
1/12/2014 1 1
1/13/2014 1 5 1 7
1/17/2014 4 2 6
1/18/2014 2 2
2/25/2014 1 1 2
3/15/2014 1 1 2
3/16/2014 4 2 2 8
4/8/2014 3 2 5
4/9/2014 2 2 2 1 5 12
5/2/2014 2 1 3 6
5/21/2014 1 1 2
5/22/2014 1 1
5/24/2014 1 2 2 5
6/10/2014 1 1 3 5
6/11/2014 1 1 2 4
7/1/2014 3 3
7/2/2014 4 4
7/22/2014 1 3 4
7/23/2014 1 1
Entire survey
period 9 4 1 8 2 75 6 6 197 2 310
CASSADAGA WIND PROJECT
BIRD AND BAT SURVEY REPORT, 2013-2014
27
3.3 DISCUSSION
The objective of diurnal raptor migration surveys was to obtain baseline species composition,
passage rate, and behavioral data of migratory and seasonally local raptors in the Project area.
The surveys represent a subsample of the overall activity during the spring migration period.
Results are limited to the number of days surveyed and the portions of the Project area visible
from the survey point. The survey point was centrally located and provided good views of the
turbine areas. Surveys targeted optimal weather conditions, and extended across the typical
peak migration periods for common raptor species occurring in the northeastern region.
Of the 157 raptor observations, observers documented 143 (91%) inside the Project area. Turkey
vulture was the most commonly observed species (n = 64, 41%). All turkey vultures and 78% of
raptors observed within the turbine area (n = 143) were observed below the maximum turbine
height of 150 m. During raptor migration, flight pathways and flight heights may vary seasonally,
daily, or hourly. Weather and wind are major factors that influence migration paths and flight
heights; in particular, wind, air temperature, and cloud cover influence the development of
updrafts and thermals used by raptors making long-distance flights. The flight paths and passage
rates of raptors observed at the Project varied among survey dates and were likely influenced
by wind direction, weather and seasonal timing. The day with the highest passage rate (5.1
raptors/hr), May 1, was characterized by low pressure and southerly and southwesterly winds.
Other survey days had similar weather characteristics, but 1 May coincided with the peak of
migration for several species observed that day, including bald eagle, golden eagle, red-tailed
hawk and broad-winged hawk.
Compared to the nearest Hawk Migration Association of North America’s Hawk Watch sites,
Cassadaga’s overall passage rate was extremely low relative to the average passage rate at
the Ripley Hawk Watch (116.6 raptors/hr) and Hamburg Hawk Watch (56.9 raptors/hr)4 (HMANA
2014a, 2014b). These hawk watch sites are located less than 1 mile from the southern shore of
Lake Erie, which is a migratory corridor for raptors migrating north in the spring. Since migrating
raptors are reluctant to cross broad stretches of water such as the Great Lakes, raptors migrating
northward through the region concentrate and move northeast along the edge of the Great
Lakes’ southern shores (Dunne 1984). The Cassadaga raptor survey site is over 14 miles from the
lakeshore.
Survey effort and results are comparable to results of other recent studies at proposed wind sites
in New York and in the northeastern U.S. (Table 3-5). The overall passage rate (1.6 raptors/hr) was
at the low end of the range of passage rates documented in these studies (0.1–25.6 raptors/hr in
New York and 0.2–6.8 raptors/hour in the Northeast) and below the medians (3.7 raptors/hr in
New York and 1.9 raptors/hr in the Northeast). The number of raptor species observed at
Cassadaga (n = 11) was within the range, suggesting that raptor activity, passage rates, and
species composition at the Project site is typical of the region.
4 The distance from Cassadaga to the Ripley Hawk Watch is 23 mi (37 km), and the distance from
Cassadaga to Hamburg Hawk Watch is 36 mi (58 km).
CASSADAGA WIND PROJECT
BIRD AND BAT SURVEY REPORT, 2013-2014
28
4.0 Spring Breeding Bird Surveys
4.1 METHODS
4.1.1 Field Surveys
Stantec identified 85 breeding bird point count locations along 16 survey transects: 59 survey
points were in close proximity to proposed turbine locations and 26 control points were chosen in
areas where no impact is expected to occur. Points were spaced approximately 125 m (410 ft)
apart, were chosen using aerial Project photos, and were positioned based on the following
criteria:
1) to sample the various available habitats
2) available site access via roads and trails
3) proposed wind turbine locations
4) available site access via participating landowner parcels
A Stantec biologist conducted surveys from sunrise until 10:00 a.m. in weather conditions
conducive to hearing birdsong and seeing birds move about in vegetation and in flight. All birds
identified by sight or sound, including soaring raptors, waterfowl, and other fly-overs, were
recorded during a 5-minute session at each survey point. The biologist also recorded weather
information and general habitat conditions at each survey point.
4.1.2 Data Summary and Analysis
Survey points were grouped into 5 habitat categories based on dominant vegetation cover and
general habitat characteristics: agricultural, forest edge, hardwood forest, mixed (hardwood
and conifer) forest, and over-grown field.
The species and number of individuals documented during surveys were used to calculate SR,
RA, Fr, and SDI. All indexes were calculated for each habitat classification, for all habitats
combined, and separately for survey points and control points.
4.2 RESULTS
4.2.1 Survey Effort and Weather Summary
A Stantec biologist conducted 85 breeding bird point counts each week in May and in June
2014, for a total of 170 point counts. Each point was surveyed twice: once in May and once in
June. Surveys were conducted on 5-6 May, 13-14 May, 22-23 May, 27 May, 4-6 June, 18-19 June,
24 June and 26 June. Wind speeds ranged from 1–12 miles per hour (mph; 0.45 to 5.36 m/s),
average daily temperatures ranged from 3.2–20.4 degrees °C, and sky conditions were typically
clear to partly cloudy. Periods of fog occurred on 22 May, 18 June, and 26 June, periods of light
drizzle occurred on 14 May and 24 June, and brief periods of showers occurred on 19 June and
26 June (Table 4-1).
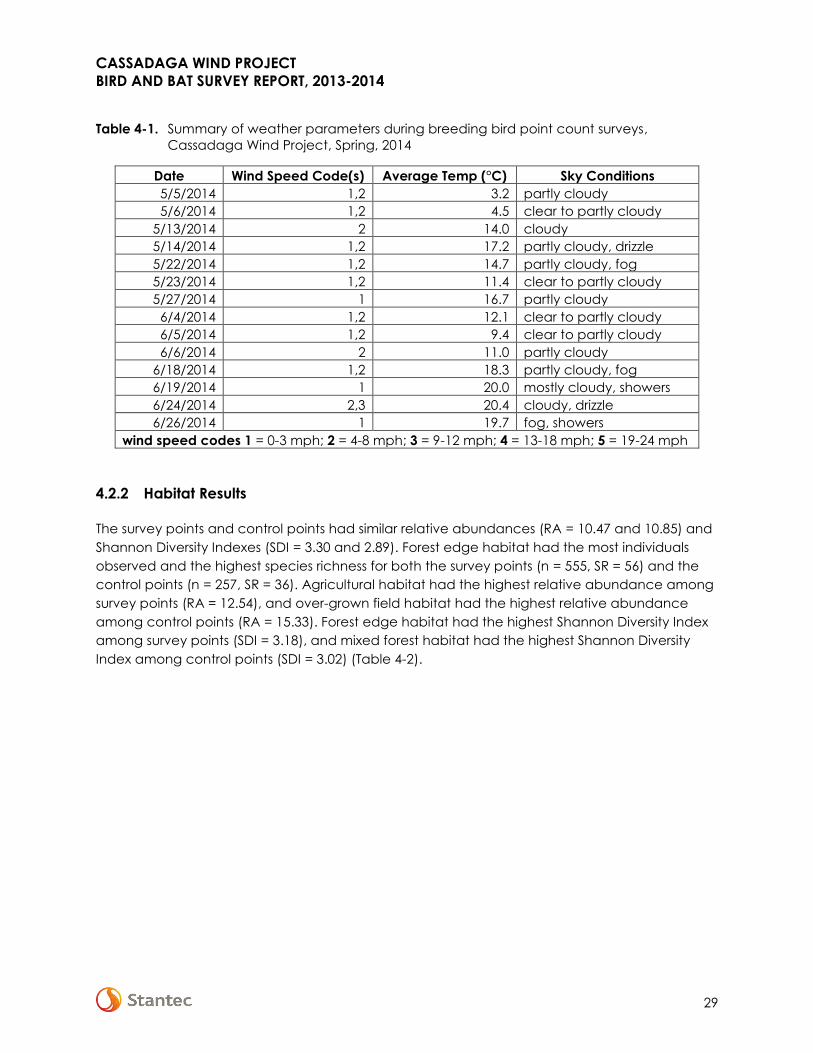
CASSADAGA WIND PROJECT
BIRD AND BAT SURVEY REPORT, 2013-2014
29
Table 4-1. Summary of weather parameters during breeding bird point count surveys,
Cassadaga Wind Project, Spring, 2014
Date Wind Speed Code(s) Average Temp (°C) Sky Conditions
5/5/2014 1,2 3.2 partly cloudy
5/6/2014 1,2 4.5 clear to partly cloudy
5/13/2014 2 14.0 cloudy
5/14/2014 1,2 17.2 partly cloudy, drizzle
5/22/2014 1,2 14.7 partly cloudy, fog
5/23/2014 1,2 11.4 clear to partly cloudy
5/27/2014 1 16.7 partly cloudy
6/4/2014 1,2 12.1 clear to partly cloudy
6/5/2014 1,2 9.4 clear to partly cloudy
6/6/2014 2 11.0 partly cloudy
6/18/2014 1,2 18.3 partly cloudy, fog
6/19/2014 1 20.0 mostly cloudy, showers
6/24/2014 2,3 20.4 cloudy, drizzle
6/26/2014 1 19.7 fog, showers
wind speed codes 1 = 0-3 mph; 2 = 4-8 mph; 3 = 9-12 mph; 4 = 13-18 mph; 5 = 19-24 mph
4.2.2 Habitat Results
The survey points and control points had similar relative abundances (RA = 10.47 and 10.85) and
Shannon Diversity Indexes (SDI = 3.30 and 2.89). Forest edge habitat had the most individuals
observed and the highest species richness for both the survey points (n = 555, SR = 56) and the
control points (n = 257, SR = 36). Agricultural habitat had the highest relative abundance among
survey points (RA = 12.54), and over-grown field habitat had the highest relative abundance
among control points (RA = 15.33). Forest edge habitat had the highest Shannon Diversity Index
among survey points (SDI = 3.18), and mixed forest habitat had the highest Shannon Diversity
Index among control points (SDI = 3.02) (Table 4-2).
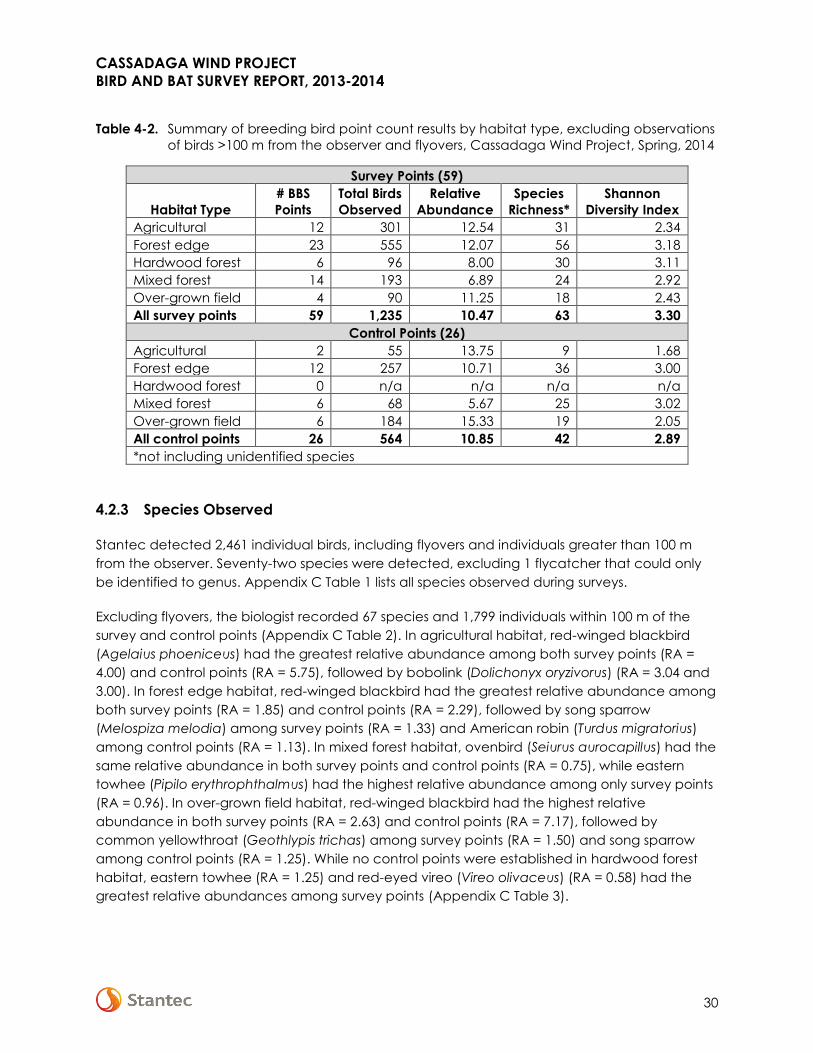
CASSADAGA WIND PROJECT
BIRD AND BAT SURVEY REPORT, 2013-2014
30
Table 4-2. Summary of breeding bird point count results by habitat type, excluding observations
of birds >100 m from the observer and flyovers, Cassadaga Wind Project, Spring, 2014
Survey Points (59)
Habitat Type
# BBS
Points
Total Birds
Observed
Relative
Abundance
Species
Richness*
Shannon
Diversity Index
Agricultural 12 301 12.54 31 2.34
Forest edge 23 555 12.07 56 3.18
Hardwood forest 6 96 8.00 30 3.11
Mixed forest 14 193 6.89 24 2.92
Over-grown field 4 90 11.25 18 2.43
All survey points 59 1,235 10.47 63 3.30
Control Points (26)
Agricultural 2 55 13.75 9 1.68
Forest edge 12 257 10.71 36 3.00
Hardwood forest 0 n/a n/a n/a n/a
Mixed forest 6 68 5.67 25 3.02
Over-grown field 6 184 15.33 19 2.05
All control points 26 564 10.85 42 2.89
*not including unidentified species
4.2.3 Species Observed
Stantec detected 2,461 individual birds, including flyovers and individuals greater than 100 m
from the observer. Seventy-two species were detected, excluding 1 flycatcher that could only
be identified to genus. Appendix C Table 1 lists all species observed during surveys.
Excluding flyovers, the biologist recorded 67 species and 1,799 individuals within 100 m of the
survey and control points (Appendix C Table 2). In agricultural habitat, red-winged blackbird
(Agelaius phoeniceus) had the greatest relative abundance among both survey points (RA =
4.00) and control points (RA = 5.75), followed by bobolink (Dolichonyx oryzivorus) (RA = 3.04 and
3.00). In forest edge habitat, red-winged blackbird had the greatest relative abundance among
both survey points (RA = 1.85) and control points (RA = 2.29), followed by song sparrow
(Melospiza melodia) among survey points (RA = 1.33) and American robin (Turdus migratorius)
among control points (RA = 1.13). In mixed forest habitat, ovenbird (Seiurus aurocapillus) had the
same relative abundance in both survey points and control points (RA = 0.75), while eastern
towhee (Pipilo erythrophthalmus) had the highest relative abundance among only survey points
(RA = 0.96). In over-grown field habitat, red-winged blackbird had the highest relative
abundance in both survey points (RA = 2.63) and control points (RA = 7.17), followed by
common yellowthroat (Geothlypis trichas) among survey points (RA = 1.50) and song sparrow
among control points (RA = 1.25). While no control points were established in hardwood forest
habitat, eastern towhee (RA = 1.25) and red-eyed vireo (Vireo olivaceus) (RA = 0.58) had the
greatest relative abundances among survey points (Appendix C Table 3).
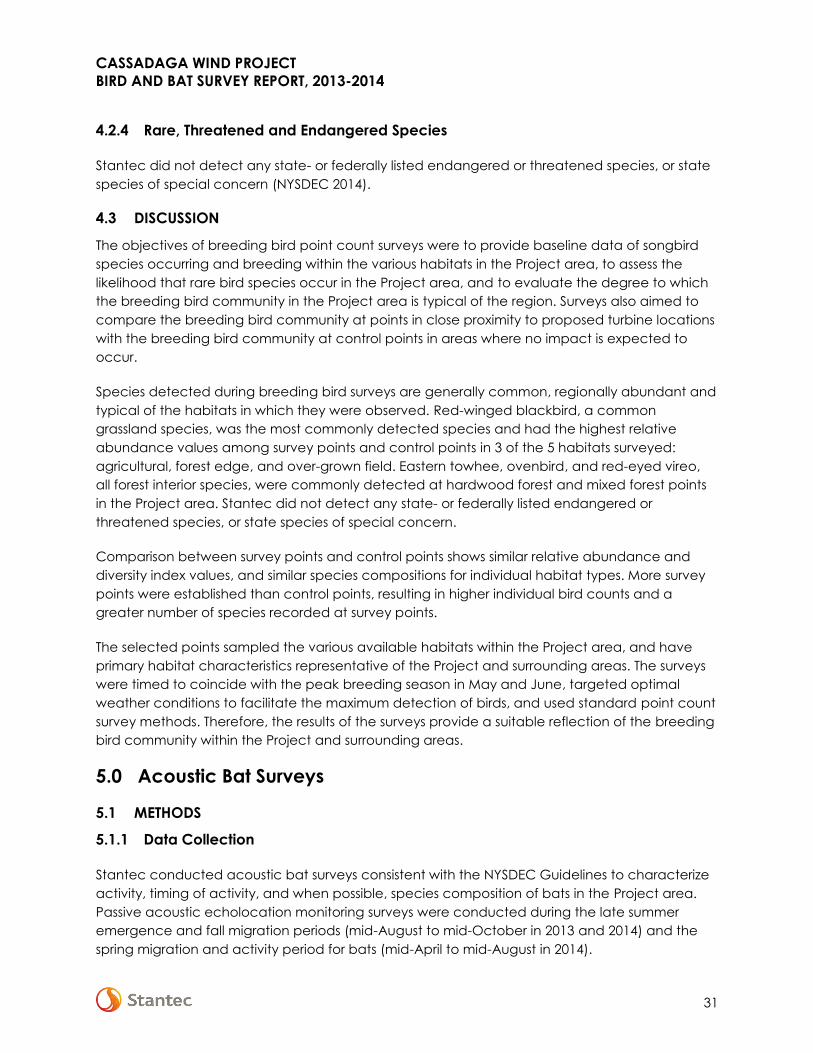
CASSADAGA WIND PROJECT
BIRD AND BAT SURVEY REPORT, 2013-2014
31
4.2.4 Rare, Threatened and Endangered Species
Stantec did not detect any state- or federally listed endangered or threatened species, or state
species of special concern (NYSDEC 2014).
4.3 DISCUSSION
The objectives of breeding bird point count surveys were to provide baseline data of songbird
species occurring and breeding within the various habitats in the Project area, to assess the
likelihood that rare bird species occur in the Project area, and to evaluate the degree to which
the breeding bird community in the Project area is typical of the region. Surveys also aimed to
compare the breeding bird community at points in close proximity to proposed turbine locations
with the breeding bird community at control points in areas where no impact is expected to
occur.
Species detected during breeding bird surveys are generally common, regionally abundant and
typical of the habitats in which they were observed. Red-winged blackbird, a common
grassland species, was the most commonly detected species and had the highest relative
abundance values among survey points and control points in 3 of the 5 habitats surveyed:
agricultural, forest edge, and over-grown field. Eastern towhee, ovenbird, and red-eyed vireo,
all forest interior species, were commonly detected at hardwood forest and mixed forest points
in the Project area. Stantec did not detect any state- or federally listed endangered or
threatened species, or state species of special concern.
Comparison between survey points and control points shows similar relative abundance and
diversity index values, and similar species compositions for individual habitat types. More survey
points were established than control points, resulting in higher individual bird counts and a
greater number of species recorded at survey points.
The selected points sampled the various available habitats within the Project area, and have
primary habitat characteristics representative of the Project and surrounding areas. The surveys
were timed to coincide with the peak breeding season in May and June, targeted optimal
weather conditions to facilitate the maximum detection of birds, and used standard point count
survey methods. Therefore, the results of the surveys provide a suitable reflection of the breeding
bird community within the Project and surrounding areas.
5.0 Acoustic Bat Surveys
5.1 METHODS
5.1.1 Data Collection
Stantec conducted acoustic bat surveys consistent with the NYSDEC Guidelines to characterize
activity, timing of activity, and when possible, species composition of bats in the Project area.
Passive acoustic echolocation monitoring surveys were conducted during the late summer
emergence and fall migration periods (mid-August to mid-October in 2013 and 2014) and the
spring migration and activity period for bats (mid-April to mid-August in 2014).
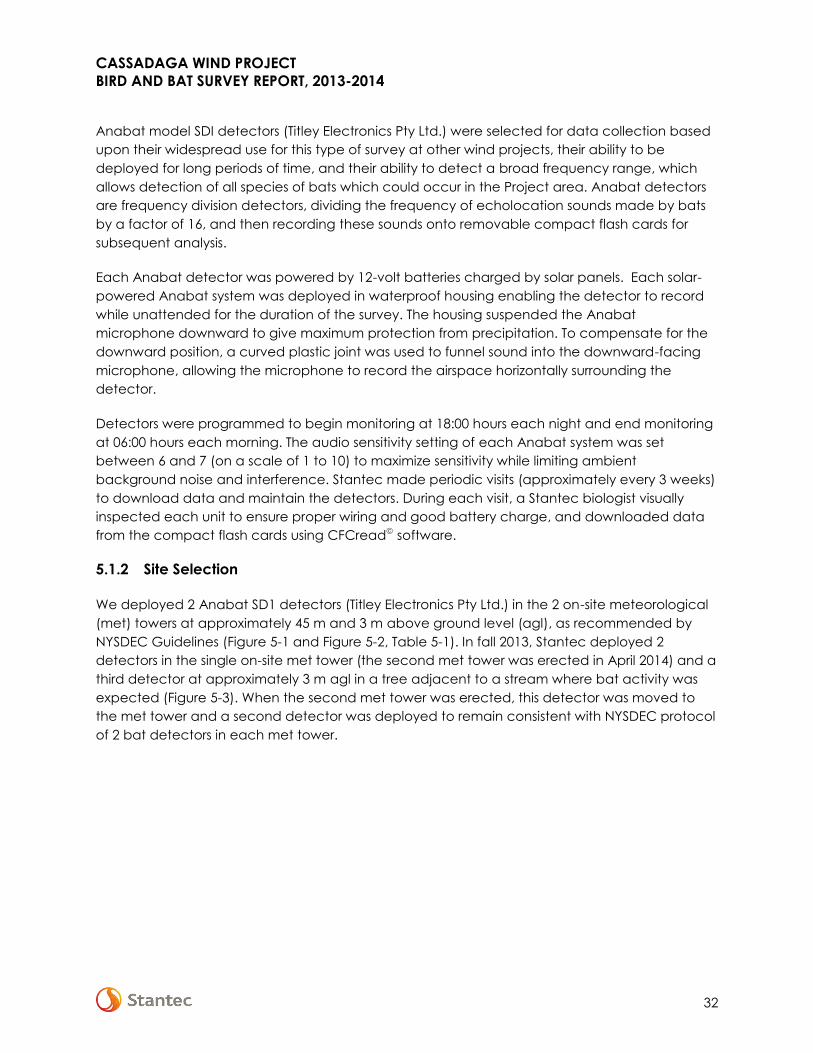
CASSADAGA WIND PROJECT
BIRD AND BAT SURVEY REPORT, 2013-2014
32
Anabat model SDI detectors (Titley Electronics Pty Ltd.) were selected for data collection based
upon their widespread use for this type of survey at other wind projects, their ability to be
deployed for long periods of time, and their ability to detect a broad frequency range, which
allows detection of all species of bats which could occur in the Project area. Anabat detectors
are frequency division detectors, dividing the frequency of echolocation sounds made by bats
by a factor of 16, and then recording these sounds onto removable compact flash cards for
subsequent analysis.
Each Anabat detector was powered by 12-volt batteries charged by solar panels. Each solar-
powered Anabat system was deployed in waterproof housing enabling the detector to record
while unattended for the duration of the survey. The housing suspended the Anabat
microphone downward to give maximum protection from precipitation. To compensate for the
downward position, a curved plastic joint was used to funnel sound into the downward-facing
microphone, allowing the microphone to record the airspace horizontally surrounding the
detector.
Detectors were programmed to begin monitoring at 18:00 hours each night and end monitoring
at 06:00 hours each morning. The audio sensitivity setting of each Anabat system was set
between 6 and 7 (on a scale of 1 to 10) to maximize sensitivity while limiting ambient
background noise and interference. Stantec made periodic visits (approximately every 3 weeks)
to download data and maintain the detectors. During each visit, a Stantec biologist visually
inspected each unit to ensure proper wiring and good battery charge, and downloaded data
from the compact flash cards using CFCread software.
5.1.2 Site Selection
We deployed 2 Anabat SD1 detectors (Titley Electronics Pty Ltd.) in the 2 on-site meteorological
(met) towers at approximately 45 m and 3 m above ground level (agl), as recommended by
NYSDEC Guidelines (Figure 5-1 and Figure 5-2, Table 5-1). In fall 2013, Stantec deployed 2
detectors in the single on-site met tower (the second met tower was erected in April 2014) and a
third detector at approximately 3 m agl in a tree adjacent to a stream where bat activity was
expected (Figure 5-3). When the second met tower was erected, this detector was moved to
the met tower and a second detector was deployed to remain consistent with NYSDEC protocol
of 2 bat detectors in each met tower.
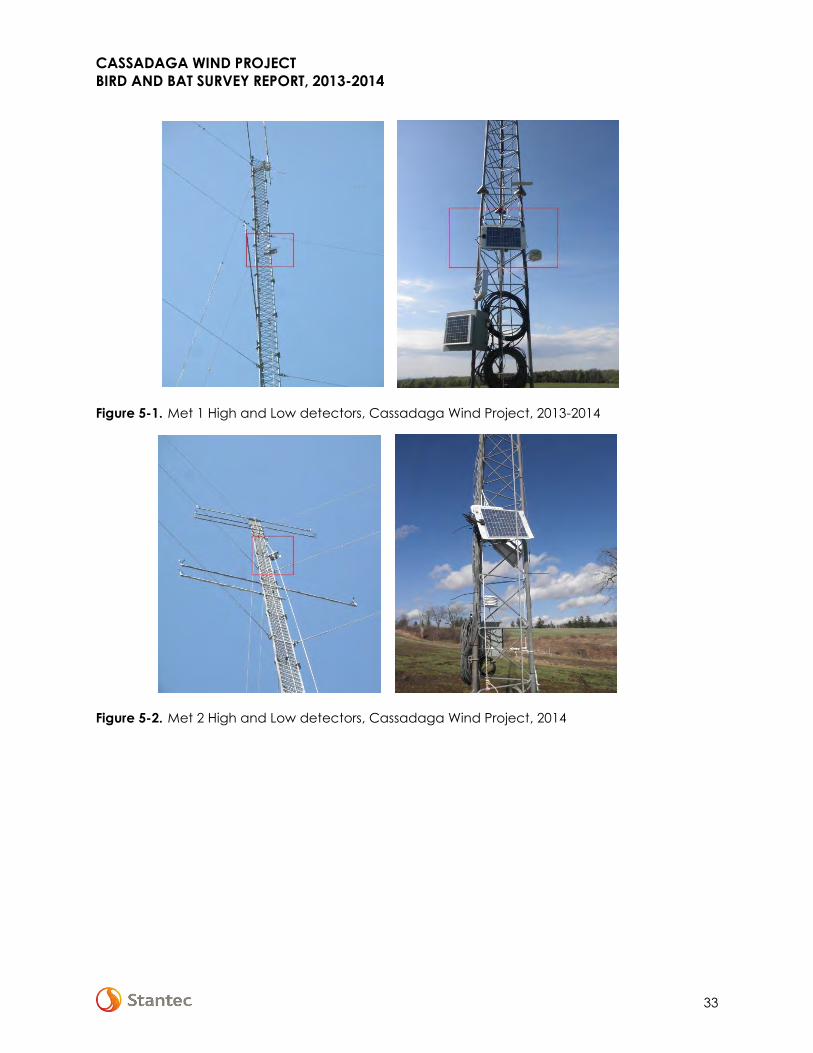
CASSADAGA WIND PROJECT
BIRD AND BAT SURVEY REPORT, 2013-2014
33
Figure 5-1. Met 1 High and Low detectors, Cassadaga Wind Project, 2013-2014
Figure 5-2. Met 2 High and Low detectors, Cassadaga Wind Project, 2014
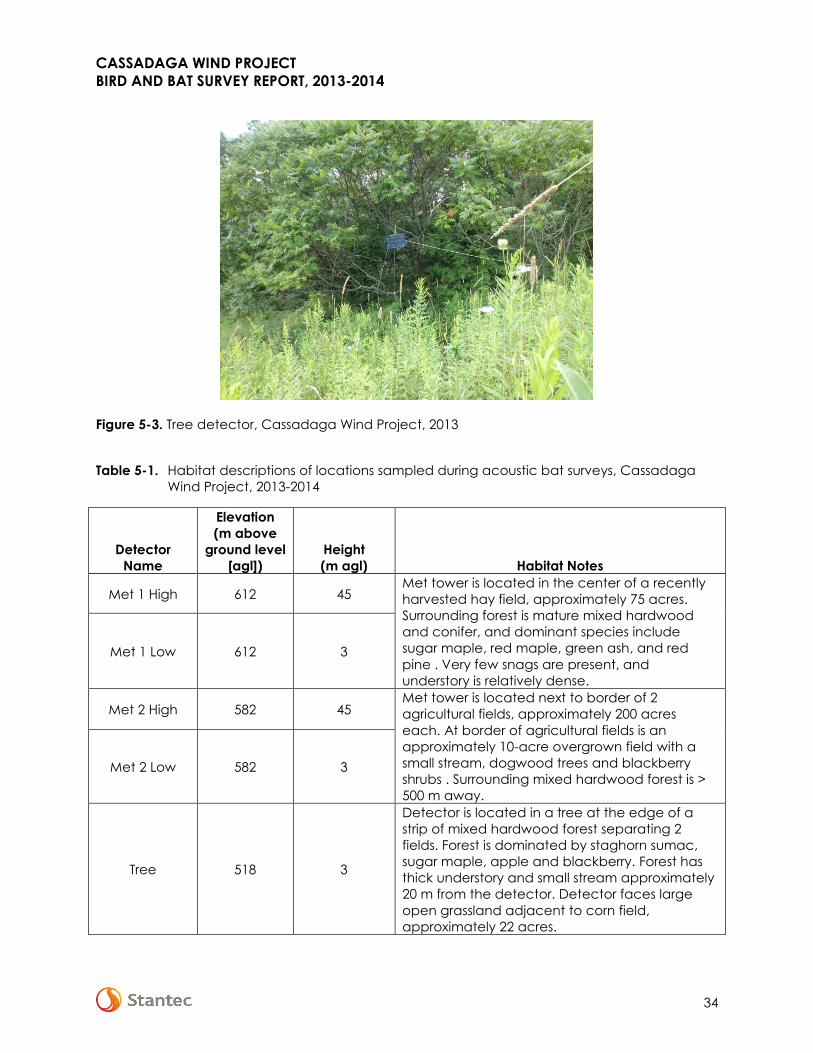
CASSADAGA WIND PROJECT
BIRD AND BAT SURVEY REPORT, 2013-2014
34
Figure 5-3. Tree detector, Cassadaga Wind Project, 2013
Table 5-1. Habitat descriptions of locations sampled during acoustic bat surveys, Cassadaga
Wind Project, 2013-2014
Detector
Name
Elevation
(m above
ground level
[agl])
Height
(m agl) Habitat Notes
Met 1 High 612 45 Met tower is located in the center of a recently
harvested hay field, approximately 75 acres.
Surrounding forest is mature mixed hardwood
and conifer, and dominant species include
sugar maple, red maple, green ash, and red
pine . Very few snags are present, and
understory is relatively dense.
Met 1 Low 612 3
Met 2 High 582 45 Met tower is located next to border of 2
agricultural fields, approximately 200 acres
each. At border of agricultural fields is an
approximately 10-acre overgrown field with a
small stream, dogwood trees and blackberry
shrubs . Surrounding mixed hardwood forest is >
500 m away.
Met 2 Low 582 3
Tree 518 3
Detector is located in a tree at the edge of a
strip of mixed hardwood forest separating 2
fields. Forest is dominated by staghorn sumac,
sugar maple, apple and blackberry. Forest has
thick understory and small stream approximately
20 m from the detector. Detector faces large
open grassland adjacent to corn field,
approximately 22 acres.
CASSADAGA WIND PROJECT
BIRD AND BAT SURVEY REPORT, 2013-2014
35
5.1.3 Data Analysis
Ultrasound recordings of bat echolocation may be broken into recordings of a single bat call or
recordings of bat call sequences. A call is a single pulse of sound produced by a bat, while a
call sequence is a combination of 2 or more pulses recorded in an Anabat file. Recordings
containing less than two calls were eliminated from analysis as has been done in similar studies
(Arnett et al. 2006). Call sequences typically include a series of calls characteristic of normal
flight or prey location (“search phase”) and capture periods (feeding “buzzes”).
Potential call files were extracted from data files using CFCread software. The default settings
for CFCread were used during this file extraction process, as these settings are recommended
for the calls that are characteristic of bats in the Northeast. This software screens all data
recorded by the bat detector and extracts call files using a filter. Using the default settings for this
initial screen also provides for comparability between data sets. Settings used by the filter
include a max TBC (time between calls) of 5 seconds, a minimum line length of 5 milliseconds,
and a smoothing factor of 50. The smoothing factor refers to whether or not adjacent pixels can
be connected with a smooth line. The higher the smoothing factor, the less restrictive the filter
and the more noise files and poor quality call sequences that are retained within the data set.
Following extraction of call files, each file was visually inspected for species identification and to
determine that only bat calls were included in the data set. Insect activity, wind, and
interference can sometimes produce Anabat files that pass through the initial filter and need to
be visually inspected and removed from the data set. Call sequences are easily differentiated
from other recordings, which typically form a diffuse band of dots at either a constant frequency
or widely varying frequency.
Because bat activity levels are highly variable among individual nights and individual hours
(Hayes 1997, Arnett et al. 2006), detection rates are summarized on both of these temporal
scales. Hourly detection rates were summarized by hour after sunset, as recommended by Kunz
et al. (2007).
Bat call sequences were individually marked and categorized by species group, or “guild”
based on visual comparison to reference calls. Relatively accurate identification of bat species
can be attained by visually comparing recorded call sequences of sufficient length to bat call
reference libraries (O’Farrell et al. 1999, O’Farrell and Gannon 1999). Call sequences were
classified to species whenever possible, based on criteria developed from review of reference
calls collected by Chris Corben, the developer of the Anabat system, as well as other bat
researchers. Each bat species is capable of expressing characteristic call types; however,
overlap in certain call patterns is common in some species that call within the same frequency
range. Additionally, calls from any species may lack sufficient detail needed for species level
identification because of background noise, distance of the bat from the microphone, weather,
or other environmental factors. To compensate for these limitations in the analysis process, the
following guilds were created to account for ambiguous calls that could not be confidently
identified to species:
CASSADAGA WIND PROJECT
BIRD AND BAT SURVEY REPORT, 2013-2014
36
Unknown (UNKN) – All call sequences with less than 5 calls, or poor quality sequences
(those with indistinct call characteristics or background static). These sequences were
further identified as either:
o “High frequency unknown” (HFUN) for sequences with a minimum frequency
above 30–35 kilohertz (kHz) (for this region, HFUN most likely represents eastern red
bat (Lasiurus borealis), tri-colored bat (Perimyotis subflavus), and Myotis species
since these species typically produce ultrasound sequences of more than 30 kHz);
or
o “Low frequency unknown” (LFUN) for sequences with a minimum frequency
below 30–35 kHz (big brown bat (Eptesicus fuscus), silver-haired bat (Lasionycteris
noctivagans), and hoary bat (Lasiurus cinereus) would be the species in this
region typically producing ultrasound sequences of less than 30 kHz).
Myotis (MYSP) – All bats of the genus Myotis. While there are some general characteristics
believed to be distinctive for several of the species in this genus, these characteristics are
not sufficiently consistent to be relied upon for species identification at all times when
using Anabat recordings.
Eastern red bat/tri-colored bat5 (RBTB) – Eastern red and tri-colored bats. These 2 species
can produce distinctive calls; however, significant overlap between these species in the
call pulse shape, frequency range, and slope can also occur.
Big brown bat/silver-haired bat (BBSH) – Big brown and silver-haired bats. These species’
call signatures commonly overlap and have therefore been included as one guild in this
report.
Hoary bat (HB) – Hoary bats. Calls of hoary bats can usually be distinguished from those
of big brown and silver-haired bats by minimum frequency extending below 20 kHz or by
calls varying widely in minimum frequency across a sequence.
This method of guild identification represents a conservative approach to bat call identification.
Since some species sometimes produce calls unique only to that species, all calls were identified
to the lowest possible taxonomic level before being grouped into the listed guilds. Tables and
figures in this report will reflect those guilds. However, since species-specific identification did
occur in some cases, each guild also will be briefly discussed with respect to potential species
composition of recorded call sequences. Call results by guild and suspected species are
presented in Appendix D of this report.
Once all of the call files were identified and categorized in appropriate guilds, nightly tallies of
detected calls were compiled. Mean detection rates (calls/detector-night) for the entire
5 The scientific and common name of the eastern pipistrelle (Pipistrellus subflavus) has been
changed to the tri-colored bat (Perimyotis subflavus).
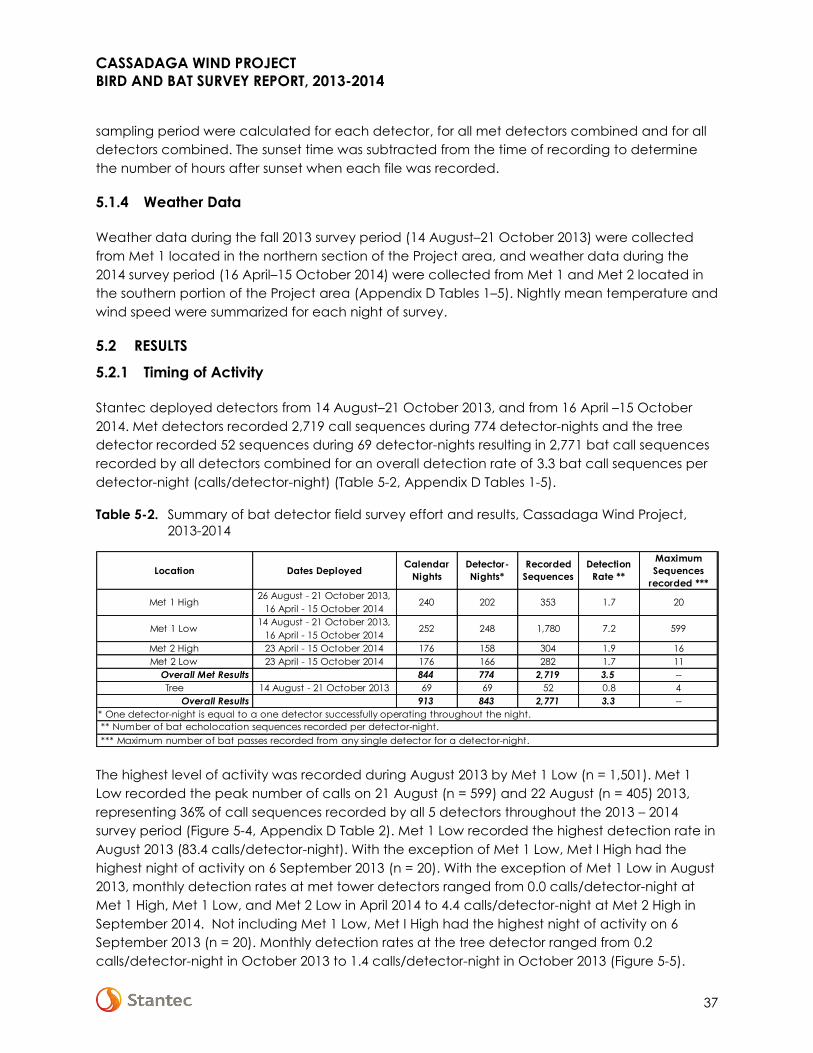
CASSADAGA WIND PROJECT
BIRD AND BAT SURVEY REPORT, 2013-2014
37
sampling period were calculated for each detector, for all met detectors combined and for all
detectors combined. The sunset time was subtracted from the time of recording to determine
the number of hours after sunset when each file was recorded.
5.1.4 Weather Data
Weather data during the fall 2013 survey period (14 August–21 October 2013) were collected
from Met 1 located in the northern section of the Project area, and weather data during the
2014 survey period (16 April–15 October 2014) were collected from Met 1 and Met 2 located in
the southern portion of the Project area (Appendix D Tables 1–5). Nightly mean temperature and
wind speed were summarized for each night of survey.
5.2 RESULTS
5.2.1 Timing of Activity
Stantec deployed detectors from 14 August–21 October 2013, and from 16 April –15 October
2014. Met detectors recorded 2,719 call sequences during 774 detector-nights and the tree
detector recorded 52 sequences during 69 detector-nights resulting in 2,771 bat call sequences
recorded by all detectors combined for an overall detection rate of 3.3 bat call sequences per
detector-night (calls/detector-night) (Table 5-2, Appendix D Tables 1-5).
Table 5-2. Summary of bat detector field survey effort and results, Cassadaga Wind Project,
2013-2014
The highest level of activity was recorded during August 2013 by Met 1 Low (n = 1,501). Met 1
Low recorded the peak number of calls on 21 August (n = 599) and 22 August (n = 405) 2013,
representing 36% of call sequences recorded by all 5 detectors throughout the 2013 – 2014
survey period (Figure 5-4, Appendix D Table 2). Met 1 Low recorded the highest detection rate in
August 2013 (83.4 calls/detector-night). With the exception of Met 1 Low, Met I High had the
highest night of activity on 6 September 2013 (n = 20). With the exception of Met 1 Low in August
2013, monthly detection rates at met tower detectors ranged from 0.0 calls/detector-night at
Met 1 High, Met 1 Low, and Met 2 Low in April 2014 to 4.4 calls/detector-night at Met 2 High in
September 2014. Not including Met 1 Low, Met I High had the highest night of activity on 6
September 2013 (n = 20). Monthly detection rates at the tree detector ranged from 0.2
calls/detector-night in October 2013 to 1.4 calls/detector-night in October 2013 (Figure 5-5).
Location Dates DeployedCalendar
Nights
Detector-
Nights*
Recorded
Sequences
Detection
Rate **
Maximum
Sequences
recorded ***
Met 1 High26 August - 21 October 2013,
16 April - 15 October 2014240 202 353 1.7 20
Met 1 Low14 August - 21 October 2013,
16 April - 15 October 2014252 248 1,780 7.2 599
Met 2 High 23 April - 15 October 2014 176 158 304 1.9 16
Met 2 Low 23 April - 15 October 2014 176 166 282 1.7 11
Overall Met Results 844 774 2,719 3.5 --
Tree 14 August - 21 October 2013 69 69 52 0.8 4
Overall Results 913 843 2,771 3.3 --
* One detector-night is equal to a one detector successfully operating throughout the night.
** Number of bat echolocation sequences recorded per detector-night.
*** Maximum number of bat passes recorded from any single detector for a detector-night.
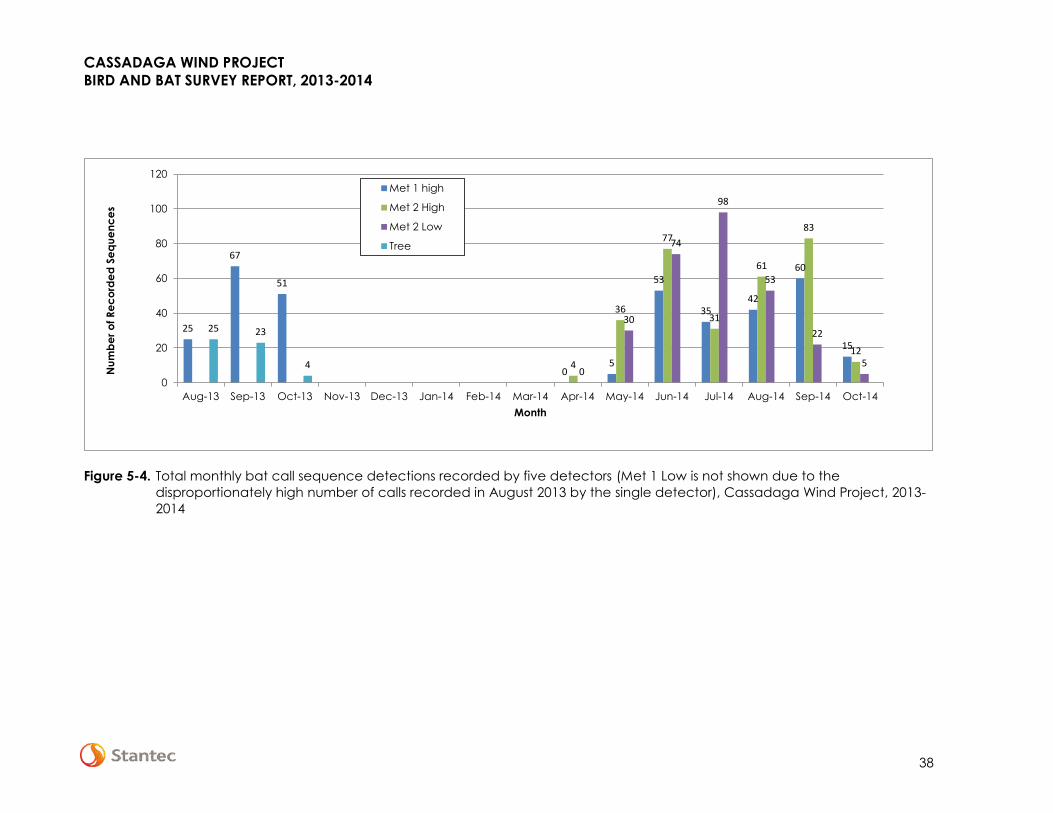
CASSADAGA WIND PROJECT
BIRD AND BAT SURVEY REPORT, 2013-2014
38
Figure 5-4. Total monthly bat call sequence detections recorded by five detectors (Met 1 Low is not shown due to the
disproportionately high number of calls recorded in August 2013 by the single detector), Cassadaga Wind Project, 2013-
2014
25
67
51
05
53
3542
60
15
4
36
77
31
61
83
12
0
30
74
98
53
22
5
25 23
4
0
20
40
60
80
100
120
Aug-13 Sep-13 Oct-13 Nov-13 Dec-13 Jan-14 Feb-14 Mar-14 Apr-14 May-14 Jun-14 Jul-14 Aug-14 Sep-14 Oct-14
Nu
mb
er
of
Re
co
rde
d S
eq
ue
nc
es
Month
Met 1 high
Met 2 High
Met 2 Low
Tree
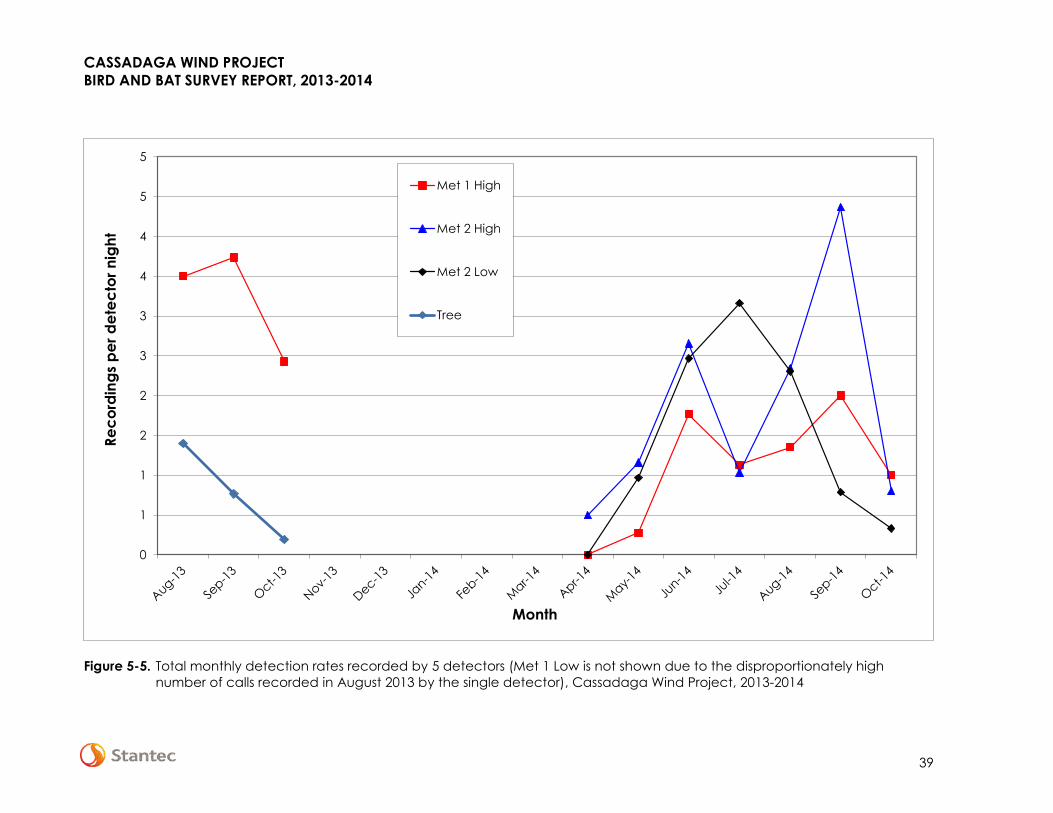
CASSADAGA WIND PROJECT
BIRD AND BAT SURVEY REPORT, 2013-2014
39
Figure 5-5. Total monthly detection rates recorded by 5 detectors (Met 1 Low is not shown due to the disproportionately high
number of calls recorded in August 2013 by the single detector), Cassadaga Wind Project, 2013-2014
0
1
1
2
2
3
3
4
4
5
5
Re
co
rdin
gs
pe
r d
ete
cto
r n
igh
t
Month
Met 1 High
Met 2 High
Met 2 Low
Tree
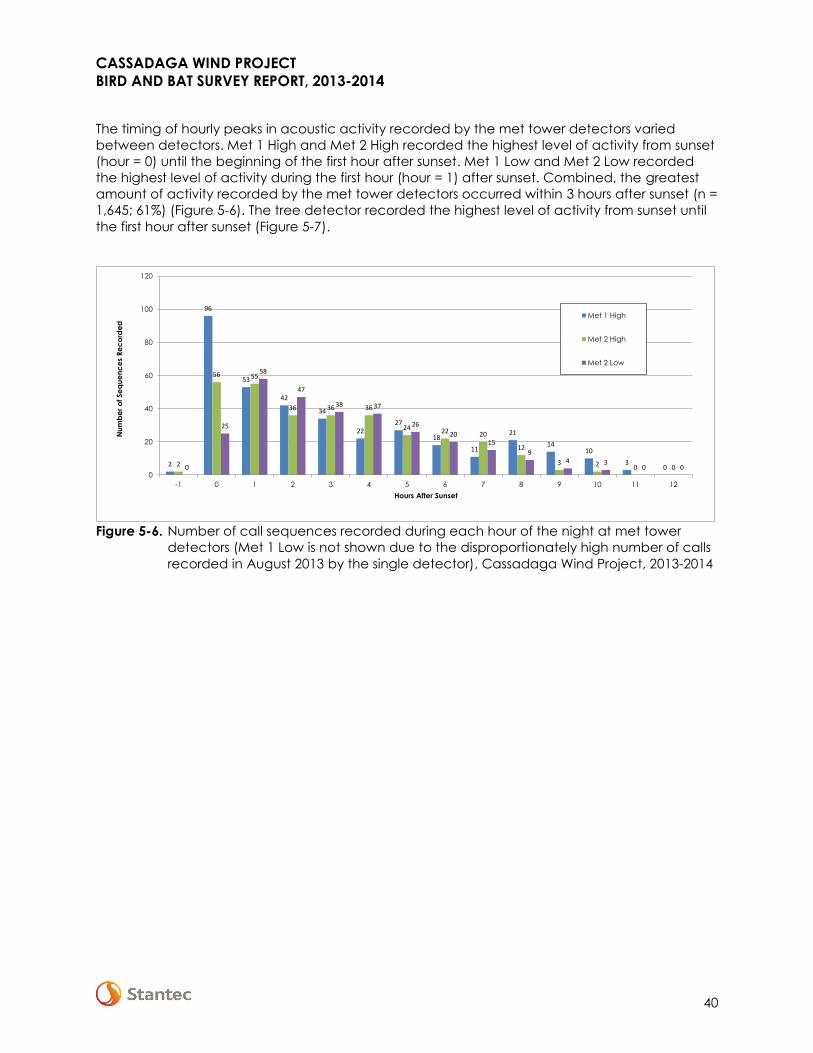
CASSADAGA WIND PROJECT
BIRD AND BAT SURVEY REPORT, 2013-2014
40
The timing of hourly peaks in acoustic activity recorded by the met tower detectors varied
between detectors. Met 1 High and Met 2 High recorded the highest level of activity from sunset
(hour = 0) until the beginning of the first hour after sunset. Met 1 Low and Met 2 Low recorded
the highest level of activity during the first hour (hour = 1) after sunset. Combined, the greatest
amount of activity recorded by the met tower detectors occurred within 3 hours after sunset (n =
1,645; 61%) (Figure 5-6). The tree detector recorded the highest level of activity from sunset until
the first hour after sunset (Figure 5-7).
Figure 5-6. Number of call sequences recorded during each hour of the night at met tower
detectors (Met 1 Low is not shown due to the disproportionately high number of calls
recorded in August 2013 by the single detector), Cassadaga Wind Project, 2013-2014
2
96
53
42
34
2227
18
11
21
1410
302
56 55
36 36 36
24 22 20
12
3 2 0 00
25
58
47
38 37
26
2015
94 3
0 00
20
40
60
80
100
120
-1 0 1 2 3 4 5 6 7 8 9 10 11 12
Nu
mb
er
of
Se
qu
en
ce
s R
ec
ord
ed
Hours After Sunset
Met 1 High
Met 2 High
Met 2 Low
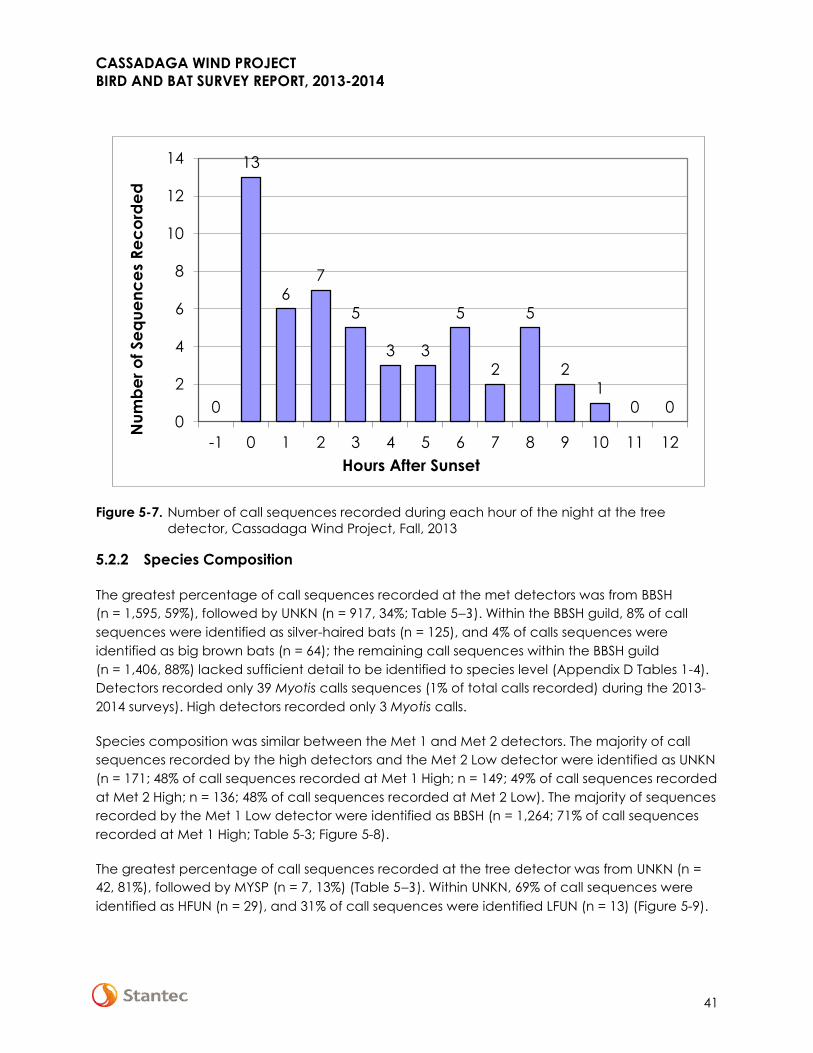
CASSADAGA WIND PROJECT
BIRD AND BAT SURVEY REPORT, 2013-2014
41
Figure 5-7. Number of call sequences recorded during each hour of the night at the tree
detector, Cassadaga Wind Project, Fall, 2013
5.2.2 Species Composition
The greatest percentage of call sequences recorded at the met detectors was from BBSH
(n = 1,595, 59%), followed by UNKN (n = 917, 34%; Table 5–3). Within the BBSH guild, 8% of call
sequences were identified as silver-haired bats (n = 125), and 4% of calls sequences were
identified as big brown bats (n = 64); the remaining call sequences within the BBSH guild
(n = 1,406, 88%) lacked sufficient detail to be identified to species level (Appendix D Tables 1-4).
Detectors recorded only 39 Myotis calls sequences (1% of total calls recorded) during the 2013-
2014 surveys). High detectors recorded only 3 Myotis calls.
Species composition was similar between the Met 1 and Met 2 detectors. The majority of call
sequences recorded by the high detectors and the Met 2 Low detector were identified as UNKN
(n = 171; 48% of call sequences recorded at Met 1 High; n = 149; 49% of call sequences recorded
at Met 2 High; n = 136; 48% of call sequences recorded at Met 2 Low). The majority of sequences
recorded by the Met 1 Low detector were identified as BBSH (n = 1,264; 71% of call sequences
recorded at Met 1 High; Table 5-3; Figure 5-8).
The greatest percentage of call sequences recorded at the tree detector was from UNKN (n =
42, 81%), followed by MYSP (n = 7, 13%) (Table 5–3). Within UNKN, 69% of call sequences were
identified as HFUN (n = 29), and 31% of call sequences were identified LFUN (n = 13) (Figure 5-9).
0
13
67
5
3 3
5
2
5
21
0 00
2
4
6
8
10
12
14
-1 0 1 2 3 4 5 6 7 8 9 10 11 12
Nu
mb
er
of Se
qu
en
ce
s R
ec
ord
ed
Hours After Sunset
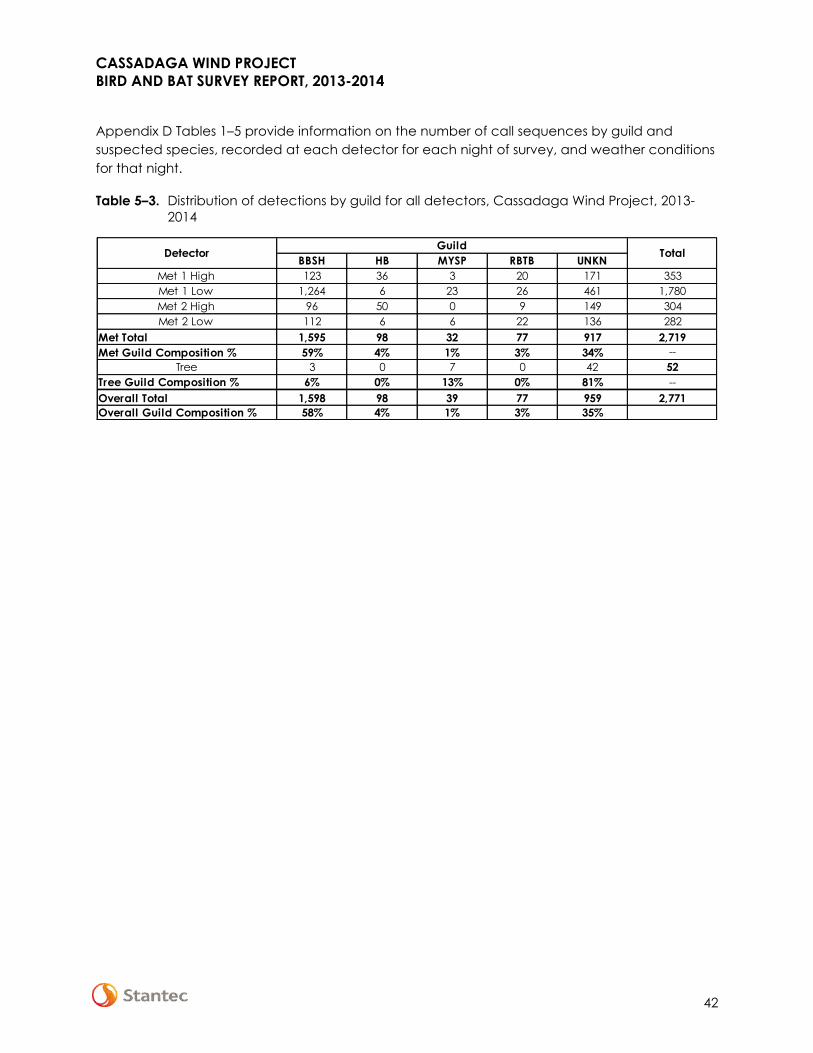
CASSADAGA WIND PROJECT
BIRD AND BAT SURVEY REPORT, 2013-2014
42
Appendix D Tables 1–5 provide information on the number of call sequences by guild and
suspected species, recorded at each detector for each night of survey, and weather conditions
for that night.
Table 5–3. Distribution of detections by guild for all detectors, Cassadaga Wind Project, 2013-
2014
BBSH HB MYSP RBTB UNKN
Met 1 High 123 36 3 20 171 353
Met 1 Low 1,264 6 23 26 461 1,780
Met 2 High 96 50 0 9 149 304
Met 2 Low 112 6 6 22 136 282
Met Total 1,595 98 32 77 917 2,719
Met Guild Composition % 59% 4% 1% 3% 34% --
Tree 3 0 7 0 42 52
Tree Guild Composition % 6% 0% 13% 0% 81% --
Overall Total 1,598 98 39 77 959 2,771
Overall Guild Composition % 58% 4% 1% 3% 35%
Detector TotalGuild
CASSADAGA WIND PROJECT
BIRD AND BAT SURVEY REPORT, 2013-2014
43
Figure 5-8. Histograms showing species composition of recorded bat call sequences from met
detectors. BBSH = big brown/silver-haired, HB = hoary bat, MYSP = Myotis species,
RBTB = red bat/tri-colored bat, UNKN = unknown, LFUN = low frequency unknown,
HFUN = high frequency unknown, PESU = tri-colored bat, LABO = red bat, LANO =
silver-haired bat, EPFU = big brown bat, Cassadaga Wind Project, 2013-2014
CASSADAGA WIND PROJECT
BIRD AND BAT SURVEY REPORT, 2013-2014
44
Figure 5-9. Histogram showing species composition of recorded bat call sequences from the
tree detector. BBSH = big brown/silver-haired, HB = hoary bat, MYSP = Myotis species,
RBTB = red bat/tri-colored bat, UNKN = unknown, LFUN = low frequency unknown,
HFUN = high frequency unknown, PESU = tri-colored bat, LABO = red bat, LANO =
silver-haired bat, EPFU = big brown bat, Cassadaga Wind Project, Fall, 2013
5.2.3 Activity and Weather
Mean nightly wind speeds at the Project area during the survey period varied between 1.4 and
11.6 m/s(Figure 5-10). Seventy-three percent of all call sequences (n = 2,023) were recorded
when mean nightly wind speeds were 6 m/s or less (Figure 5-10). Mean nightly temperatures
varied between -1.7 degrees °C and 24.5°C (Figure 5-11). Sixty-five percent of all call sequences
(n = 1,809) were recorded on nights when mean nightly temperatures were 18°C or above
(Figure 5-11). On 21 August, when the maximum number of call sequences was recorded in a
single night, the mean nightly wind speed was 6.0 m/s and the mean nightly temperature was
20.5°C. Figure 5-12 and Figure 5-13 display scatterplots of overall acoustic activity versus mean
nightly wind speed and temperature.
CASSADAGA WIND PROJECT
BIRD AND BAT SURVEY REPORT, 2013-2014
45
Figure 5-10. Nightly mean wind speed (m/s) (red line) and combined bat call sequence detections for detectors in 2013 (Tree, Met
1 High, and Met 1 Low; top graph) and detectors in 2014 (Met 1 High, Met 1 Low, Met 2 High, and Met 2 Low; bottom
graph), Cassadaga Wind Project, 2013-2014
0.0
2.0
4.0
6.0
8.0
10.0
12.0
0
50
100
150
200
250
300
350
400
450
500
550
600
650
Win
d S
pe
ed
(m
/s)
Nu
mb
er
of
Se
qu
en
ce
s R
ec
ord
ed
Date
0.0
2.0
4.0
6.0
8.0
10.0
12.0
14.0
0
5
10
15
20
25
30
Win
d S
pe
ed
(m
/s)
Nu
mb
er
of
Se
qu
en
ce
s R
ec
ord
ed
Date
CASSADAGA WIND PROJECT
BIRD AND BAT SURVEY REPORT, 2013-2014
46
Figure 5-11. Nightly mean temperature (°C) (green line) and combined bat call sequence detections for detectors in 2013 (Tree,
Met 1 High, and Met 1 Low; top graph) and detectors in 2014 (Met 1 High, Met 1 Low, Met 2 High, and Met 2 Low;
bottom graph) Cassadaga Wind Project, 2013-2014
0.0
5.0
10.0
15.0
20.0
25.0
30.0
0
50
100
150
200
250
300
350
400
450
500
550
600
650
Tem
pe
ratu
re (
°C)
Nu
mb
er
of
Se
qu
en
ce
s R
ec
ord
ed
Date
-5.0
0.0
5.0
10.0
15.0
20.0
25.0
0
5
10
15
20
25
30
Tem
pe
ratu
re (
°C)
Nu
mb
er
of
Se
qu
en
ce
s R
ec
ord
ed
Date
CASSADAGA WIND PROJECT
BIRD AND BAT SURVEY REPORT, 2013-2014
47
Figure 5-12. Nightly mean wind speed (left), and mean temperature (right) versus combined
bat call sequence for detectors (Tree, Met 1 High, and Met 1 Low), Cassadaga
Wind Project, Fall, 2013
Figure 5-13. Nightly mean wind speed (left), and mean temperature (right) versus combined
bat call sequence for detectors (Met 1 High, Met 1 Low, Met 2 High, and Met 2
Low), Cassadaga Wind Project, 2014
5.3 DISCUSSION
Overall activity was low throughout most of the survey period, with an overall detection rate of
3.3 calls/detector-night for all detectors combined. Overall activity was highest at the Met 1 Low
detector (7.2 calls/detector-night) due to a disproportionately high number of calls between 16
August and 25 August 2013. Met 1 Low recorded 1,470 calls during this 10-day period,
representing 83% of calls recorded by this detector throughout the entire survey period. The
cause for this spike in activity is outside the scope of this survey, but since Met 1 High recorded
only 16 calls during this same period and activity at Met 1 Low did not occur over the entire
night (from 8:00 PM to 2:00 AM), we can infer that the activity in the vicinity of Met 1 Low was
likely foraging, and not swarming. The call files at Met 1 Low were all very similar, visually,
indicating that the activity was from the same species (either big brown bat or silver-haired bat).
0
100
200
300
400
500
600
700
0.0 5.0 10.0 15.0
Nu
mb
er
of
Se
qu
en
ce
s
Re
co
rde
d
Mean Nightly Wind Speed (m/s)-100
0
100
200
300
400
500
600
700
0.0 5.0 10.0 15.0 20.0 25.0 30.0
Nu
mb
er
of
Re
cord
ed
Se
qu
en
ces
Mean Nightly Temperature (°C)
0
5
10
15
20
25
30
0.0 5.0 10.0 15.0
Nu
mb
er
of Se
qu
en
ce
s
Re
co
rde
d
Mean Nightly Wind Speed (m/s)
0
5
10
15
20
25
30
-5.0 0.0 5.0 10.0 15.0 20.0 25.0
Nu
mb
er
of
Re
cord
ed
Se
qu
en
ces
Mean Nightly Temperature (°C)
CASSADAGA WIND PROJECT
BIRD AND BAT SURVEY REPORT, 2013-2014
48
It is possible that a single bat or a few bats made multiple passes by Met 1 Low while foraging.
Acoustic data at the Project are fairly typical of passive acoustic bat survey data, where activity
levels can be highly variable among detectors and nights sampled.
Well-known studies have found that bat activity patterns are influenced by weather conditions
(Arnett et al. 2006, Arnett et al. 2008, Reynolds 2006). Acoustic surveys have documented a
decrease in bat activity rates as wind speed increases and temperature decreases, and bat
activity has been shown to correlate negatively to low nightly mean temperatures (Hayes 1997,
Reynolds 2006). These patterns suggest that bats are more likely to migrate on nights with low
wind speeds (less than 4–6 m/s) and generally warm temperatures. Several weather variables
can individually affect bat activity, as does the interaction among variables (i.e., warm nights
with low wind speeds). Despite the absence of a statistical correlation between the weather
variables of wind speed and temperature and bat activity, overall bat activity appeared to be
related to these weather variables at the Project. Seventy-three percent of bat activity occurred
when mean nightly wind speeds were 6 m/s or less. Sixty-five percent of bat activity occurred
when mean nightly temperatures were 18°C or above. On 21 August, when the greatest
numbers of bat call sequences were recorded, mean wind speed was 6.0 m/s, and mean
nightly temperature was 20.5°C. It should be noted that the number of call sequences recorded
that night does not represent a significant number of sequences recorded across all detectors,
as 99.8% of those call sequences (n = 599) were recorded by Met 1 Low.
Bat call sequences were identified to guild, although calls were provisionally categorized by
species when possible during analysis. Certain species, such as the eastern red and hoary bat,
have easily identifiable calls, whereas other species, such as the big brown bat and silver-haired
bat, are difficult to distinguish acoustically. Similarly, species within the Myotis genus have very
similar call characteristics, so Stantec did not make an attempt to differentiate call sequences
within this genus. Detectors recorded only 39 Myotis calls sequences (1% of total calls recorded)
during the 2013-2014 surveys. Myotis species have been particularly affected by white-nose
syndrome (WNS) that has become widespread in the Northeast (Brooks 2011). Myotis are more
commonly detected beneath canopy level (Arnett et al. 2006), and prior to WNS, Myotis call
sequences often tended to dominate acoustic data collected from detectors deployed at
canopy height (Brooks 2011). No pre-WNS acoustic data exists for the Project, making it difficult
to determine whether these results represent a significant decline in Myotis activity levels from
pre-WNS conditions.
Numbers of recorded bat call sequences cannot be correlated with the number of bats in an
area because acoustic detectors cannot differentiate between individuals (Hayes 2000). Thus,
results of acoustic surveys must be interpreted with caution. Methods surrounding acoustic bat
surveys are continually evolving, and there is currently little data aiding in the interpretation of
the number of calls/detector-nights. Results cannot be used to determine the number of bats
and bat species inhabiting an area. Although interpretations are limited, the surveys represent a
sample of activity and the general species groups that occur in the Project area. The timing of
pulses of activity and species composition are similar to that observed at other proposed wind
projects in New York and the Northeast.
CASSADAGA WIND PROJECT
BIRD AND BAT SURVEY REPORT, 2013-2014
49
6.0 Literature Cited
Arnett, E. B., J. P. Hayes, and M. M. P. Huso. 2006. An evaluation of the use of acoustic monitoring
to predict bat fatality at a proposed wind facility in south central Pennsylvania. An annual report
submitted to the Bats and Wind Energy Cooperative. Bat Conservation International. Austin,
Texas, USA.
Arnett, E.B., W.K. Brown, W.P. Erickson, J.K. Fiedler, B.L. Hamilton, T.H. Henry, A. Jain, G.D. Johnson,
J. Kerns, R.R. Koford, C.P. Nicholson, T.J. O’Connell, M.D. Piorkowski, and R.D. Takersley Jr. 2008.
Patterns of bat fatalities at wind energy facilities in North America. Journal of Wildlife
Management 72:61-78.
Brooks, R.T. 2011. Declines in summer bat activity in central New England 4 years following the
initial detection of white-nose syndrome. Biodiversity Conservation 20: 2537-2541.
Dunne, P., D. Keller, and R. Kochenberger. 1984. Hawk Watch: A Guide for Beginners. Cape May
Bird Observatory, Cape May, NJ. 2002 reprint.
HMANA (Hawk Migration Association of North America). 2014a. Hawkcount. Hawkwatch Site
Profile - Hamburg. https://hawkcount.org/siteinfo.php?rsite=364. Accessed 1 October 2014.
HMANA. 2014b. Hawkcount. Hawkwatch Site Profile - Ripley.
https://hawkcount.org/siteinfo.php?rsite=381. Accessed 1 October 2014.
Hayes, J. P. 1997. Temporal variation in activity of bats and the design of echolocation
monitoring studies. Journal of Mammalogy 78:1-524.
Hayes, J.P. 2000. Assumptions and practical considerations in the design and interpretation of
echolocation-monitoring studies. Acta Chiropterologica 2(2):225-236.
Kunz, T.H., E.B. Arnett, B.M. Cooper, W.P. Erickson, R.P. Larkin, T. Mabee, M.L. Morrison, M.D.
Strickland, and J.M. Szewczak. 2007. Assessing impacts of wind-energy development on
nocturnally active birds and bats: A guidance document. Journal of Wildlife Management
71:2449-2486.
NYNHP [New York Natural Heritage Program]. Letter response to Stantec dated 22 May 2014.
NYSDEC (New York State Department of Environmental Conservation). 2009. Guidelines for
Conducting Bird and Bat Studies at Commercial Wind Energy Projects.
NYSDEC. 2014. List of endangered, threatened and special concern fish and wildlife species of
New York State. http://www.dec.ny.gov/animals/7494.html.
O’Farrell, M.J., and W.L. Gannon. 1999. A comparison of acoustic versus capture techniques for
the inventory of bats. Journal of Mammalogy 80(1):24–30.
CASSADAGA WIND PROJECT
BIRD AND BAT SURVEY REPORT, 2013-2014
50
O’Farrell, M.J., B.W. Miller, and W.L. Gannon. 1999. Qualitative identification of free-flying bats
using the Anabat detector. Journal of Mammalogy 80(1):11–23.
Reynolds, D.S. 2006. Monitoring the potential impacts of a wind development site on bats in the
Northeast. Journal of Wildlife Management 70(5):1219 – 1227.
Stantec Consulting Services Inc. 2013a. Cassadaga Wind Project — Habitat Assessment.
Prepared for EverPower and NYSDEC.
Stantec Consulting Services Inc. 2013b. Work Plan for Avian and Bat Surveys. Prepared for
EverPower Wind Holdings, Inc. June 2013 REV July 2013.
TRC. 2012. Cassadaga Wind Energy Project Critical Issues Analysis. Prepared for EverPower Wind
Holdings, Inc. December.
USFWS (U.S. Fish and Wildlife Service)2012. U.S. Fish and Wildlife Service Land-Based Wind Energy
Guidelines.
USFWS. 2013. Eagle Conservation Plan Guidance Module 1–Land-based Wind Energy Version 2.