Embed Size (px)
Citation preview

E n e r g y R e s e a r c h a n d D e v e l o p m e n t D i v i s i o n F I N A L P R O J E C T R E P O R T
COMPARING BIRD AND BAT DATA FOR NEW WIND POWER GENERATION APPENDICES A-F
MARCH 2017 CE C-500-2017-019-APA-F
Prepared for: California Energy Commission Prepared by: K. Shawn Smallwood and Lee Neher


A-1
APPENDIX A: Reports of fatality rates, searcher detection rates, and scavenger removal rates estimated at wind-energy projects throughout North America through 2010. Ref Complete citation 1 Higgins, K. F., C. D. Dieter, and R. E. Usgaard. 1995. Monitoring of seasonal bird
activity and mortality on Unit 2 at the Buffalo Ridge Windplant, Minnesota. Report to South Dakota Cooperative Fish and Wildlife Research Unit, South Dakota State University, Brookings, South Dakota. Johnson, G. J., W. P. Erickson, M. D. Strickland, M. F. Shepherd, D. A. Shepherd, and S. A. Sarappo. 2002. Collision mortality of local and migrant birds at a large-scale wind-power development on Buffalo Ridge, Minnesota. Wildlife Society Bulletin 30:879-887. Osborn, R. G., K. F. Higgins, R. E. Usgaard, C. D. Dieter, and R. D. Neiger. 2000. Bird mortality associated with wind turbines at the Buffalo Ridge Wind Resource Area, Minnesota. American Midland Naturalist 143:41–52.
2 Young, Jr., D. P., J. D. Jeffrey, W. P. Erickson, K. Bay, V. K. Poulton, K. Kronner, B Gritski, and J. Baker. 2006. Eurus Combine Hills Turbine Ranch phase 1 post construction wildlife monitoring first annual report, February 2004–February 2005. Report to Eurus Energy America Corporation, San Diego, California, and Combine Hills Technical Advisory Committee, Umatilla County, Oregon.
3 WEST, Inc. 2006. Diablo Winds wildlife monitoring progress report: March 2005–February 2006. Unpubl. report to unnamed recipient.
4 Strickland, M. D., D. P. Young, Jr., G. D. Johnson, C. E. Derby, W. P. Erickson, and J. W. Kern. 2000. Wildlife monitoring studies for the SeaWest Wind Power development, Carbon County, Wyoming. Pages 55–63 in Proceedings of National Avian-Wind Power Planning Meeting III, May 1998, San Diego, California, USA. Report to Avian Subcommittee of the National Wind Coordinating Committee by LGL, King City, Ontario, Canada. Young, D. P., Jr., W. P. Erickson, M. D. Strickland, R. E. Good, and K. J. Sernka. 2003. Comparison of avian responses to UV-light-reflective paint on wind turbines. Subcontract report July 1999 – December 2000. NREL/SR-500-32840, National Renewable Energy Laboratory, Golden, Colorado. Young, D. P., W. P. Erickson, R. E. Good, M. D. Strickland, and G. D. Johnson. 2003. Final Report: avian and bat mortality associated with the initial phase of the Foote Creek Rim Windpower Project, Carbon County, Wyoming. WEST, Cheyenne,

A-2
Ref Complete citation Wyoming.
5 Kerlinger, P., L. Culp, and R. Curry. 2005. Year one report: post-construction avian monitoring study for the High Winds Wind Power Project Solano County, California. Report to High Winds, LLC and FPL Energy. Birds Landing, California. Kerlinger, P., R. Curry, L. Culp, A. Jain, C. Wilkerson, B. Fischer, and A. Hasch. 2006. Post-construction avian and bat fatality monitoring study for the High Winds Wind Power Project, Solano County, California: two year report. Report to High Winds, LLC and FPL Energy. Birds Landing, California.
6 Young, Jr., D. P., W. P. Erickson, J. D. Jeffrey, and V. K. Poulton. 2006. Puget Sound Energy Hopkins Ridge Wind Project Phase 1 post-construction avian and bat monitoring first annual report. Report to Puget Sound Energy, Dayton, Washington.
7 Northwest Wildlife Consultants, Inc. and WEST, Inc. 2007. Avian and bat monitoring report for the Klondike II Wind Power Project, Sherman County, Oregon. Report to PPM Energy, Portland, Oregon.
8 Johnson, G. J., W. P. Erickson, J. White, and R. McKinney. 2003. Avian and bat mortality during the first year of operation at the Klondike Phase I Wind Project, Sherman County, Oregon. Report to Northwestern Wind Power, Goldendale, Washington.
9 Erickson, W. P., J. Jeffrey, K. Kronner, and K. Bay. 2003. Stateline wind project wildlife monitoring annual report, results for the period July 2001–December 2002. Technical Report to FPL Energy, the Oregon Office of Energy and Stateline Technical Advisory Committee. Miami, Florida. Erickson, W. P., J. Jeffrey, K. Kronner, and K. Bay. 2004. Stateline wind project wildlife monitoring final report, July 2001–December 2003. Report to FPL Energy, the Oregon Energy Facility Siting Council and Stateline Technical Advisory Committee. Miami, Florida.
10 Erickson, W. P., G. D. Johnson, M. D. Strickland, and K. Kronner. 2000. Final report: avian and bat mortality associated with the Vansycle Wind Project, Umatilla County, Oregon: 1999 study year. Report to Umatilla County Department of Resource Services and Development, Pendleton, Oregon.
11 Erickson, W. P., J. D. Jeffrey, and V. K. Poulton (WEST, Inc.). 2008. Puget Sound Energy Wild Horse Wind Facility post-construction avian and bat monitoring first annual report: January–December 2007. Report to Puget Sound Energy, Ellensburg, Washington.
13 Kronner, K., B. Gritski, and S. Downes. 2008. Big Horn Wind Power Project Wildlife fatality monitoring study 2006–2007. Report to PPM Energy, Portland, Oregon.
16 Howell, J. A., and J. E. Didonato. 1991. Assessment of avian use and mortality related to wind turbine operations, Altamont Pass, Alameda and Contra Costa Counties, California, September 1998 through August 1989. Final report submitted to U.S. Windpower, Livermore, California.

A-3
Ref Complete citation Howell, J. A., and J. Noone. 1992. Examination of avian use and mortality at a U.S. Windpower wind energy development site, Montezuma Hills, Solano County, California. Final report. Prepared for Solano County Department of Environmental Management, Fairfield, California. Orloff, S., and A. Flannery. 1992. Wind turbine effects on avian activity, habitat use, and mortality in Altamont Pass and Solano County Wind Resource Areas: 1989–1991. Report to California Energy Commission, Sacramento, California. Smallwood, K. S. and B. Karas. 2009. Avian and Bat Fatality Rates at Old-Generation and Repowered Wind Turbines in California. Journal of Wildlife Management 73:1062-1071. Smallwood, K. S., and C. G. Thelander. 2008. Bird mortality in the Altamont Pass Wind Resource Area, California. Journal of Wildlife Management 72:215–223. Smallwood, K. S., D. A. Bell, S. A. Snyder, and J. E. DiDonato. 2010. Novel scavenger removal trials increase estimates of wind turbine-caused avian fatality rates. Journal of Wildlife Management 74: 1089-1097 + Online Supplemental Material.
16.1 Insignia Environmental. 2011. Draft Final Report for the Buena Vista Avian and Bat Monitoring Project. Report to County of Contra Costa, Martinez, California.
16.02-16.09, 16.11-16.22
K. S. Smallwood, this study. Smallwood, K. S. 2013. Inter-annual Fatality rates of Target Raptor Species from 1999 through 2012 in the Altamont Pass Wind Resources Area. Report to Alameda County Scientific Review Committee. http://www.altamontsrc.org/alt_doc/p268smallwood _inter_annual_comparison_of_ fatality_rates_1999_2012.pdf. Smallwood, K. S. and B. Karas. 2009. Avian and Bat Fatality Rates at Old-Generation and Repowered Wind Turbines in California. Journal of Wildlife Management 73:1062-1071. Smallwood, K. S. and C. Thelander. 2004. Developing methods to reduce bird mortality in the Altamont Pass Wind Resource Area. Final Report to the California Energy Commission, Public Interest Energy Research – Environmental Area, Contract No. 500-01-019. Sacramento, California Smallwood, K. S. and C. Thelander. 2005. Bird mortality at the Altamont Pass Wind Resource Area, March 1998 – September 2001 Final Report. National Renewable Energy Laboratory, NREL/SR-500-36973. Golden, Colorado.

A-4
Ref Complete citation ICF International. 2011. Altamont Pass Wind Resource Area Bird Fatality Study. Report # ICF 00904.08, to Alameda County Community Development Agency, Hayward, California. http://www.altamontsrc.org/alt_doc/m21_2010_altamont _bird _fatality_report.pdf
17 Anderson, R., N. Neumann, J. Tom, W. P. Erickson, M. D. Strickland, M. Bourassa, K. J. Bay, and K. J. Sernka. 2004. Avian monitoring and risk assessment at the Tehachapi Pass Wind Resource Area: period of performance: October 2, 1996–May 27, 1998. NREL/SR-500-36416, National Renewable Energy Laboratory, Golden, Colorado.
20 Anderson, R., J. Tom, N. Neumann, W. Erickson, D. Strickland, M. Bourassa, K. J. Bay, and K. J. Sernka. 2005. Avian monitoring and risk assessment at the San Gorgonio Wind Resource Area. NREL/SR-500-38054, National Renewable Energy Laboratory, Golden, Colorado.
23 Kerlinger, P., L. Culp, and R. Curry. 2005. Year one report: post-construction avian monitoring study for the High Winds Wind Power Project Solano County, California. Report to High Winds, LLC and FPL Energy. Birds Landing, California. Kerlinger, P., R. Curry, L. Culp, B. Fischer, A. Hasch, A. Jain, and C. Wilkerson. 2008. Post-construction avian monitoring study for the Shiloh I Wind Power Project, Solano County, California: two year report. Unpubl. Report to PPM Energy.
24 Tierney, R. 2007. Buffalo Gap I Wind Farm avian mortality study, February 2006–January 2007, Final Survey report. Report to AES SeaWest. Available at TRC, Albuquerque, New Mexico.
25 Fiedler, J. K. 2004. Assessment of bat mortality and activity at Buffalo Mountain Wind Farm, Eastern Tennessee. Thesis, University of Tennessee, Knoxville, Tennessee. Fiedler, J. K., T. H. Henry, R. D. Tankersley, and C. P. Nicholson. 2007. Results of bat and bird mortality monitoring at the expanded Buffalo Mountain Windfarm, 2005. Report, Tennessee Valley Authority, Knoxville, Tennessee. Nicholson, C. P. 2003. Buffalo Mountain Windfarm bird and bat mortality monitoring report: October, 2001–September, 2002. Report to Tennessee Valley Authority, Knoxville, Tennessee.
26 Kerlinger, P., R. Curry, A. Hasch, and J. Guarnaccia. 2007. Migratory bird & bat monitoring study at the Crescent Ridge Wind Power Project, Bureau County, Illinois: September 2005–August 2006. Report to Orrick Herrington & Sutcliffe, LLP, Washington, D.C.
27 URS Corporation. 2010. Final Goodnoe Hills Wind Project Avian Mortality Monitoring Report. Report to PacifiCorp, Salt Lake City, Utah.
28 TRC Environmental Corporation. 2008. Post-construction avian and bat fatality monitoring and grassland bird placement surveys at the Judith Gap Wind Energy Project, Wheatland County, Montana. Report to Judith Gap Energy, LLC, Chicago,
A-5
Ref Complete citation Illinois.
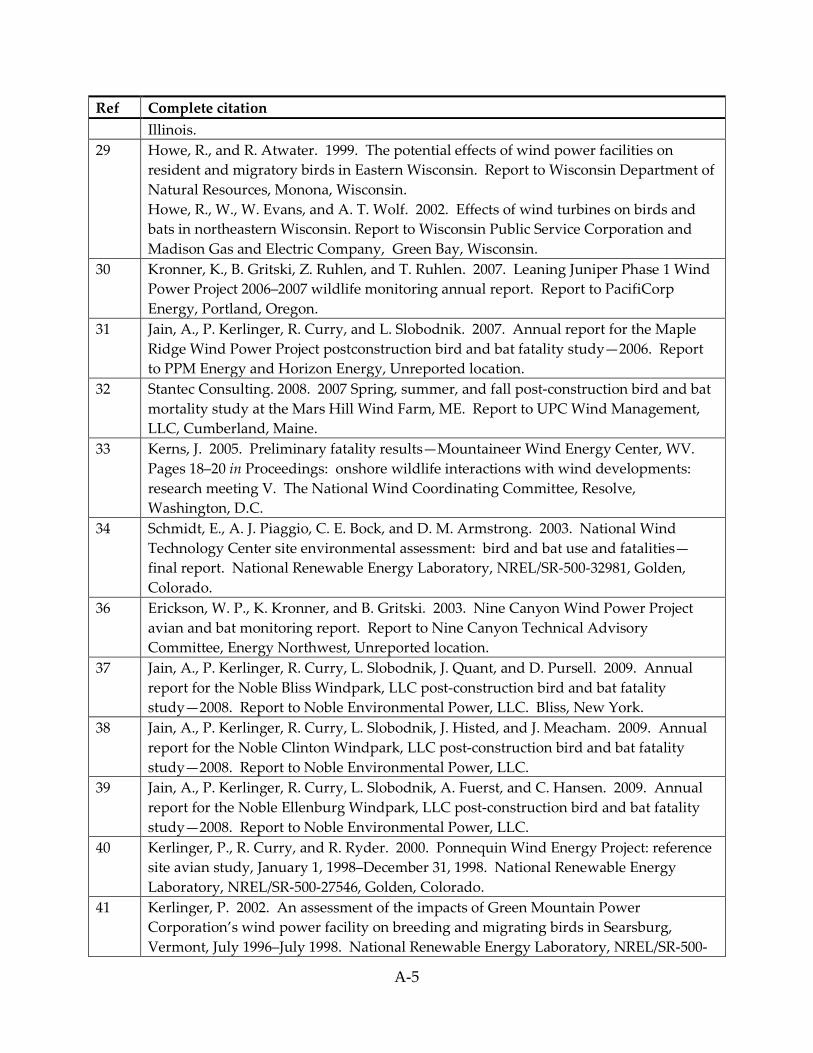
29 Howe, R., and R. Atwater. 1999. The potential effects of wind power facilities on resident and migratory birds in Eastern Wisconsin. Report to Wisconsin Department of Natural Resources, Monona, Wisconsin. Howe, R., W., W. Evans, and A. T. Wolf. 2002. Effects of wind turbines on birds and bats in northeastern Wisconsin. Report to Wisconsin Public Service Corporation and Madison Gas and Electric Company, Green Bay, Wisconsin.
30 Kronner, K., B. Gritski, Z. Ruhlen, and T. Ruhlen. 2007. Leaning Juniper Phase 1 Wind Power Project 2006–2007 wildlife monitoring annual report. Report to PacifiCorp Energy, Portland, Oregon.
31 Jain, A., P. Kerlinger, R. Curry, and L. Slobodnik. 2007. Annual report for the Maple Ridge Wind Power Project postconstruction bird and bat fatality study—2006. Report to PPM Energy and Horizon Energy, Unreported location.
32 Stantec Consulting. 2008. 2007 Spring, summer, and fall post-construction bird and bat mortality study at the Mars Hill Wind Farm, ME. Report to UPC Wind Management, LLC, Cumberland, Maine.
33 Kerns, J. 2005. Preliminary fatality results—Mountaineer Wind Energy Center, WV. Pages 18–20 in Proceedings: onshore wildlife interactions with wind developments: research meeting V. The National Wind Coordinating Committee, Resolve, Washington, D.C.
34 Schmidt, E., A. J. Piaggio, C. E. Bock, and D. M. Armstrong. 2003. National Wind Technology Center site environmental assessment: bird and bat use and fatalities—final report. National Renewable Energy Laboratory, NREL/SR-500-32981, Golden, Colorado.
36 Erickson, W. P., K. Kronner, and B. Gritski. 2003. Nine Canyon Wind Power Project avian and bat monitoring report. Report to Nine Canyon Technical Advisory Committee, Energy Northwest, Unreported location.
37 Jain, A., P. Kerlinger, R. Curry, L. Slobodnik, J. Quant, and D. Pursell. 2009. Annual report for the Noble Bliss Windpark, LLC post-construction bird and bat fatality study—2008. Report to Noble Environmental Power, LLC. Bliss, New York.
38 Jain, A., P. Kerlinger, R. Curry, L. Slobodnik, J. Histed, and J. Meacham. 2009. Annual report for the Noble Clinton Windpark, LLC post-construction bird and bat fatality study—2008. Report to Noble Environmental Power, LLC.
39 Jain, A., P. Kerlinger, R. Curry, L. Slobodnik, A. Fuerst, and C. Hansen. 2009. Annual report for the Noble Ellenburg Windpark, LLC post-construction bird and bat fatality study—2008. Report to Noble Environmental Power, LLC.
40 Kerlinger, P., R. Curry, and R. Ryder. 2000. Ponnequin Wind Energy Project: reference site avian study, January 1, 1998–December 31, 1998. National Renewable Energy Laboratory, NREL/SR-500-27546, Golden, Colorado.
41 Kerlinger, P. 2002. An assessment of the impacts of Green Mountain Power Corporation’s wind power facility on breeding and migrating birds in Searsburg, Vermont, July 1996–July 1998. National Renewable Energy Laboratory, NREL/SR-500-
A-6
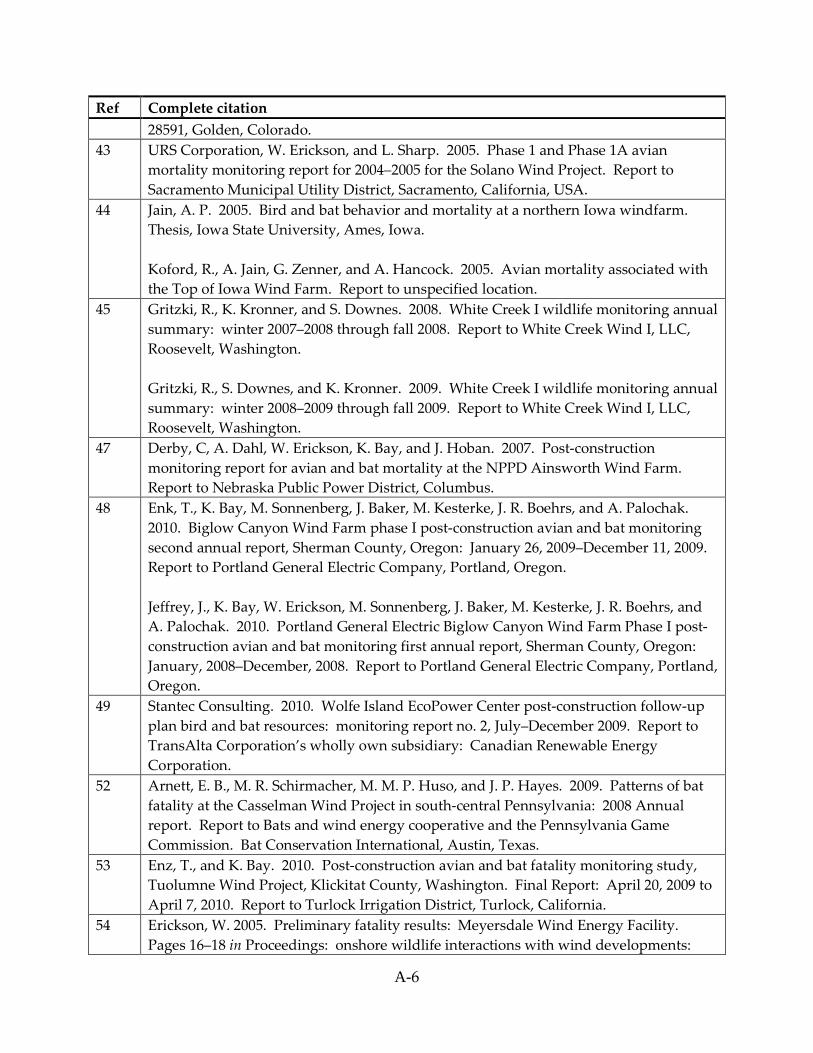
Ref Complete citation 28591, Golden, Colorado.
43 URS Corporation, W. Erickson, and L. Sharp. 2005. Phase 1 and Phase 1A avian mortality monitoring report for 2004–2005 for the Solano Wind Project. Report to Sacramento Municipal Utility District, Sacramento, California, USA.
44 Jain, A. P. 2005. Bird and bat behavior and mortality at a northern Iowa windfarm. Thesis, Iowa State University, Ames, Iowa. Koford, R., A. Jain, G. Zenner, and A. Hancock. 2005. Avian mortality associated with the Top of Iowa Wind Farm. Report to unspecified location.
45 Gritzki, R., K. Kronner, and S. Downes. 2008. White Creek I wildlife monitoring annual summary: winter 2007–2008 through fall 2008. Report to White Creek Wind I, LLC, Roosevelt, Washington. Gritzki, R., S. Downes, and K. Kronner. 2009. White Creek I wildlife monitoring annual summary: winter 2008–2009 through fall 2009. Report to White Creek Wind I, LLC, Roosevelt, Washington.
47 Derby, C, A. Dahl, W. Erickson, K. Bay, and J. Hoban. 2007. Post-construction monitoring report for avian and bat mortality at the NPPD Ainsworth Wind Farm. Report to Nebraska Public Power District, Columbus.
48 Enk, T., K. Bay, M. Sonnenberg, J. Baker, M. Kesterke, J. R. Boehrs, and A. Palochak. 2010. Biglow Canyon Wind Farm phase I post-construction avian and bat monitoring second annual report, Sherman County, Oregon: January 26, 2009–December 11, 2009. Report to Portland General Electric Company, Portland, Oregon. Jeffrey, J., K. Bay, W. Erickson, M. Sonnenberg, J. Baker, M. Kesterke, J. R. Boehrs, and A. Palochak. 2010. Portland General Electric Biglow Canyon Wind Farm Phase I post-construction avian and bat monitoring first annual report, Sherman County, Oregon: January, 2008–December, 2008. Report to Portland General Electric Company, Portland, Oregon.
49 Stantec Consulting. 2010. Wolfe Island EcoPower Center post-construction follow-up plan bird and bat resources: monitoring report no. 2, July–December 2009. Report to TransAlta Corporation’s wholly own subsidiary: Canadian Renewable Energy Corporation.
52 Arnett, E. B., M. R. Schirmacher, M. M. P. Huso, and J. P. Hayes. 2009. Patterns of bat fatality at the Casselman Wind Project in south-central Pennsylvania: 2008 Annual report. Report to Bats and wind energy cooperative and the Pennsylvania Game Commission. Bat Conservation International, Austin, Texas.
53 Enz, T., and K. Bay. 2010. Post-construction avian and bat fatality monitoring study, Tuolumne Wind Project, Klickitat County, Washington. Final Report: April 20, 2009 to April 7, 2010. Report to Turlock Irrigation District, Turlock, California.
54 Erickson, W. 2005. Preliminary fatality results: Meyersdale Wind Energy Facility. Pages 16–18 in Proceedings: onshore wildlife interactions with wind developments:
A-7
Ref Complete citation research meeting V. The National Wind Coordinating Committee, Resolve, Washington, D.C.
55 Byrne, S. 1983. Bird movements and collision mortality at a large horizontal axis wind turbine. Cal-Neva Wildlife Transactions 1983:76–83.
56 Gruver, J., M. Sonnenburg, K. Bay, and W. Erickson. 2009. Post-construction bat and bird fatality study at the Blue Sky Green Field Wind Energy Center, Fond du Lac County, Wisconsin. July 21, 2008–October 31, 2008 and March 15, 2009–June 4, 2009. Report to We Energies, Milwaukee, Wisconsin.
57 Erickson, W., A. Chatfield, and K. Bay. 2009. Review of avian studies in the Tehachapi Pass Wind Resource Area, Kern County, California. WEST, Cheyenne, Wyoming.
58 New Jersey Audubon Society. 2008. Post-construction wildlife monitoring at the Atlantic City Utilities Authority-Jersey Atlantic Wind Power Facility: periodic report covering work conducted between 20 July and 31 December 2007. Report to New Jersey Board of Public Utilities, Newark, New Jersey. New Jersey Audubon Society. 2008. Post-construction wildlife monitoring at the Atlantic City Utilities Authority-Jersey Atlantic Wind Power Facility: periodic report covering work conducted between 1 August and 30 September 2008. Report to New Jersey Board of Public Utilities, Newark, New Jersey. New Jersey Audubon Society. 2009. Post-construction wildlife monitoring at the Atlantic City Utilities Authority-Jersey Atlantic Wind Power Facility: project status report IV. Report to New Jersey Board of Public Utilities, Newark, New Jersey.
59 Gritzki, R., S. Downes, and K. Kronner. 2009. Klondike III (Phase 1) Wind Power Project wildlife monitoring year one Summary, October 2007–October 2008. Report to Iberdrola Renewables, Klondike Wind Power III LLC, Portland, Oregon.
60 Whitford, J. 2009. Ripley Wind Power Project post-construction monitoring report. Report to Suncor Energy Products, Calgary, Alberta, Canada.
67 BioResource Consultants, Inc. 2010. 2009/2010 Annual Report: Bird And Bat Mortality Monitoring, Pine Tree Wind Farm, Kern County, California. Report to Los Angeles Department of Water and Power.
74 Tetra Tech. 2013. Hatchet Ridge Wind Farm Post-Construction Mortality Monitoring Year Two Annual Report. Report to Hatchet Ridge Wind, LLC, Location not given.
79 Enz, T, and K. Bay, S. Nomani, and M. Kesterke. 2011. Bird and Bat Fatality Monitoring Study Windy Flats and Windy Point II Wind Energy Projects, Klickitat County, Washington, Final Report, February 1, 2010 – January 14, 2011. Report to Windy Flats Partners, LLC, Goldendale, Washington.
84 Chatfield, A., M. Sonnenberg, and K. Bay (WEST, Inc.). 2012. Avian and Bat Mortality Monitoring at the Alta-Oak Creek Mojave Project Kern County, California, Final Report for the First Year of Operation, March 22, 2011 – June 15, 2012. Report to Alta Windpower Development, LLC, Mojave, California.
90 Enk, T., K. Bay, M. Sonnenberg, J. Flaig, J. R. Boehrs, and A. Palochak. 2012. Amended

A-8
Ref Complete citation Year 1 Post-Construction Avian And Bat Monitoring Report, Biglow Canyon Wind Farm Phase II, Sherman County, Oregon, September 10, 2009 – September 12, 2010. Report to Portland General Electric Company, Portland, Oregon.
91 Enk, T., K. Bay, M. Sonnenberg, and J. R. Boehrs. 2012. Year 1 Avian And Bat Monitoring Report, Biglow Canyon Wind Farm – Phase III, Sherman County, Oregon, September 13, 2010 – September 9, 2011. Report to Portland General Electric Company, Portland, Oregon.
92 ICF International. 2012. Montezuma Wind LLC (Montezuma I) 2011 Avian And Bat Fatality Monitoring Report. Report to NextEra Energy Resources, Livermore, California.
93 H. T. Harvey & Associates. 2013. Montezuma II Wind Energy Center Post-construction Monitoring Report, Year-1. Report to NextEra Energy Montezuma II Wind, LLC, Juno Beach, Florida.
94 Johnson, G.D., L. Martinson, M. Sonnenberg, and K. Bay (WEST, Inc.). 2010. Post-Construction Monitoring Studies – First Annual Report, Glenrock & Rolling Hills Wind-Energy Facility, Carbon County, Wyoming: May 20, 2009 – May 19, 2010. Report to PacifiCorp Energy, Salt Lake City, Utah. Johnson, G.D., L. Martinson, M. Sonnenberg, and K. Bay (WEST, Inc.). 2011. Post-Construction Monitoring Studies - Second Annual Report: Glenrock & Rolling Hills Wind Energy Facility, Converse County, Wyoming. Draft Report: May 24, 2010 – May 26, 2011. Prepared for PacifiCorp Energy, Salt Lake City, Utah.
95 Johnson, G., T. Rintz, M. Sonnenberg, and K. Bay (WEST, Inc.). 2010. Post-Construction Monitoring Studies – First Annual Report, Seven Mile Hill Wind-Energy Facility, Carbon County, Wyoming: May 18, 2009 – May 13, 2010. Report to PacifiCorp Energy, Salt Lake City, Utah. Johnson, G., T. Rintz, M. Sonnenberg, and K. Bay (WEST, Inc.). 2011. Post-Construction Monitoring Studies – Second Annual Report, Seven Mile Hill Wind Energy Facility, Carbon County, Wyoming, Draft Report: May 19, 2010 – May 18, 2011. Report to PacifiCorp Energy, Salt Lake City, Utah.
96 Downes, S. and R. Gritzki. 2012. Harvest Wind Project Wildlife Monitoring Report, January 2010 – January 2012. Report to Harvest Wind Project, Roosevelt, Washington.
97 Enz, T, and K. Bay. 2010. Post-Construction Fatality Surveys For the Juniper Canyon Wind Project, Iberdrola Renewables, May 2011 – May 2012. Report to Iberdrola Renewables, LLC, Portland, Oregon.
98 Miller, A. 2008. Patterns of avian and bat mortality at a utility-scaled wind farm on the southern high plains. M.S. Thesis, Texas Tech University, Lubbock, Texas.
99 Brown, W. K., and B. L. Hamilton. 2006. Monitoring of Bird and Bat Collisions with Wind Turbines at the Summerview Wind Power Project, Alberta 2005-2006. Report to Vision Quest Windelectric, Calgary, Alberta.
100 ARCADIS, Inc. 2010. Fall 2008 to Spring 2010 Avian and Bat Post-Construction

A-9
Ref Complete citation Monitoring Report, Happy Jack Windpower Project. Report to Duke Energy, Cheyenne, Wyoming.
101 McCreight, J. and S. Lehnen. 2010. Annual Report: High Plains and McFadden Ridge I Wind Energy Facility Avian and Bat Fatality Survey and Pronghorn Antelope and Greater Sage Grouse Displacement Assessment. Report to PacifiCorp Energy, Salt Lake City, Utah.
102 ARCADIS, Inc. 2011. Bird and Bat Post-Construction Mortality Monitoring Study, Silver Sage Windpower Project. Report to Duke Energy, Cheyenne, Wyoming.
103 DeWitt, S. 2011. Bat Fatality Monitoring Report for the Pigeon Creek Wind Turbine, Adams County, near Payson, Illinois. Final Report for the Habitat Conservation Plan, Adams Electric Cooperative. John Wood Community College, Quincy, Illinois.
105 Young, D., C. Nations, M. Lout, and K. Bay. 2013. Post-Construction Monitoring Study, Criterion Wind Project, Garrett County, Maryland: April – November 2012. Report to Criterion Power Partners, LLC, Oakland, Maryland.
107 WEST, DeTect, TX-ESA, and EcoStats. 2010. Avian and Bat Fatality Study, Gulf Wind I Windfarm Energy Facility, Kenedy County, Texas: Interim Report: March – May 2010. Report to Pattern Energy, Houston, Texas.

B-1
APPENDIX B: Reports of utilization rates in baseline studies and post-construction monitoring at wind-energy projects throughout North America through 2010 Ref Complete citation
1
Johnson, G. D., W. P. Erickson, M. D. Strickland, M. F. Shepherd, and D. A. Shepherd. 2000. Final Report: Avian monitoring studies at the Buffalo Ridge, Minnesota Wind Resource Area: Results of a 4-year study. Report for Northern States Power Company, Minneapolis, Minnesota.
1.4
Derby, C., K. Seginak, A. Dahl, and K. Bay. 2008. Wildlife baseline studies for the Buffalo Ridge II Wind Resource Area Brookings and Deuel Counties, South Dakota. Report to HDR Engineering, Inc. (Minneapolis, MN) and Iberdrola Renewables (St. Paul, MN).
2
Young, D. P., Jr., W. P. Erickson, J.D. Jeffrey, K. Bay, R. E. Good, and B. G. Lack. 2003. Avian and sensitive species baseline study plan and final report, Eurus Combine Hills Turbine Ranch, Umatilla County, Oregon. Report to Eurus Energy America Corporation, San Diego, California, and Aeropower Services, Inc., Portland, Oregon.
4.1
Johnson, G. D., D. P. Young, Jr., W. P. Erickson, C. E. Derby, M. D. Strickland, and R. E. Good. 2000. Final Report, Wildlife Monitoring Studies, Seawest Windpower Project, Carbon County, Wyoming: 1995-1999. Report to SeaWest Energy Corporation, San Diego, CA, and Bureau of Land Management, Rawlins, Wyoming.
4.2
Young, D. P., W. P. Erickson, R. E. Good, M. D. Strickland, and G. D. Johnson. 2003. Final Report: Avian and bat mortality associated with the initial phase of the Foote Creek Rim Windpower Project, Carbon County, Wyoming. WEST, Inc., Cheyenne, Wyoming.
5
Kerlinger, P., R. Curry, L. Culp, A. Jain, C. Wilkerson, B. Fischer, and A. Hasch. 2006. Post-construction avian and bat fatality monitoring study for the High Winds Wind Power Project, Solano County, California: Two year report. Report to High Winds, LLC and FPL Energy.
6
Young, Jr., D. P., W. P. Erickson, K. J. Bay, J. D. Jeffrey, B. G. Lack, R. E. Good, and H. H. Sawyer. 2003. Baseline avian studies for the proposed Hopkins Ridge Wind Project, Columbia County, Washington. Report to RES North America LLC, Portland, Oregon.
8
Johnson, G. J., W. P. Erickson, J. White, and R. McKinney. 2003. Avian and bat mortality during the first year of operation at the Klondike Phase I Wind Project, Sherman County, Oregon. Report to Northwestern Wind Power, Goldendale, Washington.
9 Erickson, W. P., J. Jeffrey, K. Kronner, and K. Bay. 2004. Stateline wind project wildlife monitoring final report, July 2001–December 2003. Technical Report

B-2
Ref Complete citation submitted to FPL Energy, the Oregon Energy Facility Siting Council and the Stateline Technical Advisory Committee.
11
Erickson, W., D. Young, G. Johnson, J. Jeffrey, K. Bay, R. Good, and H. Sawyer (WEST, Inc.). 2003. Wildlife Baseline Study for the Wild Horse Wind Project: Summary of Results from 2002-2003 Wildlife Surveys. Report prepared for Zilkha Renewable Energy, Portland, Oregon.
13 Johnson, G. D., and W. P. Erickson. 2004. Analysis of potential wildlife/wind plant interactions Bighorn site, Klickitat County, Washington. Report to CH2MHILL, Portland, Oregon.
16 Orloff, S., and A. Flannery. 1992. Wind turbine effects on avian activity, habitat use, and mortality in Altamont Pass and Solano County Wind Resource Areas: 1989-1991. Report to California Energy Commission, Sacramento, California.
16.1 Insignia Environmental. 2011. Draft Final Report for the Buena Vista Avian and Bat Monitoring Project. Report to County of Contra Costa, Martinez, California, USA.
16.02-16.09, 16.11-16.22
K. S. Smallwood, this study. Smallwood, K. S. 2013. Inter-annual Fatality rates of Target Raptor Species from 1999 through 2012 in the Altamont Pass Wind Resources Area. Report to Alameda County Scientific Review Committee. http://www.altamontsrc.org/alt_doc/p268smallwood _inter_annual_comparison_of_ fatality_rates_1999_2012.pdf. Smallwood, K. S. and B. Karas. 2009. Avian and Bat Fatality Rates at Old-Generation and Repowered Wind Turbines in California. Journal of Wildlife Management 73:1062-1071. Smallwood, K. S. and C. Thelander. 2004. Developing methods to reduce bird mortality in the Altamont Pass Wind Resource Area. Final Report to the California Energy Commission, Public Interest Energy Research – Environmental Area, Contract No. 500-01-019. Sacramento, California. Smallwood, K. S. and C. Thelander. 2005. Bird mortality at the Altamont Pass Wind Resource Area, March 1998 – September 2001 Final Report. National Renewable Energy Laboratory, NREL/SR-500-36973. Golden, Colorado. ICF International. 2011. Altamont Pass Wind Resource Area Bird Fatality Study. Report # ICF 00904.08, to Alameda County Community Development Agency, Hayward, California, USA. http://www.altamontsrc.org/alt_doc/m21_2010_altamont _bird _fatality_report.pdf
17
Anderson, R., N. Neumann, J. Tom, W. P. Erickson, M. D. Strickland, M. Bourassa, K. J. Bay, and K. J. Sernka. 2004. Avian monitoring and risk assessment at the Tehachapi Pass Wind Resource Area: Period of Performance: October 2, 1996–May 27, 1998. NREL/SR-500-36416, National Renewable Energy Laboratory, Golden, Colorado.
B-3
Ref Complete citation
20, 22
Anderson, R., J. Tom, N. Neumann, W. Erickson, D. Strickland, M. Bourassa, K. J. Bay, and K. J. Sernka. 2005. Avian monitoring and risk assessment at the San Gorgonio Wind Resource Area. NREL/SR-500-38054, National Renewable Energy Laboratory, Golden, Colorado.
23 Kerlinger, P., R. Curry, and A. Hasch. 2004. Avian monitoring study and risk assessment for the Shiloh Wind Power Project, Solano County, California. Appendix B of Shiloh Wind Power Project EIR, Solano County, California.
23.1 Kerlinger, P., R. Curry, C. Wilkerson, L. Culp, A. Hasch, and A. Jain. 2006. Avian monitoring study and risk assessment for the Shiloh Wind Power Project, Solano County, California. Report to EnXco.
28
TRC Environmental Corporation. 2008. Post-construction avian and bat fatality monitoring and grassland bird placement surveys at the Judith Gap Wind Energy Project, Wheatland County, Montana. Report to Judith Gap Energy, LLC, Chicago, Illinois.
29 Howe, R., W., W. Evans, and A. T. Wolf. 2002. Effects of wind turbines on birds and bats in northeastern Wisconsin. Report to Wisconsin Public Service Corporation and Madison Gas and Electric Company. Green Bay, Wisconsin.
45
Kronner, K., B. Gritski, J. Baker (Northwest Wildlife Consultants, Inc.), G. D. Johnson, K. Bay, R. Good, and E. Lack (WEST, Inc.). 2005. Ecological Baseline Studies and Wildlife Impact Assessment for the White Creek Wind Power Project Klickitat County, Washington. Report to Last Mile Electric Cooperative, Goldendale, Washington.
48
WEST, Inc. 2005. Wildlife and habitat baseline study for the proposed Biglow Canyon Wind Power Project, Sherman County, Oregon. Report to Orion Energy, LLC, Oakland, California. Jeffrey, J., K. Bay, W. Erickson, M. Sonnenberg, J. Baker, M. Kesterke, J. R. Boehrs, and A. Palochak. 2010. Portland General Electric Biglow Canyon Wind Farm Phase I post-construction avian and bat monitoring first annual report, Sherman County, Oregon: January, 2008 – December, 2008. Report to Portland General Electric Company, Portland, Oregon. Enk, T., K. Bay, M. Sonnenberg, J. Baker, M. Kesterke, J. R. Boehrs, and A. Palochak. 2010. Biglow Canyon Wind Farm Phase I post-construction avian and bat monitoring second annual report, Sherman County, Oregon: January 26, 2009 – December 11, 2009. Report to Portland General Electric Company, Portland, Oregon. Enk, T., K. Bay, M. Sonnenberg, and J. R. Boehrs. 2012. Year 1 Avian And Bat Monitoring Report, Biglow Canyon Wind Farm – Phase III, Sherman County, Oregon, September 13, 2010 – September 9, 2011. Report to Portland General Electric Company, Portland, Oregon.
53 Erickson, W. P., G. D. Johnson, M. D. Strickland, K. Kronner, P. S. Becker, and S. Orloff. 1999. Baseline avian use and behavior at the CARES Wind Plant Site, Klitchitat

B-4
Ref Complete citation County, Washington. Final Report (NREL/SR-500-26902). National Renewable Energy Laboratory, Golden, Colorado. Johnson, G., W. P. Erickson, and J. D. Jeffrey 2006. Analysis of potential wildlife impacts from the Windy Point Wind Energy Project, Klickitat County, Washington. Prepared for Energy and Environment, Portland, Oregon.
56 Cutright, N. J. 2009. Post-construction Avian Point-Count Study Report, Blue Sky Green Field Wind Project, Fond du Lac County, Wisconsin. Report to We Energies. [attached to Blue Sky fatality report]
57 Erickson, W., A. Chatfield, and K. Bay. 2009. Review of avian studies in the Tehachapi Pass Wind Resource Area, Kern County, California. WEST, Inc., Report, Cheyenne, Wyoming.
59 Gritzki, R., S. Downes, and K. Kronner. 2009. Klondike III (Phase 1) Wind Power Project Wildlife Monitoring Year One Summary, October 2007–October 2008. Report to Iberdrola Renewables, Klondike Wind Power III LLC, Portland, Oregon.
60
Chautauqua Wind Power, LLC, Ecology and Environment, Inc., Pandion Systems, Inc., and Leboeuf, Lamb, Greene & Macrae. 2004. Avian risk assessment for the Chautauqua Windpower Project. Report to Towns of Ripley and Westfield, New York.
61
Johnson, G., T. Enz, and K. Bay. 2009. Wildlife baseline studies for the Whistling Ridge Wind Resource Area, Skamania County, Washington, Final Report September 11 – November 4, 2004, May 21 – July 14, 2006, and December 4, 2008 – May 29, 2009. Report to SDS Lumber, Bingen, Washington.
62 Harmata, A., K. Podruzny, and J. Zelenak. 1998. Avian use of Norris Hill Wind Resource Area, Montana. NREL/SR-500-23822, National Renewable Energy Laboratory, Golden, Colorado.
63 Erickson, W., G. Johnson, and K. Bay. 2002. Ecological baseline study for the Zintel Canyon Wind Project: Final Report April 2001-June 2002. Report to Energy Northwest, Richland, Washington.
64 Gerhardt, R., R. Gritski, and B. Anderson. 2008. Biological study results: West Butte Wind Power Project. Report to West Butte Wind Power Project, Bend, Oregon.
65
BioResource Consultants. 2005. A preliminary assessment of potential avian interactions at four proposed wind energy facilities on Vandenberg Air Force Base, California. NREL/SR-500-34961, National Renewable Energy Laboratory, Golden, Colorado.
66 Derby, C., K. Bay, and A. Dahl. 2009. Wildlife studies for the Prairie Winds SD1 Crow Lake Wind Resource Area: Aurora, Brule, and Jerauld Counties, South Dakota. Report to Basin Electric Power Cooperative, Bismarck, North Dakota.
67
Morrison, M. L. 2004. Proposed Pine Tree Wind Development Project: A review of potential avian wildlife-wind development impacts. App. F in App. D of EDAW, Inc. 2004. Biological and technical report/biological assessment for the Pine Tree Wind Development Project, Kern County, California. Report to Los Angeles Department of
B-5
Ref Complete citation Water and Power. http://www.ladwp.com/ladwp/cms/ladwp006339.pdf
68 Gritzki, R. and R. White. 2010. Ecological Baseline Studies and Wildlife Impact Assessment for Palouse Wind Whitman County, Washington. Report to Palouse Wind LLC, Portland, Oregon.
69 Derby, C., A. Dahl and K. Bay. Wildlife Baseline Studies for the Oak Glen Wind Resource Area Steele County, Minnesota, Final Report, April 1 – November 13, 2009. Report to Merjent, Inc. and Oak Glen Wind Farm LLC, Minneapolis, Minnesota.
70 Good, R., W. Erickson, K. Bay, E. Lack, V. Poulton. 2004. Wildlife baseline study for the Northern Cheyenne Wind Project. Report to Distributed Generation Systems, Inc. (DISGEN), Lakewood, Colorado.
71 Young, D. P., W. P. Erickson, K. Bay, R. Good, and K. Kronner. 2002. Baseline avian studies for the proposed Maiden Wind Farm, Yakima and Benton Counties, Washington. Report to Bonneville Power Administration, Portland, Oregon.
72
Sapphos Environmental, Inc. 2008a. Lompoc Wind Energy Project Final winter season avian preconstruction survey technical report. Reports to Pacific Renewable Energy Generation LLC, Solana Beach, California. Sapphos Environmental, Inc. 2008b. Lompoc Wind Energy Project Final spring season avian preconstruction survey technical report. Reports to Pacific Renewable Energy Generation LLC, Solana Beach, California.
73 Erickson, W. P., J. Jeffrey, D. Young, K. Bay, R. Good, K. Sernka, and K. Kronner. 2003. Wildlife baseline study for the Kittitas Valley Wind Project: summary of results from 2002 wildlife surveys. Report to Zilkha Renewable Energy, Portland, Oregon.
74 Young, D. P., Jr., G. D. Johnson, V. K. Poulton, and K. Bay. 2007. Ecological baseline studies for the Hatchet Ridge Wind Energy Project, Shasta County, California. Report to Hatchet Ridge Wind LLC, Portland, Oregon.
75 Gerhardt, R., R. Gritski, and J. Luginbuhl. 2008. Biological study report, East Ridge Wind Energy Project. Report to East Ridge Wind, LLC.
76 Johnson, G., K. Bay, and J. Eddy. 2009. Wildlife baseline studies for the Dunlap Ranch Wind Resource Area Carbon County, Wyoming: June 4, 2008-May 27, 2009. Report to CH@MHILL, Englewood, Colorado.
77 Young, D. P., Jr., V. K. Poulton, and K. Bay. 2007. Ecological baseline studies report proposed Dry Lake Wind Project, Navajo County, Arizona. Report to PPM Energy, Portland, Oregon.
78
WEST, Inc. and Turnstone Environmental Consultants, Inc. 2009. Wildlife Baseline Studies for the Radar Ridge Wind Resource Area Pacific County, Washington Final Report: April 15, 2008 – June 18, 2009. Report to Energy Northwest, Richland, Washington.
79 Johnson, G., J. Jeffrey, J. Baker, and K. Bay. 2007. Baseline avian studies for the Windy Flats Wind Energy Project, Klickitat County, Washington. Report prepared for Windy Point Partners, location not provided.

B-6
Ref Complete citation
80 Erickson, W., A. Chatfield, and K. Bay. 2011. Avian baseline studies for the North Sky River Wind Energy Project, Kern County, California. Final Report: May 18, 2010 -- May 26, 2011. Report, Cheyenne, Wyoming.
81
Young, D. P., Jr., M. D. Strickland, W. P. Strickland, K. J. Bay, R. Canterbury, T. Mabee, B. Cooper, and J. Plissner. 2004. Baseline avian studies Mount Storm Wind Power project, Grant County, West Virginia: May 2003-March 2004. Report to NedPower Mount Storm LLC, Chantilly, West Virginia.
82 Kerlinger, P., R. Curry, C. Wilkerson, L. Culp, A. Hasch, and A. Jain. 2009. Avian Monitoring Study and Risk Assessment for the Shiloh III Wind Power Project Solano County, California. Report to EnXco, unspecified location.
83
Chatfield, A., W. Erickson, and K. Bay (WEST, Inc.). 2010. Avian Baseline Studies at the Sun Creek Wind Resource Area Kern County, California, Final Report May 2009 – May 2010. Report to CH2MHILL, Oakland, California. Chatfield, A., W. Erickson, and K. Bay (WEST, Inc.). 2011. Avian Baseline Studies at the Alta East Wind Resource Area Kern County, California, Final Report July 10, 2010 – June 1, 2011. Report to CH2MHILL, Oakland, California.
84, 84.1-84.3
Erickson, W., and A. Chatfield. 2009. Avian baseline studies for the Alta-Oak Creek Mojave Wind-Energy Project, Kern County, California: Summary of results February 4 - July 11, 2009. WEST, Inc., Report, Cheyenne, Wyoming.
85
Young, D. P., Jr., W. P. Erickson, K. J. Bay, J.D. Jeffrey, B. G. Lack, and H. H.Sawyer. 2003. Baseline Avian Studies for the Proposed Desert Claim Wind Power Project, Kittitas County, Washington, Final Report, March 2002 - March 2003. Report to Desert Claim Wind Power, LLC, Ellensburg, Washington.
86
Johnson, G.D., W. P. Erickson, K. Bay, C. Nations, J. Kerns, E. Riley, and P. Bloom. 2007. Baseline Avian Use and Risk Assessment for the Homestead Wind Energy Project, Kern County, California. 2005 – 2006. Report to Horizon Wind Energy, location not provided. Chatfield, A., W. Erickson, and K. Bay (WEST, Inc.). 2012. Baseline Avian Studies for the Rising Tree Wind Resource Area Kern County, California, Final Report, June 9, 2010 – June 10, 2011. Report to Rising Tree Wind Farm LLC, Portland, Oregon.
87
Derby, C, J. Gruver, and A. Dahl. 2011. Wildlife Baseline Studies for the Pleasant Valley Wind Project Area Mower, Dodge, and Olmsted Counties, Minnesota, Final Report, September 2009 – October 2010. Report to Pleasant Valley Wind, LLC., Minneapolis, Minnesota.
88 Thorn, T., C. Derby, and K. Bay. 2009. Wildlife Baseline Studies for the Wilton Expansion Wind Resource Area Burleigh County, North Dakota, Final Report, September 2008 – June 2009. Report to NextEra Energy Resources, Austin, Texas.
89 Tetra Tech. 2013. Hatchet Ridge Wind Farm Post-Construction Mortality Monitoring Year Two Annual Report. Report to Hatchet Ridge Wind, LLC, Location not given.
90 Enk, T., K. Bay, M. Sonnenberg, J. Flaig, J. R. Boehrs, and A. Palochak. 2012.

B-7
Ref Complete citation Amended Year 1 Post-Construction Avian And Bat Monitoring Report, Biglow Canyon Wind Farm Phase II, Sherman County, Oregon, September 10, 2009 – September 12, 2010. Report to Portland General Electric Company, Portland, Oregon.
91
Enk, T., K. Bay, M. Sonnenberg, and J. R. Boehrs. 2012. Year 1 Avian And Bat Monitoring Report, Biglow Canyon Wind Farm – Phase III, Sherman County, Oregon, September 13, 2010 – September 9, 2011. Report to Portland General Electric Company, Portland, Oregon.
93 H. T. Harvey & Associates. 2013. Montezuma II Wind Energy Center Post-construction Monitoring Report, Year-1. Report to NextEra Energy Montezuma II Wind, LLC, Juno Beach, Florida.

C-1
APPENDIX C: Notes on fatality rate estimates from data presented in reports of monitoring at wind energy projects across North America K. Shawn Smallwood Alta Oaks, California Two golden eagles were found incidentally. Incidental finds of golden eagle fatalities have often been reported at monitored wind projects. In most cases, the incidental finds were understandable because eagles are easy for wind techs to spot, or for the monitors to notice while they are driving between turbines to search. One of these eagles at Alta Oaks, however, appeared to be no farther away from a searched turbine than from an unsearched turbine. I used the scale bar in the map of fatality locations to measure the distances between this eagle and the nearest two wind turbines. According to the authors, this eagle was nearest an unsearched turbine, but my measurements had it no farther away from a searched turbine. Therefore, I counted it as a fatality find during monitoring. Harvest Wind The first report summarized a complex sampling design. Two groups of 8 turbines were sampled in 2010, and a different set of two groups of 8 were sampled in 2011. Half of all these turbines were searched to 90 m and the other half to 120 m, but the report did not identify which turbines were searched to which distance, so I used the 105 m adjustment for search radius at all of them. All turbines in group 2 were searched weekly through the entire year. Turbines in group 1 were searched twice weekly for 16 weeks and every 28 days during the other 36 weeks of the year. The 16 week intensive period overlapped the typical peak period of bat fatalities in the first year, but overlapped the winter months during the second year. Hence, bat fatality rates at the wind turbines monitored with a split interval were the highest in the first year and zero in the second year, because the search interval during the peak bat fatality period increased from 3.5 days in 2010 to 28 days in 2011. Bat fatality rates at the turbines searched weekly doubled between 2010 and 2011. The sampling design at Harvest Winds yielded fatality rates that were confounded by location (sampled groups), year, search interval (3.5, 7, and 28 days), and seasonal timing of the 3.5-day interval. Simple averaging will not eliminate this confounding. Therefore, I used the best estimates available. For bats, I used only the split interval group of turbines monitored in 2010, leaving 2011 without a bat fatality estimate. For birds, I averaged the fatality rates between the two groups.

C-2
Red Canyon, Texas The monitor reduced the search interval from 14 to 7 days after 6 months of a 12 month monitoring period. She also reduced the search radius from 100 m to 80 m. Therefore, I summed fatality estimates from the two separate 6-month periods to obtain an annual estimate. I separately adjusted the estimates over each 6 month period for search interval and search radius. Vansycle Erickson et al. (2000) reported much smaller confidence intervals than I calculated. The grassland was very tall and dense, so finding carcasses in that cover must have been difficult. The report did not identify the proportion of the search area that was covered by grassland or which turbines included that cover. White Creek Within each group of 8 turbines sampled, 4 were searched out to 90 m from turbines and 4 were searched to 120 m. The report did not identify which 4 were to 90 m and which were to 120 m. The sampling of turbines was unlikely random or systematic, as the end-of-row turbines were selected for monitoring only 0.64 times other than expected (χ2 = 8.541, df = 1, P < 0.005). Did not report distances of carcasses from turbines during year 2, but did for year 1. In year 2: Group 1 consisted of 8 turbines searched every 28 days for 32 weeks(0.61 yrs) and every 3.5 days for 16 weeks (0.31 yrs) = total 0.92 yrs. Group 2 consisted of 8 turbines searched weekly for 0.92 yrs year and 28 days for 0.08 yrs. I took the weighted mean between the two search intervals within each group and each year. The weighted means were then averaged between groups 1 and 2. Shiloh I Twenty-four wind turbines were on shorter towers, but Kerlinger did not identify which they were. Fifty turbines were searched over first 18 month period, then the other 50 turbines were searched over second 18 month period, but this report only included searches over all of the first period and over the first 6 months of the second period.
C-3
It appears some math mistakes were made by Kerlinger when estimating fatality rates. He reported that his expansions were to 75 MW, but they should have been to 150 MW. Biglow The second year report did not include a list of fatalities and associated turbine numbers. I had to work with tallies of species, and I could not relate the species to the turbines. They reported seasonal breakdowns, so I used these to address the differential search interval (14 vs 28 days) only for bats because all bats are relatively small. I assumed that the bats not identified to species were probably found during the 28 day search intervals, so I assigned then to that interval. Birds were lumped together in the report, so I could not break out birds by size class when addressing time of year. I used a mean 20-day interval for birds, after adding 20 days to the front end (there was a long search gap between years one and two). I was unable to use any of the incidental finds because I could not determine whether the incidentals were found at searched turbines or non-searched turbines. Finally, because I did not have the link between fatalities and turbines, I could not estimate error terms. Biglow Phase II Fifty of the 65 wind turbines were searched, but results were not reported to wind turbine address. I therefore could not estimate standard error of the mean of the raw data. The monitors reported that 3% of small bird carcasses remained in carcasses persistence trials upon each fatality search during the non-migration seasons, and only 6% remained during migration seasons. These unusually low persistence rates resulted in very large fatality rate adjustments that led to fatality rate estimates larger than mine. I relied on national averages because I suspect that extreme trial outcomes resulted from poor methods or interpretation. Greater consistency in trial methods are needed, as well as greater care. Biglow Phase III Fifty of the 75 turbines were searched every 14 days during the migratory seasons spanning a third of the year, and every 28 days during the rest of the year. Fowler Ridge, Indiana I did not attempt to estimate fatality rates at this project due to severely restricted monitoring. The monitoring only covered turbine pads and access roads from August 1 to October 11, 2012. The authors reported estimates of annual bat fatalities, but this estimate should not be considered reliable. Forward Energy Center, Wisconsin

C-4
Carcasses found during routine monitoring were frozen and used in carcass persistence trials. Mice were used as surrogates for bats. Removal rates of found bats were very slow, and they were faster for mouse surrogates. The monitors used 3 search intervals – 1, 3, and 5 days – but did not report which fatalities were found during which search intervals. Therefore, I could not estimate fatality rates from data reported for this study. Judith Gap Wind turbines were searched monthly only during migration seasons, so the monitoring lasted only 0.58 years. The wind turbines selected from the available pool equally represented end-of-row and interior aspects of wind farm (χ2 = 1.9, df = 1, P > 0.05). The bat fatality rates were likely over-estimated because only the migration periods were monitored, and winter and summer bat fatality rates would likely have been lower. Buffalo Gap I included two turkey vulture fatalities found outside the standard search plots, but which were omitted by Tierney. I also added one month to the front end of the monitoring period, because it wasn’t clear whether a clearing search was done. Casselman Bird fatalities were not reported by turbine number, so I estimated bird fatalities as a pool against the pool of searched turbines. As a consequence, I could not estimate standard error. Searcher detection rates for bats were confusing, as the rates were reported for carcasses having persisted >7 days, at least two weeks, and so on. Because I could not tell what these persistence times had to do with the searcher detection rates, or why the persistence times varied by visibility class, I used the rates as they were reported. The fatality rates were high, and higher than reported by Arnett et al. Nevertheless, the monitoring only lasted 0.58 years. I assumed that no more bats would have been killed through the remainder of the year, which was probably untrue and probably left my bat fatality rate estimate low. I did not make the same assumption for birds, because bird fatalities have not peaked in fall as have bat fatalities. Ainsworth I used the clearing search fatalities, which the authors had excluded. I added two weeks to the front end of the search period to accommodate the clearing search fatalities.

C-5
Foote Creek Rim The study was reported as a 3.5 year study, but 5 months were missing from the search schedule preceding the last year. I used the start date of 1 Nov 1998 as the beginning of the year, so the first year ended at the end of October 1999. The second year was Nov-Oct of 1999-2000. I excluded a single blackbird found between 1 Nov and 31 Dec 2000, and I omitted those searches from consideration. The last year was June 2001 to June 2002. Only half the turbines were searched in the last year. The report did not identify which turbines were selected, but noted that groups of 3-4 turbines per string were selected to ensure spatial representation. Examining the turbines where fatalities were found, I discovered that larger groups than 4 turbines were selected for monitoring in the last year. Furthermore, I was able to identify all but 11 turbines that were monitored. I was able to identify most of these 11 turbines by seeing gaps in the groups of turbines associated with fatalities in the last year. A few more I had to guess membership. For the few guesses, I selected turbines adjacent to already identified groups. My guessing had no bearing on estimating fatality rates over the last year because all of these turbines yielded 0 fatalities over the last year. The only analytical problem I could have encountered would have been tests for association with turbine position or location in the last year. Oklahoma (Piorkowski 2006) I did not attempt to estimate fatality rates at this project due to inadequate reporting and insufficient fatality search effort. The fatality searches were out to only 20 m and lasted only 2 months. National Wind Technology Center I did not attempt to estimate fatality rates at this project due to inadequate reporting. The authors did not report how many wind turbines were searched or how large were the turbines. Shirley, Wisconsin I did not attempt to estimate fatality rates at this project due to inadequate reporting. The authors did not identify how many wind turbines were searched. Tuolumne, Washington Enz and Bay (2010) did not report a list of fatality records, so I had to work with members of the TAC to acquire the list. I also had to acquire a list of turbines that were 2 MW versus 2.3 MW in size, as well as a list of turbines searched weekly and the list of those searched monthly.

C-6
I ended up with three groups of fatality rate estimates. I estimated fatalities for the group of turbines searched monthly for one year. I also took a weighted mean of turbines searched both weekly and monthly during the year, where portion of the year was the weighting. I then took a weighted mean between the turbines searched monthly all year and those split between monthly and weekly searches, where MW was the weighting. According to Enz and Bay (2010:7), "Given the small number of birds found, no statistical tests were conducted to compare fatalities among different locations. However, the lack of strong patterns in the locations where the fatalities were found suggests that there are no large differences in bird mortality by location within the TWP." However, this conclusion appears to have been based on a lack of effort to test for any pattern. The maps of fatality finds indicate strong patterns of association with turbine position in the row and with landscape setting. To test for relationships, the researchers need to know the search history at each turbine, but Enz and Bay did not report the search history. There is no evidence that they made an effort to test hypotheses related to fatality associations. Mars Hill Only 16 weeks of fatality searches were performed, so the authors presented their fatality rate estimates as representative of the "study year." The 16 weeks were split into 3 seasons and included one gap, so the monitoring spanned about 5 months. The 3 seasonal periods lasted 0.1123, 0.0767, and 0.1123 years, but I rounded them all to 0.1 years to simplify the analysis. The analysis was further complicated by the use of two search intervals. The primary interval was 7 days, and 22 of 28 turbines were searched every 7 days during all three periods (seasons). Two (different) turbines per season were searched daily, or 6 of the 28 turbines were searched daily over one season. Therefore, I made separate fatality rate estimates for turbines searched over the 0.1-year, 0.2-year, and 0.3-year periods, where 0.1 years included the 1-day searches, and the 0.2 and 0.3 years covered the 7 day searches. After adjusting fatality rates for scavenger removal rates (and searcher detection error), I took a weighted mean of the 0.1-year and 0.2-year estimates, where the weighting was years and the number of turbines involved was 6. The fatality rates from these 6 turbines were then averaged with the fatality rates from the other 22 turbines, where the average was weighted by MW of rated capacity (9 MW for the 6 turbines and 33 MW for the 22 turbines). This was one of the most complicated fatality rate estimates I have had to make from reported data. Because the monitoring covered only 16 weeks, I have no way to represent the fatality rates over the rest of the year. These estimates could be biased high or low to unknown degrees, so they are not reliable. Furthermore, the maximum search radii varied from turbine to turbine, and were much shorter than conventional, given the 1.5-MW turbine size. Before these fatality rate estimates can be considered final, adjustments are needed for maximum search radius. These adjustments would need to be made in the SPSS file named 'Mars Hill Mortality' (held by K.S. Smallwood),

C-7
and fatality rates would need to be calculated in that file before means and standard errors are copied to the Excel spreadsheet. Kewaunee County, Wisconsin The fatality monitoring spanned two years, but the search intervals changed 8 times. Search intervals were 1, 2, 3.5, and 7 days. I summed the days (years) involving each of these search intervals, and then tagged each fatality to which search interval it was found. Fatality rate estimates were made separately for each search interval, and then weighted means were taken, where the weighting was years. Top of Iowa Neither Koford nor Jain provided a list of fatalities by wind turbine. I tallied the fatalities by species and divided by MW, years, and proportion of search area that was actually searched (ca. 25%). The yearspans were 0.67 for 2003 and 0.708 for 2004, so the fatality rate in the remainder of the year was unknown. Also of note was the short maximum search radius, given the large turbine size. The maximum radius was 38 m for a 0.9 MW turbine. Wolfe Island, Ontario The report covered monitoring for half a year (July - December). Half the turbines were searched weekly and half were searched twice per week. The average proportion of the area searched within a 50-m radius was 0.573 during July through September, and it was 0.855 during October through December (the maximum search radius was 60 m, however). Therefore, fatality rates were also divided by 0.573 or 0.855, depending on which three month period when the fatalities were found. The 60 m maximum search radius was unusually small for such a large turbine, i.e., 2.3 MW. I estimated fatality rates by quarter of the year corresponding with the difference in searchable area, and by search interval (3.5 vs. 7 days). I then took weighted means, where the weightings were years and MW. The weighted means were of fatalities per MW per searchable area per year, where the year was incomplete. The bat fatality rates will decline after a full year is completed, but the bird fatality rates could remain the same, or decrease or increase. Buffalo Mountain, Tennessee Fiedler et al. (2007) did not list fatalities by turbine, nor did they report attributes, such as distance from turbine, by each fatality. The monitoring lasted only 0.75 years, and I assumed the remaining 0.25 years would not have yielded any additional bat fatalities (I did not make this assumption for birds). Because there were multiple search intervals, I took a weighted mean among search intervals, where the weighting was on proportion of the year when each

C-8
search interval was used. I made estimates for the original 0.66-MW turbines as well as the new 1.8-MW turbines. The maximum search radius was the same between these turbine models. Nicholson (2003) performed two years of monitoring, but varied the search interval over that time. For each year, I estimated fatality rates separately per search interval, and then added the estimates. Buffalo Ridge, MN The Higgins et al. (1995) study concluded that none of the birds found at wind turbines were actually killed by the wind turbines. I rejected these conclusions, and assumed they were killed by wind turbines. Otherwise, the study was fairly standard, except that the monitoring lasted only 6 months. The Johnson et al. (2000) study was confusing, and did not provide all the information I needed to confidently make fatality rate estimates. Furthermore, data were missing from the Appendix (some sheets were duplicates in the App., so some might have ended up replacing originally intended sheets). Specifically, bird fatalities were missing for 1996-1998 at Phase 1 turbines, and for 1998 Phase 2 turbines. There were another two birds missing from 1997 Phase 2, but I ignored this fact. Finally, various tallies changed in different parts of the report, making me wonder which tallies were correct. Where feasible, I estimated fatality rates per turbine, making up dummy turbine labels to round out the numbers of turbines said to have been searched, but not reported in a list of turbines. Where it was impossible to estimate fatalities per turbine, I divided tallies by MW and years, and then adjusted for R and p. For bats, I assumed no additional bats would have been found during the non-monitored third of the year, but I made no such assumption for birds. My bird fatality rate estimates were much lower than reported by Johnson et al. (2000), but I could not figure out the reason – I suspect Johnson et al. made some math mistakes. I also estimated much higher bat fatality rates than reported in Johnson et al., but this discrepancy might be explained by my inclusion of incidentally found bats. I disagreed with Johnson et al.’s liberal omission of incidentally found bats. I also note that the background fatality searches performed in this study were performed along roadways. Roadways are probably not the most representative locations for background mortality surveys, because some of the fatalities along roadway would have been caused by autos, which present the same threat to birds around wind turbines. Johnson et al. (2002) was focused only on bats. Bat fatality rates were easy to estimate from this report, though the monitoring only lasted 3 months per year and the turbine labels were not provided for all turbines searched. I corrected for the latter deficiency by concocting dummy

C-9
labels for the number of turbines for which fatalities were not found but which totaled the number of turbines searched each year. Noble Bliss Jain et al. (2009) did not provide a list of bird fatalities by wind turbine. Instead, summary values were provided. I was able to figure out which birds went with which wind turbines in some cases, but I resorted to arbitrarily assigning the following bird fatalities to turbines searched daily: Black-polled warbler, blue-headed vireo, European starling, Magnolia warbler, 2 red-eyed vireos, savannah sparrow, veery sp. Warbler sp., wood thrush, and 7 unidentified birds. It did not matter which turbines these birds were assigned for the purpose of fatality rate estimation, so long as the turbines were among those searched daily. I also included all but three incidental finds, contrary to how Jain et al. handled them. The 3 incidentals I excluded were found at unsearched turbines. Jain et al. did not identify which birds were found at unsearched turbines, so I assumed they included the 2 red-tailed hawks and the ruffed grouse that were reportedly found incidentally. I assumed these were the birds found at other turbines because maintenance crews were more likely to see and report the large-bodied species. Incidental bat finds were also distributed arbitrarily to turbines, because Jain et al. reported summaries of incidental finds per turbine, and in another list they summarized the number of incidentals per species. I just didn’t know which species went with which turbines. Again, for the purpose of making fatality rate estimates, it is not critical to know which turbine killed each and every bat, so I assigned them to the turbines known to have yielded incidental finds. One of the denominators in the fatality rate metric was proportion of area searchable within the maximum search radius. Jain et al. related fatalities to distance annuli where they were found, and calculated the proportion of each 10-m annulus that was searchable. I simply related all fatalities per turbine to the total searchable area within the maximum search radius. Average search intervals were actually 1.23, 3.2, and 7.88, instead of 1, 3, and 7, respectively. I extrapolated the scavenger removal rates to correspond with these deviations in search interval. For bats, I assumed all fatalities were found that were going to be found throughout the year. The monitoring lasted little more than half a year, but covered the fall period, which is when most of the bats are killed by wind turbines. My bat estimates were based on deaths per MW per proportion of area searched. For birds, I did not assume most of the fatalities were found, and so I included years in the fatality rate estimate. Jain et al. reported fatality rates as deaths/MW/period, which could easily be misinterpreted as deaths/MW/year. Noble Clinton
C-10
Jain et al. (2009) did not provide a list of bird fatalities by wind turbine. Instead, summary values were provided. I was able to figure out which birds went with which wind turbines in some cases, but I resorted to arbitrarily assigning the following bird fatalities to one of two possible turbines searched daily: Killdeer, Rock pigeon, tree swallow, yellow-rumped warbler, blue-headed vireo, and least flycatcher. It did not matter which turbines these birds were assigned for the purpose of fatality rate estimation, so long as the turbines were among those searched daily. I also included all but four incidental finds, contrary to how Jain et al. handled them. The 4 incidentals I excluded were found at unsearched turbines. Jain et al. did not identify which birds were found at unsearched turbines, so I assumed they included the common merganser, mallard, and 2 ruffed grouse that were reportedly found incidentally. I assumed these were the birds found at other turbines because maintenance crews were more likely to see and report the large-bodied species. Noble Ellenburg Jain et al. (2009) did not provide a list of bird fatalities by wind turbine. Instead, summary values were provided. I was able to figure out which birds went with which wind turbines in some cases, but I resorted to arbitrarily assigning the following bird fatalities to one of two possible turbines searched daily: blue-headed vireo, brown creeper, and European starling. It did not matter which turbines these birds were assigned for the purpose of fatality rate estimation, so long as the turbines were among those searched daily. I also included all but four incidental finds, contrary to how Jain et al. handled them. The 4 incidentals I excluded were found at unsearched turbines. Jain et al. did not identify which birds were found at unsearched turbines, so I assumed they included the California goose, Wild turkey, American woodcock, and ruffed grouse that were reportedly found incidentally. I assumed these were the birds found at other turbines because maintenance crews were more likely to see and report the large-bodied species. I also omitted an incidentally found Magnolia warbler, because I could not determine whether it was found at searched versus unsearched turbines. Many bats were also found incidentally, but omitted by Jain et al. (2009). Jain et al. reported which of the searched turbines produced incidental finds and how many, and they reported how many of which species were found incidentally. Therefore, I proportionally allocated the incidental finds per species to wind turbines until tallies of incidental finds were complete per turbine. This process left 11 incidental finds allocated to turbines that were not searched. Mountaineer, West Virginia Kerns and Kerlinger (2004) did not identify which birds and bats were killed by which turbines. However, I was able to determine the number of each bird species killed during each season by cross-walking among the tables in the report. For bats with at least 28 total fatalities found, I applied the proportion of bats killed in spring versus fall to the tallies of bat carcasses per species found throughout the monitoring period, assuming that the proportions would have applied equally to each species. I only used this approach to split out the numbers of each bat

C-11
species killed in spring and fall. I then calculated weighted mean adjusted fatality rates, where the weights were fractions of the year applied to each season. Each season was associated with a unique average search interval. I carried error terms for scavenger removal and searcher detection rates, but had no error term for variation among wind turbines. Kerns and Kerlinger (2004) omitted 33 bird fatalities from the fatality rate estimation because they concluded that these 33 birds were killed in foggy conditions and did not represent annual fatality rates. I disagreed with this conclusion because their monitoring did not even last a year, so they could not have known to what degree fog contributes to annual fatality rates at the Mountaineer project. I therefore included these 33 birds. I divided the number of bat fatalities by the MW in the project and 1 year, assuming that the bats found in spring and fall would have been all the bats found in the year. This assumption was likely incorrect, so my fatality rate estimate should be considered minimum. Mountaineer, Kerns (2005) Kerns reported only the total number of bats and birds found over 6 weeks of monitoring. I divided the number of bat fatalities by the MW in the project and by 1 year, assuming that the bats found in spring and fall would have been all the bats found in the year. This assumption was likely incorrect, so my fatality rate estimate should be considered minimum. I adjusted for scavenger removal by taking the average removal rate estimate for 7 days and 1.75 days, the two intervals used between two equal-sized groups of turbines. Meyersdale, PA Erickson (2005) reported the total number of bats found only over 6 weeks of monitoring. I divided the number of bat fatalities by the MW in the project and 1 year, assuming that the bats found in spring and fall would have been all the bats found in the year. This assumption was likely incorrect, so my fatality rate estimate should be considered minimum. I adjusted for scavenger removal by taking the average removal rate estimate for 7 days and 1 day, the two intervals used between two equal-sized groups of turbines. I classified the visibility of the searching substrate as low, although the Erickson report did not provide much information. He reported that the forested environments were not worth searching because the searcher efficiency would be too low. He also reported that the forest approached to within 30 m of searched turbines, and that a future report would map the unsearchable areas so that an adjustment could be made (the search radius was originally supposed to be 70 m). Therefore, I classified the visibility as low.
C-12
Jersey Atlantic New Jersey Audubon relied on on-site scavenger removal and searcher detection trials to arrive at their adjustments, but they did not publish the results of their trials in any detail. I could not determine whether they used appropriate species or appropriate methods. They also adjusted fatality rates for the proportion of the search area that was actually searched. Their maximum search radius was only to 65 m, however. Another shortfall in Audubon's reporting was their neglecting to report dates and turbines associated with their fatality finds in their second reported study period, January 1 through December 30, 2008. For this time period, I assigned the dates carcasses were found as the 15th of the month in which they were reported, but I had no means to identify the specific turbine that killed the bird or bat. Bats were also not reported to turbine or date in the third report covering 2009. Fatalities not reported to turbine were assigned the mean proportion of the turbine areas searched so that fatality rates could be estimated. I also relied on national averages of scavenger removal and searcher detection rates, and I assumed that searcher visibility was high within the areas that were searched. I also applied the search radius adjustment because the 65 m maximum search radius was small relative to the heights of the turbine towers. Blue Sky I used the proportions of areas that were searched within 10-m radial bands extending from the turbine (Fig. 6 in report) to calculate the total proportion of the fatality search area that was actually searched within the maximum search radius. Because WEST did not report details of individual fatalities, I had to forego the calculation of means and standard errors of fatality estimates among wind turbines. Therefore, I did not carry error terms through the calculations of fatality rates. Also, when it came to representing the number of years on the fatality rate calculation, I assumed that no more bats would have been found outside the spring fall seasons when turbines were searched, so I considered the number of years to be one. For birds, however, I considered the years to be 0.5. Because mean search intervals varied between seasons and by the number of turbines searched, I derived weighted mean removal rates from national averages, where the weightings were number of turbines searched daily versus weekly and the number of days surveyed in spring versus fall. To represent conditions described by Gruver et al. (2009), I assumed that search visibility was low in fall and moderate in spring. Criterion This 70 MW project was grossly under-sampled, involving only 14 of the 28 wind turbines, and search areas only within the cleared areas out to 40 m from each turbine, and only <2/3 of a year. To adjust fatality rates for the short search radius, I used the model-predicted proportion
C-13
of carcasses occurring within 40 m of turbines on 80 m towers and searched to 105 m in other studies. The reported fatality rate estimates were likely biased low due to problems with the searcher detection and carcass persistence trials. The searcher detection trials included placements of 175 small birds, 100 large birds, and 200 bats. The carcass persistence trials included 192 small birds, 99 large birds, and 198 bats. The authors reported in the Discussion section that at least bat carcasses used in the searcher detection trial were also used in the carcass persistence trial, and the numbers of carcasses placed were sufficiently close to suggest that the searcher detection trial carcasses were indeed used for carcass persistence. There was nothing wrong with doing this, except that trial carcasses used for searcher detection included birds and bats found dead during routine fatality searches. Using carcasses of unknown time since death can confound estimates of carcass persistence rates or of mean days to removal, because carcass removal slows with increasing time since death (Smallwood et al. 2013). Another problem with the carcass persistence trial was the number of carcasses placed. Placing 489 carcasses within an average 40 m effective search radius of 14 turbines might have contributed to scavenger swamping (Smallwood 2007). This many carcasses placed on 7 ha (total effective search area) over 7.5 months equaled 9.3 carcasses per ha per month, which was a greater loading of trial carcasses than I can recollect at any other fatality monitoring study. Adding to these placements were the carcasses deposited by the wind turbines, which I estimated at 103.45 carcasses per wind turbine per year, or a loading of 8.6 carcasses per ha per month. The scavenger community was probably challenged to consume 8.6 carcasses per ha per month even before another 9.3 carcasses per ha per month were added in trials, totaling about 18 carcasses per ha per month at the monitored wind turbines. It remains unknown whether the monitors swamped the scavengers or to what degree they may have increased carcass persistence due to swamping. Klondike III This project was composed of turbines of two sizes, 1.5 MW and 2.3 MW. These turbines were searched monthly over 8.5 months, and every 15 days over 3.5 months. I therefore took a weighted mean of the adjusted fatality rates for each turbine size. Furthermore, some of the search plots extended far enough into the potential search areas of adjacent turbines that the authors derived what they termed "effective turbines" searched as the denominator in the fatality rate metric. I estimated fatality rates with and without this adjustment for the extended search areas, but I used MW instead of turbines and I applied the adjustment to individual turbines from which the plot extensions were made. The reported estimates for bats and small birds were twice my estimates. I attempted to track down the source of the differences, but without success. It is possible the authors made a math mistake.
C-14
Ripley This project was composed of 38 2-MW wind turbines, half searched at 3.5 day intervals and half searched at 7 day intervals. The monitoring period lasted only 0.42 years, so I made two estimates for bats -- one based on 0.42 years and one based on a full year, assuming no additional bats would have been found. Even though I relied on the latter assumption, I know that it was probably untrue, and that some bats were killed outside the monitoring period. The fatality rate estimate was therefore low for bats. Pine Tree, California BioResource Consultants (2010) attributed turbine collision as the cause of death of 7 of 96 bird carcasses found during the first year of fatality searches. Five of the fatalities were attributed to vehicle collisions, and the rest were classified as unknown. I ignored the vehicle collisions as likely cause of death, because vehicles are supposed to drive slowly on the project site, and because the fatalities were found within the search areas of the wind turbines. Although I omitted some fatalities found at non-searched wind turbines, I assumed the rest of the carcasses were caused by wind turbines, consistent with standard practice at wind projects. Gulf Wind, Texas The reported numbers of daily surveys did not equal the number of days spanning the monitoring period, so there was something wrong with the reporting of the daily searches. A memo from Wally Erickson to Pattern Energy reported an increase in the search radius in mid-September from 67.5 m to 100 m, although this increase in search radius was not reported in the reports. I ignored this change in search radius, because it involved only 1 month of searches. Fatalities were inconsistently reported to the turbine address, so I had to use body size classes at each turbine to estimate standard error. I applied SE only to groups defined by WEST et al. as large/medium, small bird, and bats. I did not use SE from this analysis on the species-specific estimates, because I did not know the distribution of species fatalities among the turbine addresses. Also, when I estimated fatality rates by species, I used small bird adjustment factors on mourning doves, even though WEST et al. classified mourning doves as large/medium-sized birds. Daily searches yielded fatalities of at least 10 species at turbines searched daily and 2 species at turbines searched every 8 days during fall. Daily searches yielded fatalities of at least 11 species at turbines searched daily and 3 species at turbines searched every 8 days during spring. Daily searches yielded fatalities of at least 27 species at turbines searched daily and 5 species at turbines searched every 8 days during both spring and fall.
C-15
The model fit to the adjusted bat fatality rate plotted against search interval (days) in Fig. 11 of Smallwood (2013) predicted 7.26 bat fatalities/MW/year at 8 day interval and 30.57 fatalities/MW/year at 1 day interval. The model predicted a 4.2-fold increase in fatality rate due to the reduced search interval, but the data from Gulf Wind showed a 12-fold increase in the fatality rate. One difference in the Gulf Wind project compared to the studies leading to the model in Fig. 11 of Smallwood (2013) was the use of dogs. Another was leaving found carcasses in the field due to lack of a salvage permit. I did not find either of these explanations compelling. Overall, the reporting on this monitoring effort was incomplete and confusing. Glenrock, Wyoming Of the 54 wind turbines searched (out of 118 turbines), half were searched with a 7 day interval during spring and fall migration periods, and otherwise searched with a 28 day interval. I estimated the fatalities of each species by year by period (fall migration, spring migration, nonmigration) by search interval, and then summed these estimates by year. I integrated the estimates between those derived from the 28 day interval and those based on the 7 day interval during the migration seasons, whereby I split the difference for large and medium-sized birds, split the difference for bats and small birds when the estimates were greater during the 28-day interval, and otherwise used the estimates from the 7-day intervals for bats and small birds. About half of the reported golden eagle fatalities were found incidentally. High Plains and McFadden Ridge House sparrows were used as surrogates for bats in carcass persistence trials. The search intervals were split seasonally among 15 turbines, averaging 7 days over 5.5 months of the year and 28 days the rest of the year. The other 14 turbines were searched every 28 days yearlong. Because fatalities were not identified to wind turbine address or search interval in which they were found, I took the weighted average of the search intervals, which was 24 days. Hatchet Ridge, California Tetra Tech (2014) surveyed half the 44 2.3-MW wind turbines every 14 days, and the other half every 28 days, but used only the 14-day searches for fatality rate estimation. Tetra Tech argued that it had yet to measure the searchable area around the turbines searched every 28 days. Whether fatality rate estimates were made at the turbines searched every 28 days mattered to raptor impact assessment because after two years 75% of the raptors had been found at the 22 turbines searched every 28 days. Omitting these turbines from fatality rate estimation restricted the estimate to having been derived from a single turkey vulture.

C-16
However, I saw no reason to delay estimation of fatality rates at the turbines searched every 28 days. I used Tetra Tech’s description of high visibility search areas to estimate the average search radius at these turbines using July 2012 imagery in Google Earth. I took 6 distance measurements from the tower base to the nearest vegetation that did not appear to fit Tetra Tech’s definition of high visibility ground (0-40% vegetation cover), and I averaged these distances. The averaged the 6 distance measurements at each turbine, and averaged the averages among all 22 turbines to arrive at 59 m average search radius. It appeared that Tetra Tech searched only the wind turbine pads, and not the pine plantations or shrub patches. The average search radius of 59 m at the turbines searched every 28-days, and the average 63.5 m at the turbines searched every 14 days (actually, the effective interval at these turbines was 61 m, as Tetra Tech reported that on average 7.8% of this search radius was not searchable, and that the unsearchable area was mostly in the outer third portion of the ground within the maximum search radius) were unusually short for 2.3 MW turbines mounted on 80 m towers. Tetra Tech made no adjustment for the proportion of fatalities that must have fallen beyond its search areas. Tetra Tech made some sort of math mistake when estimating bat fatalities. Given the adjustment values that Tetra Tech says were used for search detection error and carcass persistence time, and given the number of bats found, the bat fatality rate was about five times too high. Using mice as surrogates for bat carcasses in carcass persistence and search detection trials was unreliable. Bat carcasses are much harder to detect than mice. Tetra Tech did not report fatalities found at each wind turbine, so I was unable to estimate standard error and confidence ranges associated with the estimates. Additionally, Tetra Tech did not report the fatalities that were found during the clearing searches versus incidentally, and these types of finds were not linked to average search intervals. Tetra Tech’s reporting prevented me from using the incidental finds or clearing search finds in fatality rate estimation. Of the 44 wind turbines searched, half were searched with a 14 day interval and the other half were searched with a 28 day interval. I estimated the fatalities of each species by year and by search interval, and then summed these estimates by year. I integrated the estimates between those derived from the 28 day interval and those based on the 14 day interval splitting the difference for large and medium-sized birds, splitting the difference for bats and small birds when the estimates were greater during the 28-day interval, and otherwise used the estimates from the 7-day intervals for bats and small birds. Altamont Pass I calculated fatality rates by individual turbine and by “bird year,” October 1 to September 30. Fatality rates were calculated only for turbines searched at least 70% of a “bird year.”

C-17
Using installed capacity as a denominator in the fatality metric proved unreliable, as ICF’s data on wind turbine operability grossly misrepresented reality at wind turbine projects with which I am more familiar. For example, the ICF data characterized the Tres Vaqueros project as nearly fully operational in 2006 through 2010, when in reality the average capacity factor was 4-6% in 2006 through 2008, and 0% in 2009 and 2010. Wind turbines at what are now the Sand Hill sites were characterized as nearly twice as operable as they really were in 2012. Using installed capacity also assumed that most of the collision risk was in the moving parts. However, fatality rates remained relatively high where and when wind turbines were shut down, such as during the last two years of monitoring at Tres Vaqueros. Buena Vista The final report for the Buena Vista fatality monitoring project included unusually high fatality rates, even for the Altamont Pass. The following were problems I found with the report. I disagreed with Insignia's decision to exclude incidental carcass finds (p. 12). This practice was inconsistent with the approach used by the Alameda County Monitoring Team and SRC. The practice is prone to abuse, as wind farm technicians can exercise greater vigilance at finding and reporting fatalities, thereby lessening the eventual fatality rate estimate. The searcher detection trials were flawed for using rock pigeons to represent large birds, especially in the case of golden eagle (p. 13). Also, all placed birds were relatively fresh, so could not have represented the way carcasses would look after 15 days or 30 days in the field. Using national averages would have been more representative. It was inappropriate to use mean days to carcass removal (p. 15), because this approach was prone to severe bias (Huso 2010, Smallwood et al. 2013). Insignia reported that the search interval, I, was 30 days (p. 15). However, the interval was 30 days only during the first 270 days. Afterwards, it was 15 days. Scavenger removal rate, R, was not described accurately (p. 16). No method appeared to have been used to estimate the uncertainty range around the fatality rate estimate (p. 16). Insignia reported seasonal searcher detection rates (p. 31), but they used only the 69% detection term representing all birds over all seasons.

C-18
Neither the 20 day nor 60 day removal trial periods corresponded with either of the two average search intervals used during fatality monitoring (p. 32), so both were inappropriate. The raptor fatality rate estimate reported by Insignia was three times higher than what I got (p. 44). Their American kestrel estimate was twice as high as mine, their red-tailed hawk estimate was nearly four times higher than mine, and their golden eagle estimate was more than four times greater than mine. In Table 12, Insignia reported that 8 golden eagles were estimated to have been killed per year. This value was nearly five times more eagles than actually found. Nobody has used such a large expansion factor between found and estimated eagle fatality rates -- not even close. Furthermore, the Shonefeld estimator used by Insignia generates lower estimates of fatality rates than I get when I rely on the Horvitz-Thompson estimator, so Insignia must have made some mistakes. Montezuma I, California For carcass persistence trials, ICF International used carcasses found during routine fatality searches, which would have included many carcasses of unknown time since death. The carcass persistence trial was therefore confounded by variation due to time since death, or due to the level of decay that occurred prior to placement in the trial. The problem was exemplified by the 97% carcasses persistence rate of small birds placed in the trial. A persistence rate this high for small birds would have been highly unlikely had fresh carcasses been used. Also, birds were used as surrogates for bats in searcher detection and carcass persistence trials. I included carcasses found during clearing searches or found incidentally. ICF International excluded incidental finds. Excluding the 5 incidentally found red-tailed hawks especially made little sense because had these hawks remained on site, they most likely would have been found during routine searches. Fatalities were not reported to wind turbine addresses, so I was unable to estimate standard errors for fatality rates by species. Instead, I estimated SE for larger taxonomic groups, which were reported to wind turbine, and then I applied the SE values to constituent species. In the Methods section, ICF noted that some portion of search areas were unsearchable at various times. Unfortunately, ICF neglected to report the proportions of search areas that were unsearchable. I proceeded with my fatality rate estimates assuming that all search areas were searchable, but my assumption was obviously wrong. My estimates were therefore biased low to some unknown degree. ICF reported switching from weekly searches to searches every 14 days at 6 turbines, and maintaining weekly searches at the other 10 turbines. Because fatalities were not reported to turbine address, I could not know which fatalities were found during 14-day intervals. Therefore, I used the weighted average search interval for the entire monitoring study, which was 7.62 days.

C-19
Bird use surveys proved unusable because the metric used was “bird minutes.” This metric was not used in any other monitoring study at wind projects, except for a comparative metric in Smallwood and Thelander (2004). The trouble with bird minutes is that a bird perched during the entire observation session will get more weight than a bird that briefly flew through the observation plot at rotor height. In other words, a bird perched during a 30 min session will be recorded as 30, whereas an eagle flying through in a hazardous manner (i.e., vulnerable to wind turbine collision) might be recorded as 1 or 2. Giving the perched bird more activity weight than the flying eagle makes little sense. Montezuma II H. T. Harvey & Associates used carcasses found during routine monitoring for placement in carcass persistence trials. They tried to restrict use of these carcasses to those estimated to have died only 1-2 days earlier, but aging of carcasses can be highly uncertain. Some of the estimates were suspicious, such as the Mexican free-tailed bat fatality rate of 0.73/MW/Yr. Only one of these bats was found at a searched turbine, so I cannot see how one bat could translate to an average of 0.73 fatalities/MW/Yr. My estimate was 0.14 Mexican free-tailed bat fatalities/MW/Yr. Similarly, H. T. Harvey estimated only 0.09 American kestrel fatalities/MW/Yr, but I estimated 0.52 kestrel fatalities/MW/Yr. Four American kestrel fatalities were found at searched turbines, so I could not figure out how H. T. Harvey estimated such a low fatality rate. H. T. Harvey’s estimate of Mexican free-tailed bat fatality rate was 8 times higher than its estimate of the American kestrel fatality rate, even though only 1 Mexican free-tailed bat fatality but 4 American kestrel fatalities contributed to the estimates. Summerview, Alberta Surveys extended only to 70 m, and even to only 40 m in late summer due to tall crops. I made no adjustment for the shorter search radius. Transects were spaced 20 m apart, which was the widest spacing I can recollect seeing at a wind project. I therefore introduced an adjustment factor of 0.333 for bats and small birds, and 0.6 for large birds. My adjustment was intended to account for this study’s deviation from the conventional transect spacing being about a third of that used at Summerview. I arbitrarily applied a smaller adjustment (0.6) for large birds because in my experience the searchers can see them from 8 to 10 m most of the time. Fatalities were not reported to wind turbine addresses, so I could not estimate SE from the raw data. Also, fatalities were reported to search interval only in bar graphs. I measured the bars in the graph depicting the seasonal distribution of bat fatalities, so that I could assign bats to the 3.5 versus 7 day search intervals. The bar graph depicting bird fatalities by season was more

C-20
crudely presented and difficult to interpret, so I applied a weighted average search interval for birds. The searcher detection and carcass persistence trials yielded unusual results. Searcher detection was unusually high, even for bats. Carcass persistence was also very high. Only one of each trial was performed, and searchers were aware of the detection trial. As a check of whether the trials at Summerview were adequate, one can compare the reported fatality rate estimate of 10.27 bats/MW/Yr to the 532 bats found. The estimated fatality rate of 10.27 bats/MW/Yr translates to 721 bats killed during the year, project-wide. This number would be only 35.5% larger than the number of bats actually found. Given the 20-m transect spacing, the 70-m maximum search radius, and the poor ground visibility in agricultural crops, finding nearly as many bats as the number estimated to have been killed was not credible. Pigeon Creek, Illinois A single wind turbine was searched out to 27.5 m on the gravel pad from mid-June through September of 2010 and 2011. The reported fatality rates were much lower than mine because DeWitt (2011) made no adjustment for search radius bias. Also, her detection trials were a bit optimistic, but were based on methods that were insufficiently described in the report. No species of placed birds or bats were provided, nor were sources identified. Silver Sage, WY The monitoring period lasted only <4.5 months, but the authors presented the bird fatalities as if they were annual estimates (i.e., they compared their estimates to annual estimates in other studies). The detection trial was also questionable because they used decoys in place of real birds in some cases. Also, they used rock pigeons in carcass persistence trials. Rock pigeons tend to last longer at placement sites compared to other birds of similar size, because rock pigeons readily shed feathers in place. The authors also made no adjustment for their short search radius. Happy Jack, WY Performed only 8 searches over 2 years, with the first search of each migratory season performed two weeks after a clearing search (finds were not counted in clearing searches) and a second search per season performed a month after the first search. Carcass persistence and searcher detection trials involved puny sample sizes, and so were unreliable. Tehachapi Pass, CA Anderson et al. (2004) randomly selected 201 circular plots from the areas where 95% (n = 3,269) of the WRA’s documented turbines occurred. The plots were 50 m in radius, and included from 1 to 11 turbines each, totaling 637 turbines. They covered 14% of each turbine field (i.e., West

C-21
Ridge, Middle Ridge, and East Slope) because their random selection was stratified by turbine field, tower type (i.e., small lattice tower, small tubular tower, large lattice tower, large tubular tower, vertical axis turbine, and wind wall, which were composed of small lattice towers), and turbine position within a row (i.e., end of row, row interior, or scattered turbines outside of rows). Although Anderson et al. (2004) neglected to report the exact number of turbines or MW of rated capacity in each plot, they did identify the number of plots directed toward each turbine model within each turbine field, and the number of each turbine model comprising the turbine field. Multiplying the numbers of each turbine model by the rated capacity of each turbine model, I was able to calculate the MW of rated capacity that comprised the entirety of each turbine field and the portion that was monitored for fatalities. I was then able to estimate the rated capacity sampled by the average plot because Anderson et al. (2004) reported the percentage of the area that was sampled, so I assumed the sampled area corresponded with the sampled capacity in the wind turbines. I calculated and used the average rated capacity as the sum MW sampled divided by the number of wind turbines sampled. I used 1.25 years in the fatality rate calculations because Anderson et al. (2004) reportedly surveyed each plot 4-5 times each at 90 day intervals, and because I assumed the first survey would have detected carcasses deposited over the preceding 90 days. I selected fatality records that were detected during standard fatality searches and which I classified cause of death as possibly, probably, or certainly caused by wind turbine collision. Anderson et al. (2004) had attributed the nearest human-made structure as the likely cause of death, including buildings, transmission lines, distribution lines, meteorological towers, and roads. I classified fatalities as possibly caused by wind turbines if the fatality was located within 50 m of a wind turbine but the evidence suggested another cause of death was likely. They were classified as probable if within 50 m of a turbine and no other cause of death was suggested by the evidence, and they were certain if the body was sheared or other direct evidence indicated a collision occurred. Anderson et al. (2004) reportedly found 1 bat and 126 bird fatalities during the 1.25-year study. They reported finding 75 of these fatalities on search plots near wind turbines. My interpretation of the data in their Tables and Appendix B indicated 30 were found outside search plots, but I ended up excluding others from fatality rate estimation because they likely died of causes other than wind turbine collision or they were found incidentally rather than during fatality searches. Anderson et al. (2004) apparently excluded some fatalities because they were closer to other structures than to wind turbines, such as to electric distribution lines, transmission line, meteorological towers, or access roads. I included these fatalities unless burn marks indicated electrocution (n = 2) or field personnel witnessed a bird struck by a car (n = 1) or hitting a meteorological tower guy wire (n = 1). For fatality rate estimation, I relied on 97 fatalities found within plots and determined to at least possibly have been caused by wind turbine collision.

C-22
San Gorgonio Pass, CA The design and analysis of the fatality monitoring study at San Gorgonio WRA differed considerably from most other fatality monitoring studies at WRAs (Anderson et al. 2005). Normally, the turbine or turbine row is considered the study unit, around which a search radius is established to detect fatalities. The search radius is typically adjusted to accommodate turbine size, because larger turbines can throw birds and bats farther from the tower base. However, Anderson et al. considered circular plots to be the study unit, although the plot center corresponded with a turbine location (except for 40 plots away from wind turbines, and which I did not include in this analysis). Rather than adjusting plot size (i.e., search radius) with turbine size, Anderson et al. simply included fewer large turbines and more small turbines within the fixed plot size, depending on which turbine field the plot happened to be located. Furthermore, Anderson et al. (2005) presented fatality rates as deaths/survey, whereas fatality rates are conventionally presented as deaths/turbine/year or deaths/MW/year. This fatality rate metric was not comparable to other fatality rates, which is a problem addressed herein. In Phase I of the study, Anderson et al. (2005) randomly selected 138 circular plots from the areas where 85% (n = 2,839) of the WRA’s documented 3,340 turbines occurred. The plots were 50 m in radius, and included various numbers of turbines in each, totaling 423turbines. They covered 12% of each turbine field (i.e., high, medium, and low elevation areas, and water) because their random selection was stratified by turbine field, tower type (i.e., small lattice tower, small tubular tower, large tubular tower). Although Anderson et al. (2005) neglected to report the exact number of turbines or MW of rated capacity in each plot, they did identify the number of plots directed toward each turbine model within each turbine field, and the number of each turbine model comprising the turbine field. Multiplying the numbers of each turbine model by the rated capacity of each turbine model, I was able to calculate the MW of rated capacity that comprised the entirety of each turbine field and the portion that was monitored for fatalities. I was then able to estimate the rated capacity sampled by the average plot because Anderson et al. (2005) reported the percentage of the area that was sampled, so I assumed the sampled area corresponded with the sampled capacity in the wind turbines. I calculated and used the average rated capacity as the sum MW sampled divided by the number of wind turbines sampled. I used 1.5 years in the fatality rate calculations because Anderson et al. (2005) reportedly surveyed each plot at 90 day intervals over 1.25 years, and because I assumed the first survey would have detected carcasses deposited over the preceding 90 days. I selected fatality records that were detected during standard fatality searches and which I classified cause of death as possibly, probably, or certainly caused by wind turbine collision. Anderson et al. (2005) had attributed the nearest human-made structure as the likely cause of death, including buildings, transmission lines, distribution lines, meteorological towers, and roads. I classified fatalities as possibly caused by wind turbines if the fatality was located within 50 m of a wind turbine but the evidence suggested another cause of death was likely. They were classified as probable if within 50 m of a turbine and no other cause of death was

C-23
suggested by the evidence, and they were certain if the body was sheared or other direct evidence indicated a collision occurred.
D-1
APPENDIX D: Notes on use rate estimates from data presented in reports of monitoring at wind energy projects across North America Combine Hills Post-construction point-count surveys were performed to compare to pre-construction surveys, but I did not use them for two main reasons. First, only two surveys were performed after construction at each station, so the sample size was too small. Second, the maximum survey radius was 100 m in the pre-construction surveys (Young et al. 2003), but 150 m in the post-construction surveys (Young et al. 2006). Two types of survey were performed. Point counts, paired between proposed wind turbine sites and 30 m away from the turbine sites, were performed for 10 min and out to 100 m. All birds were counted. Raptor use surveys were performed at proposed wind turbine sites for 30 min and out to 800 m, and all birds were counted. The raptor use surveys were performed throughout a year, whereas the paired point counts were done only in April-June and September-October. Wolfe Island Raptor surveys and waterfowl surveys were performed before and after wind farm construction to quantify displacement effects, but I did not use the reported utilization rates because the methods were not comparable to those used at other projects. Also, the displacement study was flawed due to the absence of any control plots. The changes in detection rates could have been due to inter-annual variation in use rates having nothing to do with the wind turbines. Alta Oaks Erickson et al. (2009) did not report the data, so I could not use the results in the report. However, Erickson and Chatfield (2009) reported the all bird and all raptor use rates, as well as use rates for a few species. I collected these data for use in my analysis. Jersey Atlantic No maximum survey distance was reported, and surveys lasted only from August to early October. I did not use these data. Klondike III

D-2
Gritski et al. (2009) did not report their maximum survey radius. Few other methodological details were reported. Spruce Mountain, Maine Tetra Tech (2013) neglected to report the maximum survey radius. Few other methodological details were reported. Dokie, British Columbia Pomeroy et al. (2008) did not describe their methods, so I could not use the utilization rates reported.

E-1
APPENDIX E: Carcass persistence rates reported from trials performed across North America
302520151050
100
90
80
70
60
50
40
30
20
10
0
Solano in JuneSolano in November
Altamont in NovemberAltamont in June
Carcasses remaining (%)
Days into trial
Howell & Noone 1992RaptorsRehab centersFrozenAt turbinesAnnual grass1991
302520151050
100
90
80
70
60
50
40
30
20
10
0
Howell & DiDonato 1991Plucked game hensAssumed from storeAssumed frozenAt turbinesAnnual grassNOV 1988
302520151050
100
80
60
40
20
0
Small-sized in springMedium-sized in springLarge-sized in spring
Spring 1989Summer 1990Fall 1989Winter 1990
Raptors 1989
Birds, including raptors
Orloff & Flannery 1992AltamontRehab centers &
windfarmAssumed frozenAt turbinesAnnual grass
Trial139140141142
Trial1
Trial2345678
302520151050
100
90
80
70
60
50
40
30
20
10
0605550454035 65
Small birds, fall 2005
Small birds, winter 2006
Medium birds, fall 2005
Medium birds,winter 2006
Large raptors,winter 2006
WEST, Inc. 2006Altamont (annual grass)Turbine kills (raptors)Commercial (other birds)Frozen (other birds)At turbines
Trial9
10111213
302520151050
100
90
80
70
60
50
40
30
20
10
0
Large raptors
Small birds
Smallwood et al. 2010Altamont2007Rehab centersFrozenAt turbinesAnnual grass
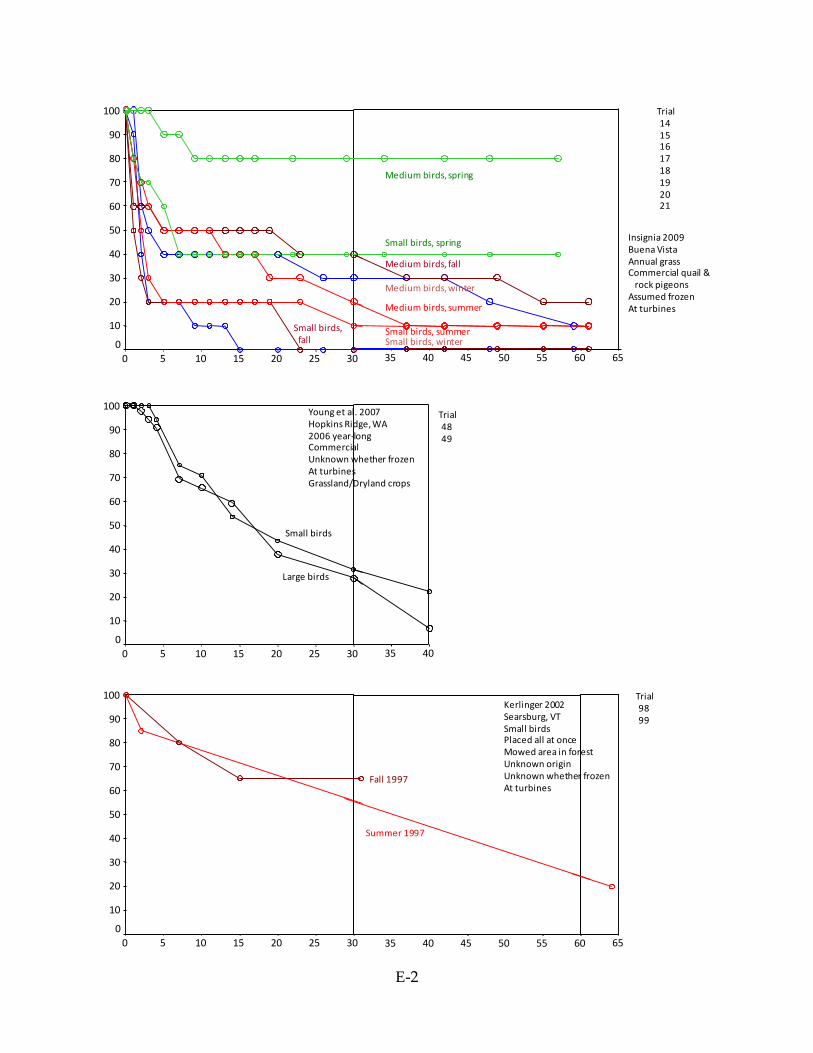
E-2
605550454035 65302520151050
100
90
80
70
60
50
40
30
20
10
0
Trial1415161718192021
Insignia 2009Buena VistaAnnual grassCommercial quail &
rock pigeonsAssumed frozenAt turbines
Medium birds, spring
Small birds, spring
Medium birds, fall
Medium birds, winter
Medium birds, summer
Small birds, summerSmall birds, fall Small birds, winter
4035302520151050
100
90
80
70
60
50
40
30
20
10
0
Small birds
Large birds
Trial4849
Young et al. 2007Hopkins Ridge, WA2006 year-longCommercialUnknown whether frozenAt turbinesGrassland/Dryland crops
302520151050
100
90
80
70
60
50
40
30
20
10
0605550454035 65
Kerlinger 2002Searsburg, VTSmall birdsPlaced all at onceMowed area in forestUnknown originUnknown whether frozenAt turbines
Trial9899
Fall 1997
Summer 1997

E-3
302520151050
100
90
80
70
60
50
40
30
20
10
0
WinterSmall birdsMedium birds
FallSmall birdsMedium birds
Trial2223242526272829
Tierney 2007Buffalo Gap, TXAss. commercial (quail)FrozenAt turbinesOpen ground undertree/shrub canopies2007
302520151050
100
90
80
70
60
50
40
30
20
10
0
Trial4243
Osborn et al. 2000Buffalo Ridge, MNSmall birdsUnknown originUnknown whether frozenAt turbinesCRP and crops
June 1994
July 1995
302520151050
100
90
80
70
60
50
40
30
20
10
0
Trial44454647
URS 2010Goodnoe Hills, OR2009Birds (quail, European
starlings, ring-neckedpheasants
CommercialDispatched onsiteAt turbinesShrub-steppePlaced to be hidden
SpringSummerFallWinter
302520151050
100
90
80
70
60
50
40
30
20
10
0
Trial50
Howe et al. 20022001 springKewuanee County, WISmall birdsMuseumFrozenAt turbinesLow vegetation
302520151050
100
90
80
70
60
50
40
30
20
10
0
Small birds
Large birds
Trial5354
Johnson et al. 20032001 year-long estimateKlondike I, ORUnknown originUnknown whether frozenAway from turbinesGrassland & shrub-steppe
302520151050
100
90
80
70
60
50
40
30
20
10
0
Small birds
Large birds
Trial9091
Erickson et al. 20032004 year-long estimateNine Canyon, WAUnknown originUnknown whether frozenAway from turbinesWheat & grassland

E-4
302520151050
100
90
80
70
60
50
40
30
20
10
0
Trial41
Johnson et al. 2003aBuffalo Ridge, MNBatsFall 1998Fresh turbine killsUnknown whether frozenAt turbinesGrain crops, pasture,
grassland
302520151050
100
90
80
70
60
50
40
30
20
10
0
Trial929394
Jain et al. 2009Noble Bliss, NY2008 year-long estimatesUnknown originFrozenAt turbinesOpen crops and pasture
Bats and house miceMedium birdsSmall birds
302520151050
100
90
80
70
60
50
40
30
20
10
0
Trial959697
Jain et al. 2009Noble Clinton, NY2008 year-long estimatesUnknown originFrozenAt turbinesPasture, open, bare
Bats and house miceMedium birdsSmall birds
302520151050
100
90
80
70
60
50
40
30
20
10
0
Trial100
Howe and Atwater 1999Shirley, WI1998Small birds (Ovenbird)Unknown originUnknown whether frozenAway from turbinesLow vegetation
302520151050
100
90
80
70
60
50
40
30
20
10
0
Trial101
URS 2005SMUD, Solano Co., CA2004Mixed species groupSacramento AirportFrozenAt turbinesLow vegetation
302520151050
100
90
80
70
60
50
40
30
20
10
0
Trial133134135
Stantec Consulting 2010Wolfe Island, ON2009Commercial chicksUnknown whether frozenAt turbinesGravel, hay, cropped, disked

E-5
302520151050
100
90
80
70
60
50
40
30
20
10
04035
302520151050
100
90
80
70
60
50
40
30
20
10
04035
4035302520151050
100
90
80
70
60
50
40
30
20
10
0
Trial102103104105
Erickson et al. 2004Stateline, WA2001Unknown originUnknown whether frozenAway from turbinesWheat, bunchgrass
Trial106107108109110111112113114115
Trial116117118119120121122123
Erickson et al. 2004Stateline, WA2002Unknown originUnknown whether frozenAway from turbinesWheat, bunchgrass
Erickson et al. 2004Stateline, WA2003Unknown originUnknown whether frozenAway from turbinesWheat, bunchgrass
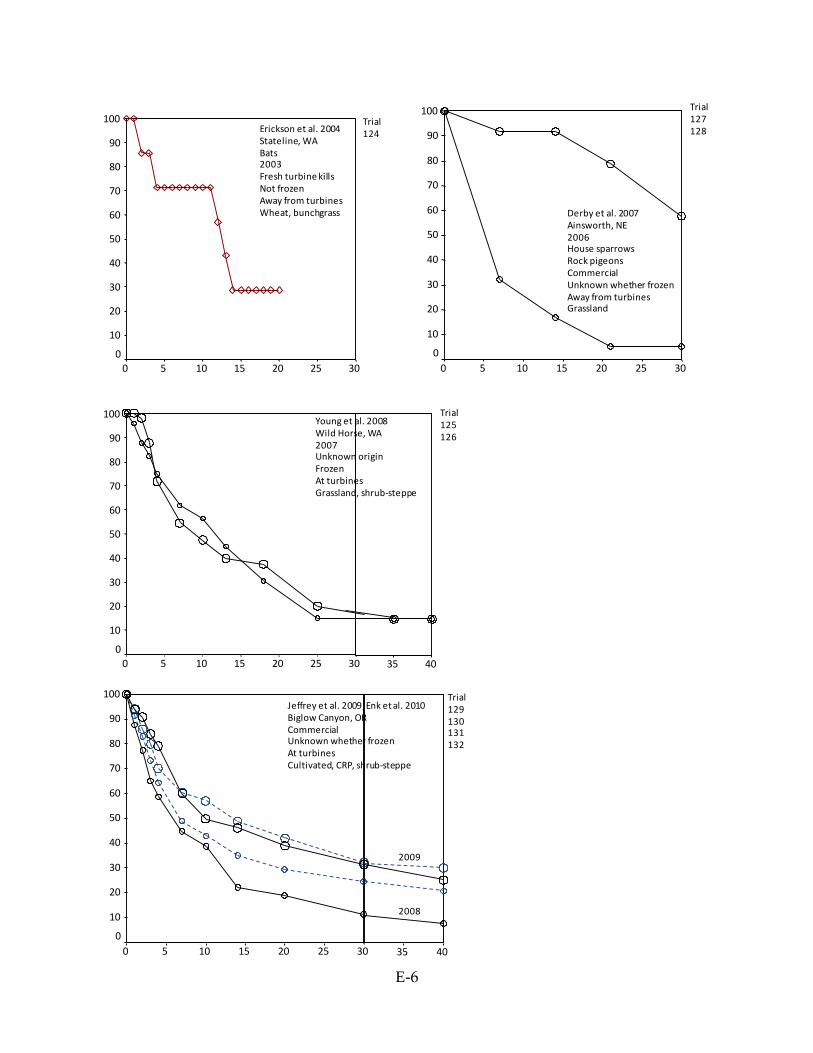
E-6
302520151050
100
90
80
70
60
50
40
30
20
10
0
Trial124Erickson et al. 2004
Stateline, WABats2003Fresh turbine killsNot frozenAway from turbinesWheat, bunchgrass
302520151050
100
90
80
70
60
50
40
30
20
10
04035
Trial125126
Young et al. 2008Wild Horse, WA2007Unknown originFrozenAt turbinesGrassland, shrub-steppe
302520151050
100
90
80
70
60
50
40
30
20
10
0
Trial127128
Derby et al. 2007Ainsworth, NE2006House sparrowsRock pigeonsCommercialUnknown whether frozenAway from turbinesGrassland
302520151050
100
90
80
70
60
50
40
30
20
10
04035
2009
2008
Trial129130131132
Jeffrey et al. 2009, Enk et al. 2010Biglow Canyon, ORCommercialUnknown whether frozenAt turbinesCultivated, CRP, shrub-steppe

E-7
302520151050
100
90
80
70
60
50
40
30
20
10
0
Trial143144
4035
Enz and Bay 2010Windy Point, WA2009Commercial originUnknown if frozenAt turbinesGrassland, shrub-steppe

F-1
APPENDIX F: Estimates of fatalities per MW per year and total annual fatalities in the APWRA
A1: Estimates of fatalities per MW per year and total annual fatalities of American kestrel and burrowing owl at 40 KW wind turbines in the APWRA, where dotted lines denote 80% confidence limits and red line denotes mean fatality rates at the turbines the SRC rated 8-10 for collision hazard
2000 2002 2004 2006 2008 2010 2012 2014-4-2
2468
101214161820222426
0
2000 2002 2004 2006 2008 2010 2012 2014
5
10
15
20
25
30
35
0
Fatalities/MW/Yr (adj) at 40 KW turbines Fatalities/Yr (adj) at 40 KW turbines
Americankestrel
Year
2000 2002 2004 2006 2008 2010 2012 2014
20
40
60
80
100
0
Year
2000 2002 2004 2006 2008 2010 2012 2014
20
40
60
80
100
120
140
160
0
Burrowing owl

F-2
A2: Estimates of fatalities per MW per year and total annual fatalities of red-tailed hawk and golden eagle at 40 KW wind turbines in the Altamont Pass WRA
Year
2000 2002 2004 2006 2008 2010 2012 2014-0.1
0.1
0.2
0.3
0.4
0.5
0.6
0.7
0
2000 2002 2004 2006 2008 2010 2012 2014
2
4
6
8
10
12
14
0
2000 2002 2004 2006 2008 2010 2012 2014
2
4
6
8
10
12
14
16
18
0
Year
2000 2002 2004 2006 2008 2010 2012 2014-1
1
2
3
4
5
0
Red-tailed hawk
Golden eagle
Fatalities/MW/Yr (adj) at 40 KW turbines Fatalities/Yr (adj) at 40 KW turbines
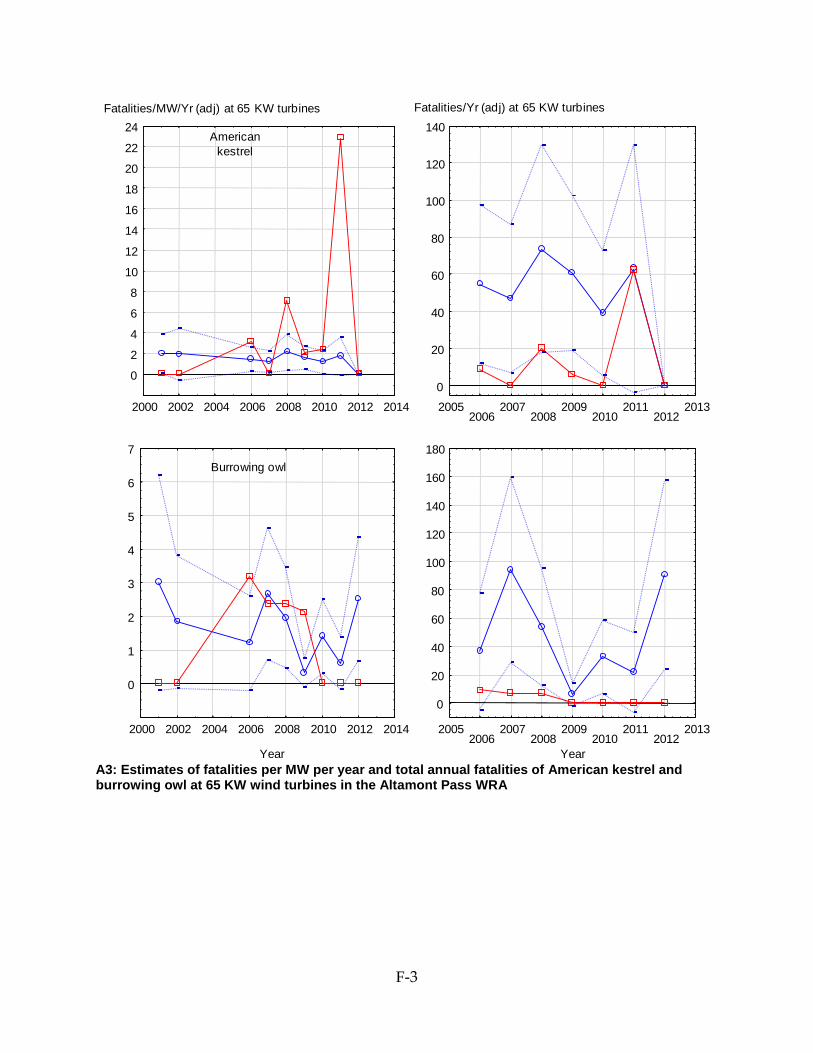
F-3
A3: Estimates of fatalities per MW per year and total annual fatalities of American kestrel and burrowing owl at 65 KW wind turbines in the Altamont Pass WRA
2000 2002 2004 2006 2008 2010 2012 2014
2
4
6
8
10
12
14
16
18
20
22
24
0
Year
2000 2002 2004 2006 2008 2010 2012 2014
1
2
3
4
5
6
7
0
Fatalities/MW/Yr (adj) at 65 KW turbines Fatalities/Yr (adj) at 65 KW turbines
Americankestrel
Burrowing owl
20052006
20072008
20092010
20112012
2013
20
40
60
80
100
120
140
0
Year
20052006
20072008
20092010
20112012
2013
20
40
60
80
100
120
140
160
180
0

F-4
A4: Estimates of fatalities per MW per year and total annual fatalities of red-tailed hawk and golden eagle at 65 KW wind turbines in the Altamont Pass WRA
2000 2002 2004 2006 2008 2010 2012 2014
1
2
3
4
5
6
0
Year
2000 2002 2004 2006 2008 2010 2012 2014
0.1
0.2
0.3
0.4
0.5
0
Fatalities/MW/Yr (adj) at 65 KW turbines Fatalities/Yr (adj) at 65 KW turbines
Red-tailed hawk
Golden eagle
2005 2006 2007 2008 2009 2010 2011 2012 2013
10
20
30
40
50
0
Year
2005 2006 2007 2008 2009 2010 2011 2012 2013
1
2
3
4
5
6
7
8
9
0
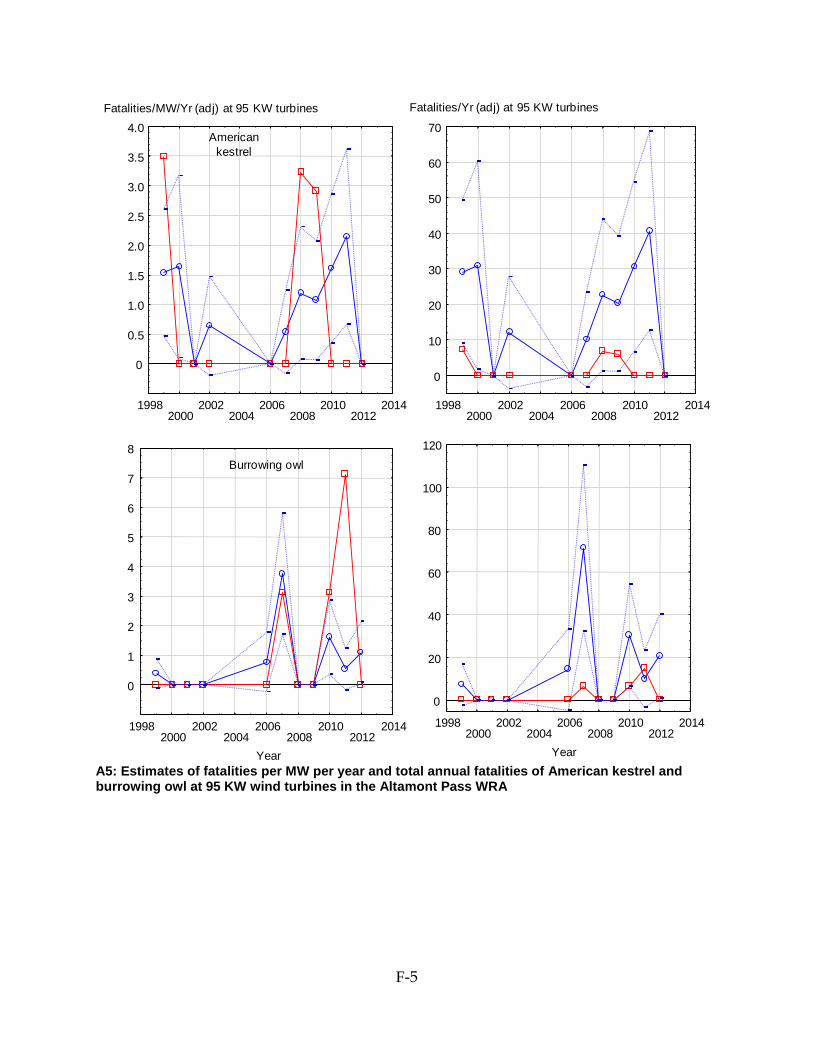
F-5
A5: Estimates of fatalities per MW per year and total annual fatalities of American kestrel and burrowing owl at 95 KW wind turbines in the Altamont Pass WRA
Fatalities/MW/Yr (adj) at 95 KW turbines Fatalities/Yr (adj) at 95 KW turbines
Year
19982000
20022004
20062008
20102012
2014
1
2
3
4
5
6
7
8
0
Year
19982000
20022004
20062008
20102012
2014
20
40
60
80
100
120
0
19982000
20022004
20062008
20102012
2014
0.5
1.0
1.5
2.0
2.5
3.0
3.5
4.0
0
19982000
20022004
20062008
20102012
2014
10
20
30
40
50
60
70
0
Americankestrel
Burrowing owl
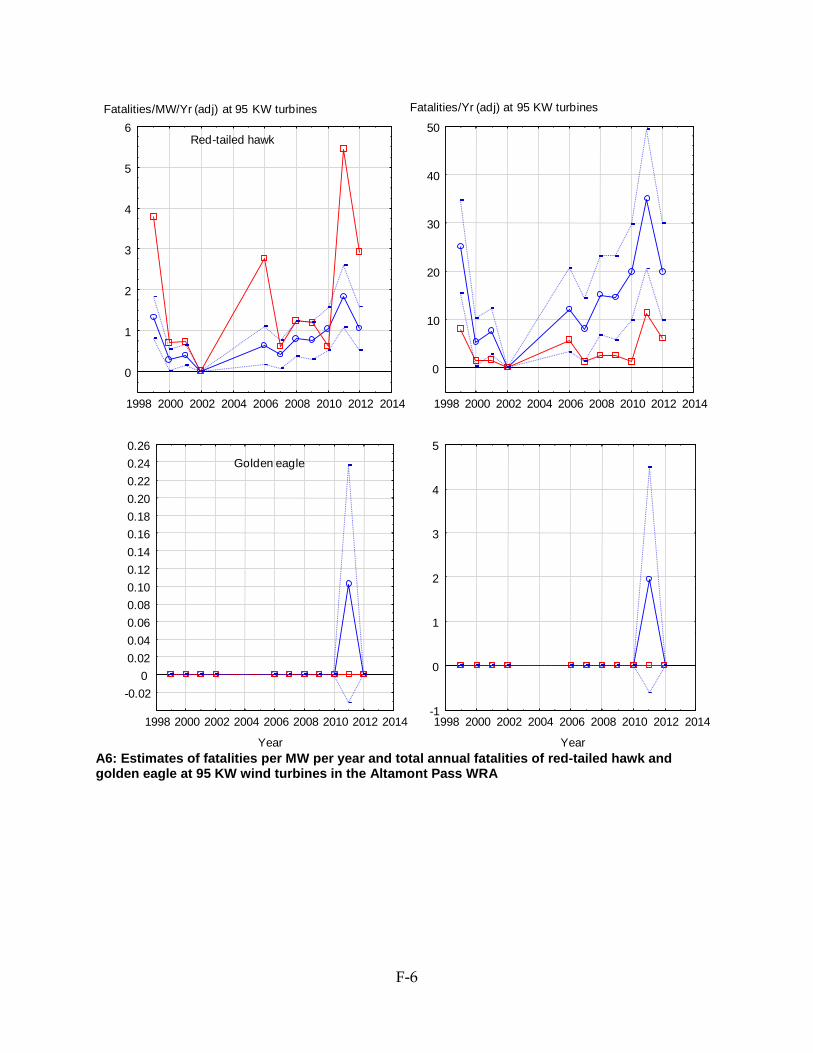
F-6
A6: Estimates of fatalities per MW per year and total annual fatalities of red-tailed hawk and golden eagle at 95 KW wind turbines in the Altamont Pass WRA
Year
1998 2000 2002 2004 2006 2008 2010 2012 2014
-0.02
0.020.040.060.080.100.120.140.160.180.200.220.240.26
0
Year
1998 2000 2002 2004 2006 2008 2010 2012 2014-1
1
2
3
4
5
0
Fatalities/MW/Yr (adj) at 95 KW turbines Fatalities/Yr (adj) at 95 KW turbines
1998 2000 2002 2004 2006 2008 2010 2012 2014
1
2
3
4
5
6
0
1998 2000 2002 2004 2006 2008 2010 2012 2014
10
20
30
40
50
0
Red-tailed hawk
Golden eagle

F-7
A7: Estimates of fatalities per MW per year and total annual fatalities of American kestrel and burrowing owl at 100 KW wind turbines in the Altamont Pass WRA
Year
19982000
20022004
20062008
20102012
2014
0.5
1.0
1.5
2.0
2.5
3.0
0
19982000
20022004
20062008
20102012
2014
2
4
6
8
10
12
14
0
Fatalities/MW/Yr (adj) at 100 KW turbines Fatalities/Yr (adj) at 100 KW turbines
Americankestrel
Burrowing owl
2005 2006 2007 2008 2009 2010 2011 2012 2013
100
200
300
400
500
600
700
800
900
0
Year
2005 2006 2007 2008 2009 2010 2011 2012 2013
100
200
300
400
500
600
700
800
900
0
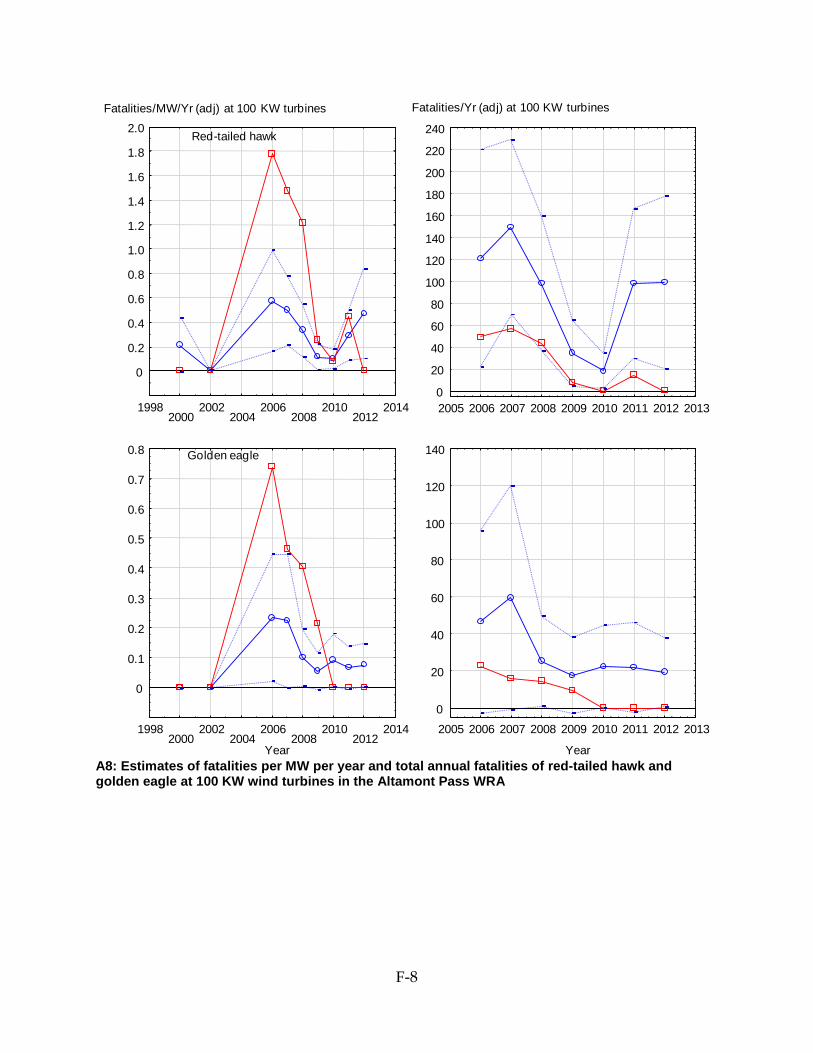
F-8
A8: Estimates of fatalities per MW per year and total annual fatalities of red-tailed hawk and golden eagle at 100 KW wind turbines in the Altamont Pass WRA
19982000
20022004
20062008
20102012
2014
0.2
0.4
0.6
0.8
1.0
1.2
1.4
1.6
1.8
2.0
0
Year
19982000
20022004
20062008
20102012
2014
0.1
0.2
0.3
0.4
0.5
0.6
0.7
0.8
0
Fatalities/MW/Yr (adj) at 100 KW turbines Fatalities/Yr (adj) at 100 KW turbines
Red-tailed hawk
Golden eagle
2005 2006 2007 2008 2009 2010 2011 2012 2013
20
40
60
80
100
120
140
160
180
200
220
240
0
Year
2005 2006 2007 2008 2009 2010 2011 2012 2013
20
40
60
80
100
120
140
0

F-9
A9: Estimates of fatalities per MW per year and total annual fatalities of American kestrel and burrowing owl at 120 KW wind turbines in the Altamont Pass WRA
Year
1998 2000 2002 2004 2006 2008 2010 20122014
2
4
6
8
10
12
14
16
0
Year
1998 2000 2002 2004 2006 2008 2010 2012 2014
20
40
60
80
100
120
140
160
180
200
220
0
1998 2000 2002 2004 2006 2008 2010 2012 2014-0.5
0.5
1.0
1.5
2.0
2.5
0
1998 2000 2002 2004 2006 2008 2010 2012 2014-10
10
20
30
40
50
60
70
0
Fatalities/MW/Yr (adj) at 120 KW turbines Fatalities/Yr (adj) at 120 KW turbines
Americankestrel
Burrowing owl

F-10
A10: Estimates of fatalities per MW per year and total annual fatalities of red-tailed hawk and golden eagle at 120 KW wind turbines in the Altamont Pass WRA
Year
1998 2000 2002 2004 2006 2008 2010 2012 2014
0.2
0.4
0.6
0.8
1.0
1.2
1.4
1.6
0
Year
1998 2000 2002 2004 2006 2008 2010 2012 2014
2
4
6
8
10
12
0
1998 2000 2002 2004 2006 2008 2010 2012 2014
1
2
3
4
5
0
1998 2000 2002 2004 2006 2008 2010 2012 2014
10
20
30
40
50
60
70
0
Fatalities/MW/Yr (adj) at 120 KW turbines Fatalities/Yr (adj) at 120 KW turbines
Red-tailed hawk
Golden eagle

F-11
A11: Estimates of fatalities per MW per year and total annual fatalities of American kestrel and burrowing owl at 150 KW wind turbines in the Altamont Pass WRA
1998 2000 2002 2004 2006 2008 2010 2012 2014
0.5
1.0
1.5
2.0
2.5
3.0
3.5
0
1998 2000 2002 2004 2006 2008 2010 2012 2014
5
10
15
20
25
0
Year
1998 2000 2002 2004 2006 2008 2010 2012 2014
1
2
3
4
5
6
7
8
0
Year
1998 2000 2002 2004 2006 2008 2010 2012 2014
20
40
60
80
100
120
0
Fatalities/MW/Yr (adj) at 150 KW turbines Fatalities/Yr (adj) at 150 KW turbines
Americankestrel
Burrowing owl
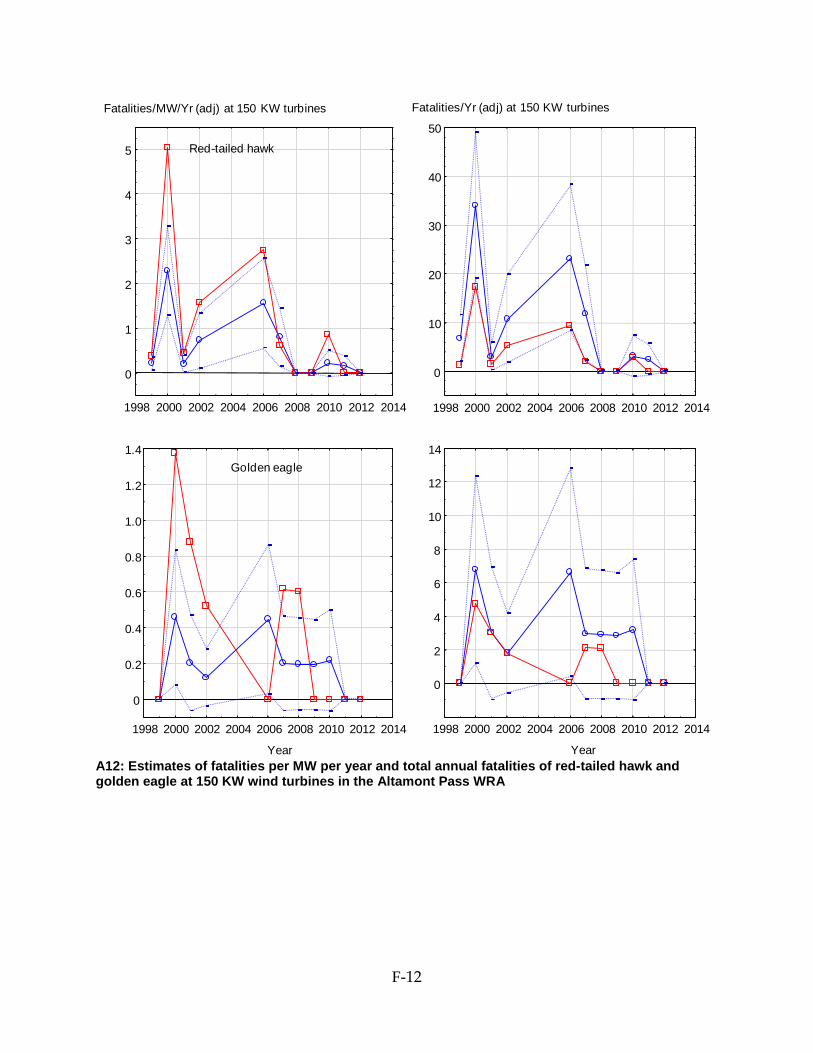
F-12
A12: Estimates of fatalities per MW per year and total annual fatalities of red-tailed hawk and golden eagle at 150 KW wind turbines in the Altamont Pass WRA
1998 2000 2002 2004 2006 2008 2010 2012 2014
1
2
3
4
5
0
1998 2000 2002 2004 2006 2008 2010 2012 2014
10
20
30
40
50
0
Year
1998 2000 2002 2004 2006 2008 2010 2012 2014
2
4
6
8
10
12
14
0
Year
1998 2000 2002 2004 2006 2008 2010 2012 2014
0.2
0.4
0.6
0.8
1.0
1.2
1.4
0
Fatalities/MW/Yr (adj) at 150 KW turbines Fatalities/Yr (adj) at 150 KW turbines
Red-tailed hawk
Golden eagle
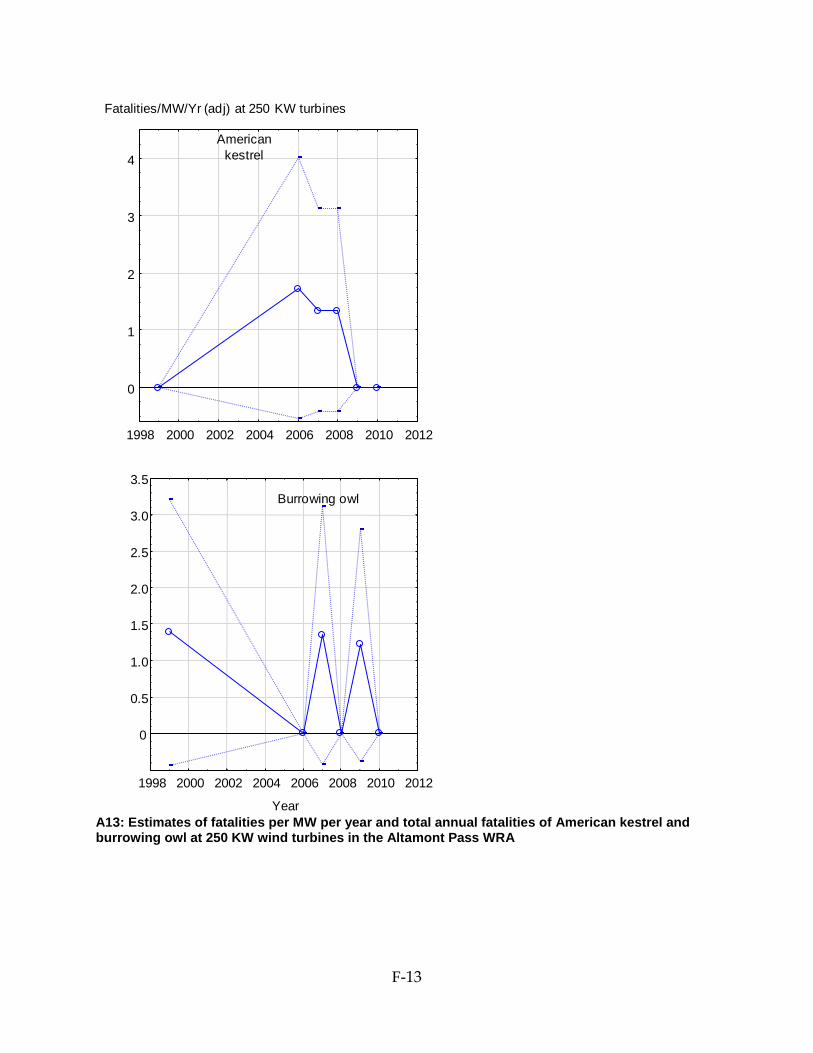
F-13
A13: Estimates of fatalities per MW per year and total annual fatalities of American kestrel and burrowing owl at 250 KW wind turbines in the Altamont Pass WRA
1998 2000 2002 2004 2006 2008 2010 2012
1
2
3
4
0
Year
1998 2000 2002 2004 2006 2008 2010 2012
0.5
1.0
1.5
2.0
2.5
3.0
3.5
0
Fatalities/MW/Yr (adj) at 250 KW turbines
Americankestrel
Burrowing owl

F-14
A14: Estimates of fatalities per MW per year and total annual fatalities of red-tailed hawk and golden eagle at 250 KW wind turbines in the Altamont Pass WRA
Year
1998 2000 2002 2004 2006 2008 2010 2012
-0.2
0.2
0.4
0.6
0.8
1.0
1.2
1.4
1.6
1.8
2.0
0
1998 2000 2002 2004 2006 2008 2010 2012
-0.2
0.2
0.4
0.6
0.8
1.0
1.2
1.4
1.6
1.8
2.0
0
Fatalities/MW/Yr (adj) at 250 KW turbines
Red-tailed hawk
Golden eagle
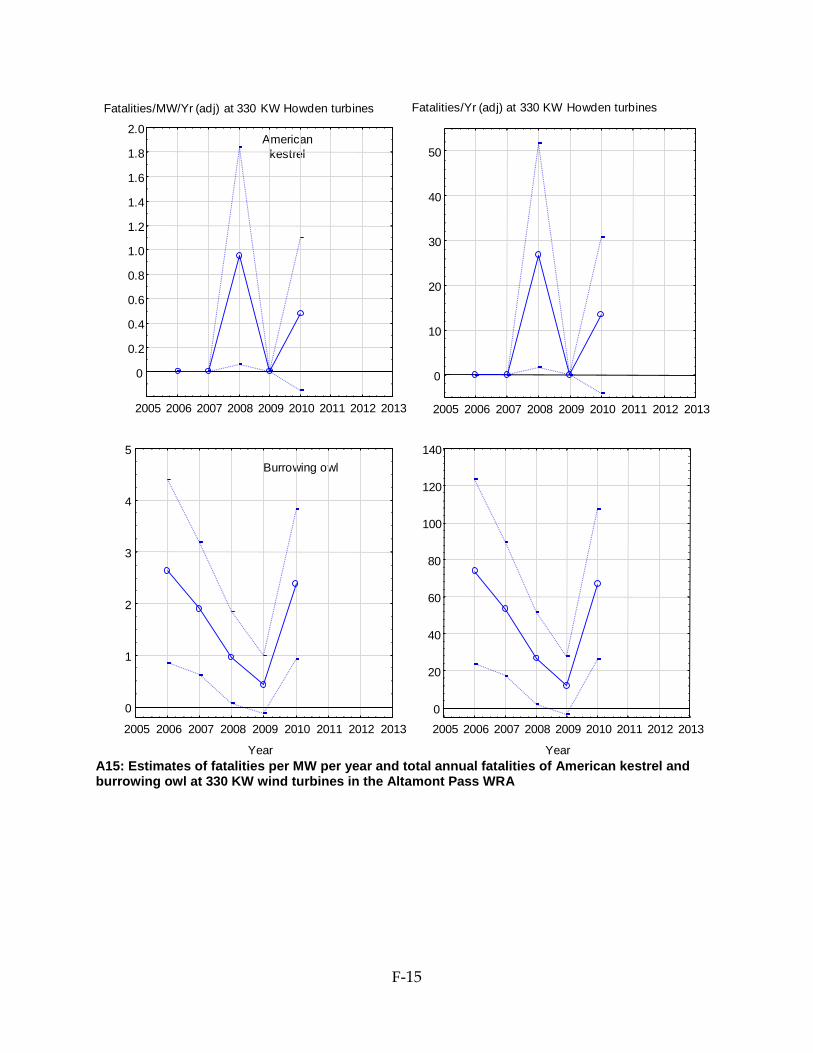
F-15
A15: Estimates of fatalities per MW per year and total annual fatalities of American kestrel and burrowing owl at 330 KW wind turbines in the Altamont Pass WRA
Fatalities/MW/Yr (adj) at 330 KW Howden turbines Fatalities/Yr (adj) at 330 KW Howden turbines
Americankestrel
Burrowing owl
2005 2006 2007 2008 2009 2010 2011 2012 2013
0.2
0.4
0.6
0.8
1.0
1.2
1.4
1.6
1.8
2.0
0
2005 2006 2007 2008 2009 2010 2011 2012 2013
10
20
30
40
50
0
Year
2005 2006 2007 2008 2009 2010 2011 2012 2013
1
2
3
4
5
0
Year
2005 2006 2007 2008 2009 2010 2011 2012 2013
20
40
60
80
100
120
140
0

F-16
A16: Estimates of fatalities per MW per year and total annual fatalities of red-tailed hawk and golden eagle at 330 KW wind turbines in the Altamont Pass WRA
2005 2006 2007 2008 2009 2010 2011 2012 2013
0.05
0.10
0.15
0.20
0.25
0.30
0.35
0.40
0.45
0
2005 2006 2007 2008 2009 2010 2011 2012 2013
2
4
6
8
10
12
0
Year
2005 2006 2007 2008 2009 2010 2011 2012 2013
0.05
0.10
0.15
0.20
0.25
0.30
0.35
0.40
0
Year
2005 2006 2007 2008 2009 2010 2011 2012 2013
2
4
6
8
10
0
Red-tailed hawk
Golden eagle
Fatalities/MW/Yr (adj) at 330 KW Howden turbines Fatalities/Yr (adj) at 330 KW Howden turbines

F-17
A17: Estimates of fatalities per MW per year and total annual fatalities of American kestrel and burrowing owl at 400 KW wind turbines in the Altamont Pass WRA
Year
1998 2000 2002 2004 2006 2008 2010 2012 2014
-0.4
-0.2
0.2
0.4
0.6
0.8
1.0
1.2
1.4
1.6
1.8
2.0
0
1998 2000 2002 2004 2006 2008 2010 2012 2014
50
100
150
200
250
300
0
Year
1998 2000 2002 2004 2006 2008 2010 2012 2014
5
10
15
20
25
30
35
40
45
0
Fatalities/MW/Yr (adj) at 400 KW KVS33 turbines Fatalities/Yr (adj) at 400 KW KVS33 turbines
Americankestrel
Burrowing owl

F-18
A18: Estimates of fatalities per MW per year and total annual fatalities of red-tailed hawk and golden eagle at 400 KW wind turbines in the Altamont Pass WRA
Year
1998 2000 2002 2004 2006 2008 2010 2012 2014
-0.02
0.020.040.060.080.100.120.140.160.180.200.220.24
0
1998 2000 2002 2004 2006 2008 2010 2012 2014
1
2
3
4
5
0
1998 2000 2002 2004 2006 2008 2010 2012 2014
5
10
15
20
25
30
35
0
Year
1998 2000 2002 2004 2006 2008 2010 2012 2014
-0.5
0.5
1.0
1.5
2.0
2.5
3.0
3.5
0
Fatalities/MW/Yr (adj) at 400 KW KVS33 turbines Fatalities/Yr (adj) at 400 KW KVS33 turbines
Red-tailed hawk
Golden eagle
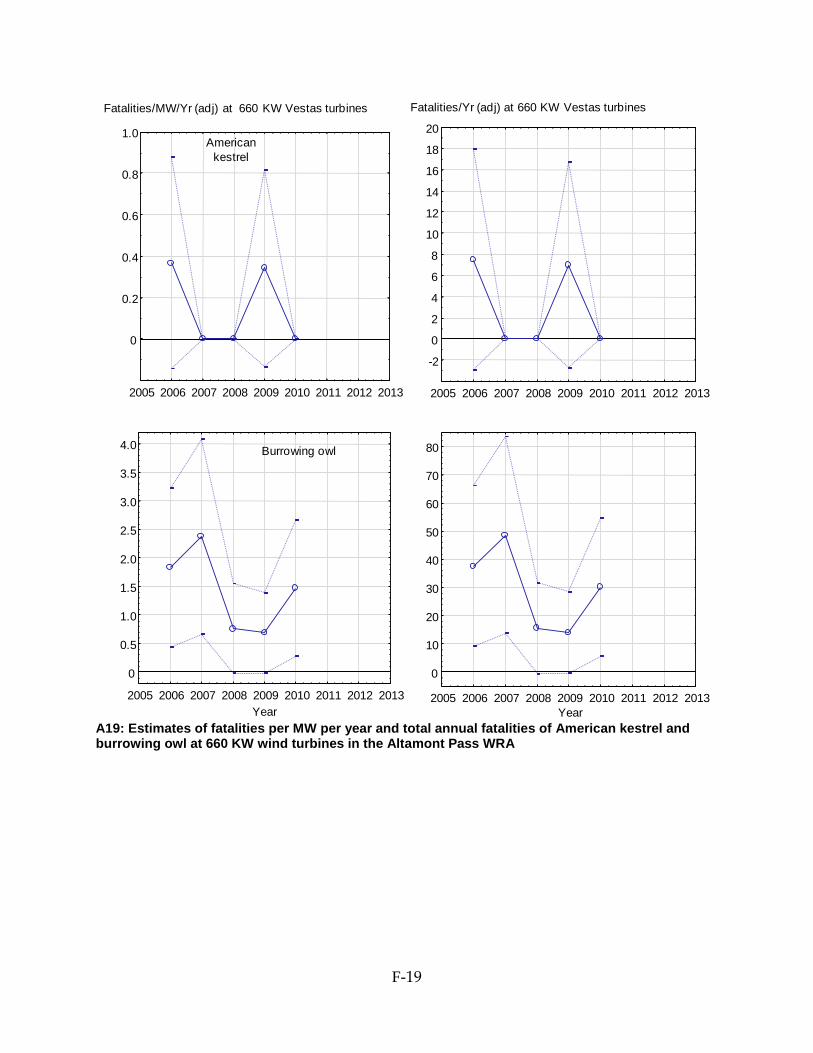
F-19
A19: Estimates of fatalities per MW per year and total annual fatalities of American kestrel and burrowing owl at 660 KW wind turbines in the Altamont Pass WRA
2005 2006 2007 2008 2009 2010 2011 2012 2013
0.2
0.4
0.6
0.8
1.0
0
2005 2006 2007 2008 2009 2010 2011 2012 2013
-2
2
4
6
8
10
12
14
16
18
20
0
Year2005 2006 2007 2008 2009 2010 2011 2012 2013
0.5
1.0
1.5
2.0
2.5
3.0
3.5
4.0
0
Year2005 2006 2007 2008 2009 2010 2011 2012 2013
10
20
30
40
50
60
70
80
0
Fatalities/MW/Yr (adj) at 660 KW Vestas turbines Fatalities/Yr (adj) at 660 KW Vestas turbines
Americankestrel
Burrowing owl
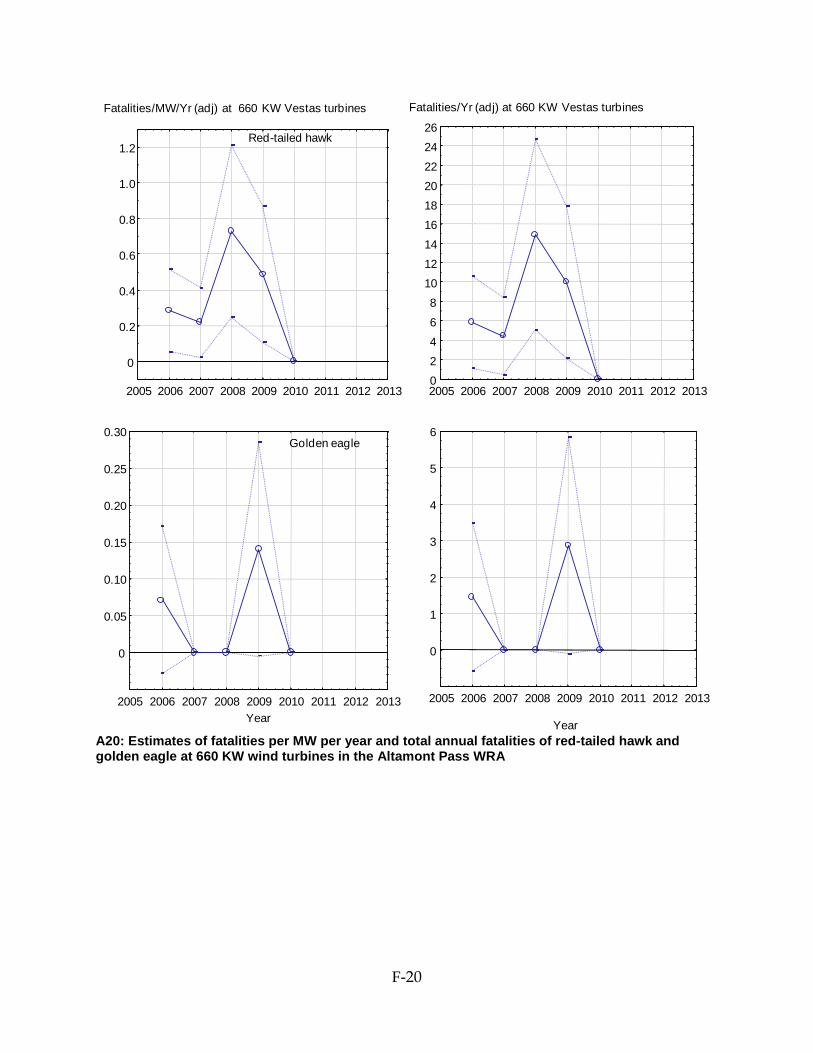
F-20
A20: Estimates of fatalities per MW per year and total annual fatalities of red-tailed hawk and golden eagle at 660 KW wind turbines in the Altamont Pass WRA
2005 2006 2007 2008 2009 2010 2011 2012 2013
0.2
0.4
0.6
0.8
1.0
1.2
0
2005 2006 2007 2008 2009 2010 2011 2012 20130246
8101214
16182022
2426
Year
2005 2006 2007 2008 2009 2010 2011 2012 2013
1
2
3
4
5
6
0
Year2005 2006 2007 2008 2009 2010 2011 2012 2013
0.05
0.10
0.15
0.20
0.25
0.30
0
Fatalities/MW/Yr (adj) at 660 KW Vestas turbines Fatalities/Yr (adj) at 660 KW Vestas turbines
Red-tailed hawk
Golden eagle

F-21
B1: Estimates of raptor fatalities per MW per year and total annual raptor fatalities at the 120 KW (top) and 150 KW (bottom) Bonus turbines (Difwind projects) on the Elworthy Ranch, APWRA, including for wind turbines the SRC rated 8-10 for collision hazard (red lines), those rated 0-7.5 (green lines), and all turbines combined (blue lines)
Elworthy Ranch Difwind projects, 120 KW Bonus turbines
Raptor fatalities/MW/Yr (adj)
1998 2000 2002 2004 2006 2008 2010 2012 2014
2
4
6
8
10
12
14
16
18
20
0
SRC hazardrating
All0-7.58-10
SumMW22.6819.323.36
1998 2000 2002 2004 2006 2008 2010 2012 2014
20
40
60
80
100
120
140
160
180
200
220
0
Project-wide raptor fatalities/Yr (adj)
Year
1998 2000 2002 2004 2006 2008 2010 2012 2014
2
4
6
8
10
12
14
0
Elworthy Ranch Difwind projects, 150 KW Bonus turbines
SRC hazardrating
All0-7.58-10
SumMW14.8511.43.45
Raptor fatalities/MW/Yr (adj) Project-wide raptor fatalities/Yr (adj)
Year
1998 2000 2002 2004 2006 2008 2010 2012 20140
20
40
60
80
100

F-22
B2: Estimates of raptor fatalities per MW per year and total annual raptor fatalities at the 100 KW KCS56 turbines (top) and 400 KW KVS-33 turbines (bottom) in the Vasco Winds Energy Project, APWRA, including for wind turbines the SRC rated 8-10 for collision hazard (red lines), those rated 0-7.5 (green lines), and all turbines combined (blue lines)
2005 2006 2007 2008 2009 2010 2011 2012 20130
20
40
60
80
100
120
140
160
180
200
220
240
2005 2006 2007 2008 2009 2010 2011 2012 20130
1
2
3
4
5
6
7
8
Vasco Winds, 100 KW KCS-56 turbines
SRC hazardrating
All0-7.58-10
SumMW74.362.511.8
Raptor fatalities/MW/Yr (adj) Project-wide raptor fatalities/Yr (adj)
Year2005 2006 2007 2008 2009 2010 2011 2012 2013
0.0
0.2
0.4
0.6
0.8
1.0
1.2
1.4
1.6
1.8
Year2005 2006 2007 2008 2009 2010 2011 2012 20130
2
4
6
8
10
12
14
Vasco Winds, 400 KW KVS33 turbines
SRC hazardrating
All0-7.58-10
SumMW
880
Raptor fatalities/MW/Yr (adj) Project-wide raptor fatalities/Yr (adj)
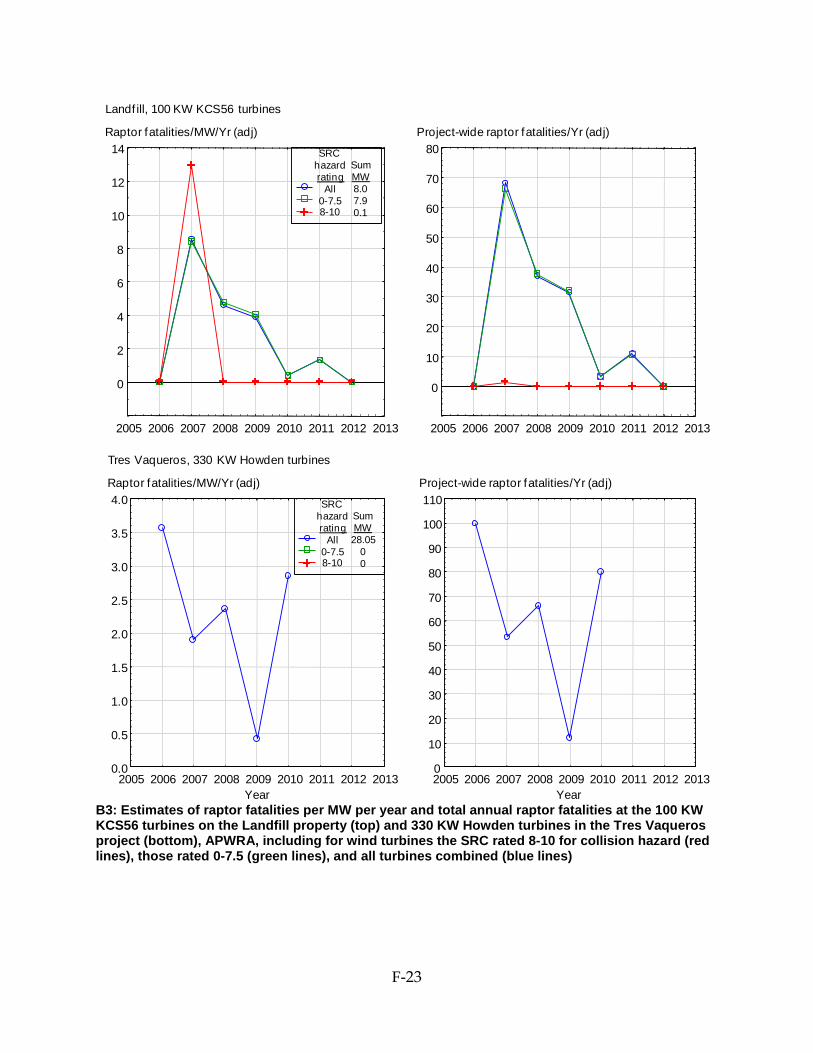
F-23
B3: Estimates of raptor fatalities per MW per year and total annual raptor fatalities at the 100 KW KCS56 turbines on the Landfill property (top) and 330 KW Howden turbines in the Tres Vaqueros project (bottom), APWRA, including for wind turbines the SRC rated 8-10 for collision hazard (red lines), those rated 0-7.5 (green lines), and all turbines combined (blue lines)
2005 2006 2007 2008 2009 2010 2011 2012 2013
2
4
6
8
10
12
14
0
2005 2006 2007 2008 2009 2010 2011 2012 2013
10
20
30
40
50
60
70
80
0
Landf ill, 100 KW KCS56 turbines
SRC hazardrating
All0-7.58-10
SumMW8.07.90.1
Raptor fatalities/MW/Yr (adj) Project-wide raptor fatalities/Yr (adj)
Year2005 2006 2007 2008 2009 2010 2011 2012 20130
10
20
30
40
50
60
70
80
90
100
110
Year2005 2006 2007 2008 2009 2010 2011 2012 2013
0.0
0.5
1.0
1.5
2.0
2.5
3.0
3.5
4.0
Tres Vaqueros, 330 KW Howden turbines
SRC hazardrating
All0-7.58-10
SumMW28.05
00
Raptor fatalities/MW/Yr (adj) Project-wide raptor fatalities/Yr (adj)

F-24
B4: Estimates of raptor fatalities per MW per year and total annual raptor fatalities at the KCS56-100 KW turbines in the Dyer area (top) and west of Dyer Road (bottom), APWRA, including for wind turbines the SRC rated 8-10 for collision hazard (red lines), those rated 0-7.5 (green lines), and all turbines combined (blue lines)
2005 2006 2007 2008 2009 2010 2011 2012 2013
1
2
3
4
5
6
7
8
9
0
2005 2006 2007 2008 2009 2010 2011 2012 2013
20
40
60
80
100
120
140
160
180
0
Dyer, 100 KW KCS56 turbines
SRC hazardrating
All0-7.58-10
SumMW40.432.57.9
Raptor fatalities/MW/Yr (adj) Project-wide raptor fatalities/Yr (adj)
Year
2005 2006 2007 2008 2009 2010 2011 2012 20130
1
2
3
4
5
6
7
Year
2005 2006 2007 2008 2009 2010 2011 2012 20130
20
40
60
80
100
120
140
Dyer West, 100 KW KCS-56 turbines
SRC hazardrating
All0-7.58-10
SumMW28.621.47.2
Raptor fatalities/MW/Yr (adj) Project-wide raptor fatalities/Yr (adj)

F-25
B5: Estimates of raptor fatalities per MW per year and total annual raptor fatalities at the KCS56-100 KW turbines on Gomes Ranch (top) and on the East Slope (bottom), APWRA, including for wind turbines the SRC rated 8-10 for collision hazard (red lines), those rated 0-7.5 (green lines), and all turbines combined (blue lines)
Year2005 2006 2007 2008 2009 2010 2011 2012 2013
20
40
60
80
100
120
140
160
180
200
0
East Slope, 100 KW KCS56 turbines
SRC hazardrating
All0-7.58-10
SumMW23.621.81.8
Raptor fatalities/MW/Yr (adj) Project-wide raptor fatalities/Yr (adj)
Year2005 2006 2007 2008 2009 2010 2011 2012 2013
2
4
6
8
10
12
14
0
2005 2006 2007 2008 2009 2010 2011 2012 2013
2
4
6
8
10
12
14
16
18
0
Gomes, 100 KW KCS56 turbines
SRC hazardrating
All0-7.58-10
SumMW17.515.61.9
Raptor fatalities/MW/Yr (adj) Project-wide raptor fatalities/Yr (adj)
2005 2006 2007 2008 2009 2010 2011 2012 2013
20
40
60
80
100
0

F-26
B6: Estimates of raptor fatalities per MW per year and total annual raptor fatalities at the 65 KW Nordtank turbines in the Patterson Pass Wind Energy Project (top) and the KCS56-100 KW turbines south of Gate 9 (bottom), APWRA, including for wind turbines the SRC rated 8-10 for collision hazard (red lines), those rated 0-7.5 (green lines), and all turbines combined (blue lines)
Patterson Pass, 65 KW Bonus and Nordtank turbines
2005 2006 2007 2008 2009 2010 2011 2012 2013
2468
10121416182022242628
0
2005 2006 2007 2008 2009 2010 2011 2012 2013
20
40
60
80
100
120
140
0
SRC hazardrating
All0-7.58-10
SumMW21.7119.3052.405
Raptor fatalities/MW/Yr (adj) Project-wide raptor fatalities/Yr (adj)
Year2005 2006 2007 2008 2009 2010 2011 2012 2013
2
4
6
8
10
12
14
16
18
0
Year2005 2006 2007 2008 2009 2010 2011 2012 2013
50
100
150
200
250
300
350
400
450
0
Gate 9, 100 KW KCS56 turbines
SRC hazardrating
All0-7.58-10
SumMW47.639.87.8
Raptor fatalities/MW/Yr (adj) Project-wide raptor fatalities/Yr (adj)

F-27
B7: Estimates of raptor fatalities per MW per year and total annual raptor fatalities at the KCS56-100 KW turbines in the North Flynn (top) and Midway (bottom) areas, APWRA, including for wind turbines the SRC rated 8-10 for collision hazard (red lines), those rated 0-7.5 (green lines), and all turbines combined (blue lines)
1998 2000 2002 2004 2006 2008 2010 2012 2014
50
100
150
200
250
300
01998 2000 2002 2004 2006 2008 2010 2012 2014
2468
10121416182022242628
0
North Flynn, 100 KW KCS56 turbines
SRC hazardrating
All0-7.58-10
SumMW54.049.14.9
Raptor fatalities/MW/Yr (adj) Project-wide raptor fatalities/Yr (adj)
Year2005 2006 2007 2008 2009 2010 2011 2012 2013
5
10
15
20
25
30
35
40
45
50
0
Year2005 2006 2007 2008 2010 2011 2012 2013
50
100
150
200
250
300
350
0
Midway, 100 KW KCS56 turbines
SRC hazardrating
All0-7.58-10
SumMW32.431.41.0
Raptor fatalities/MW/Yr (adj) Project-wide raptor fatalities/Yr (adj)
2009

F-28
B8: Estimates of raptor fatalities per MW per year and total annual raptor fatalities at the 65 KW Micon turbines at Forebay’s GB Midway site (top) and Mountain House site (bottom), APWRA, including for wind turbines the SRC rated 8-10 for collision hazard (red lines), those rated 0-7.5 (green lines), and all turbines combined (blue lines)
2000 2002 2004 2006 2008 2010 2012 2014
2468
101214161820222426
0
GB Midway, 65 KW Micon turbines
SRC hazardrating
All0-7.58-10
SumMW3.383.380.00
Project-wide raptor fatalities/Yr (adj)
Year2000 2002 2004 2006 2008 2010 2012 2014
10
20
30
40
50
60
70
0
Year2000 2002 2004 2006 2008 2010 2012 2014
10
20
30
40
50
0
Mountain House, 65 KW Micon turbines
SRC hazardrating
All0-7.58-10
SumMW8.5158.320.195
Raptor fatalities/MW/Yr (adj) Project-wide raptor fatalities/Yr (adj)
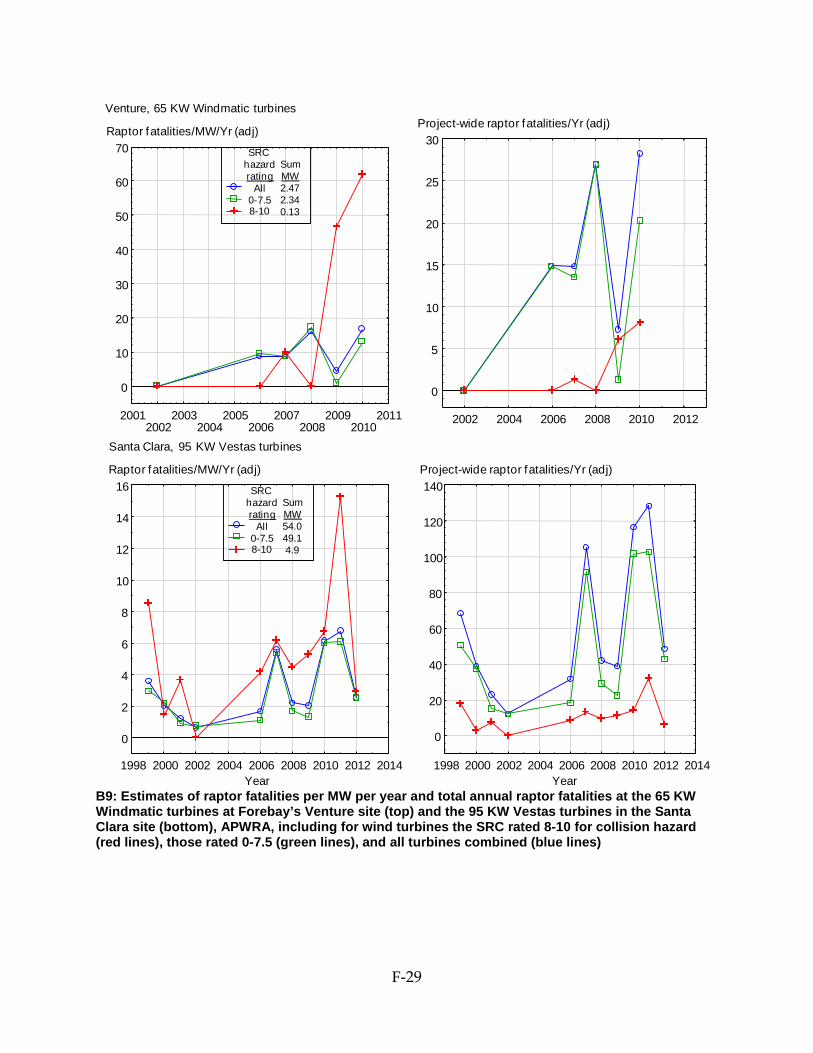
F-29
B9: Estimates of raptor fatalities per MW per year and total annual raptor fatalities at the 65 KW Windmatic turbines at Forebay’s Venture site (top) and the 95 KW Vestas turbines in the Santa Clara site (bottom), APWRA, including for wind turbines the SRC rated 8-10 for collision hazard (red lines), those rated 0-7.5 (green lines), and all turbines combined (blue lines)
2002 2004 2006 2008 2010 2012
5
10
15
20
25
30
0
20012002
20032004
20052006
20072008
20092010
2011
10
20
30
40
50
60
70
0
Venture, 65 KW Windmatic turbines
SRC hazardrating
All0-7.58-10
SumMW2.472.340.13
Raptor fatalities/MW/Yr (adj)Project-wide raptor fatalities/Yr (adj)
Year1998 2000 2002 2004 2006 2008 2010 2012 2014
2
4
6
8
10
12
14
16
0
Santa Clara, 95 KW Vestas turbines
SRC hazardrating
All0-7.58-10
SumMW54.049.14.9
Raptor fatalities/MW/Yr (adj) Project-wide raptor fatalities/Yr (adj)
Year1998 2000 2002 2004 2006 2008 2010 2012 2014
20
40
60
80
100
120
140
0

F-30
B10: Estimates of raptor fatalities per MW per year and total annual raptor fatalities at the 65 KW Micon turbines in Forebay’s Viking project (top) and 40 KW Enertech turbines in the Altech project (bottom), APWRA, including for wind turbines the SRC rated 8-10 for collision hazard (red lines), those rated 0-7.5 (green lines), and all turbines combined (blue lines)
2000 2002 2004 2006 2008 2010 2012 2014
5
10
15
20
25
30
35
40
0
2000 2002 2004 2006 2008 2010 2012 2014
5
10
15
20
25
30
35
40
0
Gate 11, 65 KW Micon turbines
SRC hazardrating
All0-7.58-10
SumMW2.472.340.13
Raptor fatalities/MW/Yr (adj) Project-wide raptor fatalities/Yr (adj)
Year
2000 2002 2004 2006 2008 2010 2012 2014
20
40
60
80
100
0
Year
2000 2002 2004 2006 2008 2010 2012 2014
20
40
60
80
100
120
0
Gate 11, 40 KW Enertech turbines
SRC hazardrating
All0-7.58-10
SumMW5.765.560.20
Raptor fatalities/MW/Yr (adj) Project-wide raptor fatalities/Yr (adj)

F-31
E1: Estimates of annual fatalities of American kestrel (top left), burrowing owl (top right), red-tailed hawk (bottom left), and golden eagle (bottom right) at KCS56-100 KW turbines in the Vasco Winds project, APWRA, including for wind turbines the SRC rated 8-10 for collision hazard (red lines), those rated 0-7.5 (green lines), and all turbines combined (blue lines)
Vasco Winds, 100 KW KCS56 turbines
Project-wide fatalities/Yr (adj) Project-wide fatalities/Yr (adj)
2005 2006 2007 2008 2009 2010 2011 2012 2013
5
10
15
20
25
30
35
40
0
Burrowing owl
2005 2006 2007 2008 2009 2010 2011 2012 2013
20
40
60
80
100
120
0
SRC hazardrating
All0-7.58-10
SumMW74.362.511.8
Americankestrel
Year
2005 2006 2007 2008 2009 2010 2011 2012 2013
10
20
30
40
50
60
70
0
Year
2005 2006 2007 2008 2009 2010 2011 2012 2013
5
10
15
20
25
30
35
0
Golden eagleRed-tailed hawk
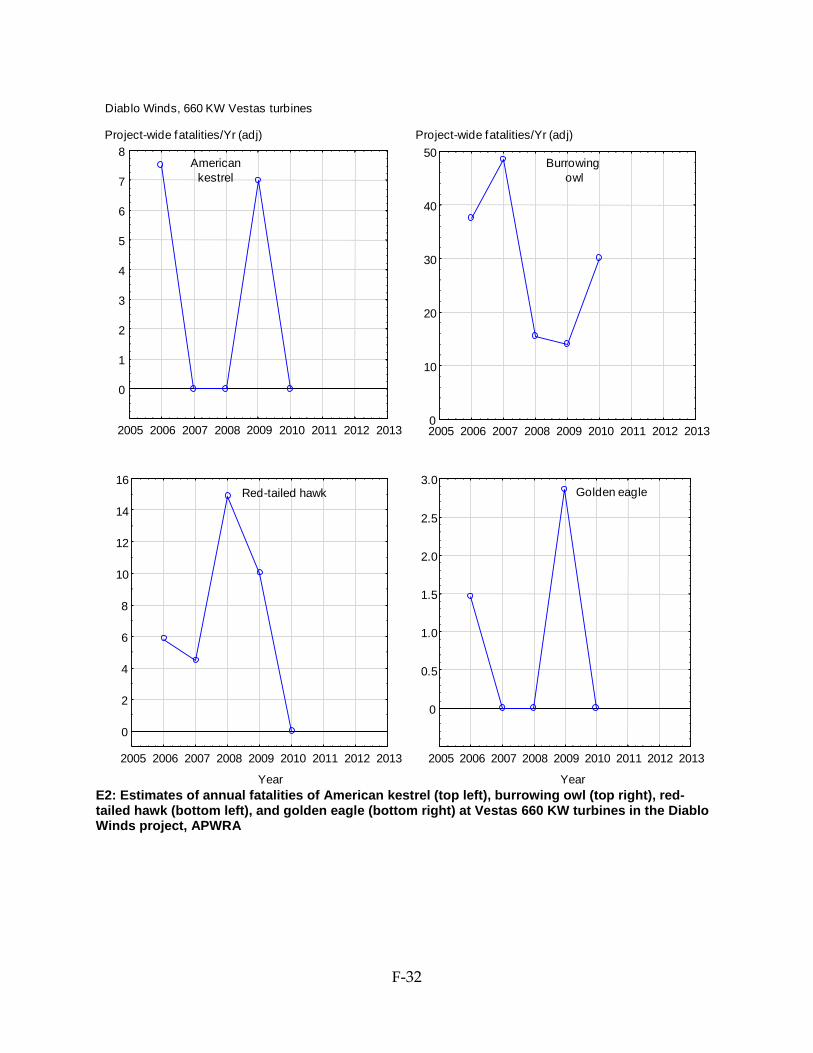
F-32
E2: Estimates of annual fatalities of American kestrel (top left), burrowing owl (top right), red-tailed hawk (bottom left), and golden eagle (bottom right) at Vestas 660 KW turbines in the Diablo Winds project, APWRA
2005 2006 2007 2008 2010 2011 2012 2013
1
2
3
4
5
6
7
8
0
Year
2005 2006 2007 2008 2009 2010 2011 2012 2013
2
4
6
8
10
12
14
16
0
2009
Year
2005 2006 2007 2008 2009 2010 2011 2012 2013
0.5
1.0
1.5
2.0
2.5
3.0
0
2005 2006 2007 2008 2009 2010 2011 2012 20130
10
20
30
40
50
Diablo Winds, 660 KW Vestas turbines
Burrowing owl
Americankestrel
Golden eagleRed-tailed hawk
Project-wide fatalities/Yr (adj) Project-wide fatalities/Yr (adj)
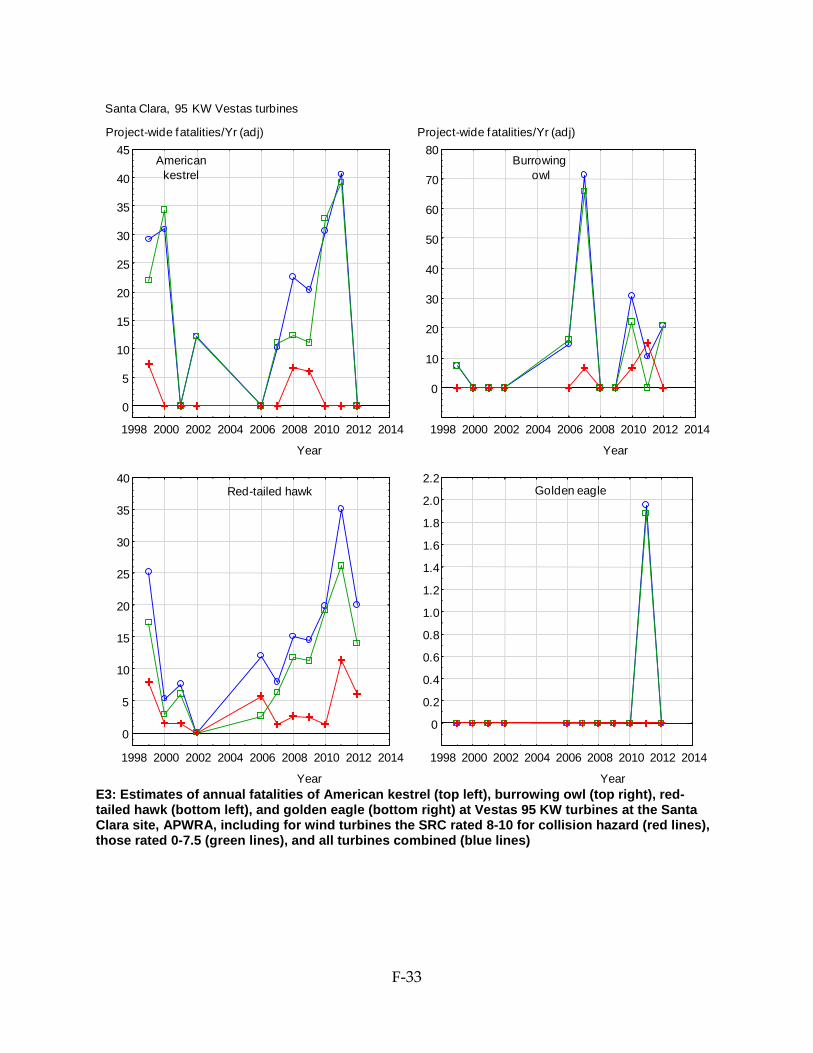
F-33
E3: Estimates of annual fatalities of American kestrel (top left), burrowing owl (top right), red-tailed hawk (bottom left), and golden eagle (bottom right) at Vestas 95 KW turbines at the Santa Clara site, APWRA, including for wind turbines the SRC rated 8-10 for collision hazard (red lines), those rated 0-7.5 (green lines), and all turbines combined (blue lines)
Santa Clara, 95 KW Vestas turbines
Year
1998 2000 2002 2004 2006 2008 2010 2012 2014
5
10
15
20
25
30
35
40
0
Year
1998 2000 2002 2004 2006 2008 2010 2012 2014
5
10
15
20
25
30
35
40
45
0
Year
1998 2000 2002 2004 2006 2008 2010 2012 2014
0.2
0.4
0.6
0.8
1.0
1.2
1.4
1.6
1.8
2.0
2.2
0
Year
1998 2000 2002 2004 2006 2008 2010 2012 2014
10
20
30
40
50
60
70
80
0
Burrowing owl
Americankestrel
Golden eagleRed-tailed hawk
Project-wide fatalities/Yr (adj) Project-wide fatalities/Yr (adj)

F-34
E4: Estimates of annual fatalities of American kestrel (top left), burrowing owl (top right), red-tailed hawk (bottom left), and golden eagle (bottom right) at KCS56-100 KW turbines west of Dyer Road, APWRA, including for wind turbines the SRC rated 8-10 for collision hazard (red lines), those rated 0-7.5 (green lines), and all turbines combined (blue lines)
2005 2006 2007 2008 2009 2010 2011 2012 2013
10
20
30
40
50
60
70
80
90
0
Year
2005 2006 2007 2008 2009 2010 2011 2012 2013
2
4
6
8
10
12
14
16
18
20
22
0
Year
2005 2006 2007 2008 2009 2010 2011 2012 2013
2
4
6
8
10
12
0
2005 2006 2007 2008 2009 2010 2011 2012 2013
2
4
6
8
10
12
14
16
18
0
Dyer West, 100 KW KCS-56 turbines
SRC hazardrating
All0-7.58-10
SumMW28.621.47.2
Burrowing owl
Americankestrel
Golden eagleRed-tailed hawk
Project-wide fatalities/Yr (adj) Project-wide fatalities/Yr (adj)

F-35
E5: Estimates of annual fatalities of American kestrel (top left), burrowing owl (top right), red-tailed hawk (bottom left), and golden eagle (bottom right) at KCS56-100 KW turbines on the East slope, APWRA, including for wind turbines the SRC rated 8-10 for collision hazard (red lines), those rated 0-7.5 (green lines), and all turbines combined (blue lines)
2005 2006 2007 2008 2009 2010 2011 2012 2013
10
20
30
40
50
60
70
80
0
2005 2006 2007 2008 2009 2010 2011 2012 2013
2
4
6
8
10
12
14
16
18
20
22
24
0
Year
2005 2006 2007 2008 2009 2010 2011 2012 2013
2
4
6
8
10
12
14
0
Year
2005 2006 2007 2008 2009 2010 2011 2012 2013
5
10
15
20
25
30
0
Project-wide fatalities/Yr (adj) Project-wide fatalities/Yr (adj)
Burrowing owl
Americankestrel
Golden eagleRed-tailed hawk
East Slope, 100 KW KCS56 turbines
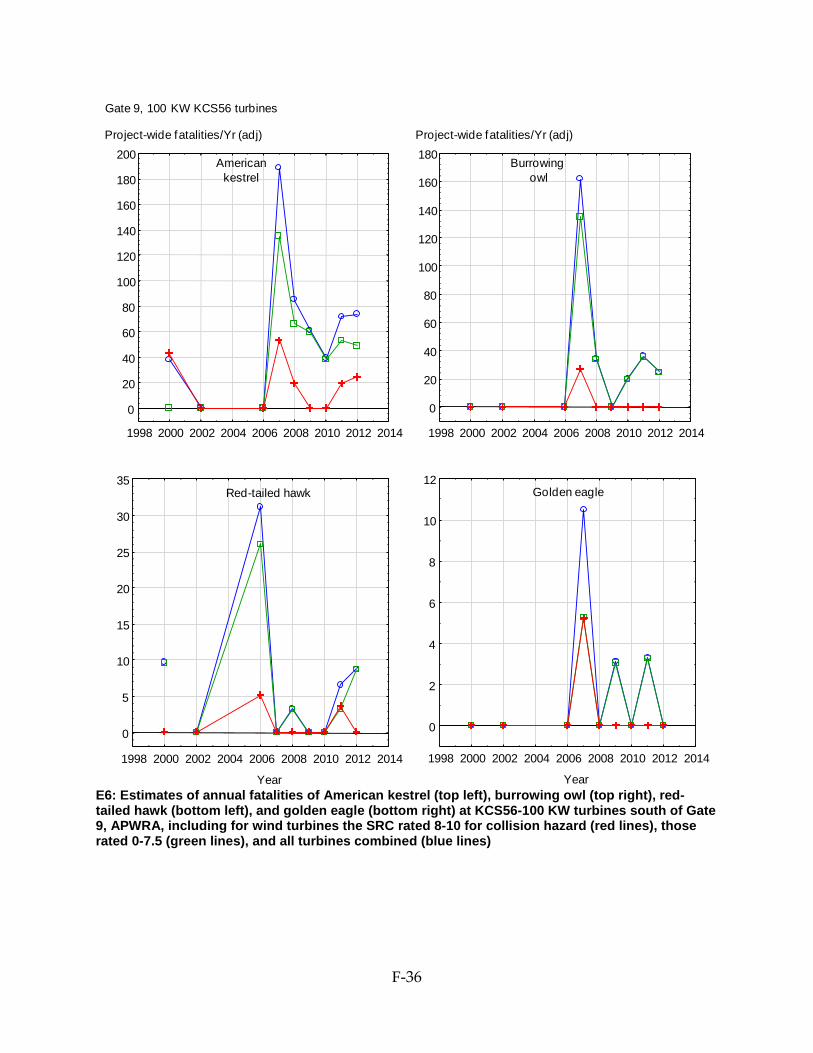
F-36
E6: Estimates of annual fatalities of American kestrel (top left), burrowing owl (top right), red-tailed hawk (bottom left), and golden eagle (bottom right) at KCS56-100 KW turbines south of Gate 9, APWRA, including for wind turbines the SRC rated 8-10 for collision hazard (red lines), those rated 0-7.5 (green lines), and all turbines combined (blue lines)
Year
1998 2000 2002 2004 2006 2008 2010 2012 2014
5
10
15
20
25
30
35
0
Year
1998 2000 2002 2004 2006 2008 2010 2012 2014
2
4
6
8
10
12
0
1998 2000 2002 2004 2006 2008 2010 2012 2014
20
40
60
80
100
120
140
160
180
0
1998 2000 2002 2004 2006 2008 2010 2012 2014
20
40
60
80
100
120
140
160
180
200
0
Project-wide fatalities/Yr (adj) Project-wide fatalities/Yr (adj)
Burrowing owl
Americankestrel
Golden eagleRed-tailed hawk
Gate 9, 100 KW KCS56 turbines

F-37
E7: Estimates of annual fatalities of American kestrel (top left), burrowing owl (top right), red-tailed hawk (bottom left), and golden eagle (bottom right) at 65 KW Nordtank turbines in the Patterson Pass project, APWRA, including for wind turbines the SRC rated 8-10 for collision hazard (red lines), those rated 0-7.5 (green lines), and all turbines combined (blue lines)
Project-wide fatalities/Yr (adj) Project-wide fatalities/Yr (adj)
Patterson Pass, 65 KW Bonus turbines
2005 2006 2007 2008 2009 2010 2011 2012 2013
10
20
30
40
50
60
70
0
Year
2005 2006 2007 2008 2009 2010 2011 2012 2013
2
4
6
8
10
12
14
16
18
20
22
24
0
Year
2005 2006 2007 2008 2009 2010 2011 2012 2013
0.20.40.60.81.01.21.41.61.82.02.22.42.62.8
0
2005 2006 2007 2008 2009 2010 2011 2012 2013
10
20
30
40
50
60
70
80
90
0
Burrowing owl
Americankestrel
Golden eagleRed-tailed hawk
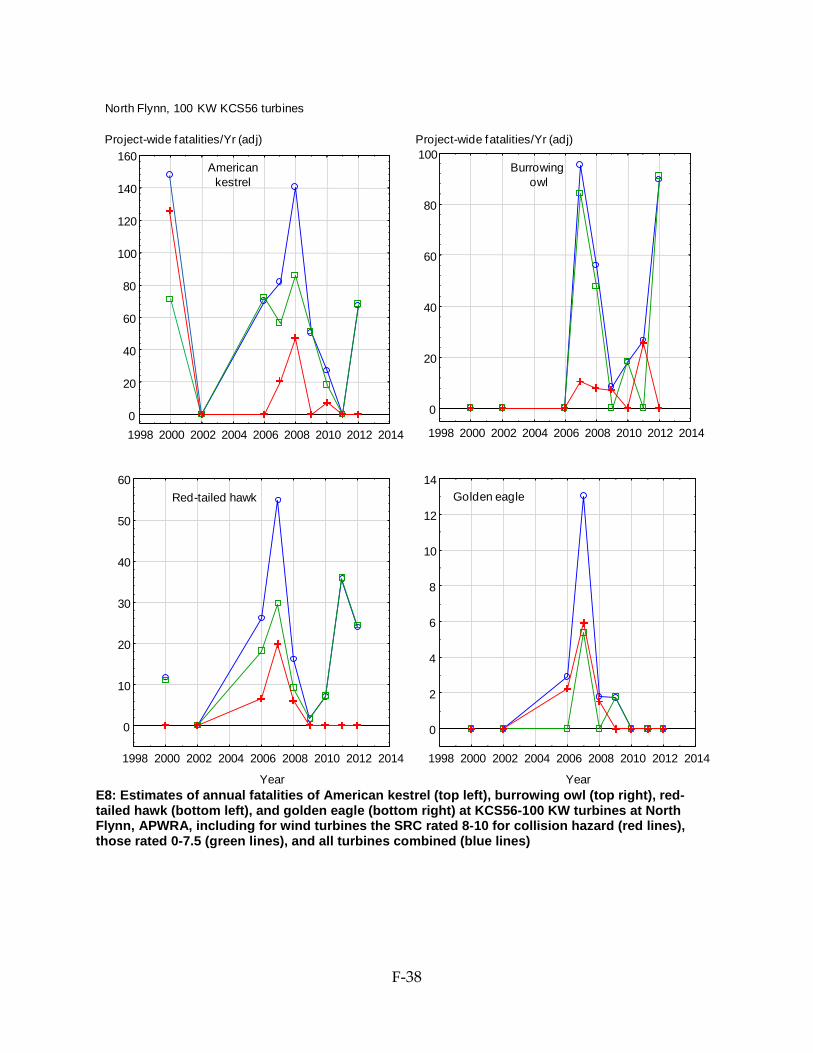
F-38
E8: Estimates of annual fatalities of American kestrel (top left), burrowing owl (top right), red-tailed hawk (bottom left), and golden eagle (bottom right) at KCS56-100 KW turbines at North Flynn, APWRA, including for wind turbines the SRC rated 8-10 for collision hazard (red lines), those rated 0-7.5 (green lines), and all turbines combined (blue lines)
North Flynn, 100 KW KCS56 turbines
1998 2000 2002 2004 2006 2008 2010 2012 2014
20
40
60
80
100
120
140
160
0
Year
1998 2000 2002 2004 2006 2008 2010 2012 2014
10
20
30
40
50
60
0
Year
1998 2000 2002 2004 2006 2008 2010 2012 2014
2
4
6
8
10
12
14
0
1998 2000 2002 2004 2006 2008 2010 2012 2014
20
40
60
80
100
0
Project-wide fatalities/Yr (adj) Project-wide fatalities/Yr (adj)
Burrowing owl
Americankestrel
Golden eagleRed-tailed hawk

F-39
E9: Estimates of annual fatalities of American kestrel (top left), burrowing owl (top right), red-tailed hawk (bottom left), and golden eagle (bottom right) at Howden 330 KW turbines in the Tres Vaqueros project, APWRA, including for wind turbines the SRC rated 8-10 for collision hazard (red lines), those rated 0-7.5 (green lines), and all turbines combined (blue lines)
2005 2006 2007 2008 2009 2010 2011 2012 2013
2468
10121416182022242628
0
2005 2006 2007 2008 2009 2010 2011 2012 20130
10
20
30
40
50
60
70
80
Year
2005 2006 2007 2008 2009 2010 2011 2012 2013
1
2
3
4
5
6
7
0
Year
2005 2006 2007 2008 2009 2010 2011 2012 2013
1
2
3
4
5
6
0
Tres Vaqueros, 330 KW Howden turbines
Project-wide fatalities/Yr (adj) Project-wide fatalities/Yr (adj)
Burrowing owl
Americankestrel
Golden eagleRed-tailed hawk

F-40
E10: Estimates of annual fatalities of American kestrel (top left), burrowing owl (top right), red-tailed hawk (bottom left), and golden eagle (bottom right) at KCS56-100 KW turbines north and east of Dyer Road, APWRA, including for wind turbines the SRC rated 8-10 for collision hazard (red lines), those rated 0-7.5 (green lines), and all turbines combined (blue lines)
2005 2006 2007 2008 2009 2010 2011 2012 2013
10
20
30
40
50
60
70
80
0
Year
2005 2006 2007 2008 2009 2010 2011 2012 2013
5
10
15
20
25
30
35
40
45
0
Year
2005 2006 2007 2008 2009 2010 2011 2012 2013
2
4
6
8
10
12
14
0
2005 2006 2007 2008 2009 2010 2011 2012 2013
10
20
30
40
50
0
Dyer, 100 KW KCS56 turbines
Project-wide fatalities/Yr (adj) Project-wide fatalities/Yr (adj)
Burrowing owl
Americankestrel
Golden eagleRed-tailed hawk

F-41
E11: Estimates of annual fatalities of American kestrel (top left), burrowing owl (top right), red-tailed hawk (bottom left), and golden eagle (bottom right) at KCS56-100 KW turbines on Gomes Ranch, APWRA, including for wind turbines the SRC rated 8-10 for collision hazard (red lines), those rated 0-7.5 (green lines), and all turbines combined (blue lines)
2005 2006 2007 2008 2009 2010 2011 2012 2013
10
20
30
40
50
60
70
0
2005 2006 2007 2008 2009 2010 2011 2012 2013
5
10
15
20
25
30
35
0
Year
2005 2006 2007 2008 2009 2010 2011 2012 2013
2
4
6
8
10
12
0
Year
2005 2006 2007 2008 2009 2010 2011 2012 2013
1
2
3
4
5
6
0
Gomes, 100 KW KCS56 turbines
Project-wide fatalities/Yr (adj) Project-wide fatalities/Yr (adj)
Burrowing owl
Americankestrel
Golden eagleRed-tailed hawk

F-42
E12: Estimates of annual fatalities of American kestrel (top left), burrowing owl (top right), red-tailed hawk (bottom left), and golden eagle (bottom right) at KCS56-100 KW turbines on the Landfill property, APWRA, including for wind turbines the SRC rated 8-10 for collision hazard (red lines), those rated 0-7.5 (green lines), and all turbines combined (blue lines)
Year
2005 2006 2007 2008 2009 2010 2011 2012 2013
2
4
6
8
10
12
0
Landf ill, 100 KW KCS56 turbines
2005 2006 2007 2008 2009 2010 2011 2012 2013
2
4
6
8
10
12
14
16
18
0
2005 2006 2007 2008 2009 2010 2011 2012 2013
5
10
15
20
25
30
35
40
0
Year
2005 2006 2007 2008 2009 2010 2011 2012 2013
2
4
6
8
10
12
14
0
Burrowing owl
Americankestrel
Golden eagleRed-tailed hawk
Project-wide fatalities/Yr (adj) Project-wide fatalities/Yr (adj)

F-43
E13: Estimates of annual fatalities of American kestrel (top left), burrowing owl (top right), red-tailed hawk (bottom left), and golden eagle (bottom right) at 120 KW Bonus turbines on Elworthy Ranch, APWRA, including for wind turbines the SRC rated 8-10 for collision hazard (red lines), those rated 0-7.5 (green lines), and all turbines combined (blue lines)
Year
1998 2000 2002 2004 2006 2008 2010 2012 2014
5
10
15
20
25
30
35
0
Year
1998 2000 2002 2004 2006 2008 2010 2012 2014
20
40
60
80
100
120
140
160
0
Year
1998 2000 2002 2004 2006 2008 2010 2012 2014
5
10
15
20
25
30
35
40
0
Year
1998 2000 2002 2004 2006 2008 2010 2012 2014
1
2
3
4
5
6
7
0
Elworthy, 120 KW Bonus turbines
Burrowing owl
Americankestrel
Golden eagleRed-tailed hawk
Project-wide fatalities/Yr (adj) Project-wide fatalities/Yr (adj)

F-44
E14: Estimates of annual fatalities of American kestrel (top left), burrowing owl (top right), red-tailed hawk (bottom left), and golden eagle (bottom right) at 150 KW Bonus turbines on Elworthy Ranch, APWRA, including for wind turbines the SRC rated 8-10 for collision hazard (red lines), those rated 0-7.5 (green lines), and all turbines combined (blue lines)
1998 2000 2002 2004 2006 2008 2010 2012 2014
2
4
6
8
10
12
0
1998 2000 2002 2004 2006 2008 2010 2012 2014
10
20
30
40
50
60
70
0
Year
1998 2000 2002 2004 2006 2008 2010 2012 2014
5
10
15
20
25
30
35
40
0
Year
1998 2000 2002 2004 2006 2008 2010 2012 2014
1
2
3
4
5
6
7
8
0
Elworthy, 150 KW Bonus turbines
Burrowing owl
Americankestrel
Golden eagleRed-tailed hawk
Project-wide fatalities/Yr (adj) Project-wide fatalities/Yr (adj)
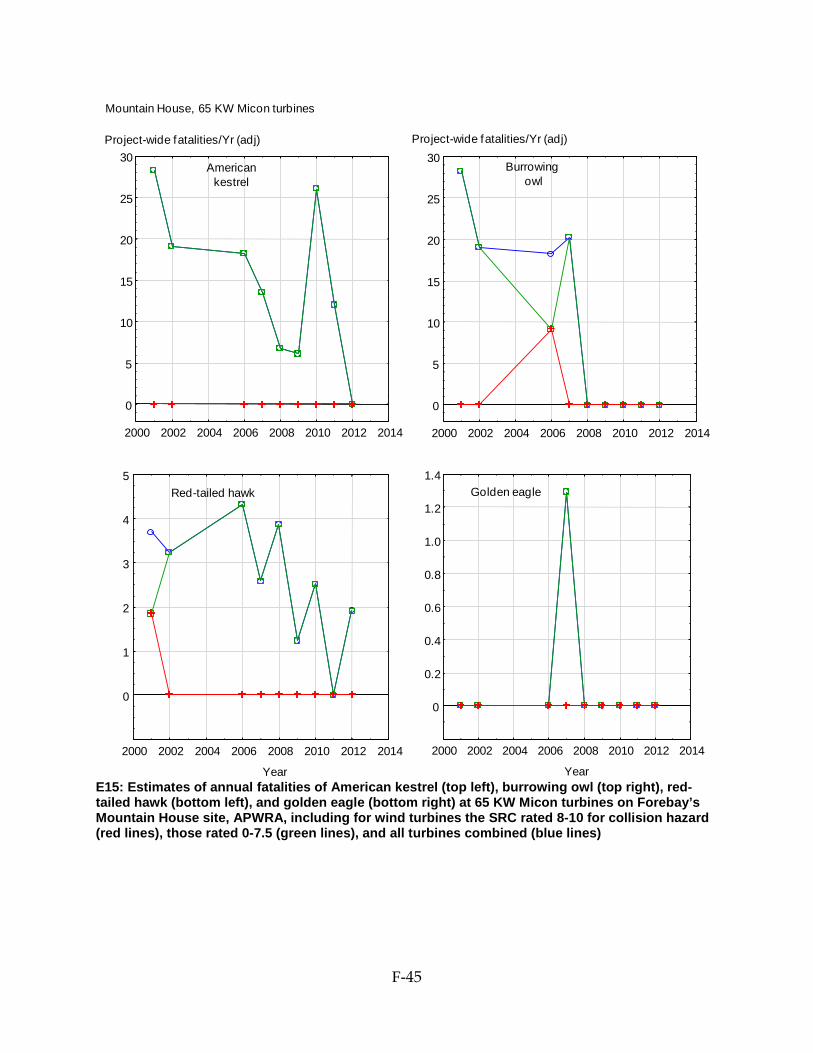
F-45
E15: Estimates of annual fatalities of American kestrel (top left), burrowing owl (top right), red-tailed hawk (bottom left), and golden eagle (bottom right) at 65 KW Micon turbines on Forebay’s Mountain House site, APWRA, including for wind turbines the SRC rated 8-10 for collision hazard (red lines), those rated 0-7.5 (green lines), and all turbines combined (blue lines)
2000 2002 2004 2006 2008 2010 2012 2014
5
10
15
20
25
30
0
2000 2002 2004 2006 2008 2010 2012 2014
5
10
15
20
25
30
0
Year
2000 2002 2004 2006 2008 2010 2012 2014
1
2
3
4
5
0
Year
2000 2002 2004 2006 2008 2010 2012 2014
0.2
0.4
0.6
0.8
1.0
1.2
1.4
0
Mountain House, 65 KW Micon turbines
Burrowing owl
Americankestrel
Golden eagleRed-tailed hawk
Project-wide fatalities/Yr (adj) Project-wide fatalities/Yr (adj)

F-46
E16: Estimates of annual fatalities of American kestrel (top left), burrowing owl (top right), red-tailed hawk (bottom left), and golden eagle (bottom right) at 65 KW Micon turbines on Forebay’s GB Midway site, APWRA, including for wind turbines the SRC rated 8-10 for collision hazard (red lines), those rated 0-7.5 (green lines), and all turbines combined (blue lines)
Year
2000 2002 2004 2006 2008 2010 2012 2014
0.2
0.4
0.6
0.8
1.0
1.2
1.4
0
GB Midway, 65 KW Micon turbines
2000 2002 2004 2006 2008 2010 2012 2014
1
2
3
4
5
6
7
8
9
0
2000 2002 2004 2006 2008 2010 2012 2014
2
4
6
8
10
12
14
0
Year
2000 2002 2004 2006 2008 2010 2012 2014
0.20.40.60.81.01.21.41.61.82.02.22.42.62.8
0
Burrowing owl
Americankestrel
Golden eagleRed-tailed hawk
Project-wide fatalities/Yr (adj) Project-wide fatalities/Yr (adj)

F-47
E17: Estimates of annual fatalities of American kestrel (top left), burrowing owl (top right), red-tailed hawk (bottom left), and golden eagle (bottom right) at KCS-56 100 KW turbines at Midway site, APWRA, including for wind turbines the SRC rated 8-10 for collision hazard (red lines), those rated 0-7.5 (green lines), and all turbines combined (blue lines)
2005 2006 2007 2008 2009 2010 2011 2012 2013
10
20
30
40
50
60
70
80
90
0
Year
2005 2006 2007 2008 2009 2010 2011 2012 2013
5
10
15
20
25
30
0
Year
2005 2006 2007 2008 2009 2010 2011 2012 2013
0
2
4
6
8
10
12
14
16
2005 2006 2007 2008 2009 2010 2011 2012 2013
20
40
60
80
100
120
140
160
180
200
0
Midway, 100 KW KCS56 turbines
Burrowing owl
Americankestrel
Golden eagleRed-tailed hawk
Project-wide fatalities/Yr (adj) Project-wide fatalities/Yr (adj)

F-48
E18: Estimates of annual fatalities of American kestrel (top left), burrowing owl (top right), red-tailed hawk (bottom left), and golden eagle (bottom right) at 400 KW KVS33 turbines at Vasco Winds, APWRA, including for wind turbines the SRC rated 8-10 for collision hazard (red lines), those rated 0-7.5 (green lines), and all turbines combined (blue lines)
Year
2005 2006 2007 2008 2009 2010 2011 2012 2013
0.2
0.4
0.6
0.8
1.0
1.2
1.4
0
2005 2006 2007 2008 2009 2010 2011 2012 2013-1
1
2
3
4
5
6
7
8
9
0
2005 2006 2007 2008 2009 2010 2011 2012 20130.0
0.2
0.4
0.6
0.8
1.0
1.2
1.4
1.6
1.8
2.0
Year
2005 2006 2007 2008 2009 2010 2011 2012 2013
0.2
0.4
0.6
0.8
1.0
1.2
1.4
1.6
0
Vasco Winds, 400 KW KVS33 turbines
Burrowing owl
Americankestrel
Golden eagleRed-tailed hawk
Project-wide fatalities/Yr (adj) Project-wide fatalities/Yr (adj)
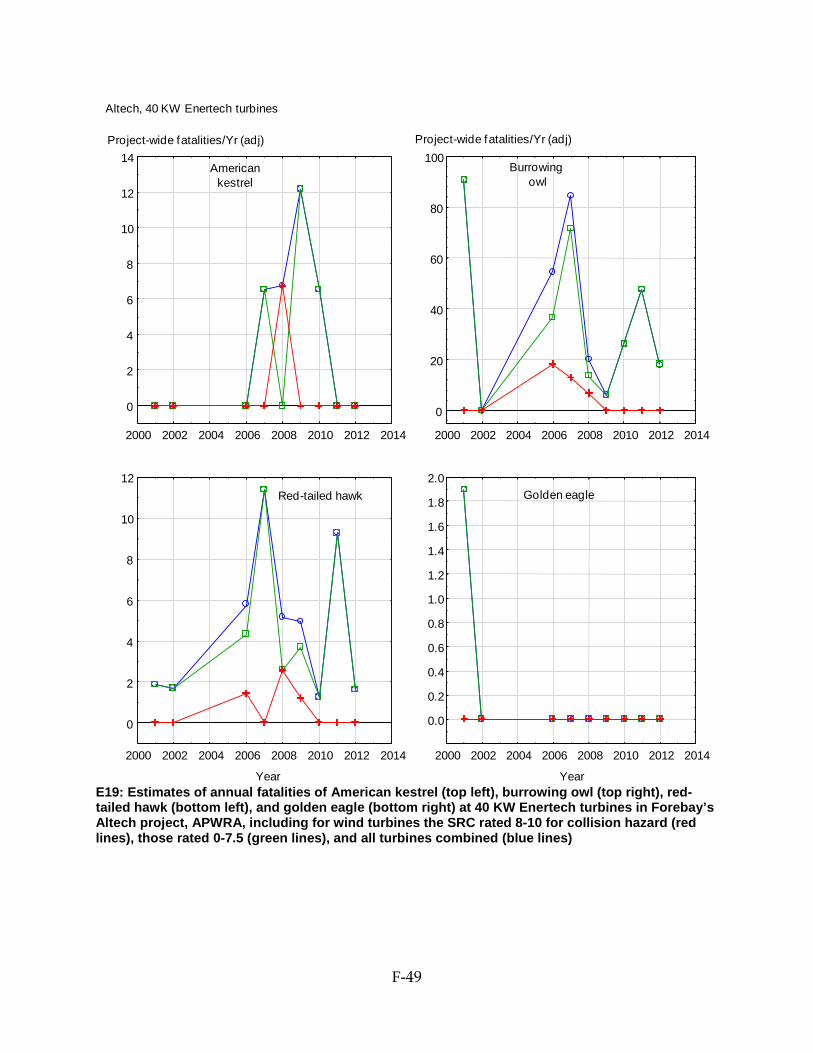
F-49
E19: Estimates of annual fatalities of American kestrel (top left), burrowing owl (top right), red-tailed hawk (bottom left), and golden eagle (bottom right) at 40 KW Enertech turbines in Forebay’s Altech project, APWRA, including for wind turbines the SRC rated 8-10 for collision hazard (red lines), those rated 0-7.5 (green lines), and all turbines combined (blue lines)
2000 2002 2004 2006 2008 2010 2012 2014
2
4
6
8
10
12
14
0
2000 2002 2004 2006 2008 2010 2012 2014
20
40
60
80
100
0
Year
2000 2002 2004 2006 2008 2010 2012 2014
2
4
6
8
10
12
0
Year
2000 2002 2004 2006 2008 2010 2012 2014
0.0
0.2
0.4
0.6
0.8
1.0
1.2
1.4
1.6
1.8
2.0
Altech, 40 KW Enertech turbines
Burrowing owl
Americankestrel
Golden eagleRed-tailed hawk
Project-wide fatalities/Yr (adj) Project-wide fatalities/Yr (adj)

F-50
E20: Estimates of annual fatalities of American kestrel (top left), burrowing owl (top right), red-tailed hawk (bottom left), and golden eagle (bottom right) at 65 KW Micon turbines in Forebay’s Viking project, APWRA, including for wind turbines the SRC rated 8-10 for collision hazard (red lines), those rated 0-7.5 (green lines), and all turbines combined (blue lines)
Year
2000 2002 2004 2006 2008 2010 2012 2014
0.5
1.0
1.5
2.0
2.5
3.0
3.5
4.0
4.5
0
2000 2002 2004 2006 2008 2010 2012 2014
0
2
4
6
8
10
12
14
2000 2002 2004 2006 2008 2010 2012 2014
5
10
15
20
25
30
35
0
Year
2000 2002 2004 2006 2008 2010 2012 2014
0.2
0.4
0.6
0.8
1.0
1.2
1.4
0
Viking, 65 KW Micon turbines
Burrowing owl
Americankestrel
Golden eagleRed-tailed hawk
Project-wide fatalities/Yr (adj) Project-wide fatalities/Yr (adj)

F-51
E21: Estimates of annual fatalities of American kestrel (top left), burrowing owl (top right), red-tailed hawk (bottom left), and golden eagle (bottom right) at 65 KW Windmatic turbines in Forebay’s Venture project, APWRA, including for wind turbines the SRC rated 8-10 for collision hazard (red lines), those rated 0-7.5 (green lines), and all turbines combined (blue lines)
2002 2004 2006 2008 2010 2012
1
2
3
4
5
6
7
8
0
2002 2004 2006 2008 2010 2012
2
4
6
8
10
12
14
16
18
20
22
0
Year
2002 2004 2006 2008 2010 2012
0.2
0.4
0.6
0.8
1.0
1.2
1.4
0
Year
2002 2004 2006 2008 2010 20120.0
0.2
0.4
0.6
0.8
1.0
1.2
1.4
1.6
1.8
2.0
Venture, 65 KW Windmatic turbines
Burrowing owl
Americankestrel
Golden eagleRed-tailed hawk
Project-wide fatalities/Yr (adj) Project-wide fatalities/Yr (adj)


![1 Introduction - Cambridge University Pressassets.cambridge.org/97811070/37267/excerpt/...1 Introduction Bird,bat,andinsectflighthasfascinatedhumansformanycenturies.Asenthusiasti-callyobservedbyDial[1],mostspeciesofanimalsfly.Basedonhisacuteobservation](https://img.pdfslide.us/doc/110x75/5ad5c8627f8b9a6d708d4aa8/1-introduction-cambridge-university-introduction-birdbatandinsectighthasfascinatedhumansformanycenturiesasenthusiasti-callyobservedbydial1mostspeciesofanimalsybasedonhisacuteobservation.jpg)