Embed Size (px)
Citation preview
catalysts
Article
Parametric Sensitivity Analysis for the IndustrialCase of O-Xylene Oxidation to Phthalic Anhydridein a Packed Bed Catalytic Reactor
Santiago Zuluaga-Botero 1, Izabela Dobrosz-Gómez 2 and Miguel-Ángel Gómez-García 1,*1 Grupo de Investigación en Procesos Reactivos Intensificados y Materiales Avanzados—PRISMA,
Departamento de Ingeniería Química, Facultad de Ingeniería y Arquitectura, Universidad Nacional deColombia, Sede Manizales, Manizales 170004, Colombia; [email protected]
2 Grupo de Investigación en Procesos Reactivos Intensificados y Materiales Avanzados—PRISMA,Departamento de Física y Química, Facultad de Ciencias Exactas y Naturales, Universidad Nacional deColombia, Sede Manizales, Manizales 170004, Colombia; [email protected]
* Correspondence: [email protected]; Tel.: +57-6-887-9300 (ext. 55210)
Received: 1 May 2020; Accepted: 28 May 2020; Published: 4 June 2020�����������������
Abstract: The operation of packed bed tubular reactors, for exothermic catalytic reactions, presentsspecial challenges provoked by hotspot development. Their potential safety risk can be assessedusing different mathematical methodologies, among them, the so-called parametric sensitivityanalysis (PSA). This study deals with the identification of safe operational conditions (e.g., feedtemperature conditions) for the catalytic oxidation of o-xylene. Three different reaction networks,with different degrees of complexity, were analyzed. Thus, the critical values of the operatingparameters, allowing us to define run-away and stable operation conditions, were provided fordifferent reactive configurations. The obtained results were compared with the data reported byvarious authors who used similar reaction rate laws. The purpose of the present study is to illustratethe peculiarities of the PSA and its application for the design, analysis, and operation of o-xylenemultitubular catalytic reactor.
Keywords: parametric sensitivity analysis; o-xylene oxidation; packed bed tubular reactor; safeoperation conditions
1. Introduction
It is with great respect and profound admiration that we dedicate this work to Professor Hugo deLasa on the occasion of honoring and recognizing his outstanding career contributions to the fields ofheterogeneous catalysis, photocatalysis and catalytic reaction engineering. In the subject of modellingand analysis of catalytic chemical reactors, it is not unjust to claim a starring place for Professor Hugode Lasa. Indeed, from the intelligent use of mathematical models during his early contributions(e.g., Soria Lopez and de Lasa, 1981 [1]; de Lasa, 1983 [2]; Arandes and de Lasa, 1995 [3]), Professor deLasa exemplified his remarkable modeling and analytical skills. Professor de Lasa has set inspirationand charted the course between the oversimplification and clouding details for parametric sensitivityanalysis of fixed bed catalytic reactors. So far, his intellect, wisdom and research contributions continueto influence us deeply.
Packed Bed Tubular Reactors (PBRs) are considered the workhorses of the chemical andpetrochemical industries. Indeed, they are usually the first choice for large-scale production. PBRs,in their multi-tubular scheme, are preferred for highly exothermic reactions, such as the partialoxidation of different hydrocarbons [4]. Any effort to quantify the phenomena taking place in aPBR must consider the mass and heat transport between the reactive fluid and the catalyst, the
Catalysts 2020, 10, 626; doi:10.3390/catal10060626 www.mdpi.com/journal/catalysts
Catalysts 2020, 10, 626 2 of 15
pressure drop for flow through the packed bed, and the energy balance on the heat-exchange fluid.The inherent two-way coupling between concentration and temperature causes chemical reactorsto show exceptional behaviors, such as a slight change in one or more inlet parameter, which canenormously alter the reactor effluent conditions. Bilous and Amundson [5] called this phenomenonparametric sensitivity. When a PBR operates in the parametrically sensitive region, its performancebecomes unreliable. For instance, a slight increase in the inlet reactive-fluid temperature can lead to alarge rise in the reaction rate (due to the exponential temperature dependence of the rate constant).The increased reaction rate results in more heat generation which furthermore increases the reactiontemperature. This feedback mechanism results in the so-called reactor runaway (when the rate of heatgeneration far exceeds the rate of heat removal). Such increase in the reaction temperature can damagethe reactor, can generate safety hazards, can cause catalyst deactivation, and can propitiate undesirableside reactions [6]. Thus, it would be of great value to reactor designers and operators to be able topredict parametric sensitivity conditions.
The solution of the rigorous model describing non-isothermal PBRs has proven to be extremelychallenging. Additionally, the level of complexity increases when including mathematical toolsfor parametric sensitivity analysis. Fortunately, recent advances in computational resources haveenabled their simultaneous simulation. During the last three decades, the use of the following fourmethodologies for parametric sensitivity analysis has become widespread: (i) Temperature-partialpressure phase plane [7]; (ii) The sensitivity indices method [8]; (iii) The divergence methods, based onchaos theory [9] and (iv) The methods of trajectory extension [10]. This rough classification implies that,although the runaway phenomenon is well known, a unique analysis approach does not exist. One ofthe purposes of the present work is to compare the results obtained using the temperature-partialpressure phase plane (e.g., by de Lasa, [2]) vs. those obtained using the sensitivity indices method for thecase of the catalytic (with V2O5) oxidation of ortho-xylene (o-xylene) for producing phthalic anhydride.This is a classic example of a fast oxidation reaction which, if not controlled, produces CO and CO2
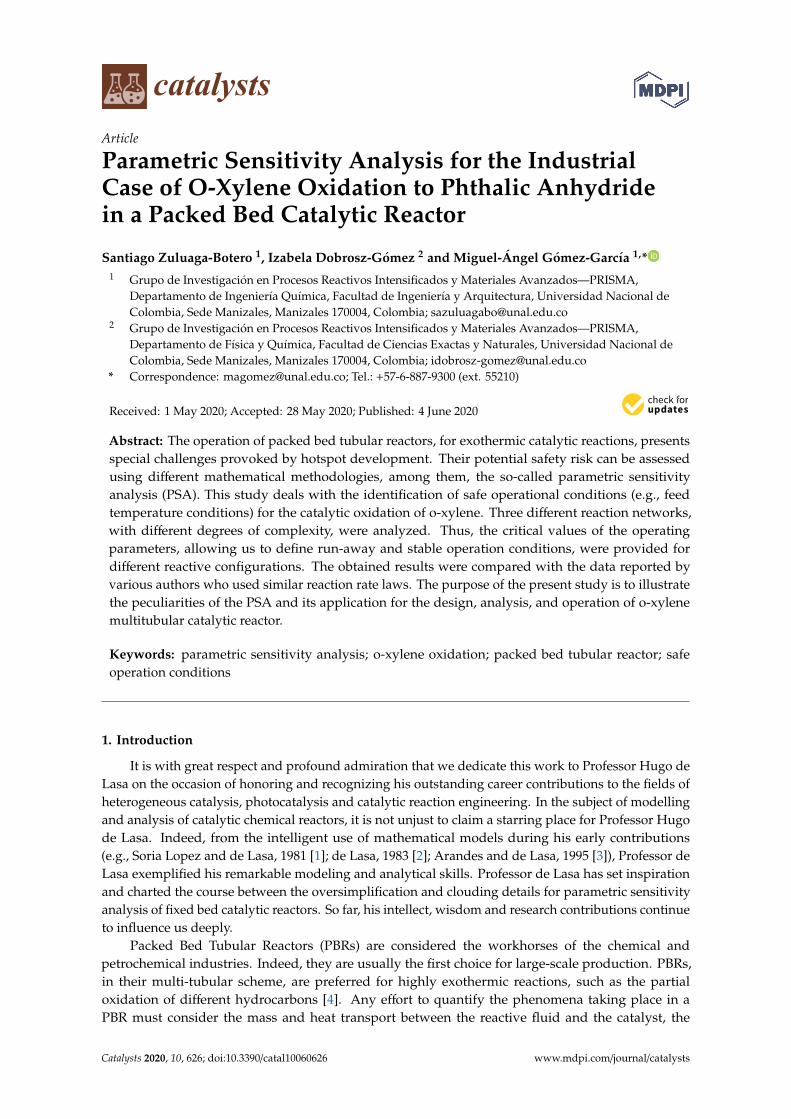
(COx) instead of valuable products. It has been pointed out in the open literature that a multitubularPBR is indispensable and that procedures for obtaining nearly complete conversion without causing arunaway must be guaranteed [11]. Industrially, the reactive process proceeds at atmospheric pressure,in the temperature range of 360–400 ◦C, reaching almost complete o-xylene conversion and witha phthalic anhydride selectivity between 70–75% [12]. Ortho-tolualdehyde (o-tolualdehyde) andphthalide are the main intermediates. However, depending on operation conditions, maleic anhydridecan also be generated (Figure 1). It is evident that the o-xylene oxidation process is highly complex.
Catalysts 2020, 10, x FOR PEER REVIEW 2 of 17
fluid. The inherent two-way coupling between concentration and temperature causes chemical reactors to show exceptional behaviors, such as a slight change in one or more inlet parameter, which can enormously alter the reactor effluent conditions. Bilous and Amundson [5] called this phenomenon parametric sensitivity. When a PBR operates in the parametrically sensitive region, its performance becomes unreliable. For instance, a slight increase in the inlet reactive-fluid temperature can lead to a large rise in the reaction rate (due to the exponential temperature dependence of the rate constant). The increased reaction rate results in more heat generation which furthermore increases the reaction temperature. This feedback mechanism results in the so-called reactor runaway (when the rate of heat generation far exceeds the rate of heat removal). Such increase in the reaction temperature can damage the reactor, can generate safety hazards, can cause catalyst deactivation, and can propitiate undesirable side reactions [6]. Thus, it would be of great value to reactor designers and operators to be able to predict parametric sensitivity conditions.
The solution of the rigorous model describing non-isothermal PBRs has proven to be extremely challenging. Additionally, the level of complexity increases when including mathematical tools for parametric sensitivity analysis. Fortunately, recent advances in computational resources have enabled their simultaneous simulation. During the last three decades, the use of the following four methodologies for parametric sensitivity analysis has become widespread: (i) Temperature-partial pressure phase plane [7]; (ii) The sensitivity indices method [8]; (iii) The divergence methods, based on chaos theory [9] and (iv) The methods of trajectory extension [10]. This rough classification implies that, although the runaway phenomenon is well known, a unique analysis approach does not exist. One of the purposes of the present work is to compare the results obtained using the temperature-partial pressure phase plane (e.g., by de Lasa, [2]) vs. those obtained using the sensitivity indices method for the case of the catalytic (with V2O5) oxidation of ortho-xylene (o-xylene) for producing phthalic anhydride. This is a classic example of a fast oxidation reaction which, if not controlled, produces CO and CO2 (COx) instead of valuable products. It has been pointed out in the open literature that a multitubular PBR is indispensable and that procedures for obtaining nearly complete conversion without causing a runaway must be guaranteed [11]. Industrially, the reactive process proceeds at atmospheric pressure, in the temperature range of 360–400 °C, reaching almost complete o-xylene conversion and with a phthalic anhydride selectivity between 70%–75% [12]. Ortho-tolualdehyde (o-tolualdehyde) and phthalide are the main intermediates. However, depending on operation conditions, maleic anhydride can also be generated (Figure 1). It is evident that the o-xylene oxidation process is highly complex.
Figure 1. Reaction scheme for o-xylene oxidation. Adapted with permission from [13], copyright 2008, Elsevier.
Figure 1. Reaction scheme for o-xylene oxidation. Adapted with permission from [13], copyright2008, Elsevier.
Catalysts 2020, 10, 626 3 of 15
Different approaches and assumptions, proposed by several researchers in the literature, yieldedsome models for o-xylene disappearance. The only probable agreement between the different authorsis that the reactions occur through a “redox” mechanism. Table 1 includes some of the reaction stepsconsidered by different investigators for kinetic studies or reactor modelling. For practical purposes,more than just the reaction rate of o-xylene to phthalic anhydride (step 6 in Figure 1) is needed.To model the highly temperature-sensitive system, the competition between phthalic anhydride andcomplete oxidation must be followed at least, which causes large heat effects [14,15].
Table 1. Reaction steps considered by different authors for kinetic studies or reactor modelling.
Mechanism ReferenceReaction Step
1 2 3 4 5 6 7 8 9 10 11 12
1 [7] X2 [2,16] X X X3 [17] X X X X X4 [12] X X X X X5 [14] X X X X X X6 [18] X X X X X X7 [19] X X X X X X X8 [20] X X X X X X X X X X9 [21] X X X X X X X X X X X
X: Reaction step from Figure 1.
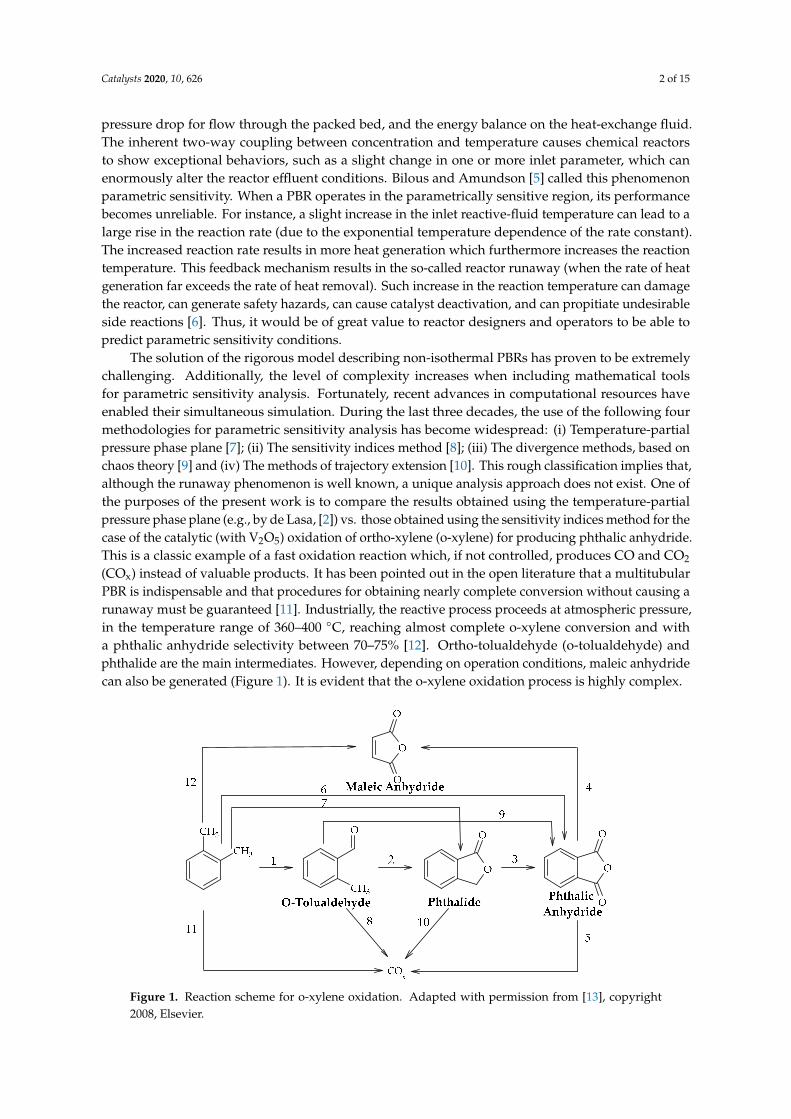
To illustrate the effect of o-xylene oxidation mechanism on reactor performance prediction, threedifferent models were considered in Figure 2 (data used for simulation will be presented later on).Regardless of the difference of the kinetic model used for simulation, a common behavior of thetemperature profile occurs: a hotspot is predicted at some position in the PBR. However, the magnitudeof the hotspot depends on the reaction kinetics. It is also interesting to note that, for the conditionsused in these calculations, the predicted o-xylene conversions are significantly different.
Catalysts 2020, 10, x FOR PEER REVIEW 3 of 17
Different approaches and assumptions, proposed by several researchers in the literature, yielded some models for o-xylene disappearance. The only probable agreement between the different authors is that the reactions occur through a “redox” mechanism. Table 1 includes some of the reaction steps considered by different investigators for kinetic studies or reactor modelling. For practical purposes, more than just the reaction rate of o-xylene to phthalic anhydride (step 6 in Figure 1) is needed. To model the highly temperature-sensitive system, the competition between phthalic anhydride and complete oxidation must be followed at least, which causes large heat effects [14,15].
Table 1. Reaction steps considered by different authors for kinetic studies or reactor modelling.
Mechanism Reference Reaction step
1 2 3 4 5 6 7 8 9 10 11 12
1 [7] X
2 [2,16] X X X
3 [17] X X X X X
4 [12] X X X X X
5 [14] X X X X X X
6 [18] X X X X X X
7 [19] X X X X X X X
8 [20] X X X X X X X X X X
9 [21] X X X X X X X X X X X
X: Reaction step from Figure 1.
To illustrate the effect of o-xylene oxidation mechanism on reactor performance prediction, three different models were considered in Figure 2 (data used for simulation will be presented later on). Regardless of the difference of the kinetic model used for simulation, a common behavior of the temperature profile occurs: a hotspot is predicted at some position in the PBR. However, the magnitude of the hotspot depends on the reaction kinetics. It is also interesting to note that, for the conditions used in these calculations, the predicted o-xylene conversions are significantly different.
Figure 2. O-xylene conversion and reactive temperature profiles obtained with a one-dimensional Packed Bed Tubular Reactor (PBR) model using three different kinetic models.
0.0 0.5 1.0 1.5 2.0
640
660
680
700
Tem
pera
ture
, K
Lenght, m
van Welsenaere & Froment [7] de Lasa [2] Chandrasekharan & Calderbank [17]
0.0
0.2
0.4
0.6
0.8
1.0
Con
vers
ion
Figure 2. O-xylene conversion and reactive temperature profiles obtained with a one-dimensionalPacked Bed Tubular Reactor (PBR) model using three different kinetic models.
The influence of the PBR parameters (parametric sensitivity), such as operation conditions andreaction kinetics on o-xylene oxidation, with constant physicochemical properties, was analyzed usingthe temperature-partial pressure phase plane by several authors as follows:
Catalysts 2020, 10, 626 4 of 15
• van Welsenaere and Froment, (1970) [7] introduced, for an ideal, one-dimensional PBR model,with constant wall temperature, two criteria for runaway based on an intrinsic property of thereactive system. They transposed the peak temperature and the conditions of the inflexion pointsfor the prediction of the critical values for the operating variables. Their work also treats therelated problem of a hotspot which has to be limited for reasons other than runaway.
• Soria-López et al. (1981) [1], as an extension of van Welsenaere and Froment’s [7] work, analyzedan ideal, one-dimensional PBR model, with co-current external cooling, under two types ofoperation modes: (i) the temperature along the reactor axis increases monotonically; that is,without a hotspot can occur under certain conditions (referred to as pseudo-adiabatic operations,PAO), and (ii) the temperature shows a maximum at a finite axial reactor position (MFARP).Limiting operation conditions were defined between MFARP temperature curves and PAO curves.
• de Lasa (1983) [2], continuing Soria-López et al.’s work [1], studied the peculiarities of PAO andits significance for the design and operational conditions of o-xylene oxidation in multi-tubularreactors using reaction networks models of different complexity.
• Akella and Lee (1983) [22] studied, for an ideal, one-dimensional PBR model, a counter-currentoperation. The runaway conditions were derived from a phase plane of feed and coolantinlet temperatures.
• Hosten and Froment (1986) [23] extended the van Welsenaere and Froment (1970) [7] approach toco-currently cooled PBRs with wall temperature variation with reactor length.
• Later, Arandes and de Lasa (1995) [3] extended the PAO analysis to the following operationregimens in PBRs: isothermal, decreasing temperature profile, cold spot, hotspot–cold spot, andcold spot–hotspot.
From another perspective of analysis, Henning and Perez (1986) [16] defined, for o-xylene oxidationreaction, a criterion for runaway in PBRs based on the behavior of the sensitivity indices along thereactor, when the temperature variation in a co-current cooling medium is considered. Their analysiswas not restricted to simple kinetics.
It is interesting to observe that all of the above-mentioned works neglected the pressure drop forflow through a packed bed. However, in gas phase reactions, the concentration of the reacting speciesis proportional to the total pressure. Therefore, a proper account of the effect of pressure variation onthe PBR is a key factor in the success of reactor operation.
This work deals with the definition of suitable inlet reactor conditions (e.g., temperature andpressure leading to safe o-xylene oxidation reactor operation) applying a sensitivity indices method tothe analysis of a non-isothermal PBR model, which includes: mass and heat balances inside (packedbed) and outside (shell side: in co-current or countercurrent flow) the reactor tubes and the pressuredrop balance (Ergun equation). For comparison, three different reaction networks, with differentdegrees of complexity, are analyzed: (i) a pseudo-first-order kinetic model, used by van Welsenaere andFroment [7], which includes a single reaction (step 6 in Figure 1); (ii) a three-step reaction model (steps5, 6 and 11 in Figure 1), as used by de Lasa [2], and (iii) the Chandrasekharan and Calderbank [17]kinetic model involving five steps of reaction (steps 1, 2, 3, 6 and 11 in Figure 1). Thus, the previouslyreported a priori runaway conditions for hotspot operation are compared with the new obtainedcriteria. Additionally, the boundary between safe and unsafe operation regions will be established.
2. Reactor Model
Previous work [24,25] indicated that a one-dimensional, pseudo-homogeneous, PBR model canbe considered adequate for the analysis for o-xylene oxidation. Thus, the model used in this work isbased on the following assumptions:
• The PBR is operating at steady state conditions.
Catalysts 2020, 10, 626 5 of 15
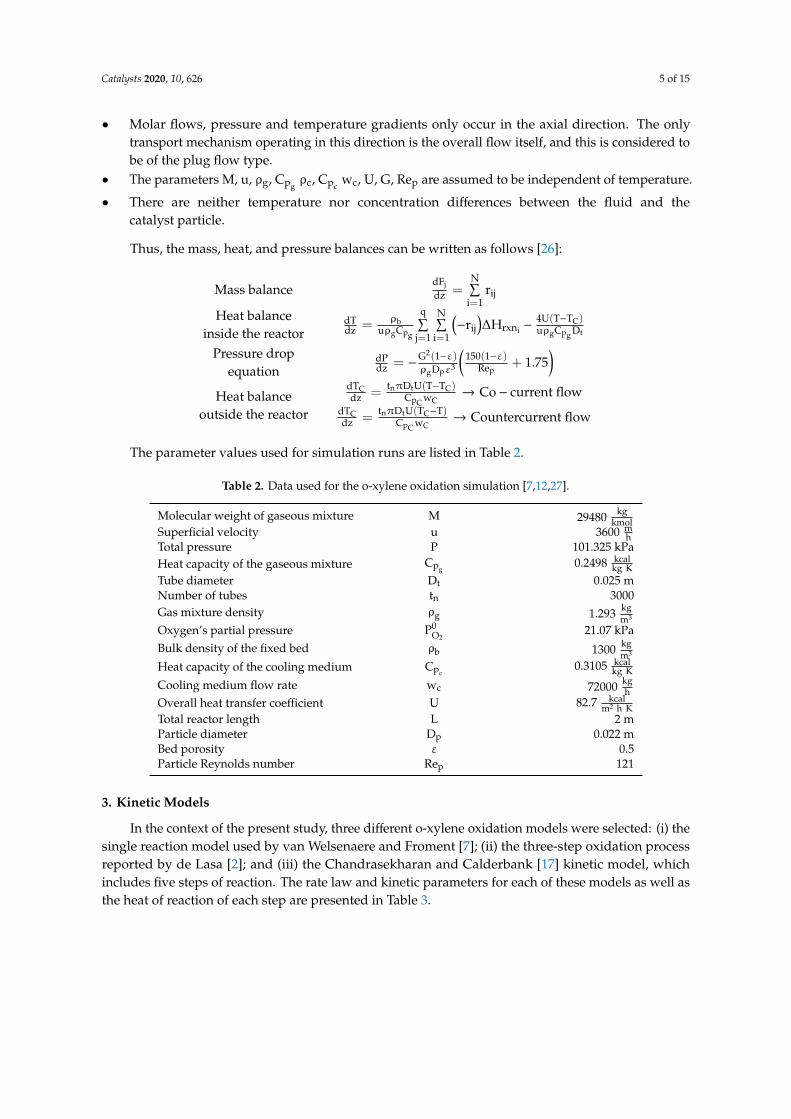
• Molar flows, pressure and temperature gradients only occur in the axial direction. The onlytransport mechanism operating in this direction is the overall flow itself, and this is considered tobe of the plug flow type.
• The parameters M, u, ρg, Cpgρc, Cpc
wc, U, G, Rep are assumed to be independent of temperature.
• There are neither temperature nor concentration differences between the fluid and thecatalyst particle.
Thus, the mass, heat, and pressure balances can be written as follows [26]:
Mass balancedFjdz =
N∑i=1
rij
Heat balanceinside the reactor
dTdz =
ρbuρgCpg
q∑j=1
N∑i=1
(−rij
)∆Hrxni −
4U(T−TC)uρgCpg Dt
Pressure dropequation
dPdz = −
G2(1−ε)ρgDpε3
(150(1−ε)
Rep+ 1.75
)Heat balance
outside the reactor
dTCdz =
tnπDtU(T−TC)CpC wC
→ Co− current flowdTCdz =
tnπDtU(TC−T)CpC wC
→ Countercurrent flow
The parameter values used for simulation runs are listed in Table 2.
Table 2. Data used for the o-xylene oxidation simulation [7,12,27].
Molecular weight of gaseous mixture M 29480 kgkmol
Superficial velocity u 3600 mh
Total pressure P 101.325 kPaHeat capacity of the gaseous mixture Cpg
0.2498 kcalkg K
Tube diameter Dt 0.025 mNumber of tubes tn 3000Gas mixture density ρg 1.293 kg
m3
Oxygen’s partial pressure P0O2
21.07 kPaBulk density of the fixed bed ρb 1300 kg
m3
Heat capacity of the cooling medium Cpc0.3105 kcal
kg K
Cooling medium flow rate wc 72000 kgh
Overall heat transfer coefficient U 82.7 kcalm2 h K
Total reactor length L 2 mParticle diameter Dp 0.022 mBed porosity ε 0.5Particle Reynolds number Rep 121
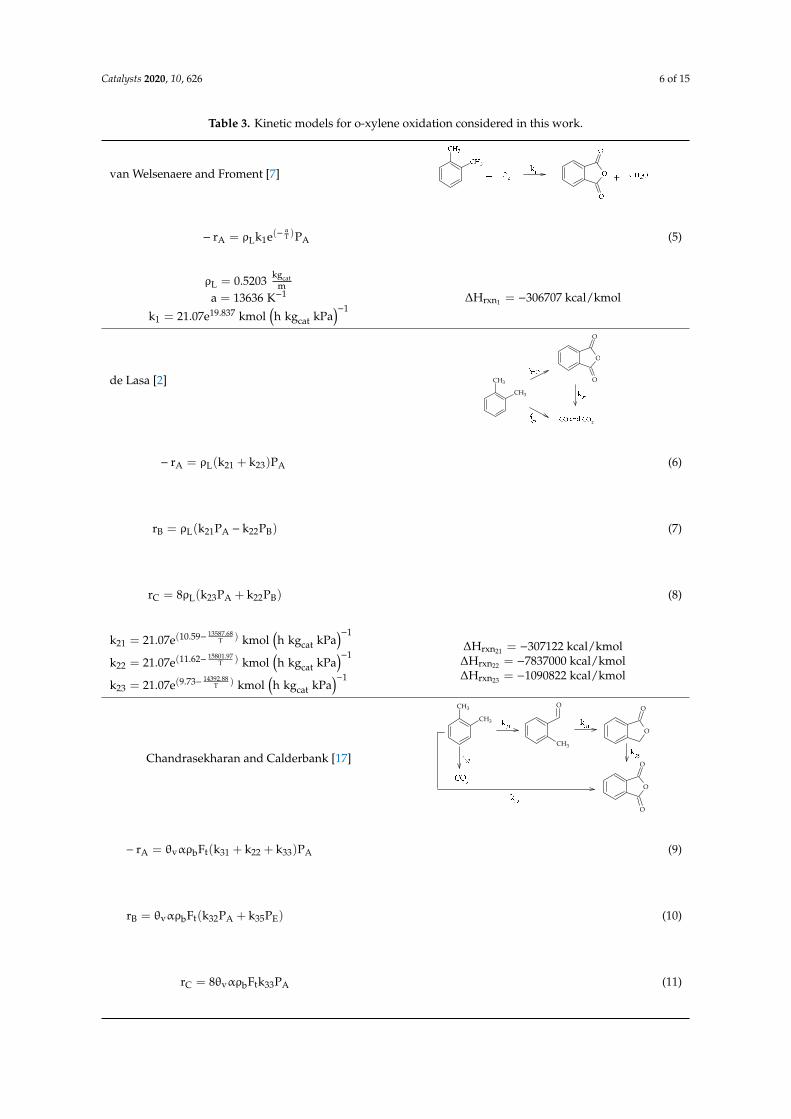
3. Kinetic Models
In the context of the present study, three different o-xylene oxidation models were selected: (i) thesingle reaction model used by van Welsenaere and Froment [7]; (ii) the three-step oxidation processreported by de Lasa [2]; and (iii) the Chandrasekharan and Calderbank [17] kinetic model, whichincludes five steps of reaction. The rate law and kinetic parameters for each of these models as well asthe heat of reaction of each step are presented in Table 3.
Catalysts 2020, 10, 626 6 of 15
Table 3. Kinetic models for o-xylene oxidation considered in this work.
van Welsenaere and Froment [7]
Catalysts 2020, 10, x FOR PEER REVIEW 7 of 17
Table 3. Kinetic models for o-xylene oxidation considered in this work.
van Welsenaere and Froment [7]
aT
A L 1 Ar ρ k e P − − = (5)
cat
L
kgρ 0.5203
m=
1a 13636 K−=
( ) 119.8371 catk 21.07e kmol h kg kPa
−=
1rxnΔH = -306707 kcal / kmol
de Lasa [2]
( )A L 21 23 A-r = ρ k + k P (6)
( )B L 21 A 22 Br = ρ k P - k P (7)
( )C L 23 A 22 Br = 8ρ k P + k P (8)
( )13587.6810.59 1T
21 catk 21.07e kmol h kg kPa − − =
( )15801.9711.62 1T
22 catk 21.07e kmol h kg kPa − − =
( )14392.889.73 1T
23 catk 21.07e kmol h kg kPa − − =
21rxnΔH = -307122 kcal / kmol
22rxnΔH = -7837000 kcal / kmol
23rxnΔH = -1090822 kcal / kmol
Chandrasekharan and Calderbank [17]
( )− = + +A v b t 31 22 33 Ar θ αρ F k k k P (9)
( )= +B v b t 32 A 35 Er θ αρ F k P k P (10)
=C v b t 33 Ar 8θ αρ F k P (11)
CH3
CH3
O
O
O
2
CH3
CH3
O
O
O
O
CH3
O
O
− rA = ρLk1e(−aT )PA (5)
ρL = 0.5203kgcat
ma = 13636 K−1
k1 = 21.07e19.837 kmol(h kgcat kPa
)−1∆Hrxn1 = −306707 kcal/kmol
de Lasa [2]
Catalysts 2020, 10, x FOR PEER REVIEW 7 of 17
Table 3. Kinetic models for o-xylene oxidation considered in this work.
van Welsenaere and Froment [7]
aT
A L 1 Ar ρ k e P − − = (5)
cat
L
kgρ 0.5203
m=
1a 13636 K−=
( ) 119.8371 catk 21.07e kmol h kg kPa
−=
1rxnΔH = -306707 kcal / kmol
de Lasa [2]
( )A L 21 23 A-r = ρ k + k P (6)
( )B L 21 A 22 Br = ρ k P - k P (7)
( )C L 23 A 22 Br = 8ρ k P + k P (8)
( )13587.6810.59 1T
21 catk 21.07e kmol h kg kPa − − =
( )15801.9711.62 1T
22 catk 21.07e kmol h kg kPa − − =
( )14392.889.73 1T
23 catk 21.07e kmol h kg kPa − − =
21rxnΔH = -307122 kcal / kmol
22rxnΔH = -7837000 kcal / kmol
23rxnΔH = -1090822 kcal / kmol
Chandrasekharan and Calderbank [17]
( )− = + +A v b t 31 22 33 Ar θ αρ F k k k P (9)
( )= +B v b t 32 A 35 Er θ αρ F k P k P (10)
=C v b t 33 Ar 8θ αρ F k P (11)
CH3
CH3
O
O
O
2
CH3
CH3
O
O
O
O
CH3
O
O
− rA = ρL(k21 + k23)PA (6)
rB = ρL(k21PA − k22PB) (7)
rC = 8ρL(k23PA + k22PB) (8)
k21 = 21.07e(10.59− 13587.68T ) kmol
(h kgcat kPa
)−1
k22 = 21.07e(11.62− 15801.97T ) kmol
(h kgcat kPa
)−1
k23 = 21.07e(9.73− 14392.88T ) kmol
(h kgcat kPa
)−1
∆Hrxn21 = −307122 kcal/kmol∆Hrxn22 = −7837000 kcal/kmol∆Hrxn23 = −1090822 kcal/kmol
Chandrasekharan and Calderbank [17]
Catalysts 2020, 10, x FOR PEER REVIEW 7 of 17
Table 3. Kinetic models for o-xylene oxidation considered in this work.
van Welsenaere and Froment [7]
aT
A L 1 Ar ρ k e P − − = (5)
cat
L
kgρ 0.5203
m=
1a 13636 K−=
( ) 119.8371 catk 21.07e kmol h kg kPa
−=
1rxnΔH = -306707 kcal / kmol
de Lasa [2]
( )A L 21 23 A-r = ρ k + k P (6)
( )B L 21 A 22 Br = ρ k P - k P (7)
( )C L 23 A 22 Br = 8ρ k P + k P (8)
( )13587.6810.59 1T
21 catk 21.07e kmol h kg kPa − − =
( )15801.9711.62 1T
22 catk 21.07e kmol h kg kPa − − =
( )14392.889.73 1T
23 catk 21.07e kmol h kg kPa − − =
21rxnΔH = -307122 kcal / kmol
22rxnΔH = -7837000 kcal / kmol
23rxnΔH = -1090822 kcal / kmol
Chandrasekharan and Calderbank [17]
( )− = + +A v b t 31 22 33 Ar θ αρ F k k k P (9)
( )= +B v b t 32 A 35 Er θ αρ F k P k P (10)
=C v b t 33 Ar 8θ αρ F k P (11)
CH3
CH3
O
O
O
2
CH3
CH3
O
O
O
O
CH3
O
O
− rA = θvαρbFt(k31 + k22 + k33)PA (9)
rB = θvαρbFt(k32PA + k35PE) (10)
rC = 8θvαρbFtk33PA (11)
Catalysts 2020, 10, 626 7 of 15
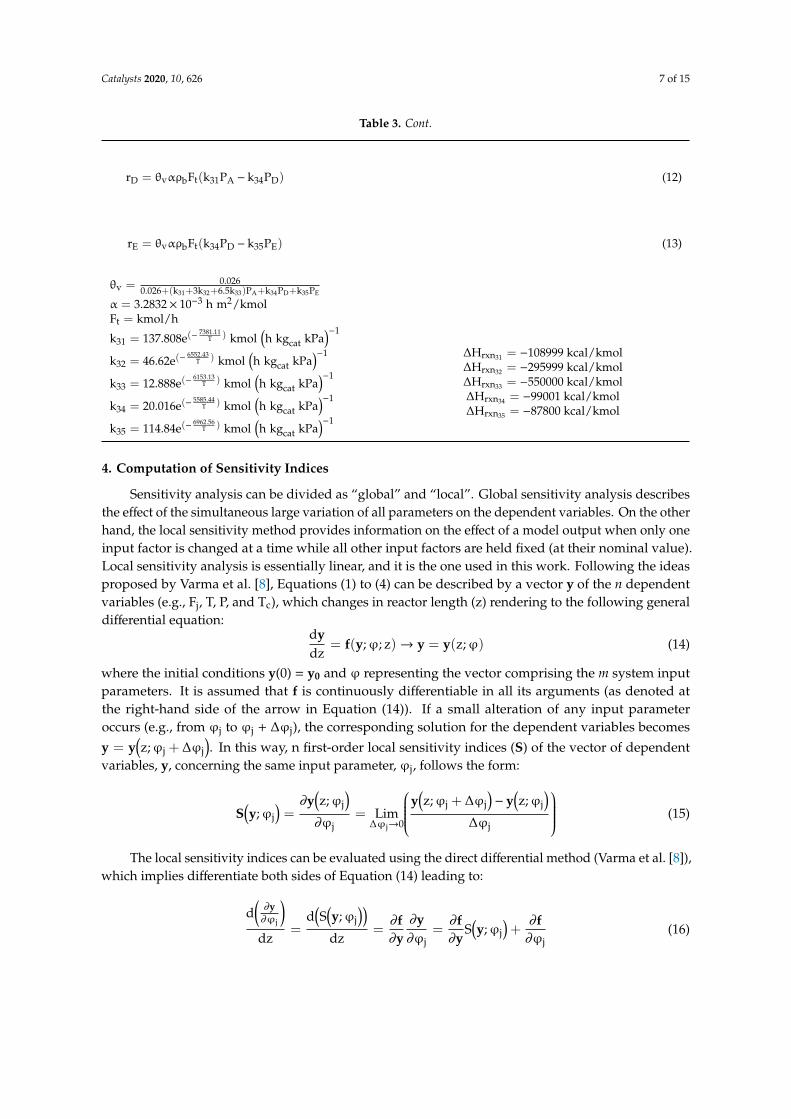
Table 3. Cont.
rD = θvαρbFt(k31PA − k34PD) (12)
rE = θvαρbFt(k34PD − k35PE) (13)
θv = 0.0260.026+(k31+3k32+6.5k33)PA+k34PD+k35PE
α = 3.2832× 10⁻³ h m2/kmolFt = kmol/h
k31 = 137.808e(−7381.11
T ) kmol(h kgcat kPa
)−1
k32 = 46.62e(−6552.43
T ) kmol(h kgcat kPa
)−1
k33 = 12.888e(−6153.13
T ) kmol(h kgcat kPa
)−1
k34 = 20.016e(−5585.44
T ) kmol(h kgcat kPa
)−1
k35 = 114.84e(−6962.56
T ) kmol(h kgcat kPa
)−1
∆Hrxn31 = −108999 kcal/kmol∆Hrxn32 = −295999 kcal/kmol∆Hrxn33 = −550000 kcal/kmol∆Hrxn34 = −99001 kcal/kmol∆Hrxn35 = −87800 kcal/kmol
4. Computation of Sensitivity Indices
Sensitivity analysis can be divided as “global” and “local”. Global sensitivity analysis describesthe effect of the simultaneous large variation of all parameters on the dependent variables. On the otherhand, the local sensitivity method provides information on the effect of a model output when only oneinput factor is changed at a time while all other input factors are held fixed (at their nominal value).Local sensitivity analysis is essentially linear, and it is the one used in this work. Following the ideasproposed by Varma et al. [8], Equations (1) to (4) can be described by a vector y of the n dependentvariables (e.g., Fj, T, P, and Tc), which changes in reactor length (z) rendering to the following generaldifferential equation:
dydz
= f(y;ϕ; z)→ y = y(z;ϕ) (14)
where the initial conditions y(0) = y0 and ϕ representing the vector comprising the m system inputparameters. It is assumed that f is continuously differentiable in all its arguments (as denoted atthe right-hand side of the arrow in Equation (14)). If a small alteration of any input parameteroccurs (e.g., from ϕj to ϕj + ∆ϕj), the corresponding solution for the dependent variables becomes
y = y(z;ϕj + ∆ϕj
). In this way, n first-order local sensitivity indices (S) of the vector of dependent
variables, y, concerning the same input parameter, ϕj, follows the form:
S(y;ϕj
)=∂y
(z;ϕj
)∂ϕj
= Lim∆ϕj→0
y(z;ϕj + ∆ϕj
)− y
(z;ϕj
)∆ϕj
(15)
The local sensitivity indices can be evaluated using the direct differential method (Varma et al. [8]),which implies differentiate both sides of Equation (14) leading to:
d(∂y∂ϕj
)dz
=d(S(y;ϕj
))dz
=∂f∂y∂y∂ϕj
=∂f∂y
S(y;ϕj
)+∂f∂ϕj
(16)
Catalysts 2020, 10, 626 8 of 15
Its initial conditions can also be obtained by differentiating the initial condition of Equation (14).Thus, depending on which input parameter in the vector ϕ is chosen, it is possible to obtain:
S(y;ϕj
)∣∣∣∣z=0
=
{0,ϕj , y(0)1,ϕj = y(0)
(17)
Thus, the simultaneous solution of Equation (14) (e.g., Equations (1) to (4)) and sensitivityEquation (16), along with their corresponding initial conditions, obtain the value of the dependentvariable and the corresponding local sensibility index, as a function of the independent variable (z).For comparison with the above-mentioned works [7,12,13,16,28], sensitivity indices with respect to theinlet temperature of the reactants (To) are evaluated for Fj, T and Tc as follows:
dS(Fi, To)
dz=
M∑j=1
∂fi
∂FjS(Fj, To
)+∂fi
∂TS(T, To) (18)
dS(T, To)
dz=
M∑j=1
∂fi
∂FjS(Fj, To
)+∂fi
∂TS(T, To) +
∂fi
∂TCS(TC, To) (19)
dS(TC, To)
dz=∂fi
∂TS(T, To) +
∂fi
∂TCS(TC, To) (20)
with the initial conditions:
z = 0, ∀i S(Fi, To) = 0, S(T, To) = 1, S(TC, To) = 0 (21)
5. Numerical Simulation
It is worthy of note that, depending on the reaction rate expressions included in the mathematicalmodel, the final form and the number of parametric sensitivity equations will be different for each caseanalyzed in this work. Consequently, each reaction problem will correspond to a different numericalchallenge, because each mechanism must fulfill the operating sensitivity limit (S (T; To) = 1) at a singlepoint for the interval z = (0.2]. Their solution strategies are summarized in Sections 5.1 and 5.2.
5.1. For Constant Temperature or Co-Current Flow in the Shell Side
These cases imply the integration of a set of, initial value, ordinary differential equations (ODE).Their solution is based on the execution of the ode15s MatLab®function, linked to the followingcondition: ∃! z [0,2]: S(T; To) = 1. This means that it is necessary to search, within the solutionrange of the sensitivity index of the reactive temperature, relative to the inlet temperature, a singlecondition different from the initial one, such that S(T; To) = 1. Thus, if the inlet temperature is set,the inlet o-xylene pressure will be varied until the criterion will be met (using additionally the fsolveMatLab®function with a tolerance of 1 × 10⁻⁶).
5.2. For Countercurrent Flow in the Shell Side
The solution of this case infers, in addition to the sensitivity index restriction, the fulfillment ofthe boundary conditions imposed by the fluid in the shell side. Thus, it is necessary to include twomore restrictions: i) z = 2→ Tco = To and ii) z = 2→ S(TC; To) = 0; generating a quite challengingnumerical problem which requires modifying, simultaneously, three joint variables and a trial-and-errorprocedure. To achieve this, the shooting method was used where the inlet pressure or temperature(depending on the case), the outlet temperature of the reactive fluid and the sensitivity index forthe inlet temperature, relative to the reactive temperature at the reactor outlet, were set. Then, tominimize the objective functions, a restricted nonlinear least-squares minimization method (using thelsqnonlin MatLab®function) allows for the limiting of the solutions to those corresponding to logical
Catalysts 2020, 10, 626 9 of 15
intervals of system operational conditions. For very demanding cases, such as the one including fivereactions, numerical difficulties were overcome by an orthogonal collocation method (using the bvp4cMatlab®function).
6. Results
To analyze the behavior of o-xylene conversion and the reaction temperature, and to give a clearinterpretation of the temperature sensitivity index, the reactor performance was examined on the basisof each of the three kinetic models. Moreover, the influence of the two types of heat exchange operation(e.g., variable fluid temperature with co-current or countercurrent operation) was also compared.
6.1. Constant Cooling Temperature (TC = T0 = 625 K)
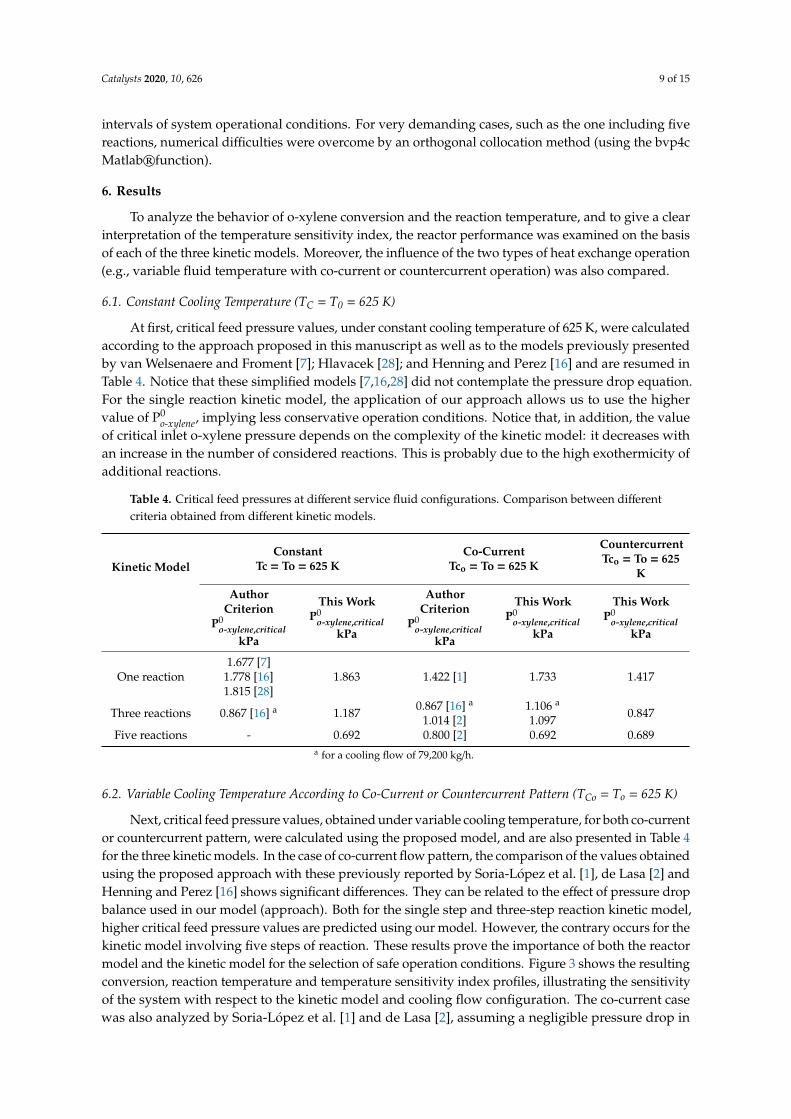
At first, critical feed pressure values, under constant cooling temperature of 625 K, were calculatedaccording to the approach proposed in this manuscript as well as to the models previously presentedby van Welsenaere and Froment [7]; Hlavacek [28]; and Henning and Perez [16] and are resumed inTable 4. Notice that these simplified models [7,16,28] did not contemplate the pressure drop equation.For the single reaction kinetic model, the application of our approach allows us to use the highervalue of P0
o-xylene, implying less conservative operation conditions. Notice that, in addition, the valueof critical inlet o-xylene pressure depends on the complexity of the kinetic model: it decreases withan increase in the number of considered reactions. This is probably due to the high exothermicity ofadditional reactions.
Table 4. Critical feed pressures at different service fluid configurations. Comparison between differentcriteria obtained from different kinetic models.
Kinetic ModelConstant
Tc = To = 625 KCo-Current
Tco = To = 625 K
CountercurrentTco = To = 625
K
AuthorCriterion
P0o-xylene,critical
kPa
This WorkP0
o-xylene,criticalkPa
AuthorCriterion
P0o-xylene,critical
kPa
This WorkP0
o-xylene,criticalkPa
This WorkP0
o-xylene,criticalkPa
One reaction1.677 [7]
1.778 [16]1.815 [28]
1.863 1.422 [1] 1.733 1.417
Three reactions 0.867 [16] a 1.187 0.867 [16] a
1.014 [2]1.106 a
1.097 0.847
Five reactions - 0.692 0.800 [2] 0.692 0.689a for a cooling flow of 79,200 kg/h.
6.2. Variable Cooling Temperature According to Co-Current or Countercurrent Pattern (TCo = To = 625 K)
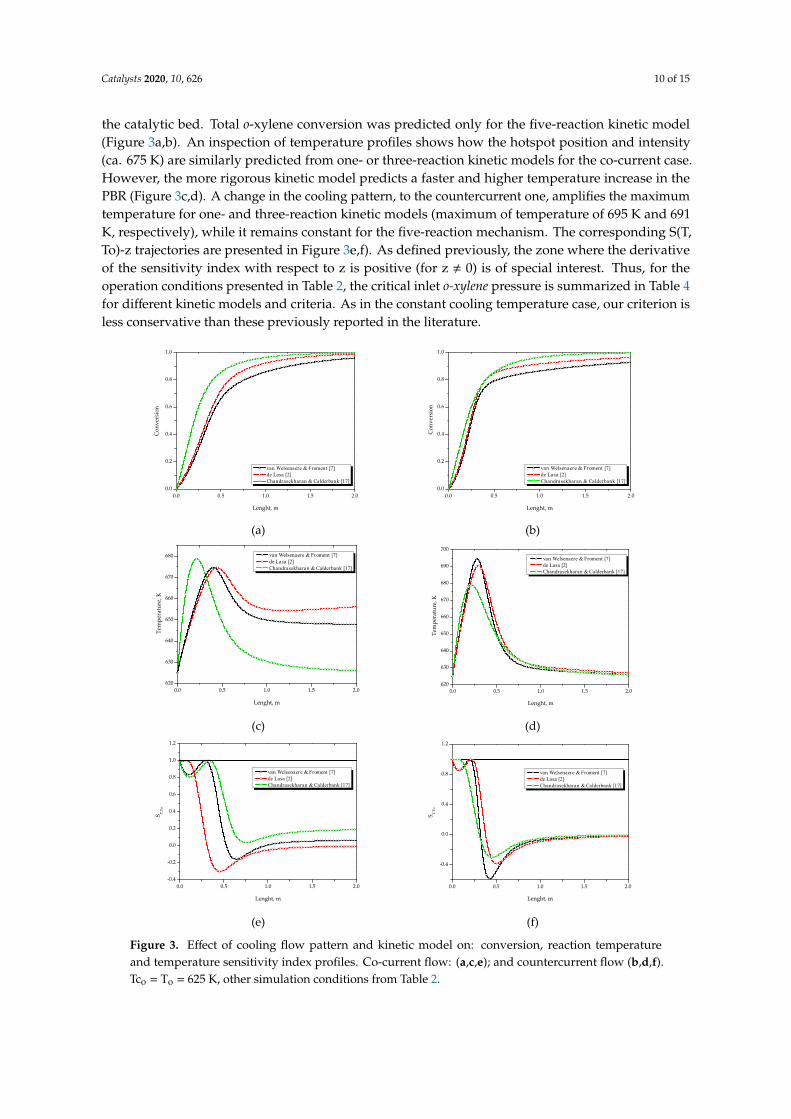
Next, critical feed pressure values, obtained under variable cooling temperature, for both co-currentor countercurrent pattern, were calculated using the proposed model, and are also presented in Table 4for the three kinetic models. In the case of co-current flow pattern, the comparison of the values obtainedusing the proposed approach with these previously reported by Soria-López et al. [1], de Lasa [2] andHenning and Perez [16] shows significant differences. They can be related to the effect of pressure dropbalance used in our model (approach). Both for the single step and three-step reaction kinetic model,higher critical feed pressure values are predicted using our model. However, the contrary occurs for thekinetic model involving five steps of reaction. These results prove the importance of both the reactormodel and the kinetic model for the selection of safe operation conditions. Figure 3 shows the resultingconversion, reaction temperature and temperature sensitivity index profiles, illustrating the sensitivityof the system with respect to the kinetic model and cooling flow configuration. The co-current casewas also analyzed by Soria-López et al. [1] and de Lasa [2], assuming a negligible pressure drop in
Catalysts 2020, 10, 626 10 of 15
the catalytic bed. Total o-xylene conversion was predicted only for the five-reaction kinetic model(Figure 3a,b). An inspection of temperature profiles shows how the hotspot position and intensity(ca. 675 K) are similarly predicted from one- or three-reaction kinetic models for the co-current case.However, the more rigorous kinetic model predicts a faster and higher temperature increase in thePBR (Figure 3c,d). A change in the cooling pattern, to the countercurrent one, amplifies the maximumtemperature for one- and three-reaction kinetic models (maximum of temperature of 695 K and 691K, respectively), while it remains constant for the five-reaction mechanism. The corresponding S(T,To)-z trajectories are presented in Figure 3e,f). As defined previously, the zone where the derivativeof the sensitivity index with respect to z is positive (for z , 0) is of special interest. Thus, for theoperation conditions presented in Table 2, the critical inlet o-xylene pressure is summarized in Table 4for different kinetic models and criteria. As in the constant cooling temperature case, our criterion isless conservative than these previously reported in the literature.Catalysts 2020, 10, x FOR PEER REVIEW 12 of 17
(a)
(b)
(c)
(d)
(e)
(f)
Figure 3. Effect of cooling flow pattern and kinetic model on: conversion, reaction temperature and temperature sensitivity index profiles. Co-current flow: (a,c,e); and countercurrent flow (b,d,f). Tco = To = 625 K, other simulation conditions from Table 2.
6.3. Variable Cooling Temperature According to Co-current or Countercurrent Pattern (PAo = 0.9322 kPa)
This case is concerned with the determination of the maximum permissible inlet temperature of the reactor fluid, as a function of cooling flow pattern and the kinetic model, for a given inlet o-xylene partial pressure (the selected value of PAo = 0.9322 kPa was justified elsewhere [27,29]). Here, as defined in Section 5.2, for each kinetic model, the solution must fulfill both the sensitivity index restriction and the boundary conditions imposed by the fluid in the shell side. Figure 4 presents the obtained results for both cooling flow configurations. It illustrates the sensitivity of inlet temperature with respect to both the kinetic model and cooling flow configuration. In all cases, the lower feed temperatures, for safe operation conditions, is suggested by the five-reaction
0.0 0.5 1.0 1.5 2.00.0
0.2
0.4
0.6
0.8
1.0
Con
vers
ion
Lenght, m
van Welsenaere & Froment [7] de Lasa [2] Chandrasekharan & Calderbank [17]
0.0 0.5 1.0 1.5 2.00.0
0.2
0.4
0.6
0.8
1.0
Con
vers
ion
Lenght, m
van Welsenaere & Froment [7] de Lasa [2] Chandrasekharan & Calderbank [17]
0.0 0.5 1.0 1.5 2.0620
630
640
650
660
670
680
Tem
pera
ture
, K
Lenght, m
van Welsenaere & Froment [7] de Lasa [2] Chandrasekharan & Calderbank [17]
0.0 0.5 1.0 1.5 2.0620
630
640
650
660
670
680
690
700
Tem
pera
ture
, K
Lenght, m
van Welsenaere & Froment [7] de Lasa [2] Chandrasekharan & Calderbank [17]
0.0 0.5 1.0 1.5 2.0-0.4
-0.2
0.0
0.2
0.4
0.6
0.8
1.0
1.2
S T,To
Lenght, m
van Welsenaere & Froment [7] de Lasa [2] Chandrasekharan & Calderbank [17]
0.0 0.5 1.0 1.5 2.0
-0.4
0.0
0.4
0.8
1.2
S T,To
Lenght, m
van Welsenaere & Froment [7] de Lasa [2] Chandrasekharan & Calderbank [17]
Figure 3. Effect of cooling flow pattern and kinetic model on: conversion, reaction temperatureand temperature sensitivity index profiles. Co-current flow: (a,c,e); and countercurrent flow (b,d,f).Tco = To = 625 K, other simulation conditions from Table 2.
Catalysts 2020, 10, 626 11 of 15
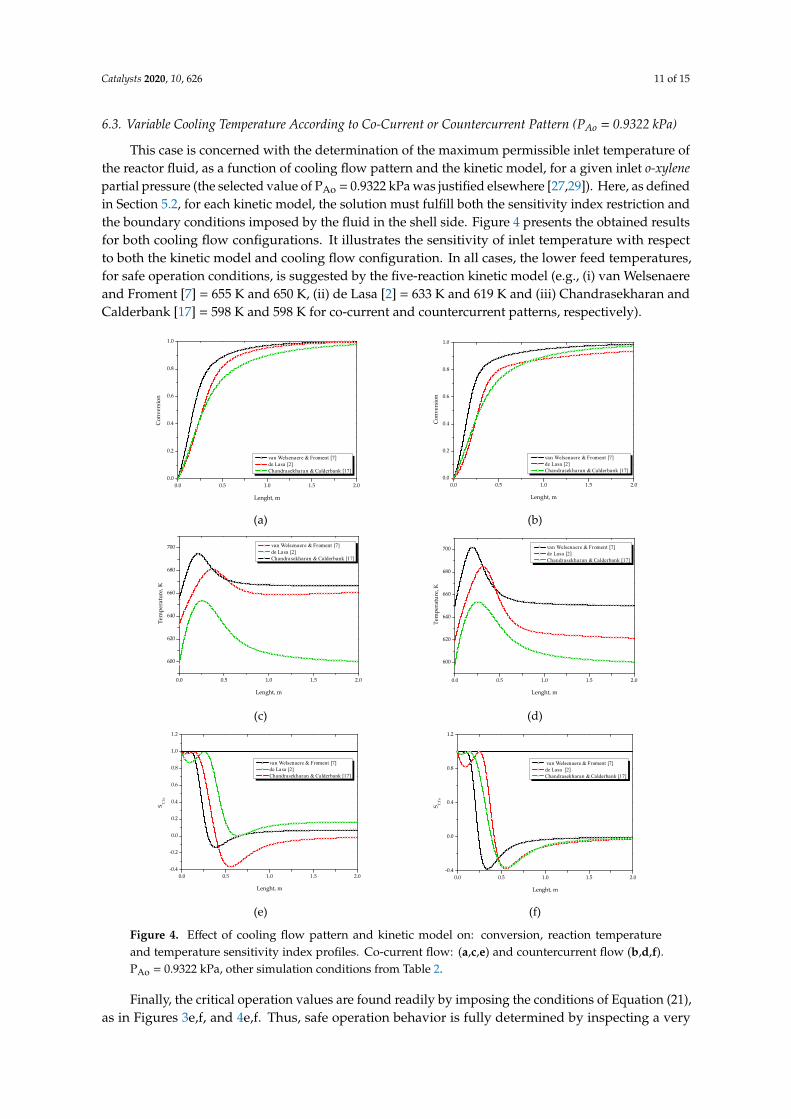
6.3. Variable Cooling Temperature According to Co-Current or Countercurrent Pattern (PAo = 0.9322 kPa)
This case is concerned with the determination of the maximum permissible inlet temperature ofthe reactor fluid, as a function of cooling flow pattern and the kinetic model, for a given inlet o-xylenepartial pressure (the selected value of PAo = 0.9322 kPa was justified elsewhere [27,29]). Here, as definedin Section 5.2, for each kinetic model, the solution must fulfill both the sensitivity index restriction andthe boundary conditions imposed by the fluid in the shell side. Figure 4 presents the obtained resultsfor both cooling flow configurations. It illustrates the sensitivity of inlet temperature with respectto both the kinetic model and cooling flow configuration. In all cases, the lower feed temperatures,for safe operation conditions, is suggested by the five-reaction kinetic model (e.g., (i) van Welsenaereand Froment [7] = 655 K and 650 K, (ii) de Lasa [2] = 633 K and 619 K and (iii) Chandrasekharan andCalderbank [17] = 598 K and 598 K for co-current and countercurrent patterns, respectively).
Catalysts 2020, 10, x FOR PEER REVIEW 13 of 17
kinetic model (e.g., (i) van Welsenaere and Froment [7] = 655 K and 650 K, (ii) de Lasa [2] = 633 K and 619 K and (iii) Chandrasekharan and Calderbank [17] = 598 K and 598 K for co-current and countercurrent patterns, respectively).
(a)
(b)
(c)
(d)
(e)
(f)
Figure 4. Effect of cooling flow pattern and kinetic model on: conversion, reaction temperature and temperature sensitivity index profiles. Co-current flow: (a, c, e) and countercurrent flow (b, d, f). PAo = 0.9322 kPa, other simulation conditions from Table 2.
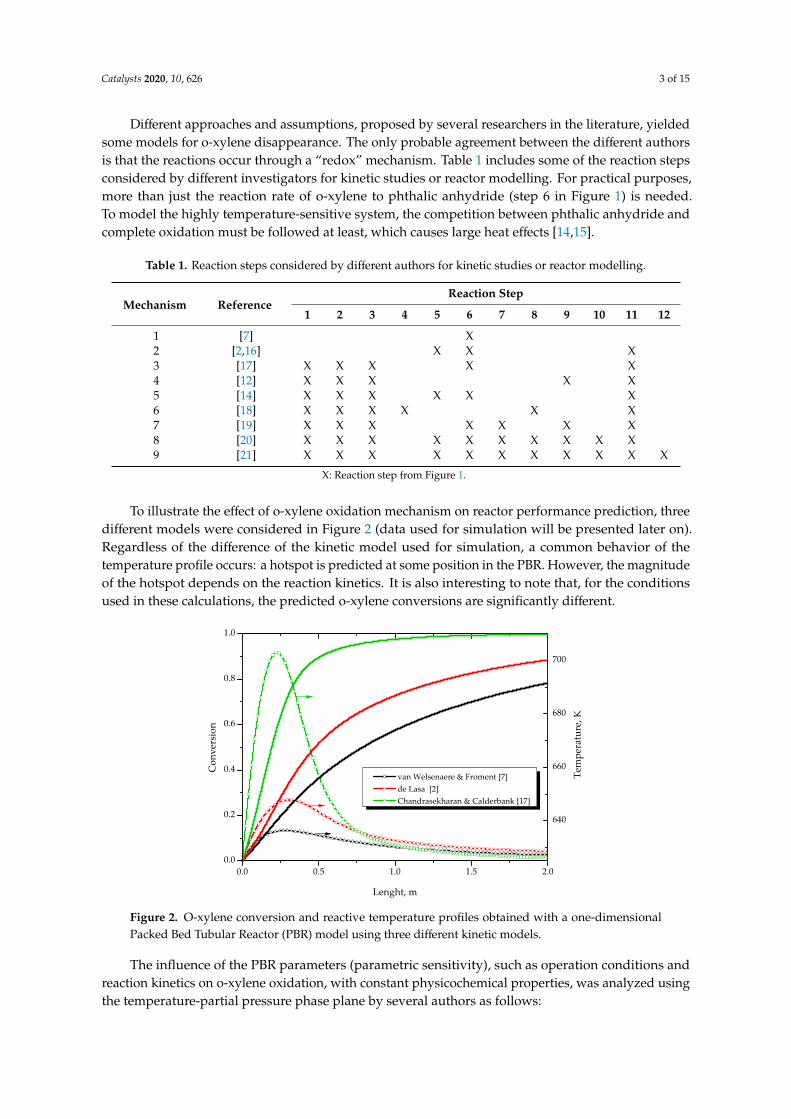
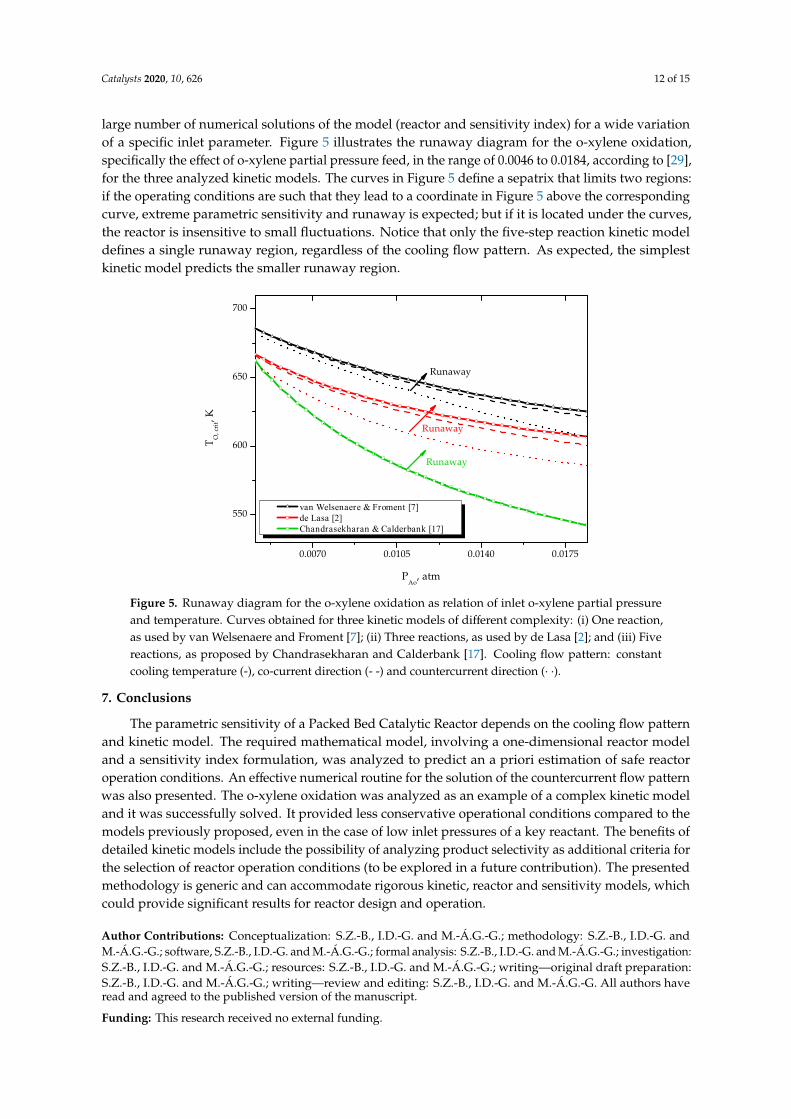
Finally, the critical operation values are found readily by imposing the conditions of Equation (21), as in Figures 3e, 3f, 4e and 4f. Thus, safe operation behavior is fully determined by inspecting a very large number of numerical solutions of the model (reactor and sensitivity index) for a wide variation of a specific inlet parameter. Figure 5 illustrates the runaway diagram for the o-xylene oxidation, specifically the effect of o-xylene partial pressure feed, in the range of 0.0046 to 0.0184, according to [29], for the three analyzed kinetic models. The curves in Figure 5 define a sepatrix that limits two regions: if the operating conditions are such that they lead to a coordinate in Figure 5 above the corresponding curve, extreme parametric sensitivity and runaway is expected; but if it is located under the curves, the reactor is insensitive to small fluctuations. Notice
0.0 0.5 1.0 1.5 2.00.0
0.2
0.4
0.6
0.8
1.0
Con
vers
ion
Lenght, m
van Welsenaere & Froment [7] de Lasa [2] Chandrasekharan & Calderbank [17]
0.0 0.5 1.0 1.5 2.00.0
0.2
0.4
0.6
0.8
1.0
Con
vers
ion
Lenght, m
van Welsenaere & Froment [7] de Lasa [2] Chandrasekharan & Calderbank [17]
0.0 0.5 1.0 1.5 2.0
600
620
640
660
680
700
Tem
pera
ture
, K
Lenght, m
van Welsenaere & Froment [7] de Lasa [2] Chandrasekharan & Calderbank [17]
0.0 0.5 1.0 1.5 2.0
600
620
640
660
680
700
Tem
pera
ture
, K
Lenght, m
van Welsenaere & Froment [7] de Lasa [2] Chandrasekharan & Calderbank [17]
0.0 0.5 1.0 1.5 2.0-0.4
-0.2
0.0
0.2
0.4
0.6
0.8
1.0
1.2
S T,To
Lenght, m
van Welsenaere & Froment [7] de Lasa [2] Chandrasekharan & Calderbank [17]
0.0 0.5 1.0 1.5 2.0-0.4
0.0
0.4
0.8
1.2
S T,To
Lenght, m
van Welsenaere & Froment [7] de Lasa [2] Chandrasekharan & Calderbank [17]
Figure 4. Effect of cooling flow pattern and kinetic model on: conversion, reaction temperatureand temperature sensitivity index profiles. Co-current flow: (a,c,e) and countercurrent flow (b,d,f).PAo = 0.9322 kPa, other simulation conditions from Table 2.
Finally, the critical operation values are found readily by imposing the conditions of Equation (21),as in Figures 3e,f, and 4e,f. Thus, safe operation behavior is fully determined by inspecting a very
Catalysts 2020, 10, 626 12 of 15
large number of numerical solutions of the model (reactor and sensitivity index) for a wide variationof a specific inlet parameter. Figure 5 illustrates the runaway diagram for the o-xylene oxidation,specifically the effect of o-xylene partial pressure feed, in the range of 0.0046 to 0.0184, according to [29],for the three analyzed kinetic models. The curves in Figure 5 define a sepatrix that limits two regions:if the operating conditions are such that they lead to a coordinate in Figure 5 above the correspondingcurve, extreme parametric sensitivity and runaway is expected; but if it is located under the curves,the reactor is insensitive to small fluctuations. Notice that only the five-step reaction kinetic modeldefines a single runaway region, regardless of the cooling flow pattern. As expected, the simplestkinetic model predicts the smaller runaway region.
Catalysts 2020, 10, x FOR PEER REVIEW 14 of 17
that only the five-step reaction kinetic model defines a single runaway region, regardless of the cooling flow pattern. As expected, the simplest kinetic model predicts the smaller runaway region.
Figure 5. Runaway diagram for the o-xylene oxidation as relation of inlet o-xylene partial pressure and temperature. Curves obtained for three kinetic models of different complexity: (i) One reaction, as used by van Welsenaere and Froment [7]; (ii) Three reactions, as used by de Lasa [2]; and (iii) Five reactions, as proposed by Chandrasekharan and Calderbank [17]. Cooling flow pattern: constant cooling temperature (-), co-current direction (- -) and countercurrent direction (· ·).
7. Conclusions
The parametric sensitivity of a Packed Bed Catalytic Reactor depends on the cooling flow pattern and kinetic model. The required mathematical model, involving a one-dimensional reactor model and a sensitivity index formulation, was analyzed to predict an a priori estimation of safe reactor operation conditions. An effective numerical routine for the solution of the countercurrent flow pattern was also presented. The o-xylene oxidation was analyzed as an example of a complex kinetic model and it was successfully solved. It provided less conservative operational conditions compared to the models previously proposed, even in the case of low inlet pressures of a key reactant. The benefits of detailed kinetic models include the possibility of analyzing product selectivity as additional criteria for the selection of reactor operation conditions (to be explored in a future contribution). The presented methodology is generic and can accommodate rigorous kinetic, reactor and sensitivity models, which could provide significant results for reactor design and operation.
Author Contributions: Conceptualization: S.Z.-B., I.D.-G. and M.-A.G.-G.; methodology: S.Z.-B., I.D.-G. and M.-A.G.-G.; software, S.Z.-B., I.D.-G. and M.-A.G.-G.; formal analysis: S.Z.-B., I.D.-G. and M.-A.G.-G.; investigation: S.Z.-B., I.D.-G. and M.-A.G.-G.; resources: S.Z.-B., I.D.-G. and M.-A.G.-G.; writing—original draft preparation: S.Z.-B., I.D.-G. and M.-A.G.-G.; writing—review and editing: S.Z.-B., I.D.-G. and M.-A.G.-G. All authors have read and agreed to the published version of the manuscript.
Funding: This research received no external funding.
Conflicts of Interest: The authors declare no conflict of interest.
0.0070 0.0105 0.0140 0.0175
550
600
650
700
van Welsenaere & Froment [7] de Lasa [2] Chandrasekharan & Calderbank [17]
Runaway
Runaway
T O, c
rit, K
PAo
, atm
Runaway
Figure 5. Runaway diagram for the o-xylene oxidation as relation of inlet o-xylene partial pressureand temperature. Curves obtained for three kinetic models of different complexity: (i) One reaction,as used by van Welsenaere and Froment [7]; (ii) Three reactions, as used by de Lasa [2]; and (iii) Fivereactions, as proposed by Chandrasekharan and Calderbank [17]. Cooling flow pattern: constantcooling temperature (-), co-current direction (- -) and countercurrent direction (· ·).
7. Conclusions
The parametric sensitivity of a Packed Bed Catalytic Reactor depends on the cooling flow patternand kinetic model. The required mathematical model, involving a one-dimensional reactor modeland a sensitivity index formulation, was analyzed to predict an a priori estimation of safe reactoroperation conditions. An effective numerical routine for the solution of the countercurrent flow patternwas also presented. The o-xylene oxidation was analyzed as an example of a complex kinetic modeland it was successfully solved. It provided less conservative operational conditions compared to themodels previously proposed, even in the case of low inlet pressures of a key reactant. The benefits ofdetailed kinetic models include the possibility of analyzing product selectivity as additional criteria forthe selection of reactor operation conditions (to be explored in a future contribution). The presentedmethodology is generic and can accommodate rigorous kinetic, reactor and sensitivity models, whichcould provide significant results for reactor design and operation.
Author Contributions: Conceptualization: S.Z.-B., I.D.-G. and M.-Á.G.-G.; methodology: S.Z.-B., I.D.-G. andM.-Á.G.-G.; software, S.Z.-B., I.D.-G. and M.-Á.G.-G.; formal analysis: S.Z.-B., I.D.-G. and M.-Á.G.-G.; investigation:S.Z.-B., I.D.-G. and M.-Á.G.-G.; resources: S.Z.-B., I.D.-G. and M.-Á.G.-G.; writing—original draft preparation:S.Z.-B., I.D.-G. and M.-Á.G.-G.; writing—review and editing: S.Z.-B., I.D.-G. and M.-Á.G.-G. All authors haveread and agreed to the published version of the manuscript.
Funding: This research received no external funding.
Catalysts 2020, 10, 626 13 of 15
Conflicts of Interest: The authors declare no conflict of interest.
Notation
a Kinetic parameter (K−1) u Superficial velocity (m/h)
Cpc
Heat capacityof the coolingmedium
(kcalkg K
)wc Cooling medium flow rate (kg/h)
Cpg
Heat capacityof the gaseousmixture
(kcalkg K
)y Dependent’s variables vector
Dp Particle diameter (m) z Axial coordinate (m)Dt Tube diameter (m) ∆Hrxn Heat of reaction (kcal/kmol)f Continuous function Greek letters
F Molar flow (kmol/h) αKineticconstant
(h m2
kmol
)Ft Total molar flow (kmol/h) ε Bed porosity
G Mass flow(
kgm2 h
)θv Kinetic parameter
kKineticconstant
(kmol
h kgcat kPa
)ρb
Bulk density of the fixed bed(kg/m3)
L Total reactor length (m) ρg Gas mixture density (kg/m3)
MMolecular weight of gaseousmixture (kg/m3)
ρL Linear density (kgcat/m3)
N Total number of reactions ϕ Input parametersP Total pressure (kPa) SubscriptsP0
O2Oxygen’s partial pressure (kPa) i Counter for reactions
q Total number of compounds j Counter for compoundsr Reaction rate
(kmolm h
)o Inlet conditions
Rep Particle Reynolds number 1 O-xylene to phthalic anhydride
S Sensitivity coefficient 21O-xylene to phthalic anhydridestep
S(F,To)Molar flow sensitivity coefficientwith respect to the inlettemperature
22Phthalic anhydride to CO andCO2 step
S(T,To)Temperature sensitivity coefficientwith respect to the inlettemperature
23 O-xylene to CO and CO2 step
S(Tc,To)Cooling medium sensitivitycoefficient with respect to the inlettemperature
31 O-xylene to O-tolualdehyde step
T Temperature inside the reactor (K) 32O-xylene to phthalic anhydridestep
TcTemperature of the coolingmedium (K)
33 O-xylene to COx step
tn Number of tubes 34 O-tolualdehyde to Phthalide step
UOverall heattransfercoefficient
(kcal
m2 h K
)35
Phthalide to phthalic anhydridestep
References
1. Lopez, A.; De Lasa, H.; Porras, J. Parametric Sensitivity of a Fixed Bed Catalytic Reactor. Chem. Eng. Sci.1981, 36, 285–291. [CrossRef]
2. De Lasa, H. Application of the Pseudoadiabatic Operation to Catalytic Fixed Bed Reactors Case of theOrthoxylene Oxidation. Can. J. Chem. Eng. 1983, 61, 710–718. [CrossRef]
Catalysts 2020, 10, 626 14 of 15
3. Arandes, J.; De Lasa, H. Pseudoadiabatic Operation for Fixed-Bed Catalytic Reactors: Methods for Findingthe Limits of the Regime. Chem. Eng. J. Biochem. Eng. J. 1995, 58, 33–44. [CrossRef]
4. Richter, O.; Mestl, G. Deactivation of Commercial, High-Load o-Xylene Feed VOx/TiO2 Phthalic AnhydrideCatalyst by Unusual Over-Reduction. Catalisis 2019, 9, 435. [CrossRef]
5. Bilous, O.; Amundson, N.R. Chemical Reactor Stability and Sensitivity: II. Effect of Parameters on Sensitivityof Empty Tubular Reactors. AIChE J. 1956, 2, 117–126. [CrossRef]
6. Balakotaiah, V.; Luss, D. Explicit Runaway Criterion for Catalytic Reactors with Transport Limitations.AIChE J. 1991, 37, 1780–1788. [CrossRef]
7. Van Welsenaere, R.; Froment, G. Parametric Sensitivity and Runaway in Fixed Bed Catalytic Reactors. Chem.Eng. Sci. 1970, 25, 1503–1516. [CrossRef]
8. Varma, A.; Morbidelli, M.; Wu, H. Parametric Sensitivity in Chemical Systems; Cambridge University Press(CUP): Cambridge, UK, 1999.
9. Strozzi, F.; Zaldívar, J. A General Method for Assessing the Thermal Stability of Batch Chemical Reactors bySensitivity Calculation Based on Lyapunov Exponents. Chem. Eng. Sci. 1994, 49, 2681–2688. [CrossRef]
10. Bosch, J.; Strozzi, F.; Snee, T.; Hare, J.; Zaldívar, J. A Comparative Analysis between Temperature and PressureMeasurements for Early Detection of Runaway Initiation. J. Loss Prev. Process. Ind. 2004, 17, 389–395.[CrossRef]
11. Rase, H.F. Fixed-Bed Reactor Design and Diagnostics; Butterworth-Heinemann: Oxford, UK, 1990.12. Papageorgiou, J.; Froment, G. Phthalic Anhydride Synthesis. Reactor Optimization Aspects. Chem. Eng. Sci.
1996, 51, 2091–2098. [CrossRef]13. Gimeno, M.P.; Gascón, J.; Téllez, C.; Herguido, J.; Menéndez, M. Selective Oxidation of O-Xylene to Phthalic
Anhydride over V2O5/TiO2: Kinetic Study in a Fluidized Bed Reactor. Chem. Eng. Process 2008, 47, 1844–1852.[CrossRef]
14. Anastov, A.I. Deactivation of an Industrial V2O5–TiO2 Catalyst for Oxidation of O-Xylene into PhthalicAnhydride. Chem. Eng. Process 2003, 42, 449–460. [CrossRef]
15. Anastov, A.I.; Nikolov, V.A. Optimal Policies of Operation of a Fixed-Bed Reactor for Oxidation of O-Xyleneinto Phthalic Anhydride. Ind. Eng. Chem. Res. 1998, 37, 3424–3433. [CrossRef]
16. Henning, G.P.; Perez, G.A. Parametric Sensivity in Fixed-Bed Catalytic Reactors. Chem. Eng. Sci. 1986, 41,83–88. [CrossRef]
17. Chandrasekharan, K.; Calderbank, P. Prediction of packed-bed catalytic reactor performance for a complexreaction (oxidation of o-xylene to phthalic anhydride). Chem. Eng. Sci. 1979, 34, 1323–1331. [CrossRef]
18. Wainwright, M.S.; Foster, N.R. Catalysts, Kinetics and Reactor Design in Phthalic Anhydride Synthesis.Catal. Rev. 1979, 19, 211–292. [CrossRef]
19. Skrzypek, J.; Grzesik, M.; Galantowicz, M.; Solinski, J. Kinetics of the Catalytic Air Oxidation of O-Xyleneover a Commercial V2O5/TiO2 Catalyst. Chem. Eng. Sci. 1985, 40, 611–620. [CrossRef]
20. Dias, C.R.; Farinha Portela, M.; Bond, G.C. Oxidation of O-Xylene to Phthalic Anhydride over V2O5/TiO2Catalysts. IV Mathematical Modelling Study and Analysis of the Reaction Network. J. Catal. 1996, 164,276–287. [CrossRef]
21. Yabrov, A.A.; Ivanov, A.A. Response studies of the mechanism of o-xylene oxidation over a vanadium-titaniumoxide catalyst. React. Kinet. Catal. Lett. 1980, 14, 347–351. [CrossRef]
22. Akella, L.M.; Lee, H.H. A Design Approach Based on Pase Plane Analysis: Countercurrent Reactor/HeatExchanger with Parametric Sensitivity. AIChE J. 1983, 29, 87–94. [CrossRef]
23. Hosten, L.; Froment, G. Parametric Sensitivity in co-Currently Cooled Tubular Reactors. Chem. Eng. Sci.1986, 41, 1073–1080. [CrossRef]
24. Rajadhyaksha, R.; Vasudeva, K.; Doraiswamy, L. Parametric Sensitivity in Fixed-Bed Reactors. Chem. Eng.Sci. 1975, 30, 1399–1408. [CrossRef]
25. McGreavy, C.; Adderley, C.I. Parametric Sensitivity and Temperature Runaway in Heterogeneous Fixed BedReactors. Adv. Chem. 1974, 133, 519–531. [CrossRef]
26. Fogler, H.S. Elements of Chemical Reaction Engineering. Chem. Eng. Sci. 1987, 42, 2493. [CrossRef]27. Rosendall, B.; Finlayson, B.A. Transport Effects in Packed–Bed Oxidation Reactors. Comput. Chem. Eng. 1995,
19, 1207–1218. [CrossRef]

Catalysts 2020, 10, 626 15 of 15
28. Hlavacek, V. Aspects in Design of Packed Catalytic Reactors. Ind. Eng. Chem. 1970, 62, 8–26. [CrossRef]29. Elnashaie, S.S.E.H.; Elshishini, S.S. Modelling, Simulation and Optimization of Industrial Fixed Bed Reactors;
Gordon & Breach Science Publishers: Yverdon, Switzerland, 1993; pp. 383–384.
© 2020 by the authors. Licensee MDPI, Basel, Switzerland. This article is an open accessarticle distributed under the terms and conditions of the Creative Commons Attribution(CC BY) license (http://creativecommons.org/licenses/by/4.0/).