Embed Size (px)
Citation preview
AP42 Section
Background Ref:
Title:
6.10
3
Benzene Emissions from Maleic Anhydride Industry -
Background Information for Proposed Standards
EPA 45013-80-001 a
February 1980
I
k
I
i I 1 f
i !
United Sfatas Office of Air Quality EPA-450/3-80-001 a Environmental Protection Planning and Standards February 1980 4ww Research Triangle Park NC 2771 1
~
Air ~~~
GEPA Benzene Emissions Draft from Maleic EIS Anhydride Industry - Background Information for Proposed Standards
EPA-450/3-80-001 a
Benzene Emissions from Maleic Anhydride Industry -
Background Information for' Proposed Standards
Emission Standards and Engineering Division
U S ENVIRONMENTAL PROTECTION AGENCY Office of Air, Noise, and Radiation
Office of Air Quality Planning and Standards Research Triangle Park, North Carolina 2771 1
February 1 9 8 0
This report has been reviewed by the Emission St.andards and Engi- neering Division of the Office of Air Quality Planning and Stand- ards, U.S. Environmental Protection Agency, and approved for publication. intended to constitute endorsement or recommendation for use. Copies of this report are available through the Library Services Office (MD-35), U. S. Environmental Protection Agency, Research Triangle Park, N.C. 27711, or from National Technical Information Services, 5285 Port Royal Road, Springfield, Va. 22161.
Mention of trade names or commercial products is not
PUBLICATION NO. EPA-450/3-80-001a
. ~~~ ~ ~~~ ~
i i
Background Information and Draft
Environmental Impact Statement for
Benzene Emissions from Maleic Anhydride Plants
Type of Action: Administrative
Prepared by:
, L. . .e .I , / ..I 5 !.>,..',' ; ,. L < ,,;/. (,,,/,): L Don R. Goodwip /' Date Director, Emission Standards and Engineering Division Environmental Protection Agency Research Triangle Park, N.C. 27711
Approved by:
---? /
David Z A H Z L ! m L G. Hawkins
Assistant Administrator, Air, Noise, and Radiation Environmental Protection Agency Washington, D.C. 20460
Draft Statement Submitted to EPA's Office of Federal Activities for Review on
This document may be reviewed at:
Central Docket Section Room 29036, Waterside Mall Environmental Protection Agency 401 M Street, S.W. Washington, D.C. 20460
Additional copies may be obtained at:
Environmental Protection Agency Library (MD-35) Research Triangle Park, N.C. 27711
National Technical Information Service 5285 Port Royal Road Springfield, Va. 22161
i i i
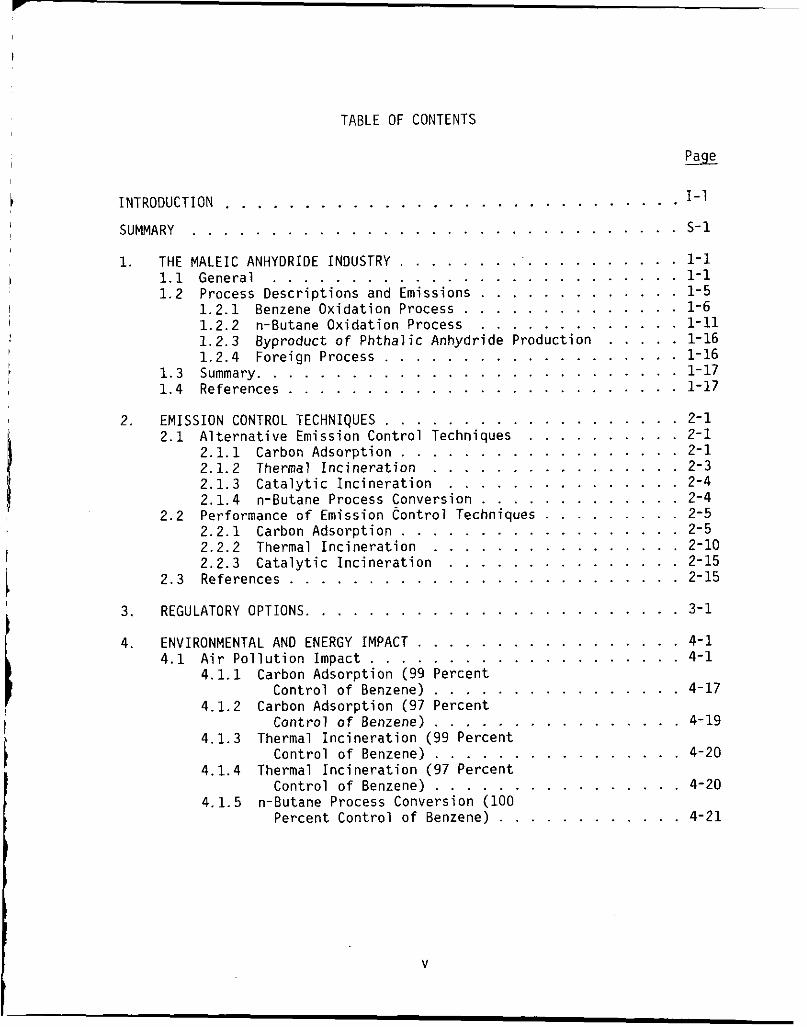
TABLE OF CONTENTS
%
1-1 INTRODUCTION . . . . . . . . . . . . . . . . . . . . . . . . . . . . . SUMMARY . . . . . . . . . . . . . . . . . . . . . . . . . . . . . . . 5-1
1 . THE MALEIC ANHYDRIDE INDUSTRY . . . . . . . . . . . . . . . . . . . 1-1 1.1 General . . . . . . . . . . . . . . . . . . . . . . . . . . 1-1 1.2 Process Desc r ip t i ons and Emissions . . . . . . . . . . . . . 1-5
1 .2 .1 Benzene Oxidat ion Process . . . . . . . . . . . . . . 1-6 1.2.2 n-Butane Ox ida t i on Process . . . . . . . . . . . . . 1-11 1.2.3 Byproduct o f P h t h a l i c Anhydride Product ion . . . . . 1-16 1.2.4 Foreign Process . . . . . . . . . . . . . . . . . . . 1-16
1 . 3 Summary . . . . . . . . . . . . . . . . . . . . . . . . . . . 1-17 1 . 4 References . . . . . . . . . . . . . . . . . . . . . . . . . 1-17
2 . E M I S S I O N CONTROL TECHNIQUES . . . . . . . . . . . . . . . . . . . 2 - 1 2 . 1 A l t e r n a t i v e Emission Control Techniques . . . . . . . . . . 2-1
2 . 1 . 1 Carbon Adsorpt ion . . . . . . . . . . . . . . . . . . 2-1 2.1.2 Thermal I n c i n e r a t i o n . . . . . . . . . . . . . . . . 2-3 2.1.3 C a t a l y t i c I n c i n e r a t i o n . . . . . . . . . . . . . . . 2-4 2.1.4 n-Butane Process Conversion . . . . . . . . . . . . . 2-4
2.2 Performance of Emission Contro l Techniques . . . . . . . . . 2-5 2.2.1 Carbon Adsorpt ion . . . . . . . . . . . . . . . . . . 2-5 2.2.2 Thermal I n c i n e r a t i o n . . . . . . . . . . . . . . . . 2-10 2.2.3 C a t a l y t i c I n c i n e r a t i o n . . . . . . . . . . . . . . . 2-15
2.3 References . . . . . . . . . . . . . . . . . . . . . . . . . 2-15
3 . REGULATORY OPTIONS . . . . . . . . . . . . . . . . . . . . . . . . 3-1
4 . ENVIRONMENTAL AND ENERGY IMPACT . . . . . . . . . . . . . . . . . 4-1 4 . 1 A i r P o l l u t i o n Impact . . . . . . . . . . . . . . . . . . . . 4 - 1
4.1.1 Carbon Adsorpt ion (99 Percent
4.1.2 Carbon Adsorpt ion (97 Percent
4.1.3 Thermal I n c i n e r a t i o n (99 Percent
4.1.4 Thermal I n c i n e r a t i o n (97 Percent
4.1.5 n-Butane Process Conversion (100
Control o f Benzene) . . . . . . . . . . . . . . . . 4-17
Contro l o f Benzene) . . . . . . . . . . . . . . . . 4-19
Control o f Benzene) . . . . . . . . . . . . . . . . 4-20
Control of Benzene) . . . . . . . . . . . . . . . . 4-20
Percent Control o f Benzene) . . . . . . . . . . . . 4-21
I
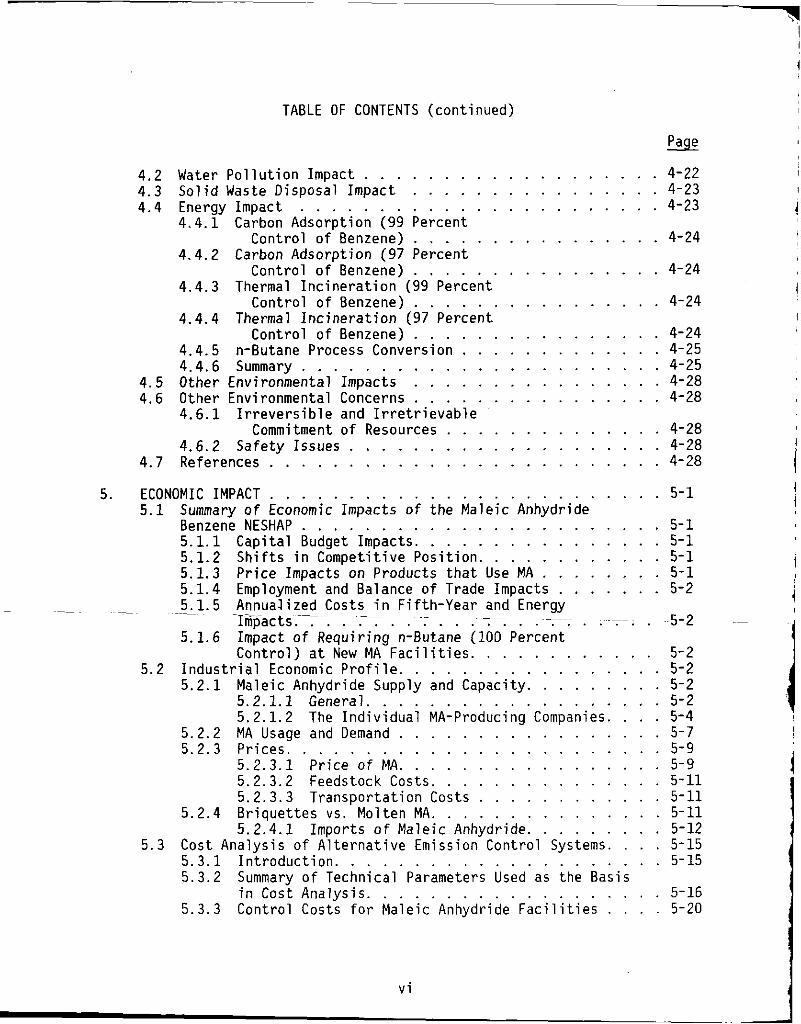
TABLE OF CONTENTS (continued)
4.2 Water Pollution Impact . . . . . . . . . 4.3 Solid Waste Disposal Impact . . . . . . 4.4 Energy Impact . . . . . . . . . . . . .
4.4.1 Carbon Adsorption (99 Percent Control of Benzene) . . . . . .
4.4.2 Carbon Adsorption (97 Percent Control of Benzene) . . . . . .
4.4.3 Thermal Incineration (99 Percent Control of Benzene) . . . . . .
4.4.4 Thermal Incineration (97 Percent Control of Benzene) . . . . . .
4.4.5 n-Butane Process Conversion . . . 4.4.6 Summary . . . . . . . . . . . . .
4.5 Other Environmental Impacts . . . . . . 4.6 Other Environmental Concerns . . . . . .
Commitment of Resources . . . . 4.6.2 Safety Issues . . . . . . . . . .
4.7 References . . . . . . . . . . . . . . .
4.6.1 Irreversible and Irretrievable
& . . . . . . . . . . 4-22 . . . . . . . . . . 4-23 . . . . . . . . . . 4-23
. . . . . . . . . . 4-24
. . . . . . . . . . 4-24
. . . . . . . . . . 4-24
. . . . . . . . . . 4-24
. . . . . . . . . . 4-25
. . . . . . . . . . 4-25
. . . . . . . . . . 4-28
. . . . . . . . . . 4-28
. . . . . . . . . . 4-28
. . . . . . . . . . 4-28
. . . . . . . . . . 4-28
5 . ECONOMIC IMPACT . . . . . . . . . . . . . . . . . . . . . . . . . 5-1 5.1 Summary of Economic Impacts of the Maleic Anhydride
Benzene NESHAP . . . . . . . . . . . . . . . . . . . . . . . 5-1 5.1.1 Capital Budget Impacts . . . . . . . . . . . . . . . . 5-1 5.1.2 Shifts in Competitive Position . . . . . . . . . . . . 5-1 5.1.3 Price Impacts on Products that Use MA . . . . . . . . 5-1 5.1.4 Employment and Balance of Trade Impacts . . . . . . . 5-2 5.1.5 AnnuaJized Costs in Fifth-Year and Energy
Tmpacts . . . . . . . . . . . . . . . . . . . . . . . ~ ~ 5 - 2 5.1.6 Impact of Requiring n-Butane (100 Percent
Control) at New MA Facilities . . . . . . . . . . . . 5-2 5.2 Industrial Economic Profile . . . . . . . . . . . . . . . . . 5-2
~ ~
-~ ~ ~- ~ -~ ~- ~
~- ~
5.2.1 Maleic Anhydride Supply and Capacity . . . . . . . . . 5-2 5.2.1.1 General . . . . . . . . . . . . . . . . . . . 5-2 5.2.1.2 The Individual MA-Producing Companies . . . . 5-4 .
5.2.2 MA Usage and Demand . . . . . . . . . . . . . . . . . 5-7 5.2.3 Prices . . . . . . . . . . . . . . . . . . . . . . . . 5-9
5.2.3.1 Price of MA . . . . . . . . . . . . . . . . . 5-9 5.2.3.2 Feedstock Costs . . . . . . . . . . . . . . . 5-11 5.2.3.3 Transportation Costs . . . . . . . . . . . . 5-11
5.2.4 Briquettes vs . Mol ten MA . . . . . . . . . . . . . . . 5-11 5.2.4.1 Imports o f Maleic Anhydride . . . . . . . . . 5-12
5.3 Cost Analysis of Alternative Emission Control Systems . . . . 5-15 5.3.1 Introduction . . . . . . . . . . . . . . . . . . . . . 5-15 5.3.2 Summary o f Technical Parameters Used as the Basis
in Cost Analysis . . . . . . . . . . . . . . . . . . . 5-16 5.3.3 Control Costs for Maleic Anhydride Facilities . . . . 5-20
vi
!
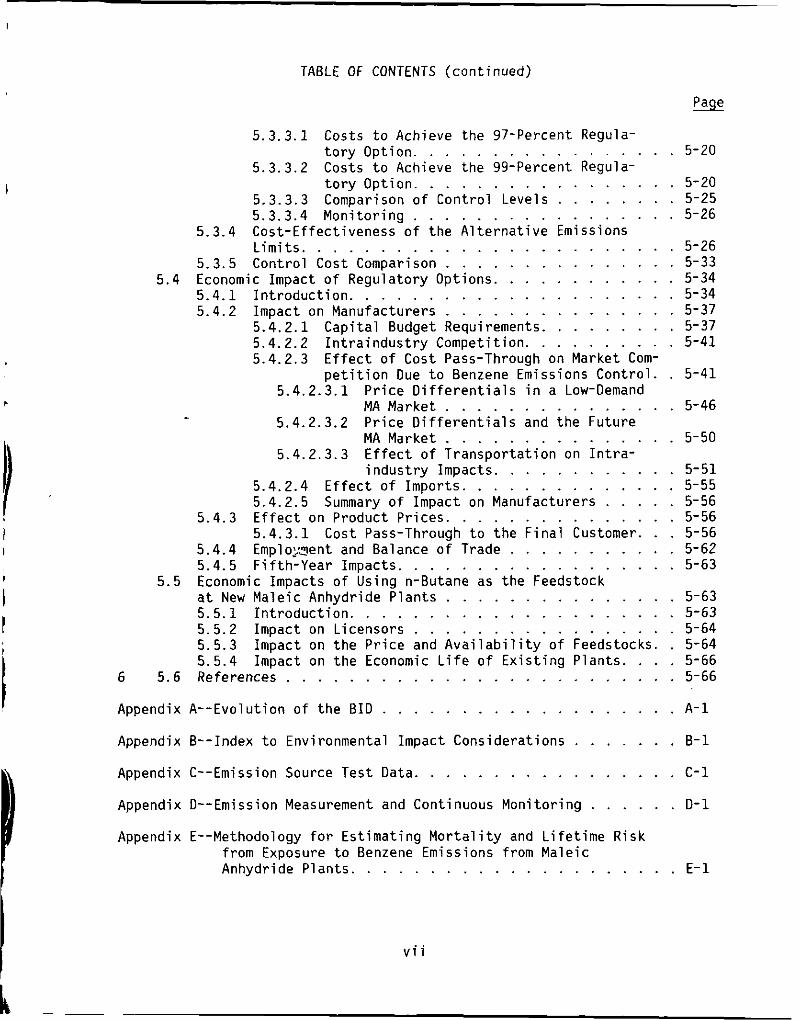
TABLE OF CONTENTS (cont inued)
I
5.3.3.1 Costs t o Achieve the 97-Percent Regula- t o r y Opt ion . . . . . . . . . . . . . . . .
5.3.3.2 Costs t o Achieve the 99-Percent Regula- t o r y Opt ion . . . . . . . . . . . . . . . .
5.3.3.3 Comparison o f Contro l Levels . . . . . . . 5.3.3.4 Mon i to r ing . . . . . . . . . . . . . . . .
5.3.4 Cost-Effect iveness o f the A l t e r n a t i v e Emissions L i m i t s . . . . . . . . . . . . . . . . . . . . . . .
5.3.5 Contro l Cost Comparison . . . . . . . . . . . . . . Economic Impact o f Regulatory Opt ions . . . . . . . . . . . 5.4.1 I n t r o d u c t i o n . . . . . . . . . . . . . . . . . . . . 5.4.2 Impact on Manufacturers . . . . . . . . . . . . . .
5.4.2.1 Cap i ta l Budget Requirements . . . . . . . . 5.4.2.2 I n t r a i n d u s t r y Compet i t ion . . . . . . . . . 5.4.2.3 E f f e c t o f Cost Pass-Through on Market Com-
p e t i t i o n Due t o Benzene Emissions Contro l . 5.4.2.3.1 P r i c e D i f f e r e n t i a l s i n a Low-Demand
MA Market . . . . . . . . . . . . . . 5.4.2.3.2 P r i ce D i f f e r e n t i a l s and the Future
MAMarket . . . . . . . . . . . . . . 5.4.2.3.3 E f f e c t o f T ranspor ta t ion on I n t r a -
i n d u s t r y Impacts . . . . . . . . . . .
5.4.2.5 Summary o f Impact on Manufacturers . . . . 5.4.3 E f f e c t on Product Pr ices . . . . . . . . . . . . . .
5.4.3.1 Cost Pass-Through t o the F i n a l Customer . . 5.4.4 Employzent and Balance o f Trade . . . . . . . . . . 5.4.5 F i f th -Year Impacts . . . . . . . . . . . . . . . . .
a t New Male ic Anhydride P lan ts . . . . . . . . . . . . . . 5.5.1 I n t r o d u c t i o n . . . . . . . . . . . . . . . . . . . . 5.5.2 Impact on Licensors . . . . . . . . . . . . . . . . 5 .5 .3 Impact on t h e P r i c e and A v a i l a b i l i t y o f Feedstocks . 5.5.4 Impact on the Economic L i f e o f E x i s t i n g P lan ts . . .
6 5.6 References . . . . . . . . . . . . . . . . . . . . . . . .
5.4
5.4.2.4 E f f e c t o f Impor ts . . . . . . . . . . . . .
5.5 Economic Impacts o f Using n-Butane as the Feedstock
. 5-20
. 5-20
. 5-25
. 5-26
. 5-26
. 5-33
. 5-34
. 5-34
. 5-37
. 5-37
. 5-41
. 5-41
. 5-46
. 5-50
. 5-51
. 5-55
. 5-56
. 5-56
. 5-56
. 5-62
. 5-63
. 5-63
. 5-63
. 5-64
. 5-64
. 5-66
. 5-66
Appendix A.. Evo lu t i on o f the B I D . . . . . . . . . . . . . . . . . . . A - 1
Appendix 6.. Index t o Environmental Impact Considerat ions . . . . . . . 6 -1
Appendix C.. Emission Source Test Data . . . . . . . . . . . . . . . . . C - 1
Appendix 0.. Emission Measurement and Continuous Mon i to r ing . . . . . . 0 -1
Appendix E.. Methodology f o r Es t imat ing M o r t a l i t y and L i f e t i m e Risk from Exposure t o Benzene Emissions from Male ic Anhydride Plants . . . . . . . . . . . . . . . . . . . . . E - 1
v i i
k
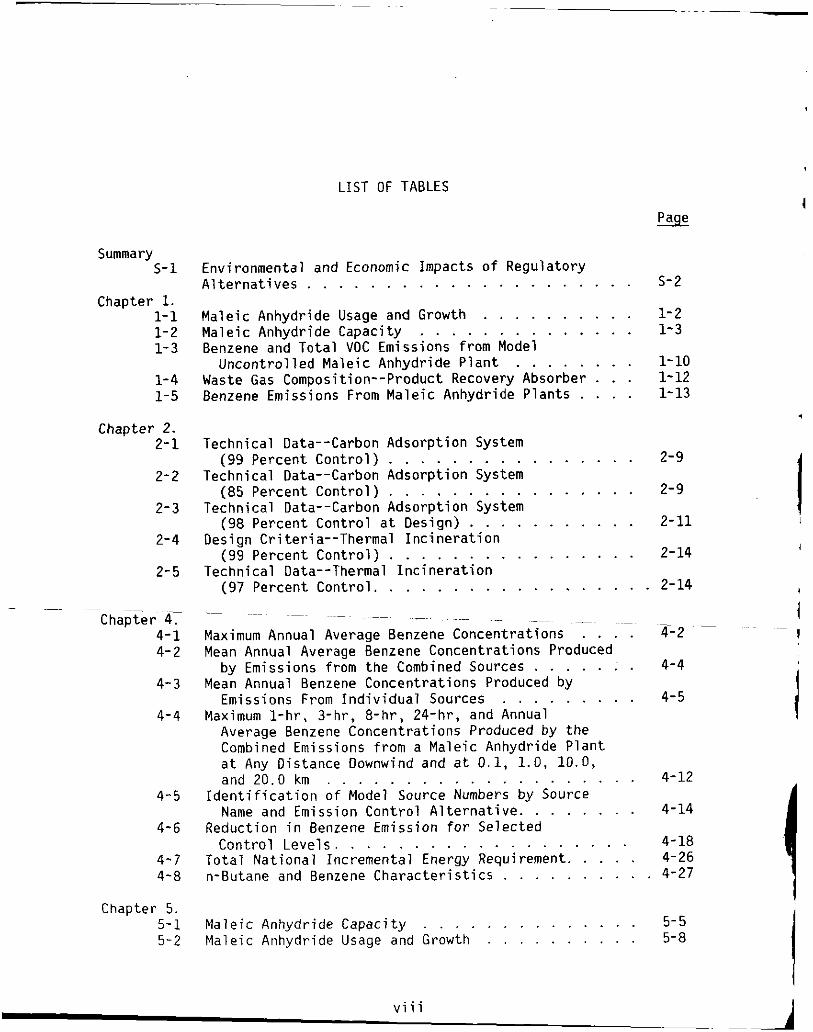
LIST OF TABLES I
Summary s- 1
Chapter 1. 1- 1 1- 2 1- 3
1-4 1-5
Chapter 2. 2 - 1
2- 2
2-3
2-4
2-5
~
Chapter 4; 4-1 4- 2
4- 3
4-4
4-5
4- 6
4-7 4-8
Chapter 5. 5- 1 5-2
Environmental and Economic Impacts o f Regulatory A1 t e r n a t i v e s . . . . . . . . . . . . . . . . . . . . .
Male ic Anhydride Usage and Growth . . . . . . . . . . Male ic Anhydride Capacity . . . . . . . . . . . . . . Benzene and Tota l VOC Emissions from Model
Uncontro l led Maleic Anhydride P l a n t . . . . . . . . Waste Gas Composition--Product Recovery Absorber . . . Benzene Emissions From Male ic Anhydride Plants . . . .
Technical Data--Carbon Adsorpt ion System
Technical Data--Carbon Adsorpt ion System
Technical Data--Carbon Adsorpt ion System
Design Cr i ter ia- -Thermal I n c i n e r a t i o n
Technical Data--Thermal I n c i n e r a t i o n
(99 Percent Con t ro l ) . . . . . . . . . . . . . . . . (85 Percent Contro l ) . . . . . . . . . . . . . . . . (98 Percent Contro l a t Design) . . . . . . . . . . .
(99 Percent Contro l ) . . . . . . . . . . . . . . . .
(97 Percent Contro l . . . . . . . . . . . . . . . . .
~ ~~
~~.~ ~~~~ ~~
~~ ~
~~~~ . ~~
Maximum Annual Average Benzene Concentrat ions . . . . Mean Annual Average Benzene Concentrat ions Produced
by Emissions f r o m the Combined Sources . . . . . : . Mean Annual Benzene Concentrat ions Produced by
Emissions From I n d i v i d u a l Sources . . . . . . . . . Maximum 1-hr , 3-hr, 8-hr, 24-hr, and Annual
Average Benzene Concentrat ions Produced by the Combined Emissions from a Maleic Anhydride P l a n t a t Any Distance Downwind and a t 0.1, 1.0, 10.0, and 20.0 km . . . . . . . . . . . . . . . . . . . .
I d e n t i f i c a t i o n o f Model Source Numbers by Source Name and Emission Contro l A l t e r n a t i v e . . . . . . . .
Reduction i n Benzene Emission f o r Selected Contro l Leve ls . . . . . . . . . . . . . . . . . . .
To ta l Na t iona l Incremental Energy Requirement. . . . .
5-2
1-2 1-3
1-10 1-12 1-13
! 2-9
2-9
2-11 1 2-11 1
1 2-14
2-14 1
1 ~
- - 4-2 1
4-12
4-14
4-18 4-26
n-Butane and Benzene C h a r a c t e r i s t i c s . . . . . . . . . . 4-27
Male ic Anhydride Capaci ty . . . . . . . . . . . . . . 5-5 Maleic Anhydride Usage and Growth . , , . . . . . . . 5-8
v i i i 1 A
LIST OF TABLES (cont inued)
&
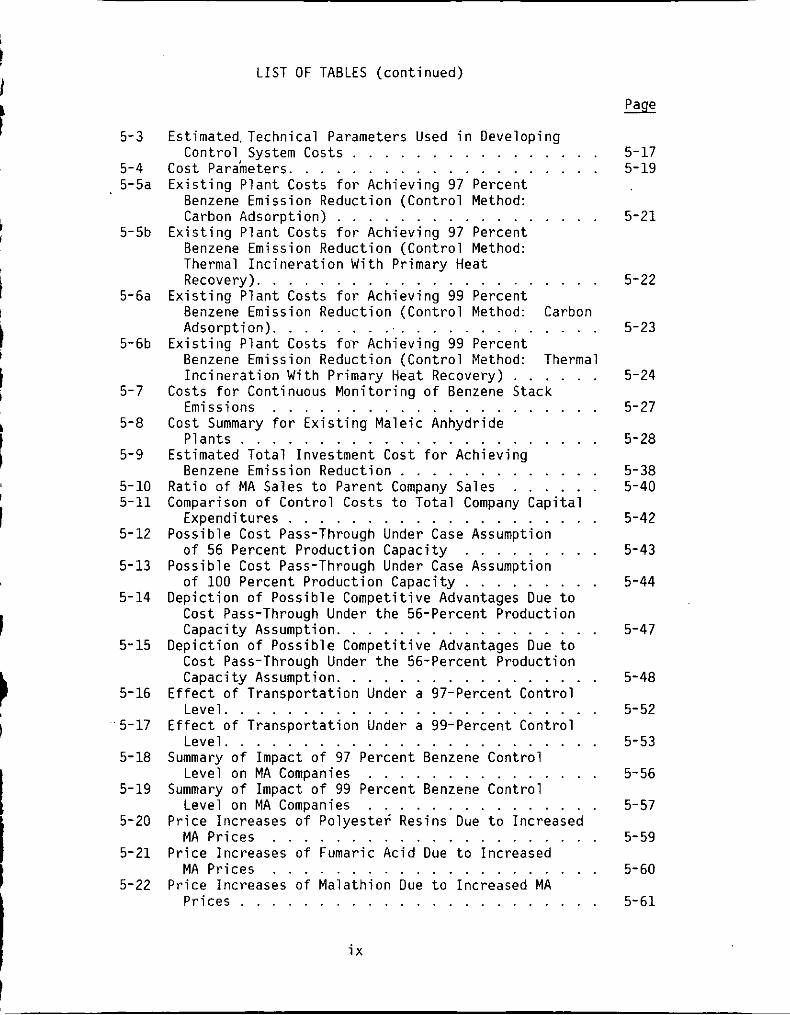
Estimated.Technica1 Parameters Used i n Developing Control System Costs . . . . . . . . . . . . . . . . 5-17
Cost Parameters. . . . . . . . . . . . . . . . . . . . 5-19 E x i s t i n g P lan t Costs f o r Achieving 97 Percent
Benzene Emission Reduction (Contro l Method: Carbon Adsorpt ion) . . . . . . . . . . . . . . . . . 5-21
E x i s t i n g P lan t Costs f o r Achieving 97 Percent Benzene Emission Reduction (Contro l Method: Thermal I n c i n e r a t i o n Wi th P r i m a r y Heat Recovery). . . . . . . . . . . . . . . . . . . . . . 5-22
E x i s t i n g P lan t Costs f o r Achieving 99 Percent Benzene Emission Reduction (Contro l Method: Carbon Adsorpt ion). . . . . . . . . . . . . . . . . . . . . . 5-23
E x i s t i n g P l a n t Costs f o ' r Achieving 99 Percent Benzene Emission Reduction (Contro l Method: Thermal I n c i n e r a t i o n With Primary Heat Recovery) . . . . . . 5-24
Costs f o r Continuous Mon i to r i ng o f Benzene Stack Emissions . . . . . . . . . . . . . . . . . . . . . 5-27
C o s t Summary f o r E x i s t i n g Maleic Anhydride P l a n t s . . . . . . . . . . . . . . . . . . . . . . . 5-28
Estimated Tota l Investment Cost f o r Achieving Benzene Emission Reduction . . . . . . . . . . . . . 5-38
Ra t io o f MA Sales t o Parent Company Sales . . . . . . 5-40 Comparison o f Control Costs t o To ta l Company Cap i ta l
Expenditures . . . . . . . . . . . . . . . . . . . . 5-42 Possible Cost Pass-Through Under Case Assumption
o f 56 Percent Product ion Capacity . . . . . . . . . 5-43 Possible Cost Pass-Through Under Case Assumption
o f 100 Percent Product ion Capacity . . . . . . . . . 5-44 Dep ic t i on o f Poss ib le Compet i t ive Advantages Due t o
Cost Pass-Through Under the 56-Percent Product ion Capacity Assumption. . . . . . . . . . . . . . . . . 5-47
Dep ic t i on o f Poss ib le Compet i t ive Advantages Due t o Cost Pass-Through Under the 56-Percent Product ion Capacity Assumption. . . . . . . . . . . . . . . . . 5-48
E f f e c t o f Transpor tat ion Under a 97-Percent Control L e v e l . . . . . . . . . . . . . . . . . . . . . . . . 5-52
E f f e c t o f Transpor tat ion Under a 99-Percent Control L e v e l . . . . . . . . . . . . . . . . . . . . . . . . 5-53
Summary o f Impact o f 97 Percent Benzene Control Level on MA Companies . . . . . . . . . . . . . . . 5-56
Summary o f Impact o f 99 Percent Benzene Contro l Level on MA Companies . . . . . . . . . . . . . . . 5-57
P r i c e Increases o f Polyester: Resins Due t o Increased MA Pr ices . . . . . . . . . . . . . . . . . . . . . 5-59
P r i c e Increases o f Fumaric Acid Due t o Increased MA Pr ices . . . . . . . . . . . . . . . . . . . . . 5-60
P r i c e Increases o f Malath ion Due t o Increased MA P r i c e s . . . . . . . . . . . . . . . . . . . . . . . 5-61
5- 3
5-4 5-5a
5-5b
5-6a
5-6b
5-7
5-8
5-9
5-10 5-11
5-12
5-13
5-14
5- 15
5- 16
' ' 5-17
5- 18
5-19
5-20
5 - 2 1
5-22
i x
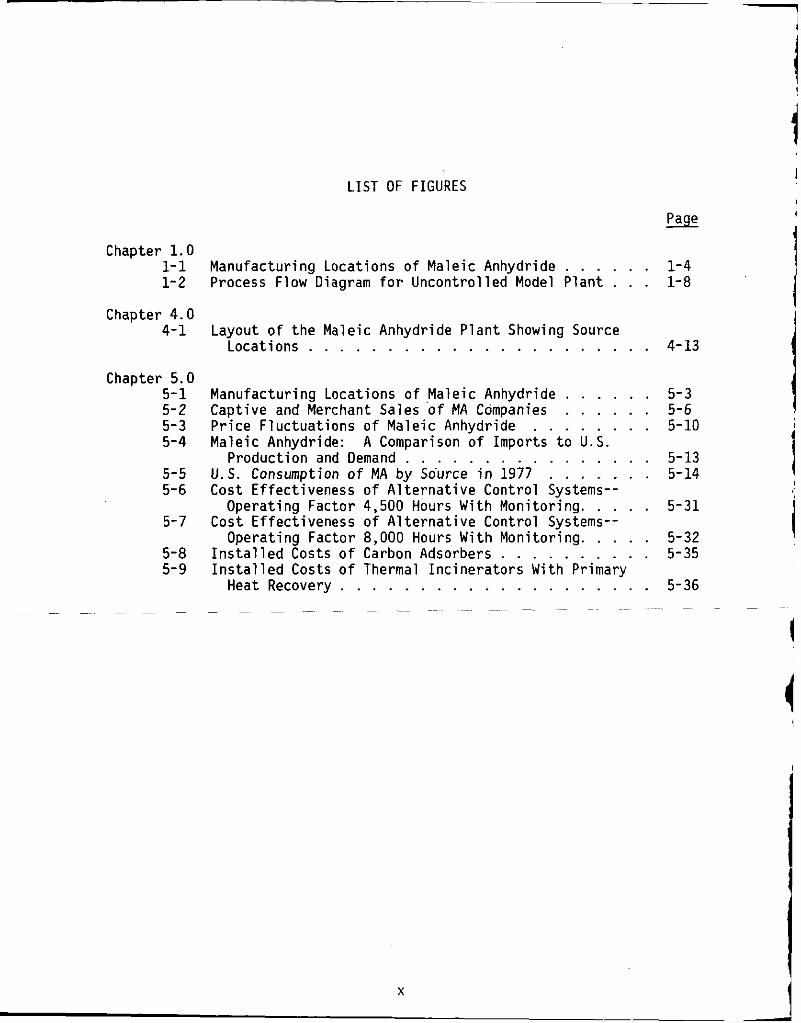
Chapter 1.0 1- 1 1- 2
Chapter 4.0 4-1
Chapter 5.0 5-1 5-2 5-3 5-4
5-5 5-6
5-7
5-8 5-9
LIST OF FIGURES
Manufacturing Locations of Maleic Anhydride . . . . . . 1-4 Process Flow Diagram for Uncontrolled Model Plant . . . 1-8
Layout of the Maleic Anhydride Plant Showing Source Locations . . . . . . . . . . . . . . . . . . . . . . 4-13
Manufacturing Locations of Maleic Anhydride . . . . . . 5-3 Captive and Merchant Sales o f MA Companies . . . . . . 5-6 Price Fluctuations o f Maleic Anhydride . . . . , . . . 5-10 Maleic Anhydride:
Production and Demand . . . . . . . . . . . . . . . . 5-13 U.S. Consumption of MA by Sdurce in 1977 . . . . . , . 5-14 Cost Effectiveness of A1 ternative Control Systems--
Operating Factor 4,500 Hours With Monitoring. . . . . 5-31 Cost Effectiveness of Alternative Control Systems--
Operating Factor 8,000 Hours With Monitoring. . . . . 5-32 Installed Costs of Carbon Adsorbers . . . . . . . . . . 5-35 Installed Costs of Thermal Incinerators With Primary
Heat Recovery . . . . . . . . . . . . . . . . . . . . 5-36
A Comparison of Imports to U.S.
X
I NT ROOUCT 1 ON
This document describes the domestic maleic anhydride production industry w i t h emphasis on the benzene emissions t o t h e atmosphere. f i r s t sect ions o f t he report discuss the c h a r a c t e r i s t i c s o f t he industry, t he processes used t o produce maleic anhydride, and t h e associated emissions. Only ducted process vents a r e covered i n t h i s document. sources of benzene, s torage and handling sources of benzene, and miscellaneous secondary sources o f benzene wi l l be covered i n other documents i n preparation. Applicable control techniques and a l t e r n a t i v e l eve l s of control and t h e i r environmental, energy, c o s t , and economic impacts a r e described.
The
Fugitive emission
1-1
SUMMARY
REGULATORY ALTERNATIVES Two regulatory alternatives were considered for best available technol-
ogy (considering environmental, energy, and economic impacts) (BAT) to control benzene emissions from existing process vents of plants that use benzene as a feedstock to manufacture maleic anhydride or maleic acid. These alternatives are:
. A 97-percent reduction from uncontrolled emission levels, based on the best control that has been achieved at an existing maleic plant using universally applicable equipment; and
A 99-percent reduction from uncontrolled levels, based on the best control considered feasible using technology transfer.
-
While no particular control technology would be specifically required for either alternative, carbon adsorption or thermal incineration could be used in achieving either 97 or 99 percent control.
A third alternative, a 100-percent reduction in benzene emissions based on the use of a substitute feedstock, such as n-butane, was con- sidered as an alternative for BAT for new sources. This alternative was not considered as an alternative for BAT for existing sources because of uncertainties about the technical feasibility of converting each existing source to n-butane and the impacts of such a conversion. sources are expected to be built until the mid-1980's. could be designed to use n-butane and would therefore not encounter the potential problems associated with conversion.
However, few new Thus, a new source
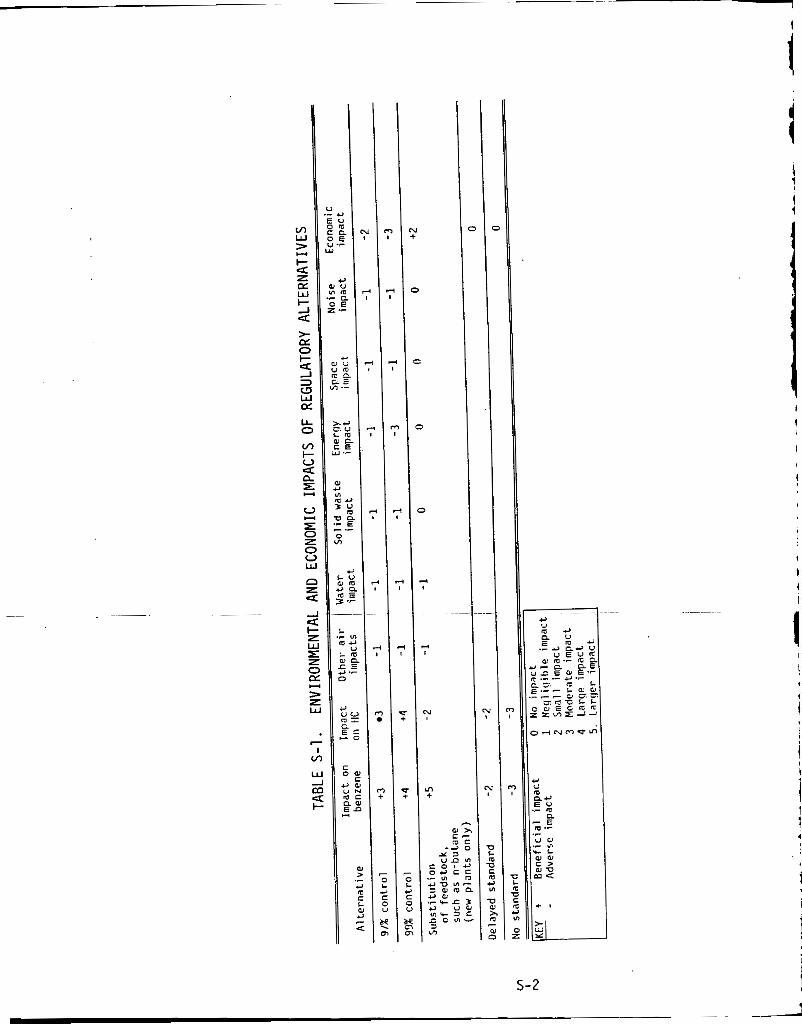
ENVIRONMENTAL IMPACTS--EXISTING SOURCES Table S - 1 summarizes the environmental and economic impacts of the
regulatory alternatives considered. wide benzene emissions from maleic anhydride plants from 6,400 Mg/yr to 1,030 Mg/yr for 97 percent control, to 540 Mg/yr for 99 percent control,
These alternatives would reduce nation-
s- 1
I
CI
c
5-2
I
l
and to 0 Mg/yr for 100 percent control. storage, and handling emissions, which are not covered by the proposed standard.
These emissions include fugitive,
The control systems likely to be used to meet a 97-percent or 99-percent benzene emission reduction (incineration or carbon adsorption) would also reduce emissions of other hydrocarbons, which might be toxic and which contribute to photochemical oxidant formation and associated environmental problems.
adverse environmental impacts. These adverse impacts would include small increases in nitrogen oxide because of high incineration temperatures and sulfur oxide emissions into the air, if fuel oil were used as a supplemental fuel for incinerators. There would be small increases in solid wastes and in benzene in wastewater. Compliance with the alternatives would increase nationwide energy conzmption by an estimated 50,000 barrels for 97 percent control and 85,000 barrels of fuel oil equivalent per year for 99 percent control by 1980.
The reduction in nationwide benzene emissions would result in minimal,
ECONOMIC IMPACTS--EXISTING SOURCES The capital investment required by the domestic maleic anhydride
industry to comply with the proposed standard would be about $6.6 million for 97 percent control and $9.1 million for 99 percent control over the 2-year period from 1979 to 1981. The total annualized operating costs of the industry would increase by about $2.5 milliodyr for 97 percent control and $4.5 million for 99 percent control by 1983. If continuous monitoring were required, annualized costs would be increased by an additional $9,000 for each plant. estimated 1.2 percent for 97 percent control and 1.7 percent for 99 percent control. In addition, one plant might close if the standard were based on 97 percent control and two plants might close if the standard were based on 99 percent control.
ENVIRONMENTAL IMPACTS--NEW SOURCES
The market price of maleic anhydride would increase an
The use of a substitute feedstock by new sources would eliminate benzene emissions from process vents, storage and handling of benzene, and fugitive sources. Information indicates there would be greater quantities of volatile organic compounds (VOC's) from the uncontrolled n-butane process
s-3
than from the uncontrolled benzene process. new source performance standard f o r a i r oxidation processes i n t h e chemical industry. This standard would cover new sources producing maleic anhydride from n-butane.
EPA i s cur ren t ly developing a
ECONOMIC IMPACTS--NEW SOURCES A p l a n t using the n-butane process has been estimated t o achieve a s
much as a 7.3U/kg (3.3Q/lb) maleic anhydride c o s t reduction below benzene- based maleic anhydride because of the d i f fe rence i n feedstock costs . T h i s reduction i s achieved despi te a g rea t e r annualized u t i1 i t i e s c o s t recent ly estimated t o be $450,000 for the n-butane-based process compared t o $350,000 f o r t h e benzene-based process of the same s i ze . n-butane process may be grea te r because of t h e l a r g e r reac tors and higher temperature required. t o use t h e n-butane process regardless of EPA's requirement.
Capital cos ts f o r the
Because of the cost reduction, new plan ts a r e expected
i
5-4
1
1. THE MALEIC ANHYDRIDE INDUSTRY
i !I
1.1 GENERAL
This chapter discusses male ic anhydride product ion, focus ing p r i m a r i l y
on th ree bas ic processes used i n the Un i ted States and the benzene emis- s ions r e l a t e d t o these processes. The processes are: o x i d a t i o n of
benzene, o x i d a t i o n o f n-butane, and recovery as a byproduct o f p h t h a l i c
anhydride manufacture. the o x i d a t i o n o f benzene. Fore ign processes are a l so b r i e f l y described.
Table 1-1 shows t h e end uses o f maleic anhydride and t h e i r expected growth ra tes . The predominant end use i s t h e produc t ion o f unsaturated
po lyes te r res ins , which go i n t o r e i n f o r c e d p l a s t i c a p p l i c a t i o n s such as marine c r a f t , b u i l d i n g panels, automobiles, tanks, and p ipes.
States male ic anhydride produc t ion capac i ty f o r 1977 was repor ted t o be
229,000 Mg (5.0 x 10 used. 'I2 A t an est imated 11-percent annual growth i n maleic anhydride
consumption, p roduc t ion would reach 95 percent o f present capac i ty by 1982.
No shortage o f benzene, the major raw m a t e r i a l , i s expected du r ing t h i s
per iod.
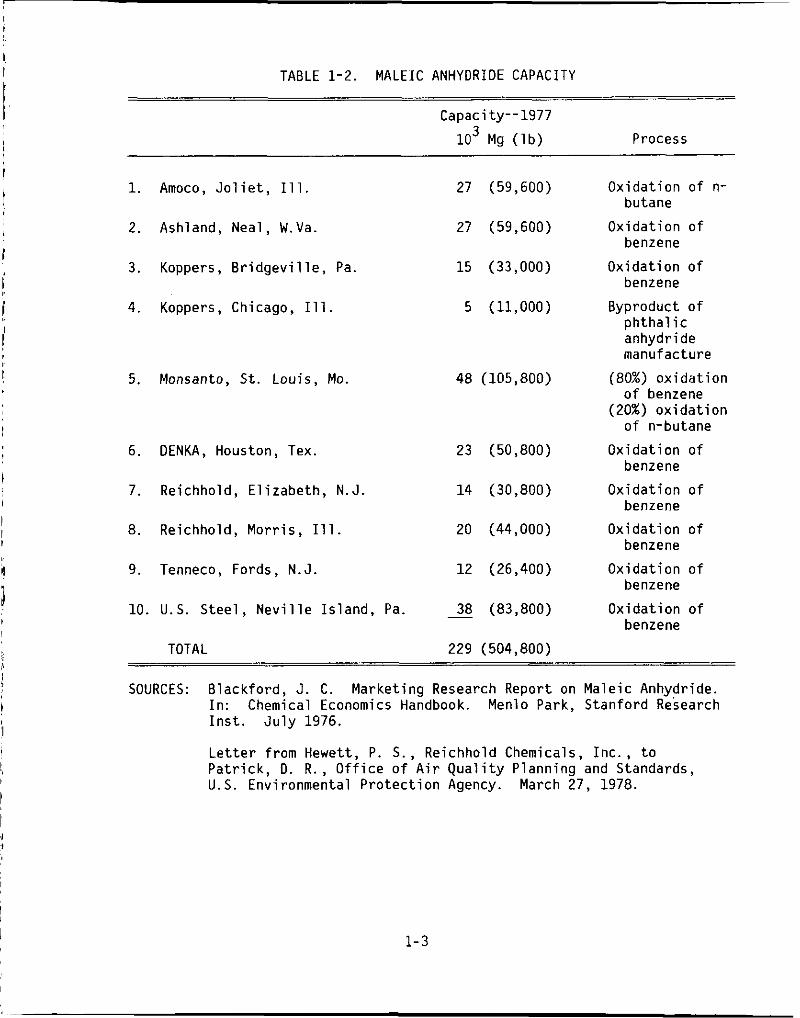
As o f 1977, t h e r e were e i g h t producers o f maleic anhydride i n the
Uni ted States w i t h 10 p lan ts . However, i n 1979, Koppers announced the mothba l l ing o f i t s Pennsylvania f a ~ i l i t y . ~ Table 1-2 l i s t s t h e producers
and t h e processes be ing used, w h i l e F igure 1-1 shows t h e p l a n t l oca t i ons .
Approximately 82 percent o f the 229,000-Mg/yr (5 .0 x 10 l b / y r ) domestic
capac i ty i s based on o x i d a t i o n o f benzene; 16 percent capac i ty comes from
ox ida t i on o f n-butane; and t h e remaining 2 percent r e s u l t s from p h t h a l i c
anhydride product ion, which y i e l d s male ic anhydr ide as a byproduct.
Because o f a n t i c i p a t e d increases i n the p r i c e o f benzene, work began i n
1960 t o develop a c a t a l y s t s u i t a b l e f o r producing maleic anhydride from
Most o f the c u r r e n t domestic capac i ty i s based on
The Un i ted
8 l b ) w i t h o n l y 56 percent o f t h i s capac i ty c u r r e n t l y
2
8
1
I 1- 1 I
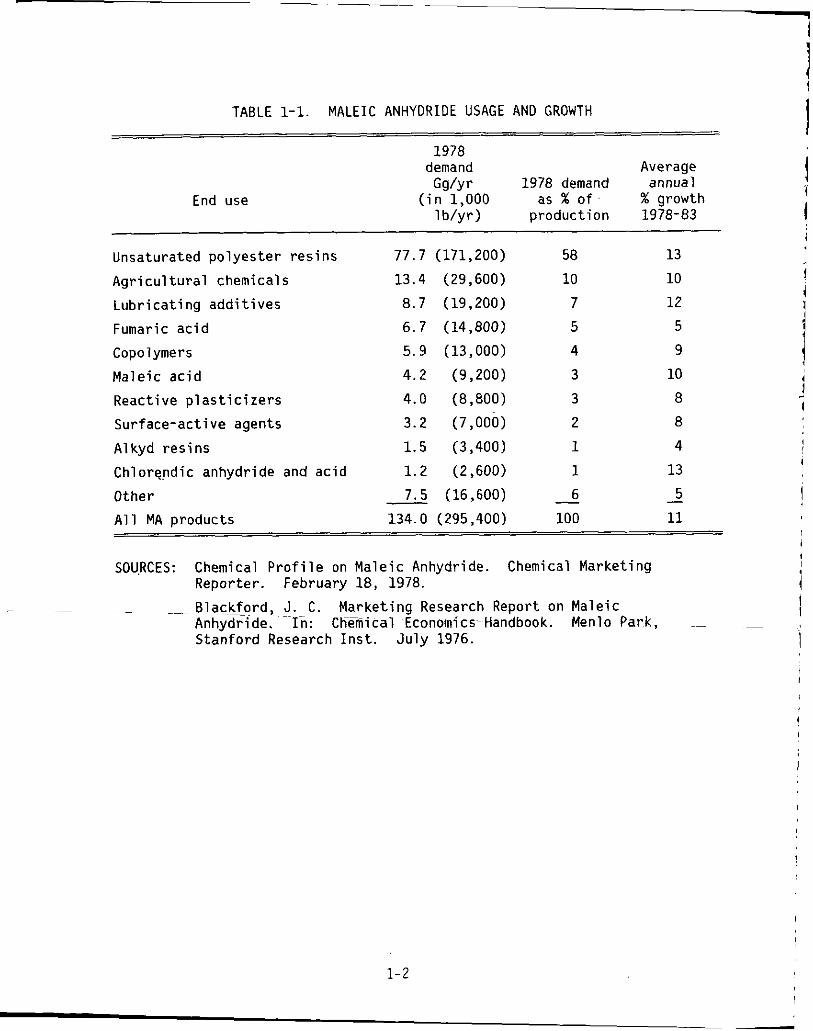
TABLE 1-1. MALEIC ANHYDRIDE USAGE AN0 GROWTH
1978 demand Average
G d Y r 1978 demand annual
1 b /y r ) p roduc t ion 1978-83 End use ( i n 1,000 as % o f % growth
Unsaturated po lyes te r r e s i n s 77.7 (171,200) 58 13 A g r i c u l t u r a l chemicals 13.4 (29,600) 10 10 L u b r i c a t i n g a d d i t i v e s 8.7 (19,200) 7 12 Fumaric a c i d
Copolymers
Male ic a c i d
6.7 (14,800) 5 5 5.9 (13,000) 4 9
4.2 (9,200) 3 10 React ive p l a s t i c i z e r s 4.0 (8,800) 3 8 Surface-act ive agents 3.2 (7,000) 2 8
Alkyd r e s i n s 1.5 (3,400) 1 4 Chlorendic anhydr ide and a c i d 1.2 (2,600) 1 13
5 Other - 6 - 7.5 (16,600) - A l l MA products 134.0 (295,400) 100 11
SOURCES: Chemical P r o f i l e on Male ic Anhydride. Chemical Market ing Reporter. February 18, 1978. Blackford, J . C . Marke t ing Research Report on Male ic Anhydride. In: Chemical Economics Handbook. Menlo Park, S tan ford Research I n s t . J u l y 1976.
I
!
1 - 2
I I
1
1 TABLE 1-2. MALEIC ANHYDRIDE C A P A C I T Y
Capaci ty--1977 t I
lo3 Mg ( l b ) Process I
I 1
f
i
i I I
!'
I
! 1
! I
I I
1
i , I
i\ !. ! :I
!,
t
1. Amoco, J o l i e t , Ill.
2. Ashland, Neal, W.Va.
3. Koppers, B r i d g e v i l l e , Pa.
4. Koppers, Chicago, Ill.
5. Monsanto, S t . Louis, Mo.
6. DENKA, Houston, Tex.
7. Reichhold, E l i zabeth , N.J.
8. Reichhold, Mor r is , Ill.
9. Tenneco, Fords, N.J.
10. U.S. Stee l , N e v i l l e I s land , Pa.
TOTAL
27 (59,600)
27 (59,600)
15 (33,000)
5 (11,000)
48 (105,800)
23 (50,800)
14 (30,800)
20 (44,000)
12 (26,400)
- 38 (83,800)
229 (504,800)
Ox ida t ion o f n- butane
Ox ida t ion o f benzene
Ox ida t ion o f benzene
Byproduct o f p h t h a l i c anhydride manufacture
(80%) ox ida t i on o f benzene
(20%) o x i d a t i o n o f n-butane
Ox ida t ion o f benzene
Ox ida t ion o f benzene
Ox ida t ion o f benzene
Ox ida t ion o f benzene
Ox ida t ion o f benzene
SOURCES: B lack ford , J. C. Market ing Research Report on Male ic Anhydride. I n : Chemical Economics Handbook. Menlo Park, S tan ford Research I n s t . J u l y 1976.
L e t t e r from Hewett, P. S . , Reichhold Chemicals, Inc . , t o P a t r i c k , 0. R . , O f f i c e o f A i r Q u a l i t y Planning and Standards, U.S. Environmental P ro tec t i on Agency. March 27, 1978.
1-3
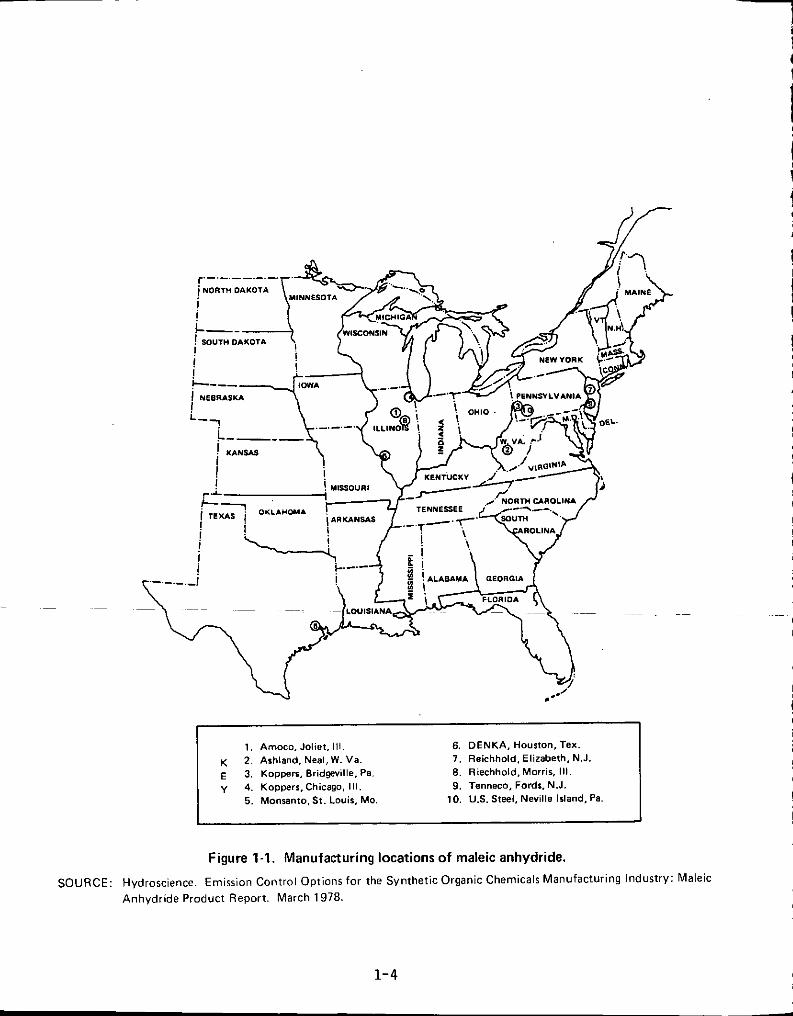
6. DENKA, Hourton.Tex. 1. Amoco. Joliet, Ill. K 2. Ashland. Neal, W. Va. 7 . Reiehhold. Elizabeth, N.J. E 3. Kopperr. Bridgeville. Pa. 8. Riechhold, Morris, Ill. y 4. Kopperr.Chicago. 111. 9. Tenneco, Fords, N.J.
5. Monranto. St . Louis, Mo. 10. US. Steel, Neville Island, Pa.
Figure 1-1. Manufacturing locations of maleic anhydride.
SOURCE: Hydrorcience. Emission Control Options for the Synthetic Organic Chemicals Manufacturing Industry: Maleic Anhydride Product Report. March 1978.
1-4
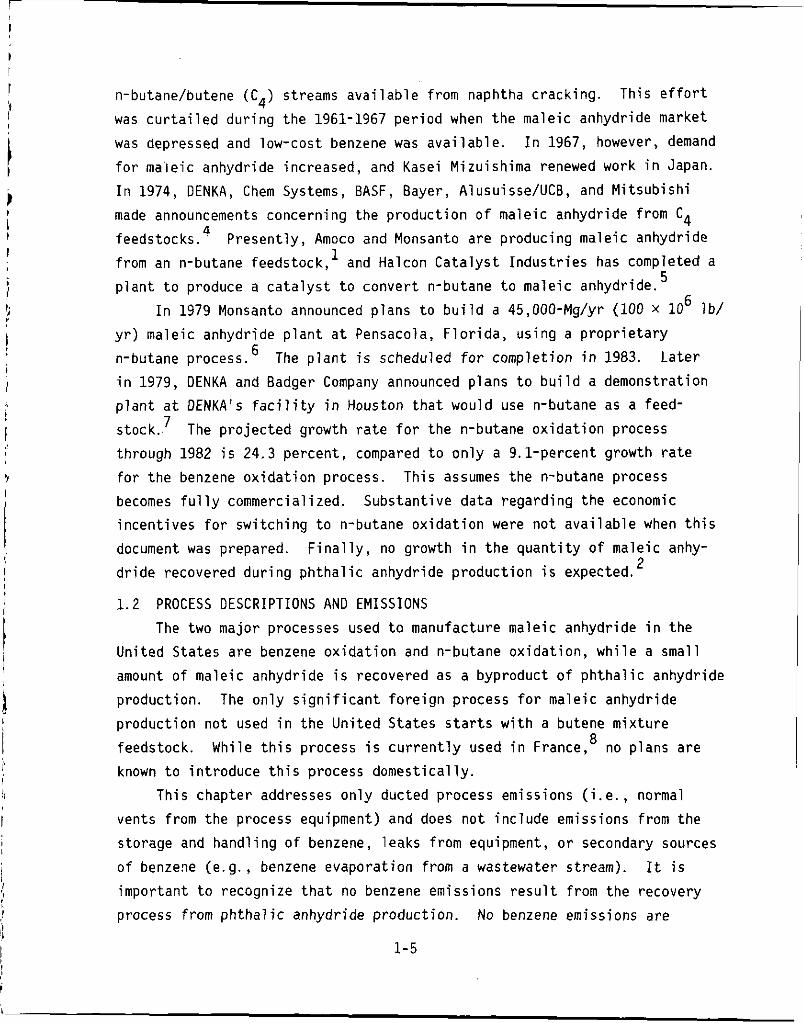
n-butane/butene (C,) streams available from naphtha cracking. This effort was curtailed during the 1961-1967 period when the maleic anhydride market was depressed and low-cost benzene was available. In 1967, however, demand for maleic anhydride increased, and Kasei Mizuishima renewed work in Japan. In 1974, DENKA, Chem Systems, BASF, Eayer, Alusuisse/UCB, and Mitsubishi made announcements concerning the production of maleic anhydride from c4 feedstocks.' from an n-butane feedstock,' and Halcon Catalyst Industries has completed a plant to produce a catalyst to convert n-butane to maleic anhydride.
In 1979 Monsanto announced plans to build a 45,000-Mg/yr (100 X 10 yr) maleic anhydride plant at Pensacola, Florida, using a proprietary n-butane process.6 The plant is scheduled for completion in 1983. in 1979, OENKA and Badger Company announced plans to build a demonstration plant at DENKA's facility in Houston that would use n-butane as a feed- stock.7 The projected growth rate for the n-butane oxidation process through 1982 i s 24.3 percent, compared to only a 9.1-percent growth rate for the benzene oxidation process. This assumes the n-butane process becomes fully commercialized. incentives for switching to n-butane oxidation were not available when this document was prepared. dride recovered during phthalic anhydride production is expected.
1.2 PROCESS DESCRIPTIONS AND EMISSIONS
4 Presently, Amoco and Monsanto are producing maleic anhydride
5 6 lb/
Later
Substantive data regarding the economic
Finally, no growth in the quantity of maleic anhy- 2
The two major processes used to manufacture maleic anhydride in the United States are benzene oxidation and n-butane oxidation, while a small amount of maleic anhydride is recovered as a byproduct of phthalic anhydride production. production not used in the United States starts with a butene mixture feedstock. known to introduce this process domestically.
vents from the process equipment) and does not include emissions from the storage and handling of benzene, leaks from equipment, or secondary sources o f benzene (e.g., benzene evaporation from a wastewater stream). important to recognize that no benzene emissions result from the recovery process from phthalic anhydride production. No benzene emissions are
The only significant foreign process for maleic anhydride
While this process is currently used in France,8 no plans are
This chapter addresses only ducted process emissions (i.e., normal
It is
1-5
a n t i c i p a t e d from any process us ing n-butane o r butenes, and none has been found a t lower d e t e c t i o n l i m i t s o f 1 ppmv.
1.2.1 Benzene Ox ida t ion Process
9
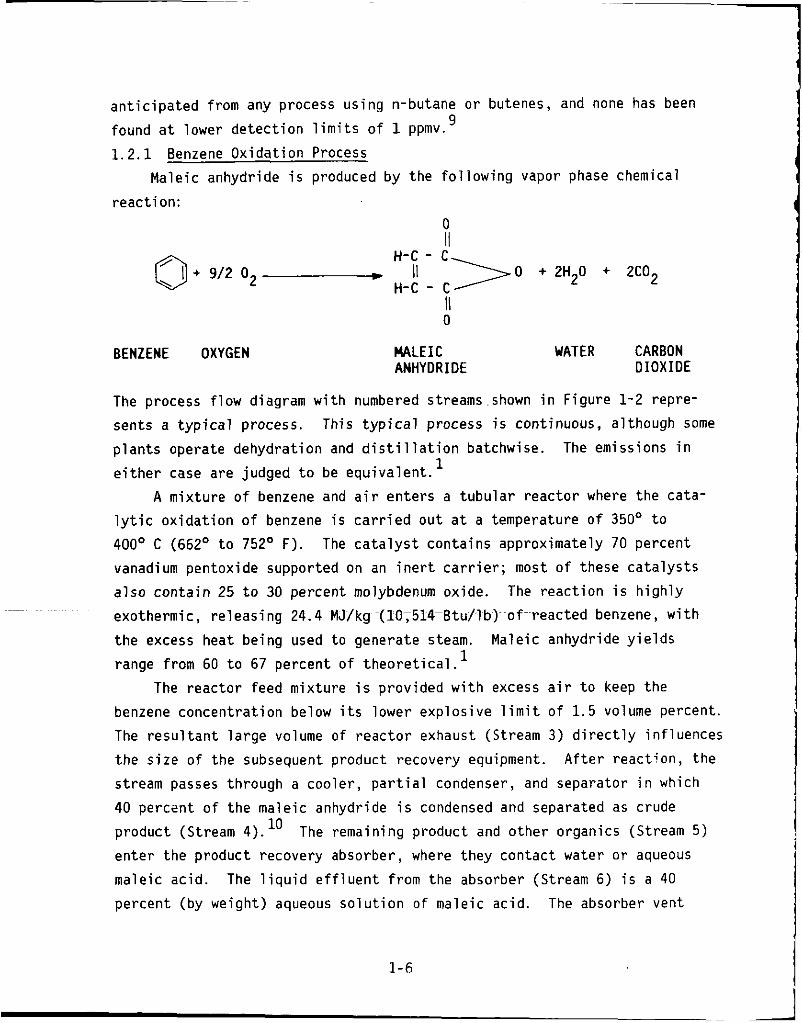
Male ic anhydride i s produced by the f o l l o w i n g vapor phase chemical
reac t ion : 0 II
P.. H-C - C, o+ \ 9/2 O2 c 11 3 0 + 2H20 + 2C02 H-C - C
BENZENE OXYGEN M A L E I C ANHYDRIDE
WATER CARBON D I O X I D E
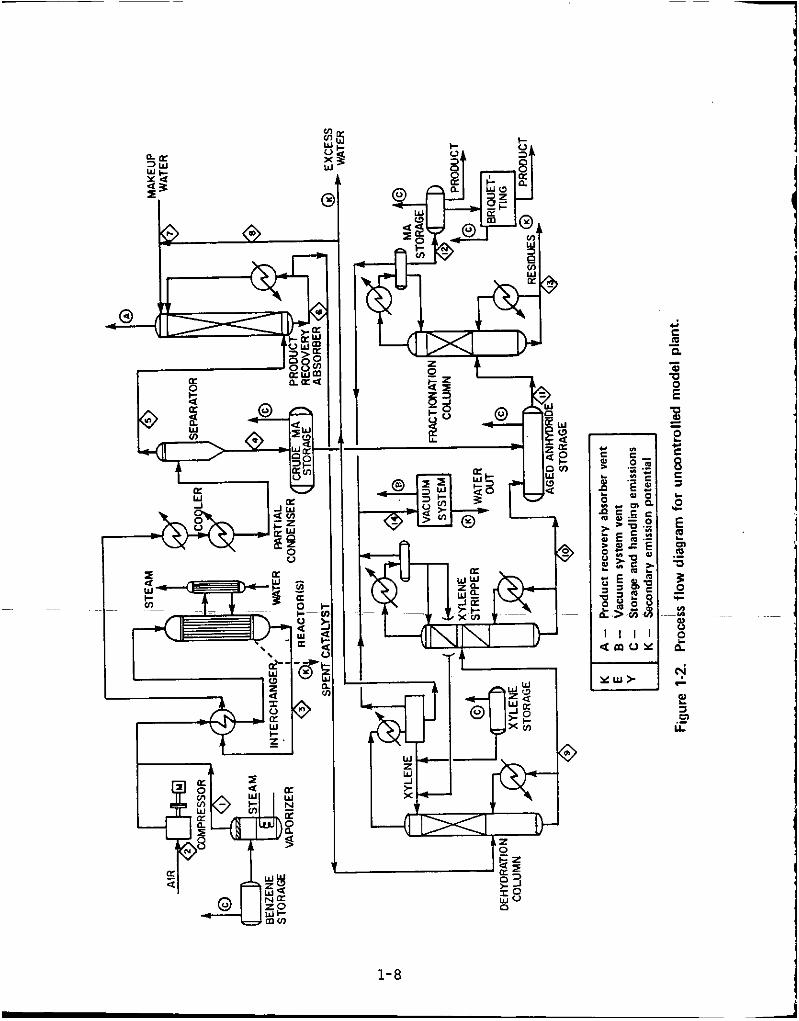
The process f l o w diagram w i t h numbered streams shown i n F igure 1-2 repre-
sents a t y p i c a l process. p l a n t s operate dehydrat ion and d i s t i l l a t i o n batchwise.
e i t h e r case are judged t o be equ iva len t .
l y t i c o x i d a t i o n o f benzene i s c a r r i e d o u t a t a temperature o f 350° t o 400' C (662O t o 752O F).
vanadium pentox ide supported on an i n e r t c a r r i e r ; most o f these c a t a l y s t s
a l s o c o n t a i n 25 t o 30 percent molybdenum oxide. exothermic, re leas ing 24.4 MJ/kg (10;514-Btu/lb) o f reacted benzene, w i t h
t h e excess heat be ing used t o generate steam. 1 range from 60 t o 67 percent o f t h e o r e t i c a l .
benzene concent ra t ion below i t s lower exp los ive l i m i t o f 1.5 volume percent.
The r e s u l t a n t l a r g e volume o f r e a c t o r exhaust (Stream 3) d i r e c t l y in f luences
t h e s i z e o f the subsequent product recovery equipment.
stream passes through a coo le r , p a r t i a l condenser, and separator i n which
40 percent o f the male ic anhydride i s condensed and separated as crude
product (Stream ,).lo enter the product recovery absorber, where they contac t water o r aqueous
maleic ac id .
percent (by weight) aqueous s o l u t i o n o f maleic ac id .
This t y p i c a l process i s continuous, a l though some
The emissions i n 1
A mix tu re o f benzene and a i r en te rs a t u b u l a r reac to r where the cata-
The c a t a l y s t con ta ins approximately 70 percent
The r e a c t i o n i s h i g h l y
Male ic anhydride y i e l d s
The r e a c t o r feed mix tu re i s p rov ided w i t h excess a i r t o keep the
A f t e r reac t i on , t h e
The remaining product and o the r organics (Stream 5 )
The l i q u i d e f f l u e n t f rom the absorber (Stream 6) i s a 40 The absorber vent
1-6
(Vent A) exhausts to the atmosphere or is directed to an emission control device . 1
The 40-percent maleic acid (Stream 6) is dehydrated by azeotropic distillation with xylene. dride (Stream 9) is removed in a xylene-stripping column, and the crude maleic anhydride (Stream 10) from this column is then combined with the crude maleic anhydride from the separator (Stream 4).
Color-forming impurities in the crude maleic anhydride are removed
Any xylene retained in the crude maleic anhy-
1
aging, which causes impurities to polymerize. After aging, the crude maleic anhydride (Stream 11) is fed to a fractionation column that yields purified molten maleic anhydride as the overhead product (Stream 12). fractionation column bottoms containing the color-forming impurities are removed as liquid residue waste (Stream 13). This stream is either com- bined with other effluent or is fed to a liquid incinerator.’ percentage of the finished product is made into briquettes.
The vacuum lines from the dehydration column, xylene stripper, and fractionation column are joined to the vacuum system (Stream 14). refining vacuum system vent (Vent B) can exhaust to the atmosphere, recycle to the product recovery absorber (Stream S ) , or be directed to an emission control device. water (Stream 7) or join the liquid residue waste (Stream 13).
Essentially, all process emissions exit through the product recovery absorber (Vent A). These emissions include any unreacted benzene; this is typically 3 to 10 percent o f the total benzene feed.” The only other process emission source is the refining vacuum system vent (Vent B), which may contain small amounts of maleic anhydride, xylene, and a slight amount of benzene, because benzene could be absorbed i n the liquid stream from the product recovery absorber (Stream 6) or in the crude maleic anhydride from the separator (Stream 4).
Analyses by producers have detected no benzene at the 10-ppm level in the final maleic anhydride products produced by the benzene process.
Although the process just described and illustrated in Figure 1-2 typifies the benzene oxidation process, variations exist. partial condensation system (cooler, partial condenser, and separator)
The
A small
The
Water from the vacuum system can be recycled as makeup 1
12,13,14
In place of the
..
1-7
(D
r i
I
1-8
shown i n Figure 1-2, a so-called switch condensing system can be incorpo- rated. t o f reeze maleic anhydride on the surface and heated t o melt the maleic anhydride f o r pumping t o crude maleic anhydride storage. can remove up t o 60 percent of t h e maleic anhydride from t h e process com- pared t o 40 percent f o r the p a r t i a l condensation system. l5
additional maleic anhydride would allow the s i z e of the product recovery absorber t o be reduced and would s l i g h t l y reduce the maleic acid l o s s through the product recovery absorber (Vent A ) .
t i o n , although several other agents can be used, including isoamyl butyrate , di-isobutyl ketone, a n i s o l e , and cumene.' A vacuum evaporation system, which replaces the dehydration column and xylene s t r i p p e r , i s used by a t l e a s t one plant t o remove water and dehydrate the maleic ac id t o form maleic a n h ~ d r 7 d e . l ~ Because an azeotropic agent i s not required i n t h a t case, xylene i s eliminated a s a process emission.
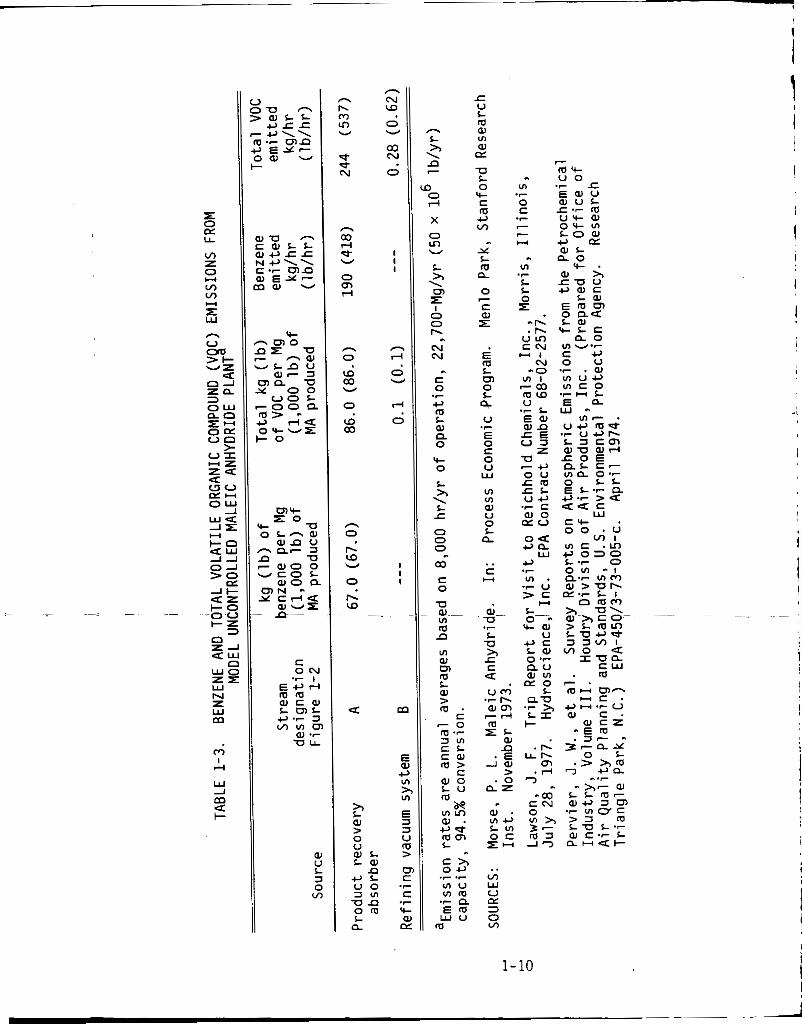
The emission r a t e s f o r t h e benzene oxidation process a r e based on a model p lan t w i t h a capacity of 22,700 Mg/yr (50 x 10 lb/yr) , assuming 8,000 hours of annual operation and 94.5 percent conversion of benzene. Though not an actual p l a n t , i t i s typical o f most plants i n capacity and operating range. The model benzene oxidation process, shown i n Figure 1-2, bes t f i t s today 's maleic anhydride manufacturing and engineering technology. Single-process t r a i n s a s shown a r e typical f o r the large p lan ts except i n the react ion area where multiple reactors a r e common. uses p a r t i a l condensation and azeotropic d i s t i l l a t i o n with xylene. emission r a t e s and sources f o r the benzene oxidation process a r e summarized i n Table 1-3 and represent compilation of da ta from several plants .
amounts of raw material reacted t o the amount of raw material fed t o t h e reactor--in t h i s case, benzene reacted t o benzene fed. 100 percent , there would be no benzene emissions from t h e process vent because a l l of t he benzene would be converted t o something e l se . conversion r a t e i s important. A maleic anhydride plant operating a t a 95-percent benzene conversion would require a control system 80 percent e f f i c i e n t i n order t o emit t he same amount of benzene a s an i d e n t i c a l , uncontrolled plant operating a t 99 percent benzene conversion.
This system uses a s e r i e s o f condensers t h a t a r e a l t e r n a t e l y cooled
Switch condensing
Removal of t h i s
Xylene is the only known azeotropic agent cur ren t ly used f o r dehydra-
6
The model process The
Emission r a t e s depend on conversion. Conversion i s t h e r a t i o of t he
I f conversion were
The exact
1-9
m I ?l
W 1
4 i-
rn
c O N
h b W v) v
d d N
n
2 U
0 m ?l
V
n 0
W 03
0
W 03
v
n 0
P- W
0
P- m
v
4
h N W 0
47 N
0
v
I I I
h rl
0 v
,+ 0
1 I I
m
E
5
e VI > VI
3 u m 5
0 C
C
Lc
L11
.r
.r
a
n L 2, \ n 7
> 0 rl
X
0 m V
L 2, \ cn r I 0 0 r. N N
c 0
c, m L 0) R. 0 9- 0
L 2, \ L T
0 0 0
03 c 0
U 0) VI m
.r
"
n VI W m m L w > m . c - 0 m 'r 3 V I c L c w c a 0
L U m a-? V I u l 0 1 . e* mcn L
m >
T V L m w VI a,
U L 0 'c c e v)
Y L m D 0
c aJ r
m
"
7
E
cn
a
m L
0 L
U
E 0 c 0 U W
VI VI a, V 0 L a
.r
.. c ct
w - U .r
1-10
I I
L
I
The highest possible benzene conversion is not necessarily optimum because not all the benzene reacted forms maleic anhydride. In fact, at high conversion rates, the yield (ratio of product formed to reactant consumed) is often lower than at lower conversions. increases with operation at a lower conversion; i.e., that which best balances conversion and yield.
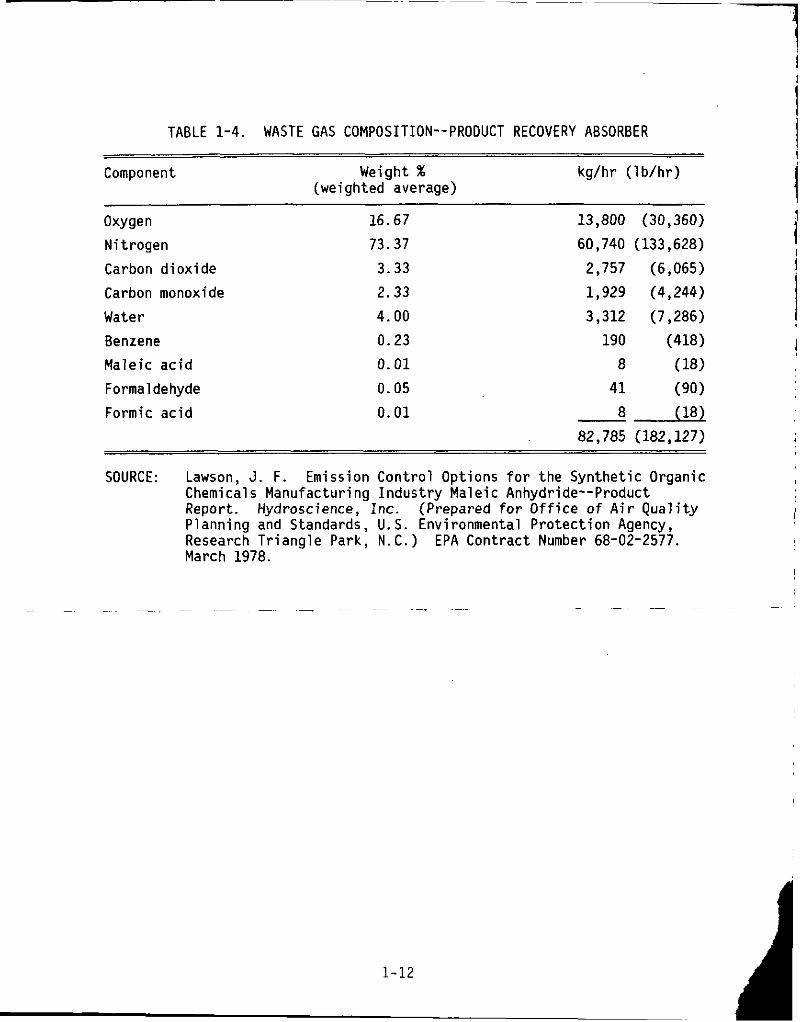
the location of the main process vent--of a model plant is shown in Table 1-4. All plants have this vent. The benzene-to-air ratio influences the concentrations of emissions from this vent. Excess air must be fed to the reactor to maintain the benzene concentration below its lower explosive limit.
Some types of process upsets result i n more benzene being released because the product recovery absorber can only remove benzene up to its solubility level in water or aqueous maleic acid. These upsets can result in short-duration benzene and volatile organic compound (VOC) emissions of three to five times normal. Process startup at an uncontrolled plant also results in temporary benzene emissions three to five times the normal rate because the benzene does not react completely until proper catalyst temper- ature is reached and, again, absorption is only effective up to the limits of sol ubi 1 i ty.
condensibles from the three vacuum columns used to dehydrate and frac- tionate maleic anhydride. The VOC emissions--maleic acid, xylene, and possibly benzenz--are estimated to be relatively small, as indicated in Table 1-3. emissions from this vent.
Thus, production often
The composition of the waste stream from the product recovery absorber--
The refining.vacuum system vent (Vent 6, Figure 2) exhausts the non-
Process upsets, startups, and shutdowns do not affect the VOC 16
Table 1-5 summarizes the estimated benzene emissions from maleic
Descriptions of fugitive and storage benzene emissions are to be anhydride plants for uncontrolled and existing control conditions.
covered i n another document. 1.2.2 n-Butane Oxidation Process
Little information in the open literature is available on maleic anhy- dride production by the oxidation o f n-butane, as currently practiced in the United States. Thus, it is particularly difficult to assess the effi-
1-11
I
i I ! i
TABLE 1-4. WASTE GAS COMPOSITION--PRODUCT RECOVERY ABSORBER !
Component Weight % kg/hr ( l b /h r )
Oxygen 16.67 13,800 (30,360) Ni t rogen 73.37 60,740 (133,628) Carbon d iox ide 3.33 2,757 (6,065) Carbon monoxide 2.33 1,929 (4,244)
(weighted average)
i
Water
Benzene
4.00 0.23
3,312 (7,286) 1 190 (418) 1
Male ic a c i d 0.01 8 (18) Formaldehyde Formic a c i d
0.05 0.01
SOURCE: Lawson, J. F. Emission Cont ro l Opt ions f o r the Synthe t ic Organic Chemicals Manufactur ing I n d u s t r y Male ic Anhydride--Product Report. Hydroscience, I nc . (Prepared f o r O f f i c e o f A i r Q u a l i t y P lanning and Standards, U.S. Environmental P ro tec t i on Agency, 1 Research T r i a n g l e Park, N . C . ) EPA Contract Number 68-02-2577. I March 1978. I
1
I
1-12
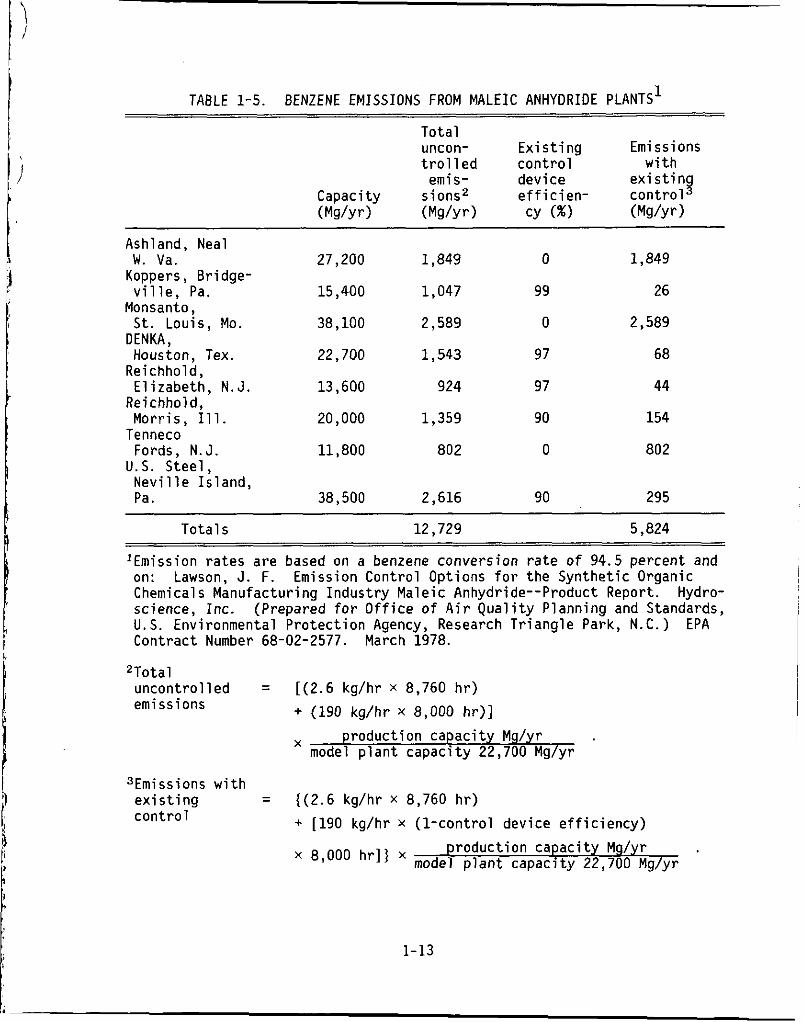
TABLE 1-5. BENZENE EMISSIONS FROM MALEIC ANHYDRIDE PLANTS’
To ta l uncon- E x i s t i n g Emissions t r o l l ed c o n t r o l w i t h
emis- device e x i s t i n g Capacity s ions2 e f f i c i e n - c o n t r o l (Mg/yr) (Mg/yr 1 CY (%I (Mg/yr)
Ashland, Neal W . Va. 27,200 1,849 0 1,849
Koppers, Br idge-
Monsanto,
DENKA,
Reichhold,
Reichhold,
Tenneco
U.S. Stee l ,
v i l l e , Pa. 15,400 1,047 99 26
S t . Louis, Mo. 38,100 2,589 0 2,589
Houston, Tex. 22,700 1,543 97 68
El izabeth , N.J. 13,600 924 97 44
Morr is , Ill. 20,000 1,359 90 154
Fords, N.J. 11,800 802 0 802
N e v i l l e I s land , Pa. 38,500 2,616 90 295
To ta l s 12,729 5,824 ~ ~ ~ ~~~
lEmission ra tes are based on a benzene convers ion r a t e o f 94.5 percent and on: Lawson, J. F. Emission Contro l Opt ions f o r the Synthet ic Organic Chemicals Manufactur ing Indus t r y Male ic Anhydride--Product Report. science, Inc . U.S. Environmental P ro tec t i on Agency, Research T r iang le Park, N.C.) EPA Contract Number 68-02-2577. March 1978.
Hydro- (Prepared f o r O f f i c e o f A i r Q u a l i t y P lanning and Standards,
2Tota l uncon t ro l l ed = [(2.6 kg/hr x 8,760 h r ) emissions + (190 kg/hr x 8,000 hr)]
X produc t ion capac i t y Mg/yr model p l a n t capac i t y 22,700 Mg/yr
3Emissions w i t h e x i s t i n g = I(2.6 kg/hr x 8,760 h r ) con t ro 1
~~ - + [190 kg/hr x (1 -cont ro l device e f f i c i e n c y )
roduc t i on capac i ty Mg/yr mode! p l a n t capac i ty 22,700 Mg/yr ’ 8’ooo hrl’
1-13
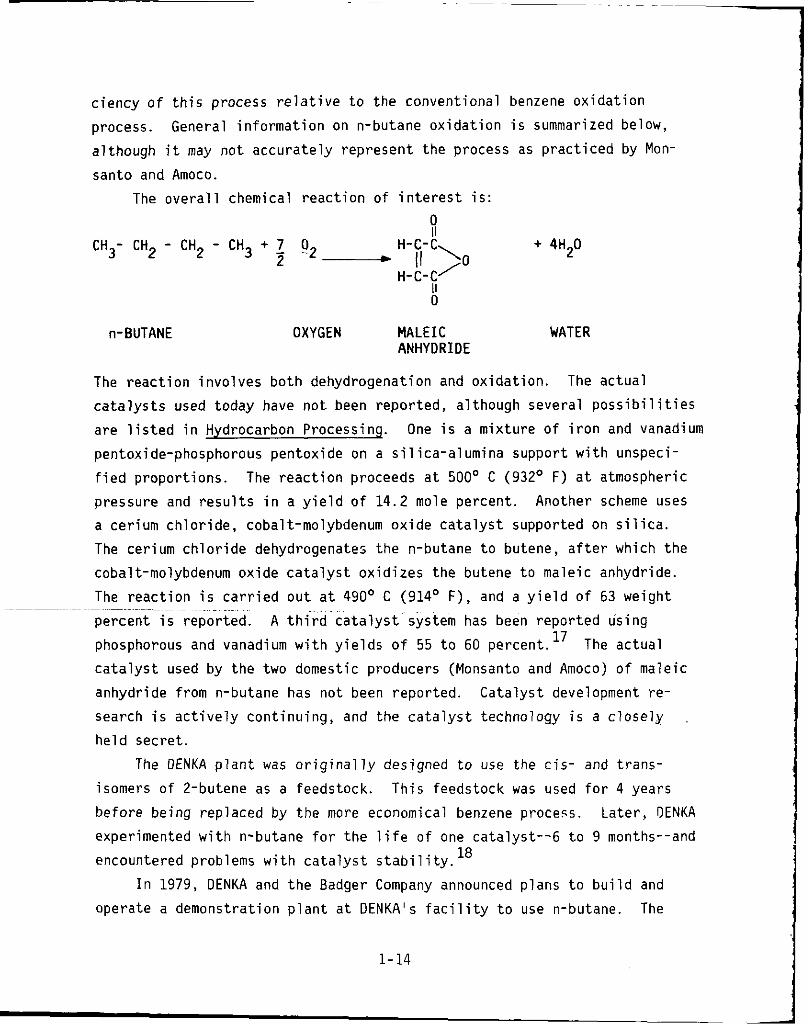
c iency o f t h i s process r e l a t i v e t o t h e convent ional benzene ox ida t i on
process. General i n fo rma t ion on n-butane ox ida t i on i s summarized below,
a l though i t may n o t accu ra te l y represent the process as p r a c t i c e d by Mon-
santo and Amoco. The o v e r a l l chemical r e a c t i o n o f i n t e r e s t i s :
0
n-BUTANE
0
OXYGEN MALEIC ANHYDRIDE
WATER
The r e a c t i o n i nvo l ves bo th dehydrogenation and ox ida t i on .
c a t a l y s t s used today have n o t been repor ted, a l though several p o s s i b i l i t i e s are l i s t e d i n Hydrocarbon Processing.
pentoxide-phosphorous pentox ide on a s i l i c a - a l u m i n a support w i t h unspeci-
f i e d propor t ions . pressure and r e s u l t s i n a y i e l d o f 14.2 mole percent . a cer ium c h l o r i d e , cobalt-molybdenum ox ide c a t a l y s t supported on s i l i c a . The cerium c h l o r i d e dehydrogenate; the n-butane t o butene, a f t e r which the
cobalt-molybdenum ox ide c a t a l y s t ox id i zes the butene t o maleic anhydride.
The reac t i on i s c a r r i e d o u t a t 490' C (914' F) , and a y i e l d o f 63 weight
percent i s reported.
phosphorous and vanadium w i t h y i e l d s o f 55 t o 60 percent. l7 c a t a l y s t used by the two domestic producers (Monsanto and Amoco) o f maleic
anhydride from n-butane has not been repor ted.
search i s a c t i v e l y cont inu ing , and the c a t a l y s t technology i s a c l o s e l y
h e l d secret .
The ac tua l
One i s a mix tu re o f i r o n and vanadium
The r e a c t i o n proceeds a t 500' C (932' F) a t atmospheric
Another scheme uses
~~~~~~~~~~~~ ~~ ~~~~~ ~~~
A ~ t h i r d ~ c a t a l y s t system has been repor ted us ing
The ac tua l
Ca ta l ys t development re -
The DENKA p l a n t was o r i g i n a l l y designed t o use the c i s - and t rans-
isomers o f 2-butene as a feedstock.
be fore be ing rep laced by t h e m o r e economical benzene process. Later , OENKA
experimented w i t h n-butane f o r t h e l i f e o f one ca ta l ys t - -6 t o 9 months--and
encountered problems w i t h c a t a l y s t s t a b i l i t y .
operate a demonstrat ion p l a n t a t DENKA's f a c i l i t y t o use n-butane.
Th is feedstock was used f o r 4 years
18
I n 1979, DENKA and t h e Badger Company announced p lans t o b u i l d and The
1-14
process uses a f l u i d i z e d bed reac tor . ’ Badger repo r t s h igh y i e l d s and l o w
u t i l i t i e s consumption, based on l abo ra to ry and model p l a n t t e s t s .
o x i d a t i o n process i s s i m i l a r t o t h e benzene o x i d a t i o n process shown p r e v i - ous ly i n f i g u r e 1-2. One obvious, major d i f f e rence i s i n t h e raw mate r ia l
storage f a c i l i t i e s , where n-butane requ i res a d d i t i o n a l sa fe ty and proper ty
p r o t e c t i o n s a f e g ~ a r d s . ’ ~ standard cond i t ions , i t w i l l normal ly be s to red as a l i q u i d i n p ressur ized
vessels, r e s u l t i n g i n a d d i t i o n a l opera t ing costs. L ike the benzene process, product recovery i s by p a r t i a l condensation, product absorpt ion, dehydrat ion,
and f r a c t i o n a t i o n . 2o t h a t the n-butane process i s analogous t o the benzene process.
Ashland Chemical, which s t a r t e d up a new benzene-based p l a n t i n 1976,
s ta tes it i s ab le t o conver t t o n-butane feed simply w i t h a change i n
cata lyst .21 can be accomplished a t a r e l a t i v e l y smal l f r a c t i o n o f the c o s t o f a new
plant.21
o x i d a t i o n by changing t h e c a t a l y s t system, and conversion can be accomplished f o r much less than the cos t o f a new plant.21 This imp l i es t h a t , f o r the
most p a r t , t h e same u n i t operat ions are performed a f t e r the reac t i on module
and i n equipment o f s i m i l a r design and capac i ty . On the o the r hand, the re is evidence t h a t some process d i f f e rences
e x i s t between the benzene and t h e n-butane process. The n-butane process
i s s a i d t o r e q u i r e a longer reac to r residence t ime and, there fore , b igger
reac tors .22 the n-butane process t o achieve t h e same produc t ion ou tpu t , a l though the re
are few data upon which t o est imate the increase i n c a p i t a l cos t .
source est imates the c a p i t a l cos ts f o r an n-butane p l a n t cou ld be 10 t o 20
percent h igher than f o r a comparable, benzene-based p lan t . 23 Also, produc- t i o n capac i ty would decrease f o r an e x i s t i n g benzene-based p l a n t , i f i t
were changed t o use n-butane as a feedstock, unless the reac tors were
rep laced w i t h l a r g e r equipment.
s t e e l reac tors used i n the ox ida t i on o f benzene may n o t w i ths tand the
h igher temperatures o f n-butane ox ida t i on . 24
A s i m p l i f i e d f l ow diagram from one producer i nd i ca tes t h a t the n-butane
Because n-butane i s i n the gaseous s t a t e a t
f u r t h e r i n d i r e c t evidence supports the assumption F i r s t ,
Second, it has been repor ted t h a t the swi tch t o n-butane feed
Th i rd , the benzene o x i d a t i o n process can be converted t o n-butane
This means t h a t a h igher c a p i t a l investment i s requ i red f o r
One
An a d d i t i o n a l problem i s t h a t t h e carbon
furthermore, t h e composi t ion
, o f the stream from the reac tors i s l i k e l y t o d i f f e r i n the n-butane process,
A 1-15 I
even though many o f the same compounds w i l l be present.LL For t h i s reason,
v a r i a t i o n s i n t h e design and opera t ion o f the produc t recovery and r e f i n i n g
steps would be expected f o r a new p l a n t based on n-butane." The impact o f t h i s v a r i a t i o n on t h e e f f i c i e n c y o f a converted f a c i l i t y i s n o t w e l l known
b u t cou ld be a s i g n i f i c a n t problem. According t o Chemical Week:
"One producer notes t h a t the a d v i s a b i l i t y o f b u i l d i n g new n-butane- based capac i ty versus conver t ing o l d benzene-based capac i t y t o n-butane i s 'one o f these quest ions no t y e t answered'."21
A sw i tch i n feeds f o r an e x i s t i n g f a c i l i t y would r e q u i r e a major investment i n new c a t a l y s t s ; 8,21 f o r p lan ts w i t h an a c t i v a t e d carbon adsorp t ion u n i t
a t tached t o t h e product recovery absorber, a d d i t i o n a l m o d i f i c a t i o n costs
would be i ncu r red , l 9 probably n o t be as h igh as i n new p l a n t s designed s p e c i f i c a l l y f o r n-butane;
t h i s lowered e f f i c i e n c y might be ser ious enough t o warrant o the r major
design changes.
1 . 2 . 3 Byproduct o f Ph tha l i c Anhydride Product ion
Male ic anhydride i s recovered as a byproduct f rom the p l a n t e f f l u e n t . '
emissions associated w i t h maleic anhydr ide recovery a re be l ieved t o be
i n s i g n i f i c a n t and are no t be ing i n v e s t i g a t e d a t t h i s time.
benzene emissions from t h i s recovery process.
the produc t ion o f maleic anhydride by t h i s process i s expected.
1 .2.4 Fore ign Process
i n t h e Un i ted States i s a process us ing feedstocks o f 65 t o 80 percent
butenes w i t h the remainder most ly n-butanes o r isobutene (mixed C4 oxida- t i o n ) . The general process d e s c r i p t i o n i s s i m i l a r t o t h a t shown i n F igure
1-2 fo r benzene ox ida t i on .8 The exhaust from t h e main process vent conta ins
unreacted n-butane, butene, carbon monoxide, and var ious secondary products.
Except f o r the poss ib le absence o f benzene, the VOC emissions should be about the same as f o r t h e benzene o x i d a t i o n process.
The most s i g n i f i c a n t process v a r i a t i o n - - t h e use o f a f l u i d i z e d cata-
l y s t bed r a t h e r than a f i x e d bed--was developed f o r the mixed C4 process.
This v a r i a t i o n prov ides good temperature c o n t r o l w i t h i n the bed, a l l o w i n g
optimum r a t i o s of feed t o a i r .
Moreover, t h e o v e r a l l y i e l d i n converted p l a n t s would
21,22
Ph tha l i c anhydride i s manufactured from naphthalene and orthoxylene. The
There are no
I n add i t i on , no growth i n ~
The on ly s i g n i f i c a n t f o re ign process t h a t d i f f e r s from processes used
11
I n con t ras t , optimum feed- to -a i r r a t i o s
1-16
I
1
I
cannot be used w i t h f i x e d bed systems because temperature cannot be prec ise-
l y c o n t r o l l e d ; t he re fo re , excess a i r becomes necessary t o s tay below t h e
explos ive range.
w i l l reduce emissions from the product recovery absorber. However, t h i s
advantage i s o f f s e t by the lower product y i e l d s obtained w i t h t h e f l u i d i z e d
bed than w i t h the f i x e d bed.
1 . 3 SUMMARY
The reduc t i on o f excess a i r i n the f l u i d i z e d bed feed
4
This chapter has descr ibed t h e processes and associated emissions f o r
f o u r routes t o the p roduc t i on o f male ic anhydride.
process i s emphasized because i t i s t he o n l y one known t o emi t benzene. Two process emission p o i n t s have been discussed: the product recovery
absorber vent, and t h e r e f i n i n g vacuum system vent. emissions a re discussed; emissions o f benzene from f u g i t i v e and storage
sources a re t o be addressed i n another document t h a t discusses these emis- sions from o the r chemical i n d u s t r i e s and petroleum r e f i n e r i e s .
able data permi t ted; i t may rep lace benzene o x i d a t i o n i n t h e fu tu re .
The benzene o x i d a t i o n
Only t h e process
The n-butane o x i d a t i o n process i s discussed t o t he e x t e n t t h a t a v a i l -
1.4
1.
3.
4. 11
5. I.
I
6.
7 .
8.
REFERENCES
Blackford, J. C. CEH Market ing Research Report on Maleic Acid. I n : Chemical Economics Handbook. Menlo Park, Stanford Research I n s t . J u l y 1976.
O f f i c e o f A i r Q u a l i t y Planning and Standards, U.S. Environmental P r o t e c t i o n Agency. Research T r i a n g l e Park, N.C. 1977.
Koppers Clos ing Male ic P lant , F i r m C i t e s Outdated Technology. Chemical Market ing Reporter. - 215:3, 11. A p r i l 9, 1979.
M i t s u b i s h i Chemical D e t a i l s i t s &-based Maleic Process. European Chemical News. A p r i l 5, 1974.
Checkoff. Chemical and Engineer ing News. - 57(40): 13. October 1, 1979.
Neunre i ter , R . L. F l o r i d a S i t e Selected by Monsanto f o r New Maleic Anhydride P l a n t (press release). Monsanto Chemical Intermediates Co. S t . Louis, Mo. August 16, 1979.
Chementator. Chemical Engineering. - 86(23):81. October 22, 1979.
Lenz, O., and M. De B o v i l l e . The Bayer Process f o r t he Product ion o f Maleic Anhydride from Butenes. 1976.
Unpublished EPA Survey and Ranking In format ion.
Rev Assoc F r Tech Pet. - 236(20-3):17.
1-17
9.
10.
11
12.
13.
14.
15.
16.
17.
18.
19.
20.
21.
22.
Telecon. Weber, Robert, O f f i c e o f A i r Q u a l i t y Planning and Standards, U.S. Environmental P r o t e c t i o n Agency, w i t h P i e r l e , Michael, Monsanto Chemical In termediates Co. January 18, 1979.
Lawson, J. F. Emission Control Opt ions f o r t he Synthet ic Organic Chemicals Manufactur ing I n d u s t r y Male ic Anhydride--Product Report. Hydroscience, I nc . (Prepared f o r O f f i c e o f A i r Q u a l i t y Planning and Standards, U.S. Environmental P r o t e c t i o n Agency, Research T r iang le Park, N.C.) EPA Contract Number 68-02-2577. March 1978.
Lewis, W. A. , J r . , G. M. R i n a l d i , and T. W. Hughes. Source Assessment: Male ic Anhydride Manufacture. Monsanto Research Corp. EPA Contract Number 68-02-1874.
Telecon. Warren, J. L., Research T r i a n g l e I n s t . , w i t h P i e r l e , M. A. , Monsanto Chemical Intermediates Co. November 16, 1978.
Telecon. Warren, J. L., Research T r i a n g l e I n s t . , w i t h Hewett, S . , Reichhold Chemicals, Inc. November 20, 1978.
Telecon. Warren, J. L . , Research T r i a n g l e I n s t . , w i t h Brennan, H . , Amoco Chemicals Corp. November 17, 1978.
Lawson, J. F. T r i p Report f o r V i d i t t o Reichhold Chemicals, I nc . , Mor r i s , I l l i n o i s , J u l y 28, 1977. Hydroscience, Inc. EPA Contract Number 68-02-2577.
P e r v i e r , J. W . , e t a l . Survey Reports on Atmospheric Emissions from t h e Petrochemical I ndus t r y , Volume 111. Houdry D i v i s i o n o f A i r Pro- ducts, I n c . (Prepared f o r O f f i c e o f A i r Q u a l i t y Planning and Stand- ards. U.S. Environmental P r o t e c t i o n Agency. Research T r i a n g l e Park,
Hatch, Lewis F . , and Matar, Sami. Hydrocarbons t o Petrochemicals . . . P a r t 7 Petrochemicals from n -Para f f i ns . - 56(11):355. November 1977.
L e t t e r from Babb, K. H. , Research T r i a n g l e I n s t . , t o Hinkson, R. E . , DENKA Chemical Corp. September 7, 1979.
L e t t e r from P i e r l e , M. A , , Monsanto Chemical Intermediates Co., t o P a t r i c k , 0. R . , O f f i c e o f A i r Planning and Standards, U.S. Environ- mental P r o t e c t i o n Agency. March 22, 1978.
Lawson, J. F. I l l i n o i s , January 24, 1978. Hydroscience, I nc . EPA Contract Number 68-02-2577.
Maleic Makers B u i l d on Hopes f o r Polyester . Chemical Week. g ( 5 ) : 37-38. February 2, 1977.
Maleic B u i l d s New Bridges t o Feedstocks. Chemical Week. @(15):79. October 13, 1976.
~ N.C.)- EPA-450/3-73-005-c. -Apri1-1974. -
Hydrocarbon Processing.
T r i p Report f o r V i s i t t o Amoco Chemicals Corp., Chicago,
1-18
23. L e t t e r from Weber, Robert, O f f i c e o f A i r Q u a l i t y Planning and Standards, U.S. Environmental P r o t e c t i o n Agency, t o Gans, M . , S c i e n t i f i c Design Co., I nc . December 27, 1978.
24. L e t t e r from P i e r l e , M. A . , Monsanto Chemical In termediates Co., t o Goodwin, 0. R., O f f i c e o f A i r Q u a l i t y P lanning and Standards, U . S . Environmental P r o t e c t i o n Agency. February 22, 1978.
1-19
2. E M I S S I O N CONTROL TECHNIQUES
2 . 1 ALTERNATIVE E M I S S I O N CONTROL TECHNIQUES This chapter addresses t h e c o n t r o l techniques t h a t can be a p p l i e d and
the emission reduc t ions t h a t can be achieved f o r each benzene source i d e n t i -
f i e d i n Chapter 1.
The c o n t r o l techniques t h a t can be a p p l i e d t o reduce benzene emissions from male ic anhydride manufactur ing f a c i l i t i e s f a l l i n t o two classes:
. Add-on c o n t r o l devices such as adsorbers o r i n c i n e r a t o r s , and
. Use o f another feedstock t o e l i m i n a t e benzene from the process.
For add-on c o n t r o l devices, i t i s assumed t h a t t h e produc t recovery absorber vent and t h e r e f i n i n g vacuum system vent can be c o n t r o l l e d by the same device. Only p i p i n g a d d i t i o n s a r e r e q u i r e d f o r c o n t r o l l i n g t h e r e f i n - i n g vacuum system a long w i t h t h e produc t recovery absorber; no added u t i l i -
t i e s , manpower, o r o ther opera t ing cos ts a r e invo lved. Emissions from the r e f i n i n g vacuum system vent a r e inc luded i n a l l c o n t r o l system ca lcu la -
t i o n s . The c o n t r o l devices descr ibed here a re a p p l i c a b l e t o the waste gas
streams def ined i n Chapter 1. Furthermore, add-on c o n t r o l devices a re
expected t o c o n t r o l t h e process vents d u r i n g process upset cond i t ions and s t a r t u p (as discussed i n Chapter 1) w i t h no increase i n emissions.
Because o f t h e low concentrat ions o f benzene and o t h e r v o l a t i l e organic
compounds ( V O C ) i n t h e emissions from t h e main process vent ( s e e Table
1-4), t he use o f f l a r e s i s n o t genera l l y b e l i e v e d t o be an ,>pl icable
c o n t r o l technique. The h igh-vo l ume, 1 ow-benzene concent ra t ion waste
stream would r e q u i r e l a r g e amounts o f a u x i l i a r y f u e l w i t h o u t the oppor tun i ty
f o r heat recovery.
2 . 1 . 1 Carbon Adsorpt ion
t o c o n t r o l waste gas streams c a r r y i n g VOC f o r s i m i l a r a p p l i c a t i o n s ; e .g . , w i t h i n l e t organic concentrat ions ranging from 1 ppm t o 40 volume percent
2
Carbon adsorp t ion systems have o f t e n been app l ied i n o t h e r i n d u s t r i e s
2- 1
3 3 and a t a i r f l o w ra tes o f 0.005 m /sec (11 cfm) t o over 100 m /sec
(212,000 ~ f m ) . ~ General d iscuss ions o f the theory and a p p l i c a t i o n o f 4,5,6 carbon adsorp t ion can be found elsewhere.
Adsorpt ion onto a c t i v a t e d carbon can be used t o recover benzene from
gas streams from t h e product recovery absorber and r e f i n i n g vacuum system
vent. Two p l a n t s c u r r e n t l y use a carbon adsorber system t o con t ro l the
e f f l u e n t from the product recovery a b ~ o r b e r . ~
t h i s a p p l i c a t i o n , t h e exhaust gas stream may be scrubbed w i t h a caus t i c s o l u t i o n t o remove organic ac ids and water -so lub le organics. Benzene i s
probably t h e on ly VOC remaining i n apprec iab le q u a n t i t y a f t e r scrubbing.
The waste stream i s cond i t ioned by reduc ing t h e r e l a t i v e humid i ty , which
improves load ing capac i ty .
depending on the design and opera t ion o f t h e adsorber system. 99 percent o r g rea ter reduc t i on o f hydrocarbon emissions, i n c l u d i n g benzene,
can be ~ b t a i n e d . ~ systems f o r benzene c o n t r o l i n ma le ic anhydride p l a n t s inc lude:
To use carbon adsorpt ion i n
Var ious l e v e l s o f c o n t r o l can be achieved w i t h carbon adsorpt ion, I n general ,
Factors i n f l u e n c i n g the e f f i c i e n c y o f carbon adsorpt ion
Re la t i ve humid i ty o f t h e incoming waste gas stream;
benzene adsorp t ion (poss ib l y forming polymer ic ma te r ia l s on the carbon beds) thereby decreasing capac i ty ;
Temperature o f the beds and the gas dur ing adsorpt ion;
Dryness o f t h e bed when p u t back on l i n e .
* Presence o f o the r organic compounds t h a t may i n t e r f e r e w i t h
*
~ - - E f f i c i e n c y o f - the steam regenerat ion; and ~-
8 19 - Both a c a u s t i c scrubber and a heater should be inc luded i n a carbon adsorp-
t i o n system, the c a u s t i c scrubber t o remove m o s t o f t h e o ther organics i n
the stream and t h e preheater t o lower the r e l a t i v e humid i ty o f the water-
sa tura ted stream. Genera l ly , a system o f two o r more carbon beds i s used. The gas stream con ta in ing benzene passes through one o r more beds i n par-
a l l e l , and t h e benzene i s removed from the gas stream. A t the same time,
another bed i s regenerated w i t h low-pressure steam. The steam and desorbed
benzene are condensed and decanted, a f t e r which the benzene re tu rns t o the
process.
from the p l a n t o r recyc led t o t h e process. A f t e r regenerat ion, the carbon
bed, which i s h o t and sa tura ted w i t h water , i s u s u a l l y cooled and dr ied ,
o f ten by b lowing ambient a i r through the bed. Bed s ize , number, and cyc le
The aqueous l a y e r can be combined w i t h the o the r l i q u i d waste
2-2
times can be varied to achieve the desired removal efficiency. because the system may be exposed to corrosive compounds. stainless s tee l
vessels are recommended. Specific systems that can achieve various removal efficiencies are discussed in Section 2.2.1. A carbon adsorption system, however, will not remove carbon monoxide, which i s also present ill the waste gas from the product recovery absorber. 2.1.2 Thermal Incineration
Finally,
Thermal incineration, also called direct-fire incineration, can be used to control emissions- from maleic anhydride manufacture. Three plants in the United States use a thermal incinerator on the product recovery absorber vent; one uses n-butane, while the other two use benzene as the feedstock. 7110 General information on thermal incineration can be found elsewhere. 4'8
mal incinerator, heat recovery is generally used. The recovered heat can be used either to preheat the feed to the incinerator or to generate steam. Some of the factors that influence the efficiency of incineration are temperature, degree of mixing, and residence time in the combustion chamber.
Because of the cost of the fuel required to operate a ther-
For maleic anhydride plants, a knockout demister tank is required to prevent liquid droplets from reaching the burner area. Supplemental fuel i s required to maintain necessary combustion temperatures, and supplemental combustion air may also be required if the incoming gas stream is not preheated. Because the gas stream to the incinerator contains corrosive materials, the equipment ahead of the combustion chamber must be made of stainless steel. Specific incineration systems and their removal efficien- cies are described in Section 2 . 2 . 2 .
The waste gas to be incinerated is approximately 2.5 mole percent f u e l , which is below the combustible level ( s e e Table 1-4). Thus, auto- ignition can only occur if the lower flammability limit of the mixture i s 2.5 mole percent or less. Based on LeChatelier's Rule and the modified Burgess-Wheeler Law, the lower flammability levels of the waste gas mixture are 6.4 mole percent at 487' C (908' F ) and 3.2 mole percent at 871' C (1,600' F ) . even at the design temperature of the incinerator.
Consequently, autoignition of the waste gas does not occur
Concern has been expressed that benzene emissions may leak through
11
recuperative heat exchangers and incinerators. Except for rotary exchangers,
2- 3
heat exchangers generally do not leak. However, emissions are routinely prevented by maintaining the clean gas at a higher pressure than the side contaminated with benzene emissions. This higher pressure causes leakage into the feed stream to the incinerator rather than into the atmosphere. Shell and tube exchangers are not expected to leak. is inadequate or operation is improper, leakage can occur because of rup- tured tubes or warped flanges. intrinsic equipment limitations. . 2.1.3 Catalytic Incineration
I f routine maintenance
However, this leakage is not caused by 12
Catalytic incineration can be used as an alternative to thermal inciner- ation of a waste gas stream. rapidly at a lower temperature, thereby decreasing or eliminating the need for supplemental fuel consumption. A catalytic incinerator is currently used by one maleic anhydride producer to meet local hydrocarbon regulations. The unit removes at least 85 percent o f the total hydrocarbon content and 95 percent o f the CO content of the product recovery absorber vent gas
13 without additional fuel. Theoretically, a catalytic incinerator could be designed to have a
removal efficiency of 90 to 95 percent.8 In practice, however, no such system is in operation on a maleic anhydride production facility because cost may be prohibitive. Achieving high benzene removal efficiencies typi- cally requires large catalyst volumes or temperatures close to those of thermal incineration, so a catalytic converter is believed to b e uneconomical.
the catalyst may reduce its life. plants because some of the components of the waste gas stream may polym- erize.8 One catalyst producer believes this problem can be overcome by using a monolithic support system with platinum catalysts and periodic maintenance.14 Precious metal catalysts are not deactivated by water. The deposition of high-boiling organics on the catalyst's surface merely masks that surface. Periodic maintenance is often all that is required to alle- viate this problem. 2.1.4 n-Butane Process Conversion
The catalyst allows oxidation to occur more
~ ~
~- 8 ~- ~ - -~ ~~ ~
In addition, depending on the nature of the catalyst used, fouling of This may occur i n maleic anhydride
14
The n-butane oxidation process has the potential for zero benzene emissions, permitting conversion from benzene feed to n-butane feed to be
2-4
considered a c o n t r o l technique f o r reducing benzene emissions f r o m the manufacture o f maleic anhydride. The process, emissions, and f a c t o r s i n -
f l uenc ing conversion from benzene t o n-butane a re discussed i n Chapter 1. One company using n-butane has detected no benzene emissions from i t s reactors a t the lower d e t e c t i o n l i m i t s o f 1 ppmv.15 has been detected a t t he 0.5-ppm l e v e l i n the f i n a l product from t h e n-butane
process.16 i n Sect ion 1.2.2.
2 .2 PERFORMANCE OF EMISSION CONTROL TECHNIQUES
2.2.1 Carbon Adsorpt ion
con t ro l o f VOC, a carbon adsorpt ion system can be designed and operated a t a sustained benzene removal e f f i c i e n c y o f 99 p e r ~ e n t . ~
r e f l e c t s opt imal c o n t r o l o f temperature, pressure, humid i ty , and the l e v e l o f o the r organics. Carbon adsorpt ion systems opera t i ng a t d i f f e r e n t l e v e l s o f c o n t r o l are d e s c r i t r d i n t h i s sec t i on . The f i r s t system, a t 99 percent
c o n t r o l o f benzene, i s based on engineer ing design c a l c u l a t i o n s and prev ious engineer ing experience. The o the r systems descr ibed here a re based on the
experience o f e x i s t i n g maleic anhydride f a c i l i t i e s , one system repor ted by the company t o achieve an average o f o n l y 85 percent c o n t r o l o f benzene,
17 wh i l e the e f f i c i e n c y o f t h e o the r has n o t been determined.
e f f i c i e n c y o f t he adsorpt ion system, and optimum c o n t r o l o f these f a c t o r s
i s responsible f o r 99 percent reduc t i on o f benzene emissions. The carbon
adsorpt ion system uses a c a u s t i c scrubber.
carbon beds t o decrease the r e l a t i v e humid i ty .
f i c i a l v e l o c i t y through the bed and the carbon requirements, as determined
by the f l o w o f adsorbable species and t h e carbon loading f o r each species.
The s u p e r f i c i a l v e l o c i t y i s impor tant because i t a f f e c t s t h e pressure drop through the bed. The u s u a l l y acceptable range f o r s u p e r f i c i a l v e l o c i t y i s 25 t o 50 cm/sec (10 t o 20 in/sec), which g ives a pressure drop o f 25 t o 65 cm H20/m ( 3 t o 8 i n H20/ f t ) bed.
system i s approximately 2 1 m /sec (4.5 x 10
I n a d d i t i o n , no benzene
Probleks associated w i t h conversion t o n-butane were discussed
Based on engineer ing experience w i t h s i m i l a r a p p l i c a t i o n s f o r t he
This e f f i c i e n c y
As discussed i n Sect ion 2.1.1, several key f a c t o r s i n f l uence the
A heater i s used before t h e
The s i z e o f t he a c t i v a t e d carbon adsorbers i s determined by the super-
The a i r f l o w r a t e t o the carbon adsorber 3 4 cfm). Assuming a s u p e r f i c i a l
v e l o c i t y o f 38 cm/sec (15 in /sec) , the r e q u i r e d cross-sect ional area i s
L 2-5
2 2 about 55 m (590 f t ).
tanks, two tanks 3 m (10 f t) diameter x 9 m (30 f t ) long operated i n p a r a l l e l would g i v e t h e requ i red c ross-sec t iona l area.
Because adsorbers t h i s l a rge are u s u a l l y ho r i zon ta l
To a l l o w enough t ime f o r regenerat ion, a d d i t i o n a l adsorbers are neces-
sary. To ensure t h a t 99 percent removal cou ld be achieved f o r the system,
which i s designed f o r comparison and c o s t i n g purposes, two a d d i t i o n a l adsorbers were chosen ins tead o f one. Also, experience from one adsorber
system i n t h i s a p p l i c a t i o n suggests t h e r e i s n o t s u f f i c i e n t t ime t o com-
p l e t e t h e regenera t ion c y c l e ( i n c l u d i n g t h e c o o l i n g and d r y i n g cyc le ) and
thereby prevent breakthrough when o n l y th ree beds are used.
c y c l e t ime, f l o w r a t e o f adsorbable species, and carbon loading.
sho r te r c y c l e t imes have been used, a 2-hour load ing c y c l e was chosen
i n i t i a l l y t o a l l ow a 1-hour steaming c y c l e and another hour t o cool and d r y t h e carbon i n p repara t i on f o r adsorp t ion serv ice. The amount o f carbon per
adsorber can be ca l cu la ted from emission r a t e , loading, and b u l k dens i ty :
17
The amount o f carbon i n t h e adsorber i s determined by t h e des i red Although
kg ( l b ) carbon bed c y c l e
~ Y- bed cyc e
Volume o f carbon
- 190 kg (418 l b ) BZ - h r cyc le
1 kg (2.2 l b ) carbon 0.06 kg (0.13 l b ) Bz
1 2 beds
X
= 3,200 kg (7,000 l b ) ~
~~ ~~~
~~~
3 3 = 7 . 1 m (250 f t )
The depth o f the carbon requ i red t o g i v e a 2-hour load ing cyc le i s 25 cm
(10 i n ) i n t h e adsorbers selected. Thus, i n t h i s case, the s i z e o f the adsorber i s d i c t a t e d more by t h e t o t a l f l o w r a t e than by t h e carbon requ i re -
ments. Because t h e incremental c o s t o f p u t t i n g more carbon i n the adsorbers
i s smal l , a carbon depth o f 6 1 cm was used. Each adsorher would now ho ld
17 m3 (600 ft3) o r 7,600 kg (16,800 l b ) o f carbon. Using the same carbon
load ing and benzene f l o w as be fore now g ives an adsorp t ion cyc le o f 4.8
hours, which should a l l o w enough adsorp t ion capac i ty t o prevent premature
breakthrough wh i l e t h e companion bed i s be ing regenerated.
2-6
A loading of 0.06 kg benzene (Bz) per kilogram (0.06 lb Bz/lb) Of carbon has been selected based on capacity data reported by Hoyt Manufactur- ing (a carbon adsorber vendor).' Reichhold's experience with a benzene adsorber in this application.18 The selected loading is conservative because other data in the literature show benzene loadings as high as 0.25 kg Bz/kg (0.25 lb Bz/lb) gf carbon on successive cycles for full-scale systems adsorbing benzene from town gas. If higher loadings are achieved, the loading cycle would be extended, allowing still more time for regeneration, cooling, drying, and lower operating costs.
can affect the loading capacity. cent drop in loading for some materials at a relative humidity of 80 per- cent as compared to 20 percent relative activated carbon are reported by Rohm and Haas in their technical bulletin on Ambersorb Carbonaceous Resins.21 changes were noted only in the loading capacity and not in the ability to achieve a baseline outlet concentration of less than 5 ppmv.
are required. desorption because steam requirements as low as 3 kg steadkg Bz ( 3 lb steadlb Bz) toluene have been quoted in the literature.22 ity is available when the duration o f the steaming cycle is determined; steaming can easily be completed in 1 hour or less if the condensing capacity exists. the steam flow equivalent for at least a 1-hour steam cycle as an additional safety factor. of 1.1 kg/sec (2.4 lb/sec) is determined from the average benzene flow and the steam-to-benzene ratio.
These capacity data are also similar to
19
There is some indication that the relative humidity of the vent stream Hydroscience has observed a 75- to 80-per-
Similar data for
It is important to note, however, that
9
To regenerate the carbon beds 20 kg steadkg Bz (20 lb steam/lb Bz) This amount should be more than adequate to complete the
Some flexibil-
For a new installation, it i s best to size the condenser to handle
The average steam flow (for calculating annualized costs)
An important part of the total operation is the cooling and drying sequence. and lower adsorption capacities will result. Note that this result con- trasts with the previously discussed effect of relative humidity of the inlet gas on loading capacity and efficiency. The full-scale experience with benzene adsorbers at one facility where cooling and drying are not practiced shows that there was an initial spike of benzene in the outlet immediately after the hot bed was put back on line.17
If the bed is not properly cooled and dried, both poor efficiency
In addition to this
2-7
i n i t i a l sp ike, the instantaneous removal was r a r e l y b e t t e r than 97 percent.
These data are cons is ten t w i t h the observat ions t h a t poor e f f i c i e n c y and
reduced load ing capac i t y occur when t h e adsorber i s n o t p roper l y cooled and d r i e d fo l l ow ing a steam regenerat ion. I n o rder t o achieve grea ter than 99
percent removal, the bed must be cooled and d r ied .
from the coo l i ng and d r y i n g cyc le must be recyc led t o a carbon bed t h a t i s
i n the adsorpt ion mode. the re i s capac i ty t o handle t h e a d d i t i o n a l benzene and a i r f l o w as w e l l as t ime t o complete the c o o l i n g and d r y i n g cyc le . The data from one f a c i l i t y
show t h a t the c o o l i n g and d r y i n g pe r iod l a s t e d f o r about the f i r s t 15 minutes
o f waste gas i n c i n e r a t i o n and t h a t about 1 t o 3 percent o f the benzene i n t h e feed l e f t the system d u r i n g t h i s per iod . l7 I f the wors t case o f 3
percent i s used, t h e c a l c u l a t e d adsorber du ty would be about 197 kg/hr
(433 lb /h r ) ins tead o f 190 kg/hr (418 lb /h r ) . breakthrough ( a t a l oad ing o f 0.06 kg Bz/kg carbon C0.06 kg Bz/kg]) would
on l y be reduced from 4.8 hours t o 4.65 hours.
t h e on - l i ne adsorber i s more c r i t i c a l than t h e recyc le o f some adsorbed benzene s ince ou ts ide a i r must be used f o r d ry ing .
s u i t a b l e f o r d r y i n g (even though the r e l a t i v e humid i ty o f the vent down-
stream o f the scrubber i s reduced from 100 percent r e l a t i v e humid i ty t o
about 50 percent r e l a t i v e humid i ty by t h e preheate!).’ ~~ For design ~ -~ purposes, a c o o l i n g and d r y i n g cyc le o f 1 hour a t a f l o w r a t e equ iva len t t o one- four th
t o one-hal f o f the f l o w r a t e dur ing t h e adsorbing c y c l e was chosen. This
I n add i t i on , the exhaust
Th is means t h a t t h e adsorbers must be s i zed so
The ca l cu la ted t ime t o
I
The e f f e c t o f t o t a l f l o w r a t e on e f f i c i e n c y and pressure drop through
The vent i t s e l f i s n o t
would r a i s e the s u p e r f i c i a l v e l o c i t y f o r t h e adsorbing carbon bed from 38
cm/sec (15 in/sec) t o 49 t o 57 cm/sec (19 t o 22 in/sec) du r ing t h e c o o l i n g
and d r y i n g cyc le b u t would n o t c rea te an excessive pressure drop. Because two beds cou ld be coo l i ng a t once, the blower has been s ized t o d e l i v e r 2 1 m /sec (4.5 x 10 A c a p i t a l savings cou ld be achieved i f a blower
3 4 were s ized a t 11 m /sec (2.3 x 1 0 cfm). However, the a d d i t i o n a l c a p i t a l
cos t o f the l a r g e r blower i s considered j u s t i f i e d t o make the opera t ion o f
the adsorpt ion system more f l e x i b l e .
3 4 cfm).
P e r t i n e n t d e t a i l s o f the system
designed t o achieve 99 percent con t ro l o f benzene are i n Table 2-1, and I
costs f o r such systems are presented f o r each p l a n t i n Chapter 5.
i As i nd i ca ted p rev ious l y , t w o p l a n t s c u r r e n t l y use carbon adsorp t ion
systems t o c o n t r o l benzene from product recovery absorber vents. One p l a n t
2-8
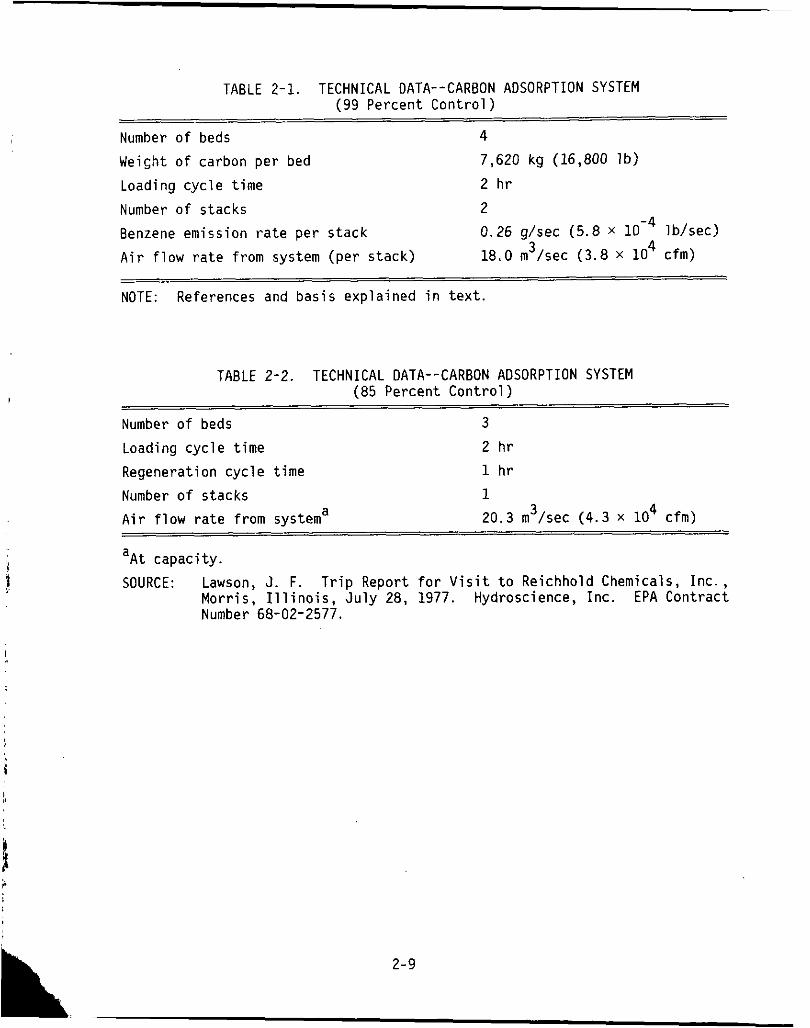
TABLE 2-1. TECHNICAL DATA--CARBON ADSORPTION SYSTEM (99 Percent Con t ro l )
Number o f beds 4 Weicht o f carbon pe r bed Loading cyc le t ime 2 h r
Number o f stacks 2
Benzene emission r a t e pe r s tack 0.26 g/sec (5.8 x lb/sec)
A i r f l o w r a t e from system (per stack)
NOTE: References and bas is explained i n t e x t .
7,620 kg (16,800 lb )
3 4 18.0 m /sec (3.8 x 10 cfm)
TABLE 2-2. TECHNICAL DATA--CARBON ADSORPTION SYSTEM (85 Percent Con t ro l )
Number o f beds 3
Loading c y c l e t ime 2 h r
Regeneration cyc le t ime 1 h r Number o f stacks 1
A i r f l o w r a t e from systema
a
SOURCE: Lawson, J. F. T r i p Report f o r V i s i t t o Reichhold Chemicals, Inc. , Mor r i s , I l l i n o i s , J u l y 28, 1977. Hydroscience, I nc . EPA Contract Number 68-02-2577.
20.3 m3/sec (4.3 x lo4 cfm)
A t capaci ty.
2-9 L
. ~
I
f o r which data are a v a i l a b l e repo r t s t h a t i t has achieved a susta ined benzene removal e f f i c i e n c y o f on l y 85 percent.”
by t h e U.S. Environmental P ro tec t i on Agency (EPA) showed a mean benzene
removal e f f i c i e n c y o f 93 percent ( w i t h a 90-percent conf idence i n t e r v a l o f
89 t o 97 p e r ~ e n t ) . ’ ~
o f f u l l capac i ty when tested.
summarized i n Table 2-2. stream t o cool and d ry t h e beds a f t e r regenera t ion w i t h steam.
a f t e r regenerat ion, t h e waste gas stream con ta in ing benzene i s d i r e c t e d t o
the ho t bed. Consequently, u n t i l t h e bed coo ls benzene removal e f f i c i e n c y i s low, which p a r t i a l l y accounts f o r t h e low o v e r a l l benzene removal e f f i -
c iency.
e f f i c i e n c y o f 98 percent , a l though no r e l i a b l e data a re c u r r e n t l y a v a i l a b l e
upon which t o est imate i t s performance. The system can be expected t o show
b e t t e r performance than t h e one discussed p r e v i o u s l y because the beds a r e
cooled and d r i e d w i th a i r a f t e r steam desorpt ion. 24
data on t h i s system are i n Table 2-3. 2.2.2 Thermal I n c i n e r a t i o n
Resul ts o f t e s t s conducted
I
However, t h e p l a n t was opera t ing a t on l y 40 percent P e r t i n e n t techn ica l data on t h a t system are
This system does no t use an organ ic - f ree gas
Immediately
The system a t the second p l a n t was designed f o r a benzene removal
P e r t i n e n t t echn ica l
Based on engineer ing experience w i t h s i m i l a r app l i ca t i ons f o r the
c o n t r o l o f V O C ’ s , i t i s expected t h a t a thermal i n c i n e r a t o r can be designed 7 and operated a t a susta ined benzene removal e f f i c i e n c y o f 99 percent.
maleic anhydride produc t ion f a c i l i t i e s , b u t t h e r e are severa l cases i n
4
~~ ~~
~~
L im i ted i n f o r m a t i o n i s a v a i l a b l e 03 direct- flame^-afterburners used-on ~~~ ~~ ~- ~~
which streams s i m i l a r t o the product recovery absorber and r e f i n i n g vacuum ! system vent gas have been c o n t r o l l e d a t h igh e f f i c i e n c i e s .
data repor ted f o r to luene i n d i c a t e a des t ruc t i on e f f i c i e n c y o f 99.9 percent
a t 766’ C (1,411O F) and a residence t ime o f 0 .21 second f o r to luene.
Another f a c i l i t y i nc ine ra tes a to luene-xy lene vapor a t 760° C (1,400° F)
and repo r ted l y achieves a d e s t r u c t i o n e f f i c i e n c y o f 99.1 percent .26
t h i r d i n s t a l l a t i o n r e p o r t e d l y expects a d e s t r u c t i o n e f f i c i e n c y o f g rea ter
than 99 percent a t 760° C (1,400° F) f o r an organic stream considered as
toluene.26 F i n a l l y , a review o f severa l case s tud ies i nd i ca tes t h a t combus-
t i o n e f f i c i e n c i e s o f l ess than 95 percent were achieved, except i n one
case, a t temperatures o f 730° C (1,346’ F) o r lower.
I n one case,
25 I
I A
i !
1 . 4
Conversely, e f f i c i e n -
2-10
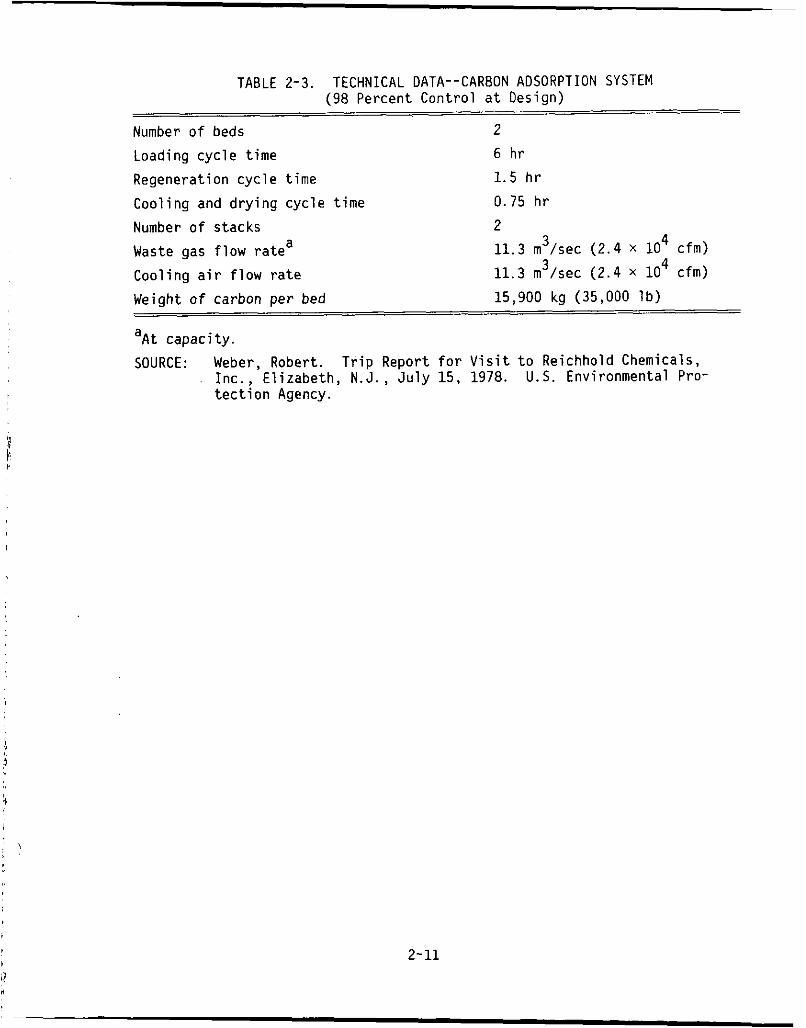
TABLE 2-3. TECHNICAL DATA--CARBON ADSORPTION SYSTEM (98 Percent Contro l a t Design)
Number o f beds 2
Loading c y c l e t ime 6 h r
Regeneration c y c l e t ime 1 .5 h r
Cool ing and d r y i n g cyc le t ime 0.15 h r
Number o f stacks
Waste gas f l o w ra tea
Cool ing a i r f l o w r a t e
,. L 11.3 m3/sec (2.4 X 10 4 cfm)
11.3 m3/sec (2.4 X 10 4 cfm)
Weight o f carbon pe r bed
a
SOURCE: Weber, Robert. T r i p Report f o r V i s i t t o Reichhold Chemicals,
15,900 kg (35,000 l b )
A t capaci ty .
Inc. , E l izabeth, N.J., J u l y 1 5 , 1978. U.S. Environmental P r o - t e c t i o n Agency.
2- 11 I! n
c i e s o f 99 percent p l u s were achieved a t temperatures o f 760' C (1,400' F)
o r g rea ter .
c ienc ies f o r s i m i l a r streams. Wi th a toluene-contaminated gas, i t was
found t h a t approximately 99 percent d e s t r u c t i o n e f f i c i e n c y was achieved a t 760' C (1,400' F) and a residence t ime o f 0.33 second. As the temperature
increased t o 816' C (1,501' F) , the e f f i c i e n c y increased t o 99.5 percent.
h i g h des t ruc t i on e f f i c i enc ies .28 Wi th a d e t e c t i o n l i m i t o f 2 ppmv, no
benzene was found a t temperatures above 790' C (1,454' F) w i t h residence
t imes as low as 0.08 second. Based on t h a t research, a thermal o x i d i z e r
w i t h a residence t ime o f 0.5 second would r e q u i r e a temperature o f 750' C (1,382' F ) f o r 99.9 percent des t ruc t i on o f benzene.
r o u t i n g the waste gas stream t o a waste heat b o i l e r .
1977, t h e average benzene removal e f f i c i e n c y was c a l c u l a t e d t o be 99 percent 29 w i t h benzene o u t l e t concentrat ions ranging from 6.0 ppmv t o 9.0 ppmv.
Although the opera t ing temperature i s n o t repor ted, i t i s probably near
2,000' F (1,090' C). was est imated t o range between 95.8 percent and 98.5 percent , w i t h benzene
o u t l e t concentrat ions ranging from 8.5 ppmv t o 13 ppmv. 30 Fur ther , i t was
s ta ted ~~ t h a t ~~ 'I. . . the b o i l e r now operates somewhat below 2,000' F.Ia3O
Dur ing t h i s s e t o f t e s t s , t h e i n l e t b e n z e n e concen t ra t i ons w e r e T o t measured.
A waste heat b o i l e r , however, i s a v i a b l e o p t i o n on ly i f t h e f a c i l i t y can
economical ly use the a d d i t i o n a l steam generated.
A temperature o f 870' C (1,600' F) i s s p e c i f i e d t o ensure complete
combustion o f the waste gas. Whi le i t i s poss ib le t h a t g rea te r than 99
percent VOC removal can be obta ined a t lower temperatures, it cannot be
p red ic ted dependably.
var ious a i r p o l l u t i o n engineer ing manuals. 5'31 While the manuals do n o t
p rov ide data on combustion temperatures above 800' C (1,472' F), ex t rapo la -
t i o n of the data presented combined w i t h t h e s i m i l a r i n c i n e r a t i o n exper i - ence descr ibed above supports the p r o j e c t i o n o f g rea ter than 99 percent
removal a t 870' C (1,600' F) . The costs f o r systems o f t h i s type are
presented i n Chapter 5 f o r each maleic anhydride p l a n t .
27
Research data on a fume i n c i n e r a t o r a l s o i n d i c a t e h igh removal e f f i -
27
Recent l abo ra to ry s tud ies on thermal i n c i n e r a t i o n o f benzene a l s o show
One p l a n t c o n t r o l s t h e emissions from the product recovery absorber by I n t e s t s conducted i n
I n l a t e r t e s t s i n 1978, the benzene removal e f f i c i e n c y
~
The cond i t ions o f Table 2-4 are cons is ten t w i t h
I
2- 12
i
\ . ,
Based on both the data from the maleic anhydride facility with the boiler and the data discussed above on similar incinerator systems, removal efficiency of 99 percent for benzene at 870' C (1,600' F) is anticipated in a we1 :-$?signed and efficiently operated incinerator. data are summarized in Table 2-4.
760' C (1,400° F) with a residence time o f 0.7 second.32 destruction efficiency has been reported to be at least 93 percent, although the company has no data on benzene removal efficiency. EPA showed a mean benzene removal efficiency of 98.6 percent.33 Although the plant was operating at about 70 percent of capacity when sampling was conducted, the plant personnel did not think the lower production rate would seriously affect the validity of the results when applied at full capacity. Pertinent technical data are summarized in Table 2-5. This incinerator is also used to generate steam, with a steam production rate of about 7 kg/sec (15.4 I > / sec) during the testing.
with proper attention to maintenance and operating parameters.'* repairs are required, they can often be made quickly or postponed until the next plant shutdown.
onsite boiler in one facility; however, other maleic anhydride plants have high gas volumes that exceed the total air-firing needs of those plants' steam boilers. (As discussed earlier in this chapter and Chapter 1, these high values are required to maintain the percent by volume of benzene in the feedstock to 1.5 or less. with low benzene concentrations.) Consequently, most plants cannot handle the waste gases in onsite waste heat boilers because the exicting equipment is not designed for such high-volume, low-concentration gases.
reduce CO concentrations. At a temperature of 609' C (1,128' F ) , thermal incineration converts 90 percent of the CO to C02. 35 For example, at the higher temperatures of a plant with 99 percent benzene removal, 870' C (1,600' F), more than 99 percent of the CO is expected to be oxidized.
Pertinent technical
A second plant uses a thermal incinerator on this stream operating at Total hydrocarbon
Tests conducted by
34
Generally, an incinerator can operate at least 95 percent of the time Even if
As discussed previously, the process waste gases are destroyed in an
This leads to large volumes of waste gases
2
In addition to controlling VOC emissions, thermal incineratiun will
2-13
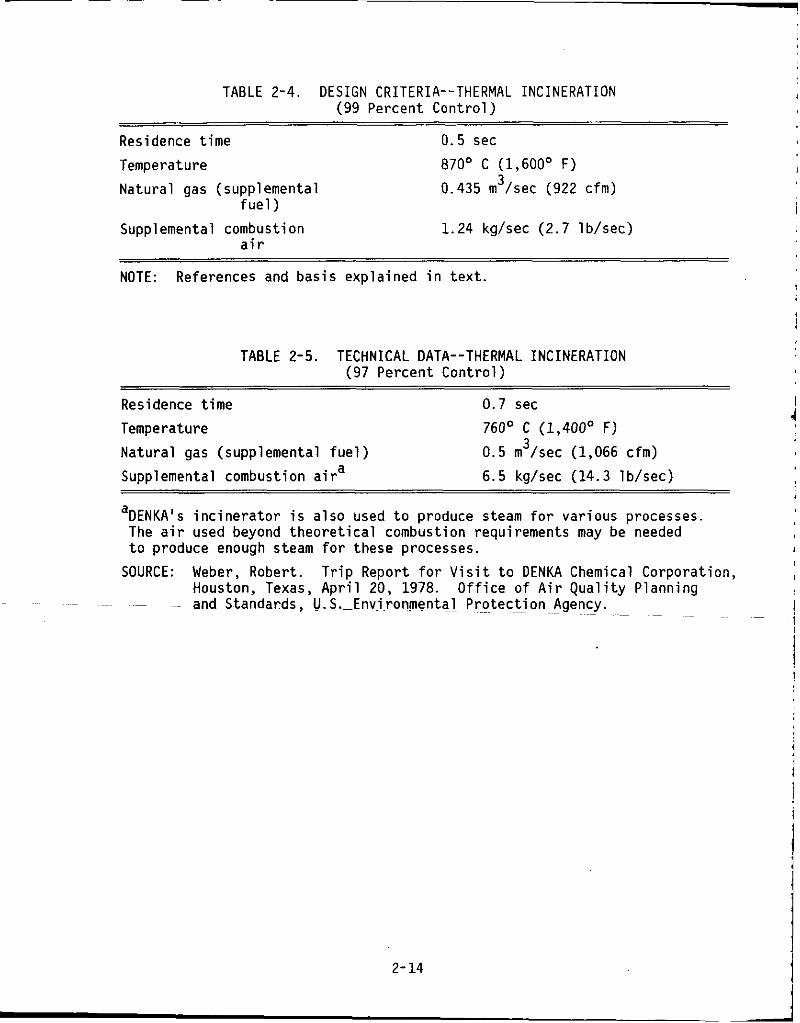
TABLE 2-4. DESIGN CRITERIA--THERMAL INCINERATION (99 Percent Contro l )
Residence t ime
Temperature
Natura l gas (supplemental
Supplemental combustion
f u e l )
a i r
0.5 sec
870' C (1,600' F )
0.435 m3/sec (922 cfm)
1.24 kg/sec (2.7 lb/sec)
NOTE: References and bas i s expla ined i n t e x t .
TABLE 2-5. TECHNICAL DATA--THERMAL INCINERATION (97 Percent Con t ro l )
Residence t ime 0.7 sec
Temperature 760' C (1,400' F) Natura l gas (supplemental f u e l ) 0.5 m3/sec (1,066 cfm)
Supplemental combustion a i r a 6.5 kg/sec (14.3 lb/sec)
DENKA's i n c i n e r a t o r i s a l s o used t o produce steam f o r var ious processes. The a i r used beyond t h e o r e t i c a l combustion requirements may be needed t o produce enough steam f o r these processes.
a
SOURCE: Weber, Robert. T r i p Report f o r V i s i t t o DENKA Chemical Corporat ion, Houston, Texas, A p r i l 20, 1978. O f f i c e o f A i r Q u a l i t y Planning
~~ ~~ ~~ ~
~~ - and Standards, -U. S.--Envi~ronme~ntal ~~~~ P r o t e c t i o n ~~~ ~~ ~~~ Agency. ~ ~~
2- 14
2.2.3 Catalytic Incineration
percent and carbon monoxide removal of greater than 95 percent, with a catalytic incinerator on the absorber offgas.13 catalytic incinerator with a nominal capacity of 1.4 m /sec (3,000 scfm) of maleic anhydride exhaust gases, benzene control was about 98.7 percent, and carbon monoxide control was about 99.3 percent.36 on approximately 300 hours o f operating time
One maleic anhydride producer reports VOC removal of at least 85
In tests run on a pilot 3
These tests were based
2.3 1.
2.
3.
4.
5.
6.
7.
8.
9.
REFERENCES U.S. Environmental Protection Agency. Control Techniques for Volatile Organic Emissions from Stationary Sources. NTIS. Springfield, Va. EPA-450/2-78-022. May 1978.
Letter from Pierle, M. A., Monsanto Chemical Intermediates Co., to Goodwin, D. R., Office of Air Quality Planning Standards, U.S. Envir- onmental Protection Agency. September 19, 1978.
Wagner, N. J . Introduction to Vapor Phase Adsorption Using Granular Activated Carbon. November, 1977.
Hughes, T. W . , et al. Source Assessment: tion from Industrial Surface Coating Operations. U.S. Environmental Protection Agency. Research Triangle Park, N.C. EPA-650/2-75-019a. 1975.
MSA Research Corp. Hydrocarbon Pollutants Systems Study, Vol. L., Stationary Sources, Effects, and Control. U. S. Environmental Protec- tion Agency. Research Triangle Park, N.C. Publication Number APTID- 1499. October 1972.
U.S. Environmental Protection Agency. Air Pollution Engineering Manual, Stcond Edition, Danielson, J. A. (ed.). Research Triangle Park, N.C. Publication Number AP-40. May 1973.
Lawson, J . F. Emission Control Options for the Synthetic Organic Chemicals Manufacturing Industry Maleic Anhydride--Product Report. Hydroscience, Inc. (Prepared for Office of Air Quality Planning and Standards, U. S. Environmental Protection Agency. Research Triangle Park, N. C. ) EPA Contract Number 68-02-2577. March 1978.
Lewis, W. A., Jr., et. al. Source Assessment: Maleic Anhydride Manufacture. Monsanto Research Corp. EPA Contract Number 68-02-1874. August 1978.
Letter from Parmale, C. S., Hydroscience, Inc., to Evans, L. B . , U.S. Environmental Protection Agency. May 4, 1978.
Calgon Activated Carbon Division, Calgon Corp.
Prioritization of Air Pollu-
2-15
10.
11.
12.
13.
14.
15.
16.
17.
18.
19.
20.
21.
22.
23.
Twaddle, W . , Charles Olson, and Karen L. Kramer. e r a t i o n o f Organic Emissions Saves Amoco $970,00O/yr i n Fuel Costs. Chemical Processing. January 1978.
Report from Felder, R. M., Nor th Caro l i na S ta te U n i v e r s i t y , t o Warren, J. L., Research T r i a n g l e I n s t . January 2, 1979.
Telecon. Weber, Robert, O f f i c e o f A i r Q u a l i t y Planning and Standards, U.S. Environmental P r o t e c t i o n Agency, w i t h K i r k land , John, H i r t Combus- t i o n Engineers. November 28, 1978.
Heat Recovery I n c i n -
Mackay, J. S. Testimony by Uni ted States Steel Corporat ion on a Proposed Standard by the U. S. Environmental P r o t e c t i o n Agency on Benzene Emissions From Maleic Anhydride Plants. Nat ional A i r P o l l u t i o n Control Techniques Advisory Committee. Alexan- d r i a . August 22-23, 1978.)
L e t t e r from Madden, G . I., E. 1. DuPont de Nemours & Co., t o Weber, R. C. , O f f i c e o f A i r Q u a l i t y Planning and Standards, U.S. Environ- mental P r o t e c t i o n Agency. August 29, 1978.
Telecon. U.S. Environmental P r o t e c t i o n Agency, w i t h P i e r l e , Michael , Monsanto Chemical Intermediates Co. January 18, 1979.
Telecon. Warren, J. L., Research T r i a n g l e I n s t i t u t e , w i t h Brennan, H . , Amoco Chemical Corp. November 16, 1978.
Lawson, J. F. T r i p Report f o r V i s i t t o Reichhold Chemicals, I nc . , Morr is , I l l i n o i s , J u l y 28, 1977. Hydroscience, Inc. EPA Contract Number 68-02-2577.
Let ter - f rom Parmale, C. S.,-Hydroscience, Inc. , t o Henry, A.-L., Reichhold Chemicals, I nc . May 3, 1978.
(Presented t o t h e
Weber, Robert, O f f i c e o f A i r Q u a l i t y Planning and Standards,
Smisck, M., and Cerney, S. A c t i v e Carbon. E l s e v i e r Pub l i sh ing Co., 1970. p. 202.
L e t t e r from White, R. E., Hydroscience, Inc. , t o P a t r i c k , 0. R., O f f i c e o f A i r Q u a l i t y Planning and Standards, U.S. Environmental P r o t e c t i o n Agency. A p r i l 13, 1978.
Rohm and Haas. Ambersorb Carbonaceous Resins ( techn ica l b u l l e t i n ) August 1977.
Ray Solv, I nc . Product Brochure. Linden, N. J. October 1976.
Clayton Environmental Consultants, I nc . , Emission Tes t i ng a t a Maleic Anhydride Manufactur ing Plant--Reichhold Chemical, I nc . , Morr is , I l l i n o i s . EPA Contract Number 68-02-2817. A p r i l 1978.
2- 16
J
i
'> I
24.
25.
26.
27.
28.
29.
30.
31.
32.
33.
34.
35.
36.
Weber, R. C. E l izabeth, New Jersey, Ju l y 5, 1978. and Standards, U. S. Environmental P r o t e c t i o n Agency.
Rolke, R. W . , e t a l . 0; f ice o f A i r Programs, U.S. Environmental P r o t e c t i o n Agency. EPA-R2-72-062. August 1972.
I n d u s t r i a l Gas Cleaning I n s t i t u t e . Af terburners. ards, U . S . Environmental P r o t e c t i o n Agency.) EPA Contract Number 68-02-1473. August 1977.
Memo from Seeman, W. R. , Hydroscience, I nc . , t o White, R. E . , Hydro- science, I nc . May 4, 1978.
Lee, K . , H. J. Jahnes, and 0. C. Macauley. Thermal Ox ida t i on K i n e t i c s o f Selected Organic Compounds. Union Carbide Corp. (Presented a t t h e 7 1 s t Annual Meeting o f t he A i r P o l l u t i o n Contro l Associat ion. Houston. June 25-30, 1978.)
L e t t e r from Lawrence, A. W . , Koppers Co., Inc. , t o Goodwin, 0. R., O f f i c e o f A i r Q u a l i t y Planning and Standards, U.S. Environmental P r o t e c t i o n Agency. February 28, 1978.
L e t t e r from Lawrence, A. W., Koppers Co., I nc . , t o Goodwin, D. R . , O f f i c e o f A i r Q u a l i t y Planning and Standards, U.S. Environmental P r o t e c t i o n Agency. January 17, 1979.
U . S . Department o f Heal th, Education, and Welfare. A i r P o l l u t i o n Engineer ing Manual. 1967.
Pruessner, R. D . , ai. Broz, L. D. Hydrocarbon Emission Reduction Systems. Chemical Ens l e e r i n g Progress. 2 (8 ) :69 -73 . August 1977.
Midwest Research I n s t . P l a n t a t t he DENKA Chemical Corporat ion, Houston, Texas. EPA Contract Number 68-02-2814.
Weber, Robert. T r i p Report f o r V i s i t t o DENKA Chemical Corp., Hou: '~n, Texas, A p r i l 20, 1978. O f f i c e o f A i r Q u a l i t y Planning and Standari ,, U. S. Environmental P r o t e c t i o n Agency.
Ann Arbor Science Publ ishers, I nc . P o l l u t i o n Engineer ing P r a c t i c e Handbook, Cheremisinoff , P. N . , and R. A. Young (ed.). 1975. p. 262-264.
L e t t e r from Lawrence, A. W . , Koppers Co., I n c . , t o Goodwin, 0. R. , O f f i c e o f A i r Q u a l i t y Planning and Standards, U.S. Environmental P r o t e c t i o n Agency. October 31, 1978.
T r i p Report f o r V i s i t t o Reichhold Chemicals, I nc . , O f f i c e o f A i r Q u a l i t y Planning
A f te rbu rne r Systems Study, She l l Development co.
Study o f Heat Recovery Systems f o r (Prepared f o r O f f i c e o f A i r Q u a l i t y Planning and Stand-
S ta t i ona ry Source Tes t i ng o f a Maleic Anhydride
2-17
3. REGULATORY OPTIONS
This chapter describes three regulatory options for two emission the product recovery
The same control points in maleic anhydride production facilities: absorber vent, and the refining vacuum system vent. device can be used to reduce emissions from both sources.
For existing maleic anhydride production facilities, two control levels are considered viable alternatives for a standard based on best available technology (considering environmental, energy, and economic impacts). are:
These options, and examples of applicable control techniques,
Benzene control efficiency of 97 percent, which can be ach.-.sd by carbon adsorption or thermal incineration; and Benzene control efficiency of 99 percent, which can be achieved by either thermal incineration or carbon adsorption.
The control devices; i.e., incinerators and carbon adsorbers, can be designed and operated at various levels of control efficiency. The benzene control efficiency of 97 percent was chosen to represent universally appli- cable control already demonstrated on a maleic anhydride facility. tests conducted at this facility indicated a 98-percent removal efficiency, they were conducted at a production rate of oniy 70 percent of capacity. Therefore, because it is uncertain whether the same control efficiency would have been obtained if the plant were operating at 100 percent of capacity, 97 percent benzene removal was selected as the basis for one regulatory option. The 99-percent removal efficiency is based on tech- nology transfer, as described i n Chapter 2.
ity of converting existing benzene-based plants to facilities using n-butane a5 thc feedstock. Little information is available on what would be required to convert each existing benzene-based plant to an n-butane-based plant, or what the consequences of such a conversion would be.
Although
As discussed in Chapter 1, uncertainty continues regarding the viabil-
Based on the limited
3-1
i n fo rma t ion a v a i l a b l e , i t appears t h a t cons iderable e f f o r t cont inues t o be
d i r e c t e d towards developing n-butane technology, p a r t i c u l a r l y t h e c a t a l y s t .
Only t h e e x i s t i n g Amoco p l a n t was o r i g i n a l l y designed t o use n-butane as a
feedstock. Problems associated w i t h conver t i ng e x i s t i n g p l a n t s t o n-butane
inc lude:
,
I
1 i l
P o t e n t i a l l y s i g n i f i c a n t reduc t ions i n male ic anhydride produc t ion when c u r r e n t n-butane c a t a l y s t technology i s combined w i t h equip- ment designed f o r benzene as t h e feedstock, and
Unsa t i s fac to ry opera t ion r e s u l t i n g from equipment changes needed i n t h e r e f i n i n g system.
e
1
Because o f u n c e r t a i n t i e s concerning t h e techn ica l f e a s i b i l i t y o f
conve r t i ng each e x i s t i n g source t o n-butane and t h e impacts o f such conver-
s ion, t h i s approach i s n o t considered a v i a b l e r e g u l a t o r y o p t i o n f o r e x i s t - i i n g sources based on BAT.
r e g u l a t o r y o p t i o n f o r new sources. o n l y 56 percent o f capac i ty i n 1978, few new sources are expected t o be
b u i l t u n t i l t h e mid-1980's. the n-butane process. Furthermore, a new p l a n t cou ld be designed t o use
n-butane and would the re fo re no t encounter the p o t e n t i a l problems associated
w i t h conversion. I n f a c t , one company has r e c e n t l y announced the construc-
t i o n o f a new 45,400-Mg/yr (50,000 tons /y r ) maleic anhydride p l a n t based on
t h e i r p r o p r i e t a r y n-butane technology, which iC scheduled-for complet ion i n
e a r l y 1983.
v i a b l e regu la to ry opt ions t h a t cou ld serve as the bas is f o r a standard f o r
The use of n-butane as a feedstock, however, i s considered a v i a b l e
Because the i n d u s t r y was opera t ing a t
This a l lows t ime f o r cont inued development o f
~ ~
~
I n summary, on ly two o f the th ree opt ions o u t l i n e d above were considered
e x i s t i n g sources based on BAT.
Opt ion 1, 97 percent benzene c o n t r o l , and Opt ion 2 , 99 percent benzene
c o n t r o l .
emissions (100 percent c o n t r o l ) i s considered a v i a b l e o p t i o n as the bas is
f o r BAT.
beyond BAT f o r e x i s t i n g sources.
these a l t e r n a t i v e s f o r e x i s t i n g and new sources are presented i n Chapter 4
and i n the economic impact sec t i on o f Chapter 5.
These two regu la to ry op t ions are designated:
For new sources, a r e g u l a t o r y o p t i o n o f no de tec tab le benzene
One hundred percent c o n t r o l was a l so considered as an o p t i o n
The environmental and energy impacts o f
3- 2
4. ENVIRONMENTAL AND ENERGY IMPACT
t i
I, e
The environmental and energy impacts o f each regu la to ry o p t i o n pre- sented i n Chapter 3 a re discussed i n t h i s chapter. Both b e n e f i c i a l and
adverse environmental impacts are assessed. The two regu la to ry op t ions considered f o r e x i s t i n g p l a n t s are:
A removal e f f i c i e n c y f o r benzene o f 97 percent based on carbon adsorpt ion o r thermal i n c i n e r a t i o n , and A removal e f f i c i e n c y f o r benzene o f 99 percent based on carbon adsorp t ion o r thermal i n c i n e r a t i o n .
C a t a l y t i c i n c i n e r a t i o n i s no t assessed as a c o n t r o l technique a t t h i s
t ime because c o n t r o l e f f i c i e n c i e s i n t h e 97-percent t o 99-percent range have n o t been demonstrated on a commercial scale. However, i f these e f f i -
c ienc ies cou ld be achieved, c a t a l y t i c i n c i n e r a t i o n would be a des i rab le
c o n t r o l technique because i t would: - Operate w i t h e s s e n t i a l l y no f u e l consumption,
Produce no secondary emissions,
Provide f o r changing c a t a l y s t i f requ i red by f u r t h e r regu la t ions , Oxid ize CO t o C02, and
Probably have lower c a p i t a l costs . 1
The a d d i t i o n a l r e g u l a t o r y o p t i o n f o r new p lan ts o f e l i m i n a t i o n o f
Both pr imary and secondary impacts o f these r e g u l a t o r y
benzene by s u b s t i t u t i n g n-butane, o r s i m i l a r m a t e r i a l , as t h e feedstock i s
a l so assessed.
opt ions are discussed i n t h e next sec t ions .
4 . 1 A I R POLLUTION IMPACT Th is sec t i on addresses bo th the p o s i t i v e and negat ive e f f e c t s on a i r
p o l l u t i o n expected t o r e s u l t from the a p p l i c a t i o n o f the r e g u l a t o r y opt ions.
The emission r a t e s from a model p l a n t as descr ibed i n Chapter 1 are present-
ed i n Table 4 -1 f o r t h e f o l l o w i n g cases:
4-1
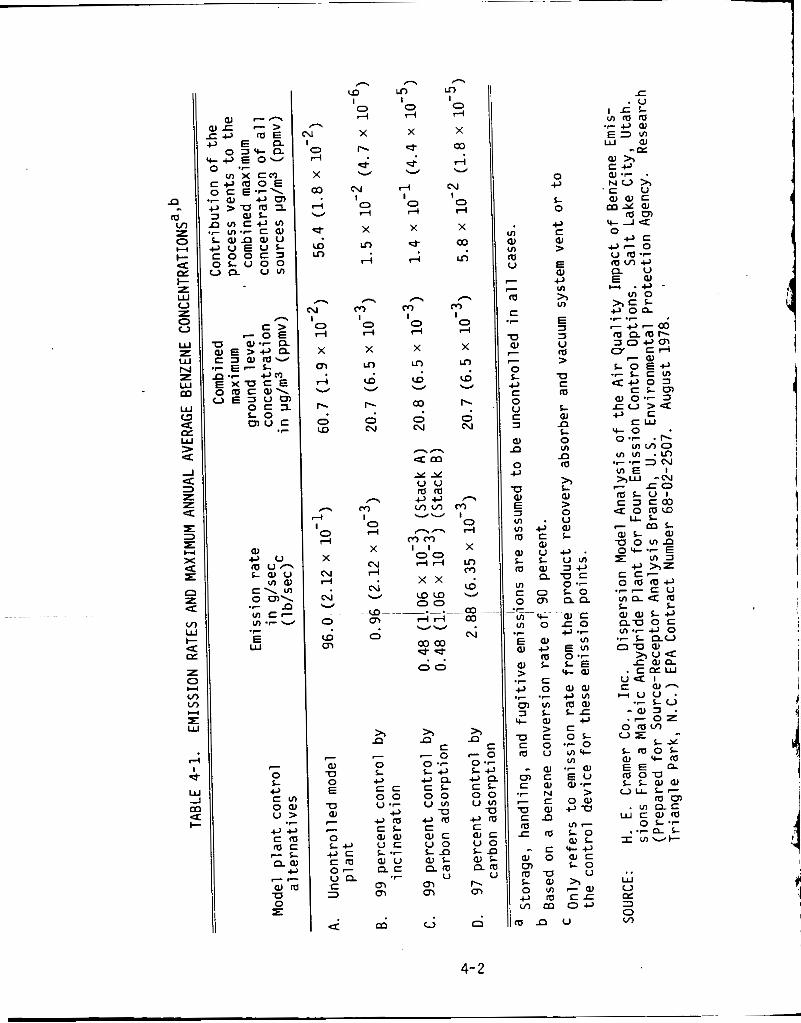
n m "
v) z
l- E
7
0 L +J c u u : c,+ c n m c 7 s
+ w o U 0 r
o a .F
n a Cr
, .. 3 4
.(
0 -I
t D
d
n
- I
3 rl
X
m Fi v
b
0 W
h 4
0 d
X N rl
N
0
W
v
m
7
W U 0 E U w
0 L o +Jc e m 0- u a C 3
7
c
a
~
n 2, c - 0 0 .- L o e a C L 0 0 UVI u c w e u o La a l L 0.m
u P- m
e m
n
0 rl
X
P-
*
W I
v
N I 0 rl
X LD
rl
n
0 rl
X
LD
W
P-
0 N
m I
v
n W
I
~~
0 +J
w W > 0 U
U 2 5 V I G w m c L VI
01 w u o . L L urn m w a o
a u c VI 0 .- c 0 L O 0 U? CLQ
m e w c VI o r 0
.C 4 .r E O , VI w o E m m 0.7 0) L L E > Y - w .r c +J 0 w w .- .r 4 VI m V I m a l a L L T Y - w +J
> c U C O L c 0'-0 m u UIY- - 01 .-a m c E U c w a'- .r N > 7 c o w v 01 +Ju m r m L O
(UL - c Y-o w 0 w e
L O U m u L a % o U I - Q I
c, lv c s cn m o c r
.C-
VI
V I 7 e n
0 rl
X
N r(
N
W~
0
v
m
% n
~
LD I 0 rl
X
d
z rl I 0 rl
X
* Fi
- m I 0 d
X
m W
03
N
v
0
n LD I 0 r i
X
0)
Fi V
N 1 0 rl
X
03 In
h m I 0 d
X
LD
W
P-
O N
v
VI 0) VI
U m
7
7
m c
U w
0 L +J c 0 U c a w .n
.r
7 7
7
0 L o c c 0 0 u .r
+J c , m c L a l w U T L .r w u Q C
m m
.r
m
x x COW 00
drl
coo3 d *
00
VU
. .
h c
- 0 0 .- L+J o n C L 0 0 UVI U e m
c w c u o a l L a m
U 0, 0-l
n
Ln
V
0 rl
X
LD W
W
~ o 3
N
v
co
0 o L 0
+J c w > E w +J VI
3 5 3 U m > U c m L 01 L 0 VI
n
n m
d I lm n u
4- 2
A . Uncontrolled model plant,
C. 0. 97 percent control by carbon adsorption. Table 4-1 also includes the estimated maximum ambient ground level
i B. 99 percent control by thermal incineration, 1
99 percent control by carbon adsorption, and i
i I
. concentrations of benzene in the vicinity of the model facilities, determined by atmospheric dispersion modeling.2 This atmospheric dispersion model was originally run for 97 and 99.5 percent control levels. Thus, the data given for 99 percent control are revised from the original data in Refer- ence 2 to reflect a change in control level from 99.5 to 99 percent. This effectively doubles both the amount of benzene emitted and the level of ambient benzene concentrations. Table 4-2 shows the mean annual average
i 1, ) I I
!
I ground level benzene concentrations produced by the emissions from combined fugitive, storage, and process sources based on the atmospheric dispersion model .* by emissions from storage, fugitive, and process sources; it is based on the atmospheric dispersion model
Table 4-3 summarizes the mean annual benzene concentrations produced
2 with the following assumptions: - Storage tanks A and B are controlled to the 90-percent level.
Fugitive sources are controlled to the 90-percent level. Emissions from the product recovery scrubber, the incinerator vent, Vents A and B o f the adsorber system, and the adsorption system vent are assumed to remain the same with or without fugi- tive and storage controls. Percentage of total emissions is the percentage of the total emitted for that particular source, storage, fugitive, or process, and option combination.
*
This table shows the differences in ambient concentrations with and without fugitive and storage emissions control; fugitive and storage emissions control may be considered in the future.
The Industrial Source Complex (ISC) Dispersion Model was used to
The program was used to calculate the maximum annual evaluate the air quality impact of benzene emissions from the model maleic anhydride plant. average ground level benzene concentration resulting from each model plant control alternative, for both the combined emissions from all sources of benzene in the plant as well as the concentration from the product recovery absorber and the refining vacuum system vent (both uncontrolled and con- trolled). The program also This information is presented i n Table 4-1.
4-3
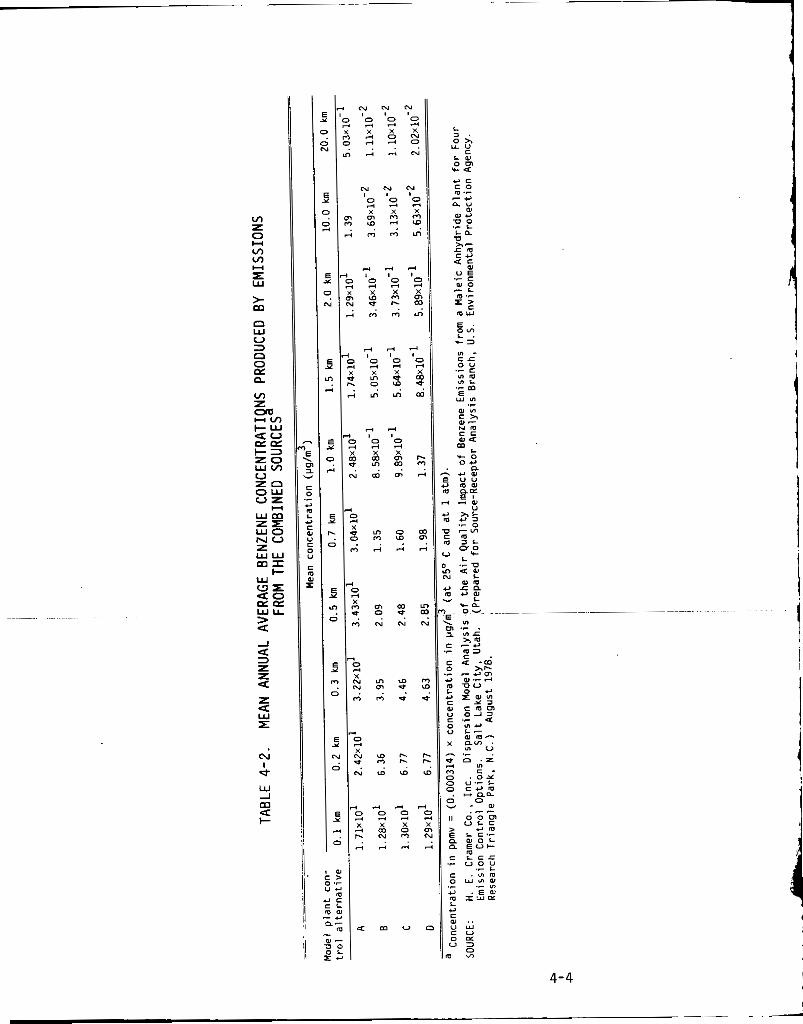
- - i
e 5 3
E 2.
r- c
E 2.
Y
c
E >
c c
t >
c
N N N
4-4
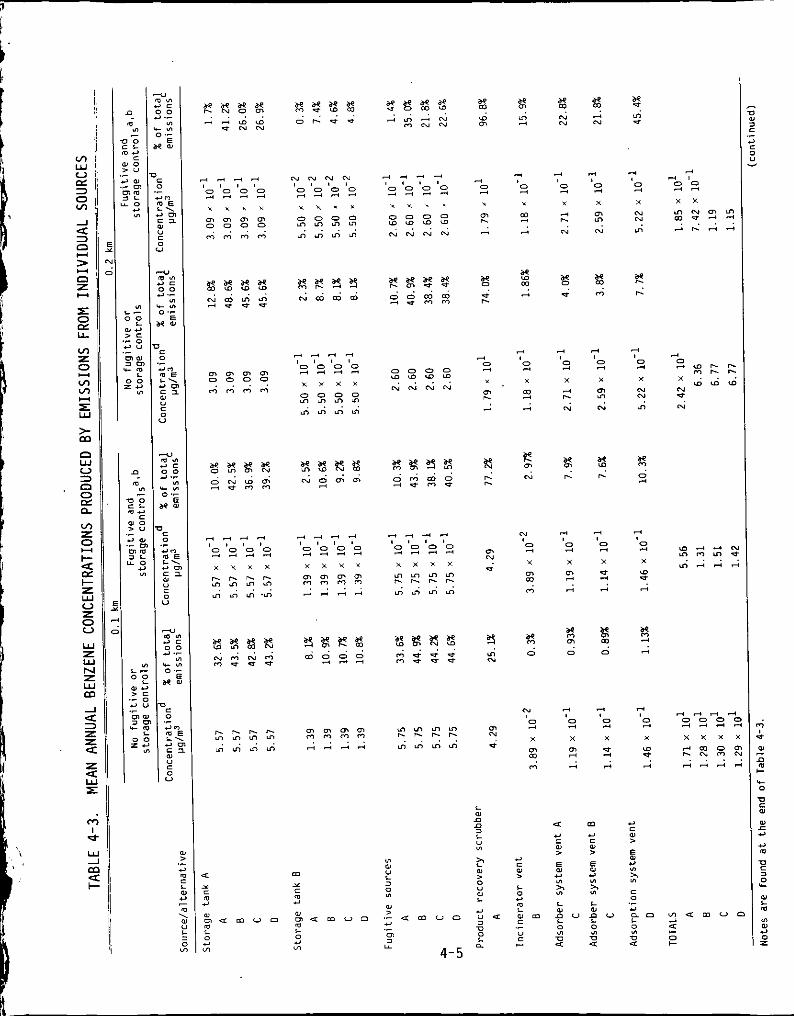
b
i
5 & u
3
2 x N N
m
3 - 4 3 , , , I o o o o 3 3 3
, x , x
c n m c n m 0 0 0 0 0 0 0 0 . . . .
3 0 3
cn r.
3
?2 m g ? 4 3 . Y o
3 3
0 0 4 3 3
x x x 3 0 1
3 N N
3
2 r . m
3
0 4
x N N
m
3 0 3
1 .
cn c
3
E r. r.
% 0 3
N 3 3
0 3 2 2 x x x
3
0 3
x 0 * 3
cn N
* 0 1 - 3 -
cn m 0 3 3
% % ?.$ m m 0 0 0
% 3 5
m N
3
3 3
0 0 3 3
x x x
N
0 3
4
2 x "7 -r 4
m N
u h r - h r . m m m m m m m m . . . . % % % % . . . .
3 - 3 3
m
c 0
1 a n
0 LA
u Q
.- w
c rn 2 Y
. 3 u m u o
4- 5
.-
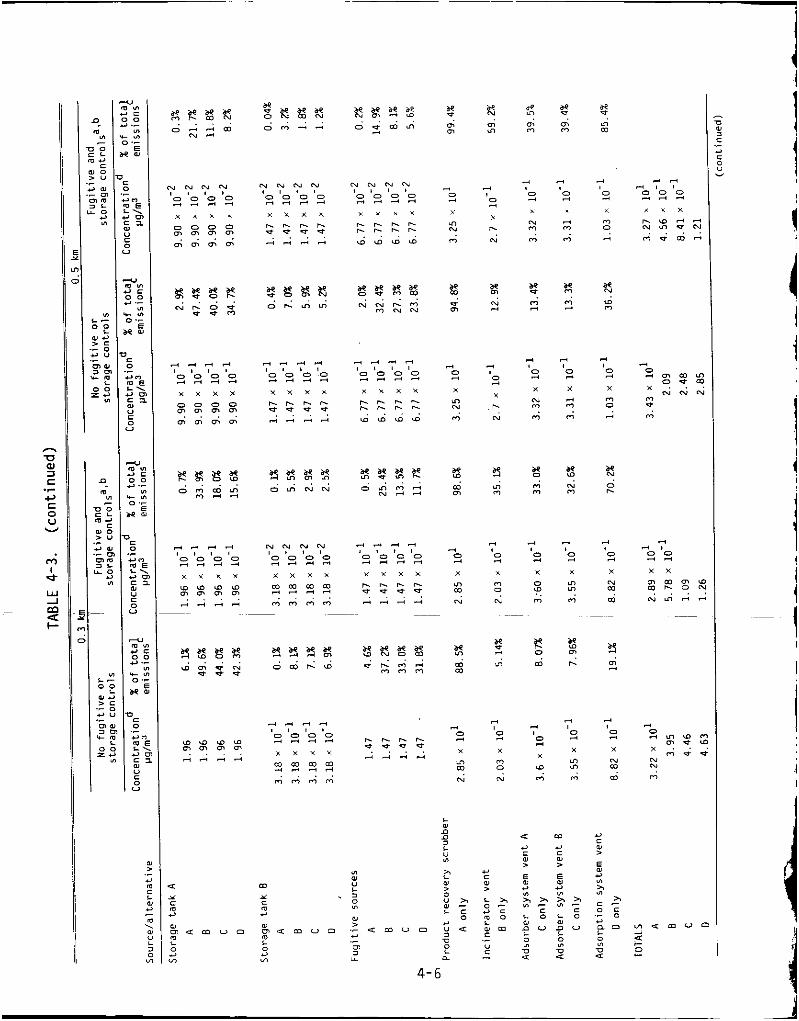
i
0 0 3
N 3 O m m N
0 N m o h
3 - 3 3
2 2 2 3
2 2 x x x x
N 3 o m m
N
0 N " l o
"l 0 3
IC I
3 3 - 4 3 3
0
3 * 0 " 0 3 0
* 3
x m o m
0 3
x x x x
m m m
N N m m
N 0 0
m
. . . . m o o r ?
D > c m c L a c m . 0 Y
3 0
.-
I I II m
a m i 0 c "7
m a m u o
6
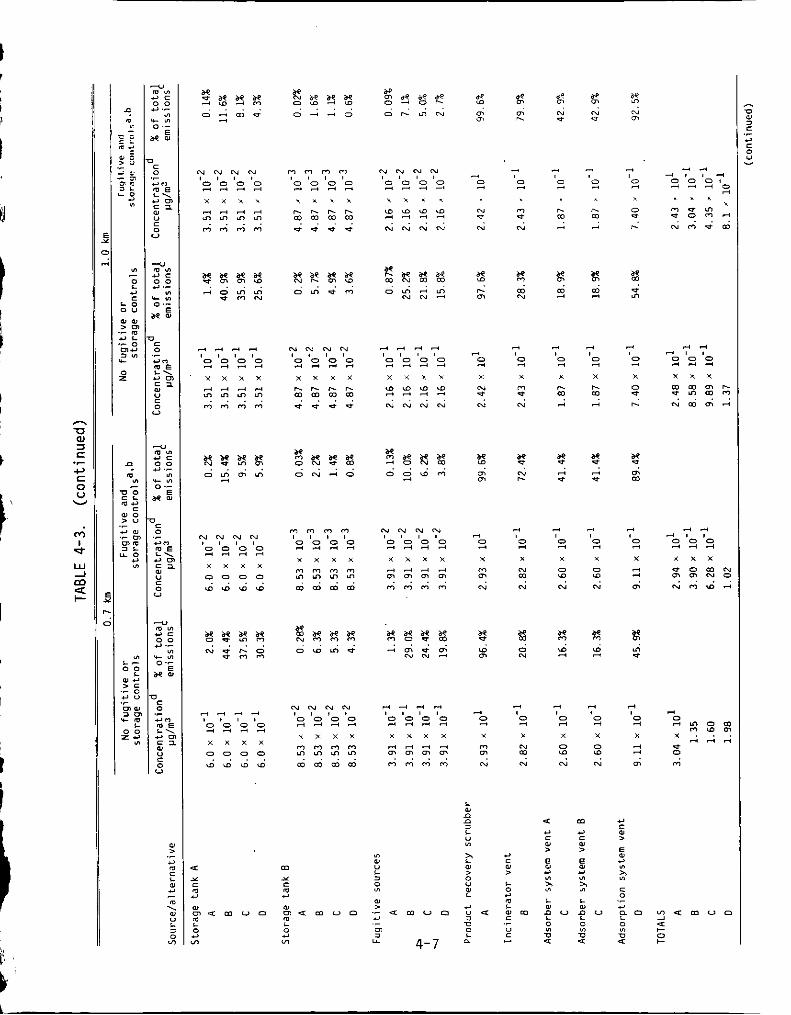
N N N N , , , I 0 0 0 0 3 - 4 3
x x x x n h h n m m m m < < < a :
4 - 3 3 , , I # 0 0 0 0 3 3 3 3
x x x x O W W W 3 3 - 4 3
" N n ;
3 3 3 , I
3
0 0 0 3 - 4 3 0 3
3 3 3
0 0 3
2 2 3 3
x x x x x x x x N e
m m m h
N m m A u Y ) m m n r - 0 e
h
m m N n; 3 3
0 w
2 3 5 % O N 2 0
N N N N , I , , 0 0 0 0 3 3 3 3
x x x x 3 3 3 3 m m m m m m n m . . . .
3 3 3 3 3 3 , 0 0 0 0 3 3 3
0 3
x x x x x x x 0 N 3 - 0 - N 0 0 m w
0
3
2 2 3 0 3 3
m m w o m m N N N h ; 0. N m m 3
. . . . 3
N N N N , , , I 0 0 0 0 3 3 3 3
x x x x m m m o m m m m m m m a j
3 3 3 3 3
0 e m o m m ~ m 0 3 0 0
3 3 0
3
2 - x x x x x X .
3 e 3 0
0 0 m m
m m N N N N m m
3 3 3 N m
c c 01 >
E 0 c m ::
c c c c w a
m
a m u m v 0 m 0 c YI
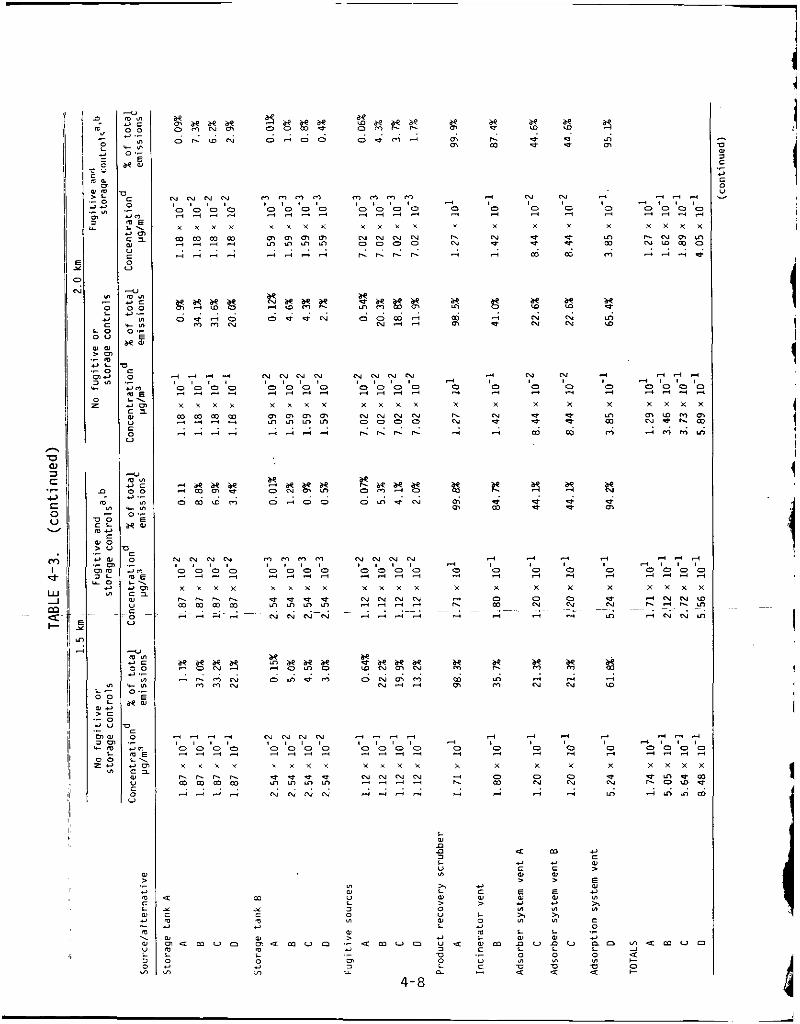
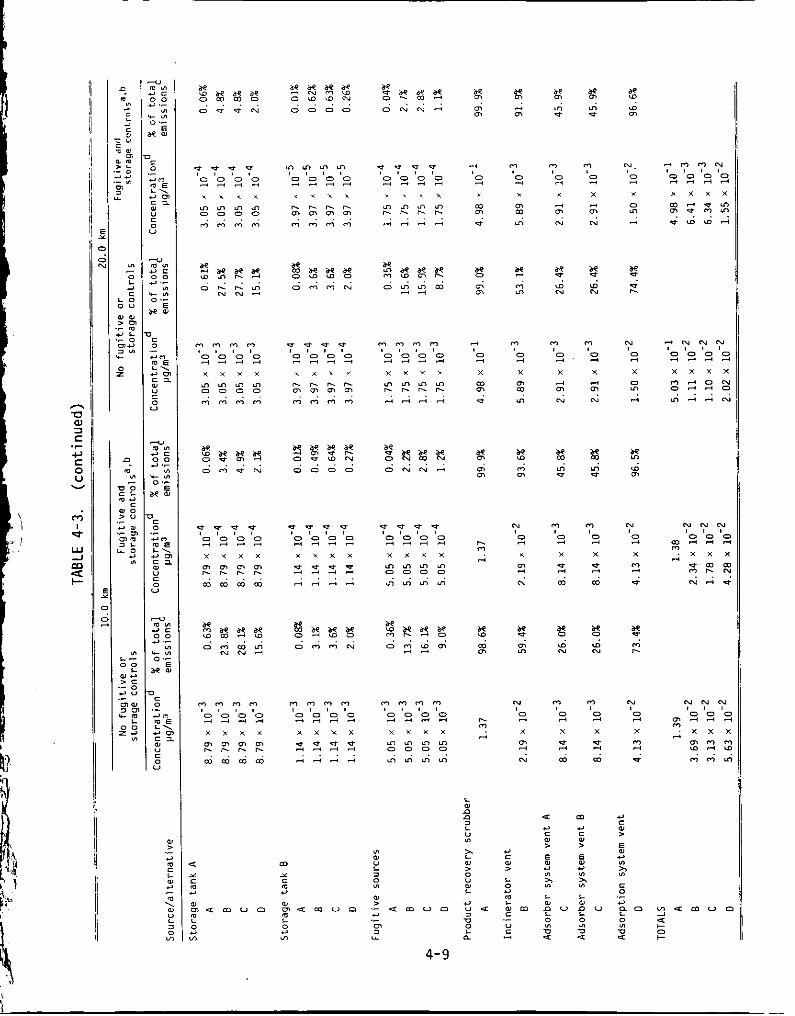
i
m m m m 0 0 0 0
o m o m . . . .
u u y : I , 0 0 0 0 3 3 3 3
x w x x m m m m h h h h
m m m m
m o o 0 I , , , 0 0 0 0 3 3 - 3
X A X X
m m m m h h h h
m m m m
a 1 L: m c w m < m u a m 0 c "l
m m m m , , , I 0 0 0 0 4 - 3 3
r .', , h h h h m m m m 0 o 0 m . . . .
x x x x u e u e - 3 3 3
3 3 3 3 . . . .
* w u u , , I # 0 0 0 . . . . m m m m h h h h
3 - 3 4
- , , 0 -
. . . .
S 3 m
0
0
x
m m "l
5 o m
o 0 3
x m m m
?2 0 m
N
2 x
m 3
n;
3 0; m
N
0 3
x m 3
N
e c 01 2-
L 0 c m L w m c Y c .-
I
t-? m *
0
0 4
3 m N
s .a N
o
0- Y
3 m N
%3 m u
m 0 3
x
:: m
?2 Ln N
0
0 3
x
z m
u m c c c c 0 1 0
?2 .n m
N.
0 3
x
0 "l
3
% x
N
0- x 0 "l
3
s .a m
N
0 3
x 0
a:
3 0 h
N
0 3
x 0 3
w
c c 01 >
&
2 c Ln
c 0 e a o 0 v)
'J u
.-
4-9
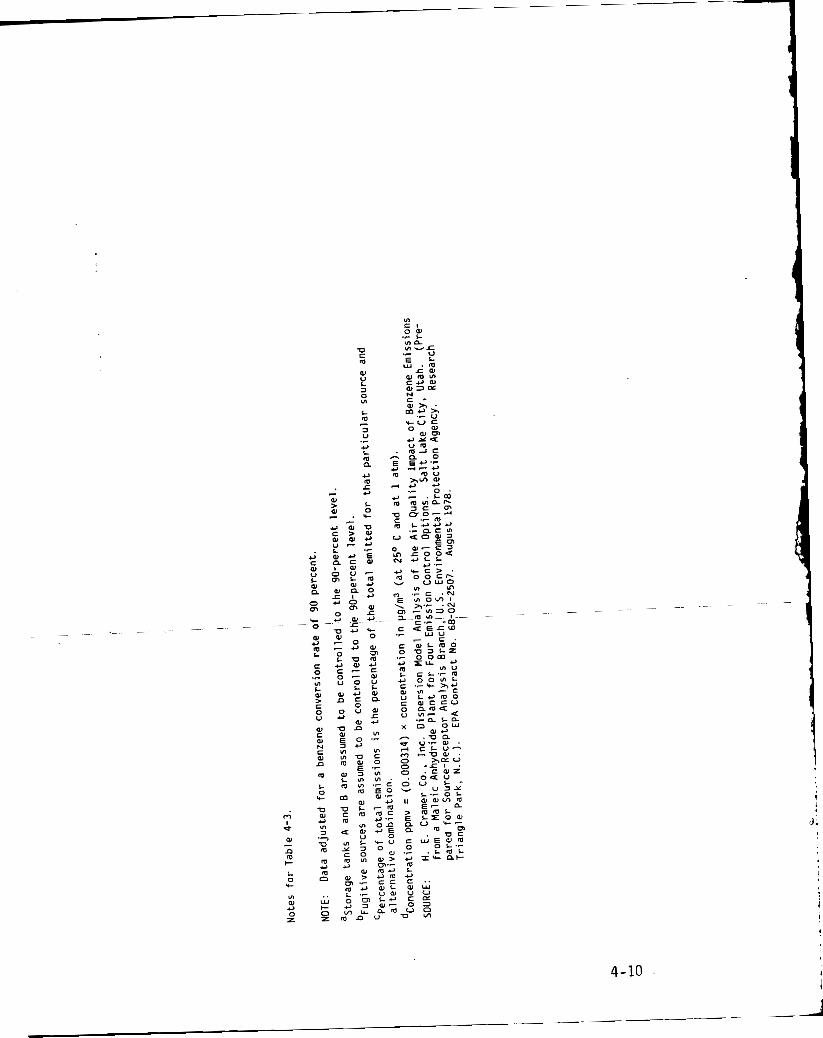
4-10
calculated the maximum benzene concentrations from the combined emissions for averaging times of 1 hour, 3 hours (uncontrolled case only), 8 hours, and 24 hours. These data are shown in Table 4-4.
The short-term program (ISCST) assessed the, averaging times of 1,3,8, and 24 hours. averages. corresponds to the Single-Source (CRSTER) Model, modified to include the effects of separation of individual sources and the effects of volume and area source emissions. The ISCLT program, which is a sector-averaged model similar to the Air Quality Display Model (AQDM) or the Climatological Dispersion Model (CDM), makes the same basic model assumptions as the ISCSl program. the joint frequency of occurrence of wind-speed and wind-direction cate- gories, classified according to the Pasquill stability categories) to calculate annual average concentrations. For the same source data and meteorological data base, ISCLT calculates annual average concentrations that are equivalent to those obtained from ISCST using a year of sequen- tial, hourly meteorological data.
22,700 Mg/yr. depicted in Figure 4-1. number in Table 4-5. were assumed to be uncontrolled, and estimated emission rates (at design capacity) were taken from Reference 3; these were 0.45 gm/sec (9.9 x
lb/sec), 0.05 gm/sed(l.l x
Ib/sec) for Tank A, Tank E , and fugitive emissions, respectively. These types of emissions will be covered in separate documents but were included here to illustrate the relative influence of the product recovery absorber and refining vacuum system vents on the ambient benzene concentration.
Two maleic anhydride plants are located in the Pittsburgh, Pennsylvania, area. Also, meteorological conditions that maximize ground level concentra- tions produced by emissions from stacks of the type studied here (neutral stability in combination with moderate-to-strong winds that persist within a narrow angular sector for a number of hours) are common in the Pittsburgh area. Surface-ai r and upper-air meteorological data from the Greater
The long-term program (ISCLT) was used to calculate annual For the model features used in this study, the ISCST program
The ISCLT program uses STAR summaries (statistical tabulation of
The dispersion estimates used a model plant with a capacity of The layout of the emission points was assumed to be as
The emission points are identified by name and Fugitive emissions and emissions from benzene storage
lb/sec), and 0.22 gm/sec (4.8 x
4- 11
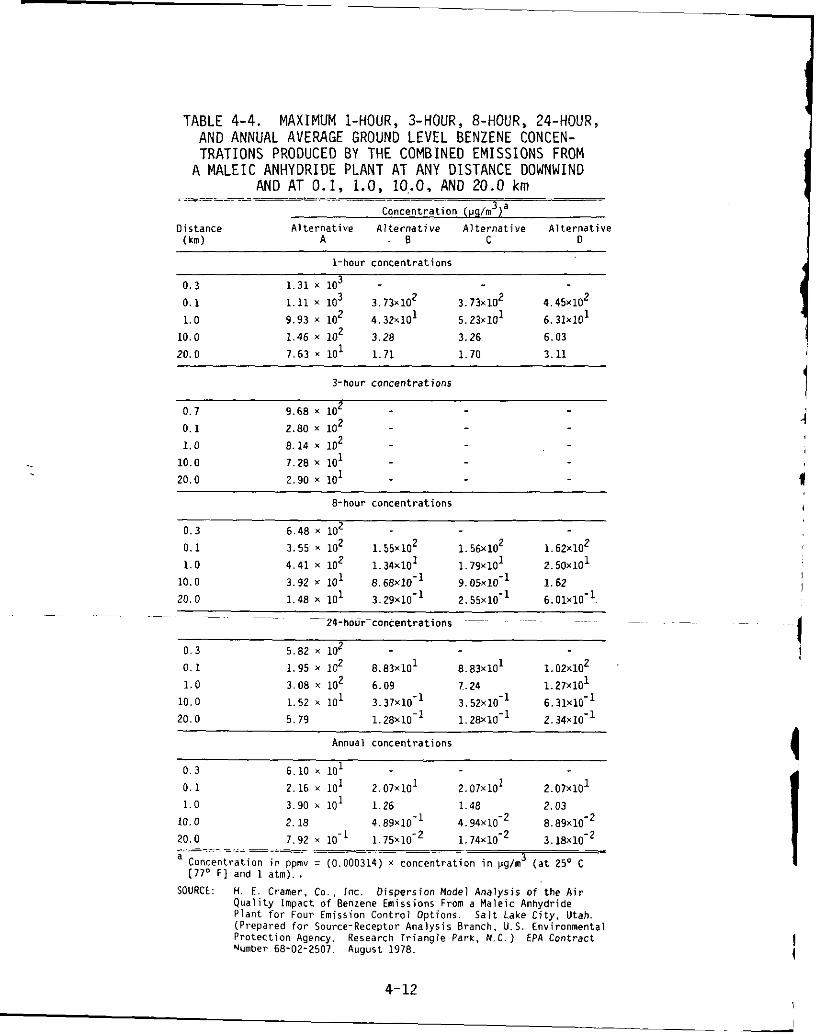
TABLE 4-4. MAXIMUM 1-HOUR, 3-HOUR, &HOUR, 24-HOUR, AND ANNUAL AVERAGE GROUND LEVEL BENZENE CONCEN- TRATIONS PRODUCED BY THE COMBINED EMISSIONS FROM
A M A L E I C ANHYDRIDE PLANT AT ANY DISTANCE DOWNWIND AND AT 0. I , 1.0, Iq.0, AND 20.0 km
.- __ __ __.- ~- __ __ Concentration (pg/m3)a
Oistance Alternative Alternative Alternative Alternative (km) A . B C 0
1-hour concentrations
0.3 1.31 103 0.1 1.11 x lo3 3.73~10' 3.73~10 2 4.45X10'
1 1.0 9.93 x 10' 4.32~10' 5 .23~10 6.31~10 1
10.0 1.46 x 10 3.28 3.26 6.03
20.0 7.63 x 10' 1.71 1.70 3.11
3-hour concentrations
0.7 9.68 x 10' -
1.0 8.14 x 10' 0 . 1 2.80 x 10² -
20.0 2.90 x 101 - 10.0 7.28 x 10' -
8-hour concentrations
0.3 6 . 4 8 x 10'
0.1 3.55 x 10' 1.55X1O2 1 .56~10 2 1 . 6 2 X 1 O 2
1.0 4.41 X 10' 1.34x10' 1.79~10 1 2.5Ox1O1 10.0 3.92 X 10' 8.68x10-' 9.05~10-1 1.62 20.0 1.48 x 10' 3.29x10-' 2 . 5 5 ~ 1 0 ~ ~ 6.01~10-~.
24-hourFconcentrationr ~~~ ~~~
~- ~~ ~ ~- -~ -
0.3 5.82 x 10' 0 . 1 1.95 x 10' 8.83~10' 8.83~10 1 1.02x10² 1.0 3.08 X 10' 6.09 7.. 24 1.27X1O1
10.0 1.52 k 10' 3.37XlO-1 3.52x10-' 6.31x10-' 20.0 5.79 1 . 2 8 ~ 1 0 - ~ 1.28x10⁻¹ 2 . 3 4 ~ 1 0 - ~
Annual concentrations ~~~
0.3 6.10 x 10' 0.1 2.16 x IO1 2 . 0 7 ~ 1 0 ~ 2 . 0 7 ~ 1 0 ~ 2 . 0 7 ~ 1 0 ~ 1.0 3.90 x 10' 1.26 1.48 2.03
10.0 2. 18 4.89X1OW1 4.94X10-' 8.89x10⁻² 20.0 7.92 x 10.' 1.75X10⁻² 1.74X10-' 3.18x10⁻²
a 3 Concentration in ppmv = (0.000314) Y concentration in pg/m [77O F l and 1 atm). .
_-=_=.i__=___=i_____ (at 25' C
SOURCE: ti. E. Cramer. C o . , Inc. Dispersion Model Analysis of the Air Quality Impact o f Benzene Emissions From a Maleic Anhydride Plant f o r F o u r Emission Control Options. Salt Lake City, Utah. (Prepared for Source-Receptor Analysis Branch. U. 5. Environmental Protection Agency. Research Triangle Park, N . C . ) E P A Contract Number 68-02-2507. August 1978.
4-12
i i
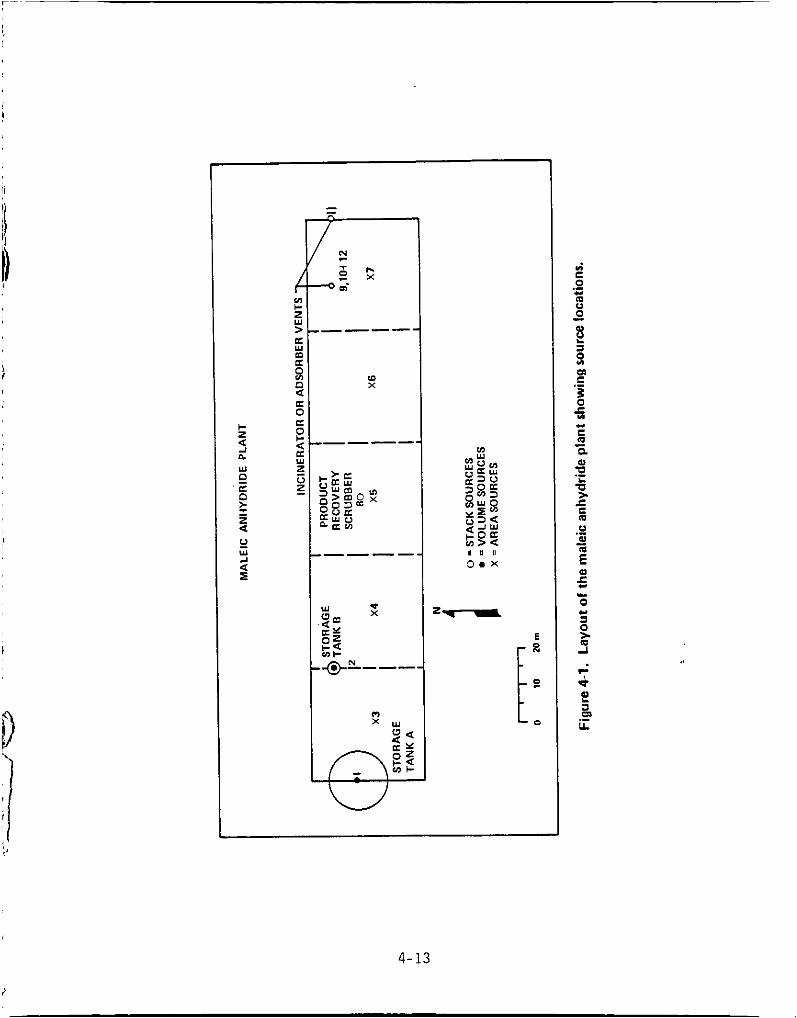
c L.7 c z W > _---
In X
4-13
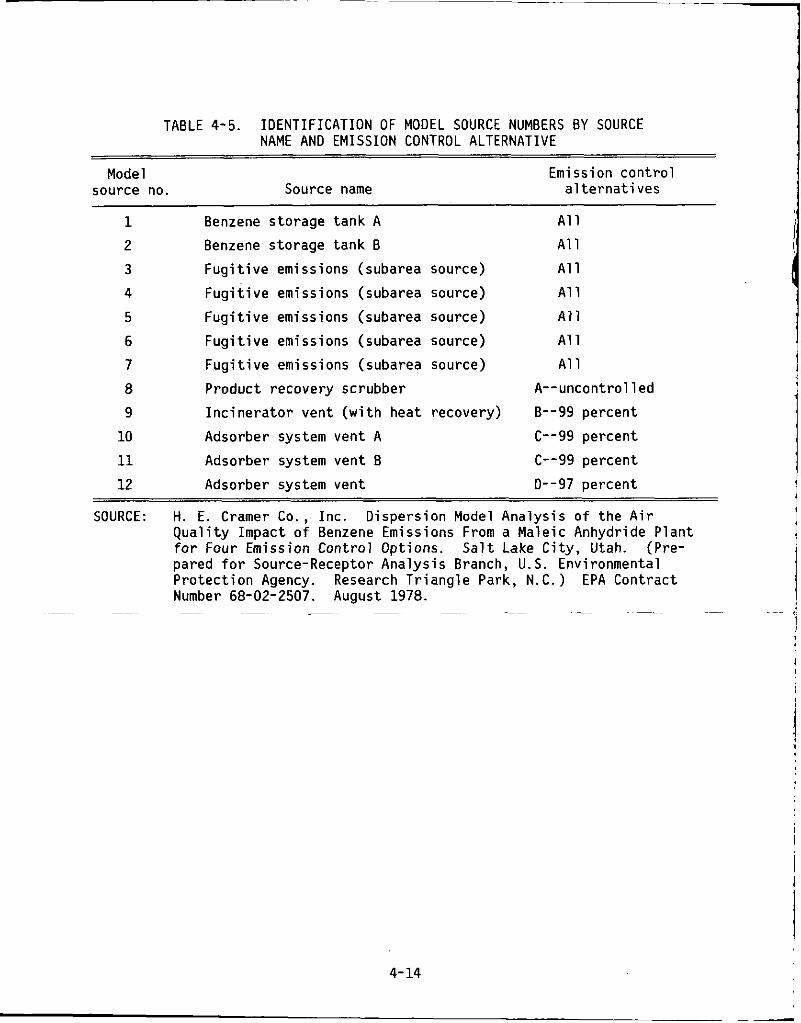
TABLE 4-5. IDENTIFICATION OF MODEL SOURCE NUMBERS BY SOURCE NAME AND EMISSION CONTROL ALTERNATIVE
Model Emission c o n t r o l source no. Source name a1 t e r n a t i v e s
1 Benzene storage tank A A1 1
2 Benzene storage tank B A1 1 3 F u g i t i v e emissions (subarea source) A1 1
4 F u g i t i v e emissions (subarea source) A1 1
5 F u g i t i v e emissions (subarea source) A1 1 6 F u g i t i v e emissions (subarea source) A1 1 7 F u g i t i v e emissions (subarea source) A1 1
8 Product recovery scrubber A--uncontro l led
9 I n c i n e r a t o r ven t ( w i t h heat recovery) B--99 percent
10 Adsorber system vent A C--99 percent
11 Adsorber system vent B C--99 percent
12 Adsorber system vent 0--97 percent
SOURCE: H. E. Cramer Co., I nc . D ispers ion Model Ana lys is o f the A i r Q u a l i t y Impact o f Benzene Emissions From a Male ic Anhydride P lan t f o r Four Emission Contro l Opt ions. S a l t Lake City, Utah. (Pre- pared f o r Source-Receptor Ana lys is Branch, U.S. Environmental P ro tec t i on Agency. Research T r i a n g l e Park, N .C . ) EPA Contract Number 68-02-2507. August 1978.
~~ ~~ ~ ~ ~ ~ ~ - ~ ~
4- 14
Pittsburgh Airport were used in the dispersion-model calculations for these reasons and because the data were readily available. plant was assumed to be located in the Pittsburgh urban area, and ISC Urban Mode 2 was used in the dispersion-model calculations to account for the effects of urban roughness elements and heat sources. Because of the high frequency of occurrence of west winds in the Pittsburgh area, an east-west orientation was assumed for the maleic anhydride plant (see figure 4-11.
The ISC Model contains numerous model options and features that are required to simulate the air quality impact of emissions from the wide variety of sources found in industrial source complexes. Because of the requisite complexity of the ISC Model, it is usually economically unfeas- ible to use the ISCST program to calculate hourly concentrations for a year of sequential, hourly meteorological data--the procedure generally followed with the Single-Source (CRSTER) Model. However, with knowledge of the critical meteorological conditions for emissions from maleic anhydride plants, it was possible to select ten 24-hour periods representative of "worst-case" dispersion conditions and to execute ISCST for these days only to obtain maximum 1-hour, 3-hour (Alternative A only), 8-hour, and 24-hour average benzene concentrations. speed to the scalar mean wind speed was computed for each day of 1964 from the Greater Pittsburgh Airport hourly surface observations. a value near unity. for days of persistent wind directions that are usually associated with maximum 8-hour and 24-hour average concentrations. days with ratio values near unity were examined to select 10 days with neutral and/or stable conditions and either persistent 1 ight-to-moderate winds ("worst-case" meteorological conditions for the storage tanks and fugitive emissions) or persistent moderate-to-strong winds ("worst-case" meteorological conditions for the stack emissions). Those selected were days 5, 10, 26, 112, 118, 122, 265, 316, 343, and 358. The principal meteorological input to the ISCLT program for the annual concentration calculations was the 1964 annual STAR summary for the Greater Pittsburgh Airport.
The objective of the dispersion study was to estimate maximum ground level benzene concentrations at or beyond the property boundaries and at downwind distances of 0.1, 1.0, 10.0, and 20.0 km (0.06, 0.62, 6.21, and 12.43 mi). Maximum ground level concentrations produced by fugitive and
The maleic anhydride
First, the ratio of the vector mean wind
This ratio has
The
4-15
storage tank emissions can be expected t o occur i n t h e immediate v i c i n i t y of t h e p l a n t p roduc t ion area. However, t h e d i spe rs ion c o e f f i c i e n t s used by
the I S C Model, t h e P a s q u i l l - G i f f o r d curves, beg in a t a downwind d is tance o f 100 m (109.4 yd). Consequently, t h e p r o p e r t y boundaries were assumed t o be
100 m (109.4 yd) from the edge o f the p l a n t p roduc t ion area, and receptors
were spaced a t 30-m (32.8-yd) i n t e r v a l s around t h e edge o f t h e p r o p e r t y
boundaries.
i n d i c a t e d t h a t t h e maximum ground l e v e l concentrat ions should occur w i t h i n
2 km o f t h e stacks.
from t h e boundaries, 0.1.. 0.2, 0.4, 0.6, 0.9, 1.4, 1.9, 9.9, and 19.9 km (0.06, 0.12, 0.25, 0.37, 0.56, 0.87, 1.18, 6.15, and 12.37 m i ) a long r a d i a l s
o r i g i n a t i n g a t t h e center o f Source 5 and passing through each o f t h e
receptors a t t h e p roper t y boundary. The r e s u l t s o f the d i spe rs ion ana lys i s a r e summarized i n Tables 4-1,
4-2, 4-3, and 4-4. The I S C Model c a l c u l a t i o n s f o r t h e uncon t ro l l ed case,
A l t e r n a t i v e A , i n d i c a t e t h a t emissions from t h e product recovery absorber
and r e f i n i n g vacuum system vent a re p r i n c i p a l l y responsib le f o r t h e maximum ground l e v e l benzene concentrat ions produced by the combined emissions from
t h e p l a n t .
recovery absorber emissions account f o r more than 85 percent o f t h e ca lcu-
l a t e d concentrat ions. A d d i t i o n a l l y , f o r some d is tances and averaging
t imes , T h e produc t recovery absorbTr accoii i i ts f o r more than 98-percent-of
the c a l c u l a t e d maximum concentrat ions. However, the produc t recovery
absorber o f A l t e r n a t i v e A does n o t necessa r i l y dominate t h e maximum con-
cen t ra t i ons a t t h e assumed boundaries o f t h e p l a n t p roper ty .
averaging t ime, meteoro log ica l cond i t i ons such as s t a b i l i t y and wind d i rec -
t i o n determine whether the f u g i t i v e and s torage tank emissions o r t h e
product recovery absorber emissions are p r i m a r i l y responsib le f o r t h e
magnitude and l o c a t i o n o f the maximum concent ra t ion a t t h e p roper t y boun- dar ies .
For A l t e r n a t i v e s E , C, and 0, the benzene emissions from the product
Pre l im inary c a l c u l a t i o n s f o r the buoyant s tack emissions
Therefore, a d d i t i o n a l receptors were p laced a t d istances
A t d is tances where maximum concentrat ions occur, t h e product
For a g iven
recovery absorber are reduced by 97 t o 99 percent . Wi th these reduced
emissions, the ISC Model c a l c u l a t i o n s show t h a t the f u g i t i v e and storage
the maximum ground l e v e l benzene concent ra t ions than i n A l t e r n a t i v e A.
1
tank emissions (which are n o t c o n t r o l l e d ) w i e l d a much grea ter i n f l u e n c e on
The I
4-16
I 2 ~-
maximum concentrations calculated for all averaging periods are located at the assumed boundaries of the plant property, and the fugitive and storage tank emissions are principally responsible for the maximum concentrations. Because the fugitive and storage tank emissions dominate the air quality near the plant for Alternatives B , C, and D, the effects on ambient air quality near the plant of different emission reductions are minimal without control of fugitive and storage emissions. from fugitive and storage emissions, however, Table 4-1 shows that the maximum concentration of benzene from the process vents after 99 percent control is less than 0.1 percent of the ambient concentration resulting from these sources when uncontrolled. When Alternative D is used (97 percent control by carbon adsorption), the resulting benzene concentration is about 0.1 percent of the concentration before control.
from application of the alternative control systems. Table 4-6 summarizes the reduction in benzene emissions for both a 97-percent and 99-percent control level on a plant-by-plant basis, using a benzene conversion rate of 90 percent. However, some adverse effects on air quality are usually associated with each control technique incorporated in the regulatory options. These adverse impacts are compared to the benefits for each technique in the next sections. 4.1.1 Carbon Adsorption (99 Percent Control of Benzene)
The carbon adsorption system described for this level of control in Chapter 2 will reduce benzene emissions from 1,540 Mg/yr (1,700 tons/yr) to 50 Mg/yr (55 tons/yr) for the model plant. about 1,450 Mg (1,600 tons) of benzene per year are recovered for recycling to the p r o c e ~ s . ~ The remaining benzene and the other VOC (-460 Mg/yr [-507 tons/yr]) are picked up in the scrubber or decanter water and are removed as effluent ~astewater.~ The amount of benzene sent to wastewater treat- ment is approximately 40 Mg/yr (44 tons/yr), or about 1.4 g/sec (3.1 x
1 b/sec).
waters as makeup wat,er for the absorbers. those from water of dehydration, water removed from scrubber solution, and the condensed vacuum jet ~ t r e a m . ~ tion units are recycled, some plants will have to discharge previously
Disregarding the contribution
Table 4-1 and Table 4-4 emphasize the positive impact on air quality
Of this emission reduction,
All plants should be able to recycle the benzene-containing waste- Wastewaters typically include
If wastewaters from the carbon adsorp-
4-17
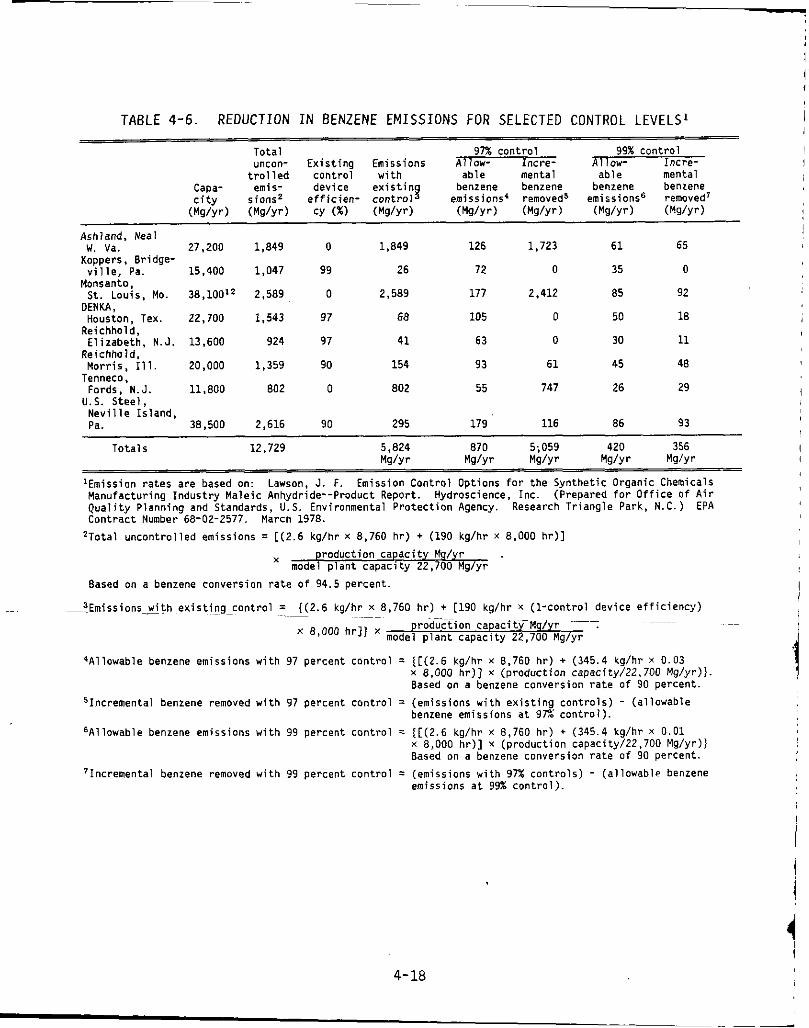
-
TABLE 4-6. REDUCTION IN BENZENE E M I S S I O N S FOR S E L E C T E D CONTROL LEVELS'
99% control Total 97% control uncon- Existing Emissions Allow- Incre- Allow- Incre-
trolled control with able mental able mental Capa- emis- device existing benzene benzene benzene benzene city sions2 efficien- control emissions' removed5 emissions6 removed' (Mg/yr) (Mg/yr) CY (%) (Mg/yr) (Mg/yr) (Mg/yr) (Mg/yr) ( M W r )
Ashland, Neal
Koppers, Bridge-
Monsanto.
DENKA,
Reichhold,
Reichhold.
Tenneco,
U . S . Steel,
w. va. 27,200 1,849 0 1,849 126 1,723 61 65
ville, Pa. 15,400 1,047 99 26 72 0 35 0
Houston, Tex. 22,700 1,543 97 68 105 0 50 18
Elizabeth, N.J. 13,600 924 97 41 63 0 30 11
Morris, Ill. 20,000 1,359 90 154 93 61 45 48
St. Louis, Mo. 38,100'2 2.589 0 2,589 177 2,412 85 92
Fords. N.J. 11,800 802 0 802 55 747 26 29
Neville Island. Pa. 38,500 2,616 90 295 179 116 86 93
Totals 12,729 5 ~ 824 870 5;059 420 356 M g h M d y r Mg/yr W y r Mg/yr
'Emission rates are based on: Lawson. J. F. Emission Control Options for the Synthetic Organic Chemicals Manufacturing Industry Maleic Anhydride--Product Report. Hydroscience, Inc. (Prepared for Office of Air Quality Planning and Standards, U . S . Environmental Protection Agency. Research Triangle Park, N.C.) EPA Contract Number 68-02-2577. March 1978. 2Total uncontrolled emissions = L(2.6 kg/hr x 8,760 hr) + (190 kg/hr x 8,000 hr)]
production capacity Mg/yr model plant capacity 22,700 Mg/yr
Based on a benzene conversion rate of 94.5 percent.
~~-p3Emissions--wjth existing-control = ((2.6 kg/hr x 8,760 hr) + [190 kg/hr x (1-control device efficiency)
x 8,000 h r l ~ x mode! plant capacPty 2:.7&Y~g/yr ~~
~ ~.~~ ~~~~.p- roduction ca acit-M / r ~~-7
qAllowable benzene emissions with 97 percent control = ([(2.6 kg/hr x 8,760 hr) + (345.4 kg/hr x 0.03 x 8,000 hr)] x (production capacity/22,700 Mg/yr)J Based on a benzene conversion rate of 90 percent.
benzene emissions at 9T% control). SIncremental benzene removed with 97 percent control = (emissions with existing controls) - (allowable
6Allowable benzene emissions with 99 percent control = ( [ ( 2 . 6 kg/hr x 8,760 hr) + (345.4 kg/hr x 0.01 x 8,000 hr)] x (production capacity/22.700 Mg/yr)l Based on a benzene conversion rate of 90 percent.
'Incremental benzene removed with 99 percent control = (emissions with 97% controls) - (allowable benzene emissions at 99% control).
4-18
I
I
recyc led wastewaters e i t h e r t o t h e p l a n t ' s wastewater t reatment p l a n t o r t o a munic ipa l wastewater t reatment p l a n t .
t reatment f a c i l i t i e s w i l l have lower benzene concentrat ions than the waste stream from the carbon adsorbers b u t w i l l con ta in a d d i t i o n a l organic com-
pounds; e.g., maleic acid.
f a c i l i t y , some v o l a t i l i z a t i o n o f benzene t o t h e atmosphere can occur. worst-case assumption i s t h a t a l l o f t h i s benzene i s emi t ted t o the atmos-
phere a t a constant r a t e o f 1.4 g/sec ( 3 . 1 x
roughly 3 percent of t h e benzene emission r a t e from t h e uncon t ro l l ed product recovery absorber of a model p l a n t , which was shown i n Table 4-1.
ac tua l q u a n t i t y o f benzene emi t ted has no t been determined because i t i s h i g h l y dependent upon the wastewater t reatment technique because benzene i s
biodegradable.6 waste i n c i n e r a t o r f o r t h e maleic anhydr ide produc t ion f a c i l i t i e s . 718 The
aqueous stream from the carbon adsorber system cou ld conceivably be combined w i t h t h e o the r l i q u i d wastes sent t o t h e i n c i n e r a t o r . Assuming a conserva-
t i v e benzene des t ruc t i on e f f i c i e n c y o f 90 percent i n t h i s type o f i nc ine ra - t o r , t h e benzene emissions f r o m t h i s source would be about 0.14 g/sec ( 3 . 1 x
product recovery absorber.
4 .1.2 Carbon Adsorpt ion (97 Percent Cont ro l o f Benzene)
The carbon adsorp t ion system descr ibed f o r t h i s l e v e l o f c o n t r o l w i l l reduce benzene emissions from 1,540 Mg/yr (1,700 tons/yr ) t o 100 Mg/yr
(110 tons/yr ) based on the model p l a n t .
Sect ion 4.1.1, some f r a c t i o n o f t h i s c o n t r o l l e d benzene i s p icked up i n the
decanter water and removed as e f f l u e n t wastewater.
t o t h e prev ious system, about 1,430 Mg (1,580 tons) o f benzene per year a re
recovered and recyc led t o the process.
tons /y r (-1.4 g/sec C3.1 x l b / s e c l ) o f benzene would be c a r r i e d i n the aqueous waste from t h e adsorber system.
Consis tent w i t h the assumptions i n Sect ion 4.1.1, a worst-case benzene
emission r a t e from t h i s source i s 1 .4 g/sec ( 3 . 1 x
than 3 percent o f the emissions from an uncon t ro l l ed product recovery
absorber. S i m i l a r l y , c o n t r o l i n a l i q u i d i n c i n e r a t o r would r e s u l t i n a
These wastewaters discharged t o
5
Depending upon t h e method o f wastewater t reatment p r a c t i c e d by the A
lb lsec) . Th is r a t e i s
The
Furthermore, a t l e a s t two f a c i l i t i e s employ an aqueous
lb/sec), o r l ess than 1 percent o f the emissions from an uncon t ro l l ed
L i ke the system discussed i n
I n a manner analogous
Therefore, about 40 Mg/yr o r 44
lb /sec) , o r l ess
4-19
benzene emission o f l ess than 0.14 g/sec (3 .1 X lb/sec). Recycle o f
t h e aqueous stream cou ld a l s o be prac t iced . 4.1.3 Thermal I n c i n e r a t i o n (99 Percent Cont ro l o f Benzene)
The i n c i n e r a t o r system descr ibed i n Chapter 2 reduces benzene emis-
s ions from 1,540 Mg/yr (1,700 tons/yr) t o 50 Mg/yr (55 tons/yr ) f o r t h e
model p lan t . No organics a r e recovered f o r recyc le . P o l l u t a n t s generated
by t h e combustion process, p a r t i c u l a r l y n i t r o g e n oxides (NOx), may have a negat ive impact on the environment. Compared w i t h i n d u s t r i a l furnaces and
b o i l e r s , however, fume i n c i n e r a t o r s tend t o have low NOx emission fac to rs .
One reference repo r t s NOx e f f l u e n t concent ra t ions f r o m thermal i n c i n e r a t o r s
o f 20 t o 30 ppmv.' est imated NOx concentrat ions would be on t h e order o f 50 t o 200 ppmv.
Pre l im inary r e s u l t s from recent t e s t s on an i n c i n e r a t o r opera t ing a t 760' C
(1,400' F) showed an average NOx emission r a t e o f about 0.27 g/sec (6.0 x
Even a t temperatures as h i g h as 870' C (1,598' F) ,
10 1 b/sec).
The waste gas stream going t o the i n c i n e r a t o r contains approximately 2
percent CO by volume.
t u r e o f 870' C (1,598' F) ( t h i s exceeds t h e a u t o i g n i t i o n temperature o f CO,
which i s 651' C [1,204' F]), e s s e n t i a l l y a l l CO i s oxid ized. The i n c i n e r - a t o r thus achieves a n e t reduc t i on i n CO emissions from maleic anhydride
p lan ts . For the i n c i n e r a t o r cond i t ions descr ibed i n Chapter 2, i t i s e s t i -
mated t h a t g rea te r than 99 percent c o n t r o l o f CO would be achieved.
In - loca t iGs wherena tu ra l gas may be unava i lab le f o r the inc inera tor ;
f u e i o i l w i l l be used as supplemental f u e l . Depending upon the type o f
f u e l used, t he re may be SO2 and p a r t i c u l a t e emissions from t h i s c o n t r o l
technique. It i s p red ic ted t h a t 87,000 b b l o f o i l per year w i l l be used t o
a t t a i n 99 percent c o n t r o l by thermal i n c i n e r a t i o n . I f t h i s o i l were 0.3
percent s u l f u r by weight, 64 Mg o f SO2 would be re leased t o the atmosphere
per year.
4 .1.4 Thermal I n c i n e r a t i o n (97 Percent Cont ro l o f Benzene)
An i n c i n e r a t o r w i t h t h i s e f f i c i e n c y w i l l reduce benzene emissions from
1,540 Mg/yr (1,700 tons /y r ) t o 100 Mg/yr (110 tons /y r ) f o r the model p l a n t .
As w i t h the i n c i n e r a t o r discussed i n t h e prev ious sect ion, negat ive env i ron-
mental impacts may r e s u l t from NOx, SOx, and p a r t i c u l a t e mat te r emissions,
b u t these impacts would tend t o be l ess than impacts o f t h e i n c i n e r a t o r
operated a t a h igher temperature. I t i s p r e d i c t e d t h a t 29,000 bb l o f o i l
Because o f s u f f i c i e n t a i r and an i n c i n e r a t o r tempera-
3 ~
4-20
per year w i l l be used t o a t t a i n 97 percent c o n t r o l by thermal i nc ine ra t i on .
I f t h e o i l were 0.3 percent s u l f u r by weight , 26 Mg o f SO2 would be released
t o the atmosphere per year .
reduced a t the lower temperature o f 760' C (1,400' F).
4.1.5 n-Butane Process Conversion (100 Percent Contro l o f Benzene)
The e f f i c i e n c y o f CO des t ruc t i on would a l so be
Al though few data are y e t a v a i l a b l e on the q u a n t i t y and composi t ion of t h e emissions, p r e l i m i n a r y i n fo rma t ion i n d i c a t e s t h a t t o t a l uncon t ro l l ed
VOC emissions are h igher i n t h e n-butane than i n the benzene o x i d a t i o n
process.8
c a l smog; i t has been found t o be photochemical ly ox id i zed t o peroxides, which are t h e precursors o f t h e var ious types o f photochemical smog. A t present, t he re i s no nat ionwide requirement t o con t ro l t h e VOC emissions
from t h e n-butane ox ida t i on process f o r ma le ic anhydride product ion. Future regu la t i ons w i l l be prepared f o r emissions from o x i d a t i o n systems,
such as n-butane.
o x i d a t i o n process. 13'14 However, one company us ing n-butane has found no
benzene emissions from i t s reac tors a t lower de tec t i on l i m i t s o f 1 ppmv. I f benzene i s no t used f o r new male ic anhydride product ion, benzene
supply in tended f o r t h a t p roduc t ion cou ld be added t o gaso l ine as an octane
booster. crease. Several f a c t o r s make t h i s scenar io seem u n l i k e l y , however.
a t i o n expected t o cont inue through t h e 1980's. Consequently, t h e benzene
t h a t would be used a t new sources, i f t h e r e were no standard, i s n o t p a r t
o f c u r r e n t p roduc t ion output . use benzene as t h e i r feedstock, an increase i n benzene demand would r e s u l t
n-Butane used as a feedstock may r e s u l t i n increased photochemi-
11.12
Trace q u a n t i t i e s o f benzene may be formed i n the n-butane
15
To ta l benzene emissions from gaso l ine market ing would then i n -
Cur ren t ly , benzene demand o f t e n exceeds the a v a i l a b l e supply, a s i t u -
I f new male ic anhydride sources wanted t o
T y p i c a l l y , when demand f o r benzene f l u c t u a t e s , supply i s ad jus ted by I f ben- changing the l e v e l o f p roduc t ion from t h e most expensive source.
zene were n o t p r o h i b i t e d as a feedstock f o r new sources and the re were l i t t l e , i f any, s lack i n the benzene supply, the a d d i t i o n a l benzene requ i red
would probably be supp l ied by hydrodeakylat ion (HDA). expensive benzene produc t ion method, and changes i n benzene demand can be
accommodated by changing the volume o f benzene produc t ion from HDA.
p roduc t ion c u r r e n t l y accounts f o r 25 t o 30 percent o f the benzene produced
per year.16
HDA i s t h e most
HDA
Because e x i s t i n g maleic anhydr ide p l a n t s c u r r e n t l y use 3
4-21
percent o f the benzene produced, the HDA process should be able t o accommo- date f l u c t u a t i o n s i n demand f o r benzene caused by maleic anhydride producers.
If chemical process i n d u s t r i e s know t h a t benzene w i l l not be used as
feedstock f o r maleic anhydride produc t ion , they w i l l presumably a d j u s t t h e i r p r o j e c t i o n s o f f u t u r e benzene demand.
capac i t y would be ad jus ted t o r e f l e c t t h i s decrease i n demand f o r benzene
as a feedstock f o r new male ic anhydr ide sources.
a b e t t e r octane booster than benzene.
p l u s motor]/2) i s 1C~2.9'~ as compared t o 97 f o r benzene.'* Unleaded premium
has an octane number o f 93.0.17 Thus, ins tead o f producing benzene by HDA
and b lend ing it i n t o gasol ine, i t seems more l o g i c a l t o b lend to luene i n t o
t h e gaso l ine than t o produce more benzene.
4 .2 WATER POLLUTION IMPACT
Add i t iona l benzene produc t ion
I n a d d i t i o n , to luene, the feedstock f o r benzene i n the HDA process, i s
Toluene's octane number ( [ research
...
No water e f f l u e n t s a re discharged as a r e s u l t o f the a p p l i c a t i o n o f
i n c i n e r a t o r systems.
w i t h t h e carbon adsorp t ion systems. wastewater from carbon adsorp t ion would be l ess than 10 percent o f t h e
t o t a l l i q u i d waste from a t y p i c a l male ic anhydride produc t ion f a c i l i t y .
The wastewater stream from the carbon adsorp t ion systems cou ld a l so be
~ t r e a t e d a long w i t h the o the r p l a n t e f f l u e n t o r recyc led t o the process.
The organic l i q u i d e f f l u e n t f r o m the carbon adsorber systems w i l l ~ - i n c l u d e ~ ~ ~ ~
male ic ac id , o the r o rgan ic ac ids, formaldehyde, o ther aldehydes, and ber-
zene.
from the process. The organic l i q u i d e f f l u e n t from the carbon adsorpt ion
systems i s a small percentage o f t h e t o t a l l i q u i d e f f l u e n t from maleic
anhydride produc t ion f a c i l i t i e s and i s t he re fo re est imated t o have an
i n s i g n i f i c a n t incremental impact on water p o l l u t i o n .
I n s u f f i c i e n t data are a v a i l a b l e t o assess the wastewater load f r o m the
n-butane process r e l a t i v e t o the load from the benzene process. The d i f -
ference i n wastewater load w i l l depend upon the s p e c i f i c operat ion o f the
recovery, dehydrat ion, and r e f i n i n g steps. As discussed i n Chapter 1,
di f ferences between t h e processes are n o t we1 1 known.
used i n the n-butane conversion process produce a grea ter q u a n t i t y o f
water-so lub le byproducts than c a t a l y s t s used i n the benzene conversion
A wastewater stream con ta in ing benzene i s associated
However, the organic load o f the
3,19
~~~
~~~ ~~ ~ ~~~ ~
~~~~~ ~ ~~~~~~ ~
~~~~~
These m a t e r i a l s are a lso conta ined i n o the r waste l i q u i d streams
Cata lys ts p resen t l y
4-22
-
process.13
the same order o f magnitude as c a t a l y s t s from the benzene process.
Formation o f smal l q u a n t i t i e s o f fumaric a c i d i n dehydrat ion cannot be
avoided.
adhesives, which cou ld l ead t o plugged p ipes and equipment.
t h i s p lugging, p e r i o d i c water washes o f equipment a r e necessary, poss ib ly
lead ing t o an impact on water p o l l u t i o n , b u t no grea ter than t h a t from the
benzene process.
4.3 SOLID WASTE DISPOSAL IMPACT
The l a t e s t c a t a l y s t s developed y i e l d l i q u i d and s o l i d wastes o f 20
Formic a c i d and maleic anhydride are t h e bases f o r some powerful
To prevent
19
One p o t e n t i a l impact on s o l i d waste d isposal assoc iated w i t h the
a l t e r n a t i v e emission con t ro l systems i s t h e hand l ing o f spent carbon from
t h e adsorp t ion systems.
l a n d f i l l , t h e spent carbon w i l l be t ranspor ted t o a f a c i l i t y f o r reclama-
t i o n and regenerat ion. I f i t were disposed o f i n a l a n d f i l l , the amount o f
s o l i d waste from t h i s source would be approximately 7,620 kg/yr (8 .4 tons/ y r ) from t h e model p l a n t , us ing t h e system achiev ing 99 percent c o n t r o l o f
b e n ~ e n e . ~ Assuming t h e same bed l i f e f o r the system a t 97 percent c o n t r o l o f benzene, t h e amount o f s o l i d waste would be on t h e order o f 7,430 kg/yr
(8.2 tons/yr ) f o r t h e model p lan t . However, i n bo th cases i t i s l i k e l y
t h a t t h e carbon can be reclaimed. Because n-butane conversion t o maleic
anhydride i s no t as e f f i c i e n t as benzene conversion, i t y i e l d s lower recov-
ery o f the product as molten maleic anhydr ide and increased recovery by
absorpt ion i n water and conversion t o maleic ac id . on l y makes i t more d i f f i c u l t t o p u r i f y t h e maleic anhydride b u t requ i res
d isposal o f increased amounts o f a c i d i c o rgan ic s o l i d waste.
y i e l d q u a n t i t i e s o f l i q u i d and s o l i d wastes o f the same order o f magnitude
as those from t h e benzene process.
4 .4 ENERGY IMPACT A model uncon t ro l l ed maleic anhydr ide p l a n t , us ing t h e benzene proc-
ess, w i l l produce a smal l energy surp lus o f 15 kJ (14.2 Btu) per k i logram
o f maleic anhydride produced. 3’16 capac i ty o f 22,700 Mg/yr, the energy surp lus i s 340 GJ/yr (3.2 x l o 8 Btu
C55 b b l / y r l ) .
p l a n t i s d iscussed i n the f o l l o w i n g sect ions.
T y p i c a l l y , r a t h e r than being disposed o f i n a
This recovery r a t e n o t
poss ib l y as The l a t e s t c a t a l y s t developed, no t c u r r e n t l y i n use, w i l l
20
For a model p l a n t w i t h a p roduc t ion
The energy impact of each con t ro l technique f o r a model
For comparison, energy
4-23
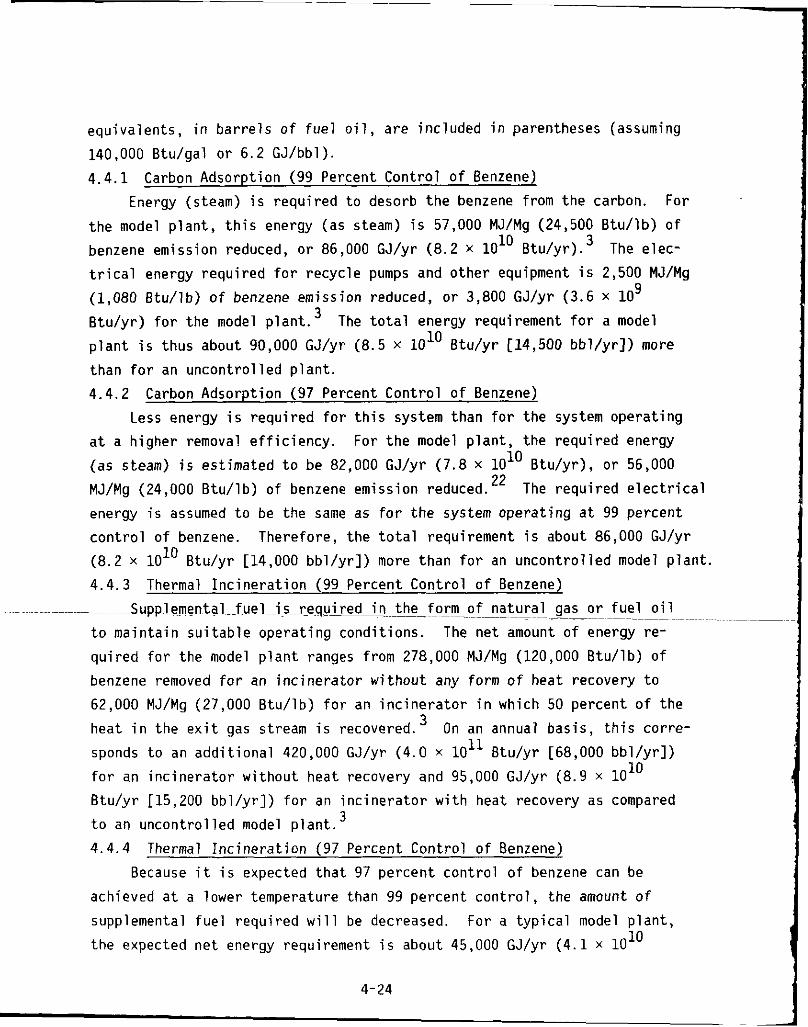
equivalents , i n bar re l s of fuel o i l , are included i n parentheses (assuming 140,000 Btu/gal or 6 . 2 GJ/bbl). 4 .4 .1 Carbon Adsorption (99 Percent Control of Benzene)
Energy (steam) i s required t o desorb the benzene from t h e carbon. t h e model p l a n t , t h i s energy ( a s steam) is 57,000 MJ/Mg (24,500 Btu/lb) of benzene emission reduced, o r 86,000 GJ/yr (8 .2 x l o l o B t ~ / y r ) . ~ The elec- t r i c a l energy required f o r recycle pumps and o ther equipment i s 2,500 MJ/Mg (1,080 Btu/lb) of benzene emission reduced, o r 3,800 GJ/yr (3.6 x 10 Btu/yr) f o r t he model p lan t .3 The t o t a l energy requirement f o r a model p lan t i s t h u s about 90,000 GJ/yr (8.5 x l o l o Btu/yr [14,500 bbl/yr]) more than f o r an uncontrolled p l an t . 4.4.2
For
9
Carbon Adsorption (97 Percent Control of Benzene) Less energy i s required f o r t h i s system than f o r t he system operating
a t a higher removal e f f ic iency . For t h e model p l a n t , t he required energy (as steam) i s estimated t o be 82,000 GJ/yr (7.8 x l o l o Btu/yr), o r 56,000 MJ/Mg (24,000 Btu/lb) o f benzene emission reduced. 22 The required e l e c t r i c a l energy i s assumed t o be the same a s f o r the system operating a t 99 percent control of benzene. (8 .2 x 10" Btu/yr [14,000 bbl/yr]) more t h a n f o r an uncontrolled model plant . 4 . 4 . 3 Thermal Incinerat ion (99 Percent Control of Benzene)
S u p p I e m e n t a l ~ f u e l ~ i s ~ ~ r e q u ~ e d ~ ~ ~ ~ ~ ~ ~ f o r m ~ . o f ~ ~ n a t u r a l ~ ~ gas ~~ or fuel 011.~~~ ~~ ~ ~
t o maintain s u i t a b l e operating conditions. The net amount o f energy re- quired f o r t he model p lan t ranges from 278,000 MJ/Mg (120,000 Btu/lb) of
Therefore, the t o t a l requirement is about 86,000 GJ/yr
benzene removed f o r a n incinerator without any form of heat recovery t o 62,000 MJ/Mg (27,000 Btu/lb) f o r an inc inera tor i n which 50 percent of t he heat i n t he e x i t gas stream i s r e ~ o v e r e d . ~ sponds t o an addi t ional 420,000 GJ/yr (4 .0 x 10l1 Btu/yr [68,000 bbl /yr l ) f o r an incinerator without heat recovery and 95,000 GJ/yr (8.9 x 10 Btu/yr [15,200 bbl/yr]) f o r an inc inera tor with heat recovery a s compared t o an uncontrolled model p l an t . 4 .4 .4 Thermal Incinerat ion (97 Percent Control of Benzene)
On an annual b a s i s , this corre-
10
3
Because i t i s expected t h a t 97 percent control of benzene can be achieved a t a lower temperature than 99 percent cont ro l , the amount of
supplemental fuel required wi l l be decreased. For a typical model p l a n t , t he expected ne t energy requirement i s about 45,000 GJ/yr ( 4 . 1 x 10 10
4-24
Btu/yr [7,000 bb l / y r ] ) f o r an i n c i n e r a t o r w i t h heat recovery, o r 29,000
MJ/Mg (12,500 Btu/ lb) of benzene emission reduced.
4.4.5 n-Butane Process Conversion
22
Male ic anhydride recovery f r o m n-butane o x i d a t i o n may be l ess than
from benzene ox ida t i on , depending on t h e type o f c a t a l y s t used.
s ta tes t h a t i t p resen t l y recovers a 50-percent molar y i e l d o f maleic anhy-
d r i de from benzene o x i d a t i o n and expects l e s s from n-butane ox ida t i on .
Another source claims a 70-percent molar y i e l d from benzene o x i d a t i o n and a 55-percent molar y i e l d from n-butane oxidat ion.21
the annual ized costs o f u t i l i t i e s f o r t h e benzene process a t $350,000, wh i l e annual ized u t i l i t i e s cos ts f o r t h e n-butane process are $450,000, based
on t y p i c a l U.S. power and f u e l costs.20
t o use more energy than t h e benzene process.
4.4.6 Summary A l l o f t h e add-on c o n t r o l devices r e q u i r e more energy than t h e t y p i c a l
benzene process produces. The thermal i n c i n e r a t o r requ i res the most energy a t 99 percent c o n t r o l , a l though w i t h heat recovery it requ i res j u s t s l i g h t l y more than the carbon adsorp t ion system opera t i ng a t t h e same l e v e l o f
con t ro l . about tw ice as much energy as t h e i n c i n e r a t o r does a t 97 percent con t ro l .
I n c i n e r a t i o n w i t h heat recovery opera t ing a t 99 percent removal e f f i c i e n c y f o r benzene uses l ess than 10 percent more energy than t h e carbon adsorp-
t i o n system opera t ing a t 97 percent c o n t r o l o f benzene. However, the
thermal i n c i n e r a t o r ope ra t i ng a t 97 percent c o n t r o l uses s i g n i f i c a n t l y l ess
energy than t h e o the r methods. Furthermore, cons idera t ion o f t h e energy usage by the add-on c o n t r o l devices a t a 99-percent l e v e l o f c o n t r o l does
no t s i g n i f i c a n t l y f avo r e i t h e r carbon adsorp t ion o r i n c i n e r a t i o n , p rov ided
heat recovery i s employed w i t h the l a t t e r .
a t 97 percent c o n t r o l .
e f f i c i e n c y decreases.
c o n t r o l technique chosen f o r any a l t e r n a t i v e l e v e l o f c o n t r o l . However,
t h e a n t i c i p a t e d upper l i m i t on energy usage i s t h e case i n which a l l p l a n t s
achieve 99 percent c o n t r o l o f benzene by thermal i n c i n e r a t i o n w i t h 50 per-
cent heat recovery. The lower l i m i t i s t h e case i n which a l l benzene-based
f a c i l i t i e s conver t t o n-butane as the feedstock.
One source
14
One recent study places
Thus, the n-butane process appears
A t 97 percent c o n t r o l , t h e carbon adsorp t ion system requ i res
Thermal i n c i n e r a t i o n i s favored
As expected, energy requirement decreases as c o n t r o l
The t o t a l na t i ona l energy requirement w i l l depend upon the p a r t i c u l a r
4-25
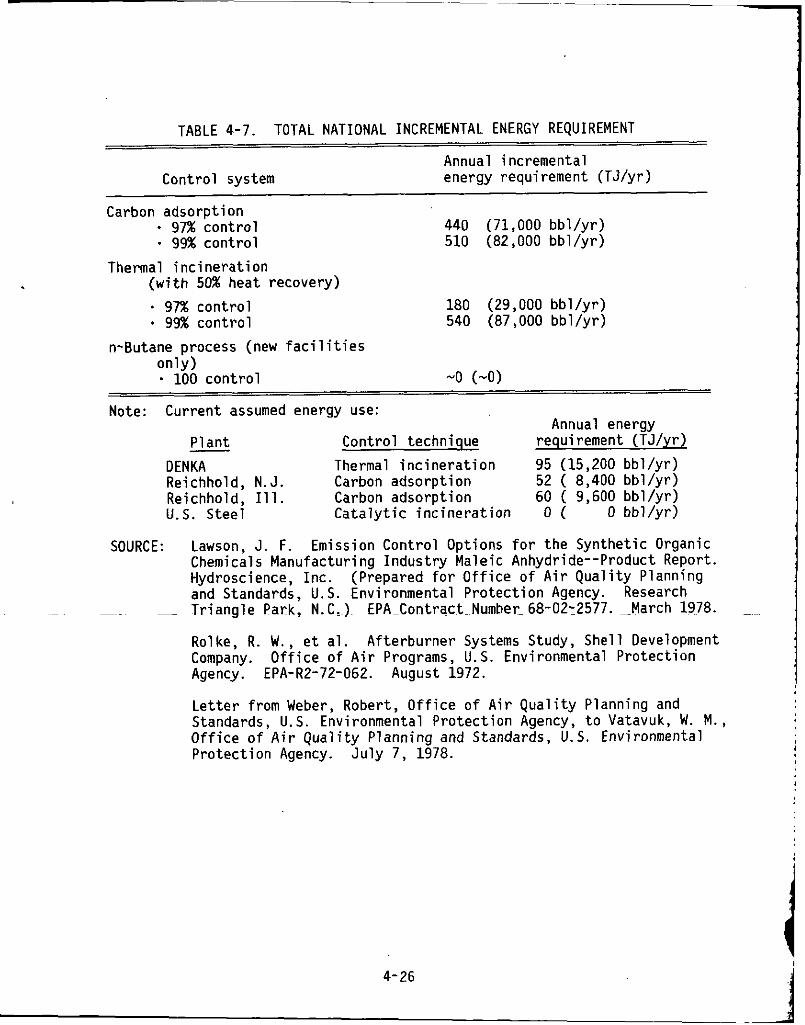
TABLE 4-7. TOTAL NATIONAL INCREMENTAL ENERGY REQUIREMENT
Annual incremental Cont ro l system energy requirement (TJ/yr)
Carbon adsorp t ion - 97% c o n t r o l - 99% c o n t r o l 440 (71,000 b b l / y r ) 510 (82,000 b b l / y r )
Thermal i n c i n e r a t i o n (wi th 50% heat recovery) e 97% c o n t r o l 180 (29,000 b b l / y r )
99% c o n t r o l 540 (87,000 b b l / y r )
n-Butane process (new f a c i l i t i e s on ly ) - 100 c o n t r o l -0 (-0)
Note: Current assumed energy use: Annual energy - P1 an t Cont ro l technique requirement (TJ/yr)
DENKA Thermal i n c i n e r a t i o n 95 (15,200 bb l / y r ) Reichhold, N. J. Carbon adsorp t ion 52 ( 8,400 bb l / y r ) Reichhold, Ill. Carbon adsorp t ion 60 ( 9,600 b b l / y r ) U.S. S tee l C a t a l y t i c i n c i n e r a t i o n 0 ( 0 bb l / y r )
SOURCE: Lawson, J. F. Emission Cont ro l Options f o r t h e Synthet ic Organic Chemicals Manufacturing I n d u s t r y Male ic Anhydride--Product Report. Hydroscience, I n c . and Standards, U. S. Environmental P ro tec t i on Agency. Research
~ - Tr iang le Park, N.C.) EPA-Contract Numher 68-02-2577. _March 1978.
Rolke, R. W . , e t a l . A f te rburner Systems Study, She l l Development Company. Agency. EPA-R2-72-062. August 1972.
L e t t e r from Weber, Robert, O f f i c e o f A i r Q u a l i t y Planning and Standards, U . S . Environmental P ro tec t i on Agency, t o Vatavuk, W. M . , O f f i c e o f A i r Q u a l i t y P lanning and Standards, U.S. Environmental P ro tec t i on Agency. J u l y 7, 1978.
(Prepared f o r O f f i c e o f A i r Q u a l i t y Planning
O f f i c e o f A i r Programs, U. S. Environmental P ro tec t i on
4-26
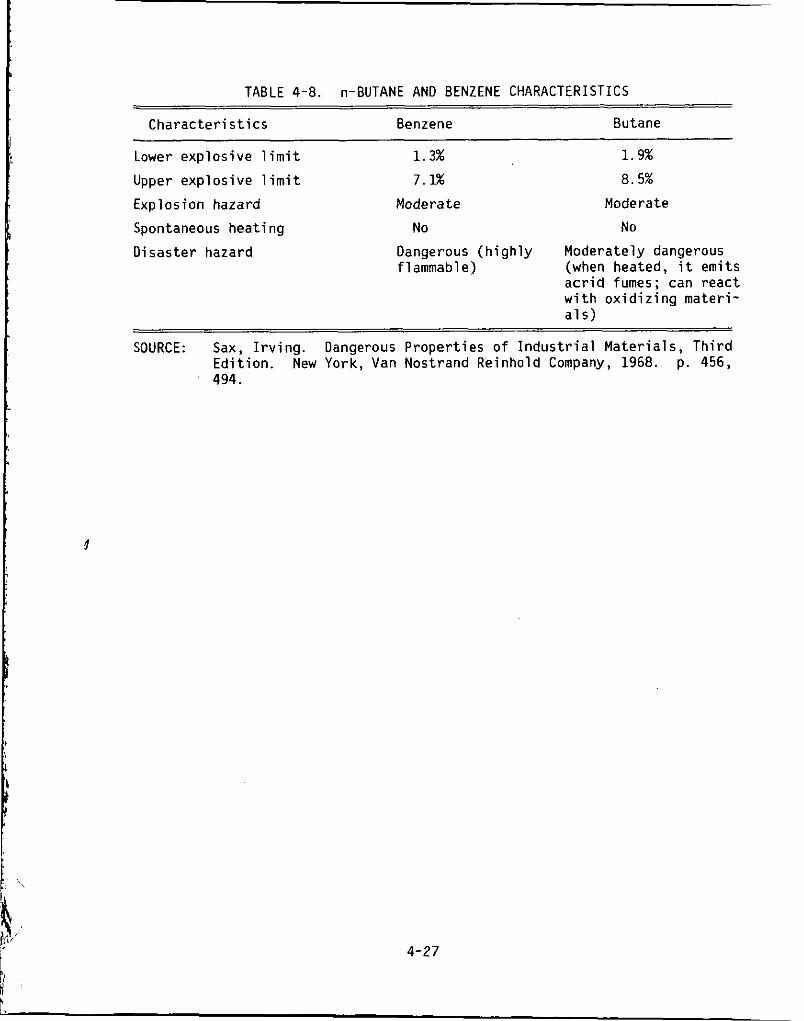
TABLE 4-8. n-BUTANE AND BENZENE CHARACTERISTICS
Charac te r i s t i cs Benzene Butane ~ ~ ~~ ~
Lower explos ive l i m i t 1.3% 1.9%
Upper exp los ive l i m i t 7.1% 8.5%
Exp 10s i o n hazard Moderate Moderate
Spontaneous heat ing No No
D isas ter hazard Dangerous ( h i g h l y Moderately dangerous flammable) (when heated, i t emits
a c r i d fumes; can reac t w i t h o x i d i z i n g mater i - a l s )
~~
SOURCE: Sax, I r v i n g . Dangerous Proper t ies o f I n d u s t r i a l Ma te r ia l s , T h i r d Ed i t i on . New York, Van Nostrand Reinhold Company, 1968. p. 456, 494.
J
4-27
Table 4-7 r e f l e c t s t h e t o t a l na t i ona l energy increase from c u r r e n t
c o n t r o l use t o t h a t requ i red f o r a s p e c i f i c type o f c o n t r o l and p a r t i c u l a r
c o n t r o l l e v e l . c o n t r o l a re no t inc luded i n t h e energy requirements f o r a 97-percent regula-
t o r y op t ion .
c o n t r o l i s sub t rac ted from t h a t energy r e q u i r e d t o achieve 97 percent.
S i m i l a r l y , p l a n t s t h a t achieve 99 percent c o n t r o l are no t inc luded i n t h e
energy requirements f o r a 99-percent op t ion , and energy used c u r r e n t l y t o
meet any o the r l e v e l o f c o n t r o l i s subt racted.
Accordingly, p l a n t s t h a t c u r r e n t l y achieve 97 o r 99 percent
Also, energy consumed by p l a n t s t o achieve l ess than 97 percent
4.5 OTHER ENVIRONMENTAL IMPACTS
any o f t h e a l t e r n a t i v e emission con t ro l systems discussed i n Chapter 3. No o the r known s i g n i f i c a n t environmental impacts are associated w i t h
4.6 OTHER ENVIRONMENTAL CONCERNS
4.6.1
raw mater ia l - -benzene-- for reuse, whereas an i n c i n e r a t i o n system uses a
nonrenewable resource.
i s subs tan t i a l . there i s an energy savings equ iva len t t o t h e energy requ i red t o produce
I r r e v e r s i b l e and I r r e t r i e v a b l e Commitment o f Resources
Emission c o n t r o l systems using carbon adsorpt ion recover a va luable
Over the l ong term, t h e amount o f recovered benzene Moreover, when benzene i s recovered r a t h e r than burned,
benzene.
4 .6.2 Safety Issues
and benzene. The t a b l e shows t h a t i f n-butane i s subs t i t u ted f o r benzene
as a feedstock, no s i g n i f i c a n t changes i n process sa fe ty are expected.
~~~~~~ ~- -~
Table 4-8 summarizes t h e sa fe ty - re la ted c h a r a c t e r i s t i c s o f n-butane
n-Butane i s a l ready used i n s i m i l a r s i t u a t i o n s w i t h i n t h e petrochemical
i n d u s t r y as a feedstock.
benzene.
4.7 REFERENCES
On a r e l a t i v e bas is , n-butane would be sa fe r than
1. L e t t e r from Madden, G. I., E. I. Dupont de Nemours and Co., t o Weber, R. C . , O f f i c e o f A i r Q u a l i t y P lanning and Standards, U . S . Environ- mental P ro tec t i on Agency. August 29, 1978.
Impact o f Benzene Emissions from a Male ic Anhydride P lan t f o r Four Emission Cont ro l Options. S a l t Lake City, Utah. (Prepared f o r Source- Receptor Analys is Branch, U. s. Environmental P ro tec t i on Agency. Research Tr iang le Park, N.C. ) EPA Contract Number 68-02-2507. August 1978.
2. H. E. Cramer Co., Inc . D ispers ion Model Ana lys is o f t h e A i r Q u a l i t y
4-28
3. Lawson, J. F. Emission Control Options for the Synthetic Organic Chemicals Manufacturing Industry Maleic Anhydride--Product Report. Hydroscience, Inc. (Prepared for Office of Air Quality Planning and Standards, U. S. Environmental Protection Agency. Research Triangle Park, N.C.) EPA Contract Number 68-02-2577. March 1978.
4. Letter from Pierle, M. A . , Monsanto Chemical Intermediates Co., to Patrick, D. R., Office of Air Quality Planning and Standards. 1978.
April 11,
5. Letter from;Hewett, P. S . , Reichhold Chemicals, Inc., t o Goodwin, 0. R., Office of, Air Quality Planning and Standards, U . S . Environ- mental Protection Agency. August 30, 1978.
6. Mitre Corp. Dorigan, J., 6. Fuller, and R. Ouffy. Preliminary Scor- ing of Selected Organic Pollutants, Appendix I--Chemistry, Production, and Toxicity of Chemicals A through C. Quality Planning and Standards, U . S . Environmental Protection Agency. Research Triangle Park, N. C. ) EPA-450/3-77-008b. October 1976.
7. Lawson, J. F. Trip Report for Visit to Reichhold Chemicals, Inc., Morris, Illinois, July 28, 1977. Hydroscience, Inc. EPA Contract Number 68-02-2577.
8. Lawson, J. F. Trip Report for Visit to Amoco Chemicals Corp., Chicago, Illinois, January 24, 1978. Hydroscience, Inc. EPA Contract Number 68-02-2577.
(Prepared for Office of Air
9. Rolke, R. W., et al. Afterburner Systems Study, Shell Development Company. Office of Air Programs, U . S . Environmental Protection Agency. EPA-R2-72-062. August 1972.
10. Midwest Research Institute. Stationary Source Testing of a Maleic Anhydride Plant at the DENKA Chemical Corp. Houston, Tex. EPA Con- tract Number 68-02-2814.
11. Bufalini, J. S . , 6. W . Gay, and S. L. Kopczynski. Oxidation of n-Butane by the Photolysis of NO2. Environmental Science and Technology. - 5(4). April 1971.
Grant Press, 1975. p. 532.
Letter from Weber, Robert, Office of Air Quality Planning and Standards, U.S. Environmental Protection Agency, to Gans, M., Scientific Design Co. December 27, 1978.
14. Letter from Pierle, M. A., Monsanto Chemical Intermediates Co., to Goodwin, 0. R., Office of Air Quality Planning and Standards, U.S. Environmental Protection Agency. March 22, 1978.
12. Manahan, 5 . E. Environmental Chemistry, Second Edition. Willard
13.
4-29
15.
16.
17.
18.
19.
20.
22.
Telecon. Weber, Robert, O f f i c e o f A i r Q u a l i t y P lanning and Standards, U.S. Environmental P r o t e c t i o n Agency, w i t h P i e r l e , Michael, Monsanto Chemical In termediates Co. January 18, 1979.
Gunn, T. C. Benzene. Chemical Economics Handbook. Stanford Research I n s t . Menlo Park, C a l i f . November 1973.
Dosher, John R. Toluene's Role as Gasol ine Octane Improver W i l l Not Change Much. O i l and Gas Journal . 104-110. May 28, 1979.
Lorenz, H. R. Toluene i s t h e Essence. Chemical Engineer ing Progress.
L e t t e r from Hewett, P. S., Reichhold Chemicals, Inc . , t o P a t r i c k , D. R. , O f f i c e o f A i r Q u a l i t y P lanning and Standards, U . S . Environmen- t a l P ro tec t i on Agency. March 27, 1978.
L e t t e r from Gans, M . , S c i e n t i f i c Design Co., t o Warren, J . , Research T r i a n g l e I n s t . February 2, 1979.
Gans, M. The Manufacture o f Ma le ic Anhydride. (Special on "Progress"). - 28(7). J u l y 1977.
L e t t e r from Weber, Robert, O f f i c e o f A i r Q u a l i t y Planning and Stand- ards, U.S. Environmental P r o t e c t i o n Agency, t o Vatavuk, W. M . , O f f i c e o f A i r Q u a l i t y P lanning and Standards, U.S. Environmental P ro tec t i on Agency. J u l y 7, 1978.
- 73(8):11-13. August 1977.
Chemical Age o f I n d i a
1
4-30
5. ECONOMIC IMPACT
5 .1 SUMMARY OF ECONOMIC IMPACTS OF THE MALEIC ANHYDRIDE BENZENE NESHAP
Two regu la to ry opt ions--97 percent and 99 percent--are analyzed f o r e x i s t i n g f a c i l i t i e s .
analyzed f o r new f a c i l i t i e s .
t h i s chapter:
One a d d i t i o n a l regu la to ry option--100 pe rcen t - - i s The f o l l o w i n g economic issues are examined i n
Cap i ta l budget impacts,
S h i f t s i n compet i t i ve p o s i t i o n s because o f unequal c o n t r o l costs ,
P r i c e impacts on products t h a t use maleic anhydride (MA), Employment and balance o f t r a d e e f f e c t s , Annualized cos ts i n f i f t h yea r and energy impacts, and
Impact o f r e q u i r i n g n-butane a t new MA f a c i l i t i e s .
*
- The r e s u l t s a re summarized below.
5 .1 .1 Cap i ta l Budget Impacts
poss ib l y Tenneco would f inance the investment.
l e v e l , the o n l y poss ib le c losure candidate i s Tenneco. 5 .1.2 S h i f t s i n Compet i t ive P o s i t i o n
o f capaci ty) , no s h i f t i n i n t r a i n d u s t r y compet i t ion i s expected.
99 percent c o n t r o l and w i t h low l e v e l s o f demand (56 percent) , Tenneco
would face the h ighes t degree o f domestic i n t r a i n d u s t r y compet i t ion, w i t h
DENKA, Koppers (Ill.), and Amoco f a c i n g the lowest degree o f t h a t competi-
t i o n .
5.1.3
A t the 99-percent c o n t r o l l e v e l , a l l f i r m s except probably DENKA and A t the 97-percent c o n t r o l
A t 97 o r 99 percent c o n t r o l and w i t h h igh l e v e l s o f demand (100 percent
A t 97 o r
P r i ce Impacts On Products That Use MA
The most s i g n i f i c a n t p r i c e increase (assuming f u l l cos t pass through) p ro jec ted i s i n fumaric ac id , rang ing up t o 4.4 percent a t t h e 99-percent
c o n t r o l l e v e l and low l e v e l o f MA demand. Polyester res ins and malath ion
w i l l have p r i c e increases l ess than 1 percent under a l l scenar ios.
5-1
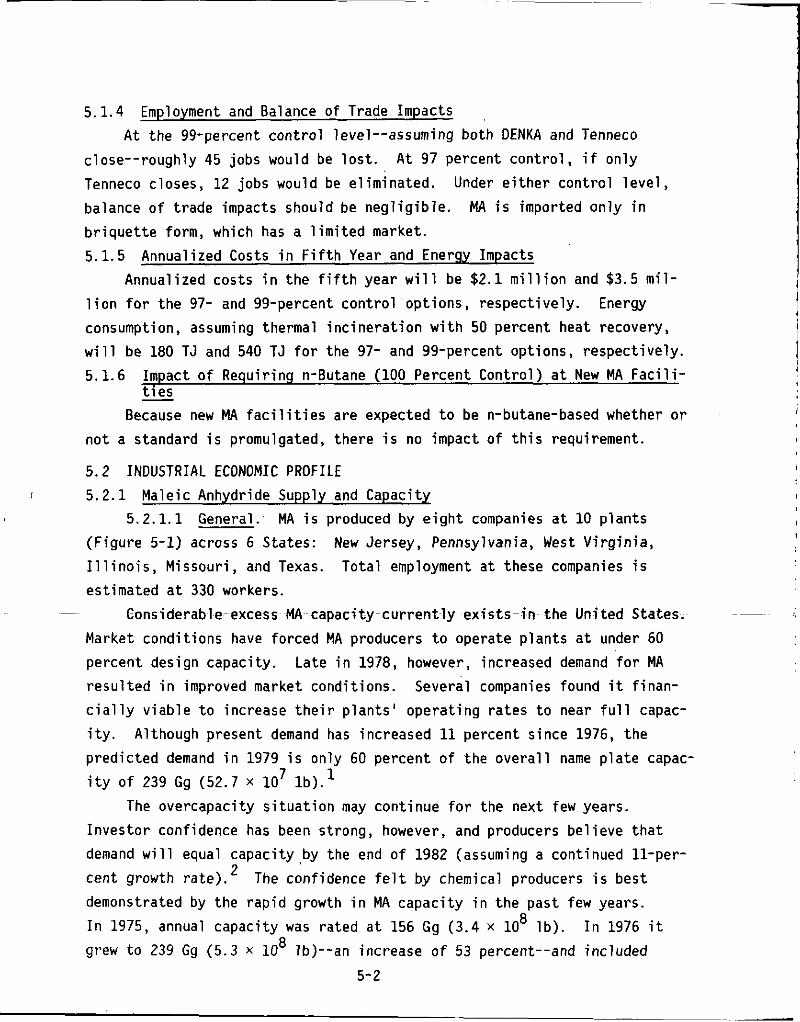
5.1.4 Employment and Balance of Trade Impacts At the 99-percent control level--assuming both DENKA and Tenneco
At 97 percent control, if only close--roughly 45 jobs would be lost. Tenneco closes, 12 jobs would be eliminated. balance of trade impacts should be negligible. briquette form, which has a limited market. 5.1.5 Annualized Costs in Fifth Year and Energy Impacts
lion for the 97- and 99-percent control options, respectively. Energy consumption, assuming thermal incineration with 50 percent heat recovery, will be 180 TJ and 540 TJ for the 97- and 99-percent options, respectively. 5.1.6 Impact of Requiring n-Butane (100 Percent Control) at New MA Facili-
ties Because new MA facilities are expected to be n-butane-based whether or
Under either control level, MA is imported only in
Annualized costs in the fifth year will be $2.1 million and $3.5 mil-
-
not a standard is promulgated, there is no impact of this requirement.
5.2 INDUSTRIAL ECONOMIC PROFILE I 5.2.1 Maleic Anhydride Supply and Capacity
5.2.1.1 General. MA is produced by eight companies at 10 plants
Total employment at these companies is (Figure 5-1) across 6 States: New Jersey, Pennsylvania, West Virginia, Illinois, Missouri, and Texas. estimated at 330 workers.
- Considerable excess MA capacity currently exists-in the United States. Market conditions have forced MA producers to operate plants at under 60 percent design capacity. Late in 1978, however, increased demand for MA resulted in improved market conditions. Several companies found it finan- cially viable to increase their plants’ operating rates to near full capac- ity. predicted demand in 1979 is only 60 percent of the overall name plate capac- ity of 239 Gg (52.7 x lo7 lb).’
The overcapacity situation may continue for the next few years. Investor confidence has been strong, however, and producers believe that demand will equal capacity by the end of 1982 (assuming a continued ll-per- cent growth rate).’ The confidence felt by chemical producers is best demonstrated by the rapid growth in MA capacity i n the past few years. In 1975, annual capacity was rated at 156 Gg (3.4 x 10 grew to 239 Gg (5.3 x 10 Ib)--an increase o f 53 percent--and included
Although present demand has increased 11 percent since 1976, the
8 lb). I n 1976 it 8
5-2
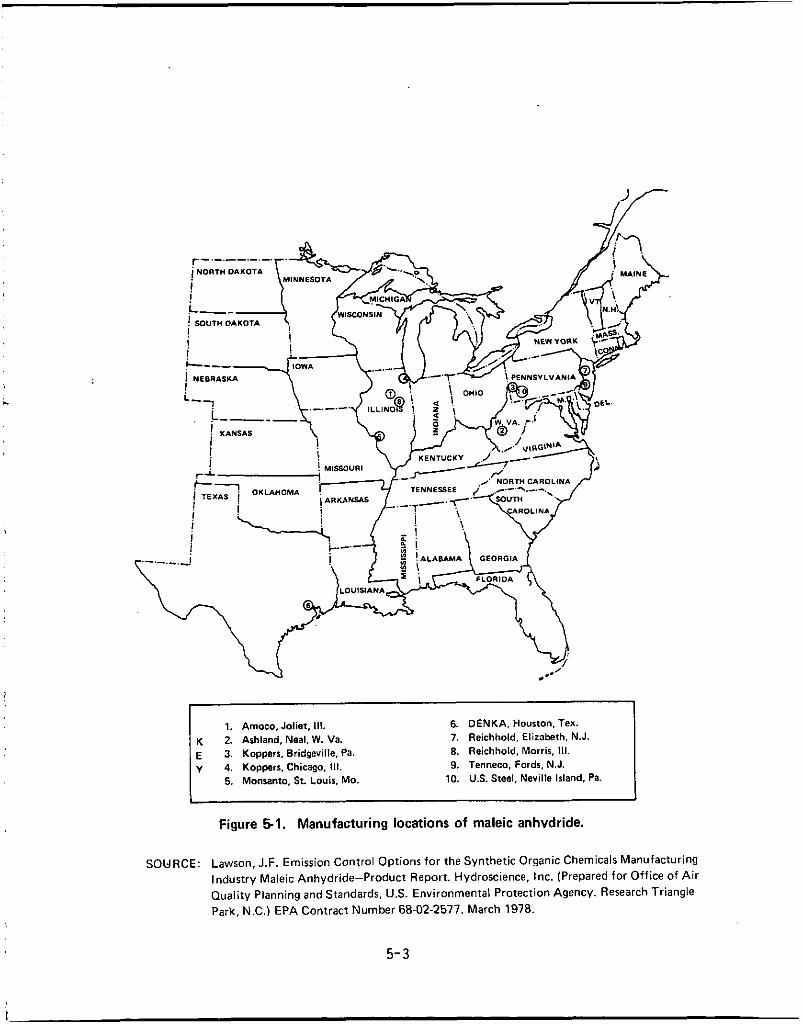
c
U 1. Amoco, Joliet, 111. 6. DENKA. Houston. Tex.
K 2. Ashland, Neal, W. Va. 7. Reichhold, Elirabath, N.J.
E 3. Kopperr. Bridgeville, Pa. 8. Reichhold, Morris. 111.
y 4. Kopperr. Chicago, 111. 9. Tenneca. Fords. N.J. 5. Monranto. St. Louis. Mo. 10. US. Steel, Neville Island. Pa
Figure 51. Manufacturing locations of maleic anhvdride.
SOURCE: Lawson, J.F. Emission Control Options for the Synthetic Organic Chemicals Manufacturing Industry Maleic Anhydride-Product Report. Hydroscience, Inc. (Prepared for Office of Air Quality Planning and Standards, US. Environmental Protection Agency. Research Triangle Park. N.C.) EPA Contract Number 68-02-2577. March 1978.
5- 3
I
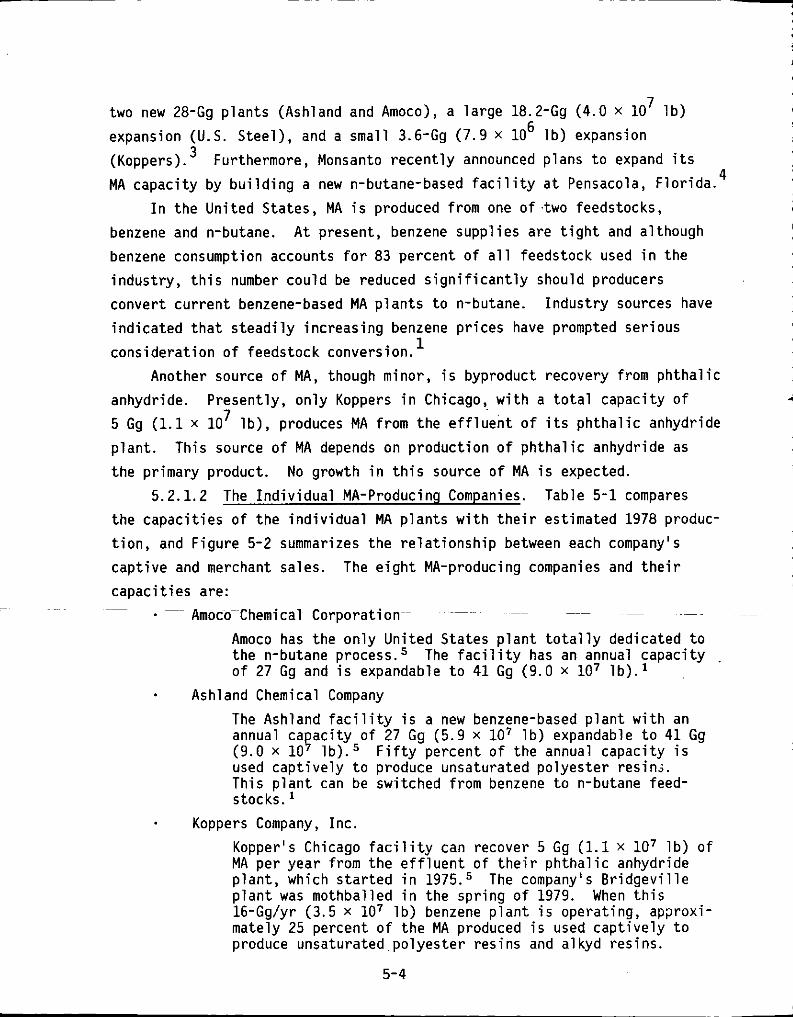
7 two new 28-Gg p l a n t s (Ashland and Amoco), a l a r g e 18.2-Gg (4.0 x 10
expansion (U.S. Steel ) , and a smal l 3.6-Gg (7.9 x 10 l b ) expansion
(Koppers). MA capac i t y by b u i l d i n g a new n-butane-based f a c i l i t y a t Pensacola, F lo r i da .
benzene and n-butane. benzene consumption accounts f o r 83 percent o f a l l feedstock used i n t h e
i ndus t r y , t h i s number cou ld be reduced s i g n i f i c a n t l y should producers
conver t c u r r e n t benzene-based MA p l a n t s t o n-butane.
i n d i c a t e d t h a t s t e a d i l y i nc reas ing benzene p r i c e s have prompted ser ious
cons ide ra t i on o f feedstock conversion.
l b ) 6
Furthermore, Monsanto r e c e n t l y announced p lans t o expand i t s 4
I n t h e Un i ted States, MA i s produced from one o f two feedstocks, A t present, benzene supp l ies are t i g h t and a l though
I n d u s t r y sources have
1
Another source o f MA, though minor, i s byproduct recovery from p h t h a l i c
l b ) , produces MA f rom t h e e f f l u e n t o f i t s p h t h a l i c anhydride anhydride. Present ly , o n l y Koppers i n Chicago, w i t h a t o t a l capac i ty o f
5 Gg (1.1 x 10
p l a n t . Th is source o f MA depends on p roduc t i on o f p h t h a l i c anhydride as
t h e pr imary product.
5.2.1.2 The I n d i v i d u a l MA-Producing Companies. Table 5 -1 compares
t h e c a p a c i t i e s o f t h e i n d i v i d u a l MA p l a n t s w i t h t h e i r est imated 1978 produc-
t i o n , and F igure 5-2 summarizes t h e r e l a t i o n s h i p between each company's cap t i ve and merchant sa les. The e i g h t MA-producing companies and t h e i r
capac i t i es are:
7
No growth i n t h i s source o f MA i s expected.
~
~ ~ ~ ~ ~~
~ AmocaChemical Corporat ion
Amoco has t h e o n l y Un i ted States p l a n t t o t a l l y dedicated t o the n-butane p r o c e ~ s . ~ The f a c i l i t y has an annual capac i t y ,
o f 27 Gg and i s expandable t o 4 1 Gg (9.0 x lo7 l b ) . l
The Ashland f a c i l i t y i s a new benzene-based p l a n t w i t h an annual ca a c i t y o f 27 Gg (5.9 x lo7 l b ) expandable t o 4 1 Gg
used c a p t i v e l y t o produce unsaturated po lyes te r resin;. Th is p l a n t can be switched from benzene t o n-butane feed- stocks.
* Koppers Company, I nc .
Kopper's Chicago f a c i l i t y can recover 5 Gg (1.1 x lo7 l b ) o f MA per yea r from t h e e f f l u e n t o f t h e i r p h t h a l i c anhydride p l a n t , which s t a r t e d i n 1975.5 The company's B r i d g e v i l l e p l a n t was mothbal led i n the s p r i n g o f 1979. 16-Gg/yr (3.5 x lo7 l b ) benzene p l a n t i s operat ing, approx i - mately 25 percent o f t h e MA produced i s used c a p t i v e l y t o produce unsaturated p o l y e s t e r res ins and a l kyd res ins .
Ashland Chemical Company
(9.0 x 10 ? l b ) . 5 F i f t y percent o f the annual capac i ty i s
When t h i s
5-4
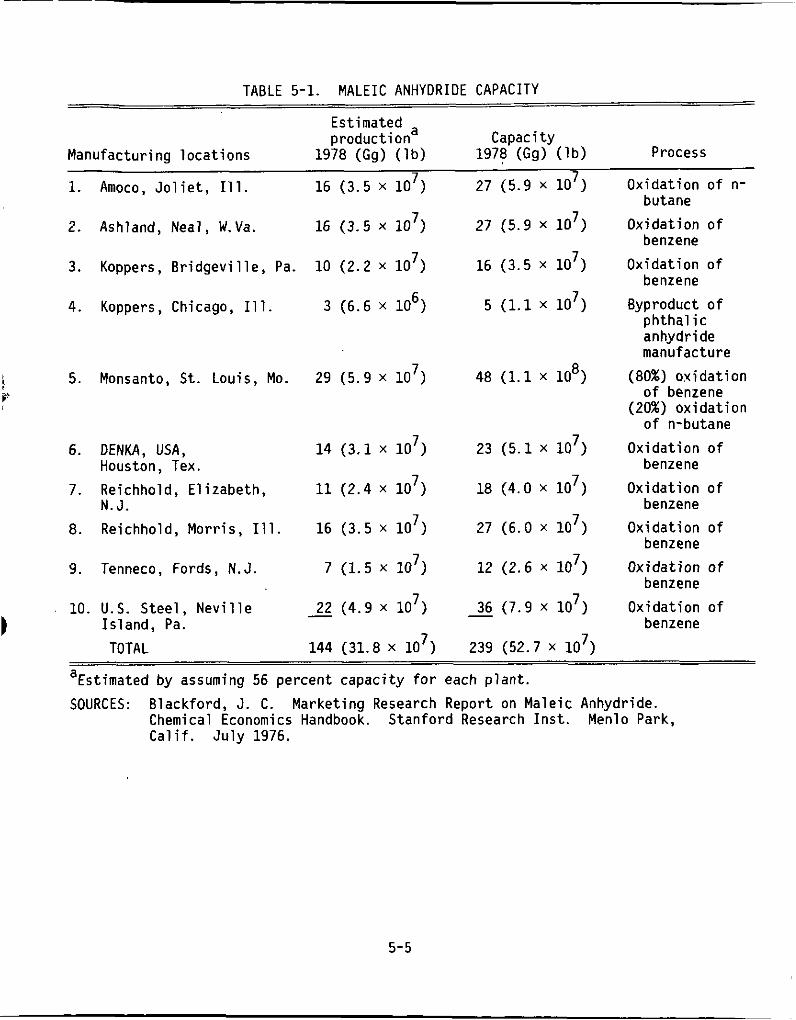
TABLE 5-1. MALEIC ANHYDRIDE CAPACITY
Estimated a produc t ion Capacity
Manufactur ing l oca t i ons 1978 (Gg) ( l b ) 1978 (Gg) ( I b ) Process - 1. Amoco, J o l i e t , Ill. 16 (3.5 x 10‘)
2. Ashland, Neal, W.Va. 16 (3.5 lo7)
3. Koppers, B r i d g e v i l l e , Pa. 10 (2.2 x lo7)
4. Koppers, Chicago, Ill. 3 (6.6 x lo6)
! 5. Monsanto, St. Louis, Mo. 29 (5.9 x lo7) e‘
6. DENKA, USA, 14 (3.1 lo7)
7. Reichhold, E l i zabeth , 11 (2.4 lo7) Houston, Tex.
N. J. 8. Reichhold, Mor r is , Ill. 16 (3.5 x lo7)
9. Tenneco, Fords, N.J. 7 (1.5 x 10 ) 7
22 (4.9 x 10’) 10. U.S. S tee l , N e v i l l e - b I s land, Pa. -
27 (5.9 x 10’)
16 (3.5 lo7)
5 (1.1 x 10’)
48 (1.1 x lo8)
23 (5.1 x lo7)
18 (4.0 x 10’)
27 (6.0 x 10’)
12 (2.6 x lo7)
- 36 (7.9 x 10‘) -
TOTAL 144 (31.8 x 10’) 239 (52.7 X 10’)
Oxidat ion o f n- butane
Ox ida t ion o f benzene
Ox ida t ion o f benzene
Byproduct o f p h t h a l i c anhydride manufacture
(80%) o x i d a t i o n o f benzene
(20%) ox ida t i on o f n-butane
Ox ida t ion o f benzene
Ox ida t ion o f benzene
Ox ida t ion o f benzene
Ox ida t ion o f benzene
Ox ida t ion o f benzene
aEstimated by assuming 56 percent capac i t y f o r each p lan t . SOURCES: B lackford, J. C. Market ing Research Report on Male ic Anhydride.
Chemical Economics Handbook. S tan ford Research I n s t . Menlo Park, C a l i f . July 1976.
5-5
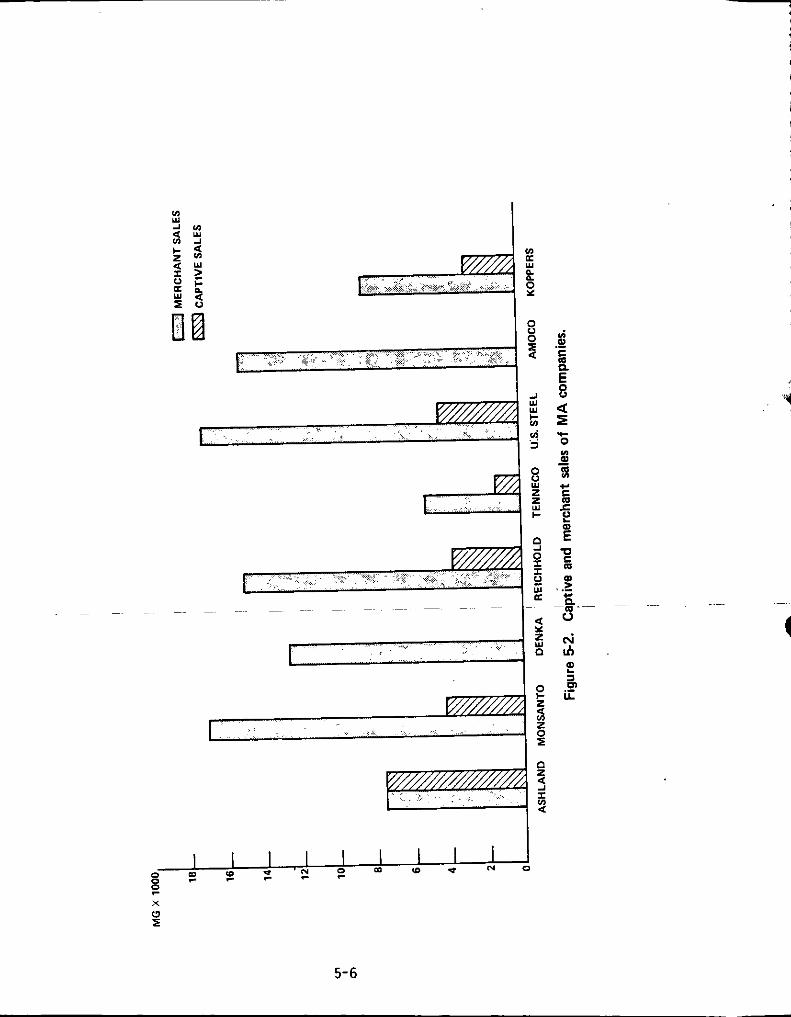
4 9 I
Y 0 a
Y
I * *: 5 0
c s e E
z W
x W I
5-6
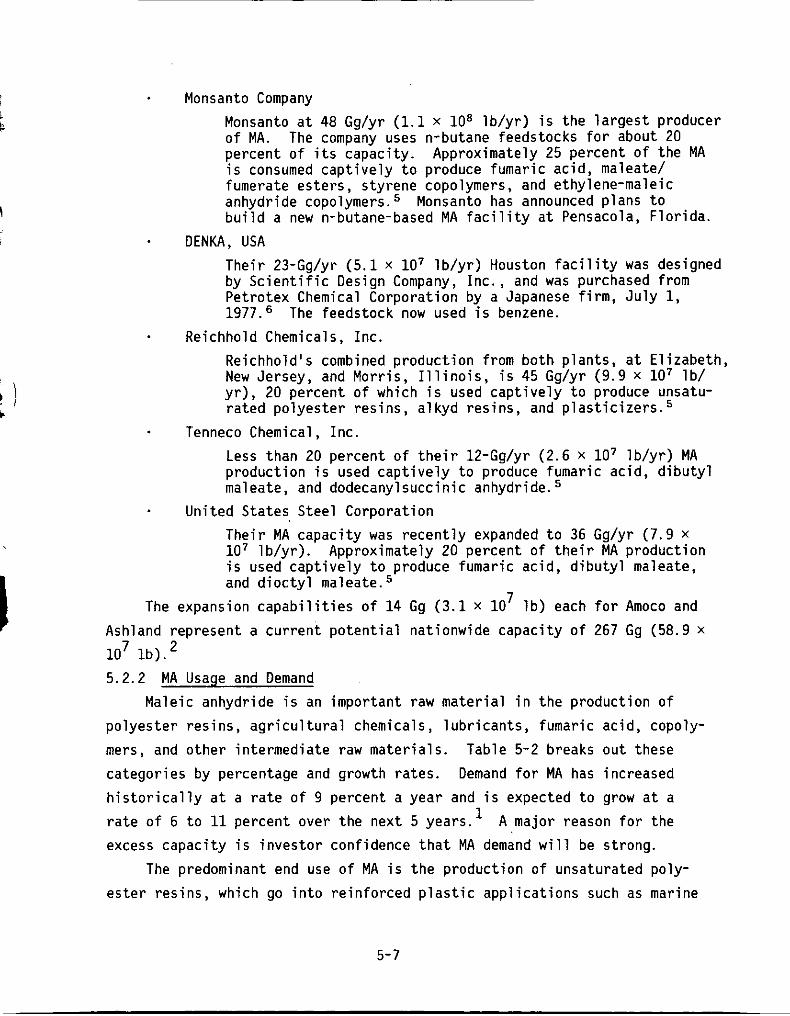
c
- Monsanto Company Monsanto at 48 Gg/yr (1.1 x lo8 lb/yr) is the largest producer of MA. percent of its capacity. is consumed captively to produce fumaric acid, maleate/ fumerate esters, styrene copolymers, and ethylene-maleic anhydride copolymers. Monsanto has announced plans to build a new n-butane-based MA facility at Pensacola, Florida.
Their 23-Gg/yr (5.1 x lo7 lb/yr) Houston facility was designed by Scientific Design Company, Inc., and was purchased from Petrotex Chemical Corporation by a Japanese firm, July 1, 1977.6 The feedstock now used is benzene.
Reichhold's combined production from both plants, at Elizabeth, New Jersey, and Morris, Illinois, is 45 Gg/yr (9.9 x lo7 lb/ yr), 20 percent of which is used captively to produce unsatu- rated polyester resins, alkyd resins, and plasticizers.5
Less than 20 percent of their 12-Gg/yr (2.6 x lo7 lb/yr) MA production is used captively to produce fumaric acid, dibutyl maleate, and dodecanylsuccinic anhydride.
Their MA capacity was recently expanded to 36 Gg/yr (7.9 x lo7 lb/yr). is used captively to produce fumaric acid, dibutyl maleate, and dioctyl maleate.5
lb) each for Amoco and
The company uses n-butane feedstocks for about 20 Approximately 25 percent of the MA
DENKA, USA
Reichhold Chemicals, Inc.
Tenneco Chemical, Inc.
United States Steel Corporation
Approximately 20 percent of their MA production
7 The expansion capabilities of 14 Gg (3.1 x 10 Ashland represent a current potential nationwide capacity of 267 Gg (58.9 x
lo7 lb).' 5.2.2 MA Usage and Demand
Maleic anhydride is an important raw material i n the production of polyester resins, agricultural chemicals, lubricants, fumaric acid, copoly- mers, and other intermediate raw materials. Table 5-2 breaks out these categories by percentage and growth rates. Demand for MA has increased historically at a rate of 9 percent a year and is expected to grow at a rate of 6 to 11 percent over the next 5 years.' A major reason for the excess capacity is investor confidence that MA demand will be strong.
The predominant end use of MA is the production of unsaturated poly- ester resins, which go into reinforced plastic applications such as marine
5-7
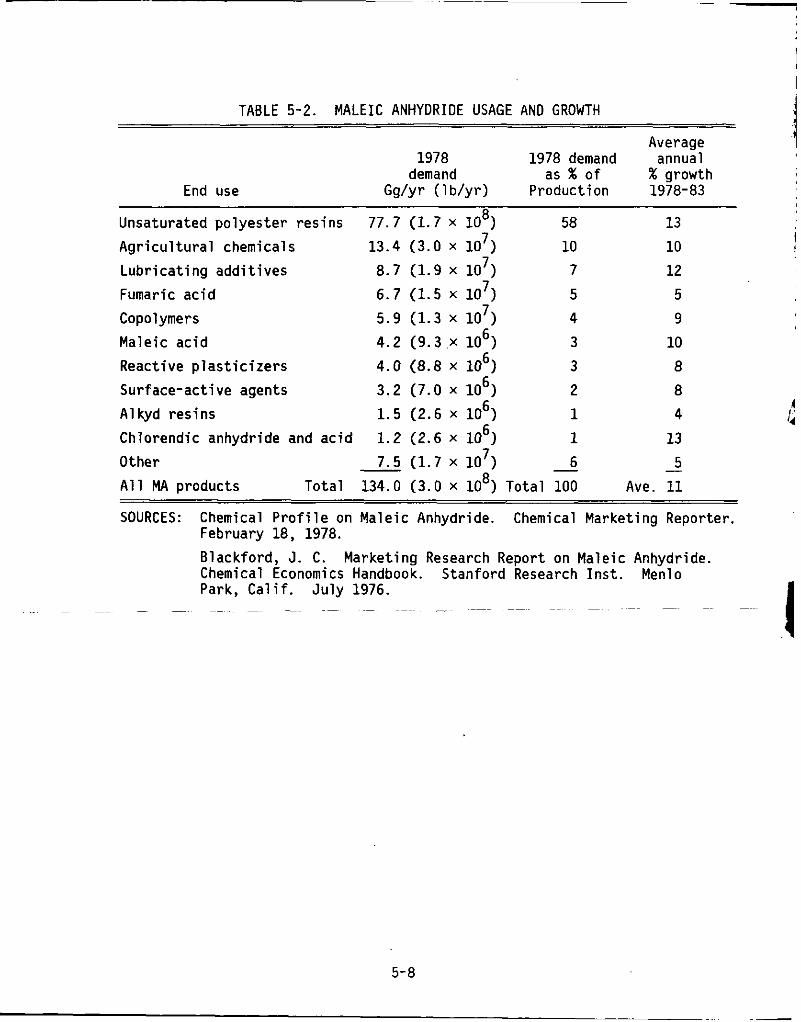
TABLE 5-2. MALEIC ANHYDRIDE USAGE AND GROWTH
Average 1978 1978 demand annual
demand as % o f % growth End use Gg/yr ( 1 b /y r ) Product ion 1978-83
Unsaturated p o l y e s t e r res ins 77.7 (1.7 x lo8) 58 13 j A g r i c u l t u r a l chemicals 13.4 (3.0 x lo7) 10 10 II
L u b r i c a t i n g a d d i t i v e s 8.7 (1.9 x lo7) 7 12 Fumaric a c i d 6.7 (1.5 x lo7) 5 5
Copolymers 5.9 (1.3 lo7) 4 9 Male ic a c i d 4.2 (9.3 .x lo6) 3 10
Alkyd res ins 1.5 (2.6 x lo6) 1 4 4
Other 7.5 (1.7 lo7) -
Reactive p l a s t i c i z e r s 4.0 (8.8 x lo6) 3 8 Surface-act ive agents 3.2 (7.0 x lo6) 2 8
Chlorendic anhydride and a c i d 1.2 (2.6 x lo6) 1 13 5
A l l MA products To ta l 134.0 (3.0 x lo8) To ta l 100 Ave. 11
4
- 6
SOURCES: Chemical P r o f i l e on Male ic Anhydride. Chemical Market ing Reporter. February 18, 1978. Black ford , J. C. ,Market ing Research Report on Male ic Anhydride. Chemical Economics Handbook. S tan ford Research I n s t . Menlo Park, C a l i f . July 1976.
~~~~ ~~~ ~~ ~~ ~~ ~~~~ ~~ ~~~~~~ ~~~ ~~ ~- ~~ -~ ~~~
5-8
c r a f t , b u i l d i n g panels, automobiles, tanks, and pipes.
x 10
58 percent (78 Gg C17.0 x l o 7 l b ] ) . p roduc t ion t o grow a t an annual r a t e of 10 t o 15 percent.
would double t h i s i n d u s t r y ' s use o f male ic anhydride by 1981 t o about 156 Gg (34.4 x 10 1b)--or more, i f p o t e n t i a l po l yes te r markets i n housing,
marine c r a f t , and autos m a t e r i a l i z e . Automobile manufacturers, s t r i v i n g t o
l i g h t e n products i n order t o meet Congress ional ly mandated f u e l economy
standards, a re t u r n i n g more and more t o po l yes te r w i t h above average maleic
content t o rep lace heavier metal 5 . l
f o r MA, as i n t h e produc t ion o f p o l y e s t e r res ins .
market (10 percent o f demand), i s expected t o grow a t a r a t e almost as r a p i d as po lyes te r res ins .
M A ' s use as a feedstock f o r a g r i c u l t u r a l pes t i c ides . c a l s can s u b s t i t u t e f o r MA as an a g r i c u l t u r a l chemical, MA i s h i g h l y competi-
t i v e i n t h i s market.
O f t h e 134 Gg (30.0 7 l b ) o f male ic anhydride produced i n 1978, po l yes te r res ins consumed
I n d u s t r y fo recas ters expect po l yes te r The growth r a t e
7
Present ly , no chemical can s u b s t i t u t e
The a g r i c u l t u r a l chemicals' market, which i s t h e second l a r g e s t MA
Th is growth cou ld be f u r t h e r accelerated by Although o the r chemi-
1
Other markets, such as l u b r i c a n t s , ma le ic anhydride copolymers, fumaric acid, and r e a c t i v e p l a s t i c i z e r s a re expected t o grow a t e i t h e r modest o r
r a p i d r a t e s i n t h e nex t 5 years.
More than 15 percent o f U.S. markets l i e i n each o f t h e f o l l o w i n g regions:
Middle Eastern, South Eastern, Western South Centra l , and Eastern Nor th
Centra l .7 w h i l e a g r i c u l t u r a l chemicals and fumaric a c i d are most ly produced i n t h e
East. product and can be s o l d i n any o f t h e markets mentioned above.
5.2.3 Pr ices
I n per iods o f excess capaci ty , MA i s n o t considered a reg iona l product.
Po lyes ter res ins a re p r i m a r i l y produced i n the Centra l States,
Al though these geographic tendencies e x i s t , MA i s a homogeneous
5.2.3.1 P r i c e o f MA. H i s t o r i c a l l y , p r i c e s o f male ic anhydride have
f l u c t u a t e d w ide ly (F igure 5-3); i t s o l d a t 37.44/kg (17.OU/lb) i n 1971 and
a t 28U/kg (12.79U/lb) i n 1972. I n these years, t he re was a small d i f - ference between t h e p r i c e costed by t h e producer ( l i s t p r i c e ) and the p r i c e
rece ived (ac tua l p r i c e ) . But a t t h e end o f 1973, the MA p r i c e began t o
r i s e , i n l a r g e p a r t due t o increased benzene p r i ces .
s t e a d i l y u n t i l they l eve led o f f a t 81.44 (37.OU/lb) per molten k i logram and
L i s t p r i c e s climbed
5-9
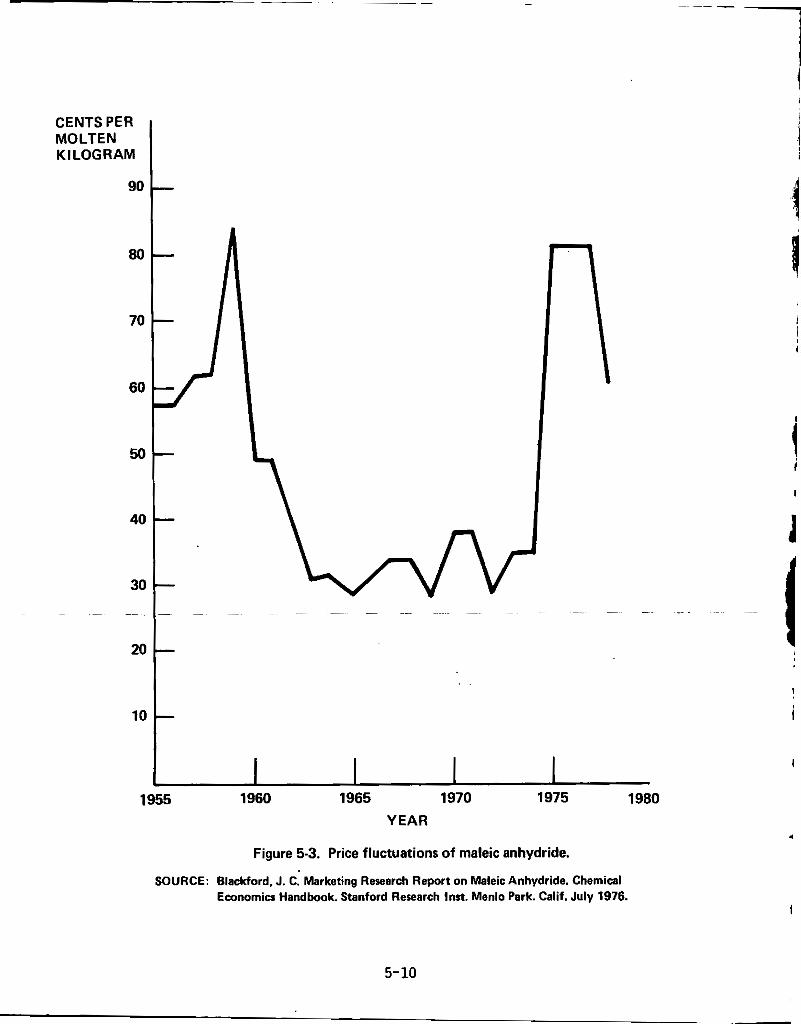
c CENTS PER MOLTEN KILOGRAM
90
80
70
60
50
40
30
~~~
20
10
1960 1965 1970 1975 1980 1955 YEAR
Figure 5-3. Price fluctuations of maleic anhydride.
SOURCE: Blackford. J. C. Marketing Research Report on Maleic Anhydride. Chemical Economics Handbook. Stanford Research Inst. Menlo Park. Calif. July 1976.
5-10
90.24 per bagged kilogram (41.0C/lb). l .Actual pr ices began t o f a l l i n 1977, level ing off a t 61.7U/kg (28.OU/lb) per molten kilogram. held u n t i l t he spring of 1979, a t which time actual pr ices rose t o 88C/kg (40.0U/lb).8 The a b i l t y of producers t o r a i se pr ices t h i s year has been a t t r i b u t e d t o increased MA demand and higher production c o s t s , caused primarily by t h e soaring pr ices of benzene feedstock.
accounted f o r 40 t o 50 percent of t he f i n a l p r i c e , b u t t he quadrupling of world o i l p r ices a l t e r e d th i s re la t ionship . u p a 43- t o 57-percent share o f t h e production p r i c e , and t h i s share wi l l r i s e w i t h increases i n o i l prices.’ feedstock led t o a s much as a 7.34 reduction per kilogram of MA produced ( 3 . 3 W b ) below benzene feedstock costs.’ Since then, t h e p r i c e of benzene has increased a t a f a s t e r r a t e than the p r i c e of n-butane. T h u s , t he c o s t d i f f e r e n t i a l between the two feedstocks has widened. I f t h i s trend contin- ues, i t may be economically favorable t o use n-butane a s t h e primary MA
feedstock.
T h i s pr ice
8 In July 1979, MA prices rose once again t o 96.8U/kg (43.9U/lb).
i
5.2.3.2 Feedstock Costs. Tradi t iona l ly , c o s t s f o r benzene feedstock
Feedstock c o s t s present ly make
In 1978, the use of n-butane a s a
5 .2 .3 .3 Transportation Costs. MA i s usually transported by truck or by t r a i n . has varied h i s t o r i c a l l y t o w i t h i n a few cen t s . cent per kilogram cheaper t o t ranspor t maleic by t r a i n than by truck. However, a c l i e n t must purchase a t l e a s t 45,000 kg (1 x 10 the amount needed t o f i l l a tank c a r , t o make t ranspor ta t ion by t r a i n prac- t i c a l . whereas the cos ts f o r t ruck t ranspor t averaged O.OlU/kg/mi.
producers t o charge customers equal t ranspor ta t ion cos ts regardless of location. T h u s , t he p r i c e paid by the customer wi l l frequently not cover the actual c o s t of t ransportat ion. Domestic producers hope, however, t h a t a s MA market conditions improve, they can s h i f t t he c o s t of t ransportat ion from themselves t o the customer. 5.2.4 Briquettes v s . Molten MA
molten MA users.
The p r i c e f o r t ransport ing MA t o i t s markets around t h e country I t i s several tenths of a
5 lb ) of maleic,
In 1978, cos ts f o r t ransport ing MA by t r a i n averaged 0.005U/kg/mi, 10
During periods of excess capaci ty , i t i s a common prac t ice among
The MA market can be segmented i n t o two par ts--br iquet te users and A typical b r ique t te user i s much smaller t h a n a niolten
5-11
5 user and can n e i t h e r buy i n b u l k ( i . e . , 45,000 kg [l x 10
ca r ) nor a f f o r d l i q u i d storage f a c i l i t i e s , even though b r i q u e t t e s normal ly
cos t 6.54 t o 94/kg (3.04 t o 4 .1Wlb ) more than the molten form and r e q u i r e up t o 4.54/kg (2.04/ lb) t o me l t down before use.”
cannot be s to red f o r per iods longer than about 60 days because they begin
t o emi t gases. B r ique t tes would be purchased by l a r g e users on ly i n abnormal circum-
stances where f o r e i g n sources o f b r i q u e t t e s tempora r i l y undercut molten MA p r i c e s by more than t h e cos t o f m e l t i n g down the MA.11 occurred r e c e n t l y and w i l l be discussed i n t h e f o l l o w i n g subsect ion on
impor ts .
sh ip between domestic p roduc t ion and demand and imports.
i s i n t h e form o f b r i q u e t t e s s ince mol ten MA cannot be t ranspor ted overseas.
I n 1978, impor ts accounted f o r l e s s than 1 percent o f t h e U.S. MA market
b u t nea r l y 20 percent o f the U.S. b r i q u e t t e market (see F igure 5-5).
impor ts c o n t r i b u t e d t o t h e drop i n p r i c e o f domestic b r i q u e t t e s from 904 t o
754/kg (40.94 t o 34.14/lb) and the reduc t i on o f molten MA p r i c e s from 81.44
t o 61.74/kg (36.94 t o 28.OWlb).
e d l y t h e main f a c t o r f o r t h i s p r i c e drop, b r i q u e t t e s were tempora r i l y
almost 44/Kg (1.8$/1 b)-Zheaper t o buy and me1 t-down than the-mol t e n form.
The low p r i c e o f MA imported i n 1977 was a t t r i b u t e d t o two poss ib le fac to rs :
l b ] ) per tank
I n a d d i t i o n , b r i q u e t t e s
11
This a c t u a l l y
5.2.4.1 Impor ts O f Male ic Anhydride. F igure 5-4 shows the r e l a t i o n -
A l l imported MA
I n 1977, MA impor ts posed problems f o r U.S. producers. That year ,
Al though domestic overcapaci ty was undoubt-
11
- Fore ign MA companies have excess capaci ty , so they purposely undercut U.S. p r i c e s i n o rde r t o a t t r a c t business; and
Because many f o r e i g n companies may be p a r t i a l l y subs id ized by t h e i r governments, they can a f f o r d t o s e l l a t minimal o r no opera t ing p r o f i t .
I n 1978, the q u a n t i t y o f impor ted MA dec l ined considerably , from
3.5 Gg (7.6 x l o 6 l b ) i n 1977 t o 1.0 Gg (2.3 x l o 6 l b ) i n 1978.”
equa l l y s i g n i f i c a n t f a c t o r s c o n t r i b u t e d t o t h i s reduc t ion .
p r i c e s have r i s e n abroad. Although benzene p r i ces have increased domestic- a l l y as w e l l , f o r e i g n benzene p r i c e s have h i s t o r i c a l l y been and cont inue t o
be higher. Second, demand f o r MA has r i s e n abroad. MA producers have been a b l e t o increase the p r i ces they charge t h e i r custo-
Several
F i r s t , benzene
Consequently, f o r e i g n
5-12
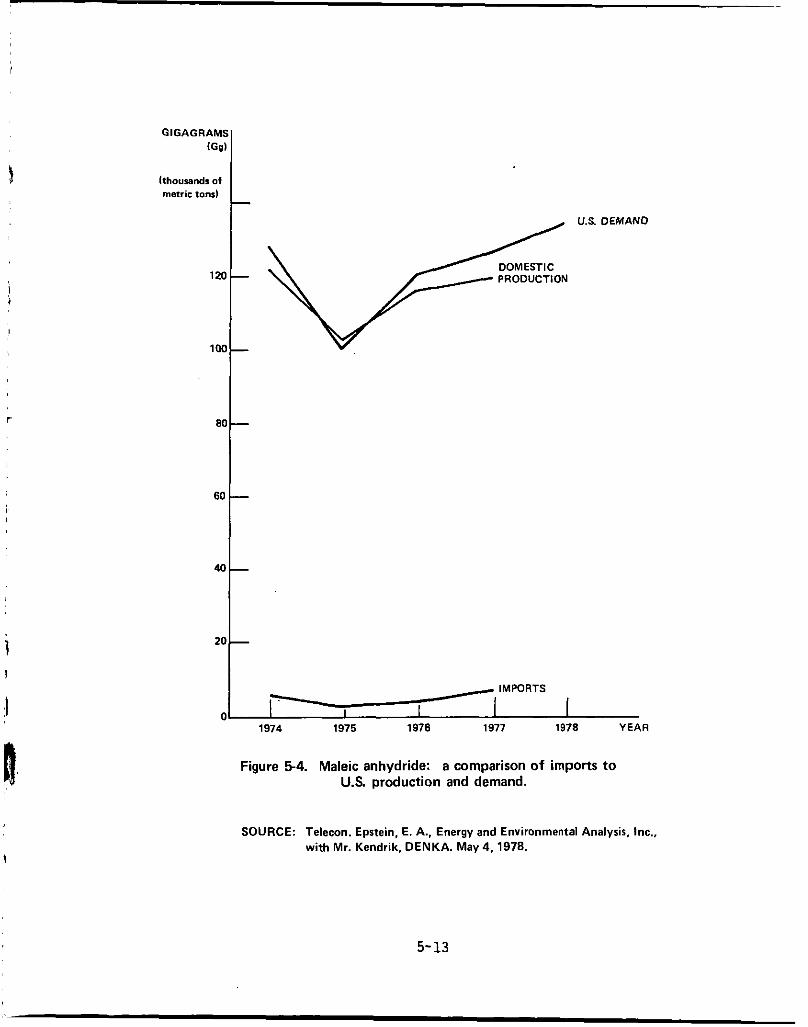
GlGAGRAMSl
IG0’ I c [thousands of metric ton4
US. OEMANO
DOMESTIC PRODUCTION
1w
60
1974 1975 1978 1977 1978 YEAR
Figure 54. Maleic anhydride: a comparison of imports to U.S production and demand.
SOURCE: Telecon. Epstein, E. A.. Energy and Environmental Analysis. h e . , with Mr. Kendrik, DENKA. May 4,1978.
5- 13
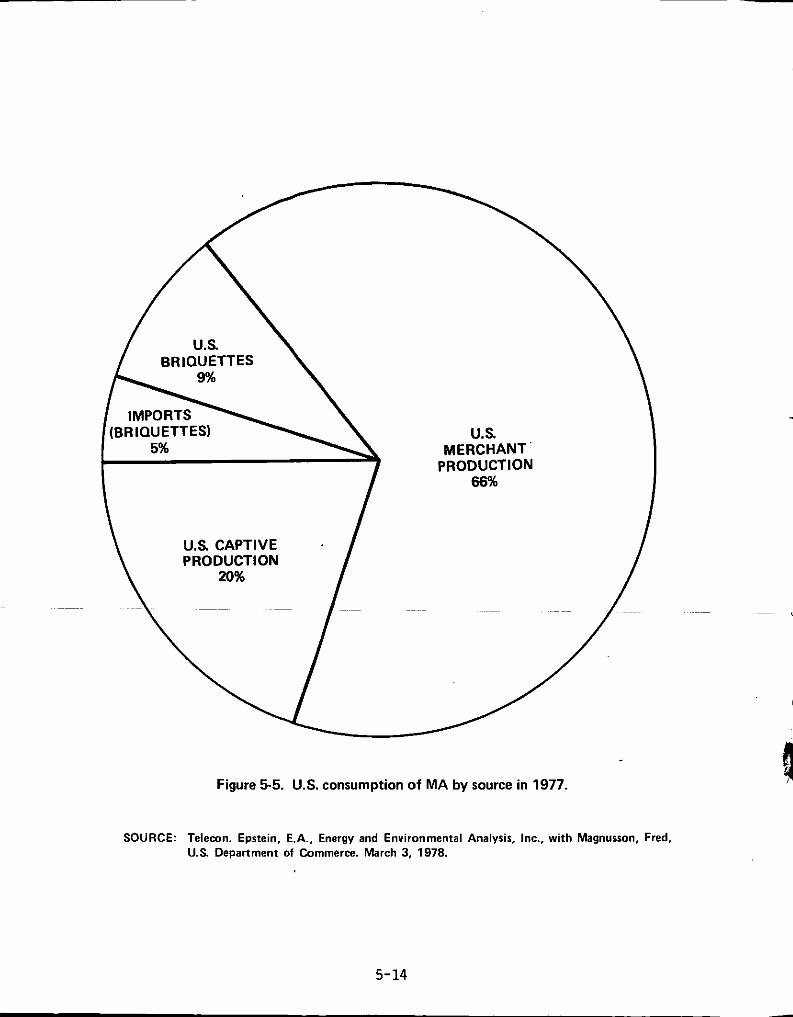
Figure 5-5. U.S. consumption of MA by source in 1977.
SOURCE: Telemn. Eprtein, E.A., Energy and Environmental Analysis, Inc., with Magnurron, Fred, U S . Department of Commerce. March 3, 1978.
5-14
mers as w e l l as decrease t h e i r surp lus supp l ies o f MA.
have brought f o r e i g n p r i c e s c l o s e r i n l i n e wi th domestic p r i ces , thereby
reducing the l i k e l i h o o d t h a t f o r e i g n p r i c e s w i l l cont inue t o undercut t h e domestic market.
These p r i c e increases
A t present, equal q u a n t i t i e s o f butene (C4)-based MA from Korea and
Japan and benzene-based MA from Mexico and I t a l y are c u r r e n t l y be ing imported. O f these, t h e C4-based MA has the most favorab le duty--6 percent ad valorem.
Some domestic producers f e a r t h a t t h i s percentage i s not h igh enough t o
keep l a r g e amounts o f C4-based MA from be ing imported i n t h e f u t u r e a t
cons iderably lower than c u r r e n t p r i ces .
3.8Wkg (1 .7Wlb) p lus 12.5 percent ad valorem. P r i o r t o 1968, the r a t e
was 7.7Q/kg (3.50/lb) p lus 25 percent ad valorem; t h e du ty , though lower, i s s t i l l s i g n i f i c a n t .
Imports o f benzenoid products from less developed coun t r i es (LDC's)
are du ty f ree , however, under t h e general system o f impor t preferences.
This means t h a t impor ts from Mexico and Korea are n o t sub jec t t o du ty as long as a t l e a s t 35 percent o f t h e va lue o f t h e i r product comes from t h a t
country. ' l Th is ra i ses t h e p o s s i b i l i t y t h a t expor te rs might t r y t o conceal the ac tua l o r i g i n o f some MA impor ts t o o b t a i n a low duty r a t e o r avo id i t
a l toge the r . o f MA t o t h e Un i ted States have no duty.
5.3 COST ANALYSIS OF ALTERNATIVE EMISSION CONTROL SYSTEMS 5 . 3 . 1 I n t r o d u c t i o n
The impor t r a t e o f du ty on benzene-derived products i s p resen t l y
12
The more impor tant observa t ion i s t h a t the two l a r g e s t expor ters
This sec t i on presents costs f o r c o n t r o l l i n g and mon i to r ing benzene
emissions, where necessary, a t each o f t h e e i g h t e x i s t i n g maleic anhydride
p lan ts us ing benzene as a feedstock. For each p l a n t , two k inds o f add-on
c o n t r o l systems have been examined: thermal i n c i n e r a t i o n w i t h pr imary heat
recovery and carbon adsorpt ion. c o n t r o l leve ls - -97 and 99 percent--have been costed. Mon i to r ing costs have
no t been incorpora ted i n t o the investment cos ts associated w i t h each c o n t r o l
system. They are discussed l a t e r i n t h i s sect ion.
For each system, two benzene emission
5-15
5.3.2 Summary of Technical Parameters Used as the Basis in Cost Analysis This section summarizes the assumptions used in developing control
costs at the 97- and 99-percent control level for eight maleic anhydride plants. liminary estimates (t30 percent). capacity was the only plant-specific parameter taken into consideration. To develop definite costs for an actual installation, a detailed engineer- ing evaluation is required. Such an evaluation is beyond the resources and scope o f this document.
The efficiencies and other parameters used in determining cost for the control methods in this analysis are listed in Table 5-3. these parameters vary from plant to plant, expressions have been derived in terms of plant capacity, Because benzene-fed maleic anhydride plants have similar process designs,6 it has been assumed that the gas volumetric flow rate and the benzene emission rate vary i n proportion to plant capacity.
each plant follow:
It should be recognized, however, that these costs are only pre- When these costs were developed, plant
Because some of
"P," for the sake of brevity.
Other assumptions used in determining cost for the add-on systems for
- Intensive stream parameters, such as gas pressure and tempera- ture, are the same for all plants; No credit is given for control equipment used in an existing plant, unless the controls already achieve the alternative ~ in
~ ~ - -question (i. ex-97 o r 99 percent) ; ~
All control system installations are retrofits, whose costs include retrofit penalties of 40 and 30 percent of the new plant installation cost for incinerator and carbon adsorption systems, respectively.6 (These moderate penalties, in turn, reflect the fact that the costs of retrofitted systems are only somewhat greater than those for completely new plant installations. The primary retrofit difficulty may be finding adequate space to fit the control system into the existing plant layout.)
In addition to developing control costs for the various maleic anhy- dride plants, costs were developed for continuous monitoring of benzene stack emissions. auxiliary equipment including air sampler, data processor, and piping.
The add-on control costs have been based primarily on data available from an EPA contractor, Hydroscience, Inc. ,6 and a compendium of costs for selected air pollution control systems. l3 Monitoring costs were obtained from a vendor.
The device costed is a gas chromatograph with appropriate
14
5-16
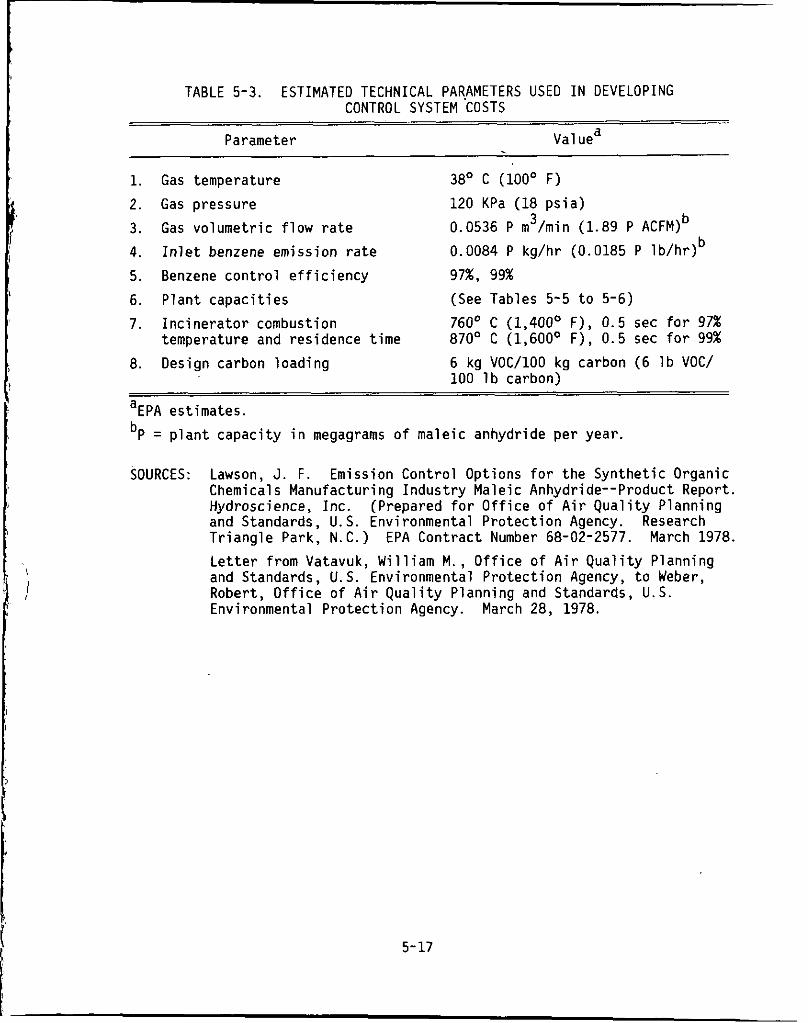
TABLE 5-3. ESTIMATED TECHNICAL PARAMETERS USED I N DEVELOPING CONTROL SYSTEM COSTS
Parameter Val uea - 1. Gas temperature 38' C (100' F)
2. Gas pressure 3. Gas vo lumetr ic f l o w r a t e
120 KPa (18 ps ia ) 0.0536 P m3/min (1.89 P ACFMlb
4. I n l e t benzene emission r a t e 0.0084 P kg/hr (0.0185 P l b /h r )b
5. Benzene c o n t r o l e f f i c i e n c y 97%, 99% 6. P lan t c a p a c i t i e s (See Tables 5-5 t o 5-6)
7. I n c i n e r a t o r combustion 760' C (1,400' F), 0.5 sec f o r 97% 870' C (1,600' F), 0.5 sec f o r 99%
8. Design carbon load ing 6 kg V O C / l O O kg carbon ( 6 l b VOC/ 100 l b carbon)
temperature and residence t ime
a~~~ est imates.
bP = p l a n t capac i t y i n megagrams o f male ic anhydride p e r year.
SOURCES: Lawson, J. F. Emission Contro l Options f o r t he Syn the t i c Organic Chemicals Manufactur ing I n d u s t r y Maleic Anhydride--Product Report. Hydroscience, Inc. (Prepared f o r O f f i c e o f A i r Q u a l i t y Planning and Standards, U . S . Environmental P r o t e c t i o n Agency. Research T r i a n g l e Park, N.C.) EPA Contract Number 68-02-2577. March 1978. L e t t e r f rom Vatavuk, W i l l i a m M., O f f i c e o f A i r Q u a l i t y Planning and Standards, U.S. Environmental P r o t e c t i o n Agency, t o Weber, Robert, O f f i c e o f A i r Q u a l i t y Planning and Standards, U.S. Environmental P r o t e c t i o n Agency. March 28, 1978.
5-17
e
Two cost parameters--installed capital and total annual ized--have been evaluated in this analysis. The installed capital cost for each emission control system includes the purchased costs of the major and auxiliary equipment, costs for site preparation and equipment installation, and design engineering costs. research and development, possible lost production during equipment instal- lation, or losses during startup. section were developed in detail with cost parameters originally indexed to the fourth quarter of 1977. Because of rapid escalation of benzene and energy costs, the cost parameters were updated to the second quarter of 1979 without reoptimizing design parameters. are shown i n Table 5-4.
No attempt has been made to include costs for
Capital and operating costs in this
Both the older and later data
The total annualized cost (TAC) consists of direct operating costs, annualized capital charges, and recovery credits. (DOC) include fixed and variable annual costs, such as:
Labor and materials needed to operate control equipment;
Utilities, such as natural gas and electric power; and Liquid waste disposal.
Direct operating costs
* Maintenance labor and materials;
The annualized capital charges account for depreciation, interest, administrative overhead, property taxes, and insurance. interest have been computed by use of a capital recovery factor, thevalue of Nhich depends on the depreciable life of the control system and the annual interest rate (10 percent is used for the latter). Administrative overhead, taxes, and insurance have been fixed at an additional 4 percent of the installed capital cost.
by the control system. from the regenerated carbon beds, while a credit for natural gas is applied to thermal incineration systems with primary heat recovery.
operating costs to the annualized capital charges and subtracting the recovery credits from this sum.
Depreciation and ~~ - ~~
~~ ~~~
The recovery credits apply to the value o f material or energy recovered With carbon adsorption systems, benzene is recovered
Finally, the total annualized cost is obtained by adding the direct
5-18
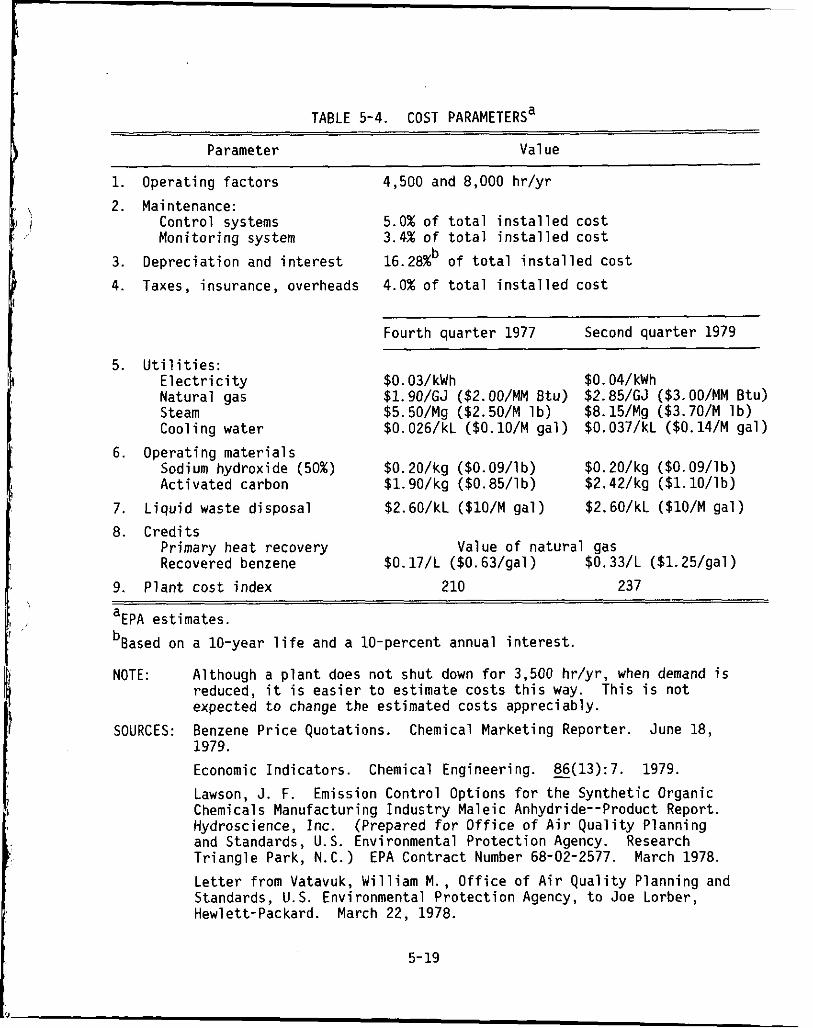
TABLE 5-4. COST PARA METERS^ Parameter Value
1. Operat ing f a c t o r s
2. Maintenance: Contro l systems Mon i to r i ng system
3. Deprec iat ion and i n t e r e s t
4. Taxes, insurance, overheads
5. U t i l i t i e s : E 1 ec tr i c i t y Natura l gas Steam Cool i ng water
Sodium hydroxide (50%) Ac t i va ted carbon
6. Operat ing m a t e r i a l s
7. L i q u i d waste disposal 8. C r e d i t s
Primary heat recovery Recovered benzene
9. P l a n t c o s t index
4,500 and 8,000 h r / y r
5.0% o f t o t a l i n s t a l l e d c o s t 3.4% o f t o t a l i n s t a l l e d c o s t
16.28%b o f t o t a l i n s t a l l e d c o s t
4.0% o f t o t a l i n s t a l l e d c o s t
Four th q u a r t e r 1977 Second quar te r 1979
$0.03/kWh $1.90/GJ ($Z.OO/MM B t u $5.50/Mg ($2.50/M 1 b) $0.026/kL ($O.lO/M ga l
$0.20/kg ($0.09/lb) $1.90/kg ($0.85/lb)
$2.60/kL ($10/M ga l )
$0.04/kWh $2.85/GJ ($3.OO/MM Btu) $8.15/Mg ($3.70/M 1 b) $0.037/kL ($0.14/M ga l )
$0.20/kg ($0.09/1 b) $2.42/kg ($1.10/1 b)
$2.60/kL ($lO/M ga l )
Value o f n a t u r a l gas
210 237
$0.17/L ($0.63/gal) $0.33/L ($1.25/gal)
a~~~ estimates.
bBased on a 10-year l i f e and a 10-percent annual i n t e r e s t .
NOTE: Although a p l a n t does n o t shut down f o r 3,500 hr /yr , when demand i s reduced, i t i s eas ie r t o est imate cos ts t h i s way. expected t o change t h e est imated costs appreciably.
1979. Economic I n d i c a t o r s . Chemical Engineering. 8&(13):7. 1979.
Lawson, J. F. Emission Contro l Options f o r t h e Syn the t i c Organic Chemicals Manufacturing I n d u s t r y Maleic Anhydride--Product Report. Hydroscience, I nc . (Prepared f o r O f f i c e o f A i r Q u a l i t y Planning and Standards, U.S. Environmental P r o t e c t i o n Agency. Research T r i a n g l e Park, N.C.) EPA Contract Number 68-02-2577. March 1978.
L e t t e r from Vatavuk, W i l l i a m M . , O f f i c e o f A i r Q u a l i t y Planning and Standards, U . S . Environmental P r o t e c t i o n Agency, t o Joe Lorber, Hewlett-Packard. March 2 2 , 1978.
This i s no t
SOURCES: Benzene P r i c e Quotat ions. Chemical Market ing Reporter. June 18,
5- 19
5.3.3 Control Costs f o r Maleic Anhydride F a c i l i t i e s
of t he e igh t benzene-fed maleic anhydride p l a n t s f o r the two regulatory options of 97 and 99 percent cont ro l . included because no new plan ts a r e an t ic ipa ted before 1983. The maleic
Costs fo r con t ro l l i ng benzene emissions have been developed fo r each
Only ex is t ing plant costs a r e
anhydride industry has been operating a t 56 percent capacity. Projected increases in demand could therefore be accommodated by increases in ope- r a t ing r a t e s over the next few years .
f o r reducing benzene emissions by 97 percent a r e shown in Tables 5-5a and 5-5b fo r the carbon adsorption and thermal incinerat ion control systems,
5 .3 .3 .1 Costs t o Achieve the 97-Percent Regulatory Option. The cos ts
respect ively. Of the e igh t p l an t s for which cos t s a re shown, the best information
ava i l ab le ind ica tes t h a t th ree (DENKA, Reichhold i n Elizabeth, N.J., and Koppers) already reduce t h e i r benzene emissions by a t l e a s t 97 percent. Therefore, the control cos t s a re indicated f o r only the f ive other p lan ts . Of t h e two control systems costed a t 97 percent , the carbon adsorption systems a r e inherent ly more complex and more expensive. systems have lower d i r e c t operating c o s t s , which a r e , a t mid-1979 pr ices f o r benzene, tempered by c r e d i t s f o r recovered benzene.
B u t the adsorption
As a r e s u l t , the t o t a l annualized cos t s a r e somewhat lower f o r the adsorption systems a t
5.3.3.2 Costs t o Achieve the 99-Percent Regulatory Option. Tables ~
f u l l capaci ty and nearly equal a t 4,500 hr/yr. ~ ~ ~
5-6a and 5-6b display respect ive control cos t s t o achieve 99 percent ben- zene emission reduction via carbon adsorption and thermal inc inera t ion , w i t h heat recovery. Except f o r the Koppers p l an t , a l l benzene-fed p lan ts require addi t ional control t o achieve t h i s leve l . Table 5-6b l i s t s cos t s f o r a thermal inc inera tor with primary heat recovery. As capacity increases from 11,800 t o 38,500 Mg/yr (26 t o 85 mil l ion lb /y r ) , the i n s t a l l e d cost increases from $0.78 mi l l ion t o $1.88 million--only s l i g h t l y more than the inc inera t ion capi ta l cos t s i n Table 5-5b, which were fo r 97 percent cont ro l . However, because of h i g h fuel cos t s , the d i r e c t operating cos ts for incinerat ion a t 99 percent control are s ign i f i can t ly higher than those f o r 97 percent cont ro l . $2.15 mil l ion/yr a t 8,000 hr/yr.
These cos t s range from about $0.68 t o
5-20
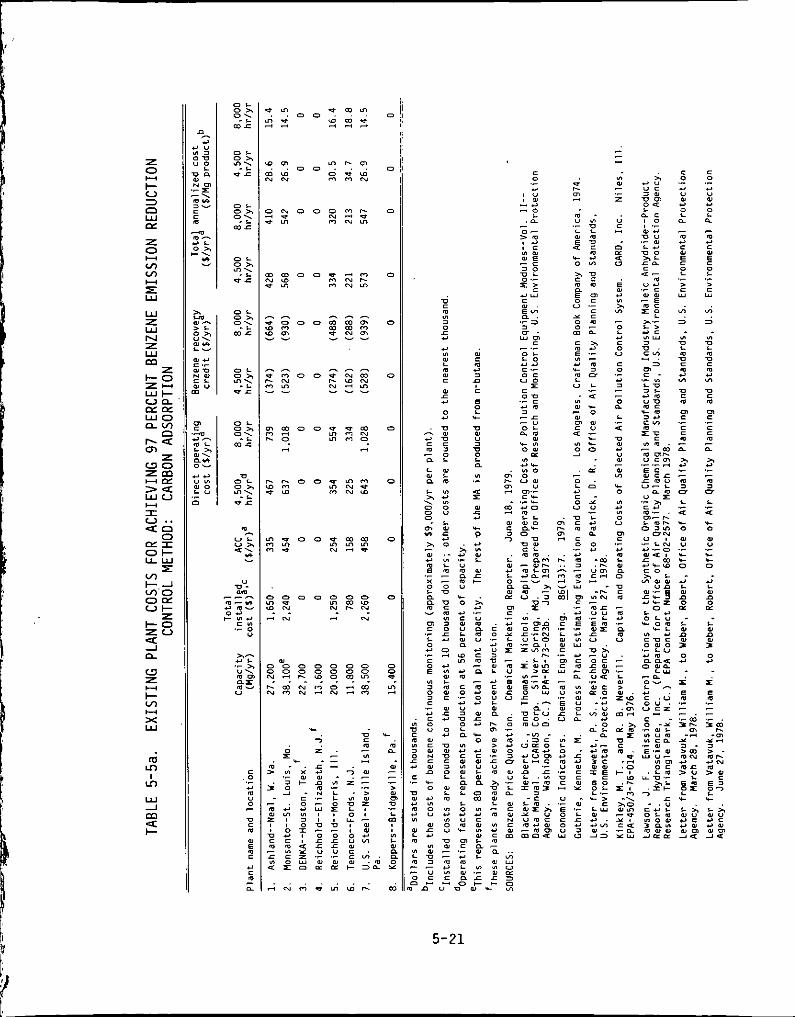
z E L 3 c3 W PI
z
v) v)
E
z Y
W z W N z W
z I-0 zu W +
= P I w o
- 4 cn z w o c l l l l > U w v I u .. 0
P I 1 O + u w r v) +-I v)'O 0- u+ z I-0 z u
m
un
nv) n
z m
CI
an
4 n c3 z + Ln b.4 x W
b.4
W LD
I Lo
W 1
4 + m
5-21
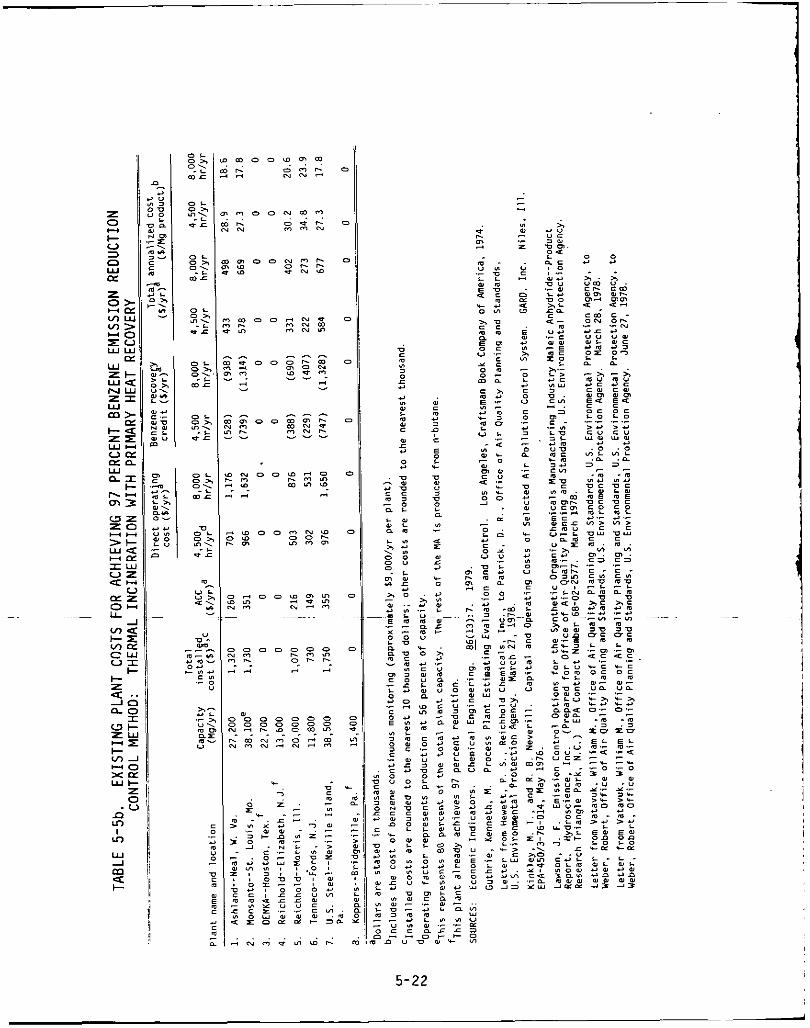
w /i 1 m il z I/
Ji 'i :'
I c
7
u Y
u L CL
5-22
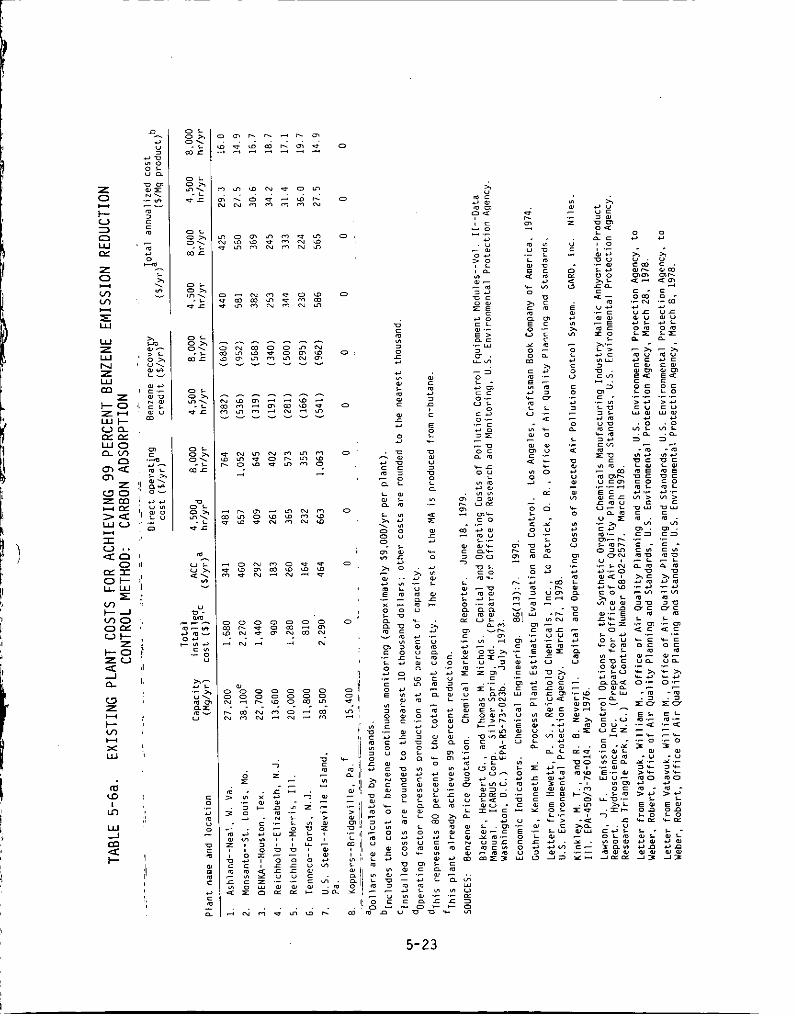
0
0
0
0
5-23
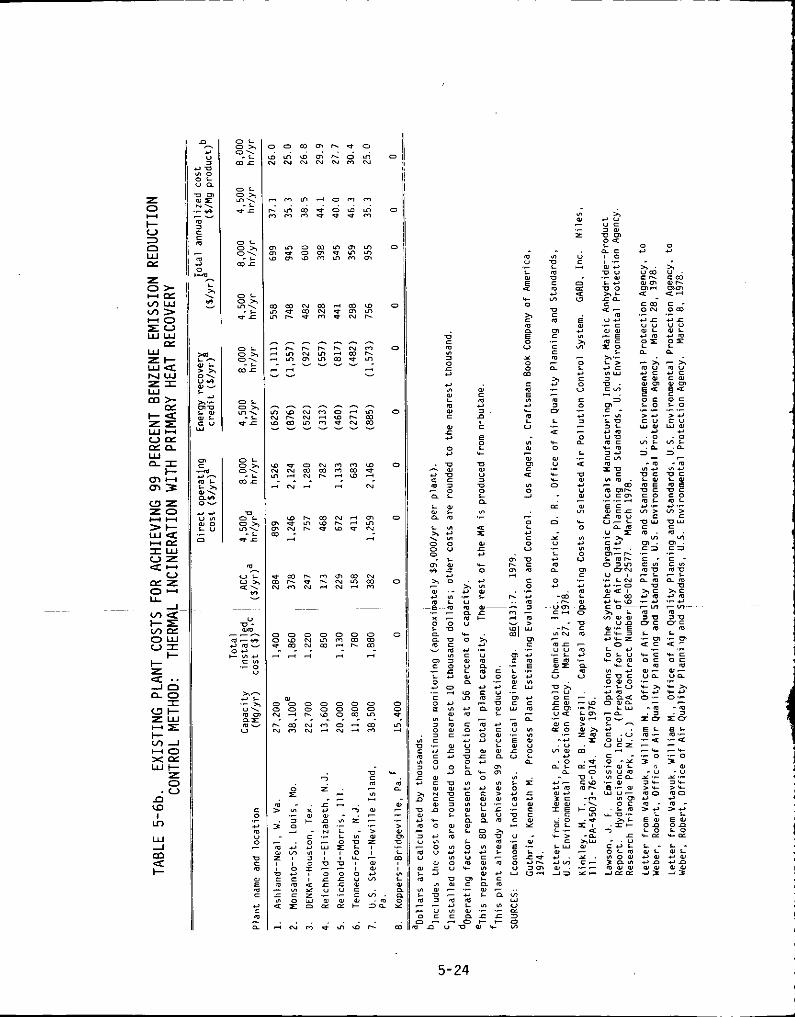
O L 0 2 .
m r 0. 2
O L o x m, .L * r
O L o x 0.2 m r
O L 0 2 m, .L * r
*
5-24
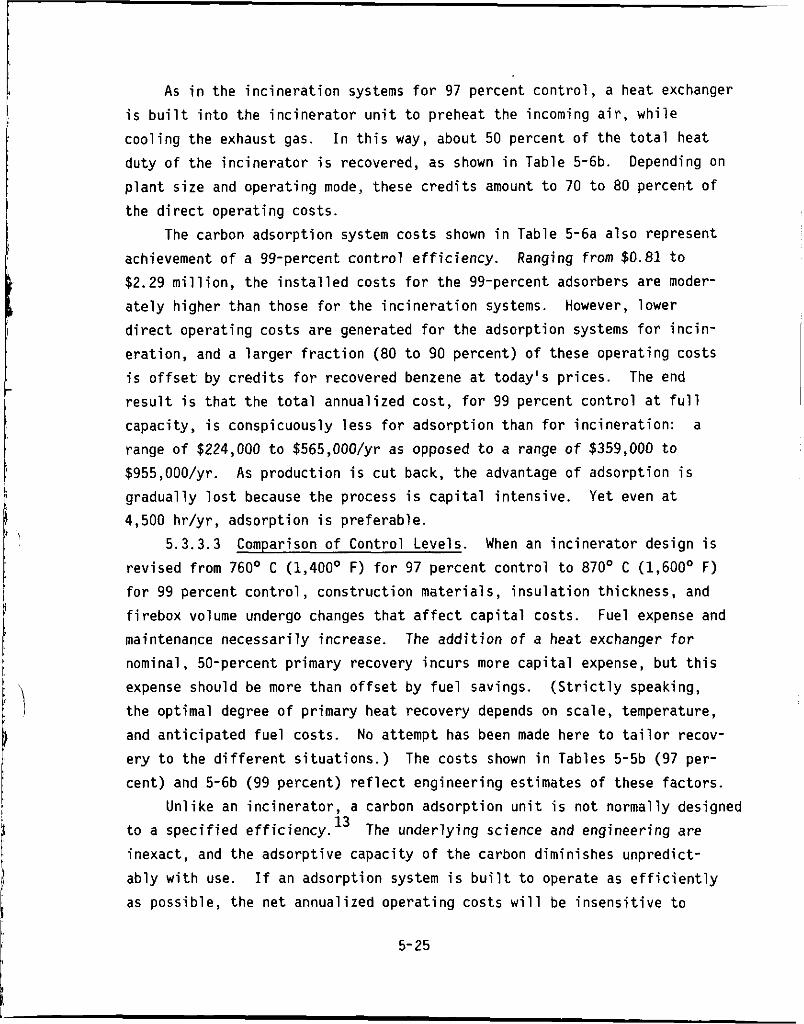
A s in the incineration systems for 97 percent control, a heat exchanger is built into the incinerator unit to preheat the incoming air, while cooling the exhaust gas. duty of the incinerator is recovered, as shown in Table 5-6b. plant size and operating mode, these credits amount to 70 to 80 percent of the direct operating costs.
The carbon adsorption system costs shown in Table 5-6a also represent achievement of a 99-percent control efficiency. $2.29 million, the installed costs for the 99-percent adsorbers are moder- ately higher than those for the incineration systems. However, lower direct operating costs are generated for the adsorption systems for incin- eration, and a larger fraction (80 to 90 percent) of these operating costs is offset by credits for recovered benzene at today's prices. result is that the total annualized cost, for 99 percent control at full capacity, is conspicuously less for adsorption than for incineration: a range of $224,000 to $565,00O/yr as opposed to a range of $359,000 to $955,00O/yr. gradually lost because the process is capital intensive. Yet even at 4,500 hr/yr, adsorption is preferable.
5.3.3.3 Comparison of Control Levels. When an incinerator design is revised from 760' C (1,400' F) for 97 percent control to 870' C (1,600' F) for 99 percent control, construction materials, insulation thickness, and firebox volume undergo changes that affect capital costs. Fuel expense and maintenance necessarily increase. nominal, 50-percent primary recovery incurs more capital expense, but this expense should be more than offset by fuel savings. the optimal degree of primary heat recovery depends on scale, temperature, and anticipated fuel costs. No attempt has been made here to tailor recov- ery to the different situations.) The costs shown in Tables 5-5b (97 per- cent) and 5-6b (99 percent) reflect engineering estimates of these factors.
Unlike an incinerator, a carbon adsorption unit is not normally designed to a specified efficiency.13 The underlying science and engineering are inexact, and the adsorptive capacity of the carbon diminishes unpredict- ably with use. as possible, the net annualized operating costs will be insensitive to
I n this way, about 50 percent of the total heat Depending on
Ranging from $0.81 to
The end
As production is cut back, the advantage of adsorption is
The addition of a heat exchanger for
(Strictly speaking,
If an adsorption system is built to operate as efficiently
5-25
c o n t r o l l e v e l . I t i s almost c e r t a i n , however, t h a t t h e e f f i c i e n c i e s requ i red
here are g rea te r than t h e economic optimum and t h a t 99 percent c o n t r o l
cos ts more than 97 percent con t ro l .
e x i s t t h a t would increase bo th c o n t r o l e f f i c i e n c y and cost .
t h i s e f f e c t mean ing fu l l y , i n the absence o f a s t r i c t design method, the
amount of carbon requ i red i s assumed t o be d i r e c t l y p ropor t i ona l t o the
des i red c o n t r o l e f f i c i e n c y . (C lear ly , t h i s assumption f a i l s a t 100 percent . )
The c a p i t a l and opera t ing cos t d i f f e r e n t i a l s between Tables 5-5a and 5-6a r e s u l t from t h i s assumption, bu t t h e end r e s u l t i s an annual ized cos t t h a t
i s a lmost unaf fec ted by the c o n t r o l l e v e l .
i n g o f benzene stack emissions from bo th t h e 97- and 99-percent emission contro1.s us ing a gas chromatograph wi th a flame i o n i z a t i o n de tec tor .
i n s t a l l e d cos t o f t h e chromatograph and i t s a u x i l i a r i e s i s $35,000.
i n g on t h e opera t i ng f a c t o r , the d i r e c t ope ra t i ng cos t va r ies from about
$1,450 t o $1,68O/yr. When t h e annual ized c a p i t a l charges are added, t h e
t o t a l annual ized c o s t amounts t o $8,600 and $8,80O/yr f o r t h e 4,500-1 and 8,000-hr/yr cases, respec t i ve l y . These cos ts a re r e l a t i v e l y low when com-
pared t o t h e c o n t r o l cos ts i n Tables 5-5 and 5-6, where t h e annual ized
mon i to r i ng c o s t has been rounded t o $9,000 f o r a l l cases.
5.3.4 Cost E f fec t i veness o f the A l t e r n a t i v e Emissions L i m i t s
C e r t a i n l y , design and opera t ing changes
To represent
5.3.3.4 Moni tor ing. Table 5-7 conta ins cos ts f o r cont inuous monitor-
The Depend-
For each o f t h e c o n t r o l methods costed t o achieve one o r more o f the
a l t e r n a t i v e emission l i m i t s considered, i t i s i n fo rma t i ve t o compare the
t o t a l annual ized cos t w i th the amount o f benzene removed. A convenient
y a r d s t i c k f o r expressing t h i s comparison i s the cos t -e f fec t i veness r a t i o ,
the q u o t i e n t o f the annual ized cos t and t h e q u a n t i t y o f benzene removed
annua l ly , expressed i n d o l l a r s per megagram o f benzene removed.
t a b l e , Table 5-8. Three kinds o f da ta a re shown: t o t a l annual ized cost ,
the amount of benzene removed annua l ly by t h e c o n t r o l method, and the
cos t -e f fec t i veness r a t i o . Because the t o t a l annual ized c o s t i s expressed
i n d o l l a r s per megagram o f maleic anhydr ide produced annual ly , two costs
are given:
capac i ty , o r 8,000 hr /y r .
These r a t i o s and o the r impor tant c o s t da ta appear i n t h e cos t summary
one computed a t 4,500 h r / y r ope ra t i ng f a c t o r , the o the r a t f u l l
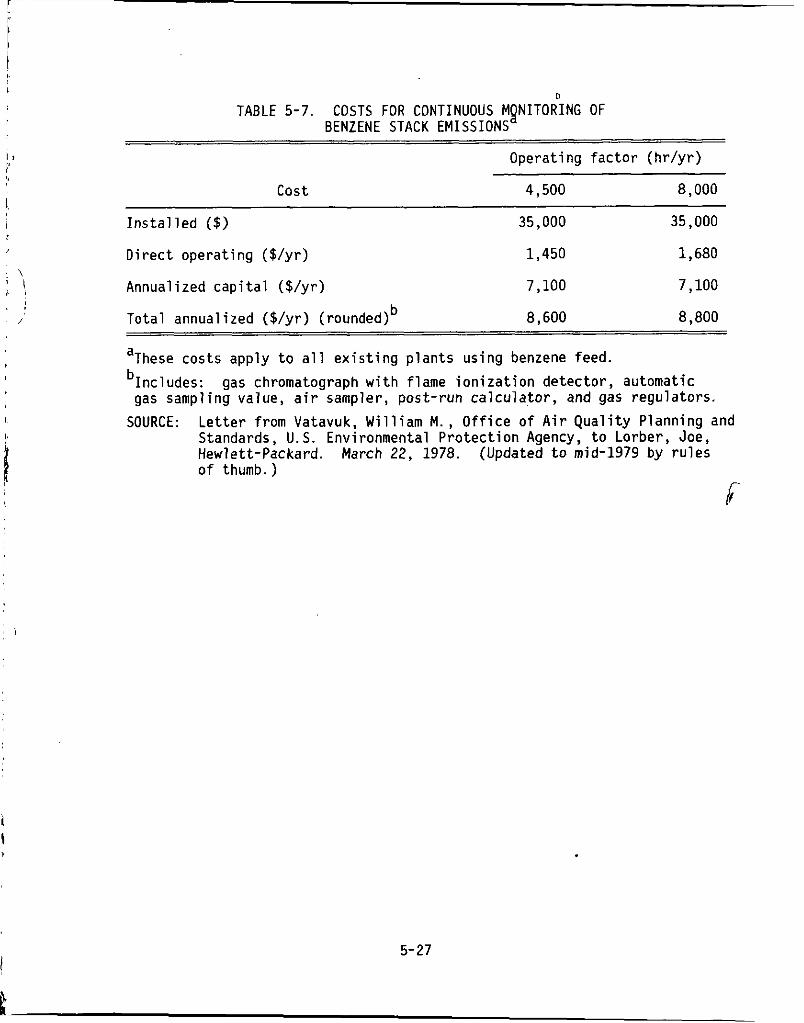
I.
D TABLE 5-7. COSTS FOR CONTINUOUS MgNITORING OF
BENZENE STACK EMISSIONS
Operating factor (hr/yr)
cost ~
4,500 8,000
Installed ($) 35,000 35,000
Direct operating ($/yr) 1,450 1,680
Annualized capital ($/yr) 7,100 7,100
8,600 8,800 Total annualized ($/yr) (rounded)
aThese costs apply to all existing plants using benzene feed. bIncludes:
SOURCE:
b
gas chromatograph with flame ionization detector, automatic gas sampling value, air sampler, post-run calculator, and gas regulators.
Letter from Vatavuk, William M . , Office of Air Quality Planning and Standards, U.S . Environmental Protection Agency, to Lorber, Joe, Hewlett-Packard. March 22, 1978. (Updated to mid-1979 by rules of thumb.)
li-
5- 27
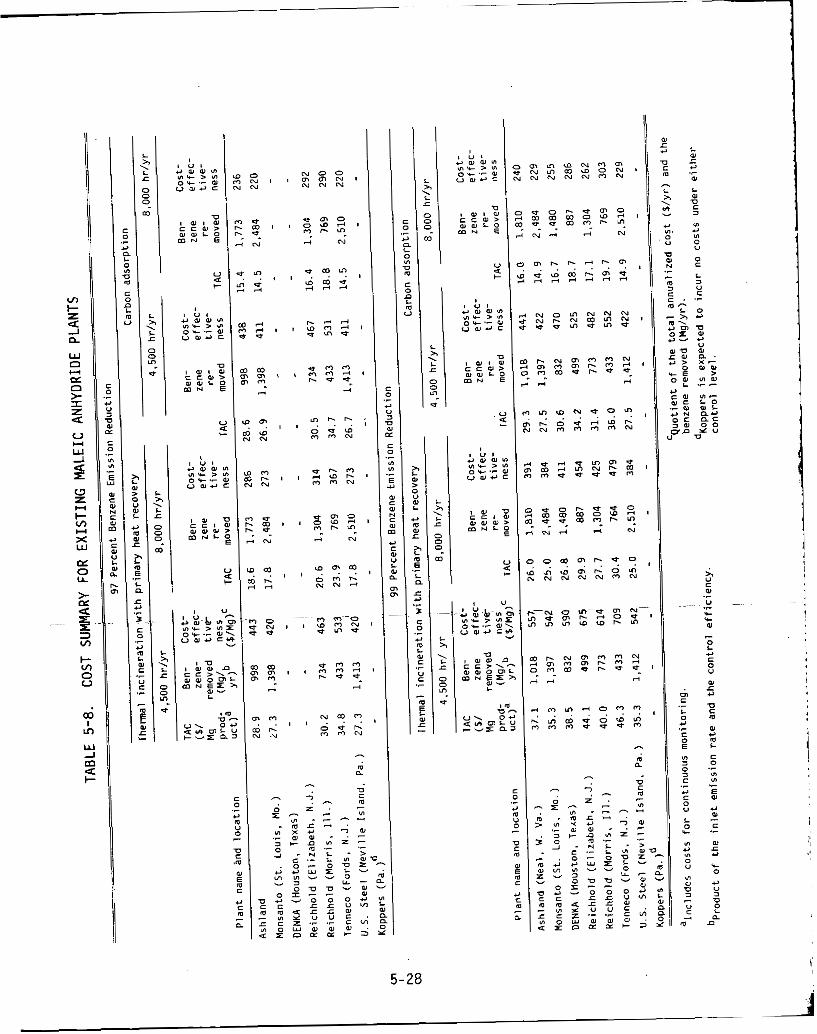
2 0
U .r .- L L 0
0 I. c c 0
-
5-28
4
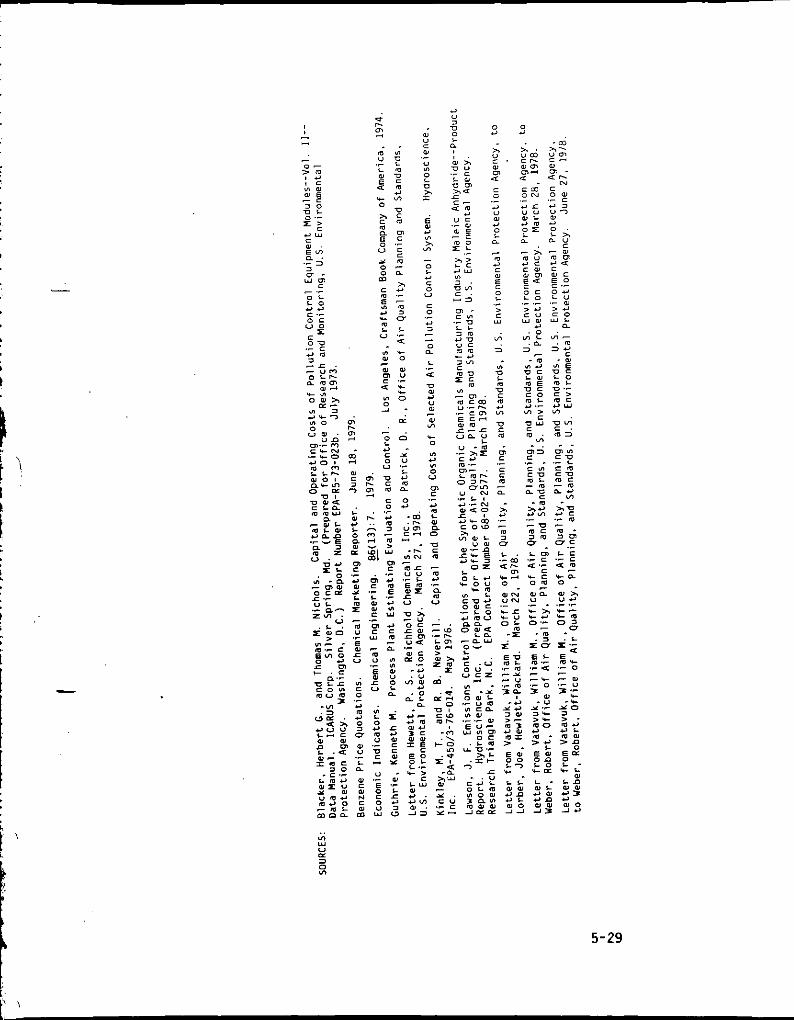
! . ’
5-29
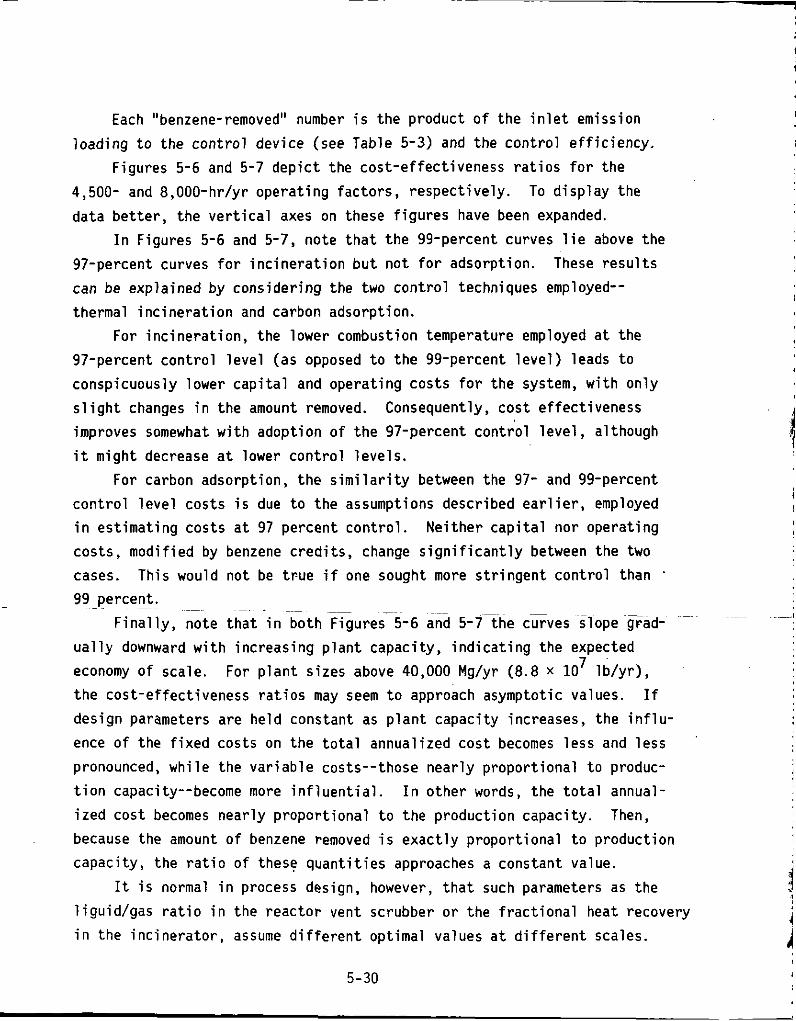
Each "benzene-removed" number i s t h e produc t o f t h e i n l e t emission
F igures 5-6 and 5-7 d e p i c t t h e cos t -e f fec t i veness r a t i o s f o r the
l oad ing t o t h e c o n t r o l dev ice (see Table 5-3) and t h e c o n t r o l e f f i c i e n c y .
4,500- and 8,000-hr/yr ope ra t i ng fac to rs , respec t i ve l y .
da ta b e t t e r , t h e v e r t i c a l axes on these f i g u r e s have been expanded.
97-percent curves f o r i n c i n e r a t i o n b u t n o t f o r adsorpt ion.
can be exp la ined by cons ider ing the two c o n t r o l techniques employed--
thermal i n c i n e r a t i o n and carbon adsorpt ion.
97-percent c o n t r o l l e v e l (as opposed t o t h e 99-percent l e v e l ) leads t o
conspicuously lower c a p i t a l and opera t ing cos ts f o r t h e system, w i t h on l y
s l i g h t changes i n t h e amount removed. improves somewhat w i t h adopt ion o f t h e 97-percent c o n t r o l l e v e l , a l though
i t might decrease a t lower c o n t r o l l eve l s .
For carbon adsorpt ion, t h e s i m i l a r i t y between the 97- and 99-percent c o n t r o l l e v e l cos ts i s due t o t h e assumptions descr ibed e a r l i e r , employed
i n es t ima t ing cos ts a t 97 percent c o n t r o l . Ne i the r c a p i t a l nor opera t ing
costs , mod i f ied by benzene c r e d i t s , change s i g n i f i c a n t l y between t h e two
cases. This would no t be t r u e i f one sought more s t r i n g e n t c o n t r o l than '
99 percent. ~
F i n a l l y , no te t h a t i n bo th F i ' gu re r5 -6 and 5 - 7 t h e curves s lope F a d -
u a l l y downward w i t h i nc reas ing p l a n t capaci ty , i n d i c a t i n g t h e expected
economy of sca le. t h e cos t -e f fec t i veness r a t i o s may seem t o approach asymptot ic values.
des ign parameters a re he ld constant as p l a n t capac i ty increases, t h e i n f l u - ence of the f i x e d costs on t h e t o t a l annual ized cos t becomes less and less
pronounced, w h i l e the v a r i a b l e costs- - those near l y p ropor t i ona l t o produc-
t i o n capacity--become more i n f l u e n t i a l . I n o the r words, t h e t o t a l annual-
i z e d cos t becomes near l y p r o p o r t i o n a l t o t h e produc t ion capaci ty .
because the amount o f benzene removed i s e x a c t l y p ropor t i ona l t o p roduc t ion capac i ty , the r a t i o o f these q u a n t i t i e s approaches a constant value.
l i gu id /gas r a t i o i n t h e r e a c t o r vent scrubber o r the f r a c t i o n a l heat recovery i n the i n c i n e r a t o r , assume d i f f e r e n t opt imal values a t d i f f e r e n t scales.
To d i s p l a y the
I n Figures 5-6 and 5-7, no te t h a t t h e 99-percent curves l i e above t h e These r e s u l t s
For i n c i n e r a t i o n , the lower combustion temperature employed a t t h e
Consequently, c o s t e f fec t i veness
~
~
~.
For p l a n t s izes above 40,000 Mg/yr (8.8 x l o 7 l b / y r ) , I f
Then,
I t i s normal i n process design, however, t h a t such parameters as t h e
I
~
5-30
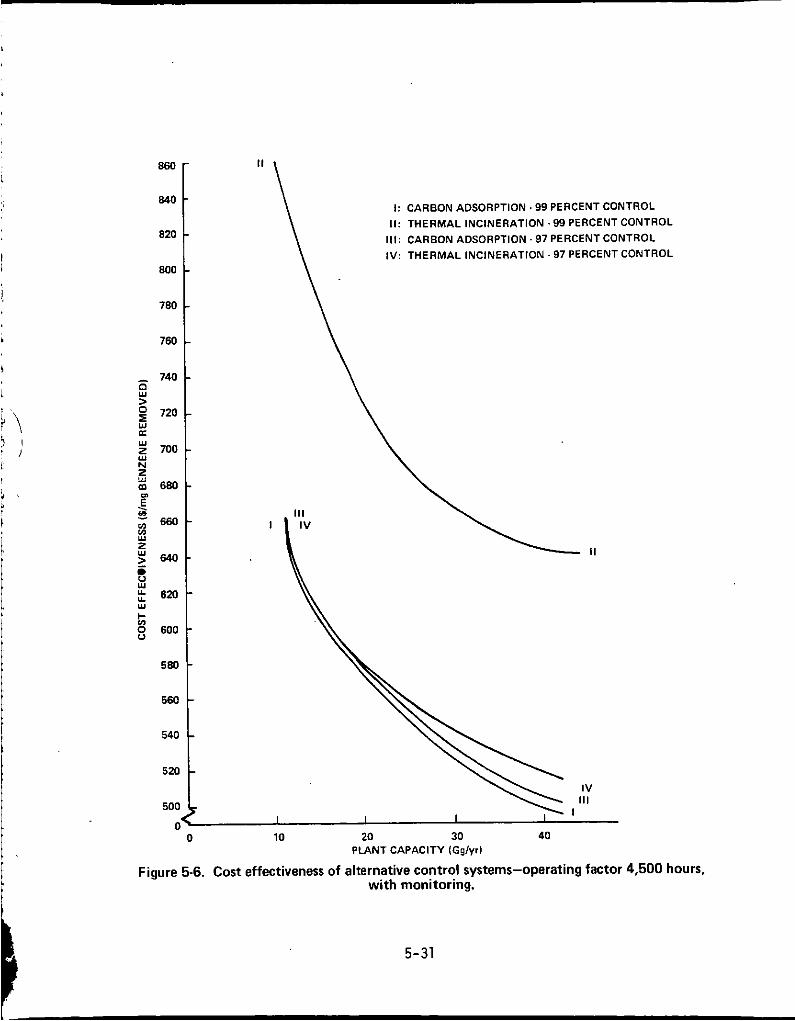
860
840
820
800
780
760
- 740
> E
z 720
U
700 N
680 D
660 5 w yf 2 : 6 4 0
:: k
620 w
8 600
58c
55(
54t
52(
501
i
I : CARBON ADSORPTION. 99 PERCENT CONTROL
II: THERMAL INCINERATION -99 PERCENTCONTROL 111: CARBON ADSORPTION. 97 PERCENT CONTROL
IV: THERMAL INCINERATION. 97 PERCENT CONTROL
I \ IV \ .
IV 111
10 20 30 40 PLANT CAPACITY IGg/yr)
Figure 5-6. Cost effectiveness of alternative control systems-operating factor 4,500 hours, with monitoring.
5-31
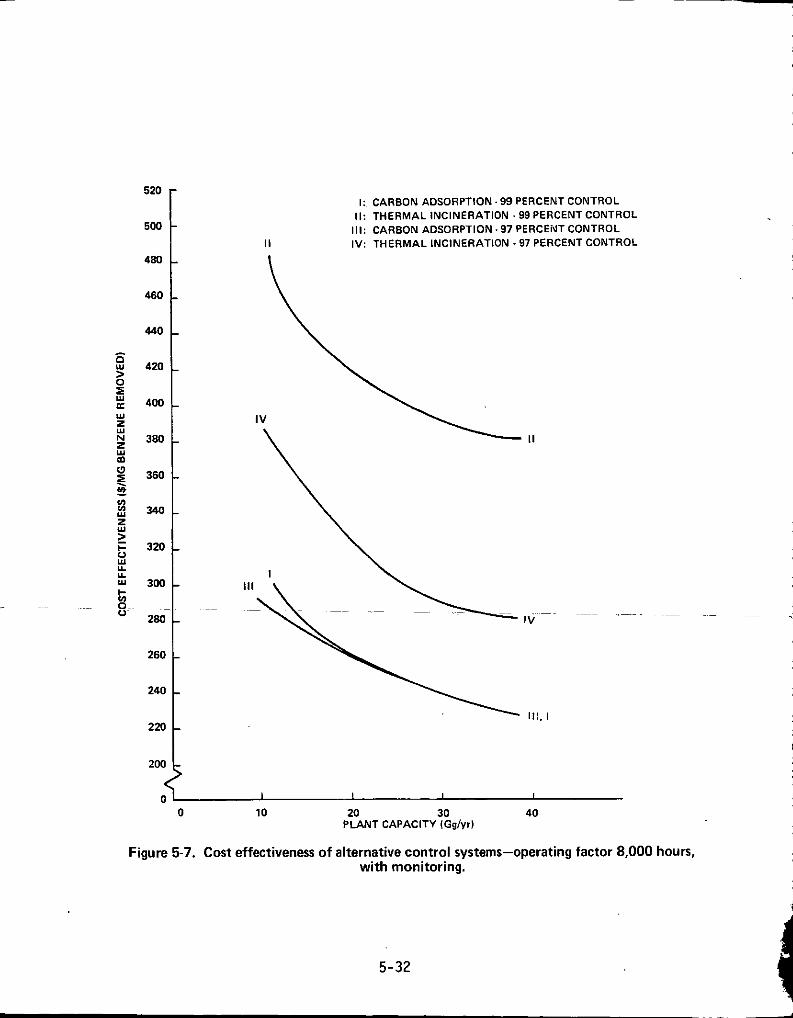
520
500
480
460
440
4 M
400
380
360
34a
320
300
280
26a
240
2M
200
c 0
I: CARBON ADSORPTION. 99 PERCENT CONTROL II: THERMAL INCINERATION .99 PERCENT CONTROL
111: CARBON ADSORPTION. 97 PERCENT CONTROL IV: THERMAL INCINERATION. 97 PERCENT CONTROL
IV
I I I I
10 20 30 40 PLANT CAPACITY (Gg/yrJ
Figure 5-7. Cost effectiveness of alternative control systems-operating factor 8,000 hours, with monitoring.
5-32 i
O r d i n a r i l y , t h e consequence i s t h a t the la rge-sca le ve rs ion i s more " e f f i -
c i e n t " i n a v a r i e t y o f ways, and bo th f i x e d and v a r i a b l e costs increase
less r a p i d l y than produc t ive capac i ty .
5.3.5 Contro l Cost Comparison
ascer ta ined, they must be compared w i t h costs obta ined from o ther data
sources.
costs , the annual ized costs , o r both. However, because the c a p i t a l cos ts
i n f l uence the annual ized costs ( v i a the annual ized c a p i t a l charges) and because t h e o the r terms i n t h e annual ized cos t con ta in more s i t e - s p e c i f i c
v a r i a b i l i t y ( u t i l i t i e s , f o r ins tance) , i t i s p re fe rab le t o l i m i t the com-
pa r i son t o the i n s t a l l e d costs . Even f o r a c o n t r o l system s i zed f o r a p a r t i c u l a r emission p o i n t , t h e
i n s t a l l e d cos t may vary considerably from s i t e t o s i t e .
the c o s t o f i n s t a l l a t i o n l abo r ( e l e c t r i c i a n s , p i p e f i t t e r s , e tc . ) , the
requirement o f spec ia l i n s t a l l a t i o n ma te r ia l s (e.g., e x t r a i n s u l a t i o n f o r
systems i n s t a l l e d i n co lder c l imates) , and the presence o r absence o f excess u t i l i t y capac i ty cons iderably i n f l uence the t o t a l i n s t a l l e d cost .
a range o f c o n t r o l system s izes. Such comparisons a r e bes t made g r a p h i c a l l y
t h a t i s , i n s t a l l e d cos ts ad justed t o t h e same reference date (second quar te r
1979, i n t h i s case) a re p l o t t e d aga ins t some techn ica l parameter r e l e v a n t
t o the c o n t r o l system. I n t h i s sec t ion , i n s t a l l e d costs a re compared among
var ious s izes o f carbon adsorbers and thermal i n c i n e r a t o r s w i t h pr imary heat recovery. The techn ica l parameters used i n the comparisons are t h e
gas vo lumet r ic f l o w r a t e s a t the c o n t r o l system i n l e t and o u t l e t , respec- t i v e l y .
p l a n t s (Tables 5-5a and 5-6a) a re compared w i t h costs developed by an EPA
c o n t r a c t o r and w i t h an ac tua l cos t f o r a system i n s t a l l e d a t a maleic anhydride p lan t . These costs have been p l o t t e d aga ins t t h e i n l e t volu-
me t r i c f l o w r a t e on l oga r i t hm ic scales (F igure 5-8). Note t h a t two EPA curves appear i n t h e f igure . The t o p EPA curve app l ies t o a 99-percent e f f i c i e n t adsorber, w h i l e t h e one beneath i t i s a u n i t designed f o r 97
percent e f f i c i e n c y .
Before t h e accuracy and representat iveness o f c o n t r o l costs can be
I n doing t h i s , one can e i t h e r compare the i n s t a l l e d c a p i t a l
Such f a c t o r s as
Wi th t h i s i n mind, however, c a p i t a l cos t comparisons can be made among
For the carbon adsorbers, c a p i t a l costs developed f o r t h e e x i s t i n g
5-33
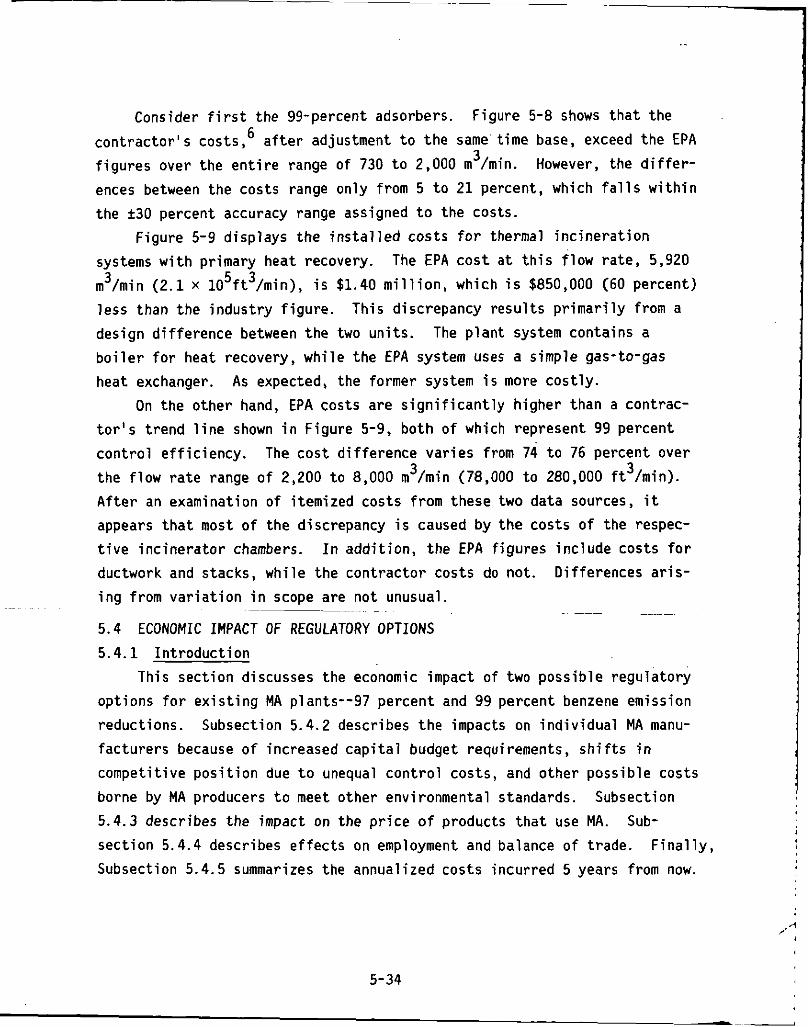
Consider f i r s t the 99-percent adsorbers. F igure 5-8 shows t h a t the
3 c o n t r a c t o r ' s costs,6 a f t e r adjustment t o t h e same t ime base, exceed t h e EPA f i gu res over t h e e n t i r e range o f 730 t o 2,000 in bin. However, the d i f f e r -
ences between t h e costs range on ly f rom 5 t o 2 1 percent, which f a l l s w i t h i n
the f30 percent accuracy range assigned t o t h e costs.
systems w i t h p r imary heat recovery. 5 3 m3/min (2 .1 x 10 f t /min), i s $1.40 m i l l i o n , which i s $850,000 (60 percent)
l ess than t h e i n d u s t r y f i g u r e .
des ign d i f ference between t h e two u n i t s .
b o i l e r f o r heat recovery, w h i l e t h e EPA system uses a s imple gas-to-gas
heat exchanger.
t o r ' s t r e n d l i n e shown i n F igure 5-9, b o t h o f which represent 99 percent
c o n t r o l e f f i c i e n c y .
the f l o w r a t e range o f 2,200 t o 8,000 m3/min (78,000 t o 280,000 f t3/min).
A f t e r an examinat ion o f i temized cos ts f rom these two da ta sources, i t
appears t h a t most o f t h e discrepancy i s caused by t h e cos ts o f the respec-
t i v e i n c i n e r a t o r chambers. I n add i t i on , t h e EPA f i g u r e s i nc lude cos ts f o r
ductwork and stacks, w h i l e t h e con t rac to r cos ts do not . D i f fe rences a r i s -
i n g f rom v a r i a t i o n i n scope are n o t unusual.
5.4 ECONOMIC IMPACT OF REGULATORY OPTIONS
5.4.1 I n t r o d u c t i o n
F igure 5-9 d isp lays t h e i n s t a l l e d cos ts f o r thermal i n c i n e r a t i o n
The EPA c o s t a t t h i s f l o w r a t e , 5,920
Th is discrepancy r e s u l t s p r i m a r i l y from a
The p l a n t system conta ins a
As expected, the former system i s more c o s t l y .
On t h e o the r hand, EPA costs a re s i g n i f i c a n t l y h igher than a contrac-
The c o s t d i f f e r e n c e v a r i e s f r o m 74 t o 76 percent over
~
-~
This sec t i on discusses the economic impact o f t w o poss ib le r e g u l a t o r y
op t ions f o r e x i s t i n g MA p lants- -97 percent and 99 percent benzene emission
reduct ions. Subsection 5.4.2 descr ibes t h e impacts on i n d i v i d u a l MA manu-
f a c t u r e r s because o f increased c a p i t a l budget requirements, s h i f t s i n
compet i t i ve p o s i t i o n due t o unequal c o n t r o l cos ts , and o the r poss ib le costs
borne by MA producers t o meet o ther environmental standards.
5.4.3 descr ibes t h e impact on t h e p r i c e o f products t h a t use MA. sec t i on 5.4.4 descr ibes e f fec ts on employment and balance o f t rade. Subsection 5.4.5 summarizes the annual ized cos ts i ncu r red 5 years from now.
Subsection
Sub-
F i n a l l y ,
5-34
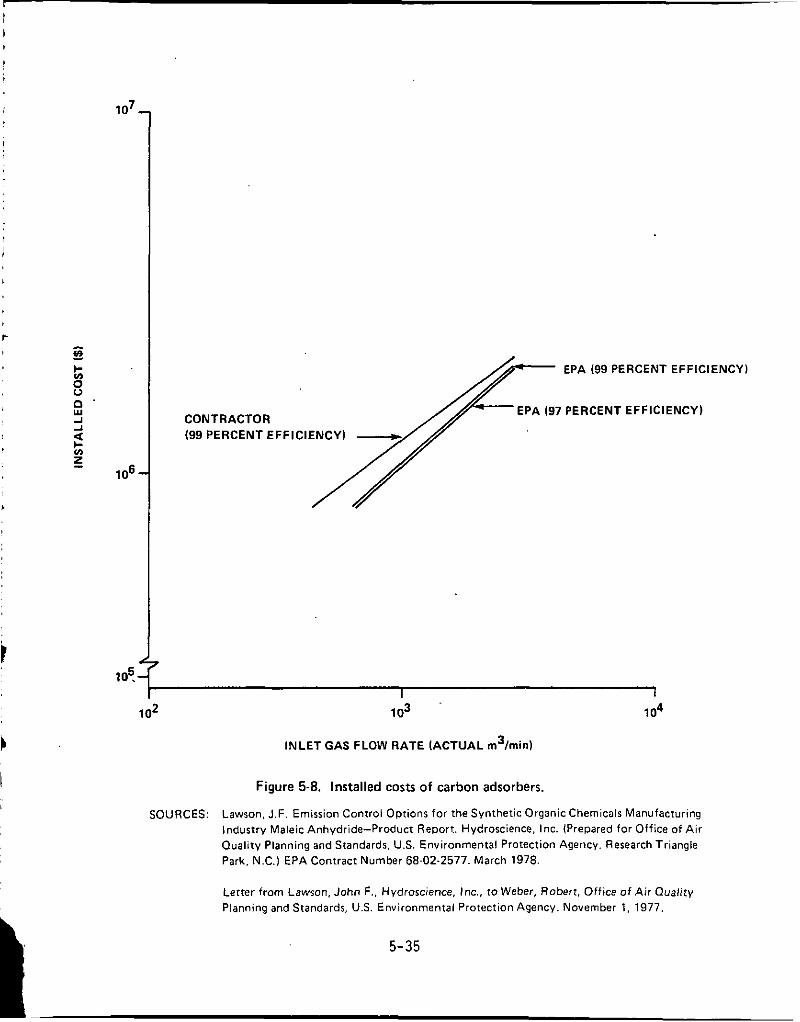
1 o7
1 06
105.
EPA I99 PERCENT EFFICIENCY)
EPA I97 PERCENT EFFICIENCY)
(99 PERCENT CONTRACTOR
102 1 03 1 o4
INLET GAS FLOW RATE (ACTUAL m3/min)
Figure 5-8. Installed costs of carbon adsorbers.
SOURCES: Lawson, J.F. Emission Control Options for the Synthetic Organic Chemicals Manufacturing Industry Maleic Anhydride-Product Report. Hydroscience, Inc. (Prepared for Office of Air Quality Planning and Standards. US. Environmental Protection Agency. Research Triangle Park, N.C.) EPA Contract Number 68-02-2577. March 1978.
Letter from Lawson. John F . . Hydroscience, Inc.. to Weber, Robert. Office o f A i r Quality Planning and Standards. U.S. Environmental Protection Agency. November 1. 1977.
5-35
1
1 o5
C- EPA (99 PERCENT EFFICIENCY)
- CONTRACTOR .:::I:::: (99 PERCENT EFFICIENCY)
A
OUTLET GAS FLOW RATE (ACTUAL rn3/rnin)
Figure 5-9. Installed costs of thermal incinerators with primary heat recovery.
SOURCE: Lawson, J.F. Emission Control Options for the Synthetic Organic Chemicals Manufacturing Industry Maleic Anhydride-Product Report, Hydroscience, Inc. (Prepared for Office Of A i r Quality Planning and Standards, US. Environmental Protection Agency. Research Triangle Park, N.C.) EPA Contract Number 68-02-2577. March 1978.
Pruessner, R.D.. and L.D. Broz. A i r Pollution Control: Hydrocarbon Emission Reduction Systems. Chemical Engineering Progress. Petrotex Chemical Corp.:73. Houston. Texas. August 1977. p. 69-73.
5-36
5.4.2 Impact on Manufacturers
MA manufacturers t h a t use benzene as a feedstock. This impact, which
depends upon t h e l e v e l o f benzene c o n t r o l requi red, p r i n c i p a l l y invo lves
two areas- -cap i ta l budget requirements and compet i t ion from domestic and
f o r e i g n producers.
t a n t i n i t s pr imary markets, so l i t t l e i n t e r i n d u s t r y impact i s expected.
benzene emissions are being considered:
t i o n . A t t h e 97-percent emission l e v e l , f i v e p lan ts w i l l r e q u i r e no i nves t - ment i n c o n t r o l s because they a l ready meet the standards.
Koppers (Pa.), DENKA, Reichhold (N.J. )--which p resen t l y achieve t h i s l e v e l
o f cont ro l - -and Koppers (Ill.) and Amoco, which do n o t use benzene as a feedstock. meet t h e 99-percent emission l e v e l . Table 5-9 shows t h e c a p i t a l budget
requirements f o r p l a n t s r e q u i r i n g e i t h e r carbon adsorpt ion o r i n c i n e r a t i o n t o achieve t h e standards being considered.
the t a b l e do n o t . c r e d i t p a r t i a l c o n t r o l s a l ready i n p lace on MA p l a n t s p r e s e n t l y n o t meet ing a poss ib le standard. Thus, f o r p l a n t s p r e s e n t l y
meeting some l e v e l o f benzene c o n t r o l , c a p i t a l o u t l a y assumptions f o r the
97- o r 99-percent emission reduc t i on standard may represent a "worst case." I n d iscuss ion o f c a p i t a l budget requirements, t h e main quest ion i s
whether MA producers w i l l have t h e f i n a n c i a l resources from which t o fund
t h e i n i t i a l c a p i t a l investment. Funding can occur e i t h e r e x t e r n a l l y , by
sales o f debt o r equ i t y , o r i n t e r n a l l y , by us ing c u r r e n t c a p i t a l budgets o r a l l o c a t i n g funds from the c a p i t a l budgets o f o ther d i v i s i o n s i n the parent
company. I n a d d i t i o n t o these f i n a n c i n g techniques, cos ts may be passed through t o consumers by r a i s i n g the p r i c e o f MA o r o the r products produced
by t h e f i r m t o recover the c a p i t a l expenses over a t ime per iod. F i n a l l y , a l though t h e method o r combinat ion o f methods f i r m s may employ t o f inance
the a d d i t i o n a l c a p i t a l expendi tures cannot be pred ic ted , i t i s l i k e l y t h a t the expendi tures w i l l be t r e a t e d as p a r t o f the parent company's o v e r a l l
c a p i t a l budget.
I n a d d i t i o n t o t h e quest ion o f how t h e con t ro l costs might be f inanced i s the ques t ion o f whether such an investment i s worthwhi le. Th is dec is ion
The d i r e c t economic e f f e c t o f a benzene con t ro l standard would f a l l on
The s u b s t i t u t e s f o r MA a re few and r e l a t i v e l y unimpor-
5.4.2.1 Cap i ta l Budget Requirements. Two c o n t r o l l e v e l s f o r reducing 97 percent and 99 percent reduc-
These p l a n t s a re
O f these f i v e p lan ts , the Amoco and the two Koppers p l a n t s a l s o
The investment costs g iven i n
5-37
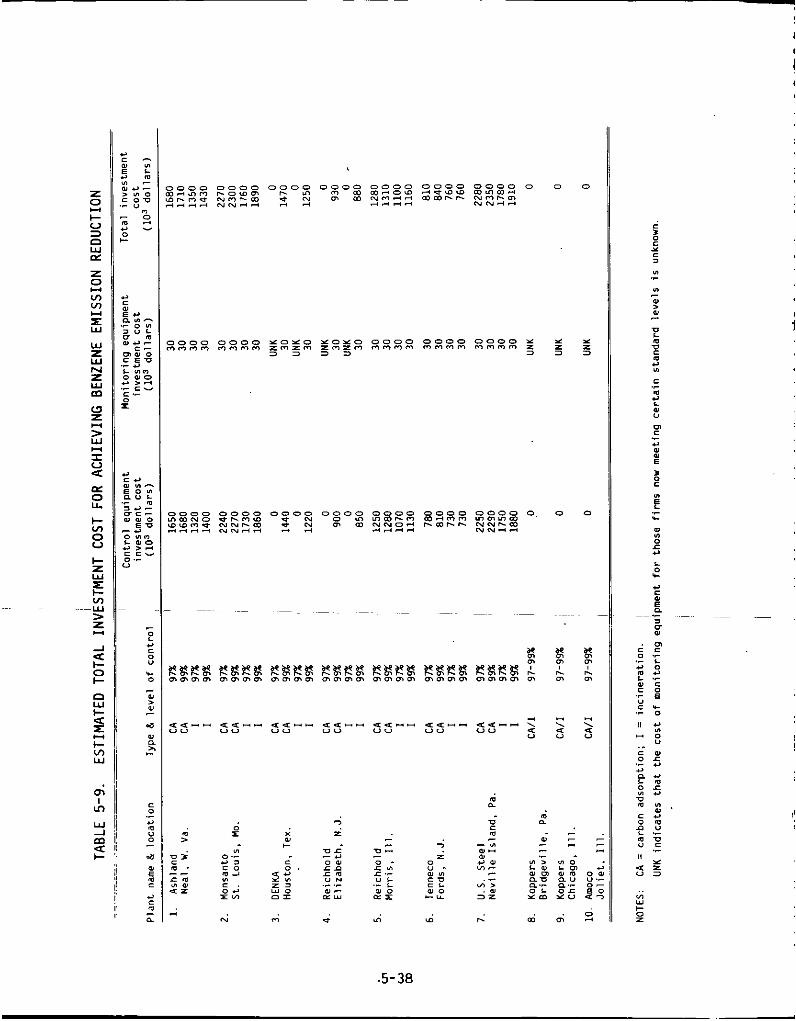
r
:
+ r
r
*
c
+
.1
f *
r 0
d &
m a
m m z 3 N 0 e u; m r.
.5-38
c 6 r c z m .r
v)
0
a
Q
m
m C m
- ...
e
i .- L
O VI 0 c C
L 0 c
depends on the importance of MA to total company sales, capital availability, and the rate of return and risks relative to competing investment opportun- ities. benzene standards being considered, five appear able to meet the additional capital budget requirements at both the 97- and 99-percent control levels. This assessment is based on analyses of physical and financial characteris- tics of individual plants as well as communications with industry. other two companies may either choose not to or cannot finance such an investment.
finance additional benzene pollution controls. l5,l6 The company has already made a major capital outlay for benzene controls within the past 4 years and is still recovering from this investment. It is a two-product company, with MA sales representing 33 percent of its total company sales. investment of another 1.3 to 1.5 million dollars in new pollution control equipment could cause DENKA to go out of business, according to a company spokesperson.
Although not confirmed by a company spokesperson, another possible candidate for closure is Tenneco. First, Tenneco's plant, built in the early 1960's, is one of the oldest domestic MA plants. plant, which may be few, will be a critical factor in an investment decision. Second, based. on the economic analysis performed in this section, cost increments associated with a benzene standard would be highest for Tenneco under both control scenarios. tage relative to its MA competitors. Third, it may be more profitable for the company to invest in products that are a more critical part o f its product mix, or yield a higher return. of total company sales are the lowest of all affected companies, 0.05 percent (see Table 5-10). industralized area of New Jersey. Many chemical companies have already left this area and relocated in the South, where production and raw material costs are presently less expensive.
In summary, DENKA's possible closure response to a benzene standard is a stated company position and has been confirmed by an independent analysis.
Of the seven companies that could be affected by the alternative
The
One of these companies, DENKA, expressed concern that it could not
An
15,16
This opinion is based on several factors.
The number of remaining viable operating years at the
Tenneco may therefore be at a cost disadvan-
9 Tenneco's MA sales as a percentage
Finally, Tenneco's MA plant is located in a highly
5-39 1
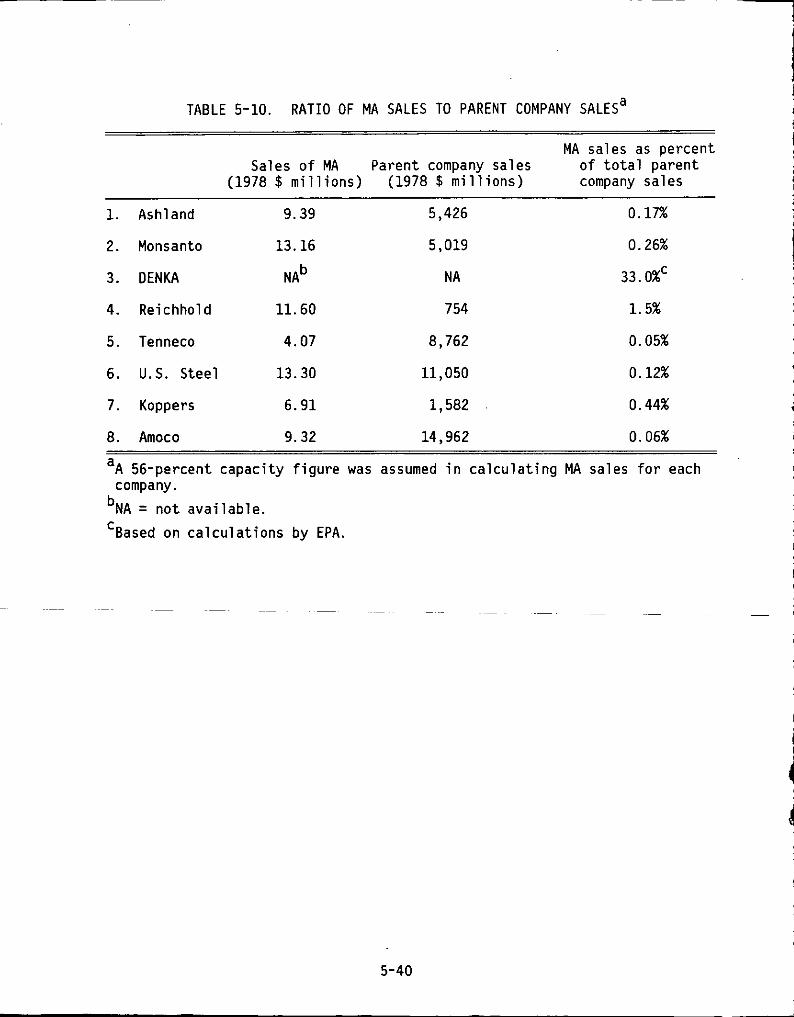
TABLE 5-10. RATIO OF MA SALES TO PARENT COMPANY SALES^
MA sales as percent Sales o f MA Parent company sales o f t o t a l paren t
(1978 $ m i l l i o n s ) (1978 $ m i l l i o n s ) company sales
1. Ashland 9.39 5,426 0.17%
2. Monsanto 13.16 5,019 0.26%
3. DENKA N A ~ NA 33. o%c
4. Reichhold 11.60 754 1.5%
5. Tenneco 4.07 8,762 0.05%
6. U.S. Stee l 13.30 11,050 0.12%
7. Koppers 6.91 1,582 0.44%
8. Amoco 9.32 14,962 0.06%
aA 56-percent capac i ty f i g u r e was assumed i n c a l c u l a t i n g MA sales f o r each
bNA = n o t ava i l ab le .
‘Based on c a l c u l a t i o n s by EPA.
company.
5-40
It can be assigned a h igh degree o f p r o b a b i l i t y .
s i b i l i t y , however, has no t been v e r i f i e d by a company spokesperson and
the re fo re cannot be g iven as much conf idence as the conclusions regard ing
OENKA's poss ib le c losure .
Table 5-11 compares t h e c o s t of t h e l e a s t expensive c o n t r o l o p t i o n t o t o t a l c a p i t a l expendi tures o f t h e MA companies. Among t h e f i rms , Reichhold--
which had t h e h ighes t c a p i t a l costs f o r c o n t r o l when expressed as a percen-
tage o f i t s c a p i t a l budget-- is expected t o cont inue MA product ion. c a p i t a l budget requirement may a f f e c t Reichhold t o a g rea te r degree than
the o the r companies (except f o r DENKA); never the less, Reichhold would probably fund needed c o n t r o l equipment and at tempt t o pass i t s increased
costs t o the consumer.
Tenneco's c losure pos-
The
5.4.2.2 I n t r a i n d u s t r y Competit ion. I n t r a i n d u s t r y compet i t ion, prompted by a 97- o r 99-percent benzene emissions standard, would c h i e f l y
i n v o l v e the p r i c e d i f f e r e n t i a l s i n MA merchant sales c rea ted by c o n t r o l
costs be ing passed through t o t h e consumer.
f a c t o r s a re t h e i n t e r p l a y o f t r a n s p o r t a t i o n costs and t h e prospect o f
impor t compet i t ion. f a c t o r s on compet i t ion w i t h i n t h e MA i n d u s t r y due t o impos i t i on o f a ben- zene c o n t r o l standard.
Other p o t e n t i a l l y c o n t r i b u t i n g
This s e c t i o n summarizes poss ib le e f f e c t s o f the above
5.4.2.3 E f f e c t o f Cost Pass-Through On Market Compet i t ion Due t o Benzene Emissions Contro l . A f t e r fund ing i n i t i a l c a p i t a l t o i n s t a l l con-
t r o l s , companies may be ab le t o r a i s e t h e p r i c e o f MA t o recover expenses
incurred. The p r i c e increment each manufacturer would l i k e t o pass through t o sa les depends on t h e t o t a l investment costs and t h e q u a n t i t y o f product
produced ( i . e , the number o f u n i t s through which p r i c e increments can be
passed).
The MA i n d u s t r y i s expanding produc t ion from approximately 56 percent toward t h e 100-percent p roduc t ion f i g u r e p red ic ted f o r t h e post-1983 per iod. 2
P r i c e increments due t o cos t pass-through should thus be viewed according t o two produc t ion scenarios--56 percent and 100 percent capac i t y u t i 1 i z a t i o n .
Tables 5-12 and 5-13 d e p i c t poss ib le p r i c e increments o f MA based on 100
percent cos t pass-through and produc t ion capac i t i es o f 56 percent and 100
percent, respec t i ve l y .
employed, and cos ts a re passed through accord ing t o bo th t h e produc t ion I n each case, t h e l e a s t expensive c o n t r o l op t i on i s
5-41
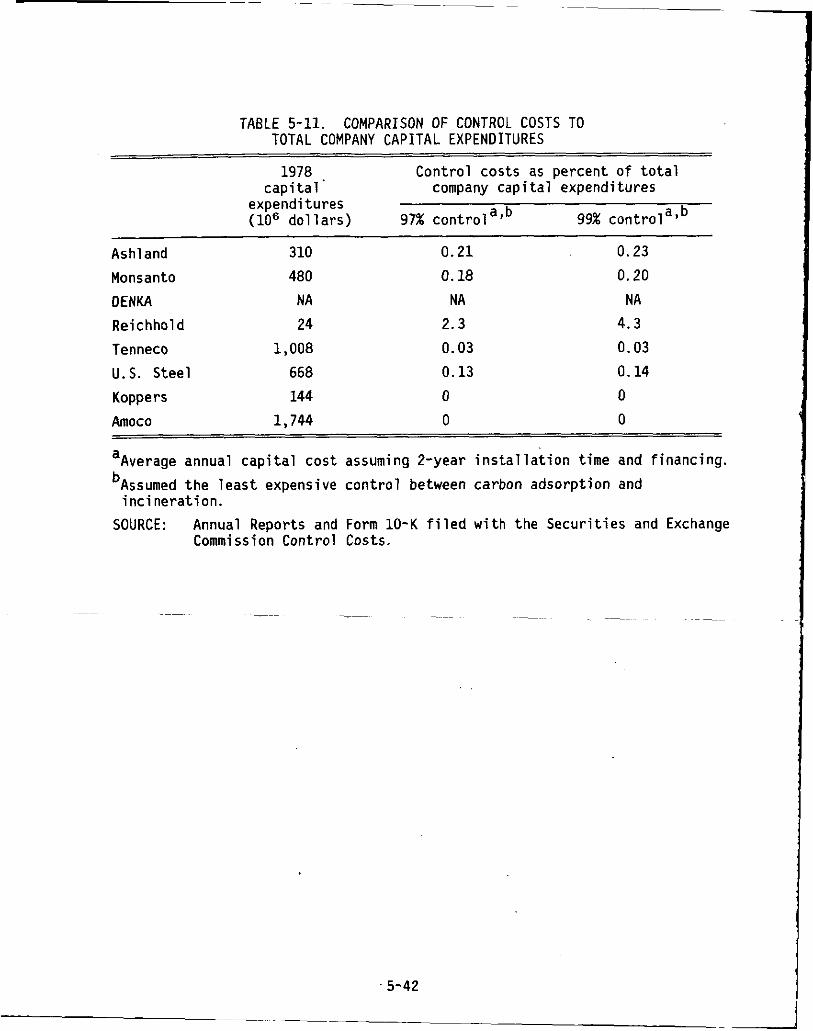
TABLE 5-11. COMPARISON OF CONTROL COSTS TO TOTAL COMPANY CAPITAL EXPENDITURES
1978 Cont ro l costs as percent of t o t a l c a p i t a l ’ company c a p i t a l expendi tures
expendi tures (lo6 d o l l a r s ) 97% c o n t r o l a * b 99% c o n t r o l a I b
Ashland 310 0.21 0.23
Monsanto 480 0.18 0.20
Rei c hhol d 24 2.3 4.3 DENKA NA NA NA
Tenneco 1,008 0.03 0.03
U.S. Steel 668 0.13 0.14
Koppers 144 0 0 Amoco 1,744 0 0
aAverage annual c a p i t a l cos t assuming 2-year i n s t a l l a t i o n t ime and f inanc ing .
bAssumed t h e l e a s t expensive c o n t r o l between carbon adsorp t ion and
SOURCE: i n c i n e r a t i o n .
Annual Reports and Form 10-K f i l e d w i t h t h e Secur i t i es and Exchange Commission Contro l Costs.
5-42
_ _ ~
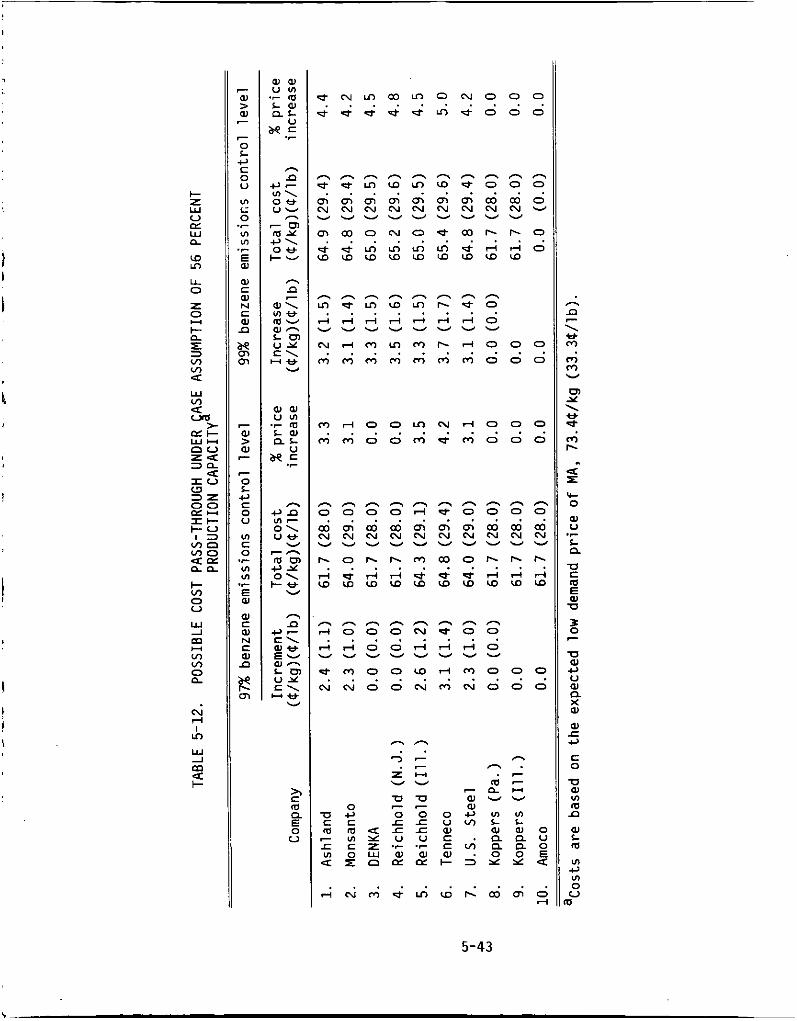
* ) r l 0 0 r n N ~ 0 0 0 . . . . ~ n ; d o m G : m o o o
n n . .
n n r \ e m rn m w
rn Y \ e d m b
4 z 'c 0 W u L
U c m E W u
.,
.r
n
g c
U W + u W
X a a r c,
c 0
U a
n
v)
m n a L m ul
% 0 V
U
5-43
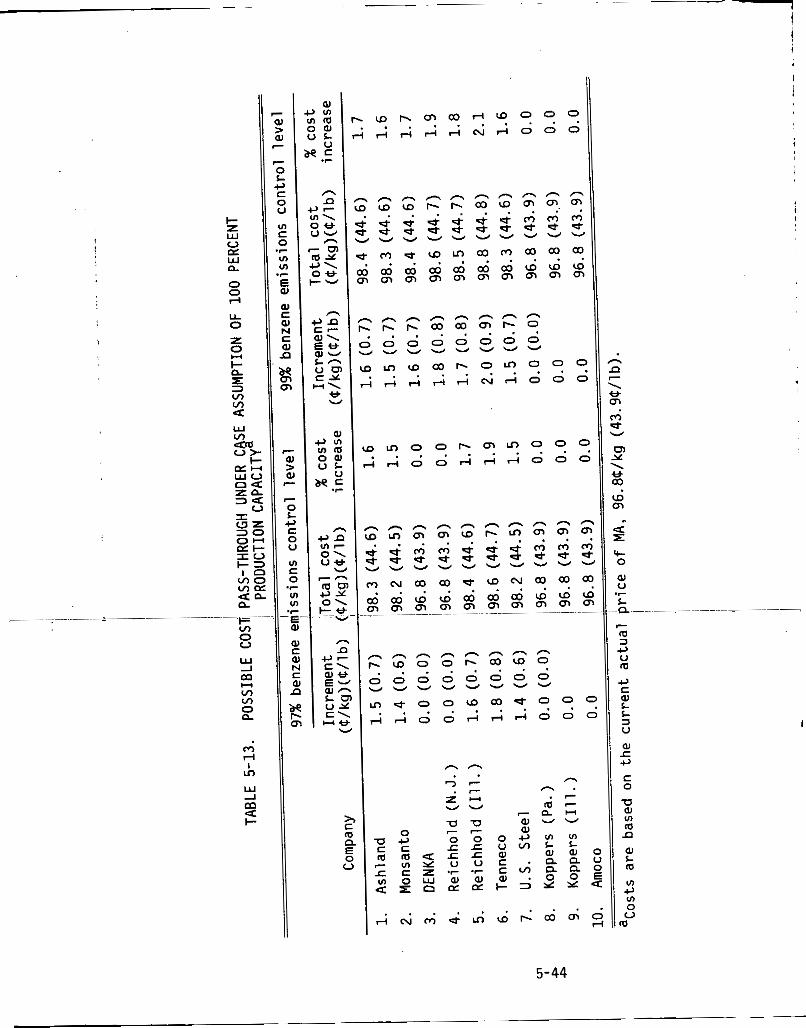
LL 0
-I=-- v) 0 0 W 1
Y m v) v)
2
m rl I v)
W -1
+ m a
i
!
! )
I 1
i >
I U
!
J J
E a a C a r a
r
C
C
I
. w r . m 0 O r l w o o o i , - i A A r i C u d o o o
. . . . .
~ v ) o o r . m m o o o . . . . . ; i 0 0 ~ d ~ o o o
5-44
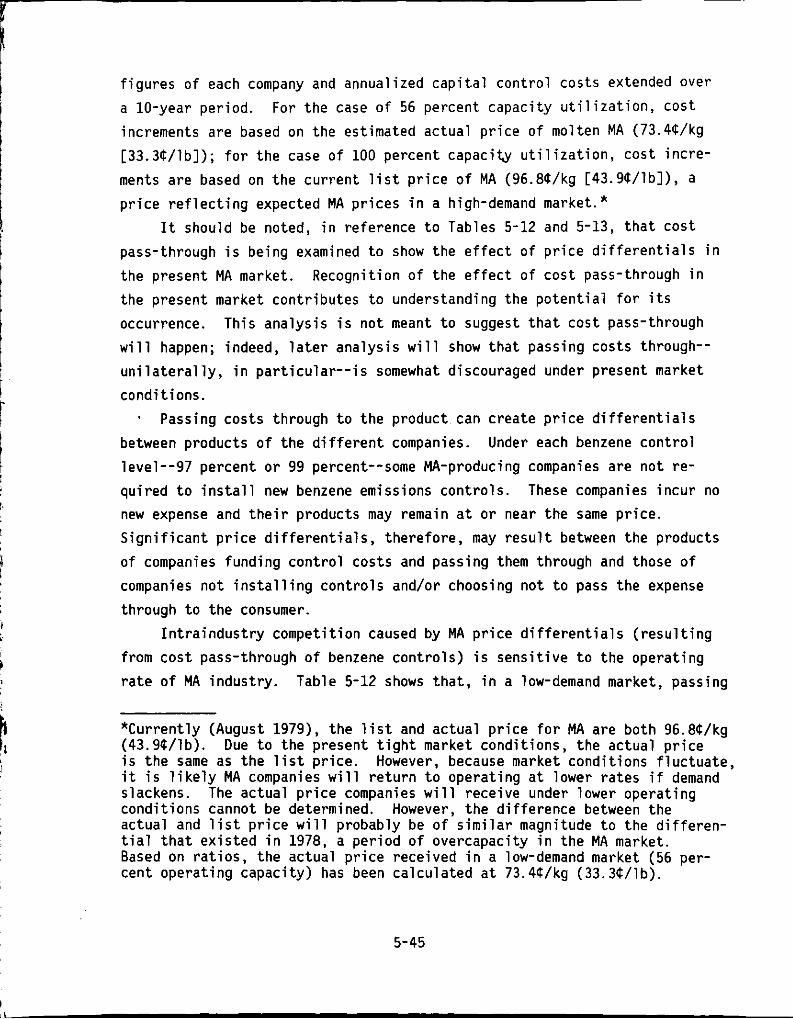
figures of each company and annualized capital control costs extended over a 10-year period. increments are based on the estimated actual price of molten MA (73.4U/kg [33.3U/lb]); for the case of 100 percent capacity utilization, cost incre- ments are based on the current list price of MA (96.8U/kg [43.9U/lbl), a price reflecting expected MA prices in a high-demand market.*
It should be noted, in reference to Tables 5-12 and 5-13, that cost pass-through is being examined to show the effect of price differentials in the present MA market. Recognition of the effect of cost pass-through in the present market contributes to understanding the potential for its occurrence. This analysis is not meant to suggest that cost pass-through will happen; indeed, later analysis will show that passing costs through-- unilaterally, i n particular--is somewhat discouraged under present market conditions.
For the case o f 56 percent capacity utilization, Cost
I Passing costs through to the product can create price differentials between products of the different companies. Under each benzene control level--97 percent or 99 percent--some MA-producing companies are not re- quired to install new benzene emissions controls. These companies incur no new expense and their products may remain at or near the same price. Significant price differentials, therefore, may result between the products of companies funding control costs and passing them through and those of companies not installing controls and/or choosing not to pass the expense through to the consumer.
from cost pass-through of benzene controls) is sensitive to the operating rate of MA industry.
Intraindustry competition caused by MA price differentials (resulting
Table 5-12 shows that, in a low-demand market, passing
*Currently (August 1979), the list and actual price for MA are both 96.8U/kg (43.9U/lb). is the same as the list price. it is likely MA companies will return to operating at lower rates if demand slackens. The actual price companies will receive under lower operating conditions cannot be determined. However, the difference between the actual and list price will probably be of similar magnitude to the differen- tial that existed in 1978, a period of overcapacity i n the MA market. Based on ratios, the actual price received in a low-demand market (56 per- cent operating capacity) has been calculated at 73.4U/kg (33.3U/lb).
Due to the present tight market conditions, the actual price However, because market conditions fluctuate,
5-45
benzene c o n t r o l costs through f u l l y can r a i s e product p r i c e s by up t o 4.5
percent i n the 97-percent c o n t r o l case and by up t o 4.8 percent i n t h e 99-percent c o n t r o l case f o r an i n d i v i d u a l p l a n t .
f u l l - c a p a c i t y u t i l i z a t i o n market (Table 5-13), p o t e n t i a l cos t increments
would be lower, va ry ing from 1.9 t o 2 . 1 percent f o r t h e 97- and 99-percent
c o n t r o l cases, respec t i ve l y .
assumptions, Tenneco may be fo rced t o r a i s e p r i c e s the most, assuming i t chooses t o pass cos ts through.
I t must be emphasized t h a t , when i n t r a i n d u s t r y compet i t ion i s viewed
r e l a t i v e t o poss ib le MA p r i c e increases from c o s t pass-through, t h e major
arena of compet i t ion invo lves merchant, r a t h e r than capt ive , markets.
Whi le costs may be passed through bo th markets, t h e g rea tes t d i r e c t e f f e c t i s seen i n the h i g h l y compet i t i ve merchant market. Conversely, p r i c e
increments i n t h e cap t i ve MA market emerge o n l y i n t h e f i n a l product ,
hav ing been d i l u t e d by cos ts o f o the r cons t i t uen ts a l s o necessary t o pro-
duce t h e f i n a l product. Sec t ion 5.4.3).
o f c o s t * d i f f e r e n t i a l s on MA merchant sa les i n bo th a low- and high-demand
market.
p r i c e s i n a low-demand market i s no t an auspic ious prospect.
t i c i t i e s governing t h e present MA-market a re s imply not-known. --Howeveri
t h e MA i n d u s t r y has i n d i c a t e d t h a t i t would be r e l u c t a n t t o r a i s e p r i c e s under low-demand market cond i t ions ; conversely, because most MA manufac-
t u r e r s a r e p a r t o f l a r g e r paren t f i r m s having o the r products, an a l te rna -
t i v e choice t o t o t a l MA cos t pass-through i s t o pass cos ts through par-
t i a l l y o r t o t a l l y t o o t h e r products. noted t h a t they may employ t h i s op t ion , assuming the choice i s made t o
i n s t a l l benzene emissions c o n t r o l i f a s tandard were promulgated.
I n t h e high-demand,
Under bo th c o n t r o l and capac i t y u t i l i z a t i o n
'
The e f f e c t of t h i s " d i l u t i o n " i s subs tan t i a l (see
The f o l l o w i n g subsect ions, t he re fo re , focus on t h e e f f e c t s
5.4.2.3.1 P r i c e d i f f e r e n t i a l s i n a low-demand MA market. Ra is ing P r i ce e las-
~
Some members o f t h e MA i n d u s t r y have
10,11,17,18,19
Tables 5-14 and 5-15 f u r t h e r examine the e f f e c t o f cos t pass-through
f o r two benzene c o n t r o l l eve l s , based on t h e 56-percent p roduc t ion r a t e
t h a t approximates present MA opera t ing cond i t ions .
i n d i c a t e t h e p r i c e d i f f e r e n t i a l ( i n cents per k i logram) between company and
compet i tor , assuming 100 percent o f c o s t pass-through. i n d i c a t e a p r i c e advantage over a compet i tor , and t h e accompanying percent-
Numbers i n t h e t a b l e
Negative numbers
5-46
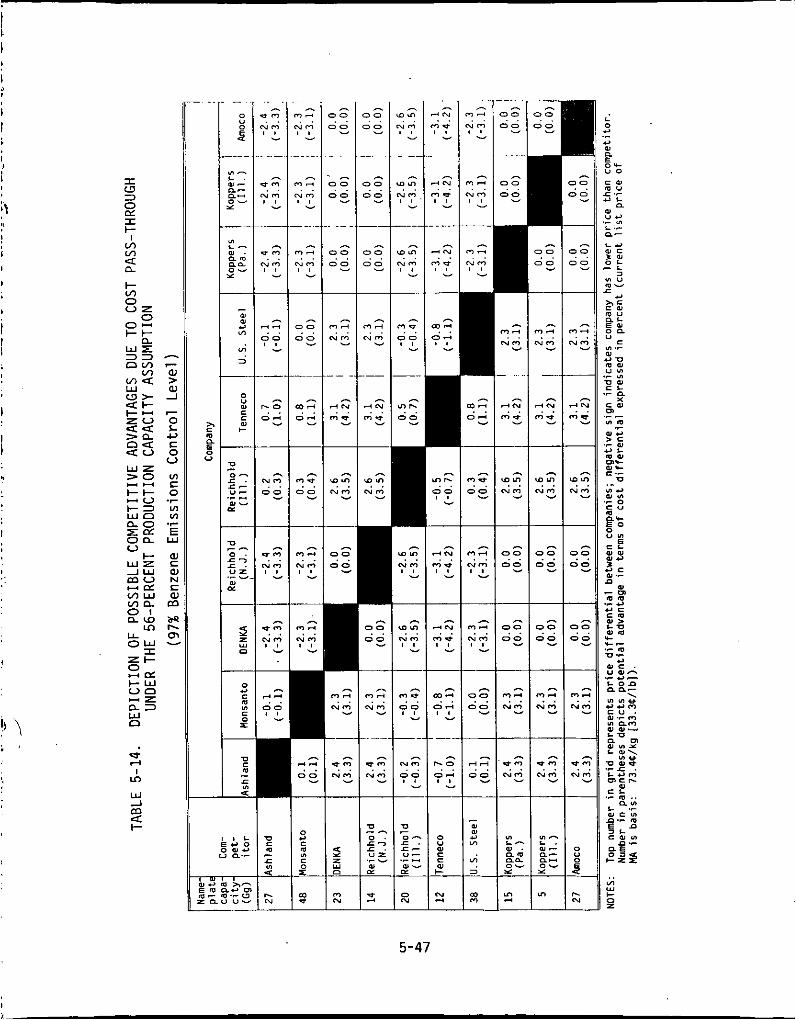
I a 3 0 w I I- I m m
4: a I- m 0 V Z 0
0- I-I- n W E 33 - o m - m a , m a 5 W a, a > -1 <I- I-- - z v 0 < a L o < c >a c,
I-3 YI w n VI n o o n w z cf E V
-1w a - P I E m w m a m 0 1
L D P I L L m o w - I
ZI-
I - W V O -z W 0
w!2 E m u N
n w bp
E =
n 3
. .
> c n (1
u 8
L 0 c e a E 0- u o
.- n
5-47
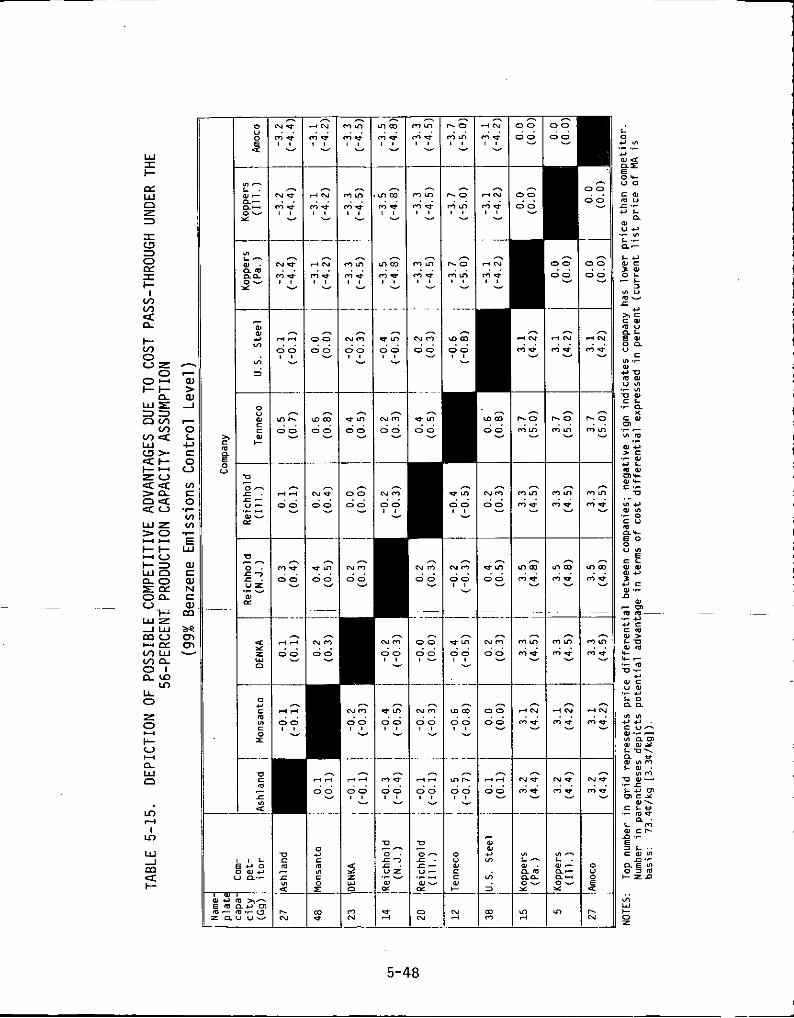
5-48
age expresses that advantage in terms of a price differential divided by the assumed base price of MA prior to cost pass-through. Positive table numbers indicate that a company is marketing its MA at a higher price than its competitor. 0.14 more per kilogram (0.054/lb) than Monsanto's; consequently, Monsanto may sell its product for less at a 0.1-percent differential over Ashland.
required to install total control systems: Ashland, Monsanto, Reichhold (Ill.), U.S. Steel, and Tenneco. If these companies decided to pass costs through completely, they would be competing with other companies that had not installed new controls and whose MA prices could consequently be lower.
Table 5-14 shows that Tenneco, the producer with the largest potential price increment (3.14/kg [1.54/lbl), could be at a competitive disadvantage with other MA producers under a 97-percent benzene control standard. the competitors, all except Koppers (Ill.) have production capacities exceeding Tenneco's. Indeed, a1 1 have residual production capacity that could be used to capture part or all of Tenneco's market should price differentials encourage it. exist for the other three companies required to install controls if they decide to pass costs through.
than the 97-percent standard (Table 5-15). Under the 99-percent control case, only the Amoco, Koppers (Pa.), and Koppers (Ill.) plants would not have to fund new control hardware. Again, Tenneco, assuming full cost pass through, wou1.d face the greatest price increase (3.7Wkg [1.7Q/lb]), put- ting itself at a possible disadvantage with its competitors. panies would face similar situations, however, since the nonaffected companies- Koppers (I1 1. ), Koppers (Pa. ), and Amoco--do not have enough residual capacity to capture all of the affected companies' markets. This situation would favor, to a degree, some cost pass-through, assuming the absence o f
increased import competition (see Section 5.4.3.1). The effects of benzene emissions standards in a low-demand MA market
can be summarized. In general, passing the costs of benzene controls through to MA may be difficult if MA demand is low. competitive, and at least three companies--Koppers (Ill.), Koppers (Pa.),
For example, Table 5-14 shows .that Ashland's product costs
Under a 97-percent benzene control assumption, five companies would be
Of
Similar situations, to a lesser extent, could
A 99-percent benzene emissions control would affect two more companies
Other com-
The market is quite
5-49
and Amoco--need n o t i n c u r any new expense t o meet a poss ib le benzene emis-
s ion standard. a f fected by the standard may choose p a r t i a l o r t o t a l pass-through o f ben-
zene c o n t r o l costs t o o the r company products as a means o f o f f s e t t i n g t h e
cos ts associated w i t h requ i red con t ro l s , w h i l e no t p l a c i n g themselves a t a
compet i t i ve disadvantage. Nevertheless, companies may n o t choose t h i s
o p t i o n f o r a number o f reasons.
t o r a i s e MA p r i ces .
i n s t a l l hardware under t h e 99-percent r e g u l a t o r y op t i on ( f i v e f o r t h e
97-percent opt ion) , and each o f these w i l l want t o pass c o n t r o l cos ts
through t o t h e consumer. I f a l l o r severa l companies w i t h l a r g e c a p a c i t i e s
independent ly decide t o pass costs through t o MA, the market system may be
ab le t o s u s t a i n t h e h ighe r MA pr i ces .
would impose a l i m i t e d t h r e a t o f compet i t ion because n e i t h e r company cou ld
produce MA i n q u a n t i t i e s s u f f i c i e n t t o s a t i s f y t h e e n t i r e domestic MA demand. Furthermore, Amoco, a l a rge MA producer, has inves ted l a r g e sums o f money i n t o t h e research and development o f i t s n-butane process.
i n g t o an Amoco spokesman, the company would r e a d i l y r a i s e p r i c e s t o o f f s e t
h igh R&D costs i f a favorab le market e ~ i s t e d . ~ Thus, i n t h e absence o f
impor t compet i t ion, h igher MA p r i ces may be a poss ib le o p t i o n f o r MA manu-
f a c t u r e r s even i n a low-demand m a r k e r
Because o f these circumstances, MA companies f i n a n c i a l l y
Even i n a depressed MA market s i t u a t i o n , companies may choose ins tead Seven ou t o f e i g h t MA f a c i l i t i e s w i l l be requ i red t o
I n t h i s case, Amoco and Koppers
Accord-
~ -~ - ~~ ~~
5.4.2.3.2 P r i c e d i f f e r e n t i a l s and t h e f u t u r e MA market ( a t 100 per-
cent capac i ty u t i l i z a t i o n ) .
MA market i s expected t o cont inue t o increase, corresponding t o a 100- percent p roduc t ion r a t e o f present MA capac i ty .2 As th is high-demand
market i s approached, i nc reas ing the p r i c e o f MA w i l l become more auspi-
c ious, and cos t pass-through, thus, more poss ib le . Furthermore, as the
base p r i c e o f MA increases t o meet market demand ( regard less o f a benzene
standard), p r i c e increments due t o c o n t r o l c o s t pass-through become l e s s s i g n i f i c a n t . Table 5-13 shows t h a t the h ighes t MA p r i c e increments under
bo th the 97- and 99-percent ,cont ro l l e v e l a r e 1.9 and 2 . 1 percent , respec- t i v e l y .
MA p r i c e d i f f e r e n t i a l s created from pass ing benzene c o n t r o l costs
through t o the consumer may n o t occur i n an i n d u s t r y runn ing a t 100 percent
For a t l e a s t t h e nex t 5 years, demand f o r t h e
5-50
produc t ion capaci ty . leaders as demand increases; thus, Monsanto and U.S. S tee l may s e t p r i c e s
i n t h e high-demand market o f 1983. Monsanto and U.S S tee l , the l a r g e s t MA producers, are bo th a f f e c t e d by t h e two poss ib le benzene c o n t r o l l e v e l
requirements. However, i t i s l i k e l y t h a t as market demand increases t o
t o t a l MA p roduc t ion capaci ty , p r i c e s w i l l r i s e t o accommodate passing benzene c o n t r o l costs through w i t h no concomitant l oss i n sales. (This
assumes, o f course, no impor t compet i t ion; see f o l l o w i n g sect ions. 1 5.4.2.3.3 E f f e c t o f t r a n s p o r t a t i o n on i n t r a i n d u s t r y impacts. Trans-
p o r t a t i o n charges can a f f e c t the d e l i v e r e d c o s t o f MA. I n 1978, costs f o r
t r a n s p o r t i n g MA by t r a i n averaged 0.005C/kg/mi (0.002Q/lb/mi) and by t ruck , O.OlC/kg/mi (0.005C/lb/mi).10 Thus, f o r 161 km (100 m i ) o f t ranspor t ,
the f i n a l cos t o f MA can increase from 0.5B/kg t o l.OQ/kg.
average t r a n s p o r t a t i o n cos t quoted i s 3.86C/kg, o r between 300 and 400 m i o f t r a n ~ p o r t . ~ Thus, t h e f i n a l d e l i v e r e d p r i c e o f MA may average 100.66U/kg
(45.63Wlb) i n today ' s market.
o thers i n terms o f t r a n s p o r t c r e d i t .
compet i tors , a d i f f e r e n t i a l between t h e p r i c e s o f t h e i r products cou ld a l l ow t h e lower p r i c e d produc t f u r t h e r t r a n s p o r t d is tance be fore a "break-
even'' p r i c e w i t h i t s more expensive compet i to r i s reached.
capaci ty , low-demand market, such p r i c e d i f f e r e n t i a l s cou ld a l l o w one
company t o penet ra te t h e reg iona l market o f another.
f e r e n t benzene emissions c o n t r o l l e v e l s . The tab les assume reg iona l
markets e x i s t f o r each company. p e t i t o r ' s market area are shown h o r i z o n t a l l y , i n the t o p row o f t h e tab le .
I f a company from t h a t row has a lower p r i c e d product than i t s compet i tor (shown i n t h e v e r t i c a l column), t h e company i s g iven appropr ia te t r a n s p o r t c r e d i t ( i n mi les) equ iva len t t o t h e p r i c e d i f f e r e n t i a l between t h e two
companies' products. The d is tance between competing companies i s a l so shown i n t h e t a b l e , i n t h e bottom number o f each app l i cab le g r i d .
compet i tor has t r a n s p o r t c r e d i t exceeding t h a t d is tance, market pene t ra t i on o f a cornpet i tor i s poss ib le . However, i t must be po in ted o u t t h a t many MA companies have an average market rad ius o f between 300 and 400 mi les.
The l a r g e s t producers a re l i k e l y t o be the p r i c e
The c u r r e n t
As MA p r i c e s increase, some companies may have an advantage over That i s , cons ider ing MA p r i c e s o f two
I n an excess-
Th is p o s s i b i l i t y i s i l l u s t r a t e d i n Tables 5-16 and 5-17 under d i f -
Companies p o s s i b l y b reak ing i n t o a com-
I f a
5-51
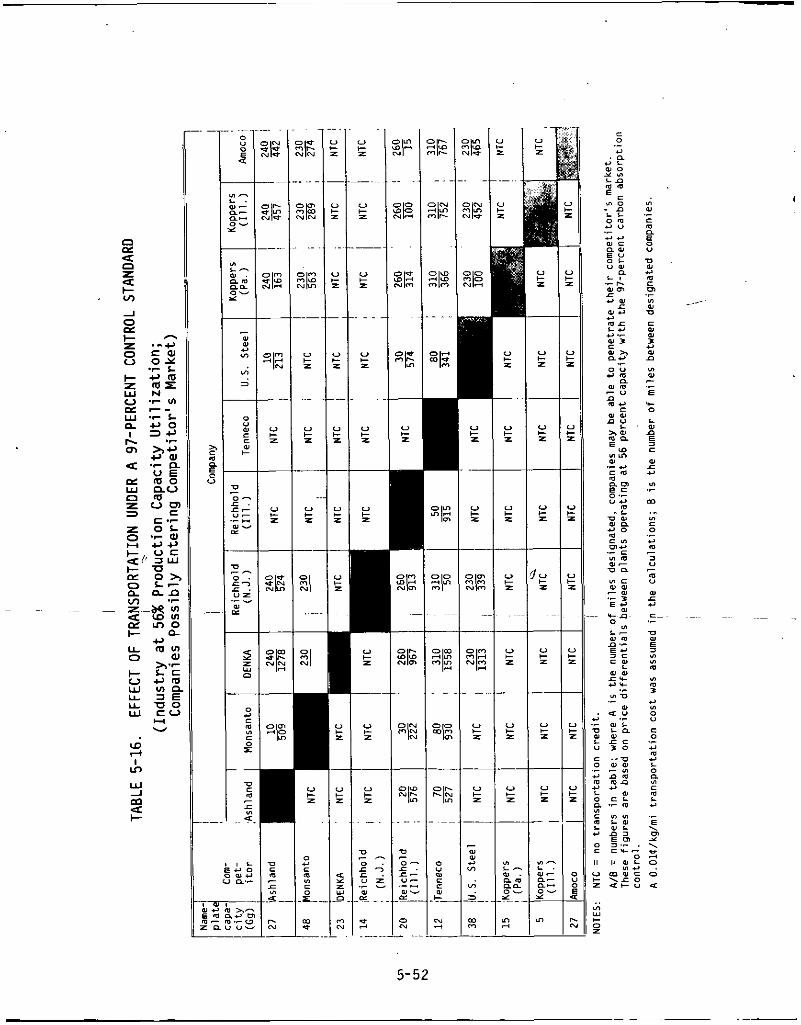
W rl I
Lo
W J m z
5-52
L o o C r c r VIn
.? ._
VI z
E c m a
Y
n u u m c ? VI _ _ _ - u 0
c o o 3 e o D
VI o
E c 0 L 0 a
c
u r c VI
- .r
5
.- m ._ VI c 0 c m 2 Y
m U
o r e c-
.r
c
c
~ .- n D
5 VI VI m VI m 3
c VI
0 Y
c 0
e m e L 0 VI c m c
.r
n
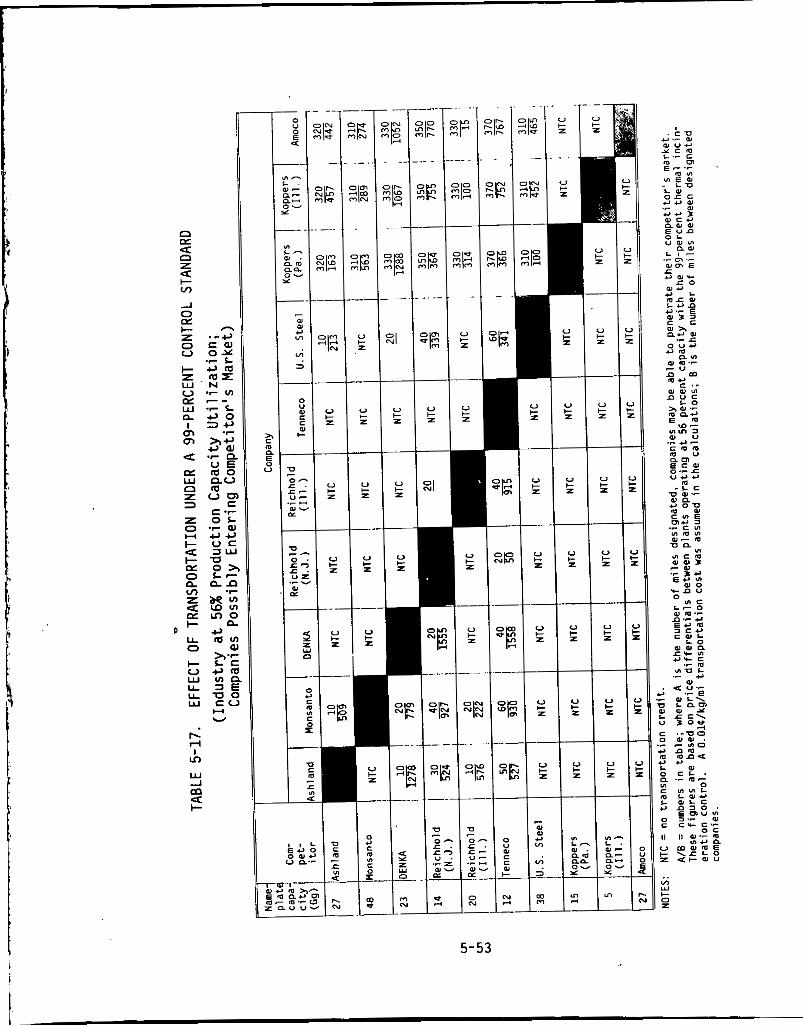
5-53
Consequently, i f between 600 and 800 m i les a r e subtracted from the d is tance
shown between two companies, i t i s ev iden t t h a t many companies a l ready
compete i n common market regions.
p l a n t ' s rad ius i s d i s t r i b u t i o n o f i t s major market. Tables 5-16 and 5-17 were c a l c u l a t e d us ing t h e d i f f e r e n t i a l between
companies a t 56 percent capaci ty , assuming b o t h a 97-percent and a 99-
percent c o n t r o l l e v e l f o r benzene emissions, respec t ive ly . The t ranspor ta -
t i o n e f f e c t s a t 100 percent capac i ty u t i l i z a t i o n were n o t inc luded because,
a t t h a t u t i l i z a t i o n r a t e , companies would be s e l l i n g t o a high-demand
market i n which l a c k o f buyers should n o t be an issue remedied by t r a n s p o r t
t o o the r markets. l a c k o f buyers cou ld be an issue.
companies hav ing t h e g rea tes t p o t e n t i a l f o r reg iona l market pene t ra t i on
(due t o MA p r i c e d i f f e r e n t i a l s ) a re DENKA, Reichhold (N.J.), U.S. Steel ,
Koppers, and Amoco.
problem because o f i t s la rge , res idua l p roduc t i on capaci ty , which can be used t o capture p a r t o f a compe t i t o r ' s markets.
Table 5-17 shows t h a t , under a 99-percent benzene emissions c o n t r o l ,
f i n a n c i a l l y a f f e c t e d companies face p o t e n t i a l reg iona l market pene t ra t i on
by a g rea te r number o f compet i tors.
aga in presents the greateTt threat-because o f i t s p o t e n t i a l l y large- t rans-
p o r t c r e d i t and i t s l a r g e res idua l p roduc t i on capaci ty .
Al though b o t h tab les show t h a t t h e compet i t i ve p o s i t i o n o f MA compan-
i e s due t o p r i c e d i f f e r e n t i a l s can be enhanced by t ranspor ta t i on , t h i s
s i t u a t i o n i s unprecedented.
reg iona l market o f a producer t o a rad ius o f about 483 t o 644 km (300 t o
400 m i ) . Under a benzene emissions standard, assuming i n d u s t r i e s decide
t o pass c o n t r o l cos ts through, t r a n s p o r t a t i o n may be used t o s e l l MA beyond
t h e t r a d i t i o n a l 483- t o 644-km (300 t o 400 m i ) market rad ius and s t i l l
meet compet i t i ve p r i c e s i n c e r t a i n cases, as i l l u s t r a t e d i n t h e tab les . Whether companies w i l l pass C o s t s through and employ t h i s method t o achieve market p e n e t r a t i o n o f a compet i tor cannot be determined. I f MA producers
e l e c t t o absorb p o l l u t i o n c o n t r o l c o s t and r e t a i n cu r ren t p r i c e s , t ranspor-
t a t i o n costs cou ld then serve t o r e s t r i c t market r a d i i t o below 483 o r 644 km
Another unknown f a c t o r w i t h i n each
A t the 56-percent p roduc t i on capaci ty market, however,
Table 5-16 shows t h a t , under a 97-percent benzene c o n t r o l l e v e l , the
O f these, Amoco presents t h e grea tes t p o t e n t i a l
I n t h i s s i t u a t i o n , however, Amoco . ~~ -
Transpor ta t ion cos ts c u r r e n t l y l i m i t t h e
I
5-54
(300 o r 400 m i ) . p e t i t o r would n o t be p r o f i t a b l e and would have low p r o b a b i l i t y o f occurr ing.
5.4.2.4 E f f e c t o f Imports. Impor ts have a small e f f e c t on the present MA market. I n 1977, they accounted f o r o n l y 2.3 percent o f t h e Un i ted
States MA demand.12
uncer ta in , however. molten and b r i q u e t t e .
Molten MA i s the p r e f e r r e d form f o r l a r g e consumers, account ing f o r 90 percent o f t h e domestic MA output." The remaining 10 percent o f MA i s converted i n t o b r i que t tes , t h e form o f a l l imported MA. Because b r i -
quettes can be converted t o t h e mol ten form on ly a t a cos t and because
b r i q u e t t e s have a l i m i t e d s h e l f l i f e , impor ted MA competes p r i m a r i l y w i t h
domestic MA b r i q u e t t e s and n o t w i t h t h e "molten market."
Imports cou ld pose problems f o r Un i ted States MA b r i q u e t t e producers,
a l though smal l q u a n t i t i e s o f imported MA have n o t i n t e r f e r e d wi th domestic
product ion.
than domestic b r i q u e t t e s (which represent 10 percent o f Un i ted States MA product ion) , a l though impor ts now s e l l f o r o n l y 24 l ess p e r k i logram (l.OQ/lb) than Un i ted States b r ique t tes . l1 Prices cou ld drop again, however.
manufacturers a re producing MA a t below capac i ty and cou ld r e a d i l y expand
i f t h e demand ex is ted. Moreover, impor ts may cont inue t o compete w i t h
Un i ted States b r ique t tes , p a r t i c u l a r l y i n t h e west coas t market where a r r i v i n g impor ts i n c u r f e r a d d i t i o n a l over land f r e i g h t charges.
p roduc t ion cos ts a r e r i s i n g abroad and t h e p o s s i b i l i t y t h a t f o r e i g n govern- ments may s top subs id i z ing MA product ion. Furthermore, it should be r e i t e -
r a t e d t h a t t h e degree o f f o r e i g n compet i t ion i s somewhat l i m i t e d s ince t h e
major arena o f compet i t ion i s b r i q u e t t e MA, which comprises o n l y 10 percent o f t h e domestic market.
Overa l l , the cos t o f benzene c o n t r o l s on domestic MA p roduc t i on may be somewhat exacerbated by f o r e i g n impor ts w i t h i n t h e nex t 5 years. However,
the Un i ted States has always met impor ted MA p r i c e s ; i f i t cont inues t o do
so w i thou t i n c u r r i n g a loss u n t i l t h e post-1983 high-demand market i s
reached, impor ts should no t present a problem.
I n t h i s case, reg iona l market pene t ra t i on o f a com-
The e f f e c t impor ts have on t h e f u t u r e MA market i s
Male ic anhydride i s produced i n two forms:
A t t imes, impor ts have s o l d f o r 94 l ess p e r k i logram ( 4 . W l b )
Fore ign
Counter ing t h e p o t e n t i a l o f f o r e i g n compet i t ion are t h e f a c t s t h a t MA
5-55
5.4.2.5 Summary o f Impact on Manufacturers. Tables 5-18 and 5-19
summarize t h e major impacts on the manufacturer a r i s i n g from c a p i t a l budget requirements and i n t r a i n d u s t r y compet i t ion under two benzene c o n t r o l l eve l s - -
97 and 99 percent , respec t i ve l y . i n d i c a t e t h a t Tenneco may be and OENKA w i l l be most severe ly a f fec ted .
Impacts of i n t r a i n d u s t r y compet i t ion i n d i c a t e poss ib le compet i t ion a r i s i n g
from benzene c o n t r o l c o s t pass-through i n the fu tu re , high-demand market.
Overa l l , t h e prospect o f o f f s e t t i n g add-on benzene c o n t r o l cos ts and augment-
i n g p r o f i t s i s enhanced i n the fu tu re , high-demand market o f 1983.
5.4.3 E f f e c t on Product Pr ices
Impacts o f c a p i t a l budget requirements
5.4.3.1 Cost Pass-Through t o t h e F i n a l Consumer. MA i s purchased by
manufacturers f o r use as an in te rmed ia te i n t h e produc t ion o f var ious end
products. Should MA producers r a i s e t h e i r product p r i c e s t o compensate f o r p o l l u t i o n abatement costs , purchasers o f MA w i l l f e e l the g rea tes t economic
impact o f these increments. It i s t h e r e f o r e l i k e l y t h a t MA users, l i k e MA
producers, w i l l choose t o r a i s e p r i c e s o f t h e i r products t o o f f s e t h igher p roduc t ion costs . P r i c e increments o f these products should n o t be as h igh
as p o t e n t i a l MA p r i c e increments because MA accounts f o r on l y a f r a c t i o n o f
the wholesale p r i c e o f each product.
p r i c e s should be d i l u t e d i n t h e f i n a l product .
Thus, t h e impact o f increased MA
MA i s used as an in te rmed ia te i n t h e produc t ion o f severa l products, -
~~ main ly p o l y e s t e r res ins , a g r i c u l t u r a l chemicals,-and fumaric acid. Tables
5-20, 5-21, and 5-22 show how the ,increased MA p r i ces cou ld a f f e c t the p r i c e s o f these products. Product p r i c e increments depend on the percent-
age o f MA i n t h e product and t h e percentage o f i t s wholesale p r i c e a t t r i -
buted t o MA. w i t h each product .
e s t e r r e s i n s (58 percent o f MA demand) t h a t go i n t o r e i n f o r c e d p l a s t i c
app l i ca t i ons such as marine c r a f t , b u i l d i n g panels, automobiles, tanks, and
pipes. Cur ren t l y , these res ins s e l l f o r 55$ t o $3.30/kg (25$ t o $1.50/lb). Should MA p r i c e s increase, po l yes te r r e s i n s could r i s e from 0.2$ t o 0.5B/kg
(0.0% t o 0.23Q/ lb) f o r res ins c u r r e n t l y p r i c e d a t 55$/kg (25Q/lb) and from
1.8$ t o 3.0B/kg (0 .W t o 2.1Q/lb) f o r res ins p r i c e d a t $3.30/kg ($1.50/ lb) .*
These f a c t o r s c o n t r i b u t e t o t h e vary ing increments associated
The predominant end use of MA i s t h e produc t ion o f unsaturated po ly -
*Increments r e f l e c t t h e maximum range o f increments t h a t cou ld occur us ing t h e wors t p r i c e increases associated w i t h t h e l e a s t expensive add-on c o n t r o l op t ions a t 97 and 99 percent benzene con t ro l .
5-56
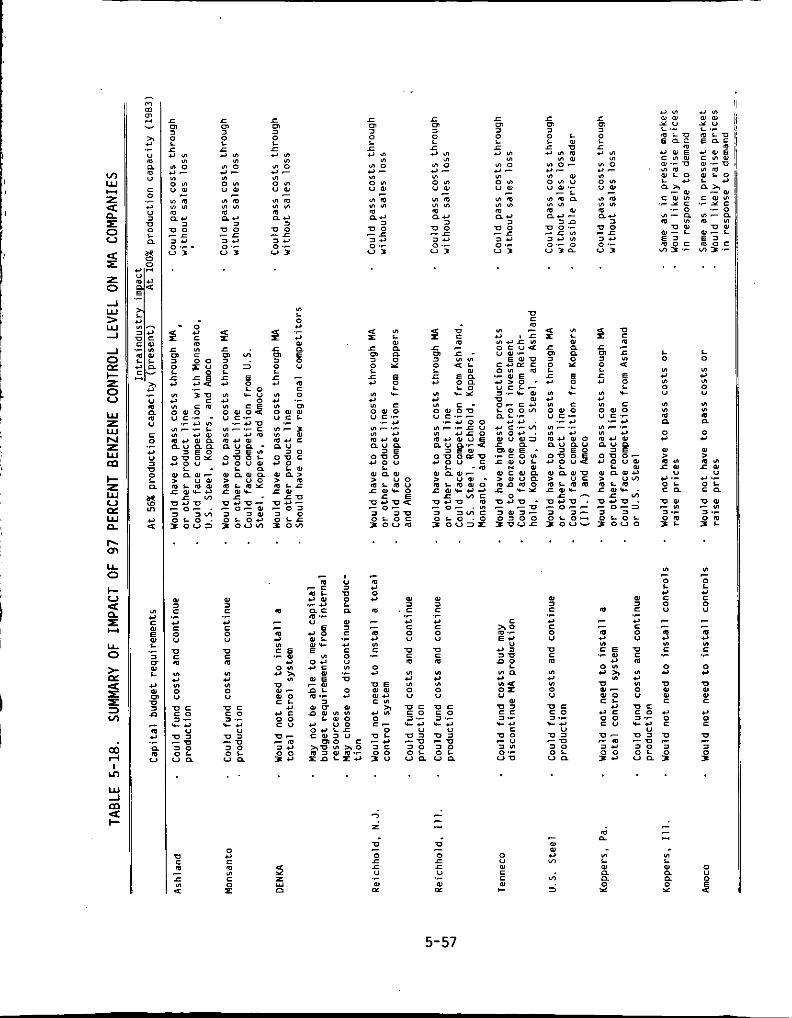
- 0
r g
(n L 0 C
. .
- 0
c c 0 U
u c
.-
5-57
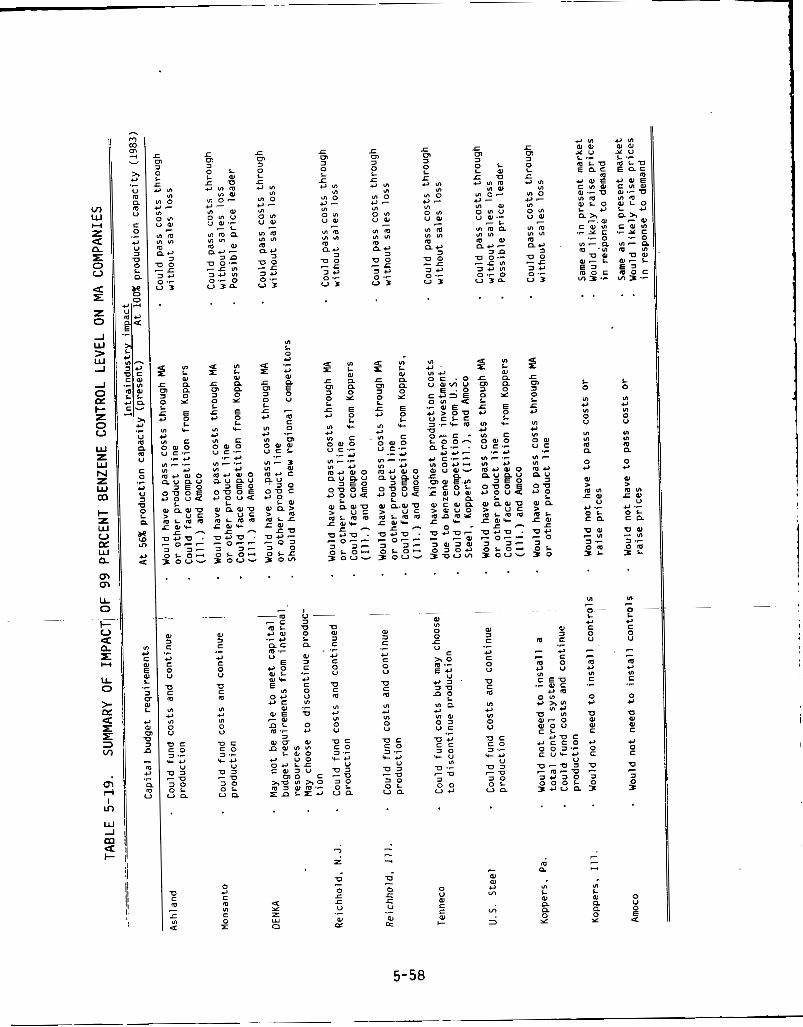
v) W Y z a n z V 4 E z 0 1 W > W J
_I
I- z 0 V W z W N z W
I- z W V CT W
z
rn
n m m U 0
V G
2 E U 0
> 4 r
v:
a
E - U r I U
LL
K 4 k
-
. . . . . . . .
. . . . . . . . . . . . . .
5-58
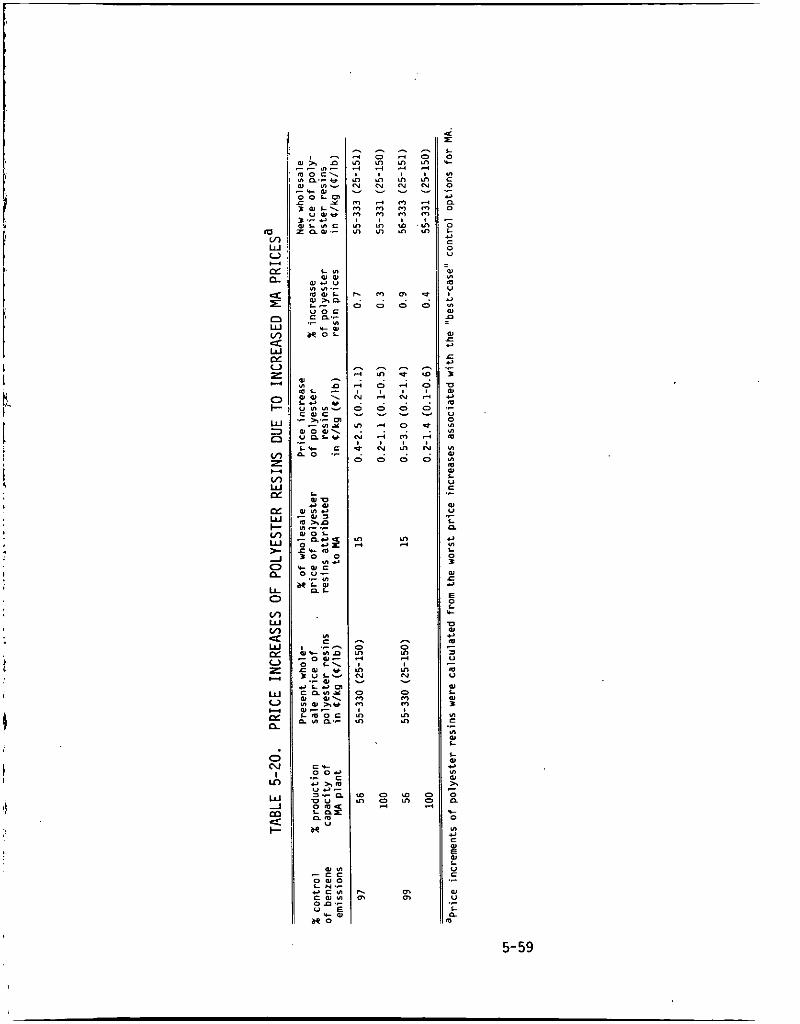
v) W v) 4 W PI u z w V
PI
w
w
n
0 N I In W _I m 3
.L c . 0 .-
n Y) 4
h m m m
D u L P L "7 L 0 3 D .c c E 0 L c
-
0) L D 3
VI c Y)
D L
.?
5-59
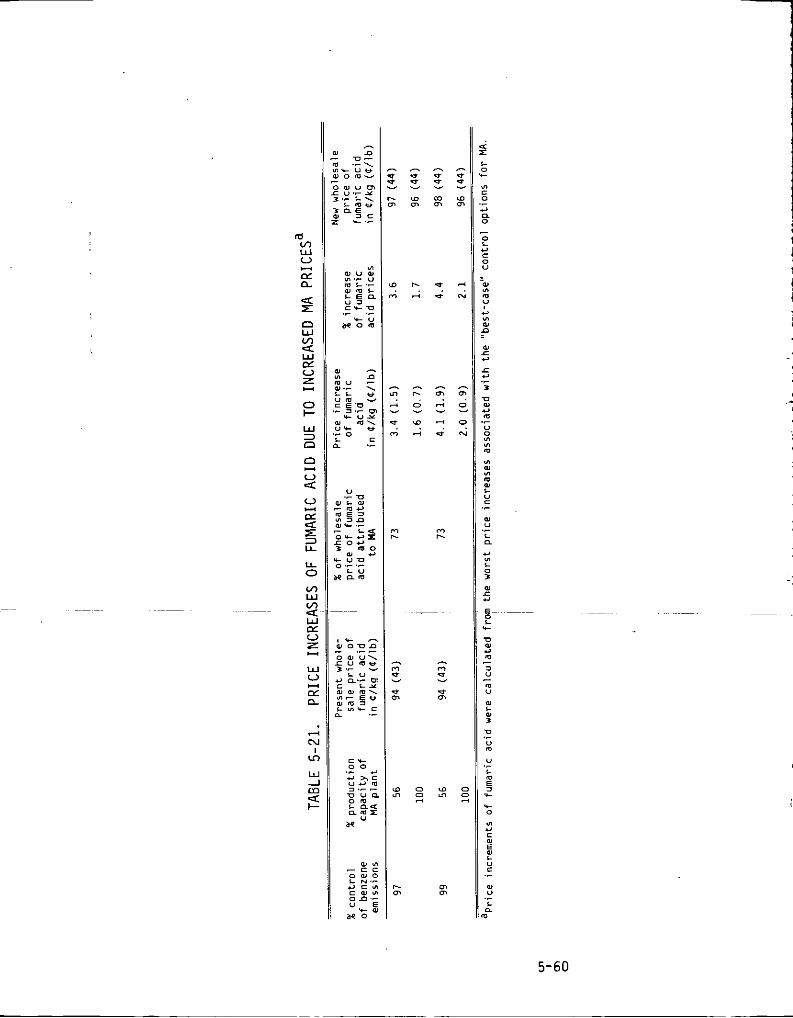
- h I
U
LL
Lr U I -
-
5-60
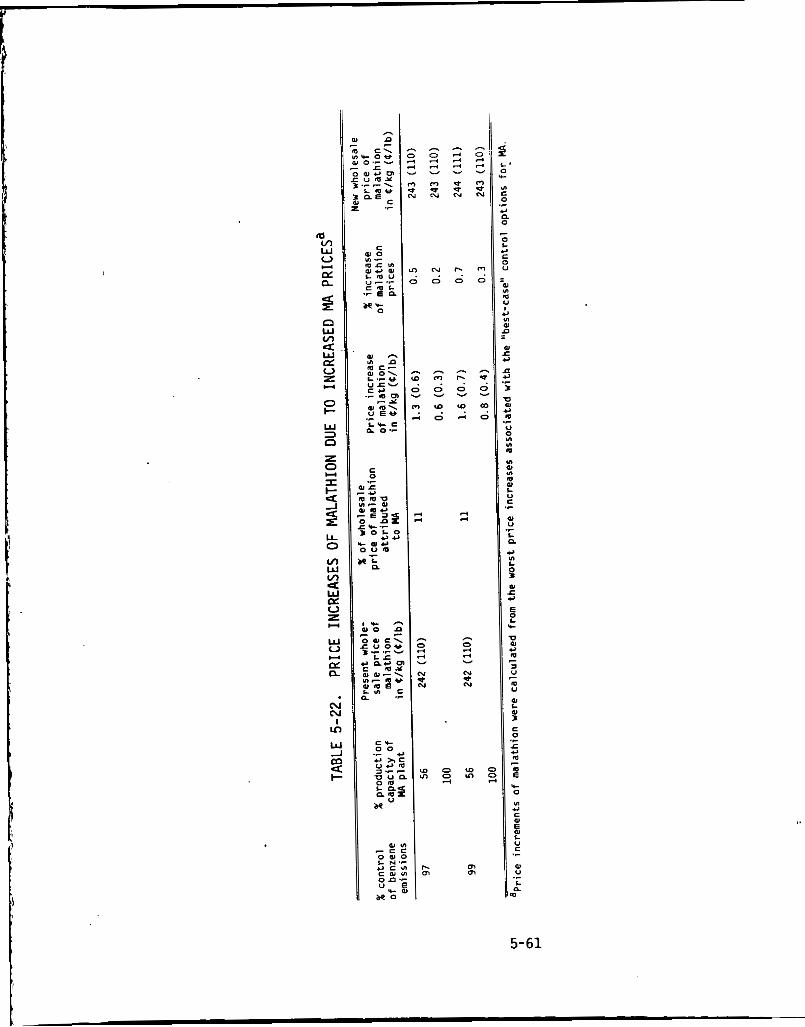
5-61
These increments a r e r e l a t i v e l y small s ince MA accounts f o r only 15 percent of the t o t a l s a l e s p r i ce of these resins; they represent only a 0.3- t o 0.9-percent increase over the wholesale price of res ins .
users of MA (10 percent of MA demand). malathion i s $2.42/kg ($ l . lO / lb ) ,* and MA accounts f o r 11 percent of t h i s price. Should MA p r i ces go up, the p r i ce of malathion could r i s e from 0.64 t o 1.64/kg (0.34 t o 0.74/lb). compared t o the t o t a l cost of the product, represent ing an increase of only 0.2 t o 0.7 percent over t he present pr ice of malathion.
i s pr imari ly used as a food acidulant . percent of the t o t a l p r i c e o f fumaric production. r e f l ec t ed i n the maximum potent ia l p r i ce increase of fumaric acid (1.64 t o 4.14/kg C0.74 t o 1.9U/lb]). increase over t he current s a l e pr ice of 944/kg (43Q/lb). 5 .4 .4
Agricul tural chemicals, such a s malathion, are the second l a r g e s t The current wholesale p r i ce of
Such an increment i s r e l a t i v e l y in s ign i f i can t
Another market f o r MA i s fumaric ac id (5 percent of MA demand), which MA accounts f o r approximately 73
This large percentage i s
This increase represents a 1.70- t o 4.40-percent
Employment and Balance of Trade Imposing a benzene control standard could a f f e c t employment i n the MA
industry and could a l t e r the present balance o f t rade . present ly employs approximately 330 indiv idua ls ; under a 99-percent control s tandard, one manufacturer--0ENKA--has ind ica ted t h a t cap i t a l expenditures f o r con t ro l s would prompt c losure. the t o t a l domestic capaci ty . If i t c loses , approximately 33 workers could lose t h e i r jobs . Tenneco is a l so considered a c losure candidate, although with l e s s c e r t a i n t y than DENKA. could lose t h e i r jobs.
control cos t s f o r U.S. producers could result in United S t a t e s producers losing up t o 12 percent of t h e i r market t o imports. on the present 1977 import penetrat ion of 2 . 3 percent i n t h e t o t a l domestic market and the poten t ia l f o r United S ta t e s br ique t te s a l e s , the only form t h a t i s imported--10 percent of the t o t a l domestic market--to lose t o
The MA industry
~
This company represents 10 percent of
I f Tenneco did c lose , roughly 12 employees
Regarding balance of trade, foreign competition exacerbated by benzene
This number i s based
*Increments r e f l e c t the maximum range of increments t h a t could occur using the worst p r ice increases associated with the l e a s t expensive add-on control options a t 97 and 99 percent benzene cont ro l .
5-62
f o re ign compet i t ion.
i s h i g h l y conservat ive; more l i k e l y , impor ts w i l l penet ra te l i t t l e o r no
more o f t h e domestic market over t h e next 5 years (see Sect ion 5.4.2.4).
5.4.5 F i f th -Year Impacts
occur r ing 5 years a f t e r t h e standard i s proposed:
The assumption o f a 12-percent market l oss t o imports
This sec t i on summarizes t h e f o l l o w i n g aggregate economic impacts
To ta l annual ized costs , Net increase i n na t i ona l energy consumption, and
I n f l a t i o n a r y impact on t h e cos t o f MA. p l a n t s w i l l be running a t f u l l capac i t y a t t h a t t ime.
It i s assumed t h a t t h e
For the 97-percent r e g u l a t o r y op t ion , t o t a l annual ized cos ts would be
about $2.1 m i l l i o n , i n c l u d i n g annual ized c a p i t a l costs and opera t i on and maintenance costs o f c o n t r o l and mon i to r i ng equipment. sumption o f energy w i t h 50 percent heat recovery c r e d i t would be approx i -
mately 180 TJ/yr (29,000 bb l /y r ) . 1 .2 percent over the c u r r e n t l i s t p r i c e . *
l.OU/kg (0.45U/lb), assuming t h e f u l l c o s t i s passed through t o t h e con-
sumer.
about $3.5 m i l l i o n .
(87,000 bbl /yr ) . the c u r r e n t l i s t p r i ce .
5.5 ECONOMIC IMPACTS OF USING n-BUTANE AS THE FEEDSTOCK AT NEW MALEIC
5.5.1 I n t r o d u c t i o n
a l t e r n a t e feedstock a t new male ic anhydr ide f a c i l i t i e s .
inc ludes impacts on domestic l i censo rs o f n-butane and benzene technology,
on t h e a v a i l a b i l i t y and p r i c e o f n-butane and benzene feedstock, and on t h e
economic l i f e o f e x i s t i n g male ic anhydr ide f a c i l i t i e s .
The a d d i t i o n a l con-
Furthermore, the p r i c e o f MA would r i s e Th is i s equ iva len t t o about
For t h e 99-percent r e g u l a t o r y op t ion , t o t a l annual ized costs would be
The a d d i t i o n a l energy consumption would be 540 TJ/yr
MA p r i c e s would r i s e 1.5Q/kg (0.7U/lb), o r 1.7 percent o f
ANHYDRIDE PLANTS
This sec t i on assesses t h e economic impact o f us ing n-butane as t h e
The assessment
*Derived by t a k i n g the increased t o t a l annual ized c o s t ( i n c l u d i n g monitor- i n g costs) f o r the e n t i r e i n d u s t r y and d i v i d i n g by t o t a l i n d u s t r y capac i ty (239 Gg). which company, i f any, w i l l emerge as t h e p r i c e leader.
Th is approach was taken s ince i t i s no t c l e a r a t t h i s t ime
5-63
5.5.2 Impact on Licensors
l icensing b o t h the benzene and n-butane processes. f i v e l icensing companies.” Of these f i v e , only one l icenses b o t h the benzene- and n-butane-based technology. benzene-based process.
I f n-butane were used as an a l t e r n a t e feedstock f o r new p lan t s , i t would be d i f f i c u l t t o p red ic t the e f f e c t on domestic producers. On one hand, i t i s l i k e l y the domestic l i censo r wil l maintain i t s foreign business because an EPA requirement would no t a f f e c t usage o f benzene-based technol- ogy abroad. competitive status o f i t s n-butane and butene c a t a l y s t s i f benzene replace- ment were mandated. 2o the success of t h e i r experimental work--is present ly unclear. technology i s usually a c losely held company sec re t . 5.5.3
benzene a s a feedstock in a new f a c i l i t y . has been estimated t o r e s u l t i n a s much as a 7.3U/kg (3.3U/lb) MA cos t reduction below benzene-based maleic anhydride. benzene has been r i s i n g a t a f a s t e r r a t e than the pr ice of n-butane, the cost- d i f f e r e n t i a ? between the-two-processes can be expected t o widen.
has been predicted through 1990 ( t h e time frame considered).21 n-butane market, however, supplies should continue t o be adequate t o meet
22 demand.
There i s only one domestic l i censo r of maleic anhydride technology, Abroad, there a re
The o ther four l icense only the
However, the company’s domestic business wil l depend on the
Which companies are developing these catalysts--and Catalyst
Impact on t he Price and Avai lab i l i ty of Feedstocks A t present, i t i s more economically favorable t o use n-butane than
Use of the n-butane feedstock
And because the pr ice of
Based on current t rends in the benzene market, a t i g h t benzene market In the
A recent U.S. Department of Energy proposal t o deregulate n-butane may, i f promulgated, cause n-butane p r i ces t o r i s e . However, p r ice increases t h a t r e s u l t from deregulation should not s ign i f i can t ly change market condi- t i ons o r the present makeup of consumers and end users.23 Moreover, n-butane pr ices should experience smaller p r i ce increases than benzene, although a large increase in n-butane pr ices may r e s u l t during the i n i t i a l stages of deregulation.
the United S ta t e s i s primarily re f in ing-or ien ted , with a v a i l a b i l i t y and The present benzene market i s already t i g h t . Benzene production in
5-64
I I
economics t i e d c l o s e l y t o gaso l ine and o ther fue l s .
o f benzene produc t ion i s from aromat ics produced as a byproduct o f the
petroleum r e f i n i n g process. A t present , l i t t l e new r e f i n i n g capac i ty i s
be ing added i n t h e i n d u s t r y because o f an a n t i c i p a t e d no-growth s i t u a t i o n
i n domestic gaso l ine product ion. I n a d d i t i o n , U.S. dependence on f o r e i g n
o i l s has a f f e c t e d benzene product ion. as domestic crude and, t he re fo re , has a lower aromatic concentrat ion. As
the aromat ics concent ra t ion from which benzene i s de r i ved decreases, t h e
economics o f e x t r a c t i o n become less a t t r a c t i v e . E i t h e r l ess benzene i s
produced o r h igher benzene p r i ces r e s u l t . A t present, benzene consumed i n U.S. MA p roduc t ion comprises 3 .7 per-
cent o f t h e t o t a l benzene consumption.” Th is percentage i s expected t o
increase . t o 4.4 percent by the year 1990.21 However, t h i s study does no t account f o r E P A ’ s poss ib le r e g u l a t i o n o f new maleic anhydride p lan ts .
n-Butane.is p r i m a r i l y der ived from na tu ra l gas as a coproduct o f
l i q u e f i e d petroleum gas.
consumed d i r e c t l y a t t h e r e f i n e r i e s t h a t produce it.
refinery-consumed n-butane i s d i f f i c u l t t o c a l c u l a t e because r e f i n e r i e s do no t keep accurate accounts o f t h e q u a n t i t y o f t h a t n-butane t h a t goes i n t o
t h e produc t ion o f o the r r e f i n e r y products. I n s p i t e o f the d i f f i c u l t y assoc iated wi th accu ra te l y c a l c u l a t i n g
n-butane supply and demand a t t h e r e f i n e r i e s , f i g u r e s on the n-butane
unused by these r e f i n e r i e s are ava i l ab le . Government s t a t i s t i c s show a t present an oversupply o f n-butane on t h e market.22 Because o f t h i s s i t ua -
t i o n , the U.S. Department o f Commerce r e c e n t l y considered t h e prospect o f
expor t i ng domestic n-butane.
The f u t u r e a v a i l a b i l i t y o f n-butane i s l i n k e d d i r e c t l y t o the f u t u r e
a v a i l a b i l i t y o f n a t u r a l gas and l i q u e f i e d petroleum gas. n e i t h e r na tu ra l gas nor LPG produc t ion i s expected t o increase s i g n i f i c a n t -
l y over the next decade. However, even i f increases are minimal, suppl ies
o f n-butane should adequately meet t h e domestic n-butane demand a t new MA p l a n t s because r e f i n e r i e s a re expected t o remain the prime users o f n-butane
and minimal increases are a n t i c i p a t e d i n t h e i r consumption pa t te rn .
One o f t h e main sources i
Fore ign o i l i s n o t as napthen ic - r i ch I
;
5
Most n-butane produced i n t h e Un i ted States i s The exact amount o f
i 22
’,
22
A t present,
22
5-65
\
5.5.4 Impact on the Economic L i f e o f E x i s t i n g P lan ts
would have no impact on t h e economic l i f e o f e x i s t i n g p lan ts .
i n Sect ion 5.2.3.2, use o f n-butane feedstock has l e d t o as much as a
7.3Q/kg (3.3Q/lb) MA cos t reduc t ion below benzene-based MA and cou ld lead t o a 25B/kg (11U/lb) d i f f e r e n t i a l . Because o f the economic advantage
associated wi th us ing n-butane feedstock, ma le ic anhydride manufacturers
would o p t t o use t h e n-butane process i n new p l a n t s regard less o f EPA's
requirement.
would n o t be d i r e c t l y a t t r i b u t e d t o the EPA requirement.
A requirement o f no de tec tab le benzene emissions a t new MA p l a n t s As mentioned
Thus, any impacts t h a t occur f rom new p l a n t s us ing n-butane
5.6
1.
2.
3.
4.
5.
~
6.
7.
a.
9.
10.
11.
REFERENCES Chemical P r o f i l e : Male ic Anhydride. Chemical Market ing Reporter. February 13, 1978.
Male ic Makers Bui ld on Hopes f o r Polyester . Chemical Week. February 2, 1977.
Male ic Anhydride Capaci ty Booming. October 4, 1976.
Neunre i te r , R. L. F l o r i d a S i t e Selected by Monsanto f o r New Maleic Anhydride P lan t (press release). Monsanto Chemical In termediates Co. S t . Louis, Mo. August 16, 1979.
B lackford, J. C. CEH Market ing Research Report on Male ic Anhydride Chemical Economics Handbook. S tan ford Research I n s t . Menlo Park, C a l i f . J u l y 1976. Lawson,J. FT EGTsionContFo l O p t i o n r f o r t h e Syn the t i c Organic- Chemicals Manufactur ing Indus t r y Ma le ic Anhydride--Product Report. Hydroscience, Inc . (Prepared f o r O f f i c e o f A i r Q u a l i t y Planning and Standards, U. S. Environmental P r o t e c t i o n Agency. Research T r iang le Park, N. C. ). EPA Contract Number 68-02-2577. March 1978.
Telecon. E. A. Epstein, Energy and Environmental Analys is , I n c . , w i t h M r . Pochowitz, Amoco. Apr i l 5, 1978.
Telecon. E. A. Epstein, Energy and Environmental Analysis, Inc . , w i t h E. Klecka, Manufactur ing Chemists Assoc. J u l y 3, 1979.
L e t t e r from Vatavuk, W i l l i a m M. , O f f i c e o f A i r Q u a l i t y Planning & Standards, U . S . Environmental P r o t e c t i o n Agency, t o Basala, A l len , U. S. Environmental P ro tec t i on Agency. A p r i l 1978.
Telecon. E. A. Epstein, Energy and Environmental Ana lys is , Inc. , w i t h Mr . Todd, Koppers Co. A p r i l 13, 1978.
Telecon. E. A. Epste in , Energy and Environmental Analys is , I nc . , w i t h M r . Kendr ik, OENKA. May 4, 1978.
Chemical and Engineer ing News.
5-66
12.
13.
i4.
15.
16.
17.
18.
19.
20.
21.
22.
23.
L e t t e r from Epstein, E. A., Energy and Environmental Ana lys is , I nc . , t o Magnusson, Fred, U.S. Department o f Commerce. June 29, 1979.
K ink ley , M. T., and R. B. N e v e r i l l . Cap i ta l and Operat ing Costs o f Selected A i r P o l l u t i o n Contro l System. Gard, Inc. N i l es , Ill. (Pre- pared f o r O f f i c e o f A i r Q u a l i t y P lanning and Standards, U.S. Environ- mental P ro tec t i on Agency.) EPA Cont rac t Number 68-02-2577. May 1977.
L e t t e r from Vatavuk, W i l l i am M., O f f i c e o f A i r Q u a l i t y Planning and Standards, U.S. Environmental P ro tec t i on Agency, t o Lorber, Joe, Hewlett-Packard. March 22, 1978.
L e t t e r from Hinkson, E., DENKA, t o T i p p i t t , Wi l l iam, U.S. Environ- mental P ro tec t i on Agency. June 12, 1979. L e t t e r from Hinkson, E. , DENKA, t o Warren, John, Research T r iang le I n s t . May 22, 1979. Telecon. E. A. Epstein, Energy and Environmental Analys is , Inc . , w i th Or. Mackay, U.S. Stee l . A p r i l 5, 1978.
L e t t e r from Epstein, E. A., and Thomasian, J., Energy and Environ- mental Analys is , Inc. , t o Far ley, Char les, Monsanto I n d u s t r i a l Chemicals Co. Apr i l 26, 1978.
L e t t e r from Far ley, Charles P . , Monsanto Chemical In termediates Co., t o Epstein, E. A . , Energy and Environmental Analysis, Inc . May 10, 1978. L e t t e r from Warren, J., Research T r i a n g l e I n s t . , t o Gans, M., S c i e n t i - f i c Design Co., Inc . February 2, 1979. Pace Co. MACRO/MICRO Economic Ana lys is o f Un i ted States Petrochemical Demand t o 1990, Volume 11. A p r i l 1, 1976.
L e t t e r from Epstein, E. A., Energy and Environmental Analys is , Inc . , t o Higgins, Terry, Economic Regulatory Admin is t ra t ion , U.S. Department o f Energy. A p r i l 4, 1978.
L e t t e r from Epstein, E. A., Energy and Environmental Analys is , Inc. , t o Wyatt, S., T i p p i t t , W., and Basala, A., U.S. Environmental Protec- t i o n Agency. May 10, 1979.
5-67
APPENDIX A
EVOLUTION OF THE B I D
A-1
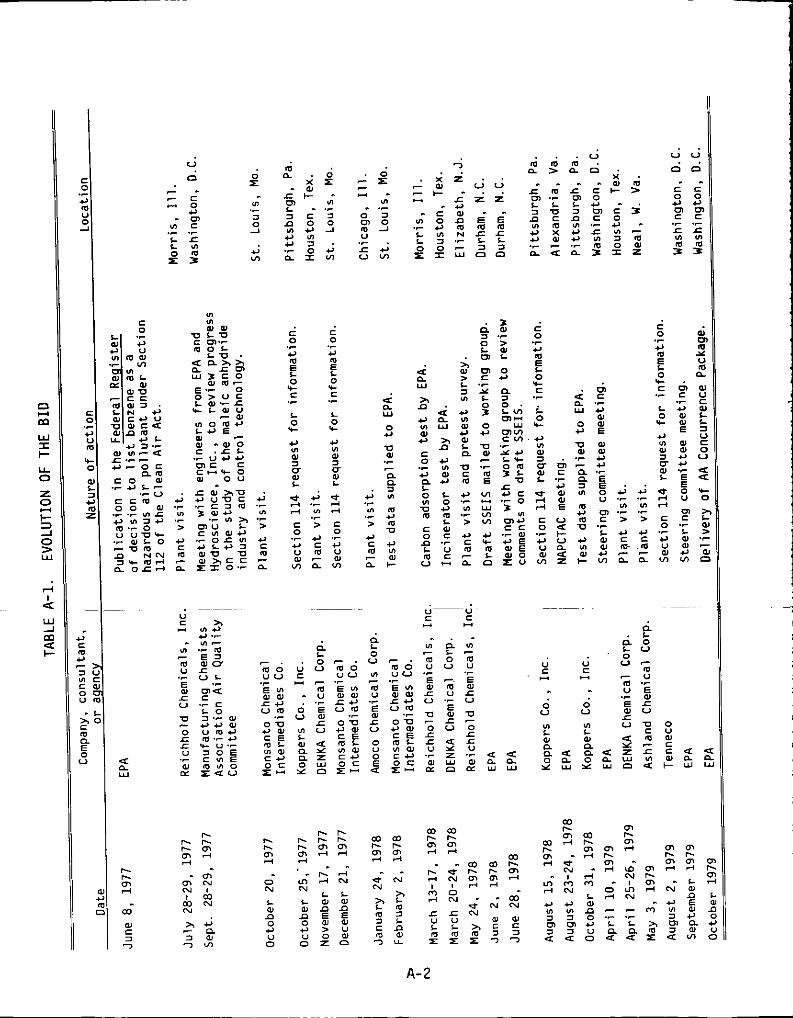
V
0 0 x 7 - . - e - 0
Y - m
V I c
L L L V I
z z 3
VI
3 0 .A
.- .- .-
U v)
o m
c c 0
Y U .r O .- E C L O L
m m
0
c .- .- L L
0 L O L
. . .. .r
c > c 0 0 .r Y .r Y C Y
w - w u m v m a -
2 Y
0 c)
u W
L O L V I 0 v u
L c w o c n .r L U v -
m m
m e
3 a .r o w L W . m L
d w
2 > L
VI
c) VI m c) w c
u c
Y
VI
> Y c
a
n
m
.r
.r
m
c 0 .L
m c c) 01 w E V U b- V n. U z
.r
a F a .r Y Y w o w Y E
2 .r VI
> Y c
n.
.r
(0. -
A- 2
i
APPENDIX E
INDEX TO ENVIRONMENTAL IMPACT CONSIDERATIONS
E-1
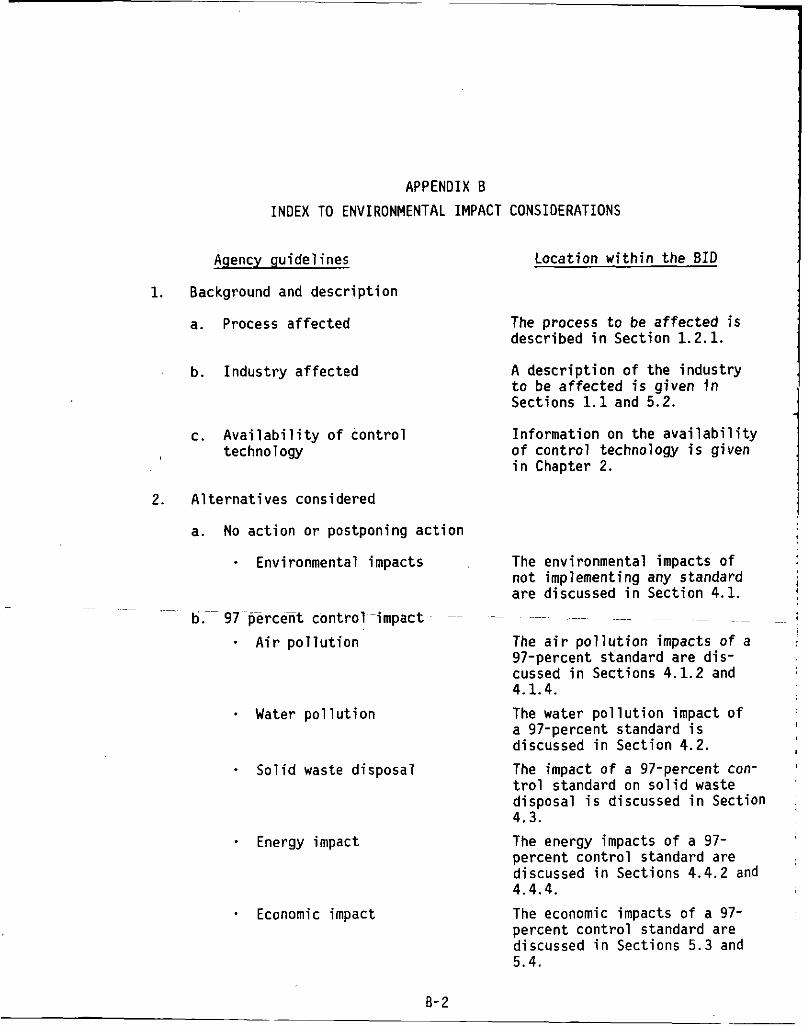
APPENDIX B INDEX TO ENVIRONMENTAL IMPACT CONSIDERATIONS
Locat ion within t h e BID
The process t o be a f f e c t e d i s descr ibed i n Sect ion 1.2.1.
A d e s c r i p t i o n o f the i ndus t r y t o be a f f e c t e d i s g iven i n
Agency gu ide l ines
1. Background and d e s c r i p t i o n
a. Process a f f e c t e d
J
b. I n d u s t r y a f f e c t e d
c . A v a i l a b i l i t y o f c o n t r o l techno1 ogy
2. A l t e r n a t i v e s considered
a. No a c t i o n o r postponing a c t i o n
Environmental impacts
b.-- 97 percent cont ro l - impact
* A i r p o l l u t i o n
Water p o l l u t i o n
S o l i d waste d isposa l
- Energy impact
* Economic impact
I n o t implementing any standard 4
1 The environmental impacts o f
a r e discussed i n Sect ion 4.1. ~~~~ ~~
~ ~~ ~~~~ ~~~~ ~~~
~~~~~
The a i r p o l l u t i o n impacts of a 97-percent standard are d i s - cussed i n Sections 4.1.2 and 4.1.4. The water p o l l u t i o n impact o f a 97-percent standard i s I
discussed i n Sect ion 4.2. The impact o f a 97-percent con- t r o l standard on s o l i d waste d isposal i s discussed i n Section ~
4.3. The energy impacts o f a 97- percent c o n t r o l standard are discussed i n Sect ions 4.4.2 and 4.4.4.
The economic impacts o f a 97- percent c o n t r o l standard are discussed i n Sections 5.3 and 5.4.
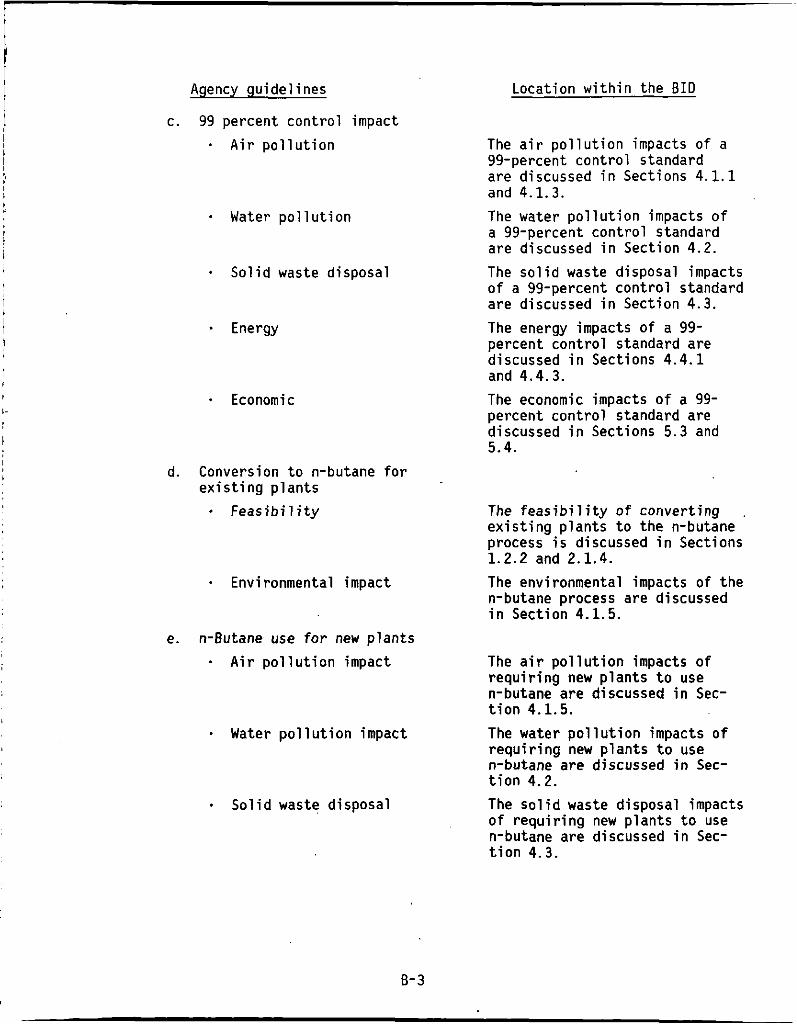
Agency gu ide l i nes
c. 99 percent c o n t r o l impact
* A i r p o l l u t i o n
Water p o l l u t i o n
l
S o l i d waste d isposal
Energy
* Economic I-
d. Conversion t o n-butane f o r e x i s t i n g p l a n t s
F e a s i b i l i t y
Environmental impact
e. n-Butane use f o r new p l a n t s
A i r p o l l u t i o n impact
Water p o l l u t i o n impact
. S o l i d waste d isposal
Locat ion w i t h i n the B I D
The a i r p o l l u t i o n impacts o f a 99-percent c o n t r o l standard a r e discussed i n Sect ions 4 .1 .1 and 4.1.3. The water p o l l u t i o n impacts o f a 99-percent c o n t r o l standard are discussed i n Sect ion 4.2.
The s o l i d waste d isposal impacts o f a 99-percent c o n t r o l standard are discussed i n Sect ion 4.3. The energy impacts o f a 99- percent c o n t r o l standard are discussed i n Sections 4.4.1 and 4.4.3.
The economic impacts o f a 99- percent c o n t r o l standard are discussed i n Sect ions 5.3 and 5.4.
The f e a s i b i l i t y o f conver t ing e x i s t i n g p l a n t s t o t h e n-butane process i s discussed i n Sect ions 1.2.2 and 2.1.4.
The environmental impacts o f t h e n-butane process are discussed i n Sect ion 4.1.5.
The a i r p o l l u t i o n impacts o f r e q u i r i n g new p l a n t s t o use n-butane a r e discussed i n Sec- t i o n 4.1.5.
The water p o l l u t i o n impacts o f r e q u i r i n g new p l a n t s t o use n-butane a r e discussed i n Sec- t i o n 4.2.
The s o l i d waste d isposa l impacts o f r e q u i r i n g new p l a n t s t o use n-butane are discussed i n Sec- t i o n 4.3.
8-3
Agency gu ide l ines
- Economic impact
Locat ion w i t h i n the BID
The economic impacts o f requ i r - i n g new p l a n t s t o use n-butane a r e discussed i n Sect ion 5.5.
. Energy impact The energy impacts o f requ i r ing new p l a n t s t o use n-butane are discussed i n Sect ion 4.4.5.
:
B-4
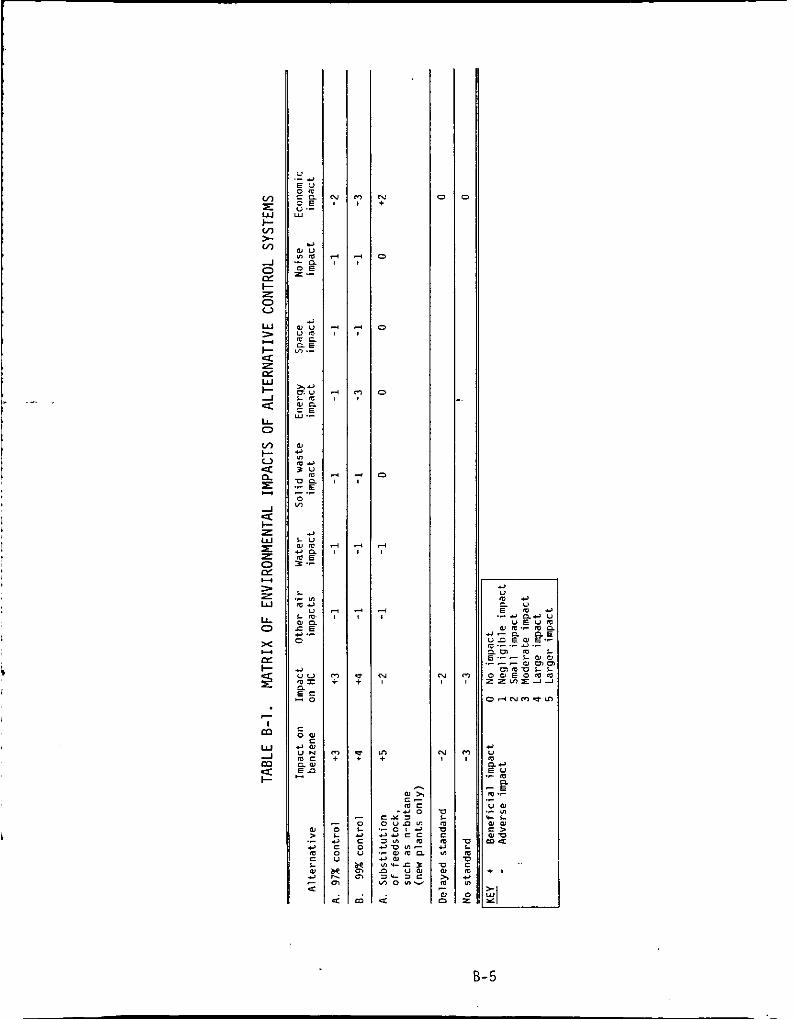
,
N
3
3
3
3
3
-
CI +
0 +
- 0 L Y c 0 U
E 01
u w 01
m
N
0
0
D
0
3
3
N
Y) +
u > YI
8-5
APPENDIX C
E M I S S I O N SOURCE TEST DATA
c- 1
-i 1
APPENDIX C
EMISSION SOURCE TEST DATA
C.l INTRODUCTION The purpose o f t h i s appendix i s t o p resent and summarize da ta gathered
du r ing t h e development o f a standard f o r benzene emissions from t h e produc- t i o n o f male ic anhydride.
source t e s t i n g methods are i d e n t i f i e d .
and processes by name does no t c o n s t i t u t e endorsement by t h e U.S. Environ-
mental P r o t e c t i o n Agency.
C.2 SUMMARY
The f a c i l i t i e s t e s t e d are descr ibed and t h e Any reference t o commercial products
Two separate y e t s i m i l a r f a c i l i t i e s producing maleic anhydride were
P o l l u t a n t s analyzed and procedures used were:
t es ted t o determine percent reduc t i on o f emissions.
by a d i f f e r e n t con t rac tor .
- Benzene ~-~
Each p l a n t was t e s t e d
- - - D r a f t EPA Method - ~-
To ta l hydrocarbons (THC) D r a f t EPA Method *Carbon d iox ide EPA Method 10/0rsat *Oxygen EPA Method 10 /0rsa t *Carbon monoxide EPA Method 10/0rsat *Methane D r a f t EPA Method *Ethane D r a f t EPA Method To ta l organic ac ids (TOA) TLAAPCD Method Tota l aldehydes LAAPCD Method Formaldehyde LAAPCD Method Temperature Thermocouple Duct pressure EPA Method 2 Volumetr ic f l o w r a t e EPA Method 2
EPA Method 7
Although produc t ion f a c i l i t i e s a r e s i m i l a r i n t h e two p l a n t s , t h e
NoX
means o f emissions c o n t r o l are d i f f e r e n t . P lan t A c o n t r o l s emissions by use
*Data no t presented i n t e x t . tLAAPCD--Los Angeles A i r P o l l u t i o n Cont ro l D i s t r i c t .
c-2 _ _ ~ _ _
o f a carbon adsorpt ion system, wh i l e P l a n t B uses an i n c i n e r a t o r .
a v a i l a b l e data i n d i c a t e t h a t i n c i n e r a t i o n prov ides s l i g h t l y h igher removal
e f f i c i e n c i e s f o r benzene and t o t a l hydrocarbons, wh i l e carbon adsorp t ion i s
acceptable and i s more cons is ten t i n removing emissions.
C.3 DESCRIPTION OF FACILITIES C.3.1 P lan t A
The
Th is p l a n t uses a s i n g l e - t r a i n , m u l t i p l e reac to r process w i t h a capac i ty
o f 20,000 Mg/yr o f male ic anhydride. were taken, t h e p l a n t was opera t ing a t about 40 percent o f i t s design
capaci ty .
Male ic anhydride i s produced a t P l a n t A (Table C - 1 ) by the vapor phase
o x i d a t i o n o f benzene i n a t u b u l a r reac tor . passes through a ser ies o f sw i tch condensers t h a t are f i r s t cooled t o
f reeze t h e male ic anhydride from s o l u t i o n and l a t e r heated t o me l t the
maleic anhydr ide f o r pumping t o storage.
remaining exhaust gas en ters t h e product recovery absorber, which scrubs
the exhaust w i t h water o r aqueous male ic ac id . The l i q u i d e f f l u e n t from the absorber i s about 40 percent , by weight , male ic ac id . Vented emissions from t h e absorber a re d i r e c t e d t o t h e carbon adsorp t ion system.
t i a l l y a l l process emissions e x i t through the product recovery absorber.
lead ing i n t o the th ree carbon adsorp t ion u n i t s .
i s l oca ted i n t h e 1.07-m I . D . s t a i n l e s s s t e e l exhaust stack, 11.6 m from the bottom o f i t s 29.3-m height .
heated t o a temperature o f 49' t o 74' C (120' t o 165' F).
a t the onset o f a 1-hour desorpt ion cyc le and l a s t e d f o r t h ree f u l l cyc les
(3 hours).
f i e l d by gas chromotography w i t h flame i o n i z a t i o n detect ion. ethane concentrat ions were no t determined because o f inadequate r e s o l u t i o n
by r e t e n t i o n time. To ta l hydrocarbons were determined as propane.
sample r e a c t i o n w i t h sodium b i s u l f a t e , pH adjustment f r e e i n g b i s u l f a t e ions
i n an amount equ iva len t t o the aldehydes present , and t i t r a t i o n w i t h a
A t t h e t ime samples f o r t h i s study
The r e s u l t i n g reac to r exhaust
A f t e r t h e f r e e z i n g process, the
Essen-
The s i n g l e i n l e t sampling p o r t i s l oca ted i n the 1.07-m I . D . duc t
The o u t l e t sampling p o r t
3 I n t e g r a t e d gas samples were obta ined i n Tedlar@ bags (0.113 m3 [4 f t I ) , Sampling commenced
Benzene and t o t a l hydrocarbon concentrat ions were determined i n t h e
Methane and
To ta l aldehydes were determined us ing t h e LAAPCD Method, i n v o l v i n g
c- 3
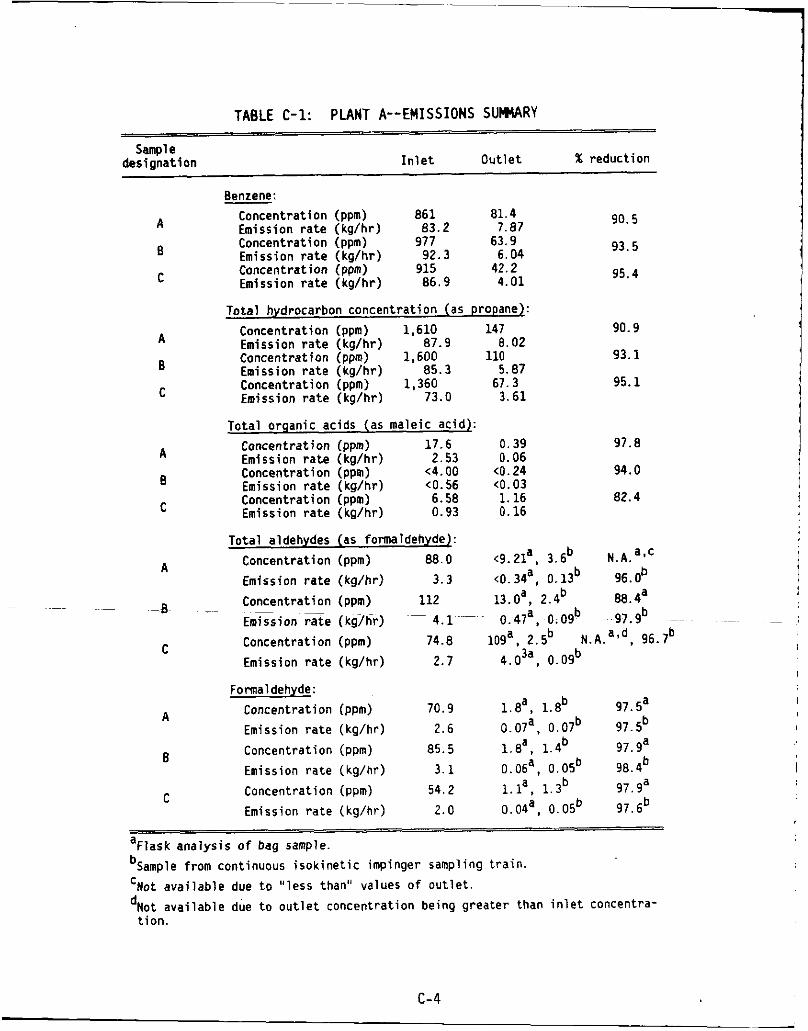
TABLE C-1: PLANT A--EMISSIONS SUmARY - Sample
desi gna t i on I n l e t Ou t le t % reduct ion
A
8
C
A
B
C
A
B
C
A
~ -E
C
A
B
C
Benzene: Concentrat ion (ppm) 861 81.4 Emission r a t e (ka/hr) 83.2 7.87 90.5
93.5
95.4
Concentrat ion (ppm) 977 63.9 Emission r a t e (kg/hr) 92.3 6.04 Concentrat ion ( ppm) 915 42.2 Emission r a t e (kg/hr) 86 .9 4.01
Tota l hydrocarbon concentrat ion (as propane): Concentrat ion (ppm) 1.610 147 90.9 Emission r a t e (kg/hr) 87.9 8.02 Concentrat ion (ppm) 1,600 110 93.1 Emission r a t e (kg/hr) 85.3 5.87 Concentrat ion (ppm) 1,360 67.3 95.1 Emission r a t e (kg/hr) 73.0 3.61
Tota l organic acids (as maleic acid): Concentrat i o n (ppm) 17.6 0.39 97.8 Emission r a t e (kg/hr) 2.53 0.06 Concentrat ion (ppm) (4.00 (0.24 94.0 Emission r a t e (kg/hr) (0.56 (0.03 Concentrat ion (ppm) 6.58 1.16 02.4 Emission r a t e (kg/hr) 0.93 0.16
Total aldehydes (as formaldehyde): Concentrat ion (ppm) 88.0 <9.21a, 3.6b N.A.a'C
Emission r a t e (kg/hr) 3 . 3 ~ 0 . 3 4 ~ , 0.13 96.0b Concentrat ion (ppm) 112 13.0a, 2.4 b m.4a EmGsion =e ( k g h r ) ~ 4 .1 ~ 0.47a, 0.09 97.9b Concentrat ion (ppm) 74.8 loga, 2.5b N.A.a'd, 96.7b
b Emission r a t e (kg/hr) 2.7 0.09
Formaldehyde: Concentrat ion (ppm) 70.9 L e a , 1.8b 97. Sa
Concentrat ion (ppm) 85.5 l .Ba , 1.4b 97.9"
Concentrat ion (ppm) 54.2 l.la, 1.3b 97.ga
Emission r a t e (kg/hr) 2.6 0.07a, 0.07b 97.Sb
Emission r a t e (kg/hr) 3 . 1 0.06a, O.OSb 98.4b
Emission r a t e (kg/hr) 2.0 0.04a, O.OSb 97.6b
aFlask ana iys is of bag sample.
bSample from continuous i s o k i n e t i c impinger sampling t r a i n . 'Not ava i l ab le due t o " l ess than" values o f o u t l e t .
dNot ava i l ab le due t o o u t l e t concentrat ion being grea ter than i n l e t concentra- t i o n .
c-4
standard i od ine s o l u t i o n . Formaldehyde i s determined by sample reac t i on
w i t h sodium b i s u l f a t e , r e a c t i o n w i t h chromotropic ac id , and c o l o r i m e t r i c
determinat ion o f a un ique ly co lo red compound formed i n t h e second react ion.
Samples f o r formaldehyde and t o t a l aldehydes were taken from the bag samples and from a continuous i s o k i n e t i c impinger sampling t r a i n . Both r e s u l t s a re
presented.
w i t h the LAAPCD A i r P o l l u t i o n Source Tes t ing Manual, November 1963. This
method invo lves " f i e l d f i x i n g " samples w i t h sodium hydroxide and t r a n s f e r
t o t h e l a b f o r e t h e r e x t r a c t i o n o f organic ac ids and t i t r a t i o n w i t h a
standard base.
Analys is f o r To ta l Organic Acids (TOA) was conducted i n accordance
The EPA Method 3 (Orsat) was used f o r determin ing C02, 02, and CO. For P lan t A, i n a d d i t i o n t o ana lys i s o f t h e gas stream a t t h e i n l e t
and o u t l e t o f t h e emission c o n t r o l system, water samples from the d r a i n t o the product recovery absorber were analyzed f o r benzene, TOA, formaldehyde,
and t o t a l aldehydes.
C.3.2 Plan t B This p l a n t has a maximum p roduc t i on capac i ty o f 23,000 Mg/yr o f maleic
anhydride. A t t h e t ime samples f o r t h i s study were taken, t h e p l a n t was I
opera t ing a t about 70 percent o f i t s des ign capaci ty . P lan t personnel d i d
not t h i n k the lower p roduc t ion r a t e would se r ious l y a f f e c t the v a l i d i t y o f
the r e s u l t s .
Maleic anhydride i s produced a t P l a n t E (Table C-2) by t h e vapor phase ox ida t i on o f benzene i n a t u b u l a r reac tor . gas passes through a p a r t i a l condenser t h a t separates ou t a p o r t i o n o f the
crude maleic anhydride. The remaining exhaust gas enters the product
recovery absorber, which scrubs t h e exhaust w i t h water o r aqueous maleic
a c i d and produces an aqueous s o l u t i o n con ta in ing about 40 percent, by weight, maleic ac id .
i nc ine ra to r .
recovery absorber.
the i nc ine ra to r . 7.5-cm I D i n c i n e r a t o r o u t l e t ducts. The o u t l e t p o r t s were loca ted down-
stream o f any phys ica l d isturbances.
The r e s u l t i n g reac to r exhaust
The exhaust gas from the absorber i s d i r e c t e d t o an
E s s e n t i a l l y a l l process emissions e x i t through t h e product
A s i n g l e i n l e t sampling p o r t i s l oca ted i n the 0.91-m I D i n l e t duct t o
An o u t l e t sampling p o r t i s loca ted a t each o f e i g h t
c-5 I
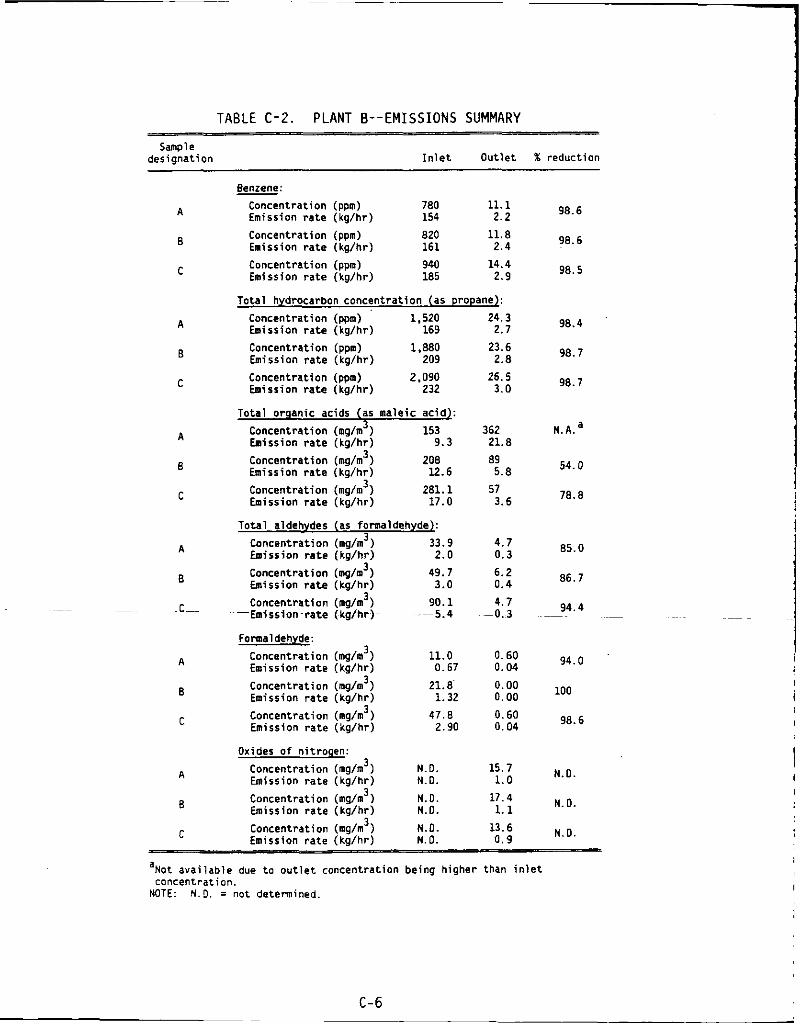
TABLE C-2. PLANT 6- -EMISSIONS SUMMARY
Sample designation I n l e t Out le t % reduction
A
8
C
A
8
C
A
B
C
A
8
~C~
A
E
C
A
8
C
Concentration (ppm) 1.520 Emission r a t e (kg/hr) 169
Concentration (ppm) 1.880
Concentration (ppm) 2.090
Emission r a t e (kg/hr) 209
Emission r a t e (kg/hr) 232
Total orqanic acids (as maleic acid):
153
208 Emission r a t e (kg/hr) 12.6
281.1 Emission r a t e (kg/hr) 17.0
3 Concentration (mg/m Emission r a t e (kg/hr) 9.3 Concentration (mg/m 3 1
Concentration (mg/n 3 )
Total aldehvdes (as formaldehyde): 33.9
49.7 Emission r a t e (kg/hr) 3.0
90.1
3 Concentration (mg/m ) Emission r a t e (kg/hr) 2.0 Concentration (mg/m 3 )
Concentration (mg/m 3 )
Concentration (mg/m 3 )
Concentration (mg/m 3 )
Concentration (mg/m 3 )
Concentration (mg/m 3 )
-Emission-rate (kg/hr)- --5.4
Formaldehyde:
11.0
21.8
47.8
Emission r a t e (kg/hr) 0.67
Concentration (mg/m ) Emission r a t e (kg/hr) 1.32
3
Emission r a t e (kg/hr) 2.90
Oxides of nitroqen: N.D.
Emission r a t e (kg/hr) N.D.
N.O. Emission r a t e (kg/hr) N.D.
m: Concentration (ppm) 780 11.1 Emission r a t e (kg/hr) 154 2.2
Concentration (ppm) 820 11.8 Emission r a t e (kg/hr) 161 2.4
Concentration (ppm) 940 14.4 Emission r a t e (kg/hr) 185 2.9
Total hydrocarbon concentrat ion (as propanel: 24.3
2.7
23.6 2.8
26.5 3.0
362 21.8 89 5.8
57 3.6
4.7 0.3
6.2 0.4
4.7 -0.3
0.60 0.04
0.00 0.00
0.60 0.04
15.7 1.0
17.4 1.1
13.6
98.6
98.6
98.5
98.4
98.7
98.7
N . A . ~
54.0
78.8
85.0
86.7
94.4 ~~
94.0
100
98.6
N.D.
N.O.
N . D . N.D. Concentration (mg/m 3 )
Emission ra te (kg/hr) N. 0. ..
Not ava i lab le due t o o u t l e t concentration being higher than i n l e t concentration,
a
NOTE: N . I . = n o t determined.
I
Gas samples were obtained according to the EPA draft method for ben- zene, in 70-L (2.5 cf) Mylar@ bags, heated to 66' C (151' F ) . carbons, benzene, methane, and ethane were determined by gas chromatography, with flame ionization detection. Total hydrocarbons were determined as propane. Carbon dioxide, oxygen, and carbon monoxide were analyzed by nondispersive infrared spectroscopy, using Orsat analysis to determine percentages.
Total organic acids in the samples were analyzed according to the LAAPCD Method, which involves bubbling the sampled gas through a dilute sodium hydroxide solution, acidification, ether extraction of the organic acids, and titration with a standard base. The LAAPCD Method employed for total aldehydes entails sample reaction with sodium bisulfate, pH adjust- ment freeing bisulfate ions, and titration with a standard iodine solution. Formaldehyde is determined by sample reaction with sodium bisulfate, reac- tion with chromotropic acid, and colorimetric determination of a uniquely colored compound formed in the second reaction.
Method 7, employing colorimetric analysis of a complex ion formed by reac- tion of organic acids with the NOx. thermocouple, and duct pressure by water manometer, according to EPA Refer- ence Method 2.
Total hydro-
Oxides of nitrogen (NOx) were determined according to EPA Reference
Duct temperature was obtained by
c-7
APPENDIX D
' . I
EMISSION MEASUREMENT AND CONTINUOUS MONITORING
..
D-1
APPENDIX D
E M I S S I O N MEASUREMENT AND CONTINUOUS MONITORING
0 . 1 EMISSION MEASUREMENT METHODS D. 1.1 General Background
tems hand l ing pure benzene, e x i s t i n t h e presence o f o the r organics. Accord ing ly , methods f o r benzene ana lys i s cons is t f i r s t o f separa t ing the
benzene from o ther organics, fo l lowed by measuring the q u a n t i t y o f benzene w i t h a flame i o n i z a t i o n de tec tor .
groups concerned w i t h measuring benzene, t h e r e i s no u n i f o r m i t y o f proce- dures. Problems of u n i f o r m i t y cou ld e x i s t i n t h e f o l l o w i n g areas:
For s tack sampling purposes, benzene w i l l , except i n t h e case o f sys-
However, among var ious s t a c k - t e s t i n g
- Sample c o l l e c t i o n ,
Sample i n t r o d u c t i o n t o gas chromatograph, Chromatographic column and associated opera t ing parameters, and
Chroma tograph C a l i b r a t ion. ~
~ ~
- ~~
- . Two poss ib le approaches f o r benzene sample c o l l e c t i o n are grab samples
~ ~
and i n teg ra ted samples.
cons iderably du r ing a s h o r t per iod , the i n teg ra ted sample approach i s more
advantageous s ince emission f l u c t u a t i o n s due t o process v a r i a t i o n s are
au tomat i ca l l y averaged.
number o f samples t h a t need t o be analyzed. tubes con ta in ing a c t i v a t e d charcoal and Tedlar@ bags have been used. How-
ever, charcoal sampling tubes were b a s i c a l l y designed f o r sampling ambient
concent ra t ion l e v e l s o f organics. Because source e f f l u e n t concentrat ions
are expected t o be h igher ( p a r t i c u l a r l y s ince organics o the r than benzene
cou ld be present) , unce r ta in t y would be i nvo l ved i n p r e d i c t i n g sample
breakthrough o r sample te rmina t ion .
Because benzene emission concentrat ions may vary
I n add i t i on , t h e i n teg ra ted approach reduces the For i n t e g r a t e d samples, bo th
Bag samples would a l s o o f f e r the bes t
0-2
p o t e n t i a l f o r p r e c i s i o n because no in te rmed ia te sample recovery step would be invo lved.
Based on the above considerat ions, c o l l e c t i n g an i n t e g r a t e d sample i n (3 bags appears t o be the bes t a l t e r n a t i v e , a conclus ion shared by an Tedlar
€PA-funded study whose purpose was t o propose a general measurement tech- nique f o r gaseous organic emissions.' Another study o f benzene s t a b i l i t y
i n Tedlar bags was undertaken t o con f i rm the soundness o f t h i s approach.
Because t h i s study showed no s i g n i f i c a n t d e t e r i o r a t i o n o f benzene over a pe r iod o f 4 days, t h e i n t e g r a t e d bag technique was deemed su i tab le . However,
anyone p r e f e r r i n g t o use a c t i v a t e d charcoal tubes has t h i s op t ion , prov ided
t h a t e f f i c i e n c y equal t o o r b e t t e r than the bag technique can be demonstrated and procedures t o p r o t e c t the i n t e g r i t y o f t h e sampling technique are
f o 11 owed.
by us ing a g a s - t i g h t syr inge o r an automated sample loop.
approach was se lec ted ' fo r the reference method because i t has less p o t e n t i a l
f o r leakage and prov ides a more reproduc ib le sample volume. Several columns are mentioned i n t h e l i t e r a t u r e t h a t may be s u i t a b l e
f o r separat ing benzene from o ther gases. 3,4 Most no tab le a re 1, 2, 3 - t r i s (2-cyanoethoxy) propane f o r separat ing aromat ics from a1 i p h a t i c s and Ben-
tone 34 f o r separa t ing aromat ics. whether var ious organics associated w i t h benzene i n s tack emissions i n t e r - f e red w i t h t h e benzene peaks f r o m the two columns. 5 y 6 The study revealed
the former column t o be s u i t a b l e f o r ana lyz ing benzene i n gaso l ine vapors
and the l a t t e r column t o be s u i t a b l e f o r analyz ing benzene emissions from maleic anhydride p lan ts . I t should be noted t h a t s e l e c t i o n o f these two
columns f o r i n c l u s i o n i n Method 110 does no t mean t h a t some o the r column(s)
may no t work equa l l y w e l l .
o the r columns.
@ 2
A c o l l e c t e d gas sample can be in t roduced t o a gas chromatograph e i t h e r The l a t t e r
A program was undertaken t o e s t a b l i s h
I n f a c t , t h e method has a p r o v i s i o n f o r us ing
C a l i b r a t i o n has been accomplished by two techniques, t h e most common
be ing the use o f c y l i n d e r standards. i n g known q u a n t i t i e s o f 99 mole percent pure benzene i n t o Tedlar@ bags as
they are be ing f i l l e d w i t h known volumes o f n i t rogen.
has been found t o produce equa l l y acceptable r e s u l t s ; bo th are inc luded i n
Method 110.
The second technique invo lves i n j e c t -
The second technique
D-3
4
0.1.2 F i e l d Tes t i ng Experience
in te r fe rences by var ious process-associated gases, and o f c a l i b r a t i o n
methods, and as a r e s u l t o f a f i e l d s tudy and t e s t s conducted a t sources o f
benzene emissions, a new d r a f t o f Method 110 f o r determin ing compliance w i t h benzene standards o r NESHAPS was prepared. This method i s the same as
t h e o r i g i n a l l y i n v e s t i g a t e d method, except t h a t the a u d i t procedure has
been r e f i n e d and an appendix has been added t o he lp v e r i f y benzene peak
reso lu t i on .
Based on t h e s tudy o f benzene s t a b i l i t y i n Tedlar@ bags, o f poss ib le
Two male ic anhydr ide manufactur ing p l a n t s were tes ted du r ing the
development t e s t program. system, and t h e o the r employed a thermal o x i d i z e r ( i n c i n e r a t o r ) t o c o n t r o l
organic emissions. Method 110 was used t o c o l l e c t and analyze f o r benzene emissions. The SP 1200/Bentone 34 gas chromatographic column descr ibed i n
t h g method was used t o reso lve t h e benzene.
Method 110 were requ i red . A t the p l a n t employing t h e carbon adsorpt ion
system, a l i q u i d dropout was requ i red t o p revent i n t e r m i t t e n t en t ra ined l i q u i d from be ing in t roduced i n t o t h e i n t e g r a t e d bag sample.
entrainment, caused when an undr ied steam-desorbed carbon bed was r e i n t r o -
duced i n t o t h e c o n t r o l system, occurred 5 percent o f t h e sampling time. A
rotameter was a l s o i n s t a l l e d a t t h e i n l e t t o the i n teg ra ted bag sample a t
t h i s p l a n t because t h e r i g i d con ta ine r h o u s i n g t h e bag sample cou ld n o t be
adequately sealed. Ne i the r o f these two dev ia t i ons are considered t o have a f f e c t e d da ta v a l i d i t y .
The sampling l i n e s and bags were maintained a t o r s l i g h t l y above the
source temperature du r ing c o l l e c t i o n and ana lys is t o prevent condensation
o f organics t h a t would normal ly be a vapor a t the source temperature.
t e s t program.
terms o f concent ra t ion , mass r a t e , and c o n t r o l system mass removal e f f i - c i ency .
D.2 CONTINUOUS MONITORING
One o f these p l a n t s employed a carbon adsorpt ion
No major dev ia t ions from
Th is l i q u i d
Organic a c i d and aldehyde emission data were a l so c o l l e c t e d du r ing t h e
Data were c o l l e c t e d t o adequately determine emissions i n
No emission-monitor ing ins t rumenta t ion , data a c q u i s i t i o n , o r data
process ing equipment have been i d e n t i f i e d f o r measuring benzene from male ic
anhydride p l a n t s tack gases. However, the U.S. Environmental P ro tec t i on
Agency (EPA) has only recently begun to explore the development of specifi- cations for a system for benzene monitoring; such a system, which would employ a package of individual, commercially available items, is considered feasible.
For a chromatographic system that measures benzene concentration, the installed cost o f the chromatograph and its auxiliaries, which include gas chromatograph with dual-flame detector, automatic gas sampling valve, air sampler, post-run calculator, and gas regulators, is $35,000. This figure would increase by approximately $10,000 for the additional hardware neces- sary to report a benzene mass emissions rate in terms of benzene feedstock. Depending on the operating factor, the direct operating cost varies from about $1,200 to $1,400 per year.
~ . 3 EMISSION TEST METHODS The recommended emission test method for determining benzene emission
concentrations at maleic anhydride plants is Method 110. the Method 106 train for sampling and a gas chromatograph/flame ionization detector equipped with a column selected for separation of benzene from the other organics present ,for analysis.
Emission Standards for Hazardous Air Pollutants be constructed to provide sampling ports adequate for the applicable test methods, and platforms, access, and utilities necessary to perform testing at those ports.
Assuming that the test location is near the analytical laboratory and that sample collection and analytical equipment are available, the cost of field collection, laboratory analysis, and reporting of benzene emissions in triplicate from a single stack is estimated to be $2,500 to $3,500 for an emission test effort. This amount would be reduced by approximately 50 percent per stack if several stacks were tested.
The method uses
Subpart A of 40 CFR 61 requires that facilities subject to National
This figure assumes a cost of $25 per person-hour.
If the plant established in-house sampling capabilities and conducted its own tests and/or analyses, the cost per person-hour could be less.
D- 5
D. 4 REFERENCES 1. Feairheller, W. R., A. M. Kemmer, B. J. Warner, and D. Q. Douglas.
Measurement of Gaseous Organic Compound Emissions by Gas Chromatography. EPA Contract Number 68-02-1404. January 1978.
2. Knoll, Joseph E., Wade H. Penny, and M. Rodney Midgett. The Use of Tedlar Bags to Contain Gaseous Benzene Samples at Source-Level Concen- trations. U.S. Environmental Protection Agency. Research Triangle Park, N.C. EPA Publication Number 600-78-057. September 1978.
3. Separation of Hydrocarbons. Bulletins 743A, 740C, and D. Supelco, Inc. Bellefonte, Pa. 1974.
4. Current Peaks. - 1O:l. Carle Instruments, Inc. Fullerton, Calif.
5.
1977.
Letter from Knoll, Joseph E., Environmental Monitoring Systems Labora- tory, U.S. Environmental Protection Agency, to Grimley, William, Emission Standards and Engineering Division, U.S. Environmental Protec- tion Agency. October 18, 1977.
tory, U.S. Environmental Protection Agency, to Grimley, William, Emission Standards and Engineering Division, U.S. Environmental Protec- tion Agency. November 10, 1977.
6. Letter from Knoll, Joseph E., Environmental Monitoring Systems Labora-
D-6 ~
APPENDIX E
METHODOLOGY FOR ESTIMATING MORTALITY AND L I F E T I M E
R I S K FROM EXPOSURE TO BENZENE EMISSIONS FROM MALEIC ANHYDRIDE PLANTS
E - 1
APPENDIX E
METHODOLOGY FOR ESTIMATING MORTALITY AND LIFETIME
R I S K FROM EXPOSURE TO BENZENE EMISSIONS FROM MALEIC ANHYDRIDE PLANTS
E . l INTRODUCTION.
The purpose of t h i s appendix i s t o descr ibe t h e methodology used i n
es t ima t ing leukemia m o r t a l i t y and l i f e t i m e r i s k a t t r i b u t a b l e t o popu la t i on
exposure t o benzene emissions from male ic anhydr ide manufactur ing p l a n t s . The appendix i s presented i n th ree p a r t s :
Pa r t E.2, Summary and Overview o f Hea l th E f f e c t s , summarizes and references reoor ted h e a l t h e f f e c t s f r o m benzene exposure. The major repo r ted h e a l t h e f f e c t i s leukemia. the B I D i nc lude on ly t h e est imated leukemia cases a t t r i b u t a b l e t o exposure t o benzene emissions from e x i s t i n g maleic anhydride p lan ts a l though other , sometimes f a t a l , e f f e c t s a re known t o r e s u l t from benzene exposure.
Par t E.3, Populat ion Densi ty AFGnd Male ic Anhydride P lan ts , descr ibes the method used t o est imate t h e popu la t ion a t r i s k ; i . e . , persons r e s i d i n g w i t h i n 20 km o f e x i s t i n g male ic anhydride p lan ts .
Par t E.4, Populat ion Exposures, R isks , and M o r t a l i t i e s , descr ibes the methodology f o r e s t i m a t i n g benzene emissions from a model p l a n t , c a l c u l a t i n g expected popu la t i on exposures, and es t ima t ing leukemia deaths a t t r i b u t a b l e t o benzene emissions from the e i g h t e x i s t i n g U.S. p lan ts .
M o r t a l i t i e s c i t e d i n
-~~~ -~
-
E.2
E.2.1 Hea l th E f f e c t s Associated w i t h Benzene Exposure
A l a rge number o f occupat ional s tud ies over the pas t 50 years have prov ided evidence o f severe h e a l t h e f f e c t s i n humans from prolonged inha la -
t i o n exposure t o benzene.
benzene have r e c e n t l y been reviewed and analyzed i n terms o f a p p l i c a t i o n t o
SUMMARY AND OVERVIEW OF HEALTH EFFECTS
1 Some 300 's tud ies of t h e h e a l t h e f f e c t s o f
E-2
low-level ambient benzene exposures that might occur in a population resid- ing near a source of benzene emissions.
implicated in three pathological conditions that may be of public health concern at environmental exposure levels:
The reviewers concluded that benzene exposure by inhalation is strongly
Leukemia (a cancer of the blood-forming system),
Cytopenia (decreased levels of one or more of the formed elements in the circulating blood), and
* Chromosomal aberrations.
Leukemia is a neoplastic proliferation and accumulation of white blood cells in blood and bone marrow. myelogenous leukemia and acute and chronic lymphocytic leukemia. causal relationship between benzene exposure and acute myelogenous leukemia and its variants in humans appears established beyond reasonable doubt.
The term "pancytopenia" refers to diminution of all formed elements of the blood and includes the individual cytopenias: thrombocytopenia, and aplastic anemia. In mild cases, symptoms of pancyto- penia are such nonspecific complaints as lassitude, dizziness, malaise, and shortness of breath. In severe cases, hemorrhage may be observed, and death may occasionally occur because of hemorrhage or massive infection. Patients with pancytopenia may subsequently develop fatal, acute leukemia.
Chromosomal aberrations include chromosome breakage and rearrangement and the presence of abnormal cells. long periods in hematopoietic and lymphoid cells. The health significance of these aberrations is not fully understood. been observed in individuals exposed to benzene who have later developed leukemia.
1
The four main types are acute and chronic The
1
anemia, leukopenia,
These aberrations may continue for
However, aberrant cells have
Some types of chromosomal aberrations may be inheritable. In one study too recent to include in the review previously cited,
workers exposed to 2.1 ppm benzene for 4 years showed a statistically significant increase in chromosomal aberrations (as high as tenfold) over those in unexposed controls.
be susceptible to benzene-induced leukemia. leukemia in animals by benzene injection was considered nonconclusive
2 1 The review concluded that man may be the only species yet observed to
Evidence for production of
E- 3
Moreover, benzene exposure by o r a l dosing, s k i n pa in t i ng , o r i n h a l a t i o n has
n o t been shown t o produce leukemia o r any o the r type o f neop las t i c diseases
i n t e s t animals, a l though o the r e f f e c t s , i n c l u d i n g pancytopenia, have been
w ide ly observed.
E.2.2 Benzene Exposure L i m i t s
been associated w i t h benzene exposure, t h e exposure has been a t occupa-
t i o n a l l eve l s .
e f f e c t s have been h i g h (10 ppm up t o hundreds o f p a r t s per m i l l i o n o f
benzene, except i n a few cases o f exposures t o 2 t o 3 ppm benzene) o r they
1
I t should be noted t h a t where t h e h e a l t h e f f e c t s descr ibed above have
That i s , t h e benzene exposure l e v e l s assoc iated w i t h the
I I
have been unknown.
t i o n a l se t t i ngs , so i n i t i a l at tempts t o l i m i t benzene exposures were aimed a t occupat ional exposures.
zene and i t s g r e a t l y expanded use a f t e r 1920, several occupat ional exposure l i m i t s were es tab l i shed i n t h e Un i ted state^.^ These l i m i t s , o r i g i n a l l y i n
t h e range o f 75 t o 100 ppm, were success ive ly lowered as more i n fo rma t ion
on benzene t o x i c i t y became known.
For example, t h e American Conference o f Governmental I n d u s t r i a l Hygien-
i s t s (ACGIH) recommended a benzene th resho ld l i m i t value o f 100 ppm i n
1946,-50 ppm i n 1947,-35 p p m i n 1948,-25 ppm-in - 1949, ~ and 10 ppm i n 1977.3'4 The Nat ional I n s t i t u t e f o r Occupational Safe ty and Hea l th recommended a n ~
exposure l i m i t o f 10 ppm i n 1974 and r e v i s e d i t downward t o 1 ppm i n 1976.
The c u r r e n t Occupational Safety and Hea l th Admin i s t ra t i on permiss ib le
exposure l i m i t i s 10 ppm
workers f r o m adverse changes i n t h e b lood and blood-forming t i ssues . The
most r e c e n t l y recommended o r pending l i m i t s o f 1 ppm and 10 ppm are based
on the conclus ion t h a t benzene i s leukemogenic i n man (NIOSH 4 a suspected carcinogen i n man (ACGIH ).
*A benzene standard w i t h a l i m i t o f 1 ppm was proposed by OSHA May 27, 1977, (42 FR 27452) and promulgated February 10, 1978 (43 FR 5918). Th is standard was s t r u c k down October 5, 1978, by t h e U.S. F i f t h C i r c u i t Court o f Appeals. Supreme Court agreed t o hear arguments on t h e case du r ing i t s f a l l 1979 term.
Benzene exposure was f i r s t associated w i t h h e a l t h e f f e c t s i n occupa-
Wi th r e c o g n i t i o n o f t h e t o x i c e f f e c t s o f ben-
-~
5
6 (a lower l i m i t o f 1 ppm i s c u r r e n t l y i n l i t i g a t i o n * ) .
Occupational exposure l i m i t s were i n i t i a l l y es tab l i shed t o p r o t e c t
5 7 and OSHA ) o r
The U.S. Department o f Labor appealed t h e dec is ion, and t h e
E.2.3 Health Effects at Environmental Exposure Levels Little information is available on health effects of nonoccupational
exposures of the general populace to benzene. cited’” were on the working population (mostly males) exposed to higher than ambient benzene levels on a work cycle. Applying these studies to chronic (24 hours per day) low-level exposure to the general population (including infants, the i l l , and the elderly) requires extrapolation.
evidence of increased risk of leukemia in humans on exposure to benzene for various time periods and concentrations was overwhelming but that data were not adequate for deriving a dose-response curve.
However, EPA’s Carcinogen Assessment Group (CAG), acknowledging the absence of a clear dose-response relationship, has estimated the risk o f
leukemia in the general population from low-level benzene exposure.8 from three epidemiological studies of leukemia in workers (mostly adult white males) were used to estimate the risk of developing leukemia. no-threshold linear model was used to extrapolate this estimated risk to the low levels (below 5 to 10 ppb) to which some populations may be exposed.
case per 10 ppb person-years. For example, if 3 million persons are chronically exposed to 1 ppb benzene, the model predicts there will be 1.02 cases of leukemia (3 x 0.34) per year in that population. model means that the model would predict the same number of leukemia deaths among 3 million people exposed to 1 ppb benzene as among 1 million people exposed to 3 ppb.
estimating the number of leukemia deaths as attributable to benzene emis- sions from maleic anhydride plants. (including fatalities from causes other than leukemia) were not included in the estimated number of deaths. to one death (that is, each case was presumed fatal).
First, the retrospective occupational exposure estimates may be inaccurate. CAG calculated the 95-percent confidence intervals for this risk factor to be 0.17 to 0.66 if exposure estimates in the three studies extrapolated are
Virtually all of the studies
1 The recent analysis of benzene health effects concluded that the
Data
A
The annual risk factor derived for benzene-induced leukemia was 0.34 6
Use of a “linear”
6 The risk factor (0.34 case per 10 ppb person-years) was used i n
Other effects of benzene exposure
The risk factor equated one leukemia case
Several sources of uncertainty are present in the risk factor.
E-5
1
E.3 POPULATION DENSITY AROUND MALEIC ANHYDRIDE PLANTS
The popu la t i on groups " a t r i s k " t o benzene exposure ( those r e s i d i n g
around male ic anhydr ide p lan ts ) were determined' from the 1970 Bureau o f 1
, p r e c i s e l y c o r r e c t , and 0.13 t o 0.90 i f exposure est imates are o f f by a
f a c t o r of 2. Second, t h e composi t ion o f the exposed populat ions around
maleic anhydride p l a n t s may vary from t h a t o f the populat ions used as a
bas is f o r t h e CAG est imate.
benzene exposure may n o t be a l i n e a r no-threshold r e l a t i o n s h i p a t the low
concentrat ions t o which t h e general popu la t i on may be exposed. r i s k f a c t o r inc ludes o n l y leukemia deaths and n o t o the r h e a l t h r i s k s . No
q u a n t i t a t i v e es t imate o f t h e e r r o r i n the r i s k f a c t o r due t o the l a t t e r two
Th i rd , t h e t r u e dose-response r e l a t i o n s h i p f o r
Fourth, t h e
E-6
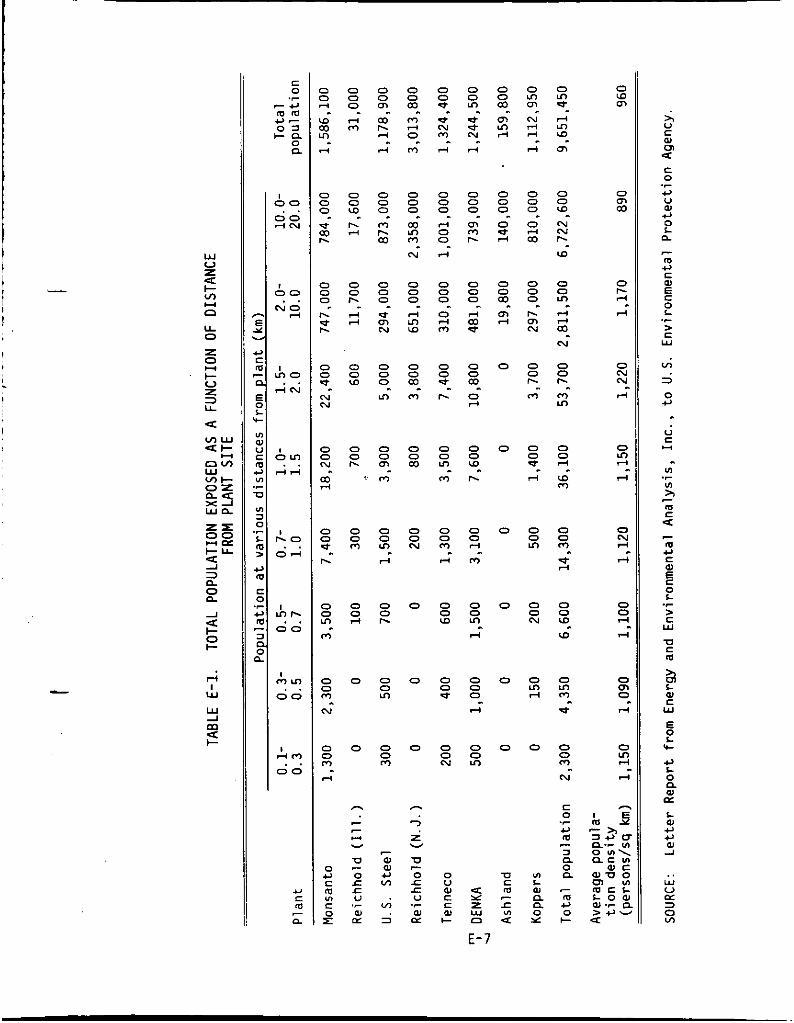
Y 0
z
I- u z 2 LL
s
a m w
nv)
na w n
w v)I- O Z
X l
l
0 I-
2
4 I w w -I m 2
f
+ C
C
I <
< I c
I
: 1
I ! * I <
, I
E
c 0 .-
I 00
00 FIN
. .
00
N O ?-I
. .
I m 0 3 N . .
t I.0
O A
I mI. 00 . .
0 mIn 00 . .
, ?-I-
00 . .
.y c m n -
0 0 rl
u) Do y! rl
0 0
P 0-
2
0 0 0
r. r?
0 0
N N
-.
0 0 N. 2
0 0
I. 9
0 0 m m -
0 0 m N -
0 0 m ?-I
0 42 c v) C 0 x
m
0 0
?-I m 9
0 0
I. ?-I
'9
0 0
rl rl
P--
0 0 W
0 0 r.
0 0 m
0 0 ?-I
0
0
- - 7
w v
v 0 L: .c U
W LL
?-
.r
0 0
m I. ?-I
rl
m ~
-
0 0
m I. m
9
0 0 0
0
N
- m
0 0
m 0-
0 0
m m -
0 0 m rl
0 0 P-
O 0 m
0 0 m
7
W W c, VI
co 3
0 0 m. 9 m ?-I
m
0 0 0-
2 m N
0 0
3 m ID
9
0 0 m m -
0 0 m
0 0 N
0
0
0
- 7 z v
2 0 L: r U
W CL
.r
0 0 -*
ma N
rl
0 0 0
rl 0
?-I 0"
0 0
0 rl m
9
0 0
I. 9
0 0 m - m
0 0
3 1
0 0 W
0 0 e
0 0 N
0 U W C c W I-
4 Y z w 0
E-7
0 0 *. N! d
?-I
0 0
m m I.
9
0 0 0
rl m -
0 0
0 ?-I
m.
0 0
I. '0.
0 0 rl
m "
0 0
3 mi
0 0 0 rl -
0 0 m
0 0 m In rl
- m
0 0
0 0-
z
0 0 a. m rl
0
0
0
0
0
0
'El c
L: v) 4
m -
0 m
N ?-I r(
3
m - -
0 0
0 4 m
0-
0 0
I.
N
0-
m
0 0 I.
m
0 0
?-I -.
0 0 m
0 0 N
0 In ?-I
0
v) c W
LI 0 Y
n
0 m
?-I m -- '9 m
0 0 W
N N
W
- 'I
0 0
3 rl m N
0 0 I.
0 In
?
"
"
0 0 ?-I
W m -
0 0 *- z 0 0
W '0.
0 m m d "
0 0 m N "
c 0
c,
3
0
.r
m
n n
m
c
.-.- c, 0 I-
O W m
0
m m
0 I. rl
rl -
0 N
rl N.
0 m ?-I
3 "
0 cu
rl ?
0 2 3
0 m 9 3
0 In rl
4
s; U c W m 4 c 0
c, U W c, 0 L n
m c, c W
0 L
> e W
.r
- 5 .r
VI
i 0 c,
U c - "
Lo
Lo .r
2, W c 7
a - W 4 c W
0 L > E: W
u c
5 .C
m
3 L W c W
E 0 L 'c
c, L 0
W E
L W c, c, W -1
n
.. Y V
3 z
E.4 POPULATION EXPOSURES, RISKS, AND MORTALITIES
E.4.1 Summary o f Methodology
benzene emissions from male ic anhydride p l a n t s fo l lows.
The methodology f o r es t imat ing leukemia deaths due t o exposure t o
A t y p i c a l ( o r "model") maleic anhydr ide p l a n t was developed, based on
a nominal male ic anhydride produc t ion capac i t y o f 22,700 Mg/yr (met r ic tons
per year) . I t s benzene emissions were est imated t o be 190 kg/hr from t h e product recovery absorber, based on a 94.5-percent benzene conversion r a t e
i n t h e r e a c t o r and no benzene emission con t ro l s . An add i t i ona l 2.6 kg/hr
benzene was est imated t o be emi t ted from storage, handl ing, and f u g i t i v e
sources. 1 0 , l l
The I n d u s t r i a l Source Complex D ispers ion (ISCD) model, urban mode 2, I I 1 was used t o est imate mean annual benzene concentrat ions o u t t o 20 km from
the model p lan t .12
s ion model:
t o r e f l e c t ac tua l p l a n t capac i ty and degree o f benzene emission c o n t r o l s
c u r r e n t l y exerc ised i n each p lan t .
w i t h co r rec ted benzene concentrat ions t o y i e l d benzene dose i n 10 ppb person-years per year . The methods f o r de termin ing popu la t ions are descr ibed
P i t t s b u r g h meteoro log ica l data were used i n t h e d isper -
Dispersed benzene concentrat ions from t h e model p l a n t were cor rec ted
9,12
i
9 i
The popu la t i on (1970) around each ac tua l p l a n t l o c a t i o n was c o r r e l a t e d (
6
~~~~~~ ~ ~~~~~
i n P a r t E.3 o f - th i s appendix. -~ ~ ~-
From h e a l t h e f f e c t s data, the EPA Carcinogen Assessment Group*der ived 6 a leukemia r i s k est imate o f 0.34 death per 10
t o benzene.
descr ibed i n P a r t E.2.3 o f t h i s appendix.
ma le ic anhydr ide p l a n t s were est imated by m u l t i p l y i n g 3.4 x
years exposure t imes the exposure i n "ppb person-years per year."
maleic anhydr ide p lan ts , assuming no c o n t r o l o f f u g i t i v e , storage, o r
handl ing emissions, b u t four d i f f e r e n t degrees o f benzene emission c o n t r o l
on t h e product recovery absorbers. These f o u r cond i t ions , termed "con t ro l a1 te rna t ives , " are:
ppb person-years from exposure The methodology f o r es t ima t ing t h e leukemia r i s k fac to r8 i s
The leukemia deaths per year a t t r i b u t a b l e t o exposure t o benzene from
ppb person-
Leukemia deaths were est imated f o r benzene exposures from e x i s t i n g
E-8
-
A. No regulation by any standard; that is, the current conversion rate (94.5 percent) and the current state of benzene emission control on the product recovery absorber in each plant (varies from no control to 90, 97, or 99 percent control);
97 percent reduction in benzene emissions;
tion; and
99 percent reduction in'benzene emissions by carbon adsorption.
B.
C. 99 percent reduction in benzene emissions by thermal incinera-
D.
For Alternatives 6 , C, and 0, a benzene conversion rate of 90 percent was assumed, resulting in an estimated uncontrolled benzene emission rate of 345.4 kg/hr from the product recovery absorber of the model plant.
For all control alternatives, two control system failure scenarios were assumed. First, it was assumed that benzene control systems on the product recovery absorbers would fail for 3 hours 15 times per year and would be limited to emissions of 250 kg of benzene per plant (on the basis of the model plant .capacity) during each failure. emission rate from the model plant product recovery absorber is 190 kg/hr, so the 250-kg emission 15 times per year would be equivalent to 20 hr/yr of uncontrolled emissions. The second failure condition assumed that benzene control systems would fail for 48 hr/yr, during which product recovery absorber emissions would be 190 kg/hr (based on the model plant) for the full 48 hours.
The uncontrolled benzene
It was assumed further that the atmospheric dispersion of these unan- ticipated emissions would follow the same pattern as during normal (con- trolled) operations and that emissions from fugitive and storage sources would be unaffected by the failures. E.4.2 Estimates of Leukemia Deaths
The general equation for estimating the number of leukemia deaths attributable to benzene emissions from a particular plant (e.g., plant X )
under either normal or uncontrolled operations is:
,. i = 0.1-0.3
E-9
in which D = estimated number of leukemia deaths per year from benzene
emissions from the plant ( e . g . , plant X). 6 R = the risk factor (0.34 death per 10
P.= population at risk, in area (i) around plant X (Table E-lK-
Bi= mean annual average benzene concentration (ppb) in area (i)
ppb person-years).
1
around plant X for the control alternative selected (A,B,C, or D) or for the uncontrolled condition (Table E-3).12
C = capacity of plant X (in thousands of metric tons of maleic anhy- dride produced per year; the capacity of the model plant is 22,700 metric tons/yr).
f = fraction of plant X output produced from benzene (e.g., if 20 per-
i = the particular area in which P. and Bi occur (i progresses from
cent o f plant capacity is from n-butane feedstock, f = 0.80).
the area 0.1 to 0.3 km from thA plant to the area 10 to 20 km from the plant).
t = summation of deaths from all areas (i).
Values for Pi are given in Table E-1. Values for R, C, f, current control levels, and control levels under failure conditions are given in Table E-2. Values of Bi for all control levels of interest, as determined from Table 32 of Reference 12, are given in Table E-3.
Leukemia deaths per year were estimated for each plant for both con- trolled and uncontrolled conditions, using Equation 3. The total-estimated ~
number of leukemia deaths per year attributable to benzene emissions f r m all plants was determined for each condition by the equation:
~~ ~~ ~~~ -~ ~
-
Total estimated number of leukemia deaths/yr (Dt) I i I
= D1 + D2 + . . . + D8 . (2) I The total numbers of estimated leukemia deaths attributable to benzene
emissions from maleic anhydride plants are given in Table E-4 on a plant-by-
97 percent, and 99 percent), the uncontrolled condition (0 percent), and the shutdown condition (storage, handling, and fugitive emissions only). For purposes of Table E-4, Alternatives C and D are indistinguishable and have been combined. The alternatives defined in Table E-4 thus differ slightly from the nomenclature previously used (A,B,C, and D).
, plant basis, in deaths per year, for three control alternatives (current, 1
E-10
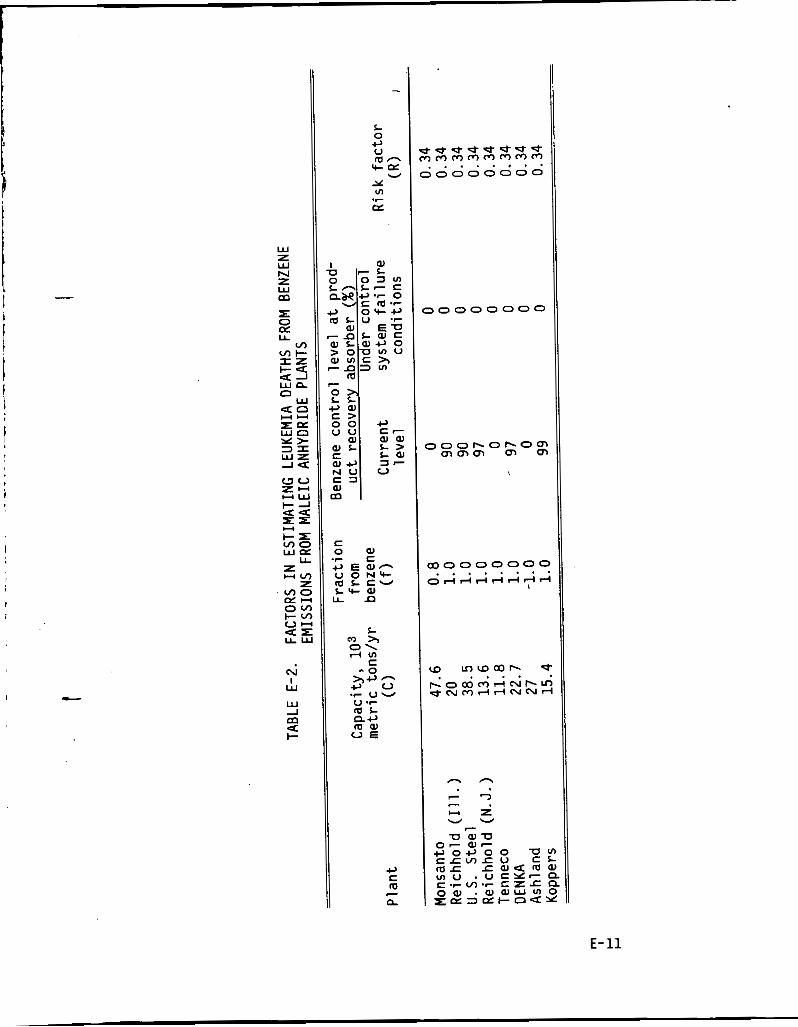
N I
W
W 1
4 t- m
V m- Y-a
U 24 VI
C Y .r
E o w C E c, E w- U 0 NY- m L c u LLC w ~n
L m h O\ dv) c
- 0
C r v .C u u u .r m L P C r
V E
- m w
Cr c m CL c
53Z333ZZ . . . . . . . ;ooooooo
>ooooooo
D O O A O A O ~ m m m m m
E - 1 1
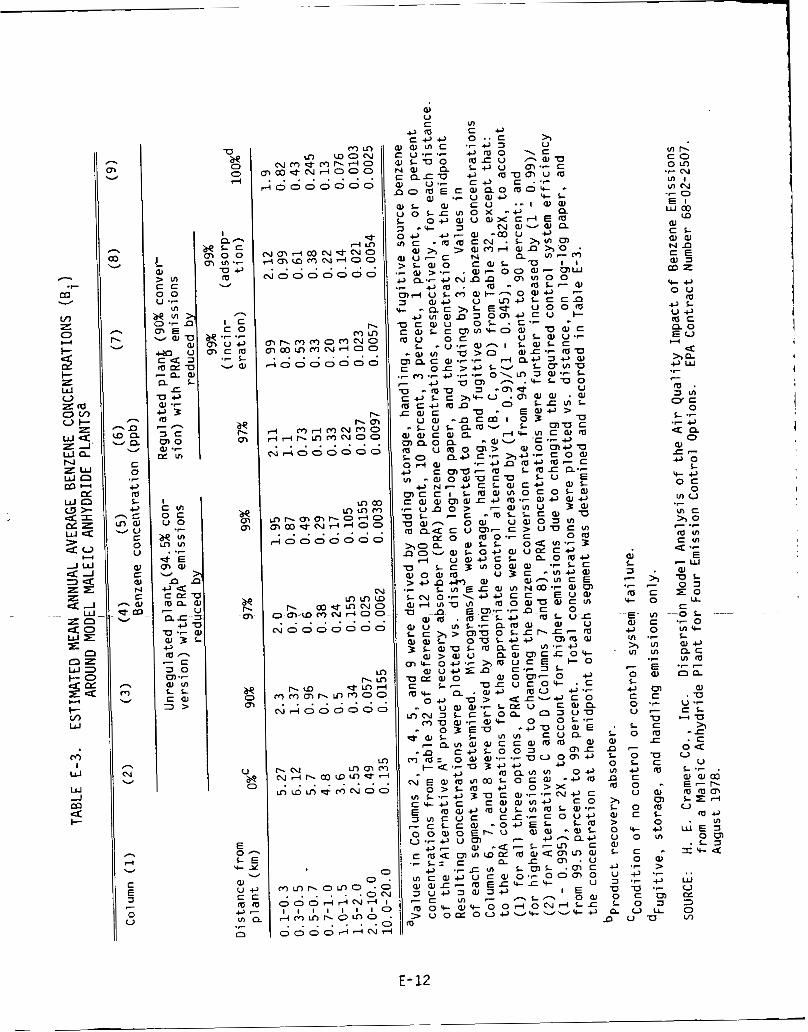
W
Tll
E 0 4
m l n m LnON
~ m b m h d o , 0 3 * N d 0 0 0
i d d d o o o o
?
d n
* dyI
I ~ ~ C O N ~ N O I m L n m ( v ~ 0 0 J 0 0 0 0 0 0 0 . . . . . . . .
c .r
m u
u-c, O U m c , L u u m c n o E V
4 ha Q W
n
.r c
v
- I C c o .r .r
m u c , m c m .- L v w
w l z El
P - ' m m h P - m m o m N o n C O m m N 4 0 0 . . . . . . . i o o o o o o o
m . 3 V I u c
0 L .r
.r 3 P-
-I m 4 m N m o i 4 r . m m N O O u 4 0 0 0 0 0 0
P-m
. . . . . . . . - C
I O
VI .-
m a m l n m n - m m r - 0 4 0 n r n b ~ d d o o . . . . . . . . - l O O O O O O O
a
a N m m L n P- r n * y I N o o m (9 m N + o o
N O O O O O O O . . . . . . . .
L
E v) --0 L w c . r O c, 0 m u - v) .- L 3 2 Eg .- m m 2 5 o n
.r 7 m P-m
P-Ln * m + m m m r - L o m o o N r l O O O O O O . . . . . . . .
h m v
L c, C 0 U
ol C
Til c c
.r - m
W . Q
v .- C L nu
h -c . E
0 4
L 0 L
W
L 0 VI
n
n m
7
0 L c, C 0 U
Tll C a
m 1
W
W -I m U
h
v N
W ol L 0 4.2 VI
m 2 W > 0 U W L
0 C
%- 0
h 4 v
C
5 - 0 U
C 0
u .r ._ W > c, .- .-
0 U 3 U 0 L n D
Q 0 .
m m P - o l n o .o . . . . . . O N 0 0 0 4 4 N - i I I Q I , I t I C d m m r - o l n o . . . . . . .c 0 0 0 0 4 4 N -
.. W V w 3 0 v)
U C 0 u
U
m a U
Q
E-12
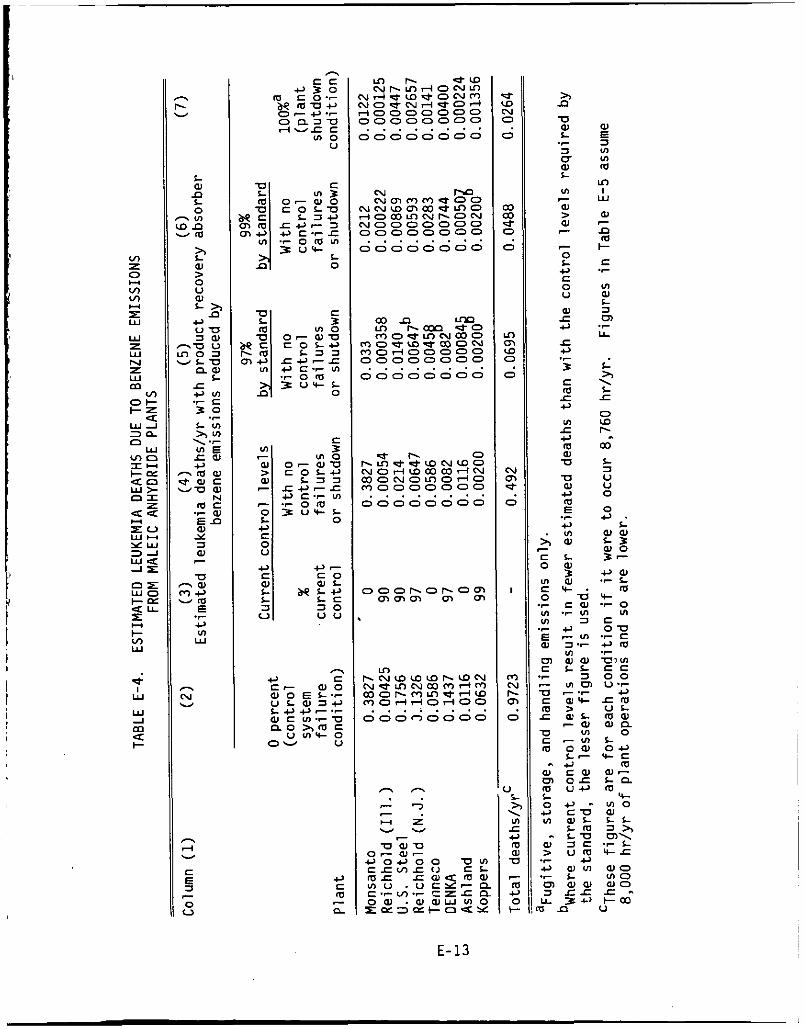
VI z w l VI
E
E Y
W z W N z W
VI OI- cz
4 W d
w c o c IC + e W > 01 z
zc w c Y Y =.- w u J Z 0 5 w c + e 4 u
I- v, W
m
3 n n
ac
z'
E
G I
W
W
4 + m
c w > W c - 0 L c, c 0 U
? . /
L a,
L 0
- V I D O d m
n
2 W > 0 U
u u u 3 W
?U u n o 3 4 L V
no) L
-c uVI .r c
LVI x m \ .r VIE r w u - m a l
e w e u u W N
m c .r W
W Y 3 W
U
3 .E
E n
c
n w
E c, VI W
2% .r
h
W N
n
v rl
c 5 c 0 u
u t 0 o c a u C O L c , L 3 3
zc,-c c, c . r VI . - o m 3 u u - L
0
h
c c u 3 0 m c 0'-
o n 3 - o g23.z rlvs c
V I 0 U
c
L 0
n c, c c c W O 0) 0 E L..- Lc,uc.r W c m . r u n o x m c u V I e 0 0- U
u L 0) a +
* W N P - m r l O N m
u r l e ~ D b O N m \10bNrlbOrl - looooooo 3 0 0 0 0 0 0 0 ; 0 0 0 0 0 0 0
~~~
jooooooo
0 0 0 - O P - 0 % m m m m
. . . . . . . . O O O n O O O O
n -
- 3
Y Z c
v v
E- 13
P 3 .I 3
;
3
3 8 ;
n n 0 3
3
N
Q n
a
I
I c\ b U c
I t i " L + n
'c a
r 0 + C +
x O U 01 L 3 U W L VI
W > 0)
.r
- c
c 0 L c, c 0 U
W c c,
r c,
3 c m -c c,
VI T c, m W U
.r
W E VI VI m m I
W
W
m + c
a
c n
.r
VI W L a m .r U
i h 2 -c
O W P-
00 L 3 U U 0
0 c , .
L
a 0 3-
"
2 g
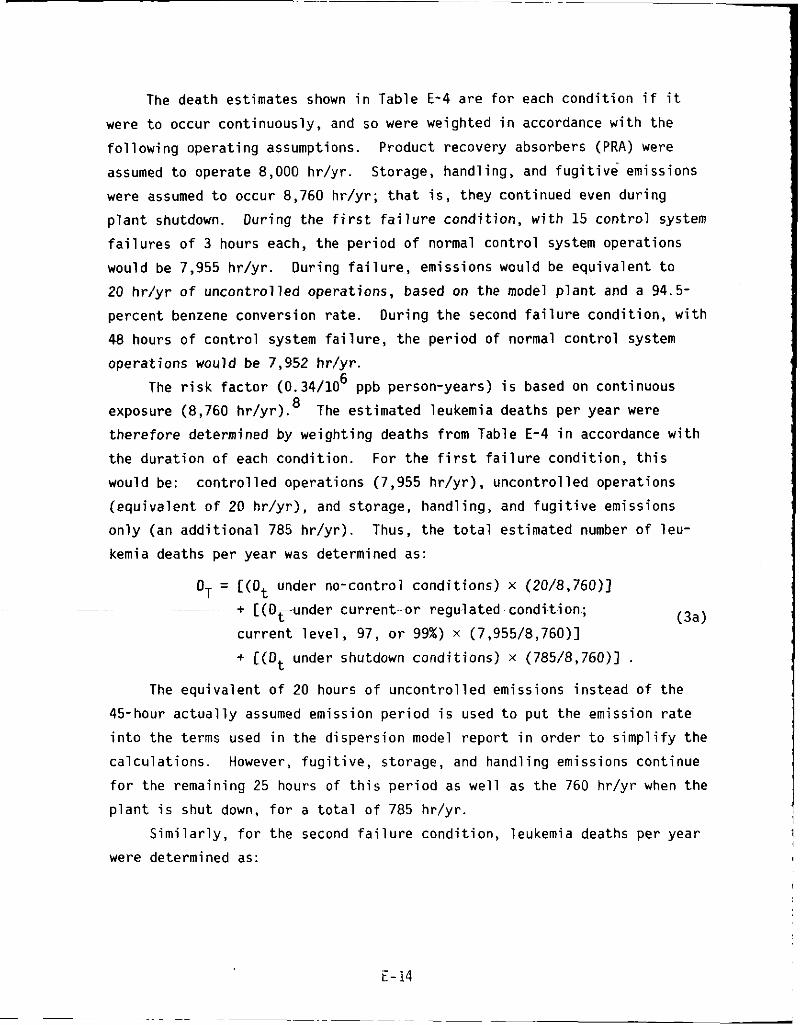
The death estimates shown in Table E-4 are for each condition if it were to occur continuously, and so were weighted in accordance with the following operating assumptions. Product recovery absorbers (PRA) were assumed to operate 8,000 hr/yr. were assumed to occur 8,760 hr/yr; that is, they continued even during plant shutdown. failures o f 3 hours each, the period of normal control system operations would be 7,955 hr/yr. 20 hr/yr of uncontrolled operations, based on the model plant and a 94.5- percent benzene conversion rate. 48 hours of control system failure, the period of normal control system operations would be 7,952 hr/yr.
exposure (8,760 hr/yr).8 therefore determined by weighting deaths from Table E-4 in accordance with the duration of each condition. would be: controlled operations (7,955 hr/yr), uncontrolled operations (equivalent of 20 hr/yr), and storage, handling, and fugitive emissions only (an additional 785 hr/yr). Thus, the total estimated number o f leu- kemia deaths per year was determined as:
Storage, handling, and fugitive emissions
During the first failure condition, with 15 control system
During failure, emissions would be equivalent to
During the second failure condition, with
6 The risk factor (0.34/10 ppb person-years) is based on continuous The estimated leukemia deaths per year were
For the first failure condition, this
DT = [(Dt under no-control conditions) x (20/8,760)] + [(Dtunder current or regulated condition; current level, 97, or 99%) x (7,955/8,760)1 + [(D, under shutdown conditions) x (785/8,760)] .
7 3 a ) ~~
The equivalent of 20 hours of uncontrolled emissions instead of the 45-hour actually assumed emission period is used to put the emission rate into the terms used in the dispersion model report in order to simplify the calculations. However, fugitive, storage, and handling emissions continue for the remaining 25 hours o f this period as well as the 760 hr/yr when the plant is shut down, for a total of 785 hr/yr.
Similarly, for the second failure condition, leukemia deaths per year were determined as:
DT = [(Dt under no-control conditions) x (48/8,760)] + [(Dt under current or regulated condition; current level, 97, or 99%) x (7,952/8,760)1 + [(D, under shutdown conditions) x (760/8,760)] .
(3b)
Deaths per year resulting from operations based on 8,000 hr/yr of product recovery absorber operations with no control failures and an addi- tional 760 hr/yr of only storage, handling, and fugitive emissions were determined by:
DT = [(D, under current or regulated condition; current level, 97, or 99%) x (8,000/8,760)1 (3c)
+ [(D, under shutdown conditions) X (760/8,760)1 . The total estimated leukemia deaths per year for the control options
of interest are summarized in Table E-5. control system failure conditions have little effect on annual exposure and deaths. Also, even with continuous 99 percent control of product recowery absorber benzene emissions, there will still be an estimated 0.0488 leukemia death per year. 0.0264 (or 54 percent) of these results from fugitive, handling, and storage emissions, and 0.0224 death (46 percent) from residual product recovery absorber emissions. E.4.3
It is apparent.that the brief
From Table E-4 (last two columns), it can be seen that
Example o f Leukemia Death Calculation Values in Table E-4 were determined in accordance with the following
example, using the U.S . Steel plant. From Table E-2, R = 0.34, C = 38.5, and f = 1 for all distances, so Equation 1 may be simplified to: n
Pi values for each area (i) around this plant are taken from Table E-1. Table E-2 shows that this plant has a current control level of 90 percent, so Bi values for 90 percent control in each area (i) are taken from Table E-3 tPiBi is calculated as follows:
E-15
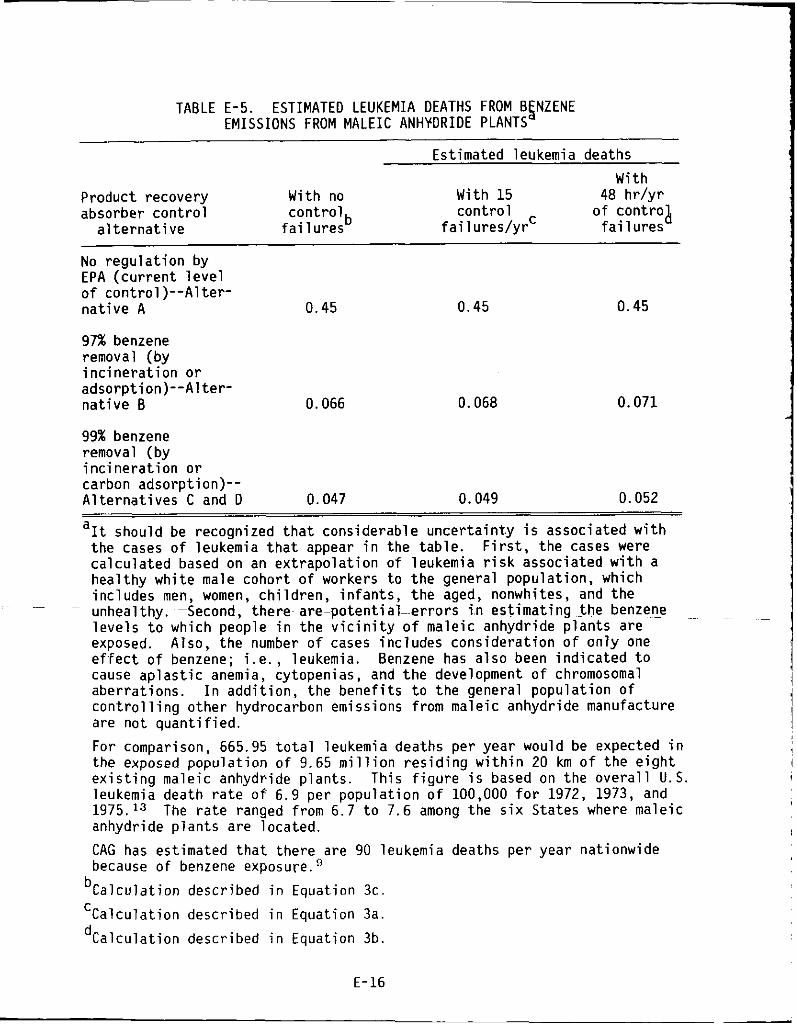
TABLE E-5. ESTIMATED LEUKEMIA DEATHS FROM BGNZENE EMISSIONS FROM MALEIC ANHYDRIDE PLANTS
Estimated leukemia deaths
Wi th Product recovery Wi th no Wi th 15 48 h r / y r absorber c o n t r o l c o n t r o l c o n t r o l o f contro),
a l t e r n a t i v e f a i l u r e s f a i 1 ures/yrc f a i l u r e s
No r e g u l a t i o n by EPA ( cu r ren t l e v e l of con t ro l ) - -A l te r - n a t i v e A 0.45 0.45 0.45
97% benzene removal (by i n c i n e r a t i o n o r adsorpt ion)--A1 t e r - n a t i v e B 0.066 0.068 0.071
99% benzene removal (by i n c i n e r a t i o n o r carbon adsorpt ion)- - A l t e r n a t i v e s C and D 0.047 0.049 0.052
aIt should be recognized t h a t cons iderable unce r ta in t y i s assoc iated w i t h the cases o f leukemia t h a t appear i n the tab le . ca l cu la ted based on an e x t r a p o l a t i o n o f leukemia r i s k associated w i t h a hea l thy wh i te male cohor t o f workers t o t h e general populat ion, which inc ludes men, women, ch i l d ren , i n f a n t s , t h e aged, nonwhites, and t h e unheal thy. -Second, there a re -po ten t i a l -e r ro rs i n es t ima t ing the benzen_e l e v e l s t o which people i n the v i c i n i t y o f maleic anhydride p lan ts are exposed. Also, the number o f cases inc ludes cons idera t ion o f o n l y one e f f e c t o f benzene; i . e . , leukemia. Benzene has a l so been i n d i c a t e d t o cause a p l a s t i c anemia, cytopenias, and t h e development o f chromosomal aber ra t ions . I n a d d i t i o n , the b e n e f i t s t o t h e general popu la t ion o f c o n t r o l l i n g o ther hydrocarbon emissions from maleic anhydride manufacture are no t q u a n t i f i e d .
For comparison, 665.95 t o t a l leukemia deaths per year would be expected i n the exposed popu la t i on o f 9.65 m i l l i o n r e s i d i n g w i t h i n 20 km o f t h e e i g h t e x i s t i n g maleic anhydride p lan ts . Th is f i g u r e i s based on the o v e r a l l U.S. leukemia death r a t e o f 6.9 per popu la t i on o f 100,000 f o r 1972, 1973, and 1975.13 The r a t e ranged from 6.7 t o 7.6 among the s i x States where maleic anhydride p lan ts are located.
CAG has est imated t h a t there are 90 leukemia deaths per year nat ionwide because o f benzene exposure.
F i r s t , t h e cases were
- ~
bCa lcu la t ion descr ibed i n Equation 3c.
CCa lcu la t i on descr ibed i n Equation 3a.
dCa lcu la t ion descr ibed i n Equation 3b.
E-16
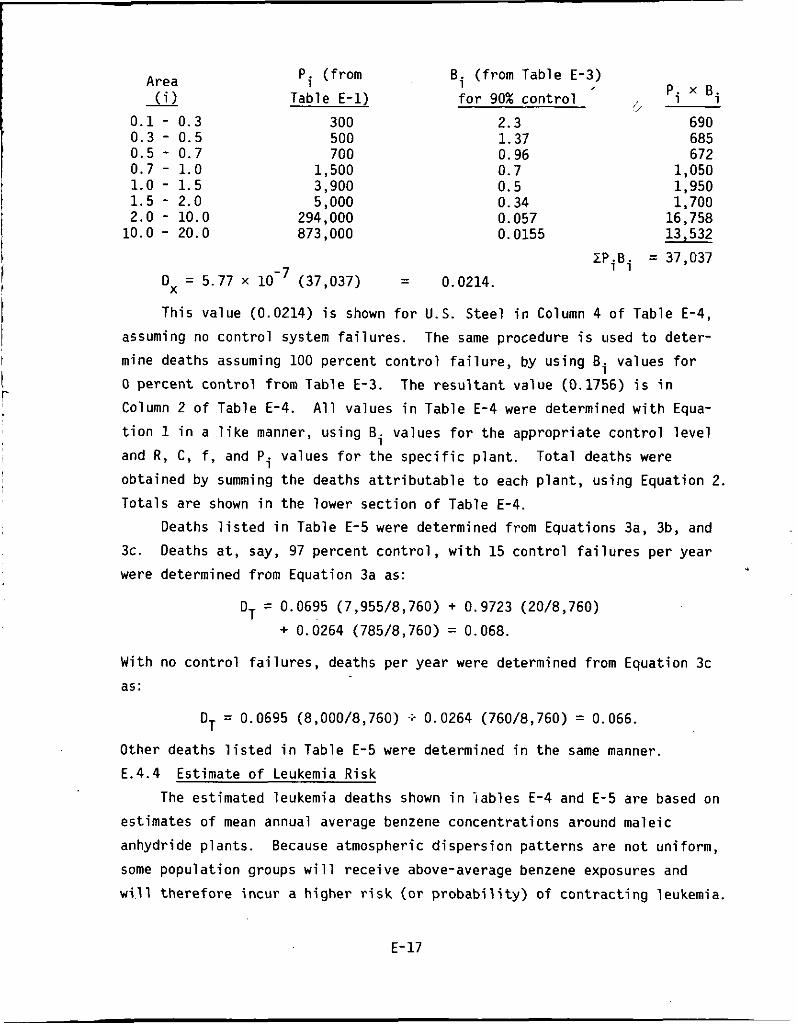
Pi ( f rom Area 0 Table E-1)
0 .1 - 0.3 300 0.3 - 0.5 500 0.5 - 0.7 700 0.7 - 1.0 1,500 1.0 - 1.5 3,900 1.5 - 2.0 5,000 2.0 - 10.0 294,000
10.0 - 20.0 873,000
Ox = 5.77 x (37,037)
Bi ( f rom Table E-3) I Pi x Bi
f; f o r 90% c o n t r o l
2.3 690 1.37 685 0.96 672 0.7 1,050 0.5 1,950 0.34 1,700 0.057 16,758
2PiBi = 37,037
0.0155 13,532
= 0.0214.
This value (0.0214) i s shown f o r U.S. Stee l i n Column 4 o f Table E-4, The same procedure i s used t o deter- assuming no c o n t r o l system f a i l u r e s .
mine deaths assuming 100 percent c o n t r o l f a i l u r e , by us ing Bi values f o r 0 percent c o n t r o l f rom Table E-3. The r e s u l t a n t value (0.1756) i s i n
Column 2 o f Table E-4. A l l values i n Table E-4 were determined w i t h Equa- t i o n l i n a l i k e manner, us ing Bi values f o r t h e appropr ia te c o n t r o l l e v e l
and R, C, f, and Pi values f o r t h e s p e c i f i c p l a n t .
obta ined by summing t h e deaths a t t r i b u t a b l e t o each p l a n t , us ing Equation 2. To ta ls a re shown i n the lower sec t i on o f Table E-4.
To ta l deaths were
Deaths l i s t e d i n Table E-5 were determined from Equations 3a, 3b, and 3c. Deaths a t , say, 97 percent c o n t r o l , w i t h 15 c o n t r o l f a i l u r e s per year
were determined from Equation 3a as:
DT = 0.0695 (7,955/8,760) + 0.9723 (20/8,760)
+ 0.0264 (785/8,760) = 0.068.
Wi th no c o n t r o l f a i l u r e s , deaths per year were determined from Equation 3c
as:
DT = 0.0695 (8,000/8,760) + 0.0264 (760/8,760) = 0.066.
Other deaths l i s t e d i n Table E-5 were determined i n the same manner.
E.4.4 Est imate o f Leukemia Risk
The est imated leukemia deaths shown i n i a b l e s E-4 and E-5 are based on
est imates o f mean annual average benzene concentrat ions around maleic
anhydride p lan ts . Because atmospheric d i spe rs ion pa t te rns are n o t uni form,
some popu la t i on groups w i l l rece ive above-average benzene exposures and
w i l l t h e r e f o r e i n c u r a h igher r i s k ( o r p r o b a b i l i t y ) o f c o n t r a c t i n g leukemia.
E-17
Maximum annual r i s k i s the est imated p r o b a b i l i t y t o someone, who i s
cons tan t l y exposed t o t h e h ighes t maximum annual average benzene concent ra t ion
i n t h e ambient a i r around a p a r t i c u l a r source f o r a year, o f con t rac t i ng
leukemia because o f exposure t o benzene emissions from t h a t source. l i f e t i m e r i s k can be found by m u l t i p l y i n g t h e maximum annual r i s k by 70
years.
were est imated from t h e maximum annual average benzene concentrat ions e s t i -
Maximum
i 1 Maximum annual r i s k s o f leukemia deaths i n exposed popu la t i on groups
1 mated12 f o r var ious d is tances from t h e model p l a n t , us ing the equation: I
Maximum annual r i s k o f leukemia death f o r an i n d i v i d u a l / y r
= (Ei, t h e max annual benzene concent ra t ion , ppb) I
1 i
6 x ( R , the r i s k f a c t o r o f 0.34 death per 10 ppb person-years) x which i s one person as a f r a c t i o n o f 1 m i l l i o n ) , o r
Maximum annual r i s k o f leukemia death f o r an i n d i v i d u a l / y r
= (3.4 x 10⁻⁷)(max Bi i n ppb) ,
3
(5.3)
(5b)
o r
= (1.06 x 10⁻⁷)(max Bi i n pg/m ) .
For t h e uncon t ro l l ed model p l a n t , t h e est imated maximum annual average 3 benzene concen t ra t i on (max Bi) i s 35.7 pg/m
(Table 14 o f Reference 12).
o f leukemia death f o r an i n d i v i d u a l i s 3.8 x
year .
a t 0.3 km from t h e p l a n t
The es t ima ted maximum annual r i s k o r p r o b a b i l i t y ~~
~~
(1.06 X 10-7pX 35.7) per
For t h e same p l a n t w i t h 97 percent c o n t r o l o f benzene emissions from -6 t h e product recovery absorber, the maximum est imated r i s k i s 2.2 X 10
person per year , which occurs 0.1 km from t h e p l a n t (Table 22 o f Reference 12).
T h i s c a l c u l a t i o n i s shown i n F igure E - 1 . Ca lcu la t ions f o r maximum r i s k are
summarized i n Table E-6.
Maximum annual r i s k s o f leukemia from product recovery absorber emis-
per
s ions on ly were c a l c u l a t e d i n a s i m i l a r manner, us ing m2ximum annual average concentrat ions from Table 9 o f Reference 12. Ca lcu la t ions are shown i n
Table E-7.
i s 3 .4 x
The maximum r i s k assoc ia ted w i t h the uncon t ro l l ed model p l a n t
Wi th 97 percent benzene c o n t r o l , t h e per person per yea;.
E-18
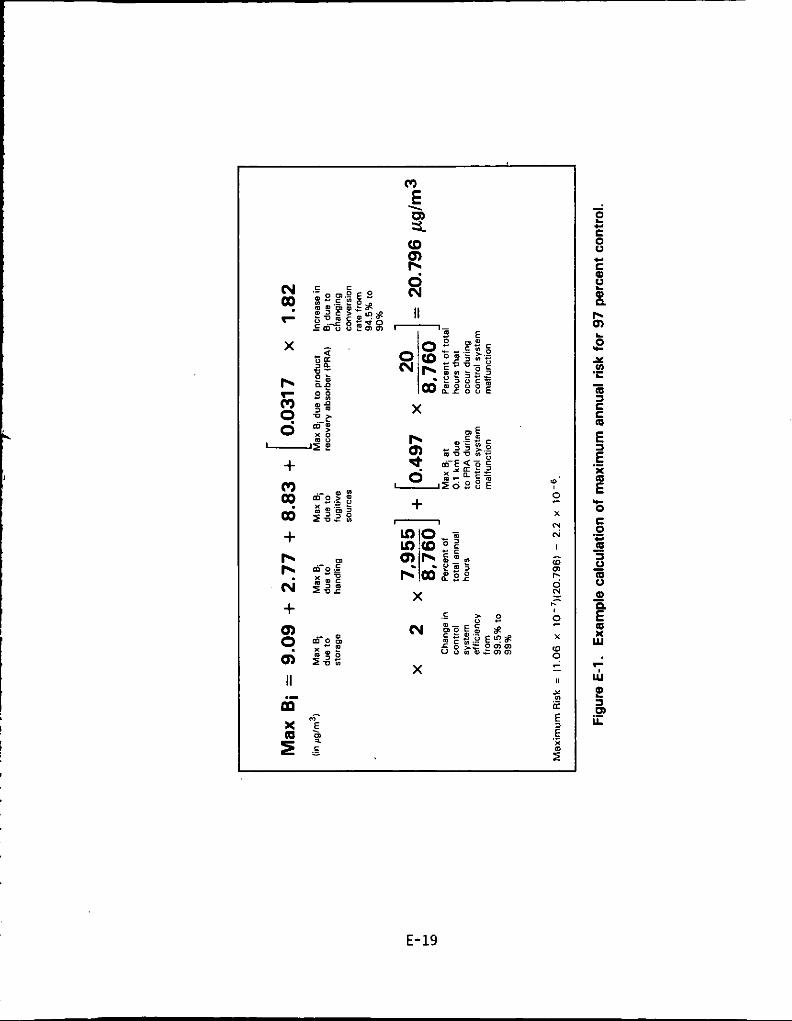
X
X
E-19
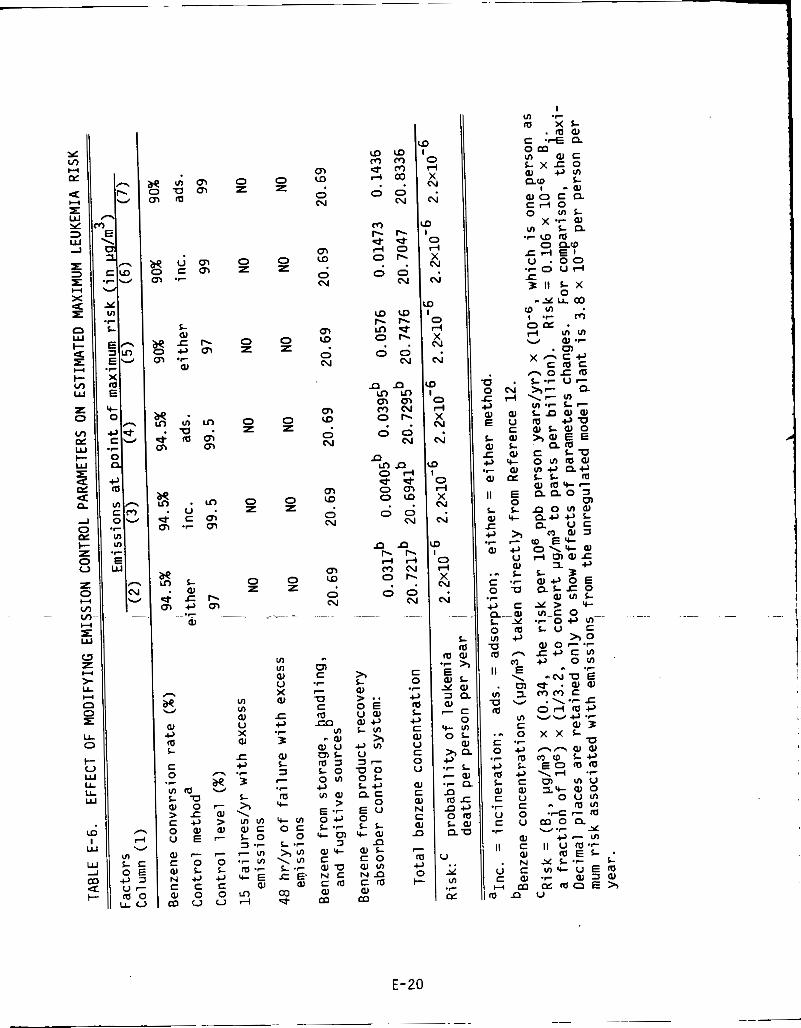
0 z
0 z
0 z
52
52
0 z
-
m VI w U X W
.c 4J
3 L >, \ m m w e L O a .r - V I .r m
.C
2 .E W
In d
m b b e * I 4 0 o r - 0 0 . . N
0 z
0 z
0 z
0 z
0 z
0 z
~.
m m W U X w T 4
3 w L a
.r
7
.r m 9-
rcv l o c 0
W I 0 rl x
N N ,
m ID
0 N
m W 0 N
0 W 0 N
m W 0 N
m W
N 0
m ID
0 N
~
" m c
W W b b r n * 0 -
0 0 N N
n n L o r n m N O b
0 0
m m
. . N
W I 0 rl x
. N . w I o rl x
N N .
A m 0
0
~~~
?? W 5 .. O E u w m o LVI
>, 4 J m U a - u o O L Lc, 0
E U 0 L L
+ - w W L e o w V I
e m W
n c
n
~n
m
n tnn 0 4 b * o m O W 0 0
N
. .
ab I d
N 8b
0 N
~~
c 0
4J m L c, c al V c 0 U
w c w N c w
.r
n 7
m c, 0 c
3 4 X N N
I
0 rl X N
N
m .r E w Y
w
e 0
>, 4J
a - .r 7
.r n m n
n 0 L
L) .. Y VI
CT .r
E-20
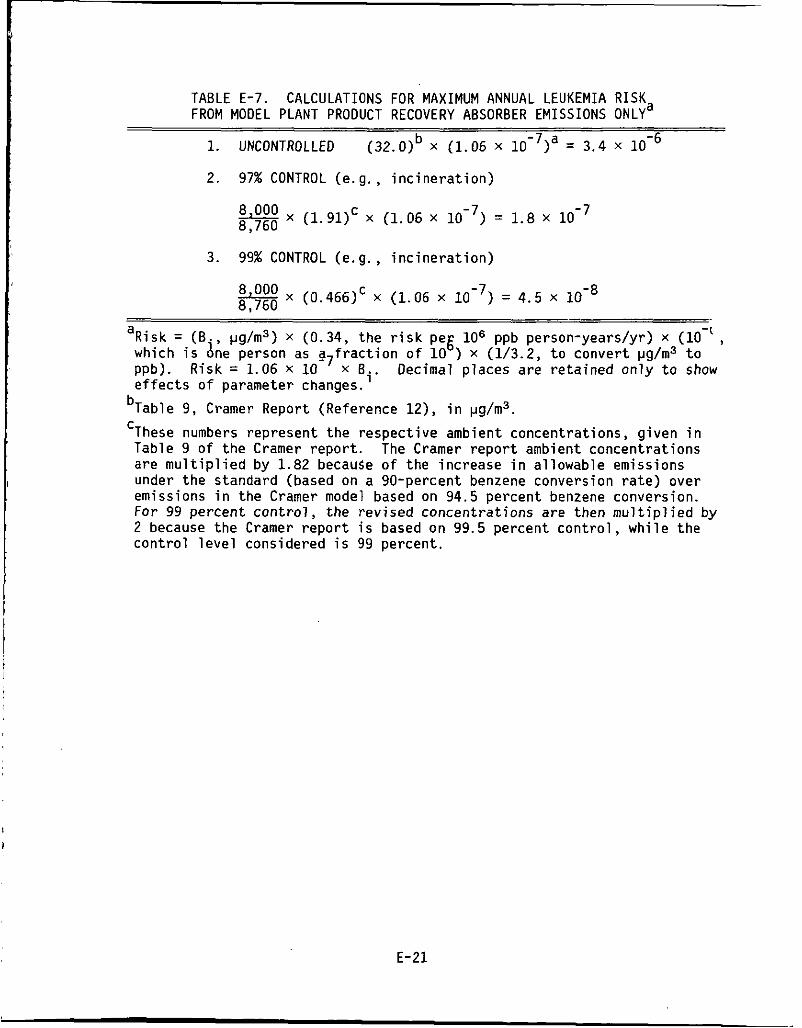
TABLE E-7. FROM MODEL PLANT PRODUCT RECOVERY ABSORBER EMISSIONS ONLY
1. UNCONTROLLED (32.0)b x (1.06 x 10-7)a = 3.4 x
2. 97% CONTROL (e.g. , i n c i n e r a t i o n )
CALCULATIONS FOR MAXIMUM ANNUAL LEUKEMIA R I S K a
e x (1.91)' x (1.06 x 10 -7 ) - - 1.8 X 8,760
3. 99% CONTROL (e.g., i n c i n e r a t i o n )
x (0.466)' x (1.06 x 10 -7 ) - - 4.5 x 8,760
aRisk = (Ei, pg/m3) x (0.34, the r i s k peg l o 6 ppb person-years/yr) x ( l o - ' , which i s one person as a 7 f r a c t i o n o f 10 ) x ( V 3 . 2 , t o conver t pg/m3 t o ppb). Risk = 1.06 x 10 x B i . Decimal places are re ta ined o n l y t o show e f f e c t s o f parameter changes.
These numbers represent the respec t ive ambient concentrat ions, g iven i n Table 9 o f t h e Cramer repo r t . The Cramer r e p o r t ambient concentrat ions are m u l t i p l i e d by 1.82 because o f the increase i n a l lowable emissions under the standard (based on a 90-percent benzene conversion r a t e ) over emissions i n the Cramer model based on 94.5 percent benzene conversion. For 99 percent c o n t r o l , the rev ised concent ra t ions are then m u l t i p l i e d by 2 because the Cramer r e p o r t i s based on 99.5 percent c o n t r o l , w h i l e the c o n t r o l l e v e l considered i s 99 percent .
bTable 9, Cramer Report (Reference 12), i n pg/m3. C
E - 2 1
maximum r i s k i s 1.8 x
the maximum r i s k i s 4 .5 x p e r person per year.
E.4.5 V a l i d i t y o f Est imates
per person p e r year . For 99 percent c o n t r o l ,
Several p o t e n t i a l sources o f e r r o r e x i s t i n the est imated f a c t o r s used
i n Equat ion 1 (R, Pi, Bi, C, f).
are discussed i n P a r t E.2.3, and sources o f e r r o r i n populat ions " a t r i s k " (Pi) a re discussed i n P a r t E.3.
d iscussed below.
c a r r i e d i n t h e decimals i n Tables E-3 through E-7 i s no t an i n d i c a t i o n of
t h e i r accuracy b u t r a t h e r a means o f enab l ing readers t o d u p l i c a t e t h e
c a l c u l a t i o n s and t o v i s u a l i z e t h e magnitude o f d i f f e r e n c e among t h e opt ions
considered.
m e t r i c tons p e r yea r were est imated by p r o j e c t i n g ou tpu t t o 1982 and assum-
i n g opera t ion a t f u l l capaci ty . t o t a l p l a n t ou tpu t produced us ing benzene as t h e feedstock.
( f) are based on c u r r e n t p l a n t operat ions.
p roduc t ion est imates may be inaccura te e i t h e r on t h e h i g h o r l o w s ide,
a f f e c t i n g (C). Plants may s t a r t us ing n-butane as a feedstock t o a g rea ter o r l esse r degree, a f f e c t i n g (f). (C) and ( f) cannot be de f ined i n numerical terms.
E.4.5.2 Benzene Concentrat ions (B i l The est imated benzene concent ra t ions are der ived from several f a c t o r s ,
Poss ib le e r r o r s i n t h e r i s k f a c t o r (R)
The v a l i d i t y o f t h e o the r f a c t o r s i s
Readers should note t h a t t h e number o f s i g n i f i c a n t f i g u r e s
E.4.5.1 P l a n t capac i ty (C, f). P l a n t capac i t i es (C) i n thousands o f
The f a c t o r (f) represents t h e f r a c t i o n o f Est imates of
Because p l a n t capac i t i es a re o f t e n nominal values, t h e capac i t y and
The degree o f e r r o r i n t h e est imates o f
~ ~ - -
~ ~- -_
as fo l lows: - Conf igura t ion o f the model p l a n t ,
Emission ra tes from t h e model p l a n t , and
D ispers ion p a t t e r n s o f t h e emissions.
Numerical e r r o r l i m i t s cou ld no t be ca l cu la ted f o r these fac to rs , b u t
t h e i r q u a l i t a t i v e e f f e c t s on the est imated number o f leukemia deaths are
discussed below.
w i t h storage tanks and product recovery absorbers a t s p e c i f i c l oca t i ons and
heights , and w i t h f u g i t i v e sources u n i f o r m l y d i s t r i b u t e d a t the p l a n t s i t e .
Emissions from the model p l a n t have been est imated from several sources and
The c o n f i g u r a t i o n o f t h e model p l a n t assumes a g iven area (4,500 sq m),
E-22
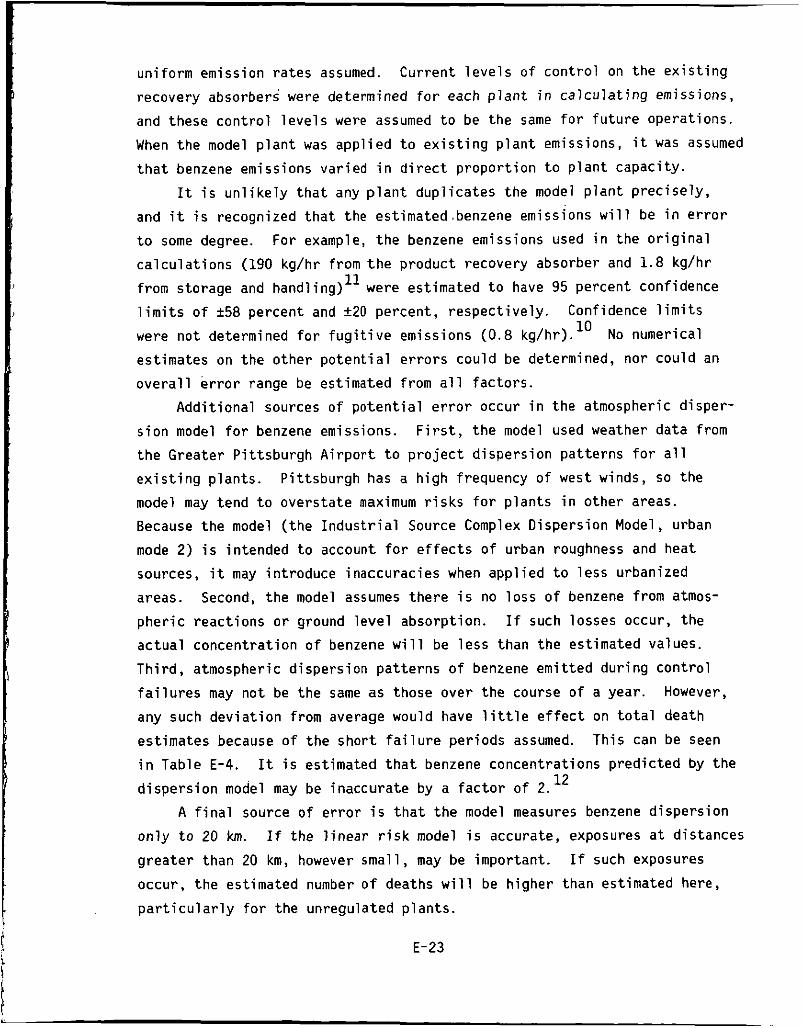
uni form emission ra tes assumed.
recovery absorbers were determined f o r each p l a n t i n c a l c u l a t i n g emissions,
and these c o n t r o l l e v e l s were assumed t o be the same f o r f u t u r e operat ions. When t h e model p l a n t was app l ied t o e x i s t i n g p l a n t emissions, i t was assumed
t h a t benzene emissions var ied i n d i r e c t p r o p o r t i o n t o p l a n t capac i ty .
I t i s u n l i k e l y t h a t any p l a n t dup l i ca tes the model p l a n t p r e c i s e l y , and i t i s recognized t h a t the estimated.benzene emissions w i l l be i n e r r o r
t o some degree. For example, t h e benzene emissions used i n the o r i g i n a l c a l c u l a t i o n s (190 kg/hr from t h e product recovery absorber and 1.8 kg/hr
from storage and handling)” were est imated t o have 95 percent conf idence
l i m i t s o f +58 percent and k20 percent , respec t i ve l y . Confidence l i m i t s
were n o t determined f o r f u g i t i v e emissions (0.8 kg/hr).1° No numerical
est imates on t h e o ther p o t e n t i a l e r r o r s cou ld be determined, nor cou ld an o v e r a l l e r r o r range be est imated from a l l f ac to rs .
Current l e v e l s o f c o n t r o l on t h e e x i s t i n g
Add i t i ona l sources o f p o t e n t i a l e r r o r occur i n the atmospheric d isper -
s ion model f o r benzene emissions. F i r s t , t h e model used weather data from t h e Greater P i t t sbu rgh A i r p o r t t o p r o j e c t d ispers ion pa t te rns f o r a l l
e x i s t i n g p lan ts .
model may tend t o overs ta te maximum r i s k s f o r p l a n t s i n o ther areas. Because the model ( t he I n d u s t r i a l Source Complex Dispers ion Model, urban
mode 2) i s in tended t o account f o r e f f e c t s o f urban roughness and heat sources, i t may in t roduce inaccurac ies when app l ied t o l ess urbanized areas. Second, t h e model assumes the re i s no l oss o f benzene from atmos-
phe r i c reac t i ons o r ground l e v e l absorpt ion. I f such losses occur, the ac tua l concent ra t ion o f benzene w i l l be l ess than t h e est imated values.
Th i rd , atmospheric d ispers ion p a t t e r n s o f benzene emi t ted dur ing c o n t r o l
f a i l u r e s may no t be t h e same as those over t h e course o f a year .
any such d e v i a t i o n from average would have l i t t l e e f f e c t on t o t a l death
est imates because o f t h e s h o r t f a i l u r e per iods assumed.
i n Table E-4. 12 d i spe rs ion model may be inaccura te by a f a c t o r o f 2.
on l y t o 20 km.
g rea te r than 20 km, however smal l , may be important. occur, t h e est imated number o f deaths w i l l be h igher than est imated here, p a r t i c u l a r l y f o r the unregulated p lan ts .
P i t t sbu rgh has a h igh frequency o f w e s t winds, so the
However,
Th is can be seen
It i s est imated t h a t benzene concentrat ions p red ic ted by t h e
A f i n a l source o f e r r o r i s t h a t t h e model measures benzene d i spe rs ion I f the l i n e a r r i s k model i s accurate, exposures a t d is tances
I f such exposures
E-23
E. 5
1.
2.
3.
4.
5.
6 .
7.
8.
9. ~
10.
11.
12.
13.
REFERENCES
U.S. Environmental P ro tec t i on Agency. Assessment o f Hea l th E f f e c t s o f Benzene Germane t o Low Level Exposure. EPA-600/1-78-061. September 1978.
Picciano, 0. Cytogenet ic Study o f Workers Exposed t o Benzene. In : Environmental Research ( i n press). 1979.
Nat ional I n s t i t u t e f o r Occupational Safe ty and Health. C r i t e r i a f o r a Recommended Standard--Occupational Exposure t o Benzene. HEW Publ ica- t i o n Number (NIOSH)74-137. 1974.
American Conference o f Governmental I n d u s t r i a l Hygienists. Threshold L i m i t Values f o r Chemical Substances and Physical Agents i n the Work- room Environment w i t h In tended Changes f o r 1977. 1977.
Nat ional I n s t i t u t e f o r Occupational Safe ty and Health. Revised Recom- mendation f o r an Occupational Exposure Standard f o r Benzene. August 1976.
Occupational Safety and Hea l th Admin is t ra t ion . Occupational Safety and Hea l th Standards, 29 CFR 1910.1000, Table 2-2. P u b l i c a t i o n 2206. 1976.
42 FR 27452. May 27, 1977.
U.S. Environmental P r o t e c t i o n Agency. Carcinogen Assessment Group (R. A l b e r t , Chairman). Populat ion R isk t o Ambient Benzene Exposures. August 1978.
L e t t e r Report t o €PA, from Energy and Environmental Analys is , Inc . June 20, 1978.
PEOCo Environmental, Inc. Pre l im inary Assessment o f Male ic Anhydride Manufactur ing Emissions. A p r i l 1978.
Lawson, J.F. Emissions Contro l Opt ions f o r t h e Synthe t ic Organic Chemicals Manufactur ing Indus t r y Ma le ic Anhydride--Product Report. Hydroscience, Inc . (Prepared f o r O f f i c e o f A i r Q u a l i t y Planning and Standards, U.S. Environmental P r o t e c t i o n Agency. Research T r iang le Park, N.C.) . EPA Contract Number 68-02-2577. March 1978.
H. E. Cramer Co., Inc. D ispers ion Model Analys is o f t h e A i r Q u a l i t y Impact o f Benzene Emissions from a Male ic Anhydride P lan t f o r Four Emission Contro l Options. EPA Contract Number 68-02-2507. August 1978.
Pub l ic Hea l th Service, U.S. Department o f Heal th, Education, and Welfare. V i t a l S t a t i s t i c s o f the Un i ted Sta tes , 1973 (and 1975 pre- 1 i m i nary f i g u r e s ) .
~ ~
EPA Contract Number 68-02-2515, Task 23.
E-24
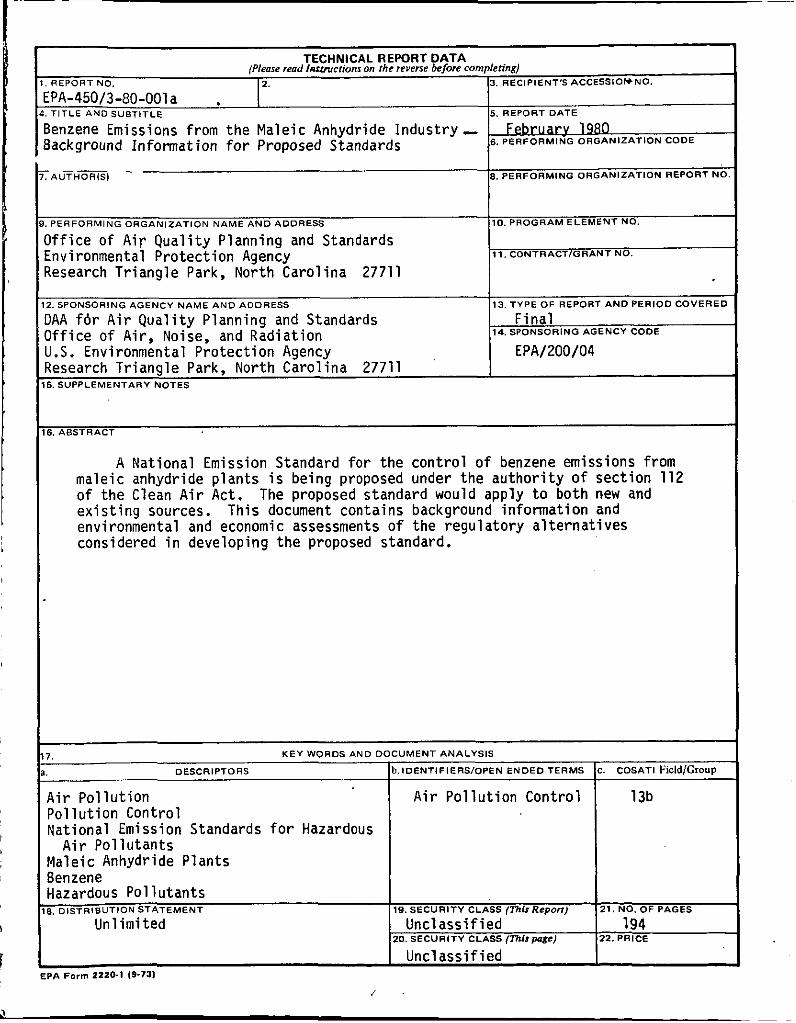
PA-450/3-80-001 a TITLE AND SUBTITLE 15. REPORT DATE
'enzene Emissions from the Maleic Anhydride Industry - ackground information for Proposed Standards -- -
AUTHORISI
PERFORMING ORGANIZATION NAME A N D ADDRESS
Februarv 1980 6. PERFORMING ORGANIZATION CODE
8. PERFORMING ORGANIZATION REPORT N O
10. PROGRAM ELEMENT NO.
11. CONTRACTIGRANT NO. t------ Iffice of Air Quality Planning and Standards :nvironmental Protection Agency :esearch Triangle Park, North Carolina 27711
I !.SPONSORING AGENCY NAME A N D ADDRESS 113. TYPE OF REPORT A N D PERIOD COVERED
IAA fdr Air Quality Planning and Standards Iffice of Air, Noise, and Radiation I.S. Environmental Protection Agency EPA/200/04 :esearch Triangle Park, North Carolina 27711 i. SUPPLEMENTARY NOTES
i. ABSTRACT
A National Emission Standard for the control of benzene emissions from maleic anhydride plants is being proposed under the authority of section 112 of the Clean Air Act. existing sources. environmental and economic assessments of the regulatory alternatives considered in developing the proposed standard.
The proposed standard would apply to both new and This document contains background information and
KEY WORDS AND DOCUMENT ANALYSIS
DESCRIPTORS Ib.lDENTIFIERSfOPEN ENDED TERMS IC. COSATI FicldIGroup
\ir Pollution 'ollution Control Vational Emission Standards for Hazardous Air Pollutants
vlaleic Anhydride Plants 3enzene iazardous Pollutants
Unlimited I. DISTRIBUTION STATEMENT
I Air Pollution Control I 13b
I Unclassified >A Form 2220-1 19-71)
,'