Embed Size (px)
Citation preview
CAPITAL PROGRAM SUMMARY
City Planning 2018 – 2027 CAPITAL BUDGET AND PLAN OVERVIEW
City Planning helps to guide the way the city looks and grows by working with the community and other City divisions to set goals and policies for development, while taking into consideration important social, economic and environmental concerns.
The 10-Year Capital Plan is $62.914 million to provide funding to achieve legislative requirements relating to the City's Official Plan, Zoning By-Law and the Archaeological Management Plan Phase II; advancing the Work Study Program to further growth, transportation and transit in the City of Toronto; and to create great public spaces.
CONTENTS Overview 1. 10-Year Capital Plan 5
2. Issues for Discussion 14
Appendices 1. 2017 Performance 19
2. 2018 Capital Budget 20
3. 2018 Capital Budget; 2019 - 2027 Capital Plan 21
4. 2018 Cash Flow and Future Year Commitments 22
5. 2018 Capital Budget with Financing Detail 23
6. Reserve / Reserve Fund Review 24
2018 Capital Budget City Planning
CAPITAL SPENDING AND FINANCING
Legislated, $6.1, 10%
2018 - 2027 Capital Budget and Plan
By Project Category
$62.9 Million
Growth Related, $56.8, 90%
Development Charge, $22.9,
36%
By Funding Source
$62.9 Million
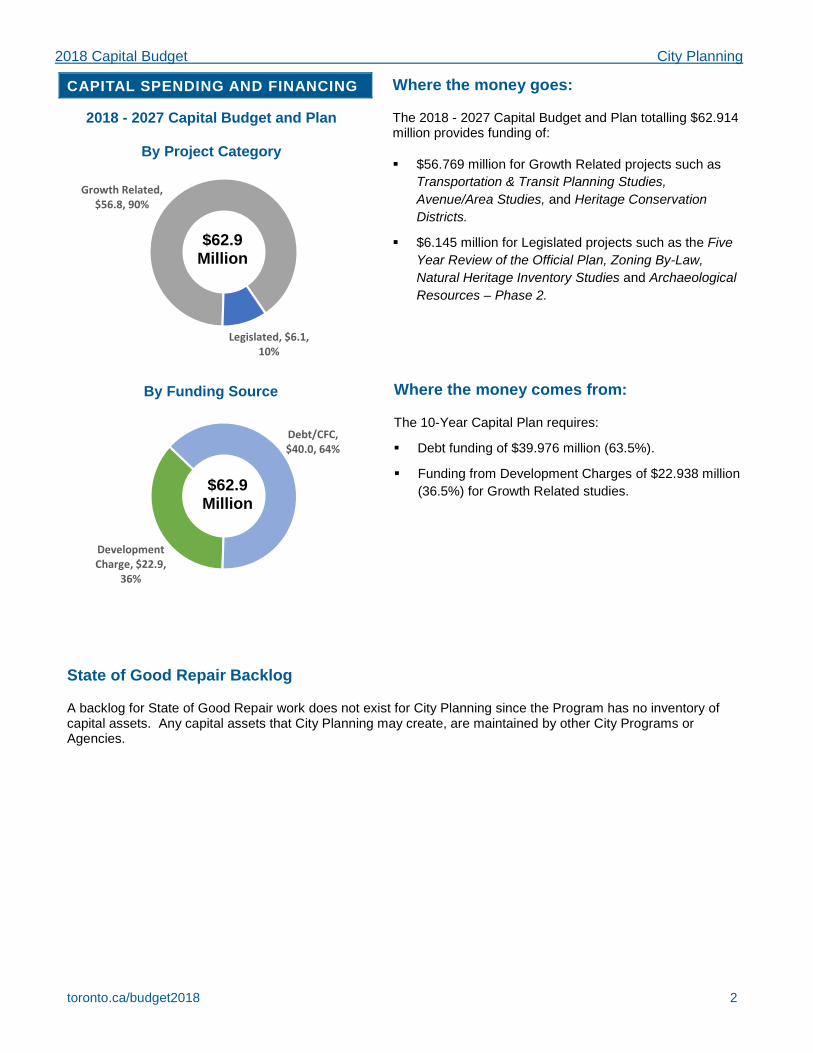
Where the money goes:
The 2018 - 2027 Capital Budget and Plan totalling $62.914 million provides funding of:
$56.769 million for Growth Related projects such as Transportation & Transit Planning Studies, Avenue/Area Studies, and Heritage Conservation Districts.
$6.145 million for Legislated projects such as the Five Year Review of the Official Plan, Zoning By-Law, Natural Heritage Inventory Studies and Archaeological Resources – Phase 2.
Where the money comes from: The 10-Year Capital Plan requires:
Debt funding of $39.976 million (63.5%).
Funding from Development Charges of $22.938 million (36.5%) for Growth Related studies.
State of Good Repair Backlog
A backlog for State of Good Repair work does not exist for City Planning since the Program has no inventory of capital assets. Any capital assets that City Planning may create, are maintained by other City Programs or Agencies.
Debt/CFC, $40.0, 64%
toronto.ca/budget2018 2
2018 Capital Budget City Planning
OUR KEY ISSUES & PRIORITY ACTIONS
Increasing demand and complexities of growth related studies as the City of Toronto invests in large City building infrastructure.
The 10-Year Capital Plan includes funding of $18.780 million to advance various Growth, Avenue/Area, Transportation and Transit related studies.
Heritage Conservation District studies needed to preserve heritage in the City of Toronto in an effective and efficient manner.
The 10-Year Capital Plan includes funding of $8.7 million to execute HCD related studies.
The statutory Five Year Review of the Official Plan to capture new growth in planning policies and the Municipal Comprehensive Review that looks at designated areas of employment in the Official Plan started in 2017 and will require staff effort to complete by year 2021.
The 10-Year Capital Plan includes funding of $3.9 million for the statutory reviews.
2018 CAPITAL BUDGET HIGHLIGHTS
The 2018 Capital Budget for City Planning of $6.781 million, excluding carry forward funding, will:
Continue Development Charge Funded Studies ($2.050 million) including Growth Studies, Transportation & Transit Planning Studies, and Avenue/Area Studies, and Heritage Conservation District studies ($1.0 million)
Continue civic improvements ($2.851 million) to enhance streetscapes in areas such as Glen Road Pedestrian Bridge, John Street and Yonge Street (North York).
Provide for on-going legislated projects ($0.130 million) such as Natural Heritage Inventory & Integration Evaluation System, and Toronto Archaeological Resources – Phase 2 Implementation and the start of the Five Year Review of the Official Plan ($0.750).
toronto.ca/budget2018 3
Development Charge, $2.4,
35%
Debt/CFC, $4.4, 65%
By Funding Source
$6.8 Million
Growth Related,
$5.9, 87%
Legislated, $0.9, 13%
2018 Capital Budget By Project Category
$6.8 Million
2018 Capital Budget City Planning
Council Approved Budget
City Council approved the following recommendations:
1. City Council approve the 2018 Capital Budget for City Planning with a total project cost of $7.360 million, and 2018 cash flow of $6.781 million and future year commitments of $2.978 million comprised of the following:
a) New Cash Flow Funds for:
i. 12 new / change in scope sub-projects with a 2018 total project cost of $7.360 million that requires cash flow of $4.782 million in 2018 and future year cash flow commitments of $2.178 million for 2019; and $0.400 million for 2020.
ii. 5 previously approved sub-projects with a 2018 cash flow of $1.999 million; and future year cash flow commitments of $0.400 million for 2019.
2. City Council approve the 2019 – 2027 Capital Plan for City Planning totalling $53.505 million in project estimates, comprised of $4.480 million for 2019; $6.134 million for 2020; $6.263 million for 2021; $5.818 million for 2022; $5.818 million for 2023; $6.266 million for 2024; $6.266 million for 2025; $6.230 million in 2026; and $6.230 million in 2027.
toronto.ca/budget2018 4
2018 Capital Budget City Planning
Part 1:
10-Year Capital Plan
toronto.ca/budget2018 5
2018 Capital Budget City Planning
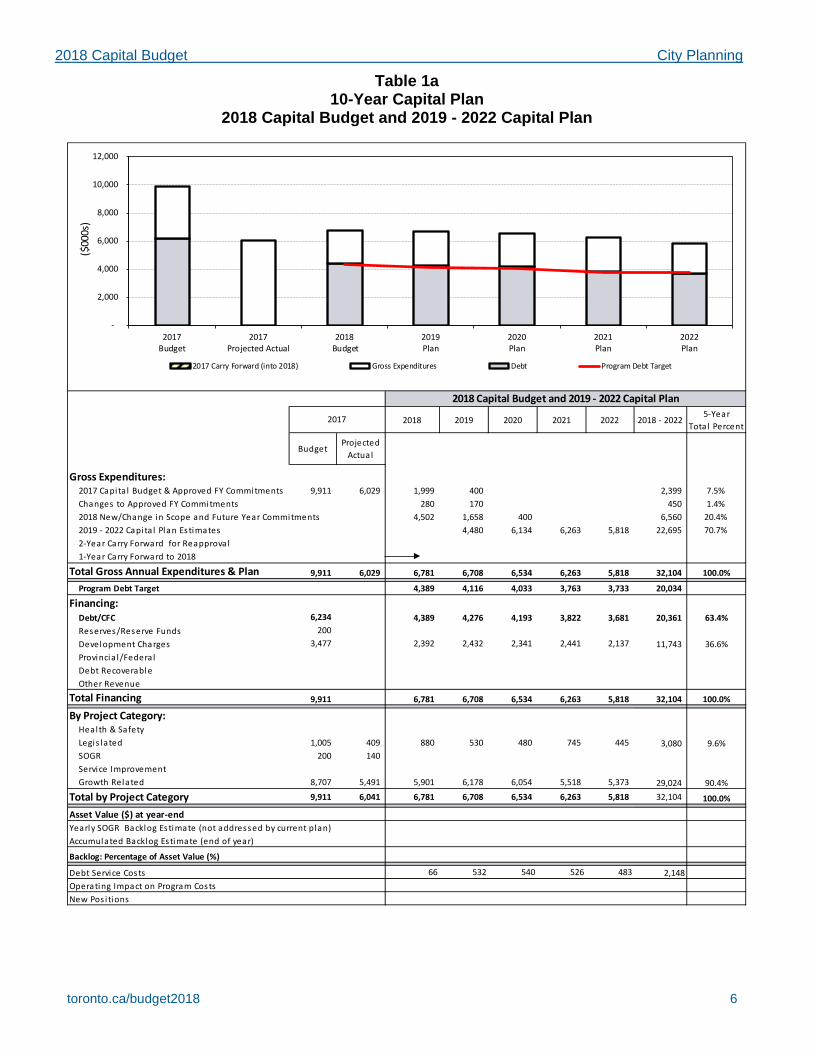
Table 1a 10-Year Capital Plan
2018 Capital Budget and 2019 - 2022 Capital Plan
`
2018 2019 2020 2021 2022 2018 - 20225-Year
Tota l Percent
BudgetProjected
Actual
Gross Expenditures:2017 Capita l Budget & Approved FY Commitments 9,911 6,029 1,999 400 - - - 2,399 7.5%Changes to Approved FY Commitments 280 170 - - - 450 1.4%2018 New/Change in Scope and Future Year Commitments 4,502 1,658 400 - - 6,560 20.4%2019 - 2022 Capita l Plan Estimates - 4,480 6,134 6,263 5,818 22,695 70.7%2-Year Carry Forward for Reapproval - 1-Year Carry Forward to 2018
Total Gross Annual Expenditures & Plan 9,911 6,029 6,781 6,708 6,534 6,263 5,818 32,104 100.0%
Program Debt Target 4,389 4,116 4,033 3,763 3,733 20,034
Financing:Debt/CFC 6,234 4,389 4,276 4,193 3,822 3,681 20,361 63.4%Reserves/Reserve Funds 200 - Development Charges 3,477 2,392 2,432 2,341 2,441 2,137 11,743 36.6%Provincia l/Federa l - Debt Recoverable - Other Revenue -
Total Financing 9,911 6,781 6,708 6,534 6,263 5,818 32,104 100.0%
By Project Category:Health & Safety - Legis lated 1,005 409 880 530 480 745 445 3,080 9.6%SOGR 200 140 - Service Improvement - Growth Related 8,707 5,491 5,901 6,178 6,054 5,518 5,373 29,024 90.4%
Total by Project Category 9,911 6,041 6,781 6,708 6,534 6,263 5,818 32,104 100.0%
Asset Value ($) at year-end - - - - - - Yearly SOGR Backlog Estimate (not addressed by current plan) - Accumulated Backlog Estimate (end of year) -
Backlog: Percentage of Asset Value (%)
Debt Service Costs 66 532 540 526 483 2,148Operating Impact on Program Costs - - - - - - New Pos i tions
2018 Capital Budget and 2019 - 2022 Capital Plan
2017
-
2,000
4,000
6,000
8,000
10,000
12,000
2017Budget
2017Projected Actual
2018 Budget
2019Plan
2020Plan
2021Plan
2022Plan
($00
0s)
2017 Carry Forward (into 2018) Gross Expenditures Debt Program Debt Target
toronto.ca/budget2018 6
2018 Capital Budget City Planning
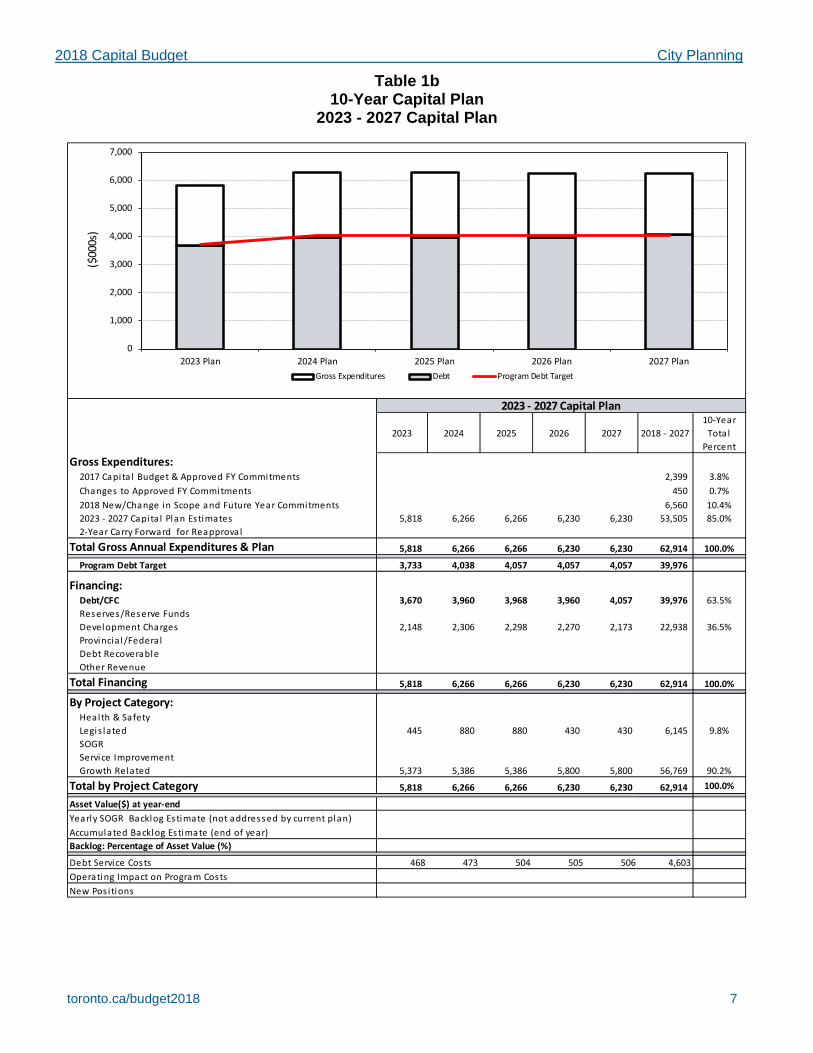
Table 1b 10-Year Capital Plan
2023 - 2027 Capital Plan
`
2023 2024 2025 2026 2027 2018 - 202710-Year
Tota l Percent
Gross Expenditures:2017 Capita l Budget & Approved FY Commitments 2,399 3.8%Changes to Approved FY Commitments 450 0.7%2018 New/Change in Scope and Future Year Commitments 6,560 10.4%2023 - 2027 Capita l Plan Estimates 5,818 6,266 6,266 6,230 6,230 53,505 85.0%2-Year Carry Forward for Reapproval -
Total Gross Annual Expenditures & Plan 5,818 6,266 6,266 6,230 6,230 62,914 100.0%
Program Debt Target 3,733 4,038 4,057 4,057 4,057 39,976
Financing:Debt/CFC 3,670 3,960 3,968 3,960 4,057 39,976 63.5%Reserves/Reserve Funds - Development Charges 2,148 2,306 2,298 2,270 2,173 22,938 36.5%Provincia l/Federa l - Debt Recoverable - Other Revenue -
Total Financing 5,818 6,266 6,266 6,230 6,230 62,914 100.0%
By Project Category:Health & Safety - Legis lated 445 880 880 430 430 6,145 9.8%SOGR - Service Improvement - Growth Related 5,373 5,386 5,386 5,800 5,800 56,769 90.2%
Total by Project Category 5,818 6,266 6,266 6,230 6,230 62,914 100.0%
Asset Value($) at year-end - - - - - - Yearly SOGR Backlog Estimate (not addressed by current plan) - Accumulated Backlog Estimate (end of year) - - - - - - Backlog: Percentage of Asset Value (%)
Debt Service Costs 468 473 504 505 506 4,603Operating Impact on Program Costs - - - - - - New Pos i tions
2023 - 2027 Capital Plan
0
1,000
2,000
3,000
4,000
5,000
6,000
7,000
2023 Plan 2024 Plan 2025 Plan 2026 Plan 2027 Plan
($00
0s)
Gross Expenditures Debt Program Debt Target
toronto.ca/budget2018 7
2018 Capital Budget City Planning
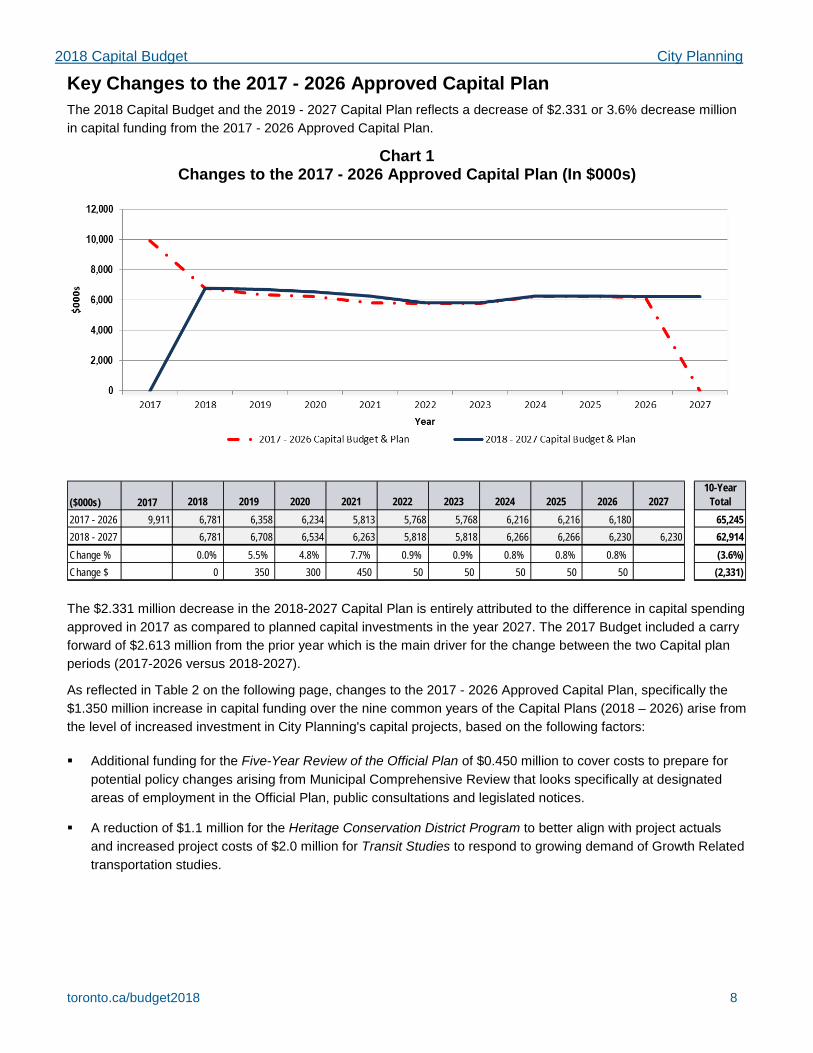
Key Changes to the 2017 - 2026 Approved Capital Plan The 2018 Capital Budget and the 2019 - 2027 Capital Plan reflects a decrease of $2.331 or 3.6% decrease million in capital funding from the 2017 - 2026 Approved Capital Plan.
Chart 1 Changes to the 2017 - 2026 Approved Capital Plan (In $000s)
($000s) 2017 2018 2019 2020 2021 2022 2023 2024 2025 2026 202710-Year
Total2017 - 2026 9,911 6,781 6,358 6,234 5,813 5,768 5,768 6,216 6,216 6,180 65,2452018 - 2027 6,781 6,708 6,534 6,263 5,818 5,818 6,266 6,266 6,230 6,230 62,914Change % 0.0% 5.5% 4.8% 7.7% 0.9% 0.9% 0.8% 0.8% 0.8% (3.6%)Change $ 0 350 300 450 50 50 50 50 50 (2,331)
The $2.331 million decrease in the 2018-2027 Capital Plan is entirely attributed to the difference in capital spending approved in 2017 as compared to planned capital investments in the year 2027. The 2017 Budget included a carry forward of $2.613 million from the prior year which is the main driver for the change between the two Capital plan periods (2017-2026 versus 2018-2027).
As reflected in Table 2 on the following page, changes to the 2017 - 2026 Approved Capital Plan, specifically the $1.350 million increase in capital funding over the nine common years of the Capital Plans (2018 – 2026) arise from the level of increased investment in City Planning's capital projects, based on the following factors:
Additional funding for the Five-Year Review of the Official Plan of $0.450 million to cover costs to prepare for potential policy changes arising from Municipal Comprehensive Review that looks specifically at designated areas of employment in the Official Plan, public consultations and legislated notices.
A reduction of $1.1 million for the Heritage Conservation District Program to better align with project actuals and increased project costs of $2.0 million for Transit Studies to respond to growing demand of Growth Related transportation studies.
toronto.ca/budget2018 8
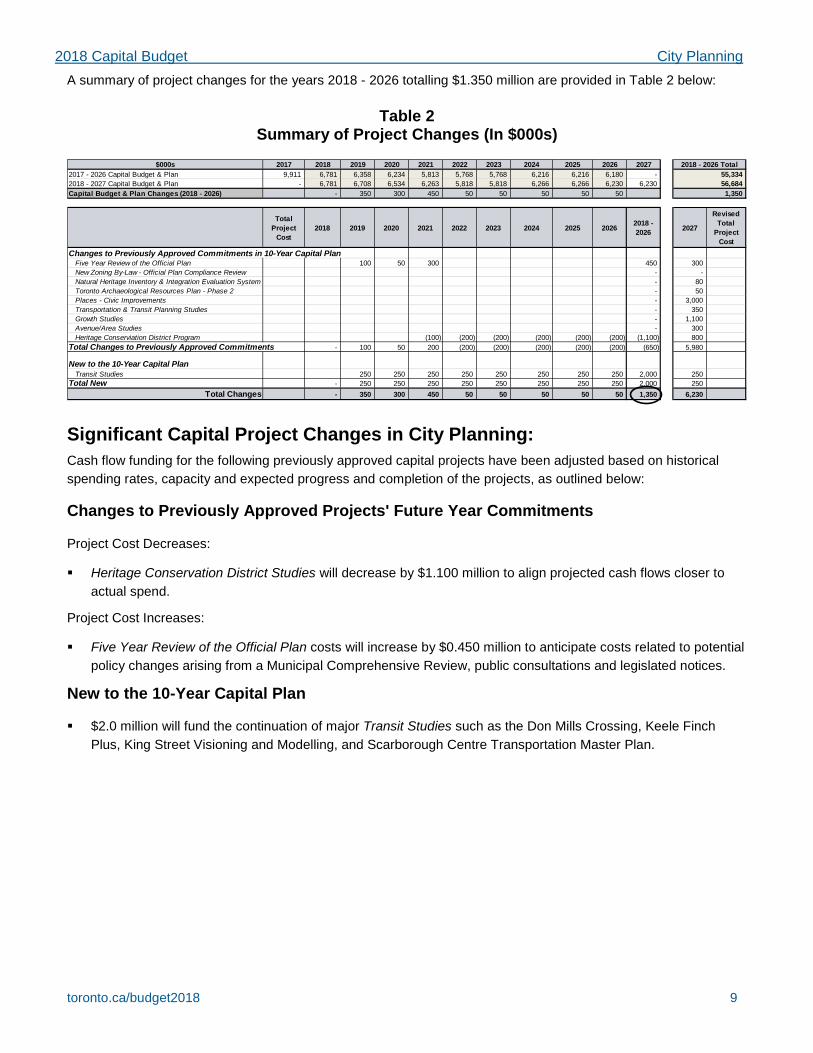
2018 Capital Budget City Planning A summary of project changes for the years 2018 - 2026 totalling $1.350 million are provided in Table 2 below:
Table 2 Summary of Project Changes (In $000s)
$000s 2017 2018 2019 2020 2021 2022 2023 2024 2025 2026 20272017 - 2026 Capital Budget & Plan 9,911 6,781 6,358 6,234 5,813 5,768 5,768 6,216 6,216 6,180 - 2018 - 2027 Capital Budget & Plan - 6,781 6,708 6,534 6,263 5,818 5,818 6,266 6,266 6,230 6,230 Capital Budget & Plan Changes (2018 - 2026) - 350 300 450 50 50 50 50 50
Total Project
Cost2018 2019 2020 2021 2022 2023 2024 2025 2026 2018 -
2026 2027
Revised Total
Project Cost
Changes to Previously Approved Commitments in 10-Year Capital PlanFive Year Review of the Official Plan 100 50 300 450 300 New Zoning By-Law - Official Plan Compliance Review - - Natural Heritage Inventory & Integration Evaluation System - 80 Toronto Archaeological Resources Plan - Phase 2 - 50 Places - Civic Improvements - 3,000 Transportation & Transit Planning Studies - 350 Growth Studies - 1,100 Avenue/Area Studies - 300 Heritage Conserviation District Program (100) (200) (200) (200) (200) (200) (1,100) 800
Total Changes to Previously Approved Commitments - 100 50 200 (200) (200) (200) (200) (200) (650) 5,980
New to the 10-Year Capital PlanTransit Studies 250 250 250 250 250 250 250 250 2,000 250
Total New - 250 250 250 250 250 250 250 250 2,000 250 Total Changes - 350 300 450 50 50 50 50 50 1,350 6,230
1,350
55,334 56,684
2018 - 2026 Total
Significant Capital Project Changes in City Planning: Cash flow funding for the following previously approved capital projects have been adjusted based on historical spending rates, capacity and expected progress and completion of the projects, as outlined below:
Changes to Previously Approved Projects' Future Year Commitments
Project Cost Decreases:
Heritage Conservation District Studies will decrease by $1.100 million to align projected cash flows closer to actual spend.
Project Cost Increases:
Five Year Review of the Official Plan costs will increase by $0.450 million to anticipate costs related to potential policy changes arising from a Municipal Comprehensive Review, public consultations and legislated notices.
New to the 10-Year Capital Plan
$2.0 million will fund the continuation of major Transit Studies such as the Don Mills Crossing, Keele Finch Plus, King Street Visioning and Modelling, and Scarborough Centre Transportation Master Plan.
toronto.ca/budget2018 9
2018 Capital Budget City Planning
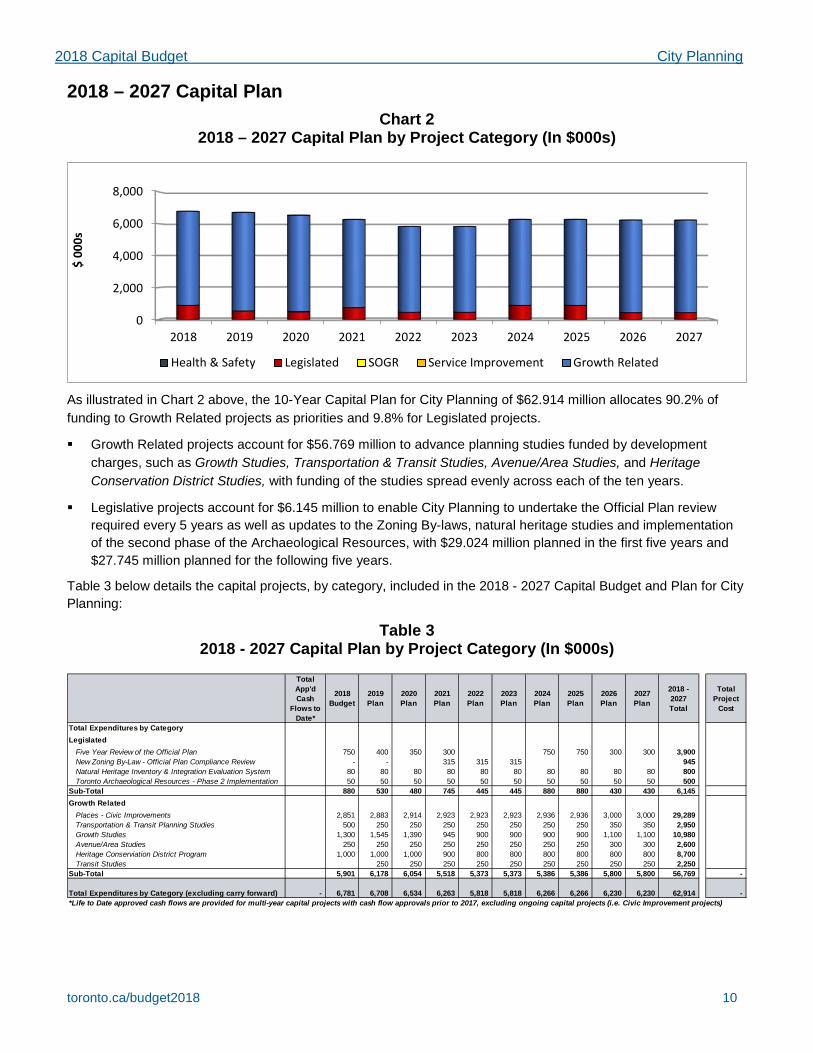
2018 – 2027 Capital Plan Chart 2
2018 – 2027 Capital Plan by Project Category (In $000s)
0
2,000
4,000
6,000
8,000
2018 2019 2020 2021 2022 2023 2024 2025 2026 2027
$ 00
0s
Health & Safety Legislated SOGR Service Improvement Growth Related
As illustrated in Chart 2 above, the 10-Year Capital Plan for City Planning of $62.914 million allocates 90.2% of funding to Growth Related projects as priorities and 9.8% for Legislated projects.
Growth Related projects account for $56.769 million to advance planning studies funded by development charges, such as Growth Studies, Transportation & Transit Studies, Avenue/Area Studies, and Heritage Conservation District Studies, with funding of the studies spread evenly across each of the ten years.
Legislative projects account for $6.145 million to enable City Planning to undertake the Official Plan review required every 5 years as well as updates to the Zoning By-laws, natural heritage studies and implementation of the second phase of the Archaeological Resources, with $29.024 million planned in the first five years and $27.745 million planned for the following five years.
Table 3 below details the capital projects, by category, included in the 2018 - 2027 Capital Budget and Plan for City Planning:
Table 3 2018 - 2027 Capital Plan by Project Category (In $000s)
Total App'd Cash
Flows to Date*
2018 Budget
2019Plan
2020Plan
2021Plan
2022Plan
2023Plan
2024Plan
2025Plan
2026Plan
2027Plan
2018 - 2027 Total
Total Project
Cost
Total Expenditures by CategoryLegislated
Five Year Review of the Official Plan 750 400 350 300 750 750 300 300 3,900 New Zoning By-Law - Official Plan Compliance Review - - 315 315 315 945 Natural Heritage Inventory & Integration Evaluation System 80 80 80 80 80 80 80 80 80 80 800 Toronto Archaeological Resources - Phase 2 Implementation 50 50 50 50 50 50 50 50 50 50 500
Sub-Total 880 530 480 745 445 445 880 880 430 430 6,145 Growth Related
Places - Civic Improvements 2,851 2,883 2,914 2,923 2,923 2,923 2,936 2,936 3,000 3,000 29,289 Transportation & Transit Planning Studies 500 250 250 250 250 250 250 250 350 350 2,950 Growth Studies 1,300 1,545 1,390 945 900 900 900 900 1,100 1,100 10,980 Avenue/Area Studies 250 250 250 250 250 250 250 250 300 300 2,600 Heritage Conserviation District Program 1,000 1,000 1,000 900 800 800 800 800 800 800 8,700 Transit Studies 250 250 250 250 250 250 250 250 250 2,250
Sub-Total 5,901 6,178 6,054 5,518 5,373 5,373 5,386 5,386 5,800 5,800 56,769 -
Total Expenditures by Category (excluding carry forward) - 6,781 6,708 6,534 6,263 5,818 5,818 6,266 6,266 6,230 6,230 62,914 - *Life to Date approved cash flows are provided for multi-year capital projects with cash flow approvals prior to 2017, excluding ongoing capital projects (i.e. Civic Improvement projects)
toronto.ca/budget2018 10
2018 Capital Budget City Planning
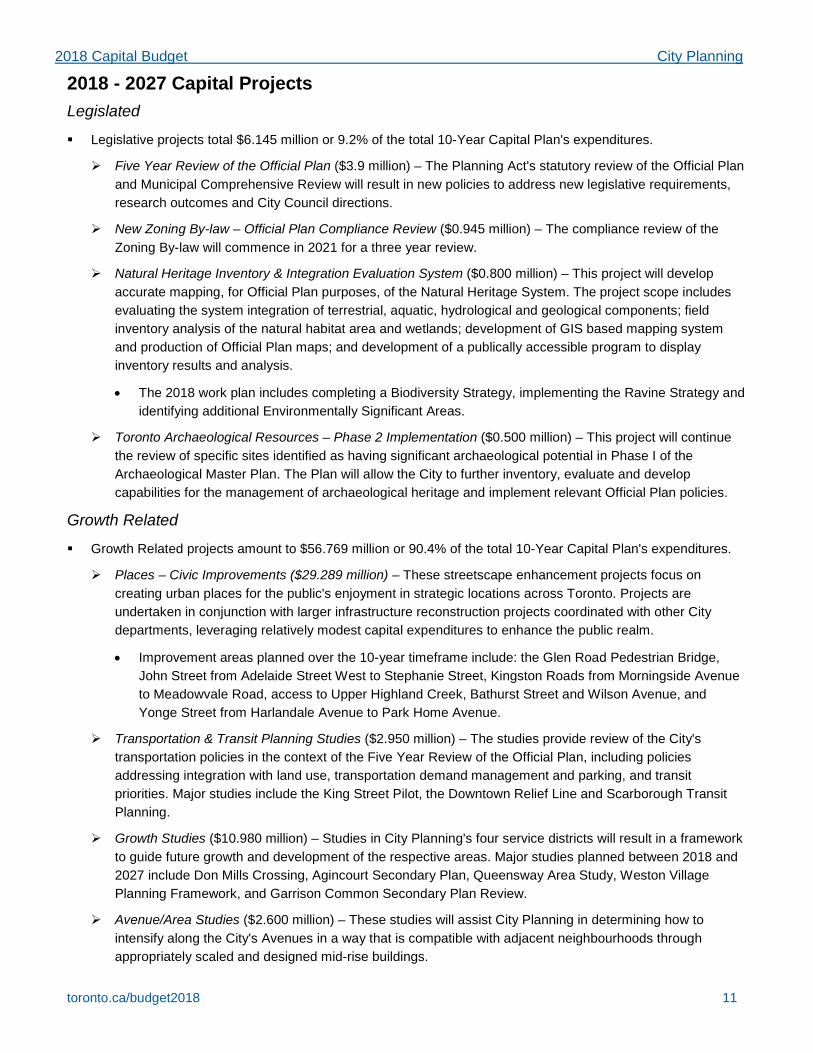
2018 - 2027 Capital Projects Legislated Legislative projects total $6.145 million or 9.2% of the total 10-Year Capital Plan's expenditures.
Five Year Review of the Official Plan ($3.9 million) – The Planning Act's statutory review of the Official Plan and Municipal Comprehensive Review will result in new policies to address new legislative requirements, research outcomes and City Council directions.
New Zoning By-law – Official Plan Compliance Review ($0.945 million) – The compliance review of the Zoning By-law will commence in 2021 for a three year review.
Natural Heritage Inventory & Integration Evaluation System ($0.800 million) – This project will develop accurate mapping, for Official Plan purposes, of the Natural Heritage System. The project scope includes evaluating the system integration of terrestrial, aquatic, hydrological and geological components; field inventory analysis of the natural habitat area and wetlands; development of GIS based mapping system and production of Official Plan maps; and development of a publically accessible program to display inventory results and analysis.
• The 2018 work plan includes completing a Biodiversity Strategy, implementing the Ravine Strategy and identifying additional Environmentally Significant Areas.
Toronto Archaeological Resources – Phase 2 Implementation ($0.500 million) – This project will continue the review of specific sites identified as having significant archaeological potential in Phase I of the Archaeological Master Plan. The Plan will allow the City to further inventory, evaluate and develop capabilities for the management of archaeological heritage and implement relevant Official Plan policies.
Growth Related
Growth Related projects amount to $56.769 million or 90.4% of the total 10-Year Capital Plan's expenditures.
Places – Civic Improvements ($29.289 million) – These streetscape enhancement projects focus on creating urban places for the public's enjoyment in strategic locations across Toronto. Projects are undertaken in conjunction with larger infrastructure reconstruction projects coordinated with other City departments, leveraging relatively modest capital expenditures to enhance the public realm.
• Improvement areas planned over the 10-year timeframe include: the Glen Road Pedestrian Bridge, John Street from Adelaide Street West to Stephanie Street, Kingston Roads from Morningside Avenue to Meadowvale Road, access to Upper Highland Creek, Bathurst Street and Wilson Avenue, and Yonge Street from Harlandale Avenue to Park Home Avenue.
Transportation & Transit Planning Studies ($2.950 million) – The studies provide review of the City's transportation policies in the context of the Five Year Review of the Official Plan, including policies addressing integration with land use, transportation demand management and parking, and transit priorities. Major studies include the King Street Pilot, the Downtown Relief Line and Scarborough Transit Planning.
Growth Studies ($10.980 million) – Studies in City Planning's four service districts will result in a framework to guide future growth and development of the respective areas. Major studies planned between 2018 and 2027 include Don Mills Crossing, Agincourt Secondary Plan, Queensway Area Study, Weston Village Planning Framework, and Garrison Common Secondary Plan Review.
Avenue/Area Studies ($2.600 million) – These studies will assist City Planning in determining how to intensify along the City's Avenues in a way that is compatible with adjacent neighbourhoods through appropriately scaled and designed mid-rise buildings.
toronto.ca/budget2018 11
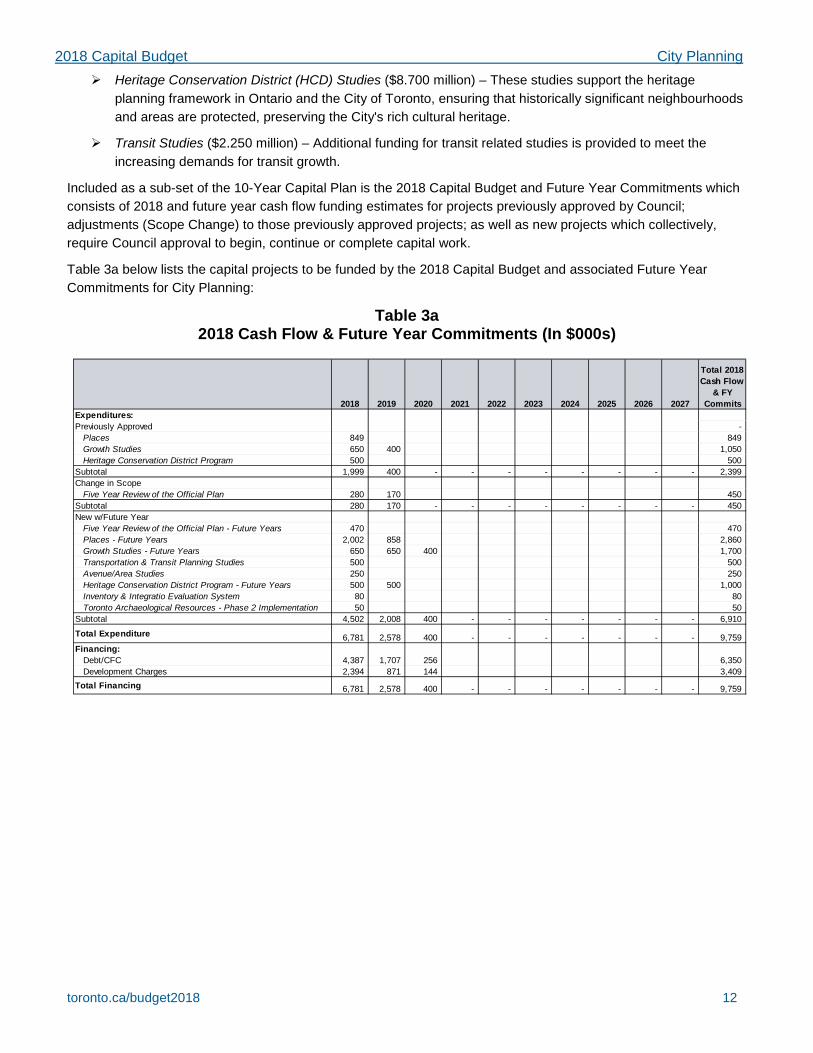
2018 Capital Budget City Planning Heritage Conservation District (HCD) Studies ($8.700 million) – These studies support the heritage
planning framework in Ontario and the City of Toronto, ensuring that historically significant neighbourhoods and areas are protected, preserving the City's rich cultural heritage.
Transit Studies ($2.250 million) – Additional funding for transit related studies is provided to meet the increasing demands for transit growth.
Included as a sub-set of the 10-Year Capital Plan is the 2018 Capital Budget and Future Year Commitments which consists of 2018 and future year cash flow funding estimates for projects previously approved by Council; adjustments (Scope Change) to those previously approved projects; as well as new projects which collectively, require Council approval to begin, continue or complete capital work.
Table 3a below lists the capital projects to be funded by the 2018 Capital Budget and associated Future Year Commitments for City Planning:
Table 3a 2018 Cash Flow & Future Year Commitments (In $000s)
2018 2019 2020 2021 2022 2023 2024 2025 2026 2027
Total 2018 Cash Flow
& FY Commits
Expenditures:Previously Approved -
Places 849 849 Growth Studies 650 400 1,050 Heritage Conservation District Program 500 500
Subtotal 1,999 400 - - - - - - - - 2,399 Change in Scope
Five Year Review of the Official Plan 280 170 450 Subtotal 280 170 - - - - - - - - 450 New w/Future Year
Five Year Review of the Official Plan - Future Years 470 470 Places - Future Years 2,002 858 2,860 Growth Studies - Future Years 650 650 400 1,700 Transportation & Transit Planning Studies 500 500 Avenue/Area Studies 250 250 Heritage Conservation District Program - Future Years 500 500 1,000 Inventory & Integratio Evaluation System 80 80 Toronto Archaeological Resources - Phase 2 Implementation 50 50
Subtotal 4,502 2,008 400 - - - - - - - 6,910
Total Expenditure 6,781 2,578 400 - - - - - - - 9,759 Financing:
Debt/CFC 4,387 1,707 256 6,350 Development Charges 2,394 871 144 3,409
Total Financing 6,781 2,578 400 - - - - - - - 9,759
toronto.ca/budget2018 12
2018 Capital Budget City Planning
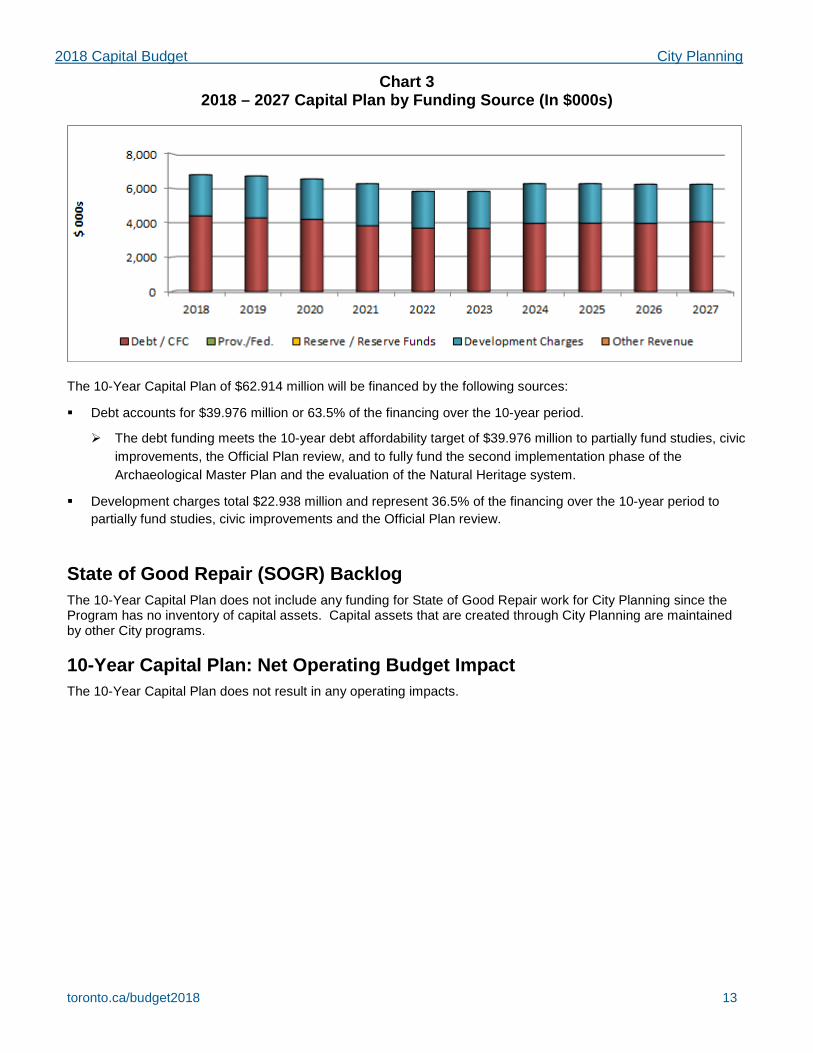
Chart 3 2018 – 2027 Capital Plan by Funding Source (In $000s)
The 10-Year Capital Plan of $62.914 million will be financed by the following sources:
Debt accounts for $39.976 million or 63.5% of the financing over the 10-year period.
The debt funding meets the 10-year debt affordability target of $39.976 million to partially fund studies, civic improvements, the Official Plan review, and to fully fund the second implementation phase of the Archaeological Master Plan and the evaluation of the Natural Heritage system.
Development charges total $22.938 million and represent 36.5% of the financing over the 10-year period to partially fund studies, civic improvements and the Official Plan review.
State of Good Repair (SOGR) Backlog The 10-Year Capital Plan does not include any funding for State of Good Repair work for City Planning since the Program has no inventory of capital assets. Capital assets that are created through City Planning are maintained by other City programs.
10-Year Capital Plan: Net Operating Budget Impact The 10-Year Capital Plan does not result in any operating impacts.
toronto.ca/budget2018 13
2018 Capital Budget City Planning
Part 2:
Issues for Discussion
toronto.ca/budget2018 14
2018 Capital Budget City Planning
Issues Impacting the 2018 Capital Budget Review of Capital Projects and Spending
City Council, at its meeting of May 25, 2017 considered the report entitled "2018 Budget Process – Budget Directions and Schedule EX25.18" and directed that City Programs and Agencies submit their 2018 – 2027 Capital Budget and Plans requiring that:
Annual cash flow funding estimates be examined to more realistically match cash flow spending to project activities and timing, especially in the first 5 years of the Capital Plan's timeframe. http://app.toronto.ca/tmmis/viewAgendaItemHistory.do?item=2017.EX25.18
The 2018 – 2027 Capital Budget and Plan for City Planning has been established following a review of capital requirements based on the reprioritization of capital needs; a review of the Program's spending capacity and the readiness to proceed of planned projects; as well as the ability to reduce overall debt funding and/or leverage non-debt funding sources.
The 10-Year Capital Plan includes a reduction of $1.1 million to the Heritage Conservation District Studies program to better align planned expenditures to project requirements and to reduce pressure on debt targets.
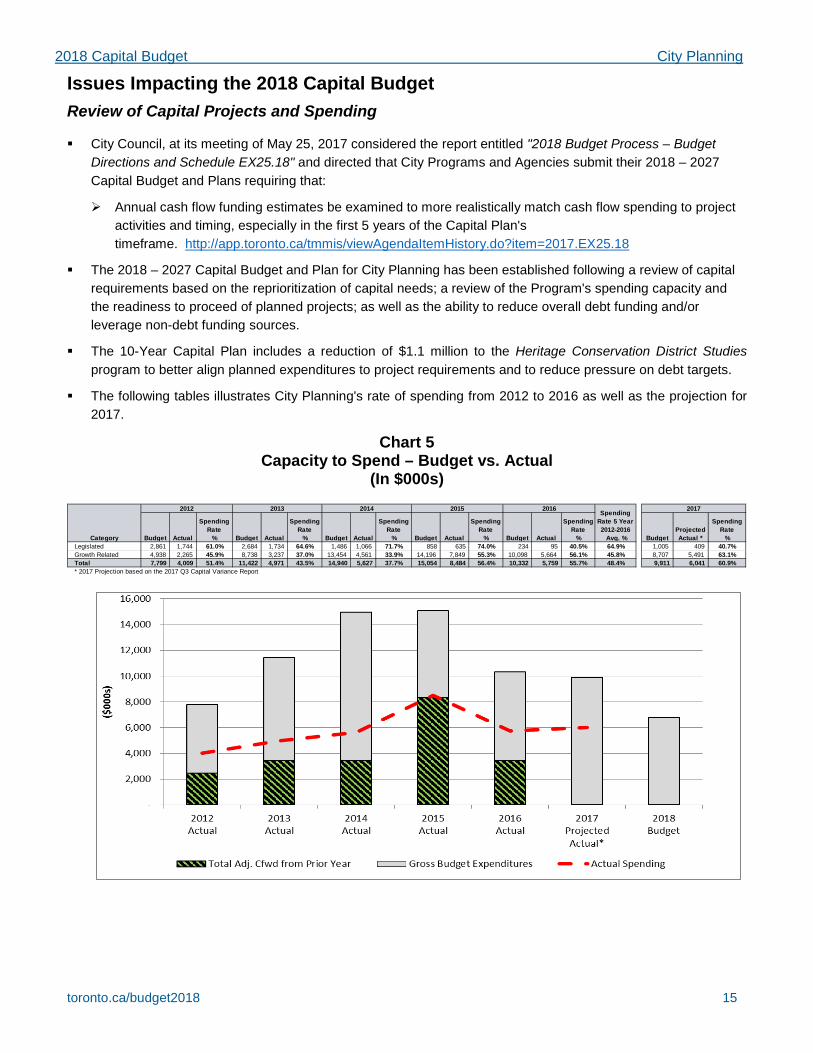
The following tables illustrates City Planning's rate of spending from 2012 to 2016 as well as the projection for 2017.
Chart 5 Capacity to Spend – Budget vs. Actual
(In $000s)
Category Budget Actual
SpendingRate
% Budget Actual
SpendingRate
% Budget Actual
SpendingRate
% Budget Actual
SpendingRate
% Budget Actual
SpendingRate
% BudgetProjected Actual *
SpendingRate
%Legislated 2,861 1,744 61.0% 2,684 1,734 64.6% 1,486 1,066 71.7% 858 635 74.0% 234 95 40.5% 64.9% 1,005 409 40.7%Growth Related 4,938 2,265 45.9% 8,738 3,237 37.0% 13,454 4,561 33.9% 14,196 7,849 55.3% 10,098 5,664 56.1% 45.8% 8,707 5,491 63.1%Total 7,799 4,009 51.4% 11,422 4,971 43.5% 14,940 5,627 37.7% 15,054 8,484 56.4% 10,332 5,759 55.7% 48.4% 9,911 6,041 60.9%* 2017 Projection based on the 2017 Q3 Capital Variance Report
20172012 2013 2014 2015 2016 Spending Rate 5 Year2012-2016 Avg. %
toronto.ca/budget2018 15
2018 Capital Budget City Planning Factors contributing to the average 48.4% spending rate over the past five years include:
Projects completed under budget, with remaining funding not required.
The ability to identify appropriate sites for Heritage Conservation District studies. A new process has been implemented to improve the efficiency and effectiveness of adding listings to the Heritage Registrar and the scope of the studies has been expanded to allow for preliminary heritage analysis work.
Better alignment of cash flow funding with actual project timing and deliverables. The realignment has improved the spending for growth-related projects as noted in Chart 5.
Legislated projects have a five year average spend rate of 64.9%, with increases between years 2012 to 2015. Year 2016 experienced a lower spend from the implementation of the Archaeological Management Plan and Natural Heritage Inventory. The 2017 spend projection is expected to remain at a similar rate of 40.7% due to the timing of the OMB appeals being scheduled for 2018, causing a delay.
Growth related projects have a five year average spend rate of 45.8% primarily driven by the misalignment of cash flows with actual expenditures. Spend rates have improved since 2015 as cash flows were adjusted to split amounts over two years to better match project timelines and improvements are expected to continue in 2017.
Capital spending will continue to be monitored and reported through quarterly variance reporting, any further adjustments required to future year cash flows based on the Program's capacity to spend along with the readiness of projects to proceed will be reflected as part of the 2019 Budget process.
IBMS Upgrade The Integrated Business Management System, primarily used by Toronto Building, City Planning and Municipal
Licensing & Standards, is at its end of life.
The system plays a critical role in processing building permits, tracking building inspections, and tracking City Planning applications.
IBMS is a project tracking and data management system that automates business processes, activities and tracking; allows for automatic assignment of tasks and modifications based on changing business needs including amending user fees, billing and collection, maintaining project tracking records, producing status reports and assigning various tasks to City employees.
A review is underway to assess the business needs of the users to provide the best technical solution, taking in consideration of various business transformation initiatives that are currently active.
City Planning will be funding its proportionate share of this I&T project from the CP Development Technology Reserve Fund (XR1306).
Unmet Needs Future Growth Studies
Unmet Needs – Projects Excluded due to Funding Constraints (In $000s)
City Planning's Study Work Program is constantly evolving based on changes to Program-specific, Corporate and City-wide priorities. New initiatives are added through requests from City Council, or as identified by the
toronto.ca/budget2018 16
Project Description (In $000s)
Total Project Expenditure
Non-Debt Funding
Debt Required 2018 2019 2020 2021 2022 2023 2024 2025 2026 2027
Future Growth Studies 3,500.0 1,260.0 2,240.0 500.0 500.0 500.0 500.0 500.0 500.0 500.0 Total 3,500.0 1,260.0 2,240.0 - - - 500.0 500.0 500.0 500.0 500.0 500.0 500.0
2018 Capital Budget City Planning Program in response to new public investment, growth pressure, shifts in demographic and economic conditions, or legislative changes.
Additional Growth studies of $3.5 million remain unfunded due to financial constraints, impacting studies such as the King Street Transit Priority, Golden Mile Focus Area Secondary Plan, Eglinton/Laird Focus Area Review, and Zoning By-Law updates as a result of new Growth Plan.
toronto.ca/budget2018 17
2018 Capital Budget City Planning
Appendices
toronto.ca/budget2018 18
2018 Capital Budget City Planning
Appendix 1
2017 Performance
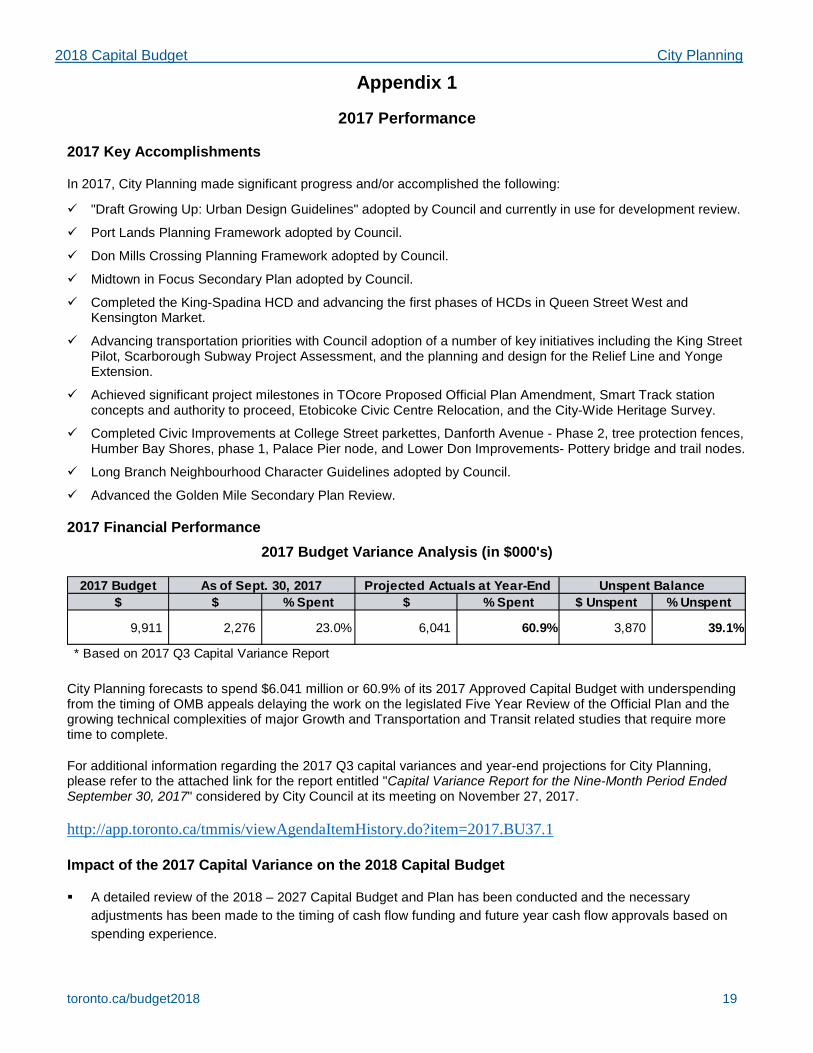
2017 Key Accomplishments
In 2017, City Planning made significant progress and/or accomplished the following:
"Draft Growing Up: Urban Design Guidelines" adopted by Council and currently in use for development review.
Port Lands Planning Framework adopted by Council.
Don Mills Crossing Planning Framework adopted by Council.
Midtown in Focus Secondary Plan adopted by Council.
Completed the King-Spadina HCD and advancing the first phases of HCDs in Queen Street West and Kensington Market.
Advancing transportation priorities with Council adoption of a number of key initiatives including the King Street Pilot, Scarborough Subway Project Assessment, and the planning and design for the Relief Line and Yonge Extension.
Achieved significant project milestones in TOcore Proposed Official Plan Amendment, Smart Track station concepts and authority to proceed, Etobicoke Civic Centre Relocation, and the City-Wide Heritage Survey.
Completed Civic Improvements at College Street parkettes, Danforth Avenue - Phase 2, tree protection fences, Humber Bay Shores, phase 1, Palace Pier node, and Lower Don Improvements- Pottery bridge and trail nodes.
Long Branch Neighbourhood Character Guidelines adopted by Council.
Advanced the Golden Mile Secondary Plan Review.
2017 Financial Performance 2017 Budget Variance Analysis (in $000's)
2017 Budget$ $ % Spent $ % Spent $ Unspent % Unspent
9,911 2,276 23.0% 6,041 60.9% 3,870 39.1%
* Based on 2017 Q3 Capital Variance Report
As of Sept. 30, 2017 Projected Actuals at Year-End Unspent Balance
City Planning forecasts to spend $6.041 million or 60.9% of its 2017 Approved Capital Budget with underspending from the timing of OMB appeals delaying the work on the legislated Five Year Review of the Official Plan and the growing technical complexities of major Growth and Transportation and Transit related studies that require more time to complete.
For additional information regarding the 2017 Q3 capital variances and year-end projections for City Planning, please refer to the attached link for the report entitled "Capital Variance Report for the Nine-Month Period Ended September 30, 2017" considered by City Council at its meeting on November 27, 2017.
http://app.toronto.ca/tmmis/viewAgendaItemHistory.do?item=2017.BU37.1 Impact of the 2017 Capital Variance on the 2018 Capital Budget
A detailed review of the 2018 – 2027 Capital Budget and Plan has been conducted and the necessary adjustments has been made to the timing of cash flow funding and future year cash flow approvals based on spending experience.
toronto.ca/budget2018 19
2018 Capital Budget City Planning
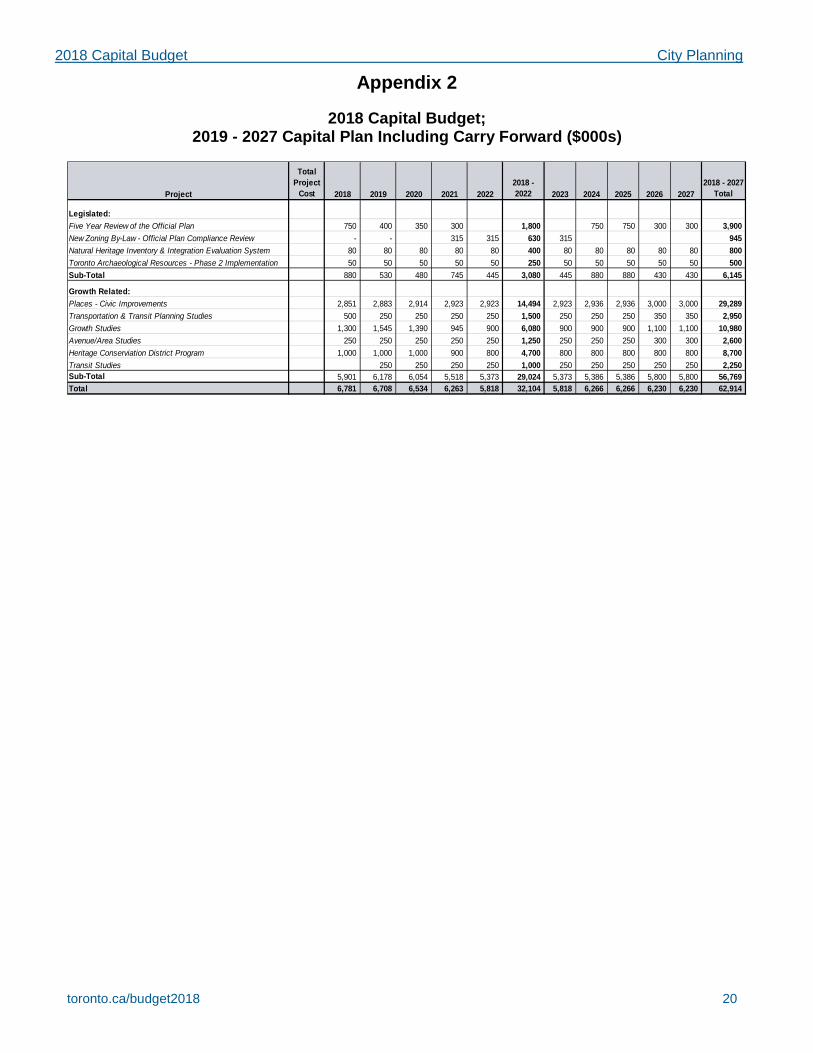
Appendix 2
2018 Capital Budget; 2019 - 2027 Capital Plan Including Carry Forward ($000s)
Project
Total Project
Cost 2018 2019 2020 2021 20222018 - 2022 2023 2024 2025 2026 2027
2018 - 2027 Total
Legislated:Five Year Review of the Official Plan 750 400 350 300 1,800 750 750 300 300 3,900 New Zoning By-Law - Official Plan Compliance Review - - 315 315 630 315 945 Natural Heritage Inventory & Integration Evaluation System 80 80 80 80 80 400 80 80 80 80 80 800 Toronto Archaeological Resources - Phase 2 Implementation 50 50 50 50 50 250 50 50 50 50 50 500 Sub-Total 880 530 480 745 445 3,080 445 880 880 430 430 6,145
Growth Related:Places - Civic Improvements 2,851 2,883 2,914 2,923 2,923 14,494 2,923 2,936 2,936 3,000 3,000 29,289 Transportation & Transit Planning Studies 500 250 250 250 250 1,500 250 250 250 350 350 2,950 Growth Studies 1,300 1,545 1,390 945 900 6,080 900 900 900 1,100 1,100 10,980 Avenue/Area Studies 250 250 250 250 250 1,250 250 250 250 300 300 2,600 Heritage Conserviation District Program 1,000 1,000 1,000 900 800 4,700 800 800 800 800 800 8,700 Transit Studies 250 250 250 250 1,000 250 250 250 250 250 2,250 Sub-Total 5,901 6,178 6,054 5,518 5,373 29,024 5,373 5,386 5,386 5,800 5,800 56,769 Total 6,781 6,708 6,534 6,263 5,818 32,104 5,818 6,266 6,266 6,230 6,230 62,914
toronto.ca/budget2018 20
2018 Capital Budget City Planning
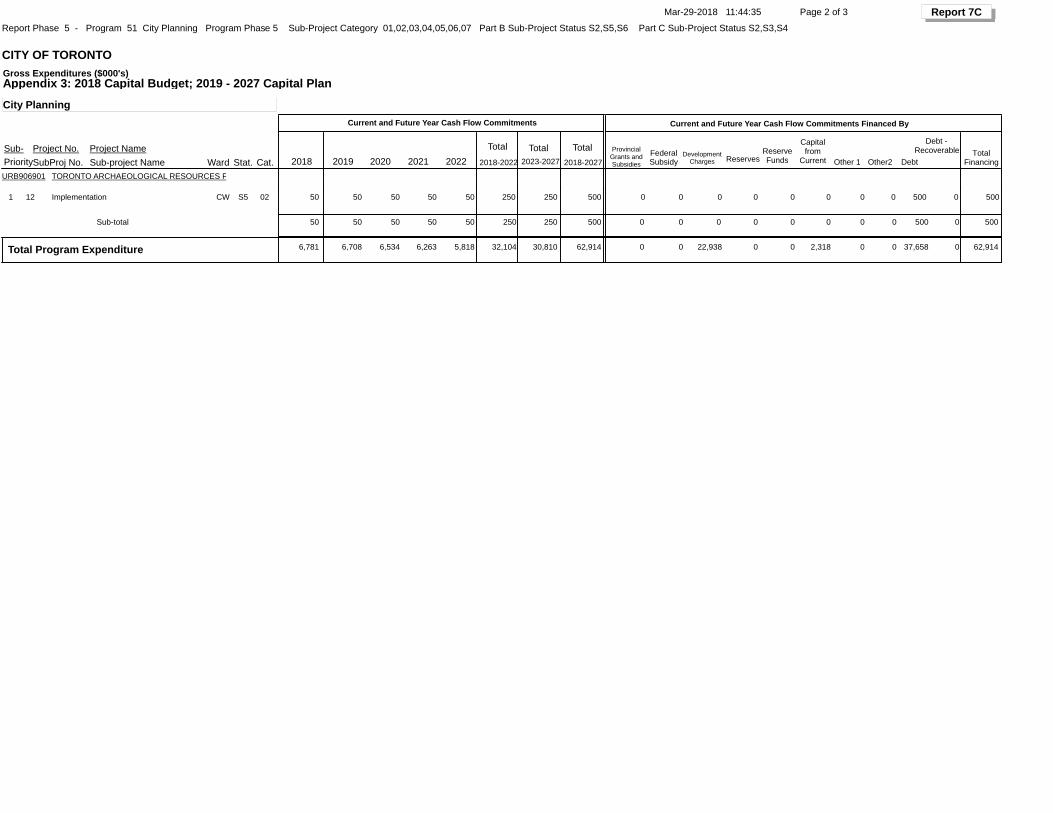
Appendix 3
2018 Capital Budget; 2019 - 2027 Capital Plan
toronto.ca/budget2018 21
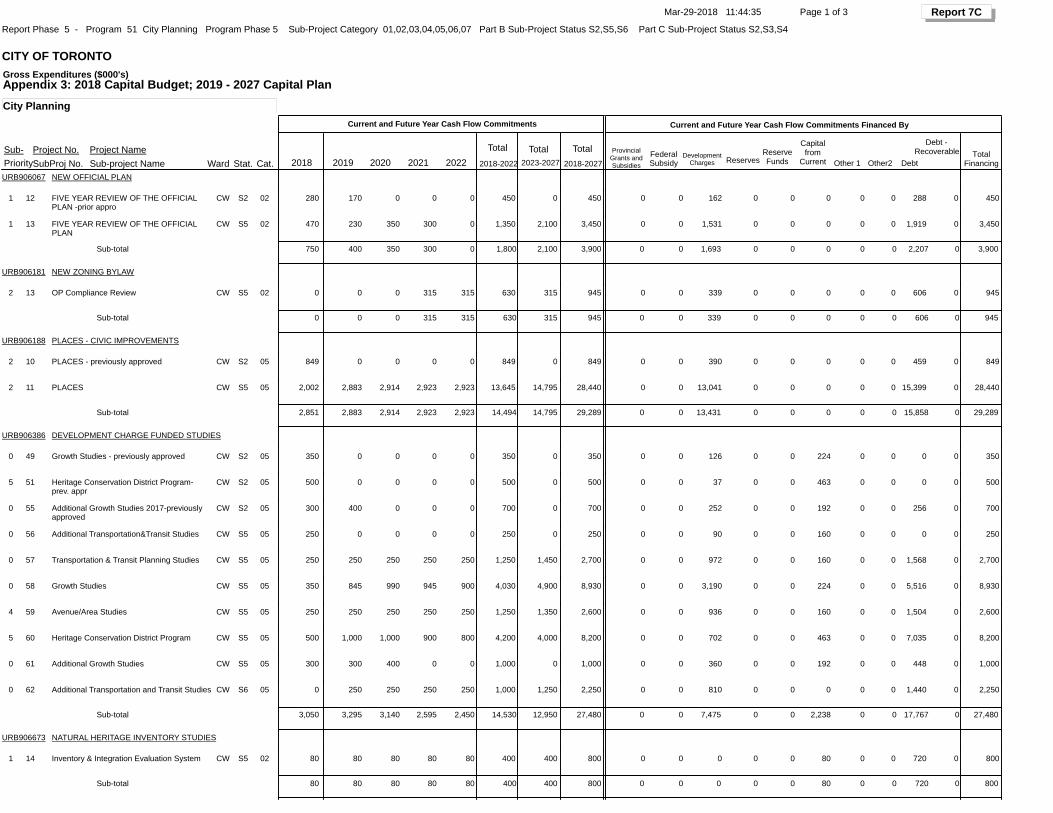
Mar-29-2018 11:44:35 Page 1 of 3 Report 7C
Debt -Recoverable
ReservesReserveFunds
Capitalfrom
Current Other 1 Other2 DebtTotal
Financing Sub- Project No. Project NamePrioritySubProj No. Sub-project Name
City Planning
Report Phase 5 - Program 51 City Planning Program Phase 5 Sub-Project Category 01,02,03,04,05,06,07 Part B Sub-Project Status S2,S5,S6 Part C Sub-Project Status S2,S3,S4
Appendix 3: 2018 Capital Budget; 2019 - 2027 Capital Plan
Ward Stat. Cat.
Current and Future Year Cash Flow Commitments Financed By
Total Total Total2018-2022 2023-2027 2018-20272019 2020 2021 2022
Current and Future Year Cash Flow Commitments
ProvincialGrants andSubsidies
DevelopmentCharges
FederalSubsidy2018
Gross Expenditures ($000's)
CITY OF TORONTO
URB906067 NEW OFFICIAL PLAN
1 12 FIVE YEAR REVIEW OF THE OFFICIAL PLAN -prior appro
162 0 0 0 0 0 288 450002S2CW 280 170 0 0 0 450 0 450 0 0
1 13 FIVE YEAR REVIEW OF THE OFFICIAL PLAN
1,531 0 0 0 0 0 1,919 3,450002S5CW 470 230 350 300 0 1,350 2,100 3,450 0 0
Sub-total 0 0 0 0 0 2,207 3,9000750 400 350 300 0 1,800 2,100 3,900 0 1,6930
URB906181 NEW ZONING BYLAW
2 13 OP Compliance Review 339 0 0 0 0 0 606 945002S5CW 0 0 0 315 315 630 315 945 0 0
Sub-total 0 0 0 0 0 606 94500 0 0 315 315 630 315 945 0 3390
URB906188 PLACES - CIVIC IMPROVEMENTS
2 10 PLACES - previously approved 390 0 0 0 0 0 459 849005S2CW 849 0 0 0 0 849 0 849 0 0
2 11 PLACES 13,041 0 0 0 0 0 15,399 28,440005S5CW 2,002 2,883 2,914 2,923 2,923 13,645 14,795 28,440 0 0
Sub-total 0 0 0 0 0 15,858 29,28902,851 2,883 2,914 2,923 2,923 14,494 14,795 29,289 0 13,4310
URB906386 DEVELOPMENT CHARGE FUNDED STUDIES
0 49 Growth Studies - previously approved 126 0 0 224 0 0 0 350005S2CW 350 0 0 0 0 350 0 350 0 0
5 51 Heritage Conservation District Program- prev. appr
37 0 0 463 0 0 0 500005S2CW 500 0 0 0 0 500 0 500 0 0
0 55 Additional Growth Studies 2017-previously approved
252 0 0 192 0 0 256 700005S2CW 300 400 0 0 0 700 0 700 0 0
0 56 Additional Transportation&Transit Studies 90 0 0 160 0 0 0 250005S5CW 250 0 0 0 0 250 0 250 0 0
0 57 Transportation & Transit Planning Studies 972 0 0 160 0 0 1,568 2,700005S5CW 250 250 250 250 250 1,250 1,450 2,700 0 0
0 58 Growth Studies 3,190 0 0 224 0 0 5,516 8,930005S5CW 350 845 990 945 900 4,030 4,900 8,930 0 0
4 59 Avenue/Area Studies 936 0 0 160 0 0 1,504 2,600005S5CW 250 250 250 250 250 1,250 1,350 2,600 0 0
5 60 Heritage Conservation District Program 702 0 0 463 0 0 7,035 8,200005S5CW 500 1,000 1,000 900 800 4,200 4,000 8,200 0 0
0 61 Additional Growth Studies 360 0 0 192 0 0 448 1,000005S5CW 300 300 400 0 0 1,000 0 1,000 0 0
0 62 Additional Transportation and Transit Studies 810 0 0 0 0 0 1,440 2,250005S6CW 0 250 250 250 250 1,000 1,250 2,250 0 0
Sub-total 0 0 2,238 0 0 17,767 27,48003,050 3,295 3,140 2,595 2,450 14,530 12,950 27,480 0 7,4750
URB906673 NATURAL HERITAGE INVENTORY STUDIES
1 14 Inventory & Integration Evaluation System 0 0 0 80 0 0 720 800002S5CW 80 80 80 80 80 400 400 800 0 0
Sub-total 0 0 80 0 0 720 800080 80 80 80 80 400 400 800 0 00
Mar-29-2018 11:44:35 Page 2 of 3 Report 7C
Debt -Recoverable
ReservesReserveFunds
Capitalfrom
Current Other 1 Other2 DebtTotal
Financing Sub- Project No. Project NamePrioritySubProj No. Sub-project Name
City Planning
Report Phase 5 - Program 51 City Planning Program Phase 5 Sub-Project Category 01,02,03,04,05,06,07 Part B Sub-Project Status S2,S5,S6 Part C Sub-Project Status S2,S3,S4
Appendix 3: 2018 Capital Budget; 2019 - 2027 Capital Plan
Ward Stat. Cat.
Current and Future Year Cash Flow Commitments Financed By
Total Total Total2018-2022 2023-2027 2018-20272019 2020 2021 2022
Current and Future Year Cash Flow Commitments
ProvincialGrants andSubsidies
DevelopmentCharges
FederalSubsidy2018
Gross Expenditures ($000's)
CITY OF TORONTO
URB906901 TORONTO ARCHAEOLOGICAL RESOURCES P
1 12 Implementation 0 0 0 0 0 0 500 500002S5CW 50 50 50 50 50 250 250 500 0 0
Sub-total 0 0 0 0 0 500 500050 50 50 50 50 250 250 500 0 00
Total Program Expenditure 22,938 0 0 2,318 0 0 37,658 62,91406,781 6,708 6,534 6,263 5,818 32,104 30,810 62,914 0 0
Mar-29-2018 11:44:35 Page 3 of 3 Report 7C
Ward Stat. Cat.
Debt -Recoverable
ReservesReserveFunds
Capitalfrom
Current Other 1 Other2 DebtTotal
Financing Sub- Project No. Project NamePriority SubProj No. Sub-project Name
Financed By:
Total Total Total2018-2022 2023-2027 2018-20272019 2020 2021 2022
Current and Future Year Cash Flow Commitments and Estimates
2018
Report Phase 5 - Program 51 City Planning Program Phase 5 Sub-Project Category 01,02,03,04,05,06,07 Part B Sub-Project Status S2,S5,S6 Part C Sub-Project Status S2,S3,S4
CITY OF TORONTOGross Expenditures ($000's)
Appendix 3: 2018 Capital Budget; 2019 - 2027 Capital PlanCity Planning
Current and Future Year Cash Flow Commitments and Estimates Financed By
ProvincialGrants andSubsidies
Federal DevelopmentSubsidy Charges
22,938 0 0 0 0 0 0 0 22,938Development Charges 2,392 2,432 2,341 2,441 2,137 11,743 11,195 22,938 0 0
0 0 0 2,318 0 0 0 0 2,318Capital from Current 2,318 0 0 0 0 2,318 0 2,318 0 0
0 0 0 0 0 0 37,658 0 37,658Debt 2,071 4,276 4,193 3,822 3,681 18,043 19,615 37,658 0 0
Total Program Financing 22,938 0 0 2,318 0 0 37,658 0 62,9146,781 6,708 6,534 6,263 5,818 32,104 30,810 62,914 0 0
Status Code DescriptionS2 S2 Prior Year (With 2018 and\or Future Year Cashflow)S3 S3 Prior Year - Change of Scope 2018 and\or Future Year Cost\Cashflow)S4 S4 New - Stand-Alone Project (Current Year Only)S5 S5 New (On-going or Phased Projects)S6 S6 New - Future Year (Commencing in 2019 & Beyond)
Category Code DescriptionHealth and Safety C0101Legislated C0202State of Good Repair C0303Service Improvement and Enhancement C0404Growth Related C0505Reserved Category 1 C0606Reserved Category 2 C0707

2018 Capital Budget City Planning
Appendix 4
2018 Cash Flow and Future Year Commitments
toronto.ca/budget2018 22
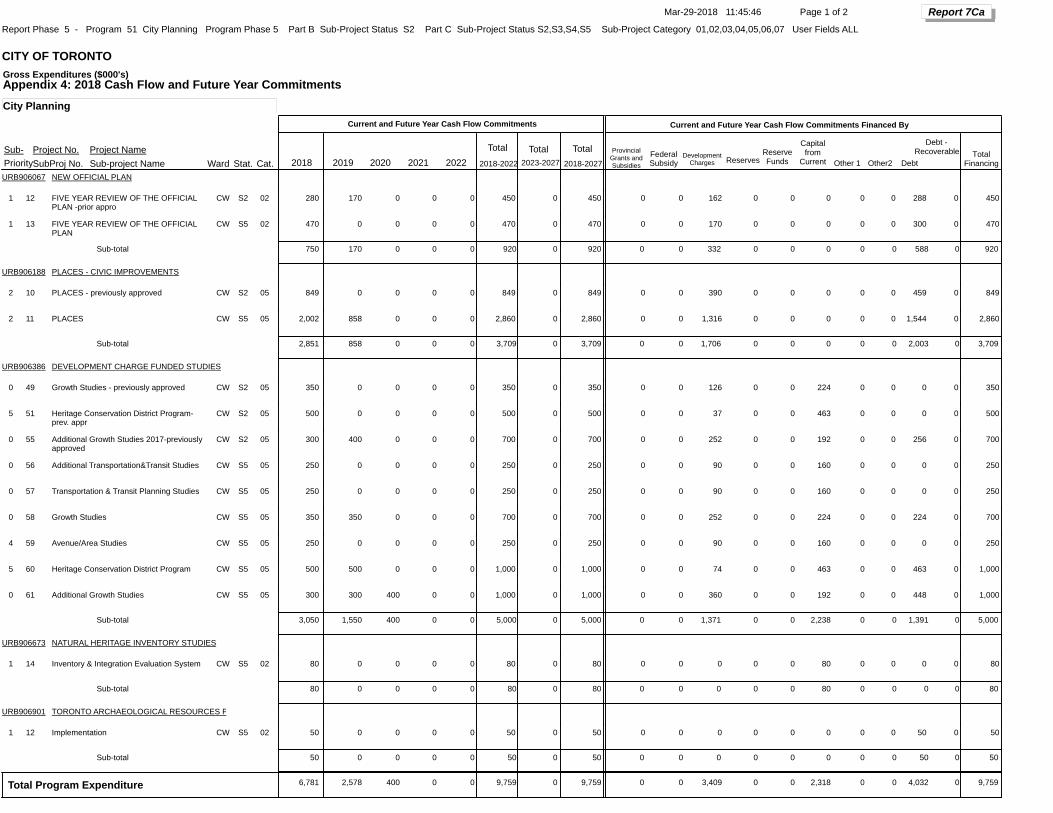
Mar-29-2018 11:45:46 Page 1 of 2 Report 7Ca
Debt -Recoverable
ReservesReserveFunds
Capitalfrom
Current Other 1 Other2 DebtTotal
Financing Sub- Project No. Project NamePrioritySubProj No. Sub-project Name
City Planning
Report Phase 5 - Program 51 City Planning Program Phase 5 Part B Sub-Project Status S2 Part C Sub-Project Status S2,S3,S4,S5 Sub-Project Category 01,02,03,04,05,06,07 User Fields ALL
Appendix 4: 2018 Cash Flow and Future Year Commitments
Ward Stat. Cat.
Current and Future Year Cash Flow Commitments Financed By
Total Total Total2018-2022 2023-2027 2018-20272019 2020 2021 2022
Current and Future Year Cash Flow Commitments
ProvincialGrants andSubsidies
DevelopmentCharges
FederalSubsidy2018
Gross Expenditures ($000's)
CITY OF TORONTO
URB906067 NEW OFFICIAL PLAN
1 12 FIVE YEAR REVIEW OF THE OFFICIAL PLAN -prior appro
162 0 0 0 0 0 288 450002S2CW 280 170 0 0 0 450 0 450 0 0
1 13 FIVE YEAR REVIEW OF THE OFFICIAL PLAN
170 0 0 0 0 0 300 470002S5CW 470 0 0 0 0 470 0 470 0 0
Sub-total 0 0 0 0 0 588 9200750 170 0 0 0 920 0 920 0 3320
URB906188 PLACES - CIVIC IMPROVEMENTS
2 10 PLACES - previously approved 390 0 0 0 0 0 459 849005S2CW 849 0 0 0 0 849 0 849 0 0
2 11 PLACES 1,316 0 0 0 0 0 1,544 2,860005S5CW 2,002 858 0 0 0 2,860 0 2,860 0 0
Sub-total 0 0 0 0 0 2,003 3,70902,851 858 0 0 0 3,709 0 3,709 0 1,7060
URB906386 DEVELOPMENT CHARGE FUNDED STUDIES
0 49 Growth Studies - previously approved 126 0 0 224 0 0 0 350005S2CW 350 0 0 0 0 350 0 350 0 0
5 51 Heritage Conservation District Program- prev. appr
37 0 0 463 0 0 0 500005S2CW 500 0 0 0 0 500 0 500 0 0
0 55 Additional Growth Studies 2017-previously approved
252 0 0 192 0 0 256 700005S2CW 300 400 0 0 0 700 0 700 0 0
0 56 Additional Transportation&Transit Studies 90 0 0 160 0 0 0 250005S5CW 250 0 0 0 0 250 0 250 0 0
0 57 Transportation & Transit Planning Studies 90 0 0 160 0 0 0 250005S5CW 250 0 0 0 0 250 0 250 0 0
0 58 Growth Studies 252 0 0 224 0 0 224 700005S5CW 350 350 0 0 0 700 0 700 0 0
4 59 Avenue/Area Studies 90 0 0 160 0 0 0 250005S5CW 250 0 0 0 0 250 0 250 0 0
5 60 Heritage Conservation District Program 74 0 0 463 0 0 463 1,000005S5CW 500 500 0 0 0 1,000 0 1,000 0 0
0 61 Additional Growth Studies 360 0 0 192 0 0 448 1,000005S5CW 300 300 400 0 0 1,000 0 1,000 0 0
Sub-total 0 0 2,238 0 0 1,391 5,00003,050 1,550 400 0 0 5,000 0 5,000 0 1,3710
URB906673 NATURAL HERITAGE INVENTORY STUDIES
1 14 Inventory & Integration Evaluation System 0 0 0 80 0 0 0 80002S5CW 80 0 0 0 0 80 0 80 0 0
Sub-total 0 0 80 0 0 0 80080 0 0 0 0 80 0 80 0 00
URB906901 TORONTO ARCHAEOLOGICAL RESOURCES P
1 12 Implementation 0 0 0 0 0 0 50 50002S5CW 50 0 0 0 0 50 0 50 0 0
Sub-total 0 0 0 0 0 50 50050 0 0 0 0 50 0 50 0 00
Total Program Expenditure 3,409 0 0 2,318 0 0 4,032 9,75906,781 2,578 400 0 0 9,759 0 9,759 0 0
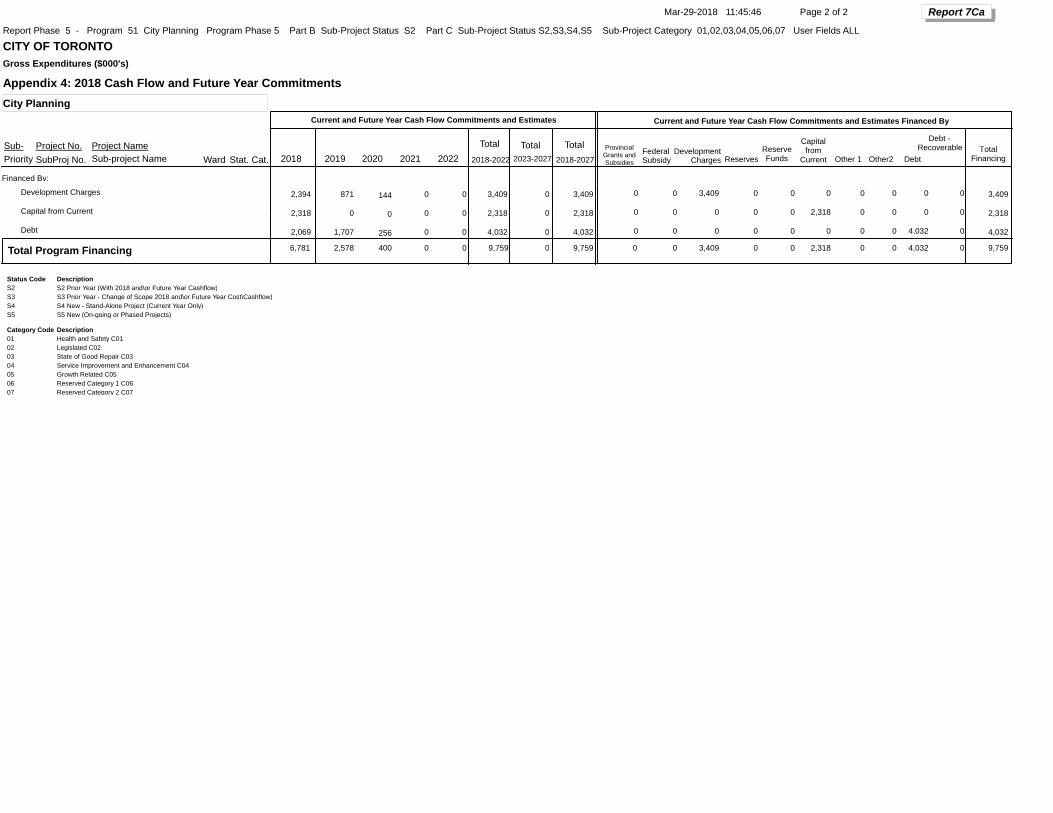
Mar-29-2018 11:45:46 Page 2 of 2 Report 7Ca
Ward Stat. Cat.
Debt -Recoverable
ReservesReserveFunds
Capitalfrom
Current Other 1 Other2 DebtTotal
Financing Sub- Project No. Project NamePriority SubProj No. Sub-project Name
Financed By:
Total Total Total2018-2022 2023-2027 2018-20272019 2020 2021 2022
Current and Future Year Cash Flow Commitments and Estimates
2018
Report Phase 5 - Program 51 City Planning Program Phase 5 Part B Sub-Project Status S2 Part C Sub-Project Status S2,S3,S4,S5 Sub-Project Category 01,02,03,04,05,06,07 User Fields ALL
CITY OF TORONTOGross Expenditures ($000's)
Appendix 4: 2018 Cash Flow and Future Year CommitmentsCity Planning
Current and Future Year Cash Flow Commitments and Estimates Financed By
ProvincialGrants andSubsidies
Federal DevelopmentSubsidy Charges
3,409 0 0 0 0 0 0 0 3,409Development Charges 2,394 871 144 0 0 3,409 0 3,409 0 0
0 0 0 2,318 0 0 0 0 2,318Capital from Current 2,318 0 0 0 0 2,318 0 2,318 0 0
0 0 0 0 0 0 4,032 0 4,032Debt 2,069 1,707 256 0 0 4,032 0 4,032 0 0
Total Program Financing 3,409 0 0 2,318 0 0 4,032 0 9,7596,781 2,578 400 0 0 9,759 0 9,759 0 0
Status Code DescriptionS2 S2 Prior Year (With 2018 and\or Future Year Cashflow)S3 S3 Prior Year - Change of Scope 2018 and\or Future Year Cost\Cashflow)S4 S4 New - Stand-Alone Project (Current Year Only)S5 S5 New (On-going or Phased Projects)
Category Code DescriptionHealth and Safety C0101Legislated C0202State of Good Repair C0303Service Improvement and Enhancement C0404Growth Related C0505Reserved Category 1 C0606Reserved Category 2 C0707
2018 Capital Budget City Planning
Appendix 5
2018 Capital Budget with Financing Detail
toronto.ca/budget2018 23
Page 1 of 1 Report P2-1A
Sub-Project Summary
Project/FinancingPriority Project Project Name
(Phase 5) 51-City Planning Sub-Project Category: 01,02,03,04,05,06,07 Type: B Sub-Project Status: S2 Type: C Sub-Project Status: S2,S3,S4,S5
Mar-29-2018 11:47:22
Appendix 5: 2018 Capital Budget with Financing Detail
2018 FinancingStart Date Developmt
ChargesReserves Other 1 Other 2Reserve
FundsCapitalFrom
Current
CompletionDate
Cash Flow FederalSubsidy
Provincial Grants
Subsidies
Debt - Recoverable
Debt
CITY OF TORONTO
City Planning
NEW OFFICIAL PLAN URB906067 0FIVE YEAR REVIEW OF THE OFFICIAL PLAN -prior appro1 12 01/01/201712/31/2019 280 0000010100 0179
FIVE YEAR REVIEW OF THE OFFICIAL PLAN1 13 01/01/201812/31/2027 470 0000017000 0300
Project Sub-total: 750 04790000027100
PLACES - CIVIC IMPROVEMENTS URB906188 0PLACES - previously approved2 10 01/01/201712/31/2018 849 0000039000 0459
PLACES2 11 01/01/201812/31/2027 2,002 0000092100 01,081
Project Sub-total: 2,851 01,540000001,31100
DEVELOPMENT CHARGE FUNDED STUDIES URB906386 0Growth Studies - previously approved0 49 01/01/201712/31/2018 350 002240012600 00
Additional Growth Studies 2017-previously approved0 55 01/01/201712/31/2018 300 001920010800 00
Additional Transportation&Transit Studies0 56 11/30/2016 12/31/2018 250 00160009000 00
Transportation & Transit Planning Studies0 57 01/01/201812/31/2027 250 00160009000 00
Growth Studies0 58 01/01/201812/31/2027 350 002240012600 00
Additional Growth Studies0 61 01/01/201712/31/2021 300 001920010800 00
Avenue/Area Studies4 59 01/01/201812/31/2027 250 00160009000 00
Heritage Conservation District Program- prev. appr5 51 01/01/201712/31/2018 500 00463003700 00
Heritage Conservation District Program5 60 01/01/201812/31/2027 500 00463003700 00
Project Sub-total: 3,050 00002,2380081200
NATURAL HERITAGE INVENTORY STUDIES URB906673 0Inventory & Integration Evaluation System1 14 01/01/201812/31/2027 80 008000000 00
Project Sub-total: 80 00008000000
TORONTO ARCHAEOLOGICAL RESOURCES PLAN PHASE II URB906901 0Implementation1 12 01/01/201812/31/2027 50 00000000 050
Project Sub-total: 50 05000000000
Program Total: 6,781 02,069002,318002,39400
Status Code DescriptionS2 S2 Prior Year (With 2018 and\or Future Year Cashflow)S3 S3 Prior Year - Change of Scope 2018 and\or Future Year Cost\Cashflow)S4 S4 New - Stand-Alone Project (Current Year Only)S5 S5 New (On-going or Phased Projects)
Category Code DescriptionHealth and Safety C0101Legislated C0202State of Good Repair C0303

Category Code DescriptionService Improvement and Enhancement C0404Growth Related C0505Reserved Category 1 C0606Reserved Category 2 C0707
2018 Capital Budget City Planning
Appendix 6
Reserve / Reserve Fund Review
Reserve / Reserve Fund – Program Specific ($000s)
2018Budget
2019Plan
2020Plan
2021Plan
2022Plan
2023Plan
2024Plan
2025Plan
2026Plan
2027Plan
2018 - 2027 Total
Contributions / (Withdrawals)
Beginning Balance 4,451 4,451 3,368 2,892 2,748 2,748 2,748 2,748 2,748 2,748 2,748 Withdrawals (-)Growth Related
Heritage Conservation District Studies (Prev. Approved) (37) (37) Heritage Conservation District Studies (37) (37) (74) Growth Studies (126) (126) (252) Additional Growth Studies (Prev. Approved) (108) (108) (144) (360) Growth Studies (Additional - Prev. Approved) (108) (144) (252) Growth Studies (Prev. Approved) (126) (126) Additional Transportation & Transit Studies (Prev. Approved) (90) (90) Transportation & Transit Planning Studies (90) (90) Avenue/Area Studies (90) (90)
LegislatedFive Year Review of the Official Plan (Prev. Approved) (101) (61) (162) Five Year Review of the Official Plan (170) (170)
Total Withdrawals (1,083) (476) (144) - - - - - - - (1,703) Contributions (+)Total Contributions - - - - - - - - - - -
4,451 3,368 2,892 2,748 2,748 2,748 2,748 2,748 2,748 2,748 2,748 (1,703) * Based on the 2017 Q3 Variance Report
2018Budget
2019Plan
2020Plan
2021Plan
2022Plan
2023Plan
2024Plan
2025Plan
2026Plan
2027Plan
2018 - 2027 Total
Contributions / (Withdrawals)
Beginning Balance 2,585 2,585 1,274 879 879 879 879 879 879 879 879 Withdrawals (-)
Places (Prev. Approved) (390) (390) Places (921) (395) (1,316)
Total Withdrawals (1,311) (395) - - - - - - - - (1,706) Contributions (+) - Total Contributions - - - - - - - - - - - -
2,585 1,274 879 879 879 879 879 879 879 879 879 (1,706) * Based on the 2017 Q3 Variance Report
2018Budget
2019Plan
2020Plan
2021Plan
2022Plan
2023Plan
2024Plan
2025Plan
2026Plan
2027Plan
2018 - 2027 Total
Contributions / (Withdrawals)
Beginning Balance 4,609 4,609 4,218 3,879 3,375 3,375 3,375 3,375 3,375 3,375 3,375 Withdrawals (-) (391) (339) (504) (1,234)
- Total Withdrawals (391) (339) (504) - - - - - - - (1,234) Contributions (+) - Total Contributions - - - - - - - - - - - -
4,609 4,218 3,879 3,375 3,375 3,375 3,375 3,375 3,375 3,375 3,375 (1,234) * Based on the 2017 Q3 Variance Report
Total Reserve Fund Balance at Year-End
Development Charge Reserves Fund - Developmental Studies (XR2120)
Reserve / Reserve Fund Name
Project / SubProject Name and Number
Projected Balance as at Dec 31,
2017 *
Contributions / (Withdrawals)
Contributions / (Withdrawals)
CP Development Technology Reserve Fund (XR1306)
Total Reserve Fund Balance at Year-End
Projected Balance as at Dec 31,
2017 *Development Charges Reserve Fund - Civic Improvements (XR2121)
Contributions / (Withdrawals)
Reserve / Reserve Fund Name
Project / SubProject Name and Number
Total Reserve Fund Balance at Year-End
Reserve / Reserve Fund Name
Project / SubProject Name and Number
Projected Balance as at Dec 31,
2017 *
toronto.ca/budget2018 24