Embed Size (px)
Citation preview
Capital Markets DayHydro AgriCapital Markets DayHydro Agri
Executive Vice President Thorleif EngerNorsk Hydro ASA
Oslo, 8 January 2002
Executive Vice President Thorleif EngerNorsk Hydro ASA
Oslo, 8 January 2002

33047_2 - 01.2002 - * 2 - Hydro Media
2
0
500
1000
1500
2000
2500
3000
Goal Oct.1999
Revised goalDec. 2000
Actual 3Q01*
Agri Turnaround goals exceeded
Cost reductions Demanning
2700 - 3000
1200
36132400 - 2700 2718
1350
‘000 NOK
* Total fixed cost reductions 2,226 MNOK compared with 1998 level
No. of people
0500
1000150020002500300035004000
Goal Oct.1999
Revised goalDec. 2000
Actual 3Q01

Agri Turnaround goals exceededSince 1999, our agri business has been through one of the toughest turna-rounds in our company's history, with a manning reduction of about 35%and a corresponding reduction in fixed costs. We announced in October 1999 our strategy for a turnaround program to becompleted in 2001. The first targets for manning and cost reductions areshown on this slide. A year later, we announced a further increase in perfor-mance improvements. Even though the goals have been increased severaltimes, we have outperformed even the high end of our most ambitioustargets.

33047_2 - 01.2002 - * 3 - Hydro Media
3Many closures and divestments ofnon-core businesses since 1999
● Plants■ Immingham fertilizer production■ Landskrona fertilizer production■ Montoir nitrate production■ Hurel Arc■ Socadour■ Socofer La Pallice■ Oberhausen■ Barletta■ Porsgrunn potassium nitrate production■ Glomfjord REO production■ Vlaardingen (to JV)
● Hydro Oleochemicals● Hydelko● Danish propane business● Swedish non-CO2 gas business● Hydroship Services● Hydro Shipping Agency Group
● Fertilizer marketing organizations■ Hungary■ Ukraine■ Bulgaria■ Slovakia■ Rumania■ Slovenia■ Croatia■ Latvia (51%)
● Czech non-fertilizer distributors● Polish non-fertilizer distributors● Agtec● Chafer Machinery● Noru Priroda mill● Burlington River Terminal (to JV)● Hydro Hagebruk (to JV)● Various ships
Many closures and divestments of non-core businesses since 1999There was a large over-capacity of nitrate fertilizers in Europe. Hydro initia-ted an industry restructuring by closing down 1 million tonnes of product.So far the total capacity reduction is around 3 million tonnes of product.Restructuring is also taking place in the NPK business where Hydro hasclosed half a million tonnes of capacity. Hydro has also closed or divestednon-core activities and activities below critical size. Our philosophy ofactive portfolio management is illustrated by our exit list which includesmore than 30 businesses and plants since 1999.

33047_2 - 01.2002 - * 4 - Hydro Media
4
Large productivity improvements
19941995
19961997
19981999
2000E2001
P20022,000
2,500
3,000
3,500
4,000
4,500
5,000
19941995
19961997
19981999
2000E2001
P2002150
200
250
300
Fixed costs per tonne*Production per employee
tonnes NOK
European plantsEuropean plants
* Excluding non-recurring items
Large productivity improvementsA steady rise in production per employee in Europe was further acceleratedby the Turnaround program. Fixed costs per tonne fertilizer have fallensignificantly since 1999. Our competitiveness has improved dramaticallyand further improvements are planned for 2002. The improved structure andquality of our production assets in Europe are now providing large contribu-tions to our improvement in overall profitability.
33047_2 - 01.2002 - * 5 - Hydro Media
5Seizing business opportunities at thebottom of the business cycleOwnership share in parenthesesOwnership share in parentheses
● Trevo, Brazil (91%)
● Kynoch, South Africa (100%)
● Philphos marketing agreement, Philippines (0%)
● SQM marketing agreement, Chile (0%)
● Qafco IV expansion and marketing agreement (25%)
An asset light strategy withMarketing share > Ownership share

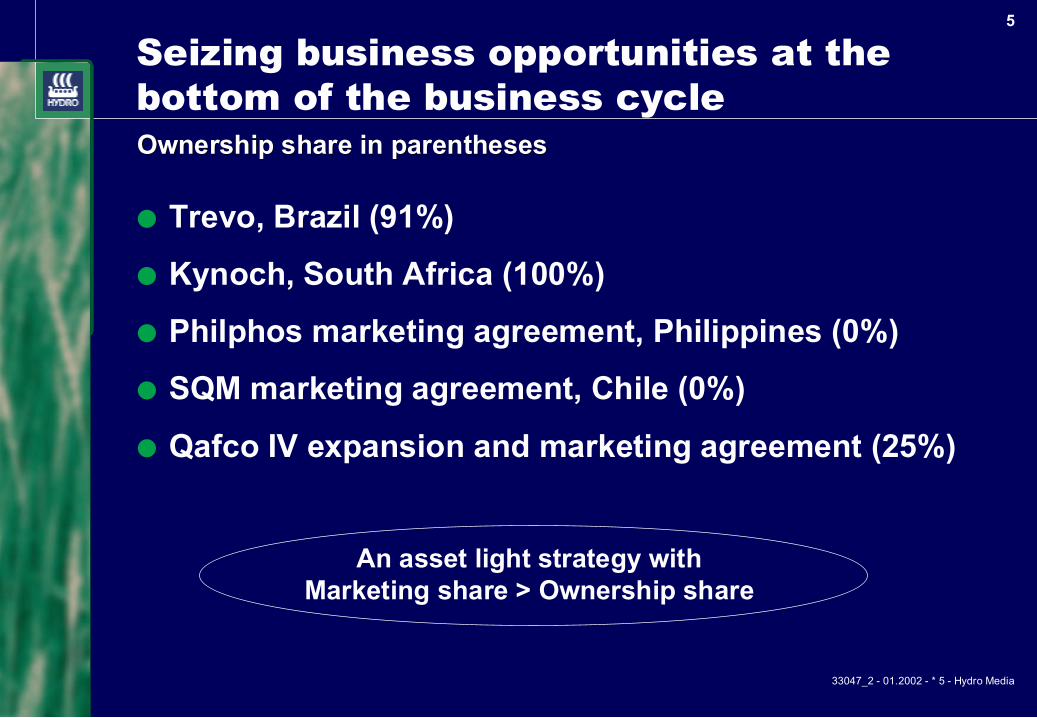
Seizing business opportunities at the bottom of the business cycleAt the bottom part of the business cycle, when businesses can be acquired atfavourable prices, we have also seized the opportunity for asset light growthfocused on high potential emerging markets. Whenever possible, we attemptto get a higher marketing share than our share of asset ownership, creatingopportunities for a stable cash flow with minimal cyclical swings. Oneexample is our 25% ownership in the world's largest and most cost-effectiveammonia and urea facility, where we have a marketing agreement forapproximately 50% (twice our ownership share).
33047_2 - 01.2002 - * 6 - Hydro Media
6Strong leadership andfocus on main value drivers
● Productivity■ Productivity improvements will be our trademark
● Portfolio■ We own assets by design, not by default
● Growth■ Asset light strategy with focus on supply/demand balance
Strong leadership and focus on main value driversAs already illustrated, Hydro Agri creates value by focusing on three mainvalue drivers: Continuous productivity improvement, active portfoliomanagement and asset light growth. We have ambitious growth targets butfocus on asset light opportunities when we are able to acquire less than100% of an asset and still achieve our cash flow targets.
33047_2 - 01.2002 - * 7 - Hydro Media
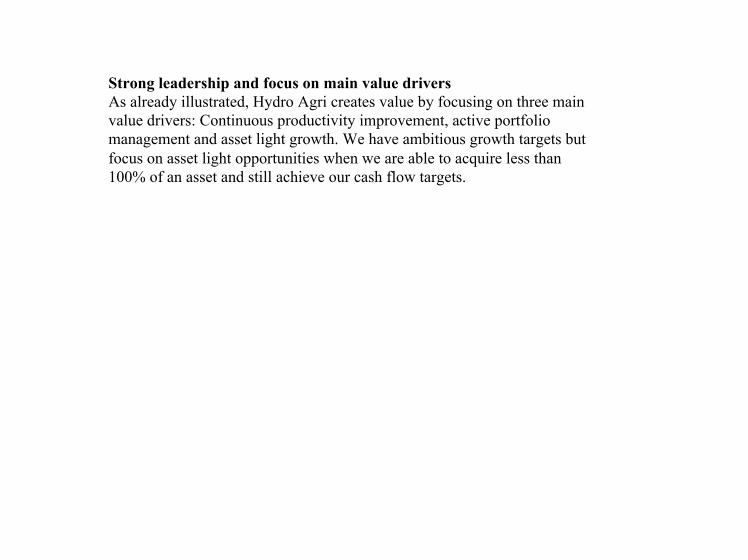
7Shareholder value - the best fertilizerperformers have done wellAverage annual Total Shareholder Return* across the businessAverage annual Total Shareholder Return* across the businesscycle (1991-2000)cycle (1991-2000)
3.3
3.9
11.5
12.5
17.8
23.4
0 5 10 15 20 25
Kemira**
Kali & Salz
DuPont
Dow Chemicals
Agrium**
PCS
* TSR = Share price appreciation + dividends to shareholders** Agrium from merger in 1993 to 2000, Kemira from IPO in 1994 to 2000 Source: BCG database
Annual TSR (%)

Shareholder value - the best fertilizer performers...The best fertilizer companies have delivered competitive shareholder returnsover time, well above some of the major chemical companies. Excellent performance over time is rewarded by the stock market. Themarket's current poor perception of the fertilizer industry in Europe is to alarge extent created by the past problems of the industry. The restructuringnow taking place will very much improve this situation. For Hydro Agri, ourEuropean business is currently showing attractive returns.

33047_2 - 01.2002 - * 8 - Hydro Media
8
Top quartile Hydro Agri performance in 2001Gross return on assets* Jan. - Sep. 2001Gross return on assets* Jan. - Sep. 2001
2.9
6.9
8.7
8.8
9.2
10.6
12.2
10.8
0 2 4 6 8 10 12 14
Dow Chemicals
IMC
PCS
Agrium
DuPont
Kemira
Hydro Agri
Kali & Salz
* Gross return on assets is similar to CROGI and defined as EBITDA divided by Total assets
Percent
Source: Company quarterly reports

Top quartile Hydro Agri performance in 2001In a very competitive industry, Hydro Agri has steadily been strengtheningits results since our Turnaround program started in 1999. In the first threequarters of 2001, we find ourselves in the top quartile of our peer group andwe have steady momentum towards even higher levels of performance.

33047_2 - 01.2002 - * 9 - Hydro Media
9
Fundamental forces drive growth
Source: IFA,Worldmarkets.com, PCS, Hydro
0
1
2
3
4
5
6
7
8
9
1950 1960 1970 1980 1990 2000 2010 2020
Fertilizer tonne
/hec
tare
Expected growth 2-3% per year
● World population growing
● Land availability limited
● Mineral fertilizer onlysustainable major sourceof nutrient
Nutrient Sources
Manure
Soil

Fundamental forces drive growthAlthough the annual industry growth is not very high, it has been remarkablystable over several decades. A rising world population, combined with adeclining amount of arable land per person requires more food productionfrom a limited land base. Increased use of fertilizers, particularly in develo-ping nations which face the largest population growth, will be critical toproduce the necessary amount of food.
33047_2 - 01.2002 - * 10 - Hydro Media
10
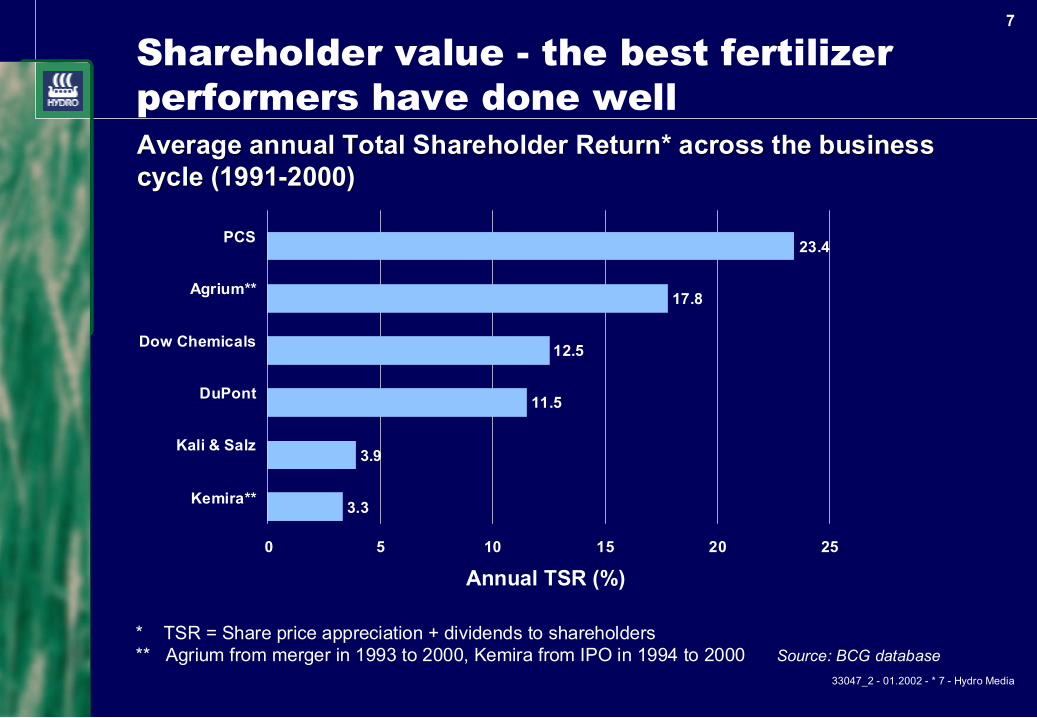
Our agri business is a uniquecombination of size and global presence
Source: Annual reports
0
5
10
15
20
25
Hydro
PCS
IMC
Agrium
Kali+S
alz
All fertilizer products
Mill.
tonn
es p
rodu
cts
sold
200
0
0
1
2
3
4
5
6
7
Firstquarter
Secondquarter
Thirdquarter
Fourthquarter
Hydro AgriNon-European sales reduce seasonality
Mill.
tonn
es fe
rtili
zer
produ
ct s
ales
200
0
Hydro Overseas Hydro Europe Overseas Home market
Europe Other Northern hemisphere Southern hemisphere

Our agri business is a unique combination of size and global presenceHydro is number one in fertilizer sales compared with other fertilizercompanies. Almost half of our sales take place outside of our home marketEurope. This puts Hydro in a unique position in the industry and make ourprofits less exposed to seasonality and problems in one specific geographicalregion. This becomes even more pronounced as Europe's importance gradu-ally diminishes.
33047_2 - 01.2002 - * 11 - Hydro Media
11
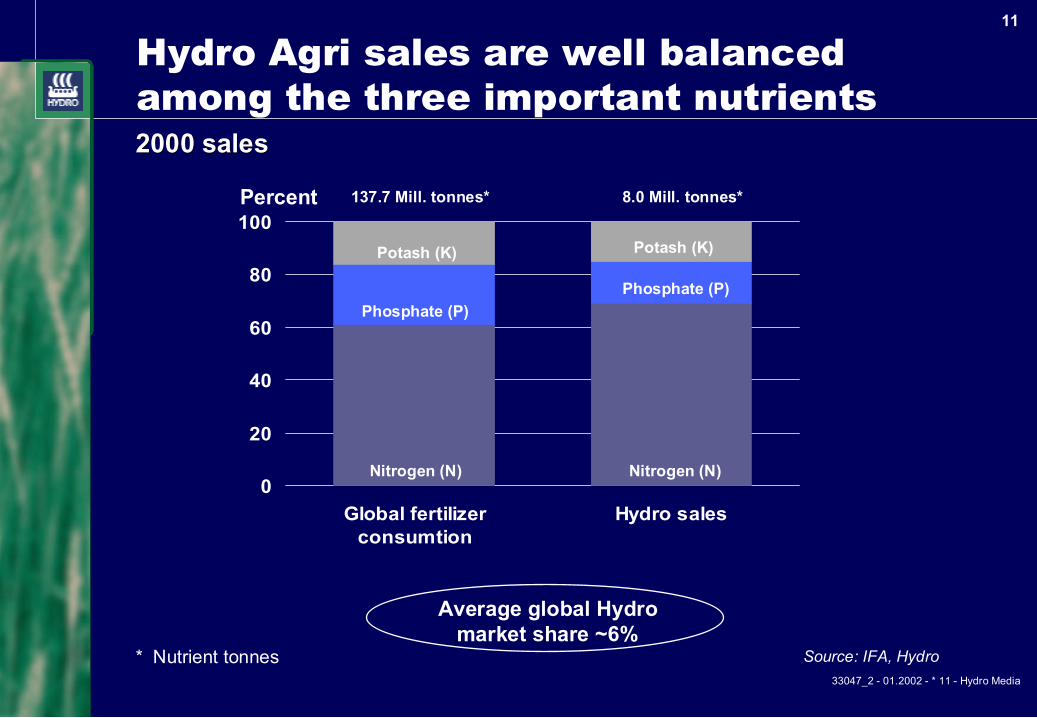
Hydro Agri sales are well balancedamong the three important nutrients
0
20
40
60
80
100
Global fertilizerconsumtion
Hydro sales
2000 sales2000 sales
137.7 Mill. tonnes*
Nitrogen (N)
Phosphate (P)
Potash (K)
8.0 Mill. tonnes*
Nitrogen (N)
Phosphate (P)
Potash (K)
Source: IFA, Hydro* Nutrient tonnes
Average global Hydromarket share ~6%
Percent
Hydro Agri sales are well balanced among the three importantnutrientsCompared with the global fertilizer consumption, Hydro's sales are wellbalanced between the three primary nutrients. As nitrogen is the most impor-tant and hence the largest plant nutrient in terms of consumption, our salesalso have a higher share of nitrogen than the other nutrients. Our compre-hensive product portfolio enable us to fully satisfy the needs of farmers anddistributors.

33047_2 - 01.2002 - * 12 - Hydro Media
12
Sourcing strategy for overseas growth
0
5
10
15
20
25
1991 1993 1995 1997 1999 2001E
Third party/JV products
Hydro produced products
Mill.
tonn
es
Third party sourcing increasing
0
2
4
6
8
10
12
14
1991 1993 1995 1997 1999 2001E
Mill.
tonn
es
Overseas volume increasing,Europe stagnating
Europe
Overseas

Sourcing strategy for overseas growthWhile fertilizer consumption in Europe is stagnating, many overseasmarkets continue their strong growth. This is reflected in our sales profile(left graph). In 2001, our sales in Europe were affected by a significantreduction in fertilizer consumptions caused by exceptionally bad weather inspring.Hydro's increasing share of third party products and products from produc-tion and marketing joint ventures give us increased sales and cash flowswithout the exposure created from owning large fixed assets.
33047_2 - 01.2002 - * 13 - Hydro Media
13
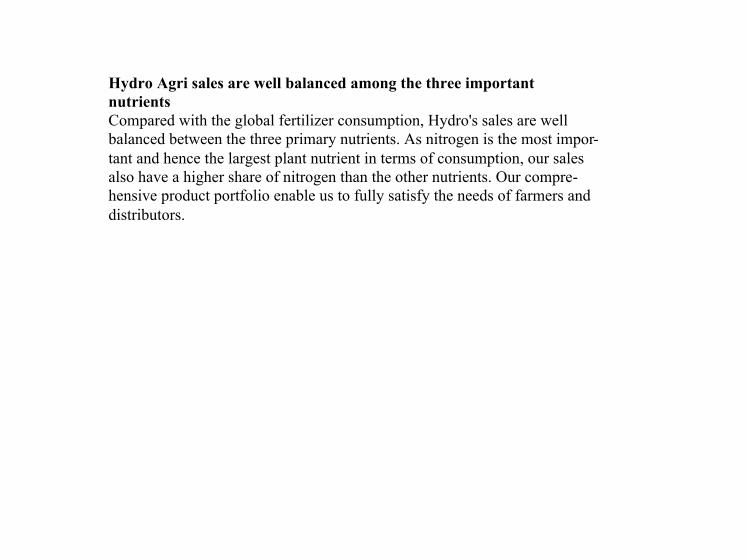
Strong leverage based on purchasing power
9.7
9.2
6.5
4.0
7.4
0.0 2.0 4.0 6.0 8.0 10.0 12.0
Brazil
China
France
India
Hydro Agri
Mill. tonnes fertilizer
* Products included are Urea, AN, CAN, AS, DAP, MAP, TSP, MOP, SOP Source: IFA
HydroHydro Agri's fertilizer Agri's fertilizer purchasing is similar to the entire imports of purchasing is similar to the entire imports oflarge countrieslarge countries

Strong leverage based on purchasing powerOur extensive sourcing from other producers gives us a purchasing powerwhich ensures that Hydro gets the best fertilizer prices. This makes it lessimportant whether we produce basic fertilizer products ourselves or sourcethem from others. Many of our fertilizer suppliers also provide raw materialsfor our own fertilizer production. This adds to our procurement leverage andeconomies of scale.
33047_2 - 01.2002 - * 14 - Hydro Media
14
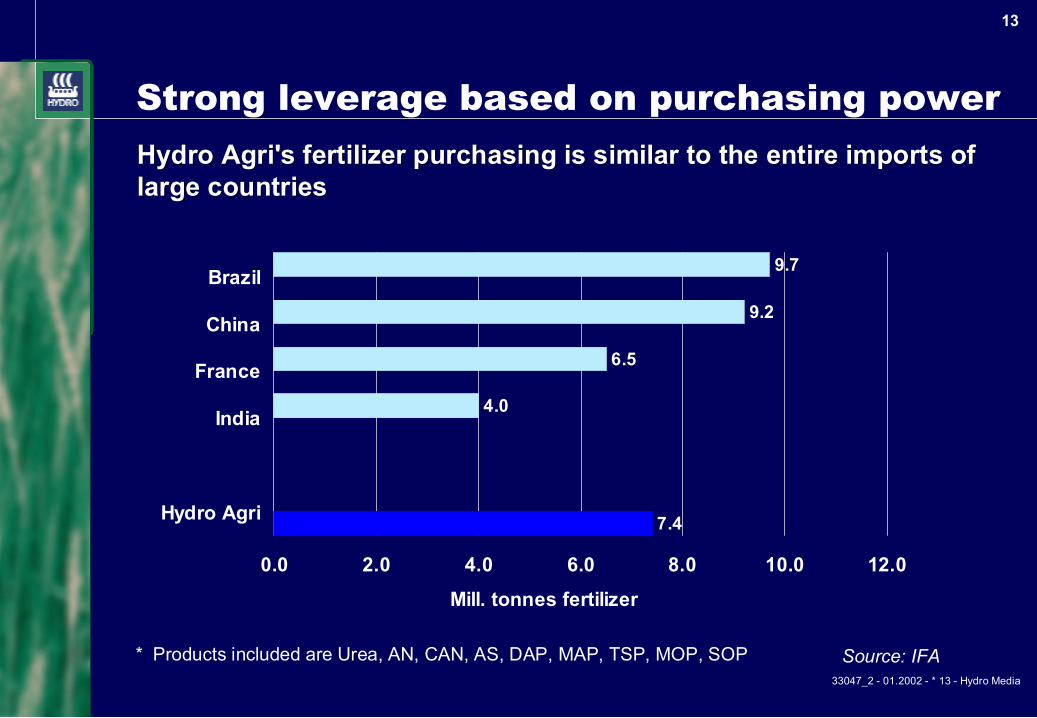
Hydro Agri, the global leader in
● Ammonia - the basis for all nitrogen fertilizer
● Nitrates - the most important fertilizer in Europe
● Balanced fertilization (NPK) - serving value-addedsegments
● Speciality fertilizers - serving high margin cash cropmarkets
● Industrial applications - mainly in Europe
● Global marketing network - local activities in morethan 60 countries on all continents

Hydro Agri, the global leader in* Hydro has the highest market share in traded (non-captive) ammonia
which is used to make nitrogen fertilizers.* Hydro has the highest market share in nitrates, the most important type of
fertilizer in Europe.* Hydro's cash costs in NPK production are lower than for other producers
using a different production process. NPK is the fastest growing volume fertilizer product category.
* Hydro has the world's largest sales of speciality fertilizers. While own produced Calcium Nitrate (CN) form the basis, the alliance with Chilean SQM, the leading player in Potassium Nitrate (PN), has created a unique business concept which is hard to copy by any other fertilizer company.
* In the European CO2 market, Hydro is the leading supplier with a marketshare of around 30%, approximately twice that of the nearest competitor. Hydro also has dominant positions in other industrial gases and technical ammonium nitrate in Europe.
* Hydro has a global market share of about 6% which is twice the size of the next largest companies, PCS, IMC and Agrium.

33047_2 - 01.2002 - * 15 - Hydro Media
15
Hydro is the leading ammonia player
3.8
5.2 4.5
1.50.5
0123456
Hydro* Agrium PCS Kali+Salz IMC
Mill. tonnesProduction capacity
0.71.5
0.65
3.8
0
1.6
0
1
2
3
4
5
Hydro PCS Agrium IMC Trammo Mitsui
Mill. tonnesTrade
Source: Company info, Blue-Johnson, British Sulphur, Hydro,
35
159 140
51
0
95
54
0255075
100125150175
Hydro
PCS
Agrium IMC
Nitrochem
Mitsui
Trammo
Shipping capacity
458
204215
44
168
0
100
200
300
400
500
Hydro Agrium PCS IMC Kali+Salz
Maritime storage capacity
* Incl. Hydro share of JVs
‘000 mts ‘000 mts

Hydro is the leading ammonia playerOn all relevant parameters, Hydro is the largest ammonia player, includingwhen looking beyond the traditional fertilizer industry. This is important dueto ammonia's critical role as raw material for fertilizer production. Further-more, having extensive production, shipping and logistical networks enableHydro to compete for contracts few others are able to compete for.

33047_2 - 01.2002 - * 16 - Hydro Media
16
Hydro is the leader in nitrate production
84
100
0
20
40
60
80
100
120
Hydro Europeanindustry excl.
Hydro
Source: Nitrex-Complex, EFMA
00.4
1.4
4.6
0.6
0
1
2
3
4
5
Hydro
Kali+S
alz
Agrium
PCS
IMC
Mill. tonnes nitrate
Total production capacity 2000 Average production cost 2000
Indexed costper tonne

Hydro is the leader in nitrate productionIn nitrates, the most important fertilizer in Europe, Hydro is the largest andmost cost effective producer. While the European nitrate industry sufferedunder structural over capacity until 1999/2000, industry closures of 3 milliontonnes, to which Hydro contributed 1 million tonnes, have created a bettersupply/demand balance. Capacity utilization is now approaching attractivelevels.

33047_2 - 01.2002 - * 17 - Hydro Media
17
Leading market positionin speciality fertilizers
88
12
0
20
40
60
80
100
Hydro Others
41
18
41
0
10
20
30
40
50
SQM/Hydro
Haifa Others
Market share (%)
Calcium Nitrate (CN) Potassium Nitrate (PN)
Market share (%)
Calcium Nitrate and Potassium Nitrate constituteapproximately 65% of total speciality fertilizer market

Leading market position in speciality fertilizersThere is high potential for value creation in speciality products for highvalue cash crops. Hydro has strong market positions in the two main fertili-zers, Calcium Nitrate and Potassium Nitrate, which together constitute thebulk of the speciality fertilizer market. Hydro's unique nitrophosphateproduction technology has given us a superior position for Calcium Nitrate,and our recent global marketing agreement with the Chilean fertilizercompany SQM has also given us a strong position in the other main product,Potassium Nitrate. In total, this enables Hydro to supply our customers withan attractive product mix at favourable prices.

33047_2 - 01.2002 - * 18 - Hydro Media
18
Strong position in selectedindustrial applications
● Leading supplier of CO2 in Europe
● Strong position in the high growth segment forenvironmental products
● Leading supplier of technical ammonium nitrate tothe civil explosives industry
● Strong financial performance over time

Strong position in selected industrial applicationsHydro Agri's Gas and Chemicals business is a successful niche player andhas enjoyed stable and good profitability and healthy growth over a numberof years. In addition to being the leading supplier of CO2 and technicalnitrate products in Europe, Hydro also has a market share of around 20% inindustrial gases in Scandinavia and is seeing interesting growth for nitrogenchemicals in environmental markets.

33047_2 - 01.2002 - * 19 - Hydro Media
19
KFK:Step change in creating shareholder value
● KFK in an aggressive turnaround mode■ Large improvements being implemented in existing feed
and grain business■ New farm management strategy being rolled out, shifting
focus to higher margin segments
● Hydro's ownership position■ Strong support of new management and value creation
efforts■ Hydro's strategic link to KFK diminished■ Ownership will be reduced

KFKKFK has launched an ambitious turnaround program for their core activities.In addition, a new farm management strategy has been designed to providestep change in value creation and total shareholder returns. As KFK is nolonger a core business to Hydro, ownership will be reduced. Both for Hydroand KFK, it will be important to find new owners which can stronglysupport new opportunities for KFK.
33047_2 - 01.2002 - * 20 - Hydro Media
20
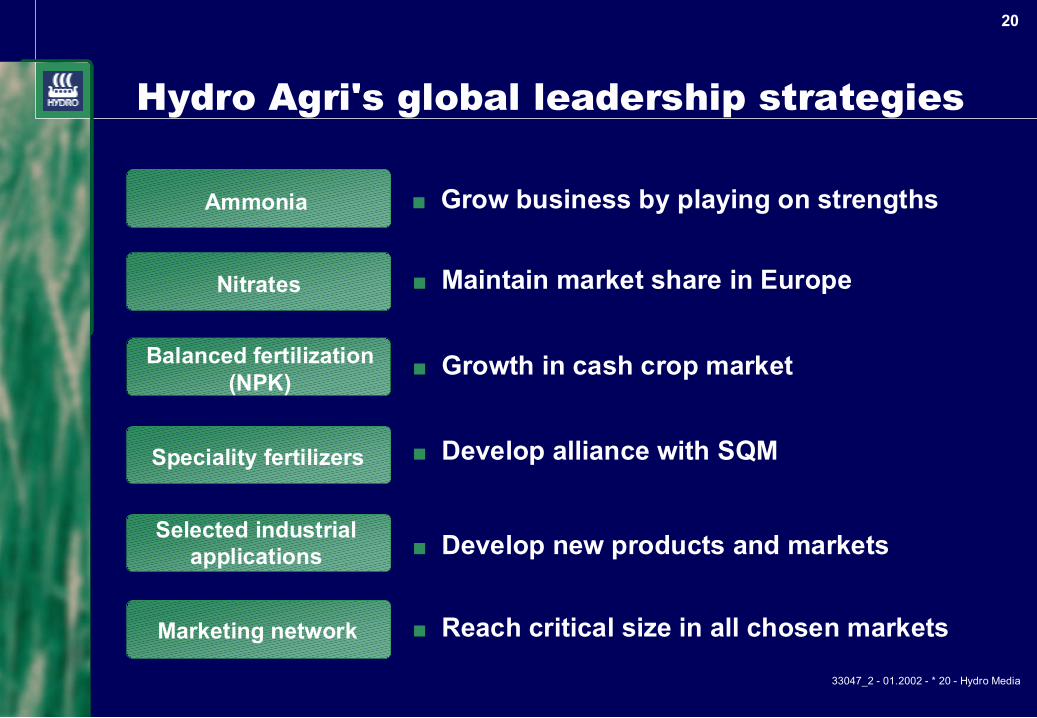
Hydro Agri's global leadership strategies
Ammonia ■ Grow business by playing on strengths
Nitrates
Balanced fertilization(NPK)
■ Growth in cash crop market
Speciality fertilizers ■ Develop alliance with SQM
Selected industrialapplications ■ Develop new products and markets
Marketing network
■ Maintain market share in Europe
■ Reach critical size in all chosen markets

Hydro Agri's global leadership strategiesWe will continue to develop each of our areas of strength and get fullleverage of our size wherever we are present. Still, we have a pragmaticattitude to our portfolio and we will continue to apply an up-or-out policy toassets which do not perform. We will also continue to search for new highpotential business opportunities. Our size and reach make Hydro Agri attrac-tive to players who want to exit the business or enter into alliances. This isbecoming an important competitive advantage in light of the ongoing indus-try consolidation.

33047_2 - 01.2002 - * 21 - Hydro Media
21
Ambitious financial targets
● Have an average profitability across the cycle which is■ higher than Hydro's general requirement of 10% CROGI■ in the best quartile of chemical industry peers■ leading among agri companies
● Pursue an asset light growth strategy
● Make good profits at bottom of business cycle
➨ Targeted annual EBITDA growth in 2002 and 2003: 10-15%➨ Minimum EBITDA at bottom of business cycle: 3 BNOK

Ambitious financial targetsDuring the past three years, Hydro Agri has demonstrated its ability toexecute a challenging turnaround with an impressive financial recovery,leading to top quartile industry performance. Going forward, Hydro Agriwill strengthen its leading position and continue to grow its cash flow. Thiswill be done through a combination of asset light growth, continued produc-tivity improvements and active portfolio management.
33047_2 - 01.2002 - * 22 - Hydro Media
22
Hydro Agri: Key messages
● Agri Turnaround targets exceeded
● Unique business model based on global strengths
● Strong platform for future value creation
● Good industry performers deliver competitiveshareholder returns

Hydro Agri: Key messagesWe have met our Turnaround targets and compare favourably with our peersin 2001 and we believe that we now have a strong platform for the future.We continue to have a strong belief in the fertilizer industry and believe thatHydro Agri will create considerable value for our shareholders. Our leaders-hip team and the competence and skills in our organisation are second tonone in our industry and we have confidence in our ability to create value inthe years ahead.
33047_2 - 01.2002 - * 23 - Hydro Media
23
APPENDIX
33047_2 - 01.2002 - * 24 - Hydro Media
24
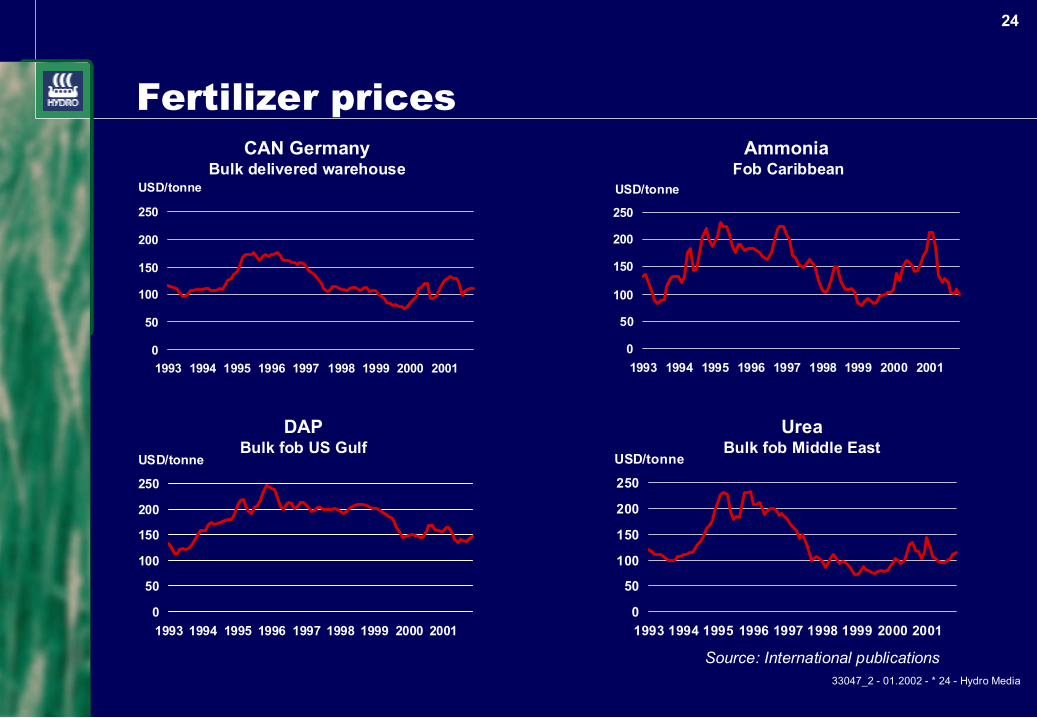
Fertilizer prices
Source: International publications
0
50
100
150
200
250
1993 1994 1995 1996 1997 1998 1999 2000 2001
USD/tonne
0
50
100
150
200
250
1993 1994 1995 1996 1997 1998 1999 2000 2001
USD/tonne
0
50
100
150
200
250
1993 1994 1995 1996 1997 1998 1999 2000 2001
USD/tonne
CAN GermanyBulk delivered warehouse
0
50
100
150
200
250
1993 1994 1995 1996 1997 1998 1999 2000 2001
USD/tonne
Ammonia Fob Caribbean
DAPBulk fob US Gulf
UreaBulk fob Middle East
33047_2 - 01.2002 - * 25 - Hydro Media
25
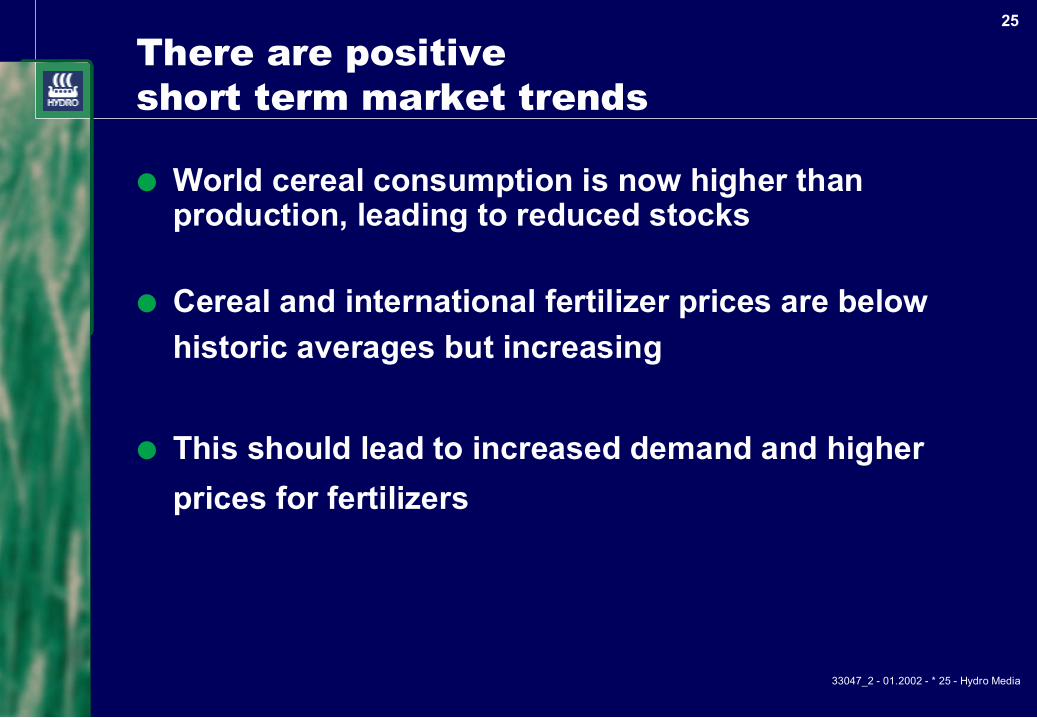
There are positiveshort term market trends
● World cereal consumption is now higher thanproduction, leading to reduced stocks
● Cereal and international fertilizer prices are belowhistoric averages but increasing
● This should lead to increased demand and higherprices for fertilizers

33047_2 - 01.2002 - * 26 - Hydro Media
26
Cereal consumption now higher than production,calling for increased fertilizer demand
Wheat
540
560
580
600
620
1996 1997 1998 1999 2000 2001
Stocks
050
100150200250300
1996 1997 1998 1999 2000 2001 2002
Rice
360370380390400410420
1996 1997 1998 1999 2000 2001
Maize
840860880900920940
1996 1997 1998 1999 2000 2001
Consumption
Consumption
Consumption
Production Production
Production
Maize
WheatRice
Source: FAO
Mill. tonnes Mill. tonnes
Mill. tonnes Mill. tonnes

33047_2 - 01.2002 - * 27 - Hydro Media
27
Grain prices correlate with fertilizer pricesand indicate price increase in next years
Source: Blue-Johnson, CBT
1980 1982 1984 1986 1988 1990 1992 1994 1996 1998 2000 2002E 2004E 0 1 2 3 4 5 6 USD/bushel grain
0 50
100
150
200
250
300
USD/tonne urea
Predicted urea price trend Corn Chicago cash Urea fob Middle East
33047_2 - 01.2002 - * 28 - Hydro Media
28
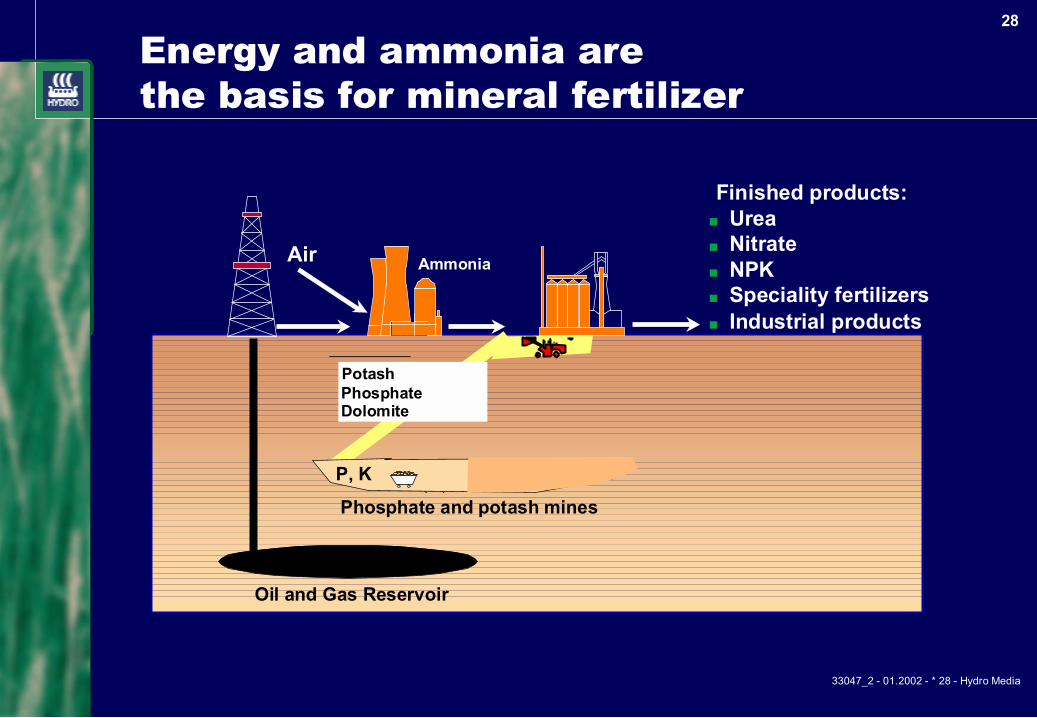
Energy and ammonia arethe basis for mineral fertilizer
Air Ammonia
Phosphate and potash mines
Oil and Gas Reservoir
P, K
Dolomite
PotashPhosphate
Finished products:■ Urea■ Nitrate■ NPK■ Speciality fertilizers■ Industrial products
33047_2 - 01.2002 - * 29 - Hydro Media
29
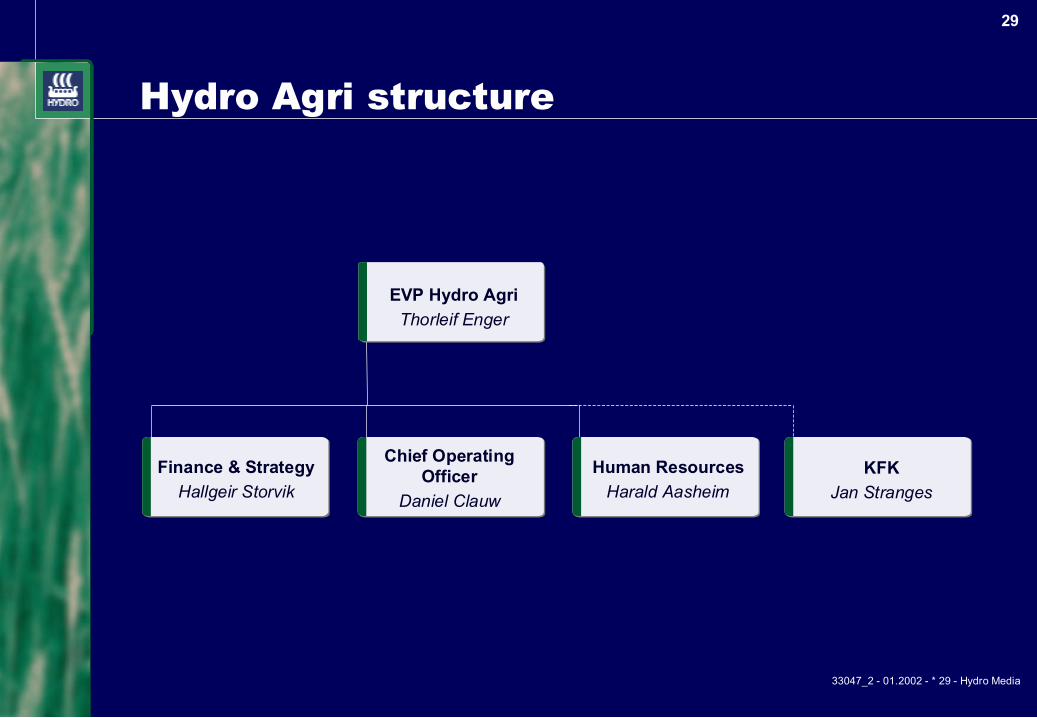
Hydro Agri structure
EVP Hydro AgriThorleif Enger
Finance & StrategyHallgeir Storvik
Chief OperatingOfficer
Daniel Clauw
Human ResourcesHarald Aasheim
KFKJan Stranges

33047_2 - 01.2002 - * 30 - Hydro Media
30
Safe harbour statement
In order to utilize the "Safe Harbor" provisions of the United States PrivateSecurities Litigation Reform Act of 1995, Hydro is providing the following cautionarystatement: This presentation contains certain forward-looking statements withrespect to the financial condition, results of operations and business of theCompany and certain of the plans and objectives of the Company with respect tothese items. By the nature, forward-looking statements involve risk and uncertaintybecause they relate to events and depend on circumstances that will occur in thefuture. The actual results and developments may differ materially from thoseexpressed or implied in the forward-looking statements due to any number ofdifferent factors. These factors include, but are not limited to, changes in costs andprices, changes in economic conditions, and changes in demand for the Company'sproducts. Additional information, including information on factors which may affectHydro's business, is contained in the Company's 2000 Annual Report on Form 20-Ffiled with the U.S. Securities and Exchange Commission.

Capital Markets DayCapital Markets DayHydro Oil & EnergyHydro Oil & Energy
Executive Vice President ToreExecutive Vice President Tore Torvund TorvundNorskNorsk Hydro ASA Hydro ASA
Oslo, January 8, 2002Oslo, January 8, 2002

33047_5 - 01.2002 - * 2 - Hydro Media
2
Hydro Oil and Energy
Competitive edge:
0
500
1000
1500
2000
Offshore Operatorproduction mill. barrels/day
Source: Oil & Gas Journal McKinsey
● Large operator
● Strong and innovativetechnology
● Commercial trackrecord
NorskHydro

33047_5 - 01.2002 - * 3 - Hydro Media
3
Objectives CMDDecember 2000
Production growth
International build up
Positioning for liberalisedEuropean gas market
Reduced F&D cost
SDFI positioning
* CAGR: Compound annual growth rate
Oil and Energy 2001 deliveryActions taken
● Snorre B, Girassol and Terra Nova● 2001 production in line with revised forecast● 5-6% CAGR* 2001 - 2005
● 30% awarded in Angolan block 34● Farm-in Gulf of Mexico and Angolan block 25
● Implementation of company based sales from NCS● Continued build up of commercial activities
● New projects confirm direction
● Application deadline 10. January

33047_5 - 01.2002 - * 4 - Hydro Media
4
Improving performance in 2001
● Maintain positive safety trend
● Maintain operating performance in first quartile
● Delivering projects on cost and schedule
● High-grading of global exploration portfolio
● Divestment of non-core licences
● Capital discipline

33047_5 - 01.2002 - * 5 - Hydro Media
5
Production 2001
● NCS oil production in linewith expectations
● Lower customer gas off-take
● Lower international oilproduction due to delayedstart up new fields
0
100
200
300
400
500
CMD Dec. 2000 2001E
1000 boe/day
OilNorwegian
Shelf
Gas
Oil int.
415435
33047_5 - 01.2002 - * 6 - Hydro Media
6
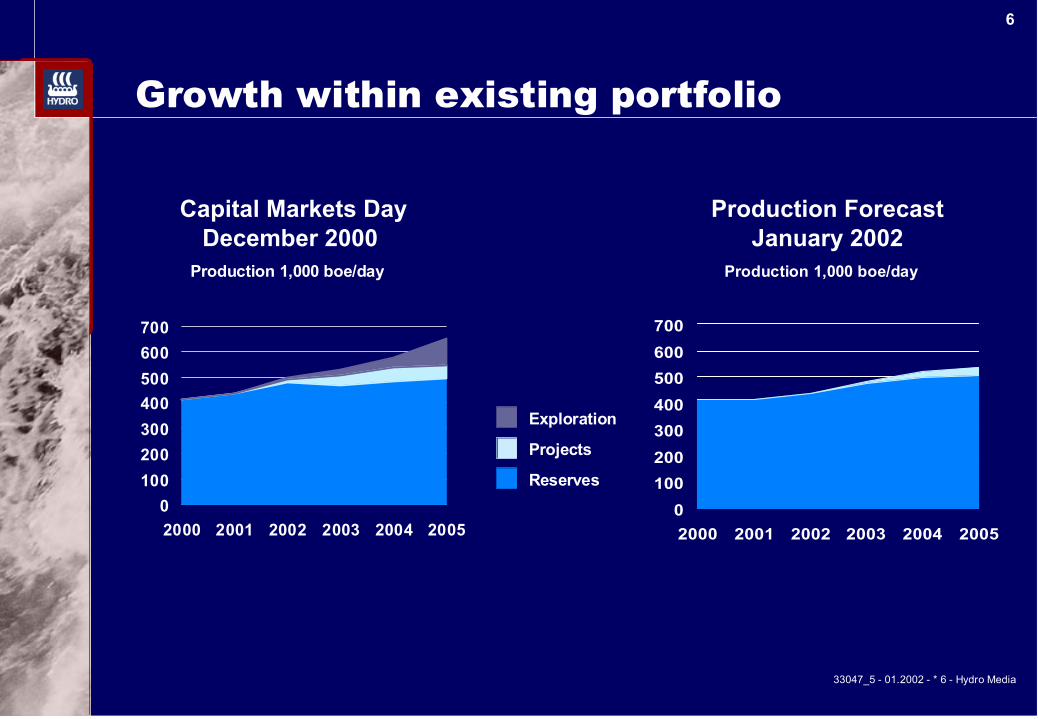
Growth within existing portfolio
Capital Markets DayDecember 2000
Production ForecastJanuary 2002
0100200300400500600700
2000 2001 2002 2003 2004 2005
Production 1,000 boe/day
0100200300400500600700
2000 2001 2002 2003 2004 2005
Production 1,000 boe/day
Exploration
Projects
Reserves

33047_5 - 01.2002 - * 7 - Hydro Media
7
New fields on stream 2002 - 2005N
CS
non
ope
rato
rIn
tern
atio
nal a
ctiv
ityN
CS
Ope
rato
r
Terra Nova 20,000 boe/day
Jasmin 5,000
Dalia 20,000
Rosa/Lirio 8,000
Kharyaga 2 9,000 (phase 1-2)
Tune 22,000
Grane 50,000
Vale 6,000
Fram Vest 15,000
Kvitebjørn 25,000
Mikkel 5,000
Kristin 27,000
DevelopmentPDO SubmittalPDO Approval/SanctioningStart Production2005
2005
2004
2005
1998 1999 2000 2001 2002 2003

33047_5 - 01.2002 - * 8 - Hydro Media
8
0
100
200
300
400
500
600
700
1998 1999 2000 2001E 2002E 2003E 2004E 2005E
Oil; Norway and Int. Oil Norway Oil Int. Gas
Strong production growth
1,000 boe/day
CAGR 2001-2005; 5-6%
NCS production cut first half 2002 included

33047_5 - 01.2002 - * 9 - Hydro Media
9Norsk Hydro —main events on NCS 2001
Hydro operated fields Partner-operated fields
Norne
Åsgard
Statfjord
Gullfaks
Frigg
Ekofisk
Yme
OsloOslo
NjordNjord
Snorre areaSnorre area
VisundVisund
Oseberg AreaOseberg Area
Ormen LangeOrmen Lange
HeimdalHeimdal
Troll ATroll A
Troll B,CTroll B,C
GraneGrane
VargVarg
BrageBrage
Stavanger
Sleipner
● Snorre B and Gullfaks satellitesin production
● Vesterled gas pipeline inoperation
● Snøhvit, Kristin and Mikkeldevelopment plans submitted
● Satellite discoveries aroundOseberg and Snorre
● Non core acreage sold
● SDFI: Hydro priority tostrengthen key operated fields

33047_5 - 01.2002 - * 10 - Hydro Media
10
International activities —2001 main events
Gulf of Mexico
RussiaKharyagaShtokman
Iran
East Coast Canada
T&TBlock 27 Angola
Libya:4 finds
33047_5 - 01.2002 - * 11 - Hydro Media
11
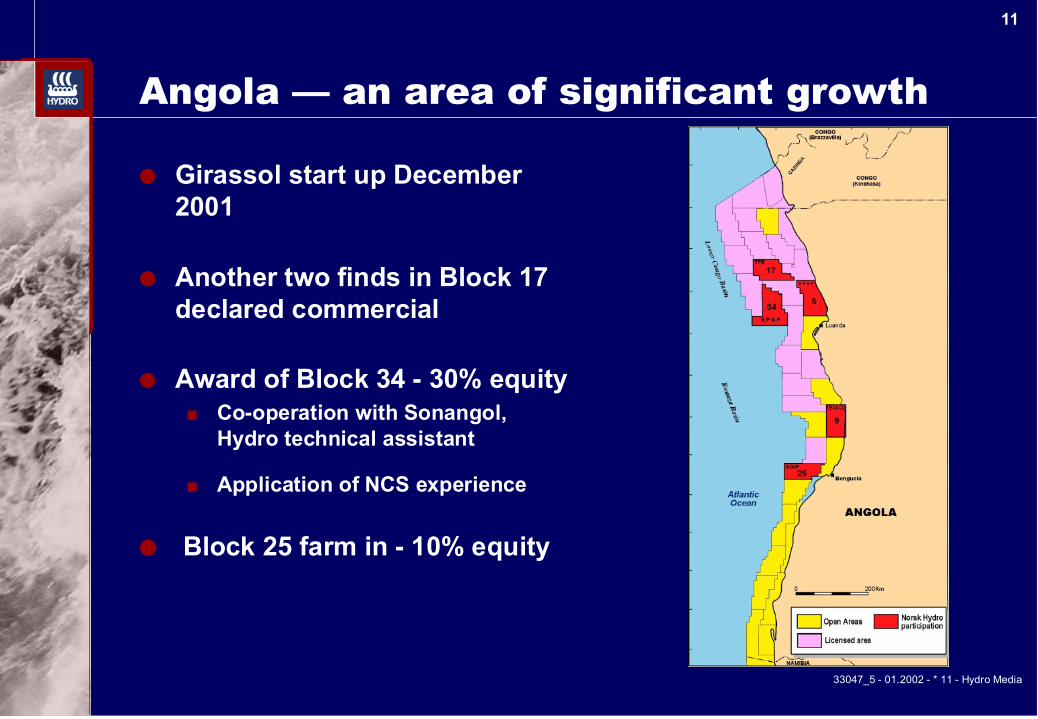
Angola — an area of significant growth
● Girassol start up December2001
● Another two finds in Block 17declared commercial
● Award of Block 34 - 30% equity■ Co-operation with Sonangol,
Hydro technical assistant
■ Application of NCS experience
● Block 25 farm in - 10% equity

33047_5 - 01.2002 - * 12 - Hydro Media
12
Canada — further developments
● Hibernia - stable production
● Terra Nova - on stream January 2002
● New find in Terra NovaFar East
● Hebron - on schedule forconcept selection 2002
● Successful deep wateracreage bid - Scotian Shelf

33047_5 - 01.2002 - * 13 - Hydro Media
13
US — Gulf of MexicoPotential new core area
Location of exploration
areas
● Comprehensive farm-in dealwith Conoco■ Hydro 25% working
interest in 55 leases
■ Option for participationin 178 leases through 2005
● Evaluation of further jointbusiness developmentactivities

33047_5 - 01.2002 - * 14 - Hydro Media
14
Iran — Anaran Exploration Contract
Exploration contract signed between NIOC and Hydro
April 9th 2000
●● Exploration Exploration areaarea ofof 3 260 km 3 260 km22
●● Mine clearance & seismic Mine clearance & seismic acquisition in 2001 and 2002 acquisition in 2001 and 2002
●● First well expected Q3 2002 First well expected Q3 2002
SE Musian30 Km
Anaran Anticline
Changulehl
SE ChangulehNW Dehluran
N Dehluran
Azar
Iraq
Iran
MusianDehluran
Abu Ghirab
LeadProspectOilfield
LEGEND
Ghare Bur

33047_5 - 01.2002 - * 15 - Hydro Media
15
2002 — shift in exploration focus
Exploration - 2002E
0
500
1000
1500
2000
Norway InternationalMNOK
2002E2001E20001999
Iran
Libya,Russia,Trinidad
& Tobago
GoM
Canada
Angola
Norway

33047_5 - 01.2002 - * 16 - Hydro Media
16
Exploration 2002 — significant wells
Well expec.finalised
3Q 2002
1Q 2002
3Q 2002
1Q 2002
2002
3Q 2002
3Q 2002
NCS Solsikke 50%
Canada - Anapolis 25%
Canada - Flemish pass 30%
Trinidad Tobago - Catfish 19%
Angola Block 34 30%
GoM - 3 wells 25%
Iran - Anaran 100%
Location Norsk Hydro share

33047_5 - 01.2002 - * 17 - Hydro Media
17
Third largest gas producer on the NCS
● Total Norwegian gas export2010 approx. 110 BCM
● Company based sales introduced
● Market development■ Continental market driven
by gas to power needs
■ UK - need for imports
■ New markets; Scandinavia and Poland
0
5
10
15
1998 2000 2002 2004 2006 2008 2010
Norsk Hydro expectednatural gas production
BCM

33047_5 - 01.2002 - * 18 - Hydro Media
18
Ormen Lange — the most important gasdiscovery since Troll
● Reserves: 400 bcm
● Hydro operator for the mostchallenging development on NCS
● Market gas at competitive costs;Target; 2 USD/mill. BTU
● Plan for development 4Q 2003
● Production start 2007

33047_5 - 01.2002 - * 19 - Hydro Media
19
Still large undiscovered gasresources on the Norwegian Shelf
● 17th round application deadline in March■ Focus on gas offshore mid-Norway
Oslo
Source: NPD, expected volume
Halten, Møre and VøringTotal of 2200 bill Sm3 gas
Undiscovered
In production/evalu.Discovered

33047_5 - 01.2002 - * 20 - Hydro Media
20
● Equity sales from NCS: 6 bcm 2002
● Marketing (mainly based on thirdparty sourcing): 9 bcm 2002
Flexibility gives value creation
Heimdal
Ekofisk
Sleipner
Gullfaks
Oseberg
Ormen Lange
SnorreStatfjord
Mongstad
OsloKårstø
Stavanger
StureKollsnesBergen
Cruden BaySt. Fergus
Teesside
Bacton
Dunkerque Zeebrugge
Salzwedel
Emden EtzelDornum
Sluiskil (Europe's largest gas consumer)
Troll

33047_5 - 01.2002 - * 21 - Hydro Media
21
Norsk Hydro has the ability tocommercialise gas in a liberalising market
Targeted Dutch end usersales in 2002:
■ 300 end-users
■ 4.7 bill. sm3(incl. portfoliomanagement)
■ Approx. 20% of Dutchindustrial market
Hydro Sluiskil - Europe’slargest consumer of natural gas
's Gravenvoeren
Zelzate
Emden
Maasvlakte
Balgzand
Hydro AgriSluiskil
Noordbroek

33047_5 - 01.2002 - * 22 - Hydro Media
22
0
1
2
3
4
5
6
7
8
9
10
1999 2000 2001E 2002
Internal consumpion External sales
● Norsk Hydro natural gas salesmainly based on third partysourcing
● Low capital requirement■ Trading■ Good margins: EBITDA of
100 MNOK 1- 3Q 2001■ Customers
■ Industrial customers■ Internal consumption
● Operations based in Brussels
BCM
Commercial innovation

33047_5 - 01.2002 - * 23 - Hydro Media
23
F&D costs tracking down towards target
F&D costs excl. sale & purchase
-50
0
50
100
150
200
1995 1996 1997 1998 1999 2000 2001E 2002 20030
2.5
5
7.5
10
12.5
15
17.5
20
Res. replacement F&D (3-year roll) F&D Target
Year
2001
2002
2003
Fields assumedbooked
Kristin, Mikkel,Sigyn, Rosa
Lirio, Jasmin
Snøhvit, Hebron,Murzuk A,
Mabruk East
Ormen Lange, Tyrihans,
Kharyaga ph. 3
Res
erve
Rep
lace
men
t (%
)
F&D
cos
ts (U
SD/b
oe)
33047_5 - 01.2002 - * 24 - Hydro Media
24
Key messages
● Production growth 2001 - 2005 expected toaverage 5 - 6%
● Key exploration prospects to be tested in 2002
● Using commercial innovation to add value toNorsk Hydro's upstream gas position
● F&D costs on track towards USD 5/bbl

33047_5 - 01.2002 - * 25 - Hydro Media
25
Safe harbour statement
In order to utilize the "Safe Harbor" provisions of the United States PrivateSecurities Litigation Reform Act of 1995, Hydro is providing the following cautionarystatement: This presentation contains certain forward-looking statements withrespect to the financial condition, results of operations and business of theCompany and certain of the plans and objectives of the Company with respect tothese items. By the nature, forward-looking statements involve risk and uncertaintybecause they relate to events and depend on circumstances that will occur in thefuture. The actual results and developments may differ materially from thoseexpressed or implied in the forward-looking statements due to any number ofdifferent factors. These factors include, but are not limited to, changes in costs andprices, changes in economic conditions, and changes in demand for the Company'sproducts. Additional information, including information on factors which may affectHydro's business, is contained in the Company's 2000 Annual Report on Form 20-Ffiled with the U.S. Securities and Exchange Commission.
Capital Markets DayHydro AluminiumCapital Markets DayHydro Aluminium
Executive Vice President Jon-Harald NilsenNorsk Hydro ASA
Oslo, January 8, 2002
Executive Vice President Jon-Harald NilsenNorsk Hydro ASA
Oslo, January 8, 2002

33047_4 - 01.2002 - * 2 - Hydro Media
2
What we said and what we have done
● Participate in industryrestructuring
● VAW -acquisition
● Technal Building Systems
● Magnesium restructuring
Objectives in Dec. 00 Actions taken in 2001
● Continue to leverage ourstrengths
● Continue top and bottomline growth
● Sunndal-expansion● Expansion Søral, Slovalco,
Alunorte● Remelters in Spain & Texas● Cost-reduction programmes
initiated

33047_4 - 01.2002 - * 3 - Hydro Media
3
Hydro’s stated ambition in Aluminium
A profitable positionA profitable positionamong the world’samong the world’stop three integratedtop three integrated
aluminiumaluminiumcompaniescompanies

33047_4 - 01.2002 - * 4 - Hydro Media
4
Metal 34%
Extrusion6%Rolled
products40%
Castings7%
Flexible pack. 13%
Euro/NOK: 8.00
Hydro Light Metals VAWGross revenues 6,400 mill Euro 3,700 mill EuroEBITDA 680 mill Euro 450 mill Euro
Hydro Light Metals and VAW (2000 - figures)
Metal 58%
Other10%
Extrusion27%
Rolled products
5%
Hydro Light Metals VAWEmployees total 17,000 16,000- in Germany 1,000 7,600- in Norway 6,300 0

33047_4 - 01.2002 - * 5 - Hydro Media
5The new entity: Hydro AluminiumPro Forma 2000 combined
Metal49%
Extrusion20%
Rolled products
18%
Other9%
Flexible pack.4%
Other2%
Asia/Pacific7%
North America16%
Germany21%
EU(ex. Germany)40%
Norway2%
Other Europe12%
HAL (Pro Forma)Gross revenues 9,700 mill EuroEBITDA 1,130 mill Euro
Combined sales Hydro Aluminium
Sum sector gross revenues Sum Business Area’s external sales

33047_4 - 01.2002 - * 6 - Hydro Media
6
Significant synergies and value creation
More value for customers
Innovative global force
Attractive financials
Rapid integration
Hydro — VAW: An attractive combination
33047_4 - 01.2002 - * 7 - Hydro Media
7
✔Norsk Hydro acquires all shares in VAW AG from E.ON
✔Total consideration is 2 645 mill Euro (21.2 bn NOK)1) including netinterest bearing debt of 757 mill Euro (6.1 bn NOK)
✔In addition Norsk Hydro takes over 450 mill. Euro (3.6 bn NOK)unfunded pension obligations
✔Expected closing by 1st Quarter 2002
✔Acquisition financed through cash and absorption of debt
✔Approved by Boards of Norsk Hydro and E.ON. Subject to regulatoryapprovals and approval by Norsk Hydro Corporate Assembly
Transaction highlights
1) All figures are estimates as per 1.1.2002 except where noted. Assumed exchange rate of 8.00 NOK/Euro
33047_4 - 01.2002 - * 8 - Hydro Media
8
Financial impact for Hydro Aluminium
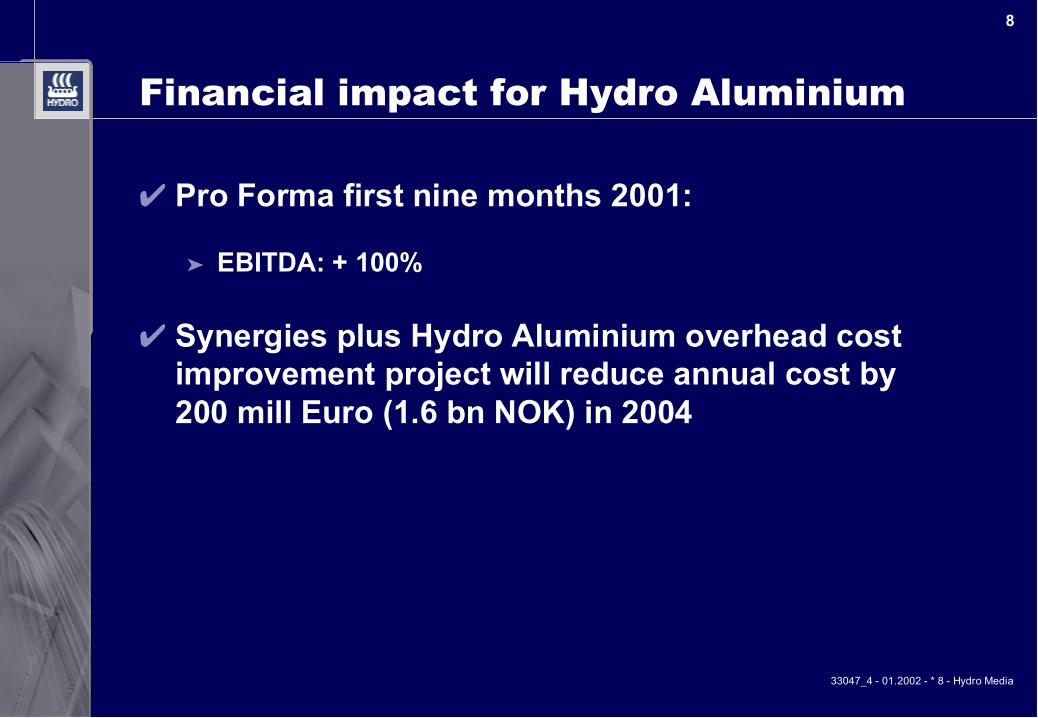
✔ Pro Forma first nine months 2001:
➤ EBITDA: + 100%
✔ Synergies plus Hydro Aluminium overhead costimprovement project will reduce annual cost by200 mill Euro (1.6 bn NOK) in 2004
33047_4 - 01.2002 - * 9 - Hydro Media
9
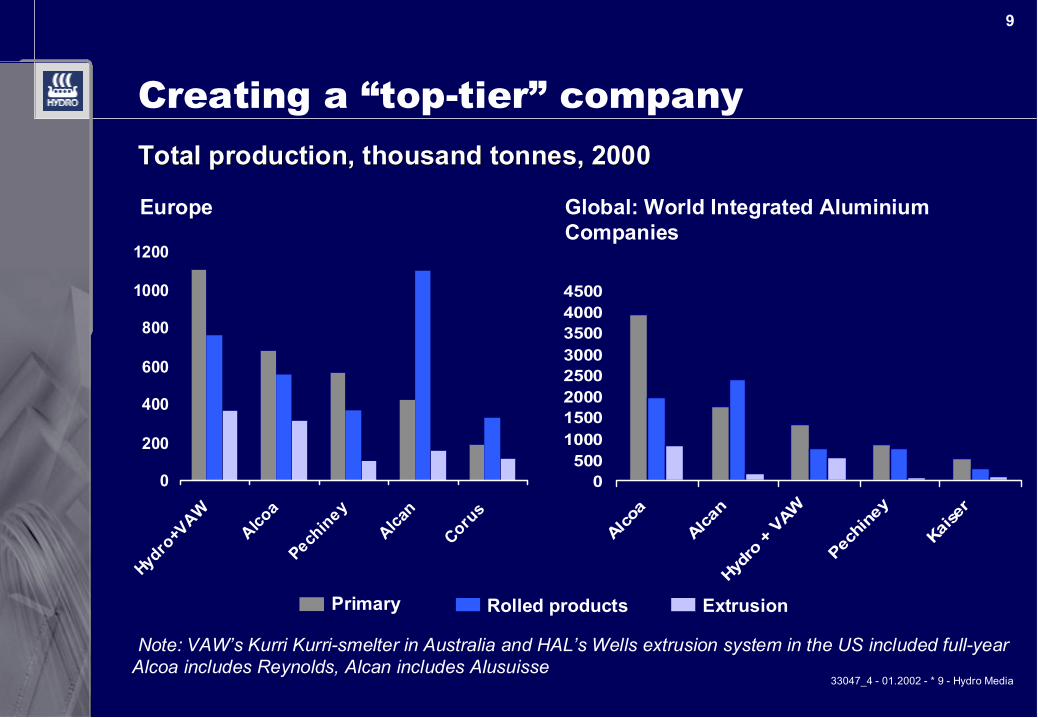
Creating a “top-tier” company
0500
10001500200025003000350040004500
Alcoa
Alcan
Hydro
+ VAW
Pechin
ey
Kaiser
0
200
400
600
800
1000
1200
Hydro
+VAW
Alcoa
Pechiney
Alcan
Corus
Note: VAW’s Kurri Kurri-smelter in Australia and HAL’s Wells extrusion system in the US included full-yearAlcoa includes Reynolds, Alcan includes Alusuisse
Global: World Integrated AluminiumCompanies
Total production, thousand tonnes, 2000Total production, thousand tonnes, 2000
Europe
Rolled products ExtrusionPrimary

33047_4 - 01.2002 - * 10 - Hydro Media
10
The leading company in Europe
Europe
PRIMARY METALEXTRUSIONAUTOMOTIVEMETAL PRODUCTSROLLED PRODUCTS

33047_4 - 01.2002 - * 11 - Hydro Media
11
Significant value creationopportunities in North America
● High quality smeltercapacity (Alouette)
● High quality extrusionassets
● #3 in Extrusion
● Roll-out of asset-lightmetal supply concept
● Leverage Latin-Americanmetal supply sources
● Transfer Europeanextrusion business system
North America
PRIMARY METALEXTRUSION /METAL PRODUCTSAUTOMOTIVE
South America
PRIMARY METALEXTRUSIONAUTOMOTIVEMETAL PRODUCTS

33047_4 - 01.2002 - * 12 - Hydro Media
12
Stronger positionin Asia/Pacific’s growing markets
● Low-cost smelter capacity● Foothold in rolling (Malaysia)● Foothold in extrusion (China)
● Low-cost brownfield potential● Opportunities for metal swaps● Roll-out of asset-light metal
supply conceptAsia and Australia
PRIMARY METALEXTRUSIONROLLED PRODUCTSMETAL PRODUCTS

33047_4 - 01.2002 - * 13 - Hydro Media
13
Global Volumes 2000
0 500 1000 1500 2000 2500 3000
Downstream
Primaryproduction
Alumina*
Thousand tonnes
HydroVAWLT ContractsHydro remelt and 3rd party**
* Aluminium equivalent. VAW metallurgical alumina only** Remelt + Hydro non-equity primary: Contracts to sell metal from Slovalco, Talum, Pianmeca, Aluvale. Goldendale tollingagreement. Trading.
A full range aluminium company

33047_4 - 01.2002 - * 14 - Hydro Media
14
Structures
LeadershipLeadershipLeadershipLeadership in global market segments
Foil Litho
Heat Transfer Engine castings
Building systems
Magnesium alloys
33047_4 - 01.2002 - * 15 - Hydro Media
15
Improvedmargins
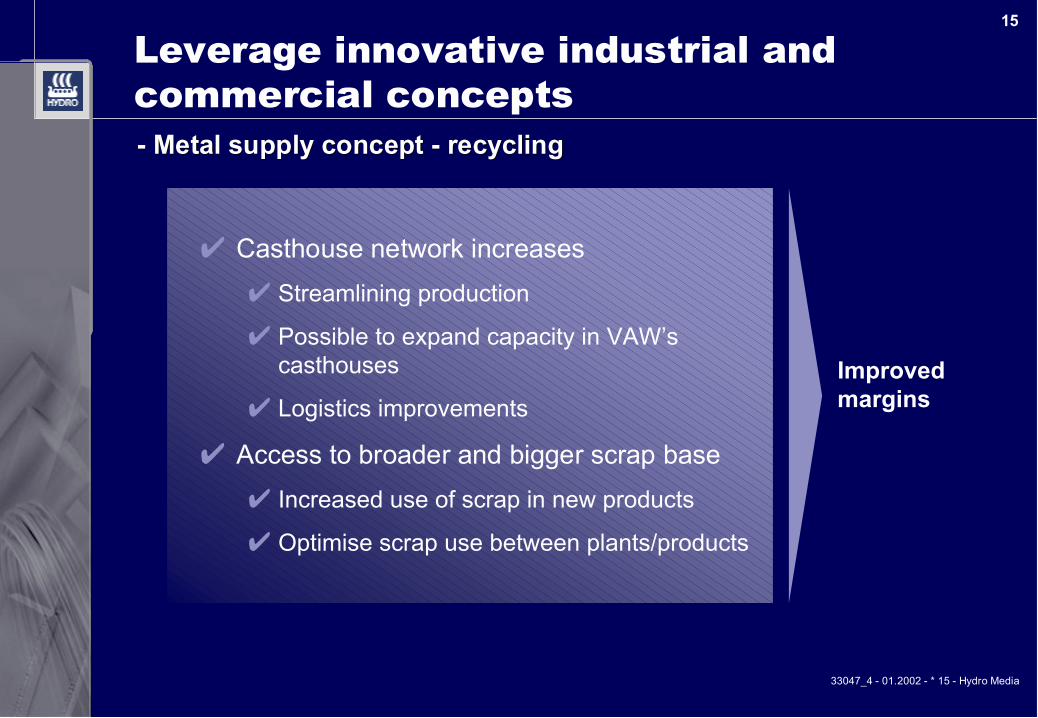
Leverage innovative industrial andcommercial concepts
✔ Casthouse network increases✔ Streamlining production
✔ Possible to expand capacity in VAW’s casthouses
✔ Logistics improvements
✔ Access to broader and bigger scrap base✔ Increased use of scrap in new products
✔ Optimise scrap use between plants/products
- Metal supply concept - recycling- Metal supply concept - recycling
33047_4 - 01.2002 - * 16 - Hydro Media
16
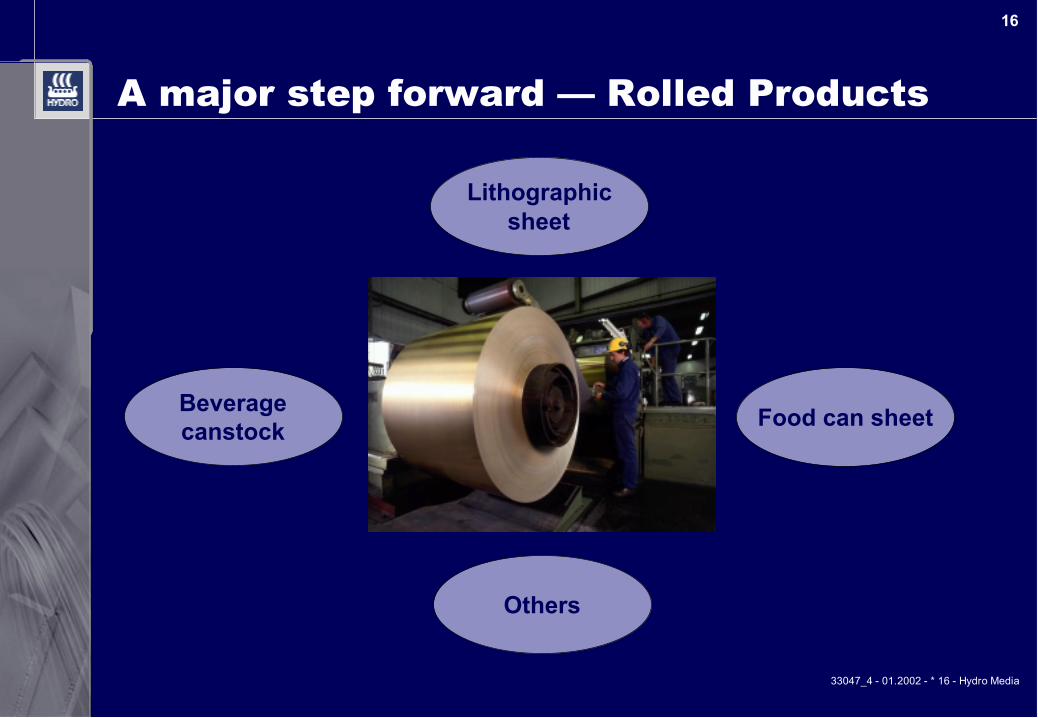
A major step forward — Rolled Products
Lithographicsheet
Others
Beveragecanstock Food can sheet
33047_4 - 01.2002 - * 17 - Hydro Media
17
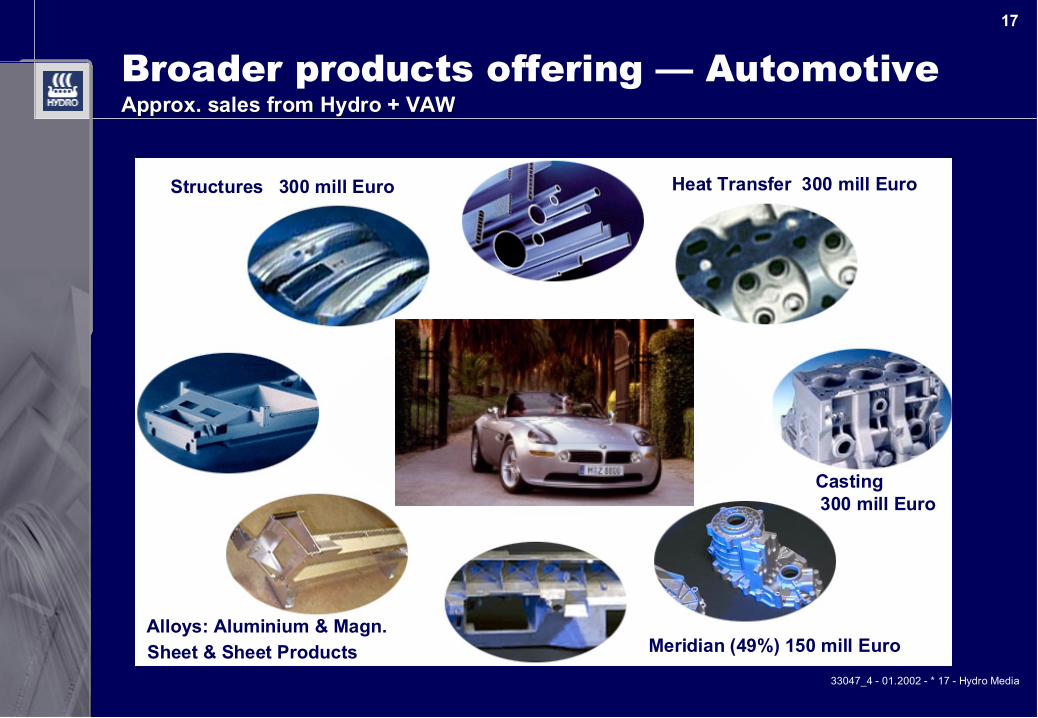
Broader products offering — AutomotiveApproxApprox. sales from Hydro + VAW. sales from Hydro + VAW
Structures 300 mill Euro Heat Transfer 300 mill Euro
Casting 300 mill Euro
Meridian (49%) 150 mill EuroAlloys: Aluminium & Magn.Sheet & Sheet Products
33047_4 - 01.2002 - * 18 - Hydro Media
18
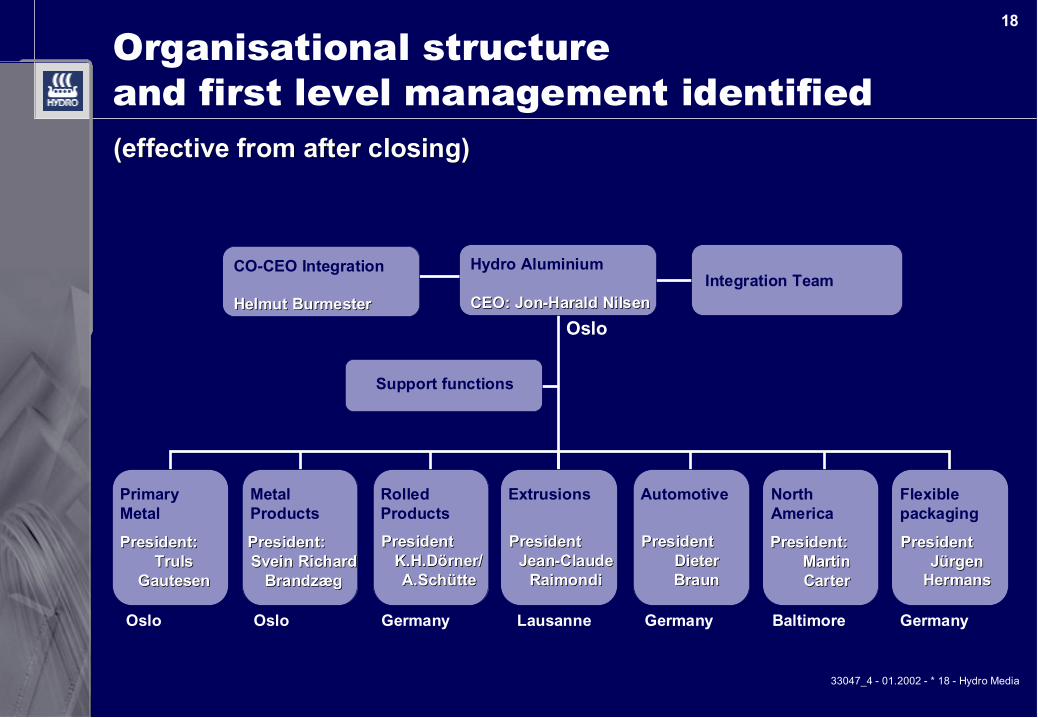
Organisational structureand first level management identified
Hydro Aluminium
CEO: Jon-CEO: Jon-Harald NilsenHarald Nilsen
PrimaryMetal
MetalProducts
Extrusions Automotive NorthAmerica
RolledProducts
President:President:TrulsTruls
GautesenGautesen
President:President:Svein RichardSvein Richard
BrandzægBrandzæg
PresidentPresidentK.H.Dörner/K.H.Dörner/A.SchütteA.Schütte
PresidentPresidentJean-ClaudeJean-Claude
RaimondiRaimondi
PresidentPresidentDieterDieterBraunBraun
President:President:MartinMartinCarterCarter
Flexiblepackaging
PresidentPresidentJürgenJürgen
HermansHermans
Integration Team
Support functions
Oslo
(effective from after closing)(effective from after closing)
CO-CEO Integration
Helmut Helmut BurmesterBurmester
Oslo Oslo Germany Lausanne Germany Germany Baltimore
33047_4 - 01.2002 - * 19 - Hydro Media
19
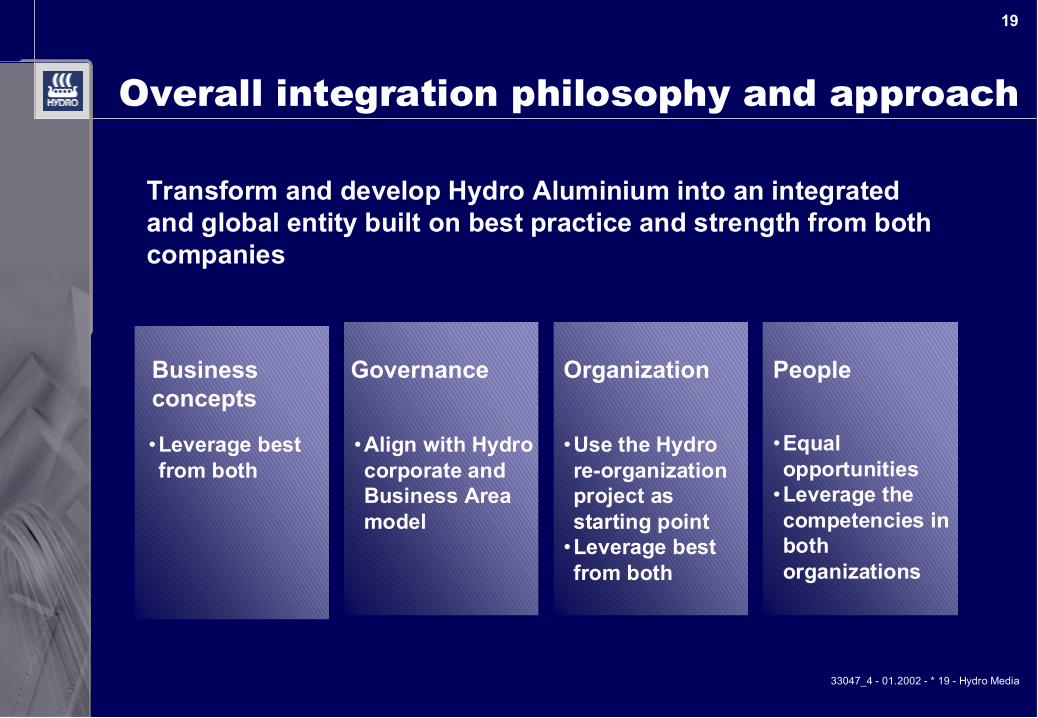
•Leverage bestfrom both
Businessconcepts
•Use the Hydrore-organizationproject asstarting point
•Leverage bestfrom both
•Align with Hydrocorporate andBusiness Areamodel
OrganizationGovernance
Transform and develop Hydro Aluminium into an integratedand global entity built on best practice and strength from bothcompanies
Overall integration philosophy and approach
•Equalopportunities
•Leverage thecompetencies inbothorganizations
People

33047_4 - 01.2002 - * 20 - Hydro Media
20
Significant synergies and value creation
More value for customers
Innovative global force
Attractive financials
Rapid integration
Hydro — VAW: An attractive combination

33047_4 - 01.2002 - * 21 - Hydro Media
21
Present situationPresent situation& Going Forward& Going Forward
33047_4 - 01.2002 - * 22 - Hydro Media
22
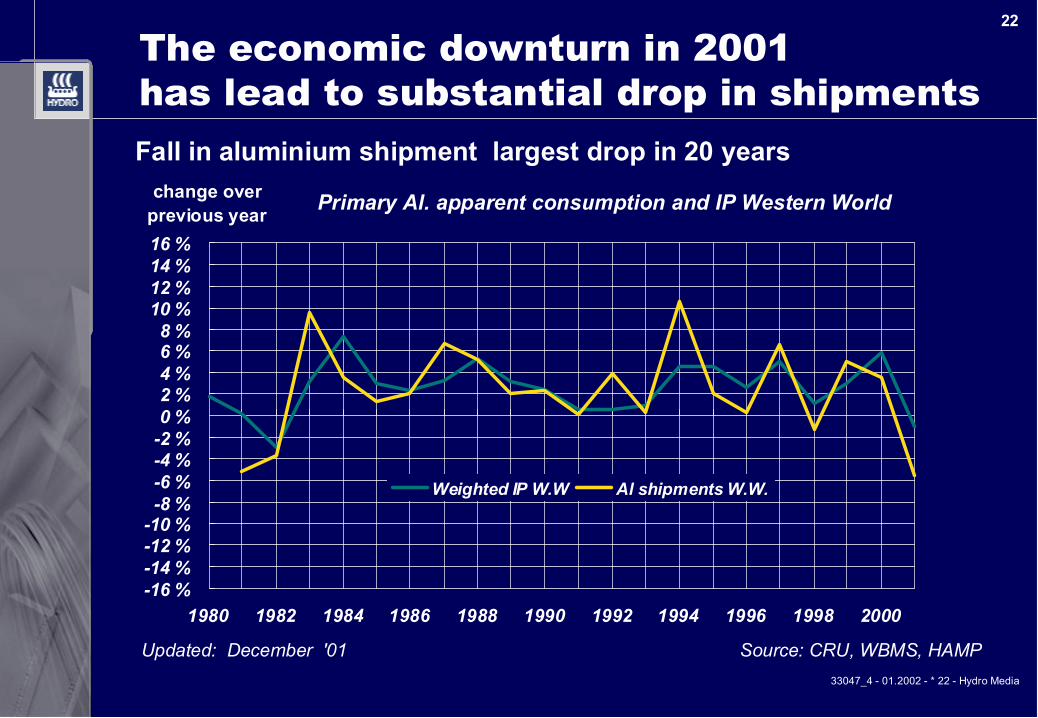
Fall in aluminium shipment largest drop in 20 years
-16 %-14 %-12 %-10 %-8 %-6 %-4 %-2 %0 %2 %4 %6 %8 %
10 %12 %14 %16 %
1980 1982 1984 1986 1988 1990 1992 1994 1996 1998 2000
change over previous year
Weighted IP W.W Al shipments W.W.
The economic downturn in 2001has lead to substantial drop in shipments
Primary Al. apparent consumption and IP Western World
Source: CRU, WBMS, HAMP Updated: December '01
33047_4 - 01.2002 - * 23 - Hydro Media
23
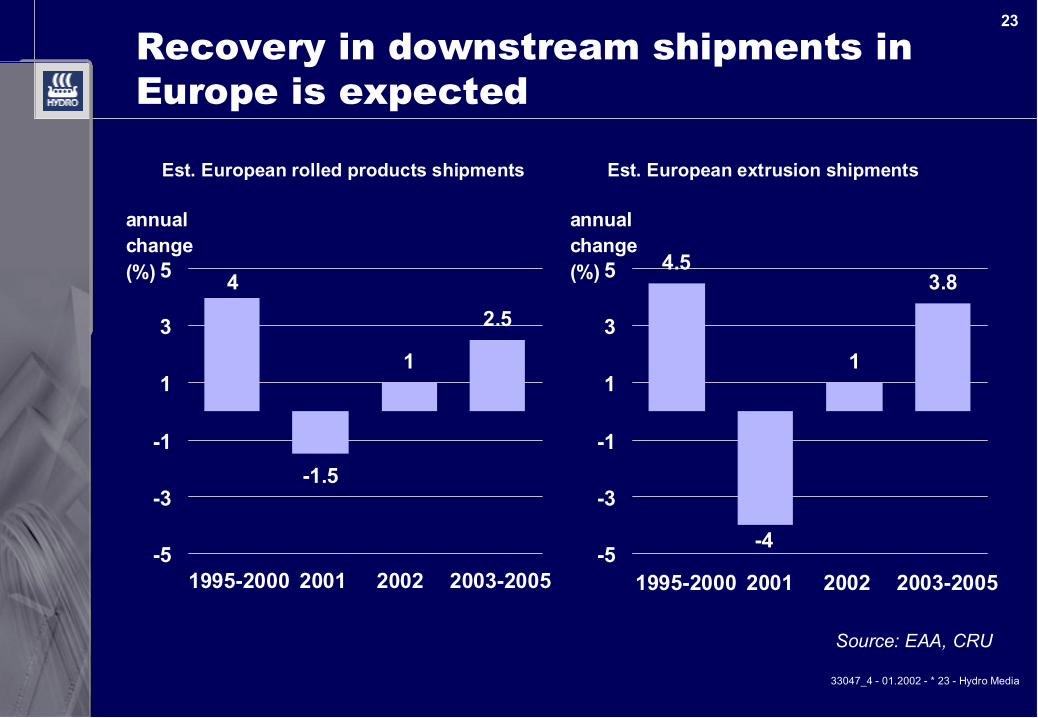
Recovery in downstream shipments inEurope is expected
Est. European rolled products shipments
Source: EAA, CRU
Est. European extrusion shipments
-1.5
1
2.5
4
-5
-3
-1
1
3
5
annualchange (%) 4.5
1
3.8
-4-5
-3
-1
1
3
5
annualchange (%)
1995-2000 2001 2002 2003-2005 1995-2000 2001 2002 2003-2005

33047_4 - 01.2002 - * 24 - Hydro Media
24
Longer term outlook positive
2.5-3% growth going forward
Packaging Construction material
Recyclability up to 90% Only 5% energy use in recycling
Light weight of cars (CO2)

33047_4 - 01.2002 - * 25 - Hydro Media
25
The industry attractiveness has improved
✔ Healthy growth in demand
✔ Industry consolidation will continue
✔ High entry barriers
✔ Better up- and mid-stream supply and demandbalance expected

33047_4 - 01.2002 - * 26 - Hydro Media
26
The industry structure Total consumption of aluminium, Western World
Rolled Products 50%
Extruded products 25%
Cast products 20%
Other 5%
Degree of Casting integration: 10%
Degree of Extrusion integration, 50%
0100020003000
4000500060007000
1000 mt
IndependentIntegrated
Degree of Rolling integration, 80%
01000
2000
3000
40005000
6000
70001000 mt
Western Europe Eastern Europe
NAFTA Lat. America Japan Western Europe
Eastern Europe NAFTA Lat. America
Japan
33047_4 - 01.2002 - * 27 - Hydro Media
27
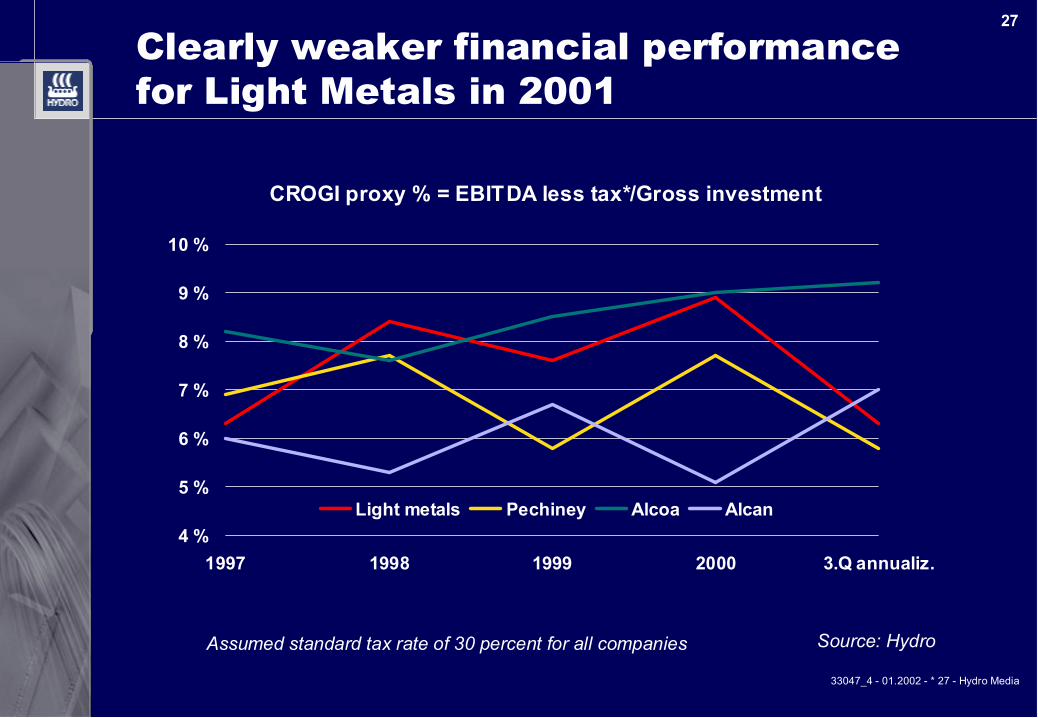
Clearly weaker financial performancefor Light Metals in 2001
Source: Hydro
CROGI proxy % = EBITDA less tax*/Gross investment
4 %
5 %
6 %
7 %
8 %
9 %
10 %
1997 1998 1999 2000 3.Q annualiz.
Light metals Pechiney Alcoa Alcan
Assumed standard tax rate of 30 percent for all companies

33047_4 - 01.2002 - * 28 - Hydro Media
28
Actions taken to improve performance
✔ Decision to close Porsgrunn magnesiumproduction
✔ Significant cost reduction programmes in SG&A✔ Initiatives taken to compensate for lower
volumes and margins➤ Demanning of 350 employees in Extrusion. Capacity
reduction of 10%➤ Capacity reduction of 90.000 t remelt in Metal Products
✔ Further improvement programmes withinPrimary Metal and Metal Products initiated

33047_4 - 01.2002 - * 29 - Hydro Media
29
Substantial financial effects of mainprogrammes 2002-2003 (full effect 2004)
* Projects : Including approved projects like SU 4, Alunorte, Slovalco, Søral, Remelters & Aluchemie
Magnesium Porsgrunn Hydro/VAW Optimize/SG&A
Investment Projects*
0
500
1000
1500
2000
2500Mill.NOK
Income increaseFixed and variableFixed cost
EBITDA - investment projects Cost reductions

33047_4 - 01.2002 - * 30 - Hydro Media
30
Substantial reduction in manning
Expected effect approx. 1.2 - 1.4 bn NOK Net financial effect in 2002 will be negative due to upfront restructuring costs
Manning
0200400600800
10001200140016001800
Mid 2002 End 2002 End 2003
Hydro/VAW SG&AMagnesium
33047_4 - 01.2002 - * 31 - Hydro Media
31
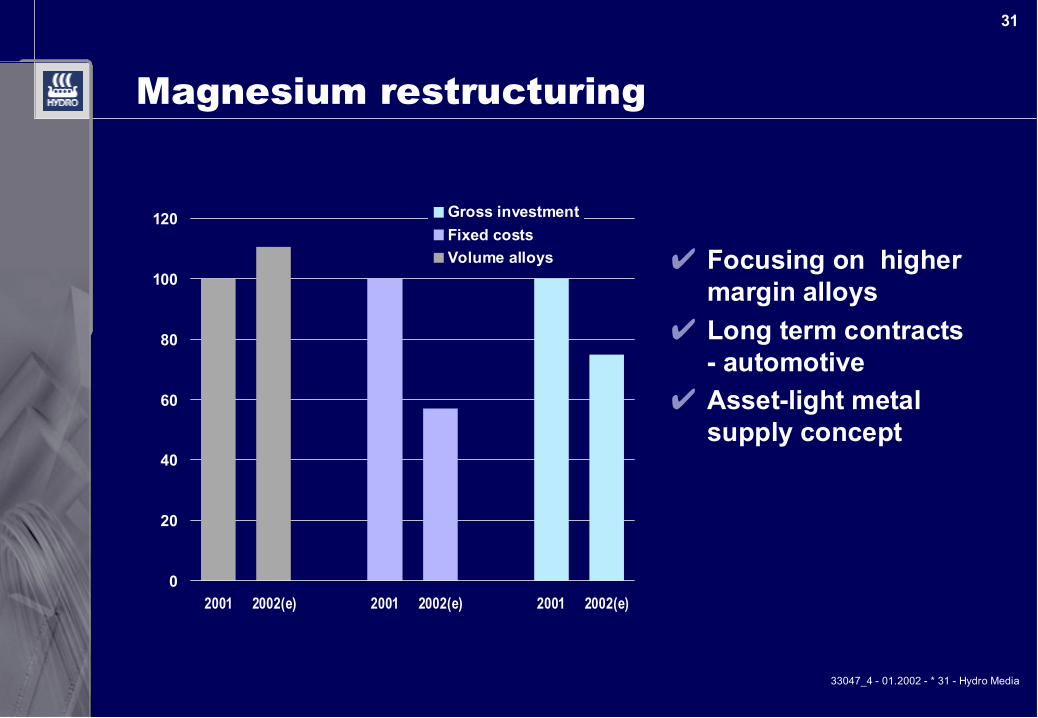
Magnesium restructuring
✔ Focusing on highermargin alloys
✔ Long term contracts- automotive
✔ Asset-light metalsupply concept
0
20
40
60
80
100
120
2001 2002(e) 2001 2002(e) 2001 2002(e)
Gross investmentFixed costsVolume alloys

33047_4 - 01.2002 - * 32 - Hydro Media
32
The way forward
✔ Forceful integration of VAW and Technal
✔ Realise significant short term improvementpotentials
✔ Successful restructuring of magnesium
✔ Execution of large projects

33047_4 - 01.2002 - * 33 - Hydro Media
33
Backup

33047_4 - 01.2002 - * 34 - Hydro Media
34
Hydro Light Metal — quarter by quarter
-500
0
500
1000
1500
2000
Aluminium Metal Production Aluminium Extrusion Other Light Metals Eliminations
EBITDA Mill NOK
1998 1999 2000 2001
Accumulated 4060 3760 5501 2845

33047_4 - 01.2002 - * 35 - Hydro Media
35
0
500
1000
1500
2000
1969 1971 1973 1975 1977 1979 1981 1983 1985 1987 1989 1991 1993 1995 1997 1999 2001
Effect of slowdownin the US has been extreme
000 tpa
2002E
1969 - 2000: 2.7% growth p.a.
Extrusion shipmentsExtrusion shipments
-20%
-25%
-21%
33047_4 - 01.2002 - * 36 - Hydro Media
36
Safe harbour statement
In order to utilize the "Safe Harbor" provisions of the United States PrivateSecurities Litigation Reform Act of 1995, Hydro is providing the following cautionarystatement: This presentation contains certain forward-looking statements withrespect to the financial condition, results of operations and business of theCompany and certain of the plans and objectives of the Company with respect tothese items. By the nature, forward-looking statements involve risk and uncertaintybecause they relate to events and depend on circumstances that will occur in thefuture. The actual results and developments may differ materially from thoseexpressed or implied in the forward-looking statements due to any number ofdifferent factors. These factors include, but are not limited to, changes in costs andprices, changes in economic conditions, and changes in demand for the Company'sproducts. Additional information, including information on factors which may affectHydro's business, is contained in the Company's 2000 Annual Report on Form 20-Ffiled with the U.S. Securities and Exchange Commission.

Capital Markets Day
Performance and FinancialStrength
Capital Markets DayCapital Markets Day
Performance and FinancialPerformance and FinancialStrengthStrength
Executive Vice President and CFO Leiv L. NergaardNorsk Hydro ASA
Oslo, January 8, 2002
Executive Vice President and CFOExecutive Vice President and CFO Leiv Leiv L. L. Nergaard NergaardNorskNorsk Hydro ASA Hydro ASA
Oslo, January 8, 2002Oslo, January 8, 2002

33047_3 - 01.2002 - * 2 - Hydro Media
2
Creating shareholder value
Share-holder-value
Performance
Portfoliomanagement
Major portfoliorestructuring
Return on Capital andasset productivity
Capital discipline Financial capacity

33047_3 - 01.2002 - * 3 - Hydro Media
3
VAW TransactionVAW Transaction
● Total consideration is 2,645 mill Euro (21.2 BnNOK* including net interest bearing debt of 757mill Euro (NOK 6.1 bn)
● In addition Norsk Hydro takes over 450 mill.Euro (3.6 bn NOK) unfunded pension obligations
● Acquisition financed through cash and debt
● Subject to approval by Norsk Hydro Corporateassembly and regulatory approvals
● Expected closing by Q1 2002* All figures are estimates as per 1.1.2002 except where noted. Assumed exchange rate of 8,00 NOK/Euro

33047_3 - 01.2002 - * 4 - Hydro Media
4
* Estimated after transaction
VAW Financial impact on Norsk Hydro
● Pro forma first 9 months 2001
EBITDA: + 7%EPS: + 1.30 NOK/share
● Estimated* debt/equity: 0.7
● Hydro maintains emphasis on keeping A/A2rating

33047_3 - 01.2002 - * 5 - Hydro Media
5
Total assets
Oil and Energy Aluminium Agri Other
44%
16%
23%
17%
39%14%
14%
33%
Norsk HydroNorsk Hydro + VAW
Norsk Hydro and VAW combinedPro Forma Total assets 30 Sept. 2001

33047_3 - 01.2002 - * 6 - Hydro Media
6
Pro Forma EBITDA first 9 monthsPro Forma EBITDA first 9 months 2001 2001
73%
12%6%
9%
67%
11%4%
18%
Norsk Hydro
Oil and Energy Aluminium Agri Other
Norsk Hydro + VAW
Norsk Hydro and VAW combined

33047_3 - 01.2002 - * 7 - Hydro Media
7
0.37
0.49
0.69
0
0.1
0.2
0.3
0.4
0.5
0.6
0.7
1997 1998 1999 2000 30.09.01 Afteracq.
Target2003
Speedy return to strong financial position
* Long-term debt divided by shareholders' equity plus minority interest** Adjusted ratio if current cash position had been reduced to NOK 10 for 2000 and 15 billion for 30.09.01
0.29**
0.39**
Long-term debt/equity*Long-term debt/equity* illustrating expected effect llustrating expected effect of VAW acquisitionof VAW acquisition
0.550.50
0.7
0.5
33047_3 - 01.2002 - * 8 - Hydro Media
8
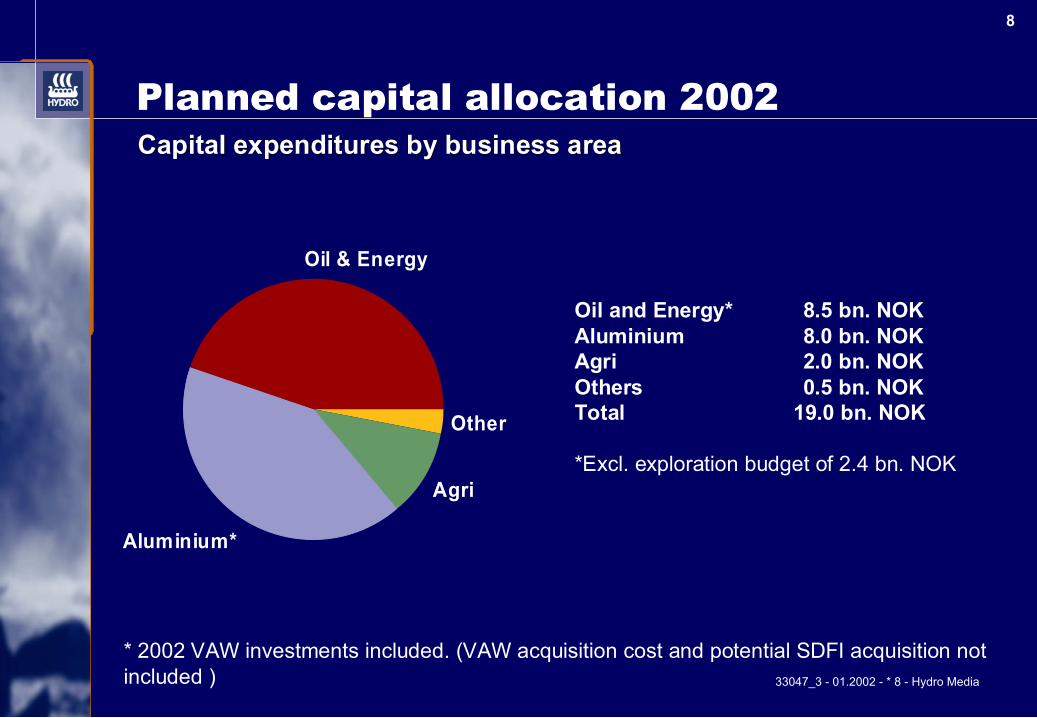
Planned capital allocation 2002 Capital expenditures by business areaCapital expenditures by business area
Oil and Energy* 8.5 bn. NOKAluminium 8.0 bn. NOKAgri 2.0 bn. NOKOthers 0.5 bn. NOKTotal 19.0 bn. NOK
*Excl. exploration budget of 2.4 bn. NOK
* 2002 VAW investments included. (VAW acquisition cost and potential SDFI acquisition notincluded )
Other
Agri
Aluminium*
Oil & Energy

33047_3 - 01.2002 - * 9 - Hydro Media
9
Active divestment program
● New divestment target of NOK 10 billion by end2003■ Larger non-core candidates for divestment include:
– Petrochemicals– KFK shareholding– VAW Flexible Packaging
● Continued divestments within core areas■ Recent examples:
– Pelican, non-core NCS licenses, Oleochemicals business
● Fix, sell or close underperforming units
33047_3 - 01.2002 - * 10 - Hydro Media
10
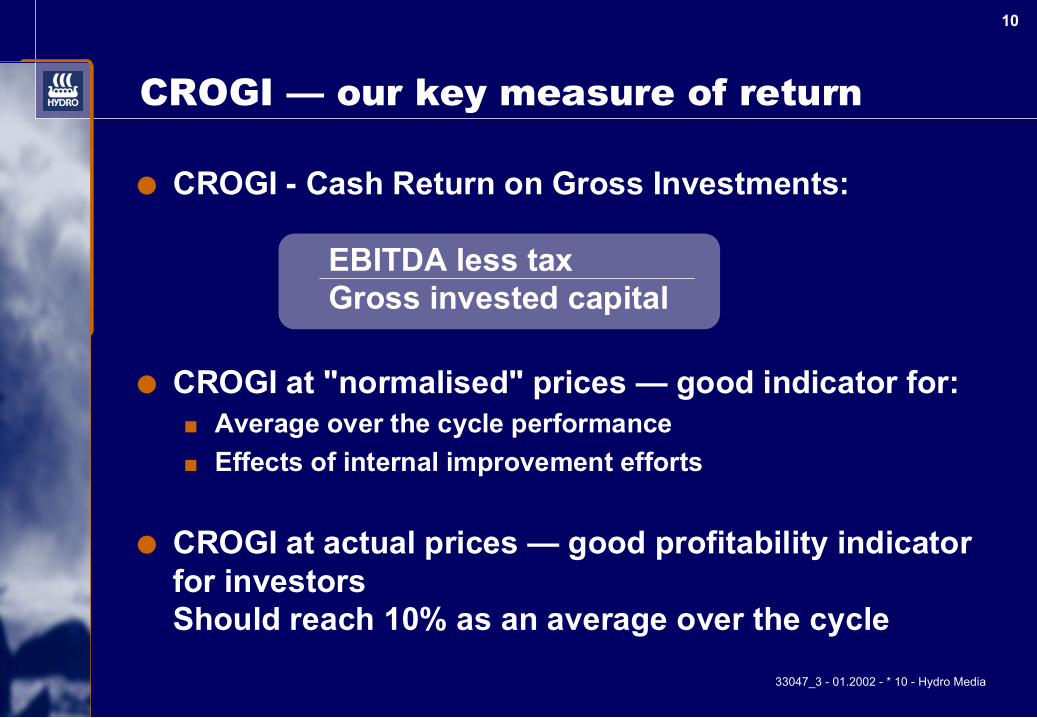
CROGI — our key measure of return
● CROGI - Cash Return on Gross Investments:
EBITDA less taxGross invested capital
● CROGI at "normalised" prices — good indicator for:■ Average over the cycle performance■ Effects of internal improvement efforts
● CROGI at actual prices — good profitability indicatorfor investorsShould reach 10% as an average over the cycle

33047_3 - 01.2002 - * 11 - Hydro Media
11
CROGI — development
Actual prices
7.78.5
10.3
8.49
3.3
8
1
0
2
4
6
8
10
12
14
1996 1997 1998 1999 2000 2001 2002(e)
CROGI %
Normalized prices
● Normalized prices:■ NOK/USD: 8.00■ Brent Blend (USD/bbl) 18■ CAN27 (USD/t) 113■ LME 3M (USD/t)1,500
● Average over the cycletarget 10%

33047_3 - 01.2002 - * 12 - Hydro Media
12
CROGI performance
1996
1997
1 99 8
1 99 9
2 00 0
1996
1997
1998
1 99 9
2 00 0
2 00 0
1996
1 99 7
1 99 9
1 99 8
0
2
4
6
8
10
12
14
16
Oil and Energy Aluminium Agri
Actual pricesActual prices
33047_3 - 01.2002 - * 13 - Hydro Media
13
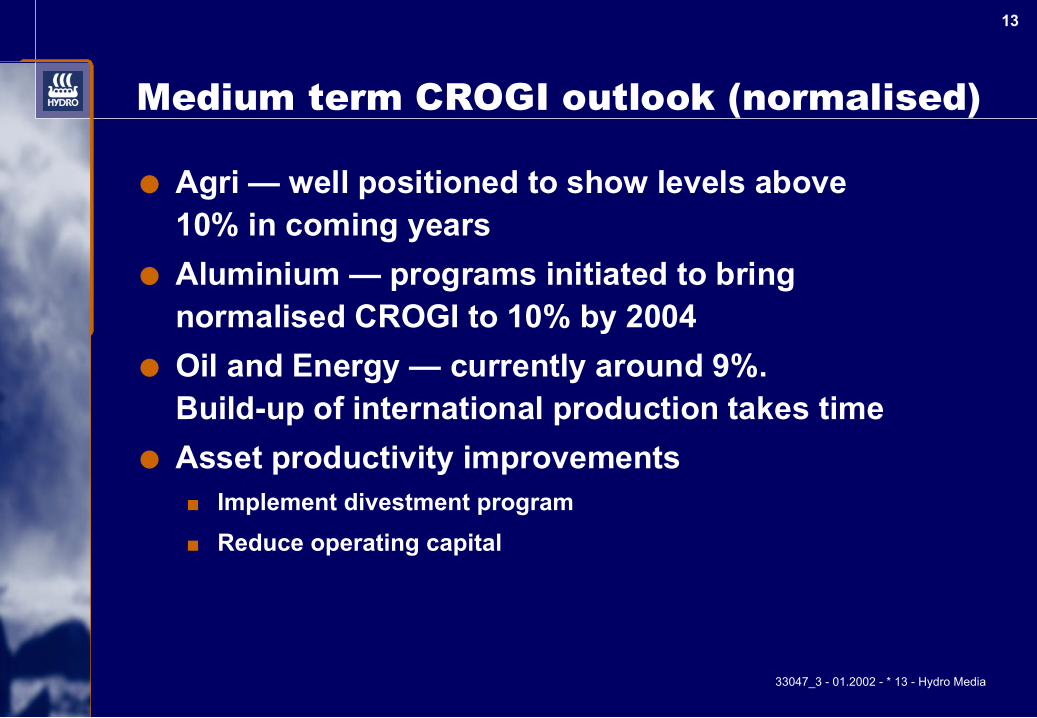
Medium term CROGI outlook (normalised)
● Agri — well positioned to show levels above10% in coming years
● Aluminium — programs initiated to bringnormalised CROGI to 10% by 2004
● Oil and Energy — currently around 9%.Build-up of international production takes time
● Asset productivity improvements■ Implement divestment program■ Reduce operating capital

33047_3 - 01.2002 - * 14 - Hydro Media
14
NorskNorsk Hydro including VAW Hydro including VAW —indicative sensitivity by unit changesindicative sensitivity by unit changes
Underlying assumptions :Oil 18 USD/bbl, LME 1,500 USD/t, CAN 27 113 USD/t, NOK/USD 8.00Full taxpaying position offshore
* after currency loss on loans and interest (105 after tax) These elements are not included in the EBITDA and CROGI figures.
EBITDAMill NOK
Net incomeMill NOK
CROGI% points
Oil price + 1 USD/boe 990 215 0.07
LME + 100 USD/t 820 575 0.20
CAN + 10 USD/t 600 420 0.15
Currency + 0.1 NOK/USD 430 105* 0.07

33047_3 - 01.2002 - * 15 - Hydro Media
15
Hydro — new reporting format from 2002
1) Primary Metals + Metal Products incl. Magnesium2) Extrusion + Automotive + the North American Unit3) Petrochemicals + KFK + VAW Flexible packaging + Others
● Exploration and Production● Energy & Oil Marketing
Hydro Oil and Energy
Other 3)
Sum Hydro
● Metals 1)● Rolled products● Extrusion & Automotive 2)
Hydro Aluminium
● Exploration and Production● Oil Marketing● Energy
Hydro Oil and Energy
PetrochemicalsOther
Sum Hydro
● Aluminium Metal Products● Extrusion● Other Light Metals
Hydro Light Metals
NEW OLD
Hydro Agri
● Plant Nutrition● Gases and Chemicals● KFK
Hydro Agri

33047_3 - 01.2002 - * 16 - Hydro Media
16
Main financial targets
● Cash Return on Gross Investment(CROGI*), nominal after tax 10%
● Return on new investments, real rate after tax 10%
● Dividend:Share of net income, average over the cycle 30%
● Solidity:Long term interest-bearing debt/equity 0.5
* Based on "normalised" price set to reflect average over the cycle performance

33047_3 - 01.2002 - * 17 - Hydro Media
17
Capital Markets DayCapital Markets Day
Additional sensitivityAdditional sensitivityinformationinformation

33047_3 - 01.2002 - * 18 - Hydro Media
18
Norsk Hydro including VAW —indicative sensitivity by % changes
Underlying assumptions : Oil 18 USD/bbl, LME 1,500 USD/t, CAN 27 113 USD/t, NOK/USD 8.00Full taxpaying position offshore
EBITDAMill NOK
Net incomeMill NOK
CROGI% points
Oil price + 5% USD/boe 890 195 0.07
LME + 5% USD/t 615 430 0.15
CAN + 5% USD/t 340 235 0.08
Currency + 5% NOK/USD 1,720 415* 0.29
* after currency loss on loans and interest (420 after tax) These elements are not included in the EBITDA and CROGI figures.
33047_3 - 01.2002 - * 19 - Hydro Media
19
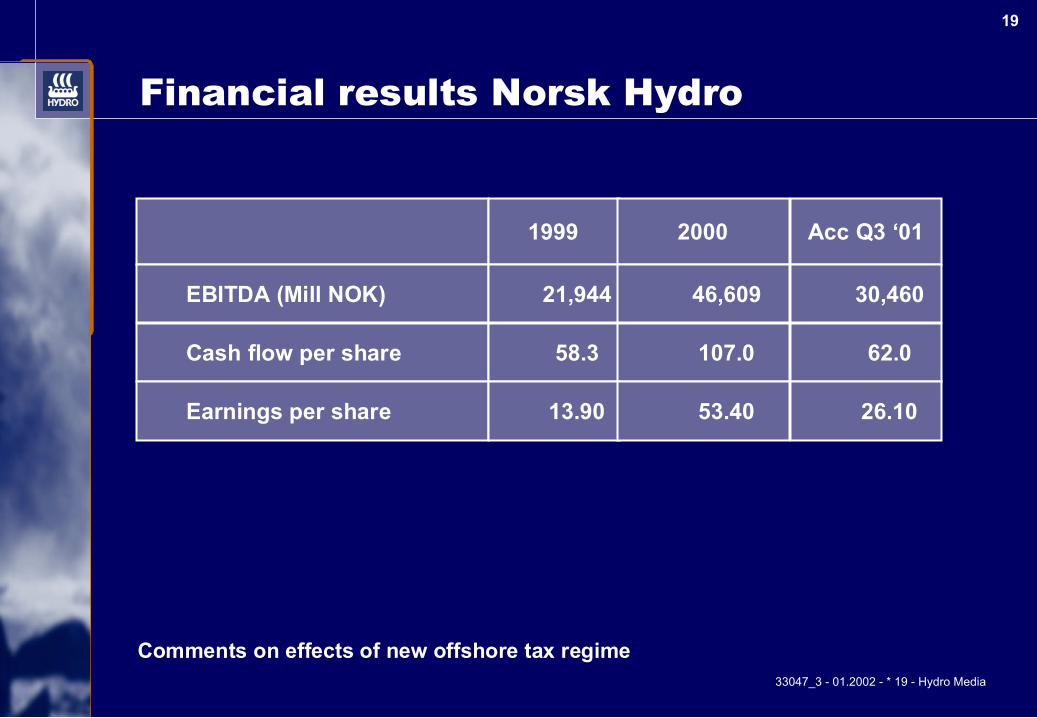
Financial results Norsk Hydro
Comments on effects of new offshore tax regime
1999 2000 Acc Q3 ‘01
EBITDA (Mill NOK) 21,944 46,609 30,460
Cash flow per share 58.3 107.0 62.0
Earnings per share 13.90 53.40 26.10

33047_3 - 01.2002 - * 20 - Hydro Media
20
Oil & Energy — indicative sensitivities
Underlying assumptions: Oil 18 USD/bbl, NOK/USD 8.00Full tax paying position offshore
EBITDAMill NOK
CROGI% points
Oil price + 1 USD/boe 1,100 0.22
Currency + 0.1 NOK/USD 215 0.04
33047_3 - 01.2002 - * 21 - Hydro Media
21
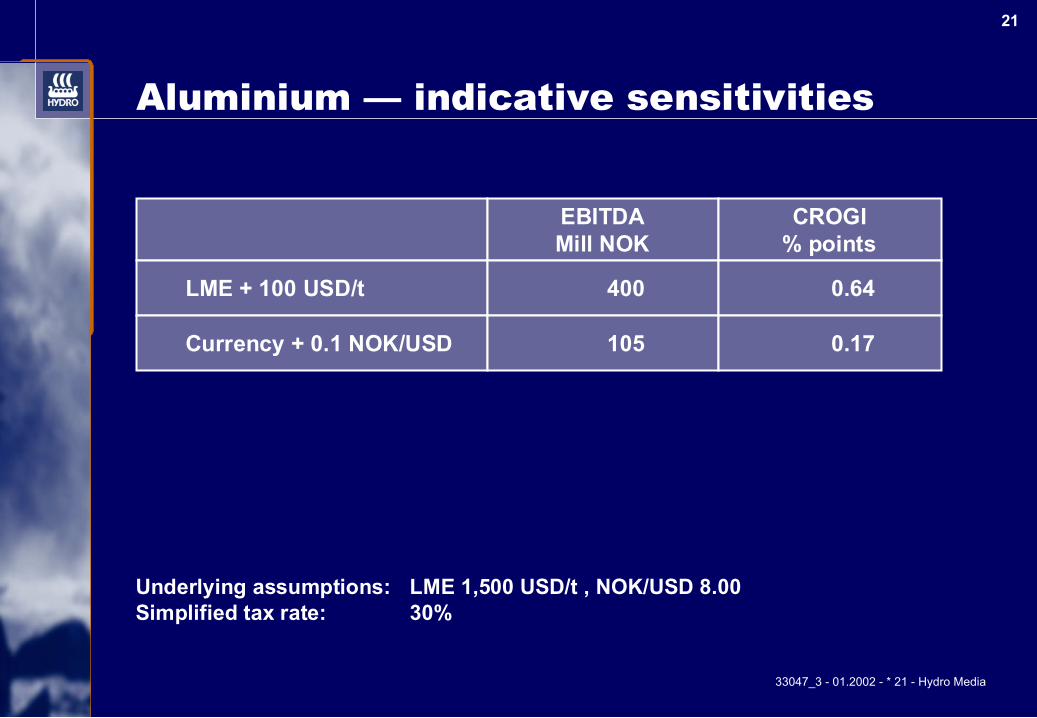
Aluminium — indicative sensitivities
Underlying assumptions: LME 1,500 USD/t , NOK/USD 8.00Simplified tax rate: 30%
EBITDAMill NOK
CROGI% points
LME + 100 USD/t 400 0.64
Currency + 0.1 NOK/USD 105 0.17

33047_3 - 01.2002 - * 22 - Hydro Media
22
Agri — indicative sensitivities
Underlying assumptions: Oil 18 USD/bbl, CAN 113 USD/t , NOK/USD 8.00Simplified tax rate: 30%
EBITDAMill NOK
CROGI% points
CAN + 10 USD/t 600 0.89
Oil price + 1 USD/boe -110 -0.16
Currency + 0.1 NOK/USD 60 0.09

33047_3 - 01.2002 - * 23 - Hydro Media
23
Aluminium — indicativesensitivities by unit changes incl. VAW
Underlying assumptions: LME 1,500 USD/t , NOK/USD 8.00Simplified tax rate: 30%
EBITDAMill NOK
CROGI% points
LME + 100 USD/t 820 0.76
Currency + 0.1 NOK/USD 155 0.14

33047_3 - 01.2002 - * 24 - Hydro Media
24
Norsk Hydro — (excl. VAW)indicative sensitivity by unit changes
Underlying assumptions :Oil 18 USD/bbl, LME 1,500 USD/t, CAN 27 113 USD/t, NOK/USD 8.00Full taxpaying position offshore
IndicativeEBITDAMill NOK
Net incomeMill NOK
CROGI% points
Oil price + 1 USD/boe 990 215 0.08
LME + 100 USD/t 400 280 0.11
CAN + 10 USD/t 600 420 0.17
Currency + 0.1 NOK/USD 375 65* 0.07
* after currency loss on loans and interest (105 after tax) These elements are not included in the EBITDA and CROGI figures.

33047_3 - 01.2002 - * 25 - Hydro Media
25
Norsk Hydro - (excl. VAW)indicative sensitivity by % changes
Underlying assumptions :Oil 18 USD/bbl, LME 1,500 USD/t, CAN 27 113 USD/t, NOK/USD 8.00Full taxpaying position offshore
EBITDAMill NOK
Net incomeMill NOK
CROGI% points
Oil price + 5% USD/bbl 890 195 0.08
LME + 5% USD/t 300 210 0.08
CAN + 5% USD/t 340 235 0.09
Currency + 5% NOK/USD 1,500 265* 0.27
* after currency loss on loans and interest (420 after tax) These elements are not included in the EBITDA and CROGI figures.

33047_3 - 01.2002 - * 26 - Hydro Media
26
Safe harbour statement
In order to utilize the "Safe Harbor" provisions of the United States PrivateSecurities Litigation Reform Act of 1995, Hydro is providing the following cautionarystatement: This presentation contains certain forward-looking statements withrespect to the financial condition, results of operations and business of theCompany and certain of the plans and objectives of the Company with respect tothese items. By the nature, forward-looking statements involve risk and uncertaintybecause they relate to events and depend on circumstances that will occur in thefuture. The actual results and developments may differ materially from thoseexpressed or implied in the forward-looking statements due to any number ofdifferent factors. These factors include, but are not limited to, changes in costs andprices, changes in economic conditions, and changes in demand for the Company'sproducts. Additional information, including information on factors which may affectHydro's business, is contained in the Company's 2000 Annual Report on Form 20-Ffiled with the U.S. Securities and Exchange Commission.

Capital Markets DayCapital Markets DayCapital Markets Day
President & CEO, Eivind ReitenNorsk Hydro ASA
Oslo, January 8, 2002
President & CEO, President & CEO, Eivind ReitenEivind ReitenNorskNorsk Hydro ASA Hydro ASA
Oslo, January 8, 2002Oslo, January 8, 2002
33047_1 - 01.2002 - * 2 - Hydro Media
2
Delivering on our strategyDelivering on our strategy
● Strong financial capacity established
● VAW acquisition — a transforming step forAluminium
● Attractive international positions establishedfor Oil and Energy
● Agri turnaround successfully completed
● Challenging to meet 2002 return target
33047_1 - 01.2002 - * 3 - Hydro Media
3
The VAW acquisitionThe VAW acquisition
Creating a world classCreating a world classaluminiumaluminium company company
● Establishing Europe's no. 1 aluminium company
● An excellent strategic fit — new company wellpositioned
● Accretive to EPS already in 2002
● Successful integration the main short term priority
● Ambitious programme to realise synergies andimprove Hydro's existing aluminium business■ Improvement target NOK 1.6 billion by end 2003■ Manning to be reduced by 1100 persons
33047_1 - 01.2002 - * 4 - Hydro Media
4
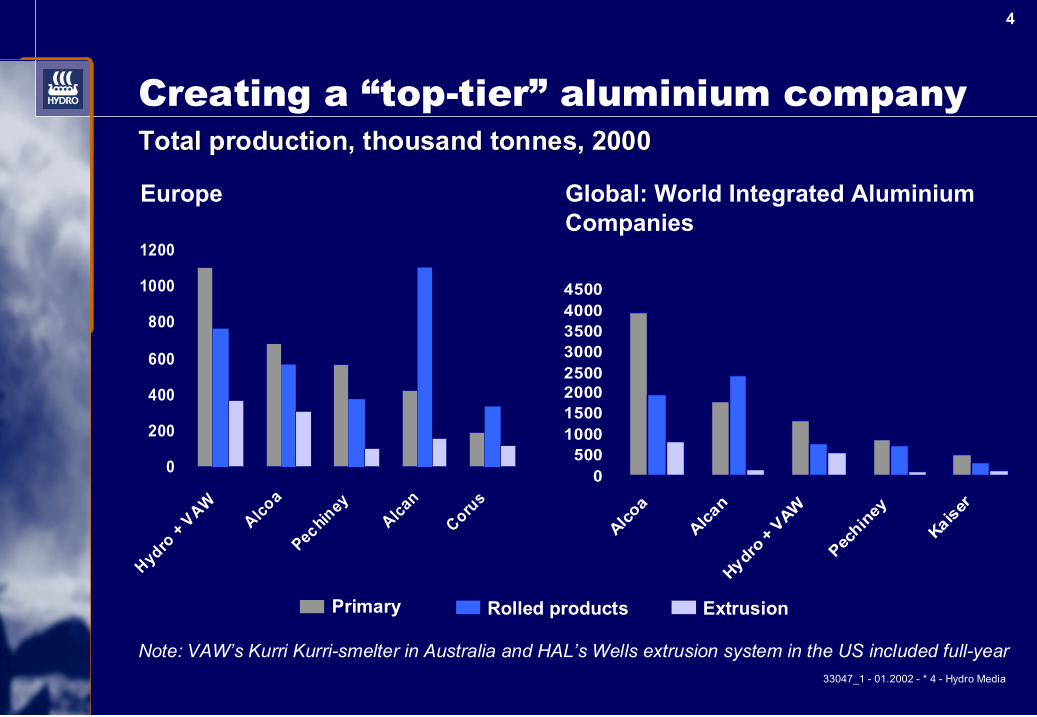
Creating a “top-tier” aluminium company
0500
10001500200025003000350040004500
Alcoa
Alcan
Hydro + V
AW
Pechin
ey
Kaiser
0
200
400
600
800
1000
1200
Hydro + V
AW
Alcoa
Pechiney
Alcan
Corus
Note: VAW’s Kurri Kurri-smelter in Australia and HAL’s Wells extrusion system in the US included full-year
Global: World Integrated AluminiumCompanies
Total production, thousand tonnes, 2000Total production, thousand tonnes, 2000
Europe
Rolled products ExtrusionPrimary

33047_1 - 01.2002 - * 5 - Hydro Media
5Agri —potential for significant value creation
* Based on first nine months 2001 figures
● Successful turnaround exceeds original targets:■ Greatly improved market balance in Europe■ Annual fixed costs cut by 30% (NOK 2.3 billion) from 1998-
level*■ Manning reduced by 30% (3,600 persons*) from 1998-level■ Platform for sustainable competitive earnings
● Strengthened positions outside of Europe
● Strong performance by Gas and Chemicals

33047_1 - 01.2002 - * 6 - Hydro Media
6Oil and Energy —positive growth outlook
● 2001 production target of 415,000 boe/d.reached, average annual production growth to2005 of 5 - 6%
● Growing natural gas sales and adding valuethrough commercial activities
● Exciting exploration acreage secured
● Finding and development costs on track toreach $5 target by 2003
33047_1 - 01.2002 - * 7 - Hydro Media
7
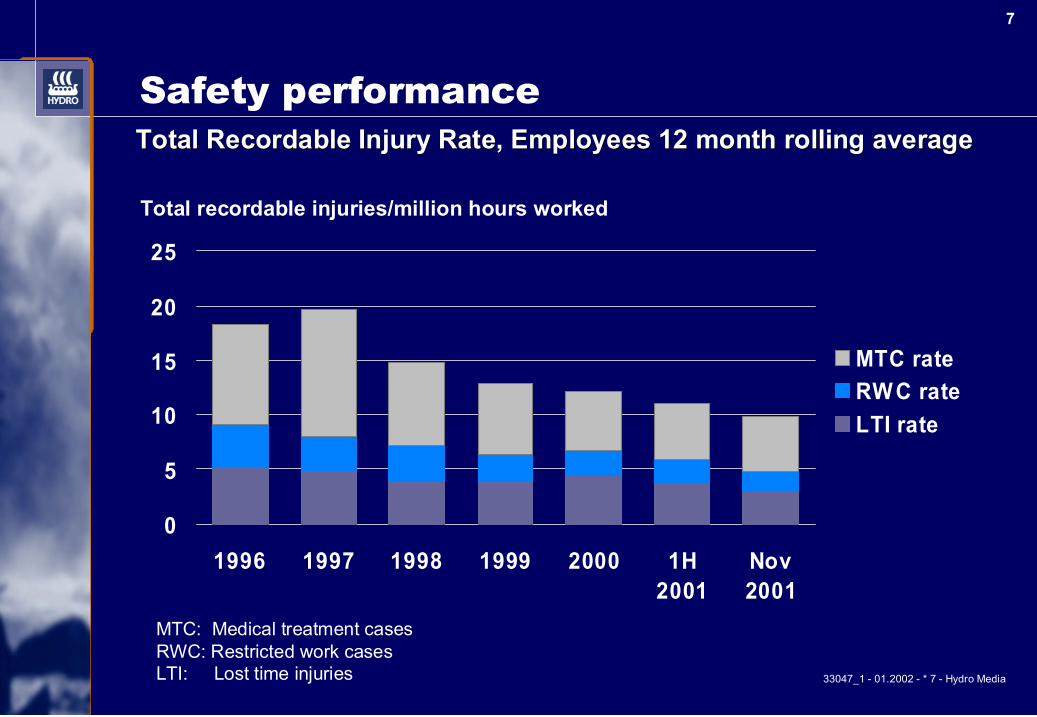
Safety performance
0
5
10
15
20
25
1996 1997 1998 1999 2000 1H2001
Nov2001
MTC rateRWC rateLTI rate
Total recordable injuries/million hours worked
TotalTotal Recordable Recordable Injury Rate, Employees 12 month rolling average Injury Rate, Employees 12 month rolling average
MTC: Medical treatment casesRWC: Restricted work casesLTI: Lost time injuries

33047_1 - 01.2002 - * 8 - Hydro Media
8Share price performance —a major challenge
100
150
200
250
300
350
400
450m
ar-9
0
mar
-91
mar
-92
mar
-93
mar
-94
mar
-95
mar
-96
mar
-97
mar
-98
mar
-99
mar
-00
mar
-01
NHY OSENHY OSE
Annual Total Shareholder Return 1991 - 2001 13%
33047_1 - 01.2002 - * 9 - Hydro Media
9
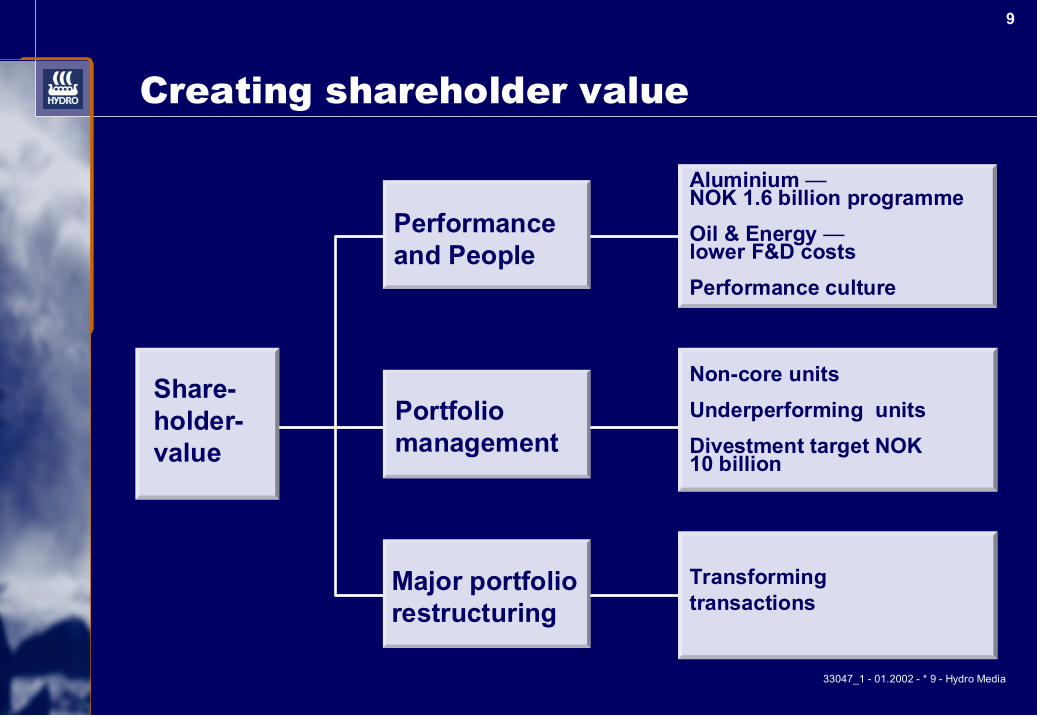
Creating shareholder value
Share-holder-value
Transformingtransactions
Performanceand People
Portfoliomanagement
Major portfoliorestructuring
Aluminium —NOK 1.6 billion programmeOil & Energy —lower F&D costsPerformance culture
Non-core unitsUnderperforming unitsDivestment target NOK10 billion

33047_1 - 01.2002 - * 10 - Hydro Media
10
CROGI —our main metric for return on capital
10.38.5
7.7 8.4
12.3
0
2
4
6
8
10
12
1996 1997 1998 1999 2000
CROGI —— Cash Return on Gross Investments
● Average over the cycle10%
● Level achieved in two ofthe last five years;improved performancerequired
● 2001 CROGI affected by:■ Weak aluminium market■ Restructuring charges

33047_1 - 01.2002 - * 11 - Hydro Media
11
Challenging to reach 2002 CROGI target
● Current plans imply an expected normalised CROGIlevel of between 8 and 9% in 2002
● Challenge being met by continued drive for betterperformance■ Implementing an agressive restructuring and improvement
programme in Aluminium■ Developing an attractive exploration portfolio in Oil and
Energy■ New measures to bring further improvements in Agri■ Active portfolio management and divestment of non-core
assets■ More efficient shared services

33047_1 - 01.2002 - * 12 - Hydro Media
12
Strengthen performance cultureStrengthen performance culture
● Speedy actions to correct deviations from plans
● New top management incentive systems established
● Performance drive in total compensation systems
● Improved management development programmes
33047_1 - 01.2002 - * 13 - Hydro Media
13
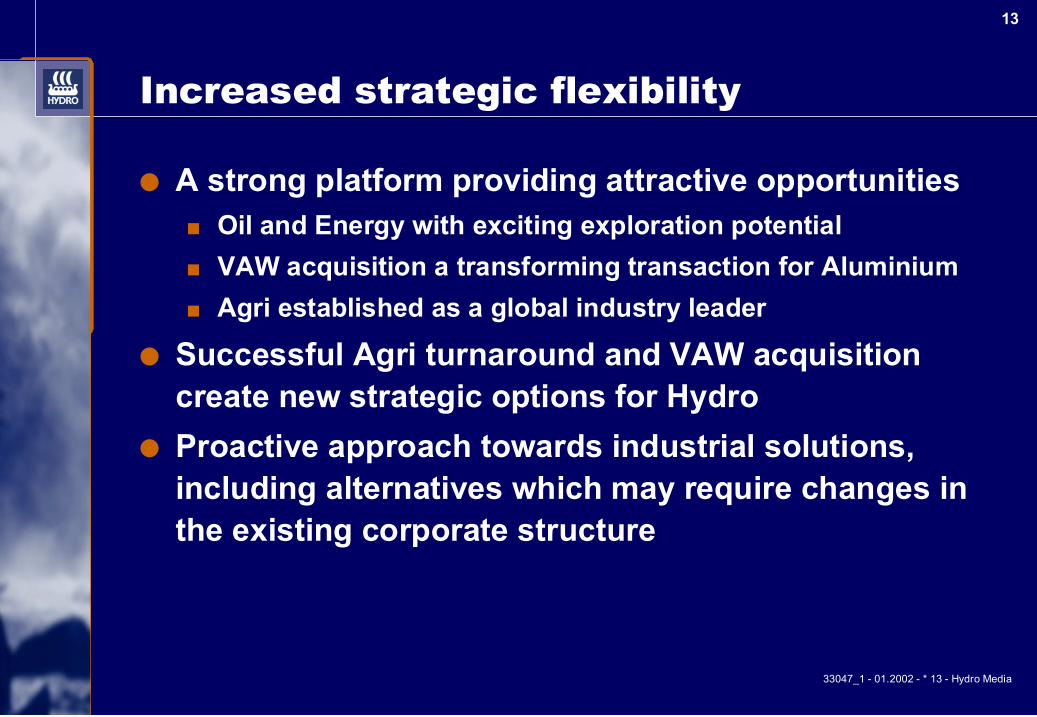
Increased strategic flexibility
● A strong platform providing attractive opportunities■ Oil and Energy with exciting exploration potential■ VAW acquisition a transforming transaction for Aluminium■ Agri established as a global industry leader
● Successful Agri turnaround and VAW acquisitioncreate new strategic options for Hydro
● Proactive approach towards industrial solutions,including alternatives which may require changes inthe existing corporate structure

33047_1 - 01.2002 - * 14 - Hydro Media
14
Safe harbour statement
In order to utilize the "Safe Harbor" provisions of the United States PrivateSecurities Litigation Reform Act of 1995, Hydro is providing the following cautionarystatement: This presentation contains certain forward-looking statements withrespect to the financial condition, results of operations and business of theCompany and certain of the plans and objectives of the Company with respect tothese items. By the nature, forward-looking statements involve risk and uncertaintybecause they relate to events and depend on circumstances that will occur in thefuture. The actual results and developments may differ materially from thoseexpressed or implied in the forward-looking statements due to any number ofdifferent factors. These factors include, but are not limited to, changes in costs andprices, changes in economic conditions, and changes in demand for the Company'sproducts. Additional information, including information on factors which may affectHydro's business, is contained in the Company's 2000 Annual Report on Form 20-Ffiled with the U.S. Securities and Exchange Commission.


![Agri-A4a Information AGRI Oh! e O Oh! SERIES]](https://img.pdfslide.us/doc/110x75/5acab7477f8b9a42358e1546/agri-a4a-information-agri-oh-e-o-oh-series-agri-800mm-d-w-oomm-h-agri-800mm.jpg)