Embed Size (px)
Citation preview

CJTG/RCJT, Laurentian University/Université Laurentienne, Geography/Géographie, Sudbury, Ontario, P3E 2C6, Canada. ISSN : 2292-4108. Vol. 4(2) : 22-33. Copyright @ 2017 CJTG-RCGT, All rights reserved/Tous droits réservés.
22
Land use dynamics and rural landscape transformations in southwestern Nigeria Dynamique d'utilisation du sol et transformations du paysage rural au sud-ouest du Nigeria
ADELEKE, Benjamin Oluwafemi; ORIMOOGUNJE, Oluwagbenga O.Isaac & SHOTE, Adekunle Adebola
@ 2017 CJTG-RCGT All rights reserved / Tous droits réservés
Abstract:
The paper examined the driving forces underlying land use dynamics in the study area. It also projected the future
land patterns of rural-urban transformations in the metropolis of Abeokuta, Nigeria. Both primary and secondary data
collected were analyzed using descriptive statistics and geospatial techniques of GIS and Remote Sensing. The result
showed farmlands reducing from 8751.21 hectares (19%) percentage of the total land area in 1972 to 7144.32
hectares (15%) in 1984, and subsequently to 3824.80 (8%) in 2005. Between 1972 and 1984 the population grew
by 75.16% while settlements increased by 513.21%. Also between 1972 and 2005, the population grew by 206.70
% and settlements increased by 924.81 %. By projection, in the year 2020, settlements would have increased to
20586.35 hectares by encroaching on other land use classes most importantly farmlands which will decrease to
2732.91 hectares from 3824.80 in 2005. The study concluded that there was a consistent transformation from rural to urban landscape through unregulated settlement developments.
Résumé:
L’article examine les éléments moteurs qui commandent la dynamique d'utilisation du sol dans la région étudiée. Il
fait la projection des changements spatiaux entre l’espace géographique rural et urbain dans la métropole d'Abeokuta
au Nigeria. Des données primaires et secondaires ont été recueillies et analysées en utilisant la statistique descriptive,
les techniques du SIG et de télédétection. Les résultats des analyses indiquent une diminution de 19% des terres
cultivées en 1972, soit 8751,21 hectares; de 15% en 1984, soit 7144,32 hectares et de 8% en 2005, soit 3824,80
hectares. Entre 1972 et 1984 la population a augmenté de 75,16 % tandis que le taux d’occupation du sol a enregistré
une augmentation de 513,21%. Entre 1972 et 2005, on note une croissance de la population de 206,70% et un taux
d’occupation du sol de 924,81%. Par projection, au cours de l'année 2020 l’espace urbain occupera 20586,35
hectares. Il y aura un empiétement sur les autres affectations du sol. La superficie des terres cultivées sera réduite
à 2732,91 hectares comparativement aux 3824,80 hectares de 2005. L'étude conclut à l’existence d’une transformation soutenue de l’espace rural en espace urbain, résultat d’une croissance urbaine anarchique.
Keywords / Mots clés Rural transformation, urban growth, negative impacts, human activities, environment
Changement spatial rural, croissance urbaine, impacts négatifs, activités humaines, environnement
INTRODUCTION
According to Kaasik et al., (2011) landscape is a reflection of natural and socio-economic processes and that when this socio-economic situations change, it alters land use and leads to changed land use patterns. Reflected in the facts that the direction of the land use dynamics globally in the last two decades have been in favour of urban land development at the expense of the rural lands; as urbanization has been described as a major concern of many of the world regions (United Nations, 2008). It has equally been established
that more than half of the world population is currently living in an urban environment. Also the urban population will double by 2050, and will grow from 3.3 billion in 2007 to 6.4 billion in 2050 (United Nations, 2008). Ironically these new urban dwellers will concentrate in cities of developing nations (Ginkel, 2010). The importance of such increase in urban growth includes the loss of sizeable hectares of rural lands to urban development. The disturbing aspect of the issue was that the urban lands are still growing at alarming rates more than it was at the beginning of the century.
The ever-growing cities, their population increase and infrastructural developments together with inherent
activities in the urban area have led to the conversion of peripheral lands into what has been described as
Canadian Journal of Tropical Geography Revue Canadienne de Géographie Tropicale
CJTG (Online) / RCGT (En ligne) ISSN: 2292-4108 Vol. 4 (2): 22-33 http://laurentian.ca/cjtg
Article history/Histoire de l’article Received /Reçu: 04 February 2017 Received in revised form/Reçu dans la forme révisée: 10 May 2017 Accepted/Accepté: 21 July 2017 Available online/Disponible en ligne: 31 December 2017
CJTG/RCJT, Laurentian University/Université Laurentienne, Geography/Géographie, Sudbury, Ontario, P3E 2C6, Canada. ISSN : 2292-4108. Vol. 4(2) : 22-33. Copyright @ 2017 CJTG-RCGT, All rights reserved/Tous droits réservés.
23
urban-rural fringe or urban-rural continuum (Yaro, 2014). This has reduced the land for cultivation through excessive fragmentation and conversion of agricultural lands into non-farm lands. These conversions in the rural-urban fringes are a serious detriment on agricultural productivity (Yaro, 2014). For the purpose of
urban growth, much of the rural lands that should have been dedicated to agricultural use were transformed into permanent urban use, such as: road expansions, constructions, settlement growths and industrialization expansions.
At the turn of the century, the unplanned urban expansion has taken a heavy toll on the rural landscape
with its loss and irreversible conversion. The natural landcover which characterized the rural landscape has been replaced by the permanent landcover materials used in the urban areas. This replacement has caused the rural land users to cultivate on marginal lands, therefore shifting to the available forest lands which will eventually be overrun by urban sprawl. Since agriculture is an important economic activity in many parts of the world, especially in developing countries of sub-Saharan Africa and Asia (Naab et al., 2013). Nigeria’s farming is the mainstay of a large proportion of the population with over 70% of rural dwellers engaged in agricultural activities (Enaruvbe and Ige-Olumide, 2014). However as the cities grow, most
significantly in the developing world, their functions become diversified as well as their structures becoming complex. A city functions which includes commercial, administrative and manufacturing also includes other function that are carried out by the city but which are relegated to the background especially in the
developed countries (Yaro, 2014). Such regulated activities include; exploration of minerals, mining and other primary activities carried out in the area, however the focus of this paper is the loss of agricultural lands to urban development.
From the fore-going, the driving forces of landscape change are mobility, industrialization, urbanization
and globalization and these are all economically and politically driven (Burgi, et.al. 2004). The effects of rural land-loss are serious both in the present and in the future; the consequences in the immediate may include food security, human health; while in the future the capability and sustainability of Earth. Hence with unabated urban growth, most especially in the tropics and the finite land area, the land density shrink and it will continue until urgent actions are taken to address the dwindling fortunes of the rural land areas and the resultant rapid environmental changes (Adeleke, 2012). The rapid rate of environmental change
has however attracted the interest of the environmental managers and scientists because of its negative implications (Biro et al., 2013; Salemi et al., 2013; Yeshaneh et al., 2013; Zhang and Xu, 2014), which include loss of biological diversity, tropical deforestation, soil erosion and degradation, and subsequent climate change (Atu et al., 2013; Huang et al., 2013; Ogunowo and Oderinde, 2012). One of the identified drivers of such environmental change is the rapid urban growth and development as a result of the
uncontrolled population growth of the cities in the developing world (Adeleke, 2012). This problem of urban lands development has been one major factor of rural lands loss in the tropics and there is need to challenge
the imbalance occasioned by this one-sided growth in order to prevent the impending catastrophic which may include job losses among able bodied young men in the rural area who are engaged in agricultural practices and ultimately the irreversible consequences on the climate and by implication on the Earth function as the home of man. This paper examined the implications of the intense urban lands development and population growth on the dwindling rural lands in Abeokuta metropolis of Southwestern Nigeria as a case study in tropical environment.
THE STUDY AREA
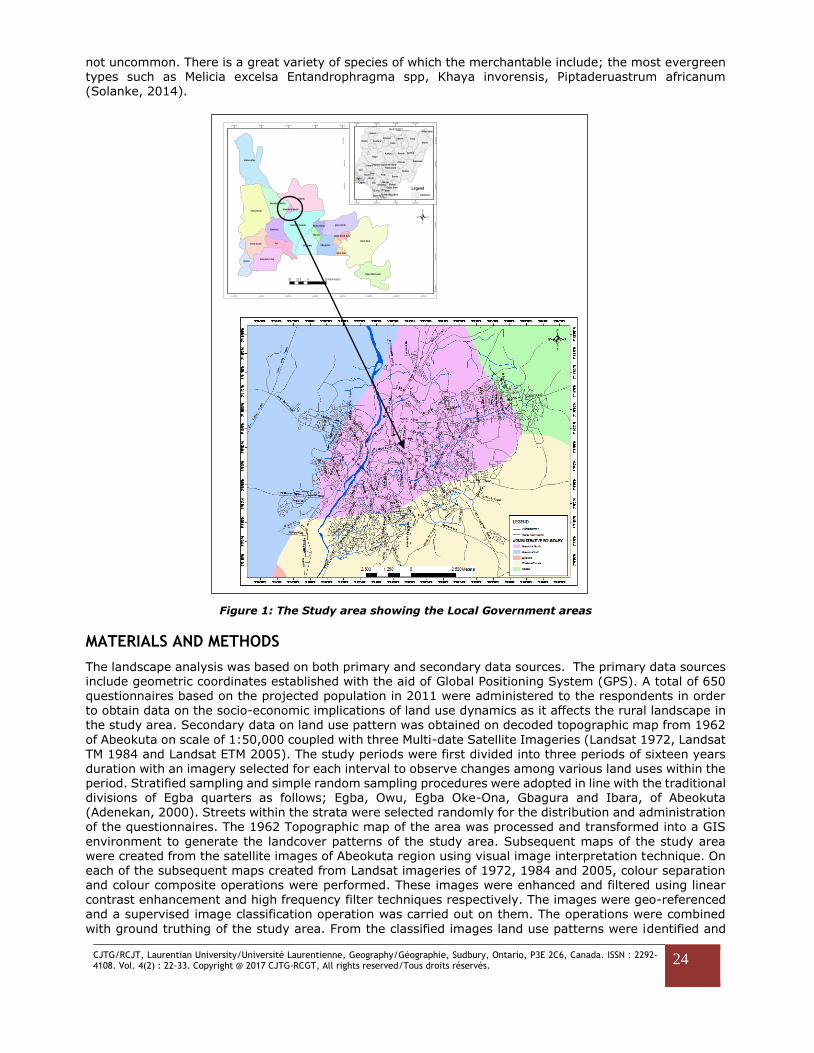
Abeokuta occupies an area of approximately 100 square kilometers, covering about three Local Government Areas of the State (Figure 1) with an estimated population of about 616,473 (NPC, 2011). The area lies within the rainforest belt of the tropics, between latitude 075 and 0720 N and longitude
0317 and 0327 E (Onakomaiya, 2000). The altitude ranges from 120 to 180m above sea level. The
dominant feature of the area is the Ogun River which flows from north to south draining the city through a network of smaller rivers such as Ona-Ibu River in the southeast, the Osun in the east, Yewa in the west and Ewekoro and Adiyan Rivers in the southwest (Figure 2) (Oyegoke et al., 2012). Abeokuta enjoys a tropical climate with distinct wet and dry seasons, with rainfall ranges from 1016mm to 1270mm (NEAFR, 2002, NiMet, 2016). It is underlain by both the crystalline basement rocks and the Cretaceous Sedimentary formation (Aketoyon et al., 2010). The vegetation of the area comprise of tall evergreen trees; like the
Swietenia Genus, Ttriplochiton scleroxylon, Diospyros, Lianas, Milicia excelsa, Entandrophragma cylindricum and Juglans Genus, with an undergrowth of lians) and other climbing plants which make it impossible to venture into. The forest protects the soil from erosion whereby a leave litters provides the soil with humus.
The economic value of the trees is enhanced by their long, straight and branched stems. Although, with the damp condition that exists inside the forest, damage by insects, fungi or other parasitic growths are
CJTG/RCJT, Laurentian University/Université Laurentienne, Geography/Géographie, Sudbury, Ontario, P3E 2C6, Canada. ISSN : 2292-4108. Vol. 4(2) : 22-33. Copyright @ 2017 CJTG-RCGT, All rights reserved/Tous droits réservés.
24
not uncommon. There is a great variety of species of which the merchantable include; the most evergreen types such as Melicia excelsa Entandrophragma spp, Khaya invorensis, Piptaderuastrum africanum (Solanke, 2014).
Figure 1: The Study area showing the Local Government areas
MATERIALS AND METHODS
The landscape analysis was based on both primary and secondary data sources. The primary data sources include geometric coordinates established with the aid of Global Positioning System (GPS). A total of 650 questionnaires based on the projected population in 2011 were administered to the respondents in order to obtain data on the socio-economic implications of land use dynamics as it affects the rural landscape in the study area. Secondary data on land use pattern was obtained on decoded topographic map from 1962
of Abeokuta on scale of 1:50,000 coupled with three Multi-date Satellite Imageries (Landsat 1972, Landsat
TM 1984 and Landsat ETM 2005). The study periods were first divided into three periods of sixteen years duration with an imagery selected for each interval to observe changes among various land uses within the period. Stratified sampling and simple random sampling procedures were adopted in line with the traditional divisions of Egba quarters as follows; Egba, Owu, Egba Oke-Ona, Gbagura and Ibara, of Abeokuta (Adenekan, 2000). Streets within the strata were selected randomly for the distribution and administration of the questionnaires. The 1962 Topographic map of the area was processed and transformed into a GIS
environment to generate the landcover patterns of the study area. Subsequent maps of the study area were created from the satellite images of Abeokuta region using visual image interpretation technique. On each of the subsequent maps created from Landsat imageries of 1972, 1984 and 2005, colour separation and colour composite operations were performed. These images were enhanced and filtered using linear contrast enhancement and high frequency filter techniques respectively. The images were geo-referenced and a supervised image classification operation was carried out on them. The operations were combined
with ground truthing of the study area. From the classified images land use patterns were identified and
Ijebu East
Odeda
Ifo
Yewa North
Imeko-Afon
Obafemi-Owode
Ipokia
Ijebu North
Ewekoro
Shagamu
Ado-Odo / Ota
Ogun Waterside
Yewa SouthOdogbolu
Abeokuta North
Ikenne
Ijebu Ode
Remo-North
Ijebu North-East
Abeokuta South
5°0'0"E
5°0'0"E
4°40'0"E
4°40'0"E
4°20'0"E
4°20'0"E
4°0'0"E
4°0'0"E
3°40'0"E
3°40'0"E
3°20'0"E
3°20'0"E
3°0'0"E
3°0'0"E
2°40'0"E
2°40'0"E
8°0
'0"N
8°0
'0"N
7°4
0'0
"N
7°4
0'0
"N
7°2
0'0
"N
7°2
0'0
"N
7°0
'0"N
7°0
'0"N
6°4
0'0
"N
6°4
0'0
"N
6°2
0'0
"N
6°2
0'0
"N
Niger
Borno
Yobe
Taraba
Bauchi
Oyo
Kebbi
Kogi
Kaduna
Kwara
Edo
Benue
Sokoto
ZamfaraKano
Plateau
Jigawa
Ogun
Adamawa
Katsina
Delta
Ondo
Gombe
Nassarawa
Cross River
Osun
Imo
Ekiti
Enugu
BayelsaRivers
Abia
EbonyiLagos
Akwa Ibom
Anambra
Water body
Federal Capital Territory
12°0'0"E
12°0'0"E
9°0'0"E
9°0'0"E
6°0'0"E
6°0'0"E
3°0'0"E
3°0'0"E
12
°0
'0"N
12
°0
'0"N
9°0
'0"N
9°0
'0"N
6°0
'0"N
6°0
'0"N
.
25 0 2512.5 Kilometers
Legend
NIGERIA
MAP INSET

CJTG/RCJT, Laurentian University/Université Laurentienne, Geography/Géographie, Sudbury, Ontario, P3E 2C6, Canada. ISSN : 2292-4108. Vol. 4(2) : 22-33. Copyright @ 2017 CJTG-RCGT, All rights reserved/Tous droits réservés.
25
digitized. The operation created eight classes of land uses which were arranged in layers as follows; light forest, forested wetlands, non-forested wetlands, shrubs, farmlands, settlements, bare ground / rock outcrops. Overlay operations were subsequently carried out to obtain and detect changes among the
imageries used; and linear regression of the variables obtained from the area coverage for each year. Abeokuta metropolis was outlined on the 1962 Topographic map, and on the satellite imageries to show the extent of its spatial growth on the rural lands during the study periods. The 1972, 1984 and 2005 population figures were estimated using the recommended 2.86% growth rate from the 1991 and 2006
census figures of the area (NPC 2007). The status of land use classes and the projected population for the year 2020 was obtained in order to observe the future status of the land use (MDG, 2007). The socio–economic implication of change was evaluated through the analysis of the questionnaires and dynamics of land use values and population between 1972 and 2005.
RESULTS AND DISCUSSION
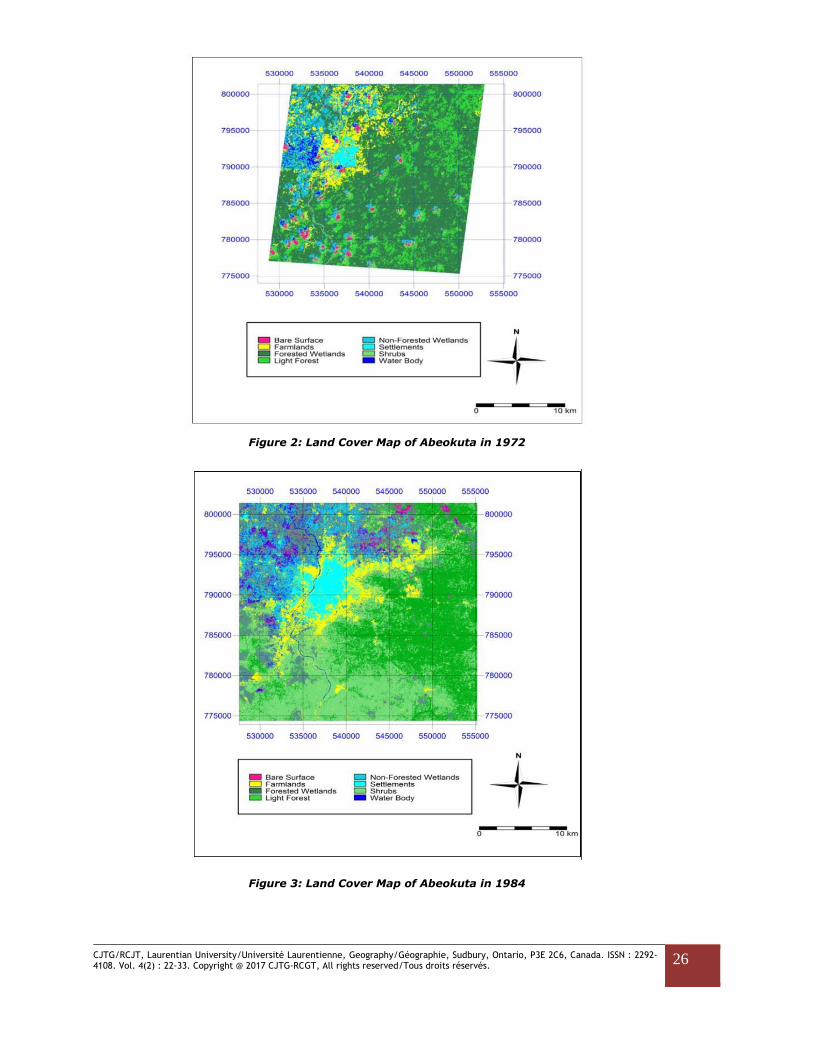
Table 1 illustrates the prevailing situation in 1972 with settlement lands taken up the smallest area of 1253.12 hectares (2.66%) and farmlands 8751.21 hectares (18.66%). The highest area was at the instance
of non-forested wetlands with total coverage of 10906.08 hectares (23.18%) and forested wetlands covered 6480.61 (13.77%). All these statistics depicted a rural setting with lower population of 172,090
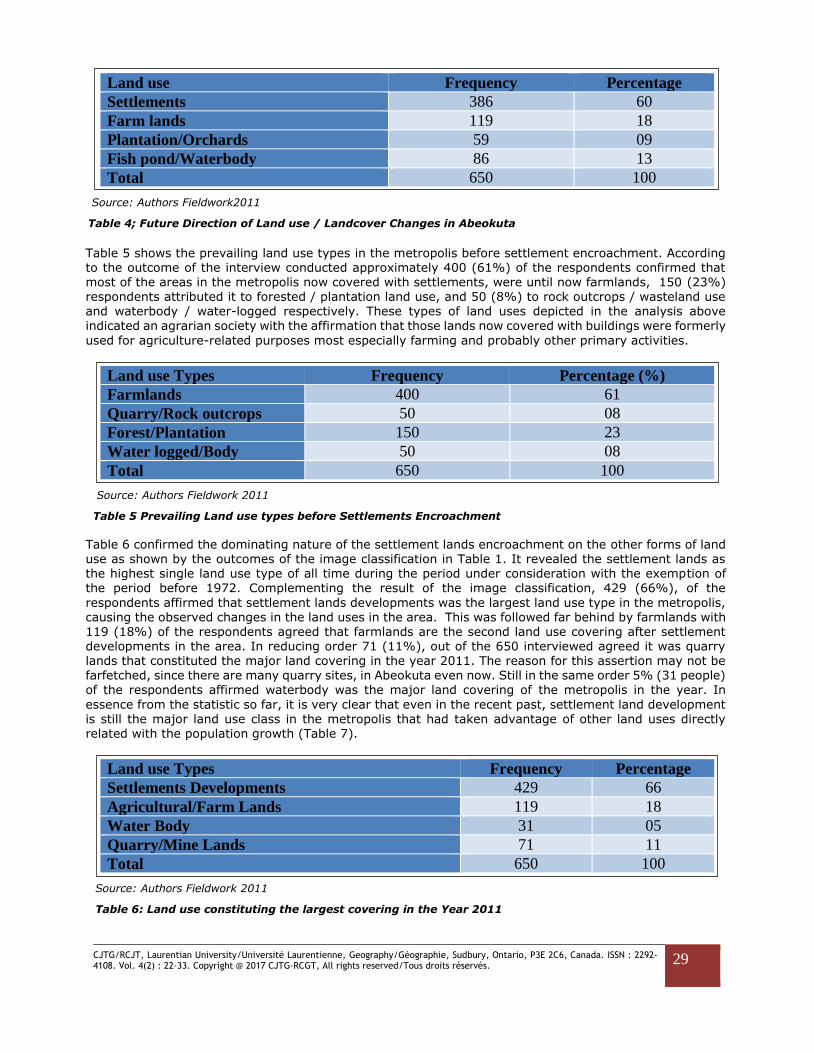
(refer to Table 7) who were predominantly local farmers. As the years progressed, specifically in the years 1984 and 2005, the population increased from 301,440 to 527,803 respectively, there was a corresponding decrease in the farmlands and other forest-related land uses. And there was a consistent rise in the settlement lands since more people represented the demand for more households (Figures: 3, 4 and 5). This confirmed the opinion expressed by Harcourt (1992) in Kenya that an increase in the number of the
people caused deforestation. However in 1984, there was a sharp deviation from what was obtained in 1972. This period (1976-1991) was the time Abeokuta assumed the status of state capital. In order to cater for the influx of people, the period witnessed a sharp increase in the area of lands taken up by settlement lands from 1253.12 hectares of 1972 (2.663%) to 7684.27 hectares in 1984 (16.33%). In the same view there is a proportional increased in the number of people from 172,090 in 1972 to 301,330 people in 1984. This was corroborated by Glin’s (1998) work on the emerging trends of increasing
encroachment of settlements related land uses on agricultural and natural land areas, and the detrimental consequences, among other things population related generation of pollution, through massive deforestation.
The increase in lands taken up by settlements continued into 2005, with 12,842.11 hectares (27.29%), of the total land area; a substantial increase from 7684.27 hectares occupied in the year 1984. This implied more households were being erected and lands occupied by other land cover were being encroached onto. Mostly affected were the farmlands which had their land coverage reduced from 7144.32 hectares in 1984
to 3824.80 hectares in 2005. Other land uses were not exempted in the encroachment by the settlement development due to rapid urbanization that was taking place (Table 1). This, according to Fritts (2005), highlighted the costs imposed on the society and environment as a whole by urbanization which included loss of wetlands that provided flood control and waste water renovation, ecosystem destruction and loss of agricultural lands.
Source: Image Classification Analysis
Table 1: Areal Coverage of the Land Use/Land Cover Classes between 1972 and 2005
CJTG/RCJT, Laurentian University/Université Laurentienne, Geography/Géographie, Sudbury, Ontario, P3E 2C6, Canada. ISSN : 2292-4108. Vol. 4(2) : 22-33. Copyright @ 2017 CJTG-RCGT, All rights reserved/Tous droits réservés.
26
Figure 2: Land Cover Map of Abeokuta in 1972
Figure 3: Land Cover Map of Abeokuta in 1984

CJTG/RCJT, Laurentian University/Université Laurentienne, Geography/Géographie, Sudbury, Ontario, P3E 2C6, Canada. ISSN : 2292-4108. Vol. 4(2) : 22-33. Copyright @ 2017 CJTG-RCGT, All rights reserved/Tous droits réservés.
27
Figure 4: Land Cover Map of Abeokuta in 2005
Figure 5: Projected Landcover map of the Study Area 2020

CJTG/RCJT, Laurentian University/Université Laurentienne, Geography/Géographie, Sudbury, Ontario, P3E 2C6, Canada. ISSN : 2292-4108. Vol. 4(2) : 22-33. Copyright @ 2017 CJTG-RCGT, All rights reserved/Tous droits réservés.
28
Table 2 confirmed the changes in land use and growths of settlement lands at the expense of other land use types between the years 1972 and 2005 as deduced from the result of the imagery classifications in Table 1. The response to the survey showed that 300 (47%) of respondents affirmed that major changes
in land use in the metropolis in the last thirty years was a heavy conversion of farmlands to settlement developments. According to Abebe, 2013 rapid urban growth and development in 2013 has been noted as an important driver of environmental change resulting from population growth, especially in developing countries. This has been associated with several environmental, social and economic consequences,
including climate change, depletion of agricultural resources and deforestation (Enaruvbe and Ige-Olumide, 2014). Related to this, 190 (29%) of the respondents also agreed that it was deliberate relocation of farming and other primary activities to the outskirt of the metropolis. Caused by the exigencies of other land use categories in the metropolis most especially settlement. Also 85 (13%) agreed that it was rock quarrying, mining and wastelands reclamation and developments that constituted the major land use shift, while 75 (11%) agreed it was indiscriminate forest removal. By and large, the result of the questionnaires survey confirmed the fact that land uses were changing, as expressed by the findings of the imageries
classification in Table 1. The import of all these according to Anene (2008) was that farmlands are absorbed into urban built-up areas at a yearly rate of 1.6 hectares per 1000 people in his study of urban-rural encroachment farmlands in England and Wales. Fellmeth (1973) recognized the loss of rural lands that once developed cannot easily be converted back to agricultural uses.
Land use Change Frequency Percentage %
Conversion of Farmlands to Settlement lands 300 46
Indiscriminate Forest removal 75 12
Rock Outcrops Quarrying/Mining 85 13
Deliberate relocation of Farming to the Outskirt 190 29
Total 650 100
Source: Author Fieldwork, 2011
Table 2; Major Land use Changes in the last 30 Years in the Metropolis
Table 3 revealed manners of land use changes to be expected in the year 2020. This is given the prevailing conditions in the metropolis. As it was the case with the previous years, there was a tendency that the rate
of urbanization that is ongoing in the metropolis will not be abated. According to the table by the year 2020, the settlements would have increased to 20586.35 hectares; non-forested wetlands encroached into and therefore will decrease to 7137.96 hectares, farmlands will decrease to 2732.91 hectares from 3824.80 of 2005 (See Figure 6). This was noted by Fritts (2005) that the cost implications to the society and the environment as a whole by urbanization, included loss of wetlands that provide flood control and wastewater renovation, ecosystem destruction and loss of agricultural lands. The current spate of urban
flooding and acute water shortage in Abeokuta and many other urban centers are a physical manifestation of the cost implication expressed by Fritts (2005).
Source: Image Classification Analysis
Table 3: Projected Land use / Landcover values for the Study Area in 2020 from 2005
Table 4 showed how respondents would use a piece of land if they were to acquire one in the future. The outcome revealed that 386 (60%) of the respondents interviewed would put these lands to settlements use. However 119 (18%) opted to use lands for farming, 59 (9%) for plantation / orchard and 86 (13%) for fish pond (waterbody). The outcomes above agreed with the findings of the projected land use / landcover value for the study area in 2020 (Table 3). At such a rate, as expressed by the respondents, it
is likely that the lands that will be devoted to settlements in the year 2020 may even be more than 20,586.35 hectares, at the detriment of other land use categories; most importantly agricultural lands.
Settlements Non-
Forested
Wetlands
Farmland
s
Forested
Wetlands
Shrub Bare
Surface
Light
Forest
Water
Body
2005 12842.11 7888.13 3824.80 4164.42 5953.66 2239.66 2065.87 8071.21
2020 20586.35 7137.96 2732.91 3650.08 9156.11 947.90 1512.99 8718.99
CJTG/RCJT, Laurentian University/Université Laurentienne, Geography/Géographie, Sudbury, Ontario, P3E 2C6, Canada. ISSN : 2292-4108. Vol. 4(2) : 22-33. Copyright @ 2017 CJTG-RCGT, All rights reserved/Tous droits réservés.
29
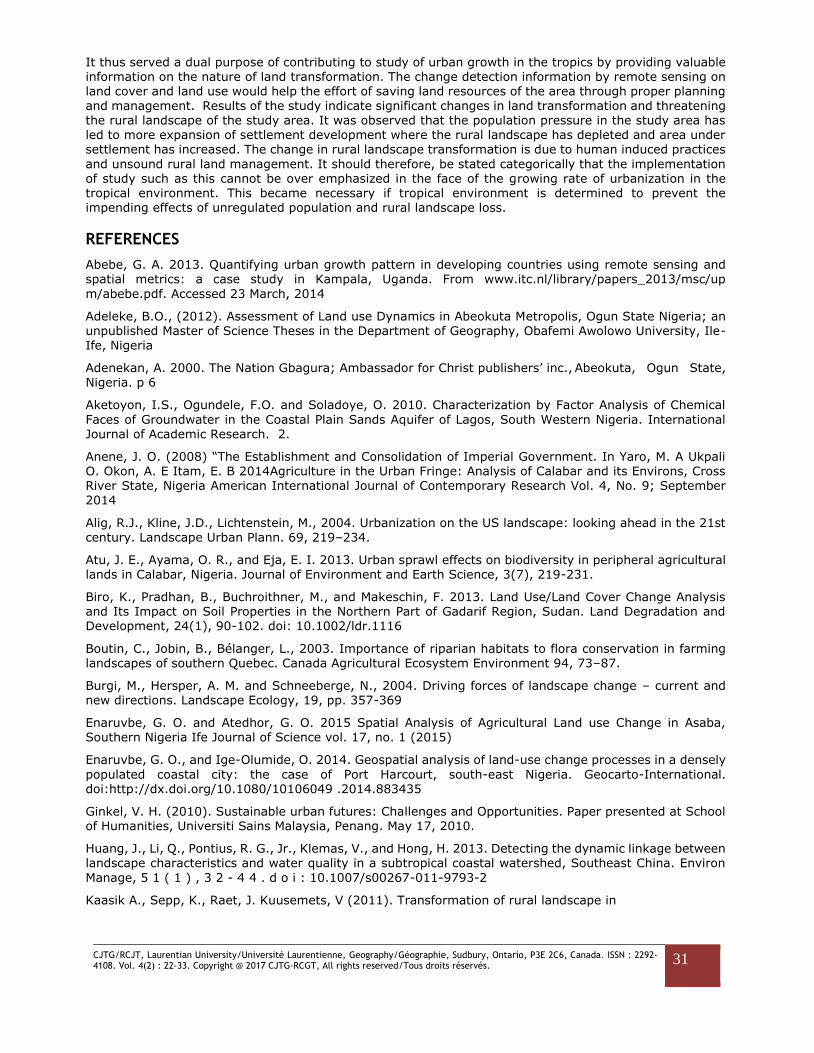
Land use Frequency Percentage
Settlements 386 60
Farm lands 119 18
Plantation/Orchards 59 09
Fish pond/Waterbody 86 13
Total 650 100
Source: Authors Fieldwork2011
Table 4; Future Direction of Land use / Landcover Changes in Abeokuta
Table 5 shows the prevailing land use types in the metropolis before settlement encroachment. According to the outcome of the interview conducted approximately 400 (61%) of the respondents confirmed that most of the areas in the metropolis now covered with settlements, were until now farmlands, 150 (23%) respondents attributed it to forested / plantation land use, and 50 (8%) to rock outcrops / wasteland use and waterbody / water-logged respectively. These types of land uses depicted in the analysis above
indicated an agrarian society with the affirmation that those lands now covered with buildings were formerly
used for agriculture-related purposes most especially farming and probably other primary activities.
Land use Types Frequency Percentage (%)
Farmlands 400 61
Quarry/Rock outcrops 50 08
Forest/Plantation 150 23
Water logged/Body 50 08
Total 650 100
Source: Authors Fieldwork 2011
Table 5 Prevailing Land use types before Settlements Encroachment
Table 6 confirmed the dominating nature of the settlement lands encroachment on the other forms of land use as shown by the outcomes of the image classification in Table 1. It revealed the settlement lands as the highest single land use type of all time during the period under consideration with the exemption of the period before 1972. Complementing the result of the image classification, 429 (66%), of the
respondents affirmed that settlement lands developments was the largest land use type in the metropolis, causing the observed changes in the land uses in the area. This was followed far behind by farmlands with 119 (18%) of the respondents agreed that farmlands are the second land use covering after settlement developments in the area. In reducing order 71 (11%), out of the 650 interviewed agreed it was quarry lands that constituted the major land covering in the year 2011. The reason for this assertion may not be farfetched, since there are many quarry sites, in Abeokuta even now. Still in the same order 5% (31 people) of the respondents affirmed waterbody was the major land covering of the metropolis in the year. In
essence from the statistic so far, it is very clear that even in the recent past, settlement land development is still the major land use class in the metropolis that had taken advantage of other land uses directly related with the population growth (Table 7).
Land use Types Frequency Percentage
Settlements Developments 429 66
Agricultural/Farm Lands 119 18
Water Body 31 05
Quarry/Mine Lands 71 11
Total 650 100
Source: Authors Fieldwork 2011
Table 6: Land use constituting the largest covering in the Year 2011

CJTG/RCJT, Laurentian University/Université Laurentienne, Geography/Géographie, Sudbury, Ontario, P3E 2C6, Canada. ISSN : 2292-4108. Vol. 4(2) : 22-33. Copyright @ 2017 CJTG-RCGT, All rights reserved/Tous droits réservés.
30
Population has always been one important factor in land use dynamics. An attempt was therefore made to single it out as a major cause of changes (Table 7). It was observed that as the population was growing it caused instability among various uses to which lands were put. For instance, in 1972 with a population of
Abeokuta of only 172,090 residents, only 1253.12 hectares of land was all that was required to meet the settlement needs of the people, of which 8751.21 hectares was for farming, an arrangement which typified an agrarian community. In 1984, when the population increased from 172,090 to 301,440, it triggered an increase in the settlement lands from 1253.12 hectares in 1972 to 7684.27 hectares, while farmlands
decreased continually. It is evident from Table 7 that the population kept increasing into the year 2005, with 527,802 people while the settlement lands increased to 12,842.11 hectares, whereas it was 7,684.27 hectares in year 1984. Other land use types were also affected either with increase or decrease in their coverage as revealed in Table 7. All the forest related coverage reduced from their previous extent of 1984 in the year 2005. As a result of human occupation, even farmlands were reduced from 7,144.32 hectares in 1984 to 3,824.80 hectares in 2005. Urban population growth has resulted in an increased pressure on land for housing and its related services (Devas and Rakodi, 1993).
Year Population/1000 (%)change Settlements/ha (%)change Farmlands % change
1972 172,090 _ 1253.12 _ 8751.21 -
1984 301440 75.16 7684.27 513.21 7144.32 -18.36
2005 527,802 75.09 12842.11 67.12 3824.80 -46.46
Source: Estimated from 1991 and 2006 population figures and image classification
Table 7: Population / settlements and farmlands growth of Abeokuta in 1972, 1984 and 2005
The results of the questionnaire surveys on the factors / forces responsible for the observed land use changes confirmed population increase as a major factor (Table 8). It was revealed that 381 (58%) of the respondents agreed that population increase and the need to accommodate the population was the main force responsible for the land use changes in the area. However, 151 (24%) respondents noted that increase in economic activities were responsible for the changes still as a result of growth in population.
Furthermore, 59 (9%) of the respondents agreed it was deliberate relocation of farming and other primary activities to the fringes, while another 9% equally agreed it was the creation of state and the assumption of state capital status by Abeokuta. It is evident that the major force responsible for the changes was population growth, which in collaboration with increase in settlement needs has resulted in subsequent loss of rural lands. This point was reasserted by the outcome of the remote sensing image classifications, and the various scholarly assertions over the years (Alig, et al., 2004; Burgi, et. al., 2004; Adeleke, 2012).
Source: Authors Fieldwork 2011
Table 8: Factors / Forces Responsible for the Land use Changes
CONCLUSION
This study describes land use dynamics and rural landscape transformations in southwestern Nigeria between 1972 and 2005. Landscape metrics has been analyzed to show the driving force of landscape transformation and showed the influence of unabated population growth in extending urban development on the surrounding rural lands. Through the adoption of the instruments such as geographic information
system, questionnaire survey and population data analyses in contemporary tropical environments, the study further revealed the state of affairs in the study area in particular and typical tropical environment in general.
Forces of Change Frequency Percentage
Population Increase and Settlement needs 381 58
Relocation of Farmlands to the Outskirt 59 09
Creation of State and assumption of Capital Status 59 09
Increase Economic Activities in the Town Centre 151 24
Total 650 100
CJTG/RCJT, Laurentian University/Université Laurentienne, Geography/Géographie, Sudbury, Ontario, P3E 2C6, Canada. ISSN : 2292-4108. Vol. 4(2) : 22-33. Copyright @ 2017 CJTG-RCGT, All rights reserved/Tous droits réservés.
31
It thus served a dual purpose of contributing to study of urban growth in the tropics by providing valuable information on the nature of land transformation. The change detection information by remote sensing on land cover and land use would help the effort of saving land resources of the area through proper planning
and management. Results of the study indicate significant changes in land transformation and threatening the rural landscape of the study area. It was observed that the population pressure in the study area has led to more expansion of settlement development where the rural landscape has depleted and area under settlement has increased. The change in rural landscape transformation is due to human induced practices
and unsound rural land management. It should therefore, be stated categorically that the implementation of study such as this cannot be over emphasized in the face of the growing rate of urbanization in the tropical environment. This became necessary if tropical environment is determined to prevent the impending effects of unregulated population and rural landscape loss.
REFERENCES
Abebe, G. A. 2013. Quantifying urban growth pattern in developing countries using remote sensing and spatial metrics: a case study in Kampala, Uganda. From www.itc.nl/library/papers_2013/msc/up
m/abebe.pdf. Accessed 23 March, 2014
Adeleke, B.O., (2012). Assessment of Land use Dynamics in Abeokuta Metropolis, Ogun State Nigeria; an unpublished Master of Science Theses in the Department of Geography, Obafemi Awolowo University, Ile-Ife, Nigeria
Adenekan, A. 2000. The Nation Gbagura; Ambassador for Christ publishers’ inc., Abeokuta, Ogun State, Nigeria. p 6
Aketoyon, I.S., Ogundele, F.O. and Soladoye, O. 2010. Characterization by Factor Analysis of Chemical
Faces of Groundwater in the Coastal Plain Sands Aquifer of Lagos, South Western Nigeria. International Journal of Academic Research. 2.
Anene, J. O. (2008) “The Establishment and Consolidation of Imperial Government. In Yaro, M. A Ukpali O. Okon, A. E Itam, E. B 2014Agriculture in the Urban Fringe: Analysis of Calabar and its Environs, Cross River State, Nigeria American International Journal of Contemporary Research Vol. 4, No. 9; September 2014
Alig, R.J., Kline, J.D., Lichtenstein, M., 2004. Urbanization on the US landscape: looking ahead in the 21st
century. Landscape Urban Plann. 69, 219–234.
Atu, J. E., Ayama, O. R., and Eja, E. I. 2013. Urban sprawl effects on biodiversity in peripheral agricultural lands in Calabar, Nigeria. Journal of Environment and Earth Science, 3(7), 219-231.
Biro, K., Pradhan, B., Buchroithner, M., and Makeschin, F. 2013. Land Use/Land Cover Change Analysis and Its Impact on Soil Properties in the Northern Part of Gadarif Region, Sudan. Land Degradation and Development, 24(1), 90-102. doi: 10.1002/ldr.1116
Boutin, C., Jobin, B., Bélanger, L., 2003. Importance of riparian habitats to flora conservation in farming landscapes of southern Quebec. Canada Agricultural Ecosystem Environment 94, 73–87.
Burgi, M., Hersper, A. M. and Schneeberge, N., 2004. Driving forces of landscape change – current and new directions. Landscape Ecology, 19, pp. 357-369
Enaruvbe, G. O. and Atedhor, G. O. 2015 Spatial Analysis of Agricultural Land use Change in Asaba, Southern Nigeria Ife Journal of Science vol. 17, no. 1 (2015)
Enaruvbe, G. O., and Ige-Olumide, O. 2014. Geospatial analysis of land-use change processes in a densely
populated coastal city: the case of Port Harcourt, south-east Nigeria. Geocarto-International. doi:http://dx.doi.org/10.1080/10106049 .2014.883435
Ginkel, V. H. (2010). Sustainable urban futures: Challenges and Opportunities. Paper presented at School of Humanities, Universiti Sains Malaysia, Penang. May 17, 2010.
Huang, J., Li, Q., Pontius, R. G., Jr., Klemas, V., and Hong, H. 2013. Detecting the dynamic linkage between landscape characteristics and water quality in a subtropical coastal watershed, Southeast China. Environ
Manage, 5 1 ( 1 ) , 3 2 - 4 4 . d o i : 10.1007/s00267-011-9793-2
Kaasik A., Sepp, K., Raet, J. Kuusemets, V (2011). Transformation of rural landscape in
CJTG/RCJT, Laurentian University/Université Laurentienne, Geography/Géographie, Sudbury, Ontario, P3E 2C6, Canada. ISSN : 2292-4108. Vol. 4(2) : 22-33. Copyright @ 2017 CJTG-RCGT, All rights reserved/Tous droits réservés.
32
Hiiumaa since 1956: consequences to open and half-open semi-natural habitats. Ekológia (Bratislava), Vol. 30, No. 2, p. 257–268
Naab, F. Z., Dinye, R. D., and Kasanga, R. K. 2013. Urbanisation and its impact on agricultural lands in growing cities in developing countries: A case study of Tamale in Ghana. Modern Social Science Journal, 2(2), 256-287.
Nigeria Environmental Analysis Final Report (NEAFR), 2002 under USAID Contract No. LAG-I-00-99-00013-00 Biodiversity and Sustainable Forestry (BIOFOR) Indefinite Quantity Contract (IQC). P 10.
Nigeria Metrological Agency (NiMet) 2016. First Quarter Weather Bulletin for 2015. January – March 2014. www.nimet.ng.gov. accessed July 2016
Ogunowo, C. O., and Oderinde, F. O. 2012. S u s t a i n a b l e d e v e l o p m e n t a n d management of infrastructure for effective transformation of rural communities in Nigeria: Implications for food security. Ozean Journal of Social Sciences, 5(3), 87-94.
Ryan, R.L., Erickson, D.L., De Young, R., 2003. Farmers’ motivations for adopting conservation practices along riparian zones in a Mid-western agricultural watershed. Journal of Environmental Planning
Management. 46 (1), 19–37.
Salemi, L. F., Groppo, J. D., Trevisan, R., de Moraes, J. M., de Barros Ferraz, S. F., Villani, J. P., Duarte-Neto, P. J., and Martinelli, L. A. 2013. Land-use change in t h e A t l an t i c r ai n f o re st re g i o n : Consequences for the hydrology of small catchments. Journal of Hydrology, 499, 100- 109. doi: 10.1016/j.jhydrol.2013.06.049
Solanke, M.O 2014. Urban Socio-Economic Development And Intra-City Travel In Ogun State, Nigeria. Ethiopian Journal of Environmental Studies & Management, 7, 202 – 209.
Onakomaiya, S.O, Oyesiku, K., Jegede, J. 2000. Ogun State in maps. Geography, Regional Planning Dept. Olabisi Onabanjo University, Ago Iwoye: Rex Chales Publication Ibadan. PP 184-187
Oyegoke, S.O, and Sojobi, A.O 2012. Developing Appropriate Techniques to Alleviate the Ogun River Network Annual Flooding Problems, International Journal of Scientific & Engineering Research, 3, 1-7
United Nations. (2008). World Urbanization Prospects: The 2007 Revision. [Online] Available: http://www.unpopulation.org (April 20, 2011)
Yaro, M. A Ukpali O. Okon, A. E Itam, E. B 2014Agriculture in the Urban Fringe: Analysis of Calabar and its Environs, Cross River State, Nigeria American International Journal of Contemporary Research Vol. 4, No. 9; September 2014
Yeshaneh, E., Wagner, W., Exner-Kittridge, M., Legesse, D., and Blöschl, G. 2013. Identifying Land Use/Cover Dynamics in the Koga Catchment, Ethiopia, from Multi-Scale Data, and Implications for Environmental Change. I S P R S International Journal of Geo-Information, 2(2), 302-323.
Zhang, Y., and Xu, B. 2014. Spatiotemporal analysis of land use/cover changes in Nanchang area, China.
International Journal of Digital Earth, 1-22. doi: 10.1080/17538947.2014.894145
To cite this article
Electronic reference Benjamin Oluwafemi ADELEKE, Oluwagbenga O.Isaac ORIMOOGUNJE & Adekunle Adebola SHOTE (2017).
« Land use dynamics and rural landscape transformations in southwestern Nigeria ». Canadian journal of tropical geography/Revue canadienne de géographie tropicale [Online], Vol. (4) 2. Online in December 31, 2017, pp. 22-33. URL: http://laurentian.ca/cjtg
Authors
Benjamin Oluwafemi ADELEKE Department of Geography Obafemi Awolowo University, Ile-Ife, Nigeria

CJTG/RCJT, Laurentian University/Université Laurentienne, Geography/Géographie, Sudbury, Ontario, P3E 2C6, Canada. ISSN : 2292-4108. Vol. 4(2) : 22-33. Copyright @ 2017 CJTG-RCGT, All rights reserved/Tous droits réservés.
33
Oluwagbenga O.Isaac ORIMOOGUNJE Department of Geography Obafemi Awolowo University, Ile-Ife, Nigeria,
[email protected] Adekunle Adebola SHOTE GIS Unit Ogun State Water Corporation Headquarters
Abeokuta, Nigeria [email protected] [email protected]