Embed Size (px)
Citation preview
CANADA’S ELECTRICITY INDUSTRY
Table of Contents
Page 2
• Table of Contents• The Canadian Electricity Association (CEA)• CEA’s Corporate Utility Members• CEA Corporate Partners Program Membership• CEA Mission Statement• CEA Strategic Goals• Canada’s Multi-Jurisdictional Environment• Canada’s Market Structure• North American Electric Reliability Corporation
(NERC) Regions• Electricity Demand in Canada by Sector, 2012• Electricity Demand in Canada by Sector, 1990 - 2011• Electricity Generation in Canada by Fuel Type, 2012• Electricity Generation in Canada by Fuel Type, 1990
- 2012• Electricity Generation in Canada by Province and
Fuel Type, 2012• Canada-US Electricity Trade Volume, 1990 – 2012• Canada-US Natural Gas Trade Volume, 1990 – 2012• Canada-US Natural Gas Trade Volume, 1998 – 2010• Canada-US Electricity Trade Revenue, 1990 – 2012• Canada-US Natural Gas Trade Revenue, 1990 – 2012• Canada-US Natural Gas Trade Revenue, 2002 – 2012• Canada-US Natural Gas Export/Import prices, 2002
– 2010• Canada-US Electricity Export/Import prices, 1997 –
2012• Electricity Exports and Imports between Canada
and the U.S.• Major Canada-U.S. Transmission Interconnections• The Integrated North American Grid
• Transmission Lines in Canada Length by Voltage, 1990 - 2008
• Utility Investment in Canada’s Transmission & Distribution Cables & Lines, 1998 - 2010
• Electric Power Generation, Transmission and Distribution Sector Contribution to Canada’s GDP, 1990 – 2012
• Capital Investment in Canada’s Electric Power Sector, 1990 – 2012
• Electric Sector Environmental Protection Expenditures by type, 2010
• Environmental Protection Expenditures by the Electric Power Sector, 1996 – 2010
• Greenhouse Gas (GHG) Emissions in Canada by Sector, 2012
• Greenhouse Gas (GHG) Emissions in Canada for Energy Sector, 2012
• CO2 Emissions for Public Heat and Utility Sector, 2012
• Utility Generated Electricity by Source and GHG• Nitrogen Oxide (NOx) Emissions in Canada by
Sources, 2012• Sulphur Oxide (SOx) Emissions in Canada by
Sources, 2012• Manitoba-Minnesota Transmission Project• Mercury Emissions in Canada by Sources, 2012• Electric Sector Mercury Emissions in Canada, 1990
- 2012• Particulate Matter (PM2.5) Emissions in Canada by
Sources, 2012• Electric Sector Particulate Matter (PM) Emissions in
Canada, 1990 - 2012• Greenhouse Gas Emissions in Canada and the US
by Sector, 2012• Utility-Generated Electricity by Source and GHG
• Electricity Generating Capacity in the US and Canada by Fuel Type,1 2013
• Electricity Generation in the US and Canada by Fuel Type,1 2013
• Building the Next Generation of Infrastructure: Capital Investment Requirements
• Active MPMO Electricity Sector Projects• Active MPMO Electricity Sector Projects – indirect
relevance• Active MPMO Electricity Sector Projects - New• Canada’s Regulatory Regime for Large Energy
Projects• Average Residential Electricity Price in Canada,
1998 – 2013 (cents/kWh)• Selected World Residential Electricity Prices, 2013• Selected World Industrial Electricity Prices, 2013• The Percentage Change in Household Expenditures
2000-2012• Canada’s Future Residential Electricity Needs• Low Emission and Sustainable Technologies Used
for Electricity Generation in Canada• Canadian Electricity Statistics• Installed Wind Capacity in Canada as of April 2013• Existing Coal Facilities in Canada – End of Life and
Regulatory Shut Down• Proposed Regulations to address GHG emissions
from coal-fired electricity• The CEA Councils• Energy Efficiency• Smart Grid• Economic Value• Electricity in Canada at a Glance• For More Information...
The Canadian Electricity Association (CEA)
• Founded in 1891, the Canadian Electricity Association is the national forum and voice of the evolving electricity business in Canada.
• Mission Statement: A safe, secure, reliable, sustainable and competitively-priced supply of electricity is essential to Canada’s prosperity.
Page 3
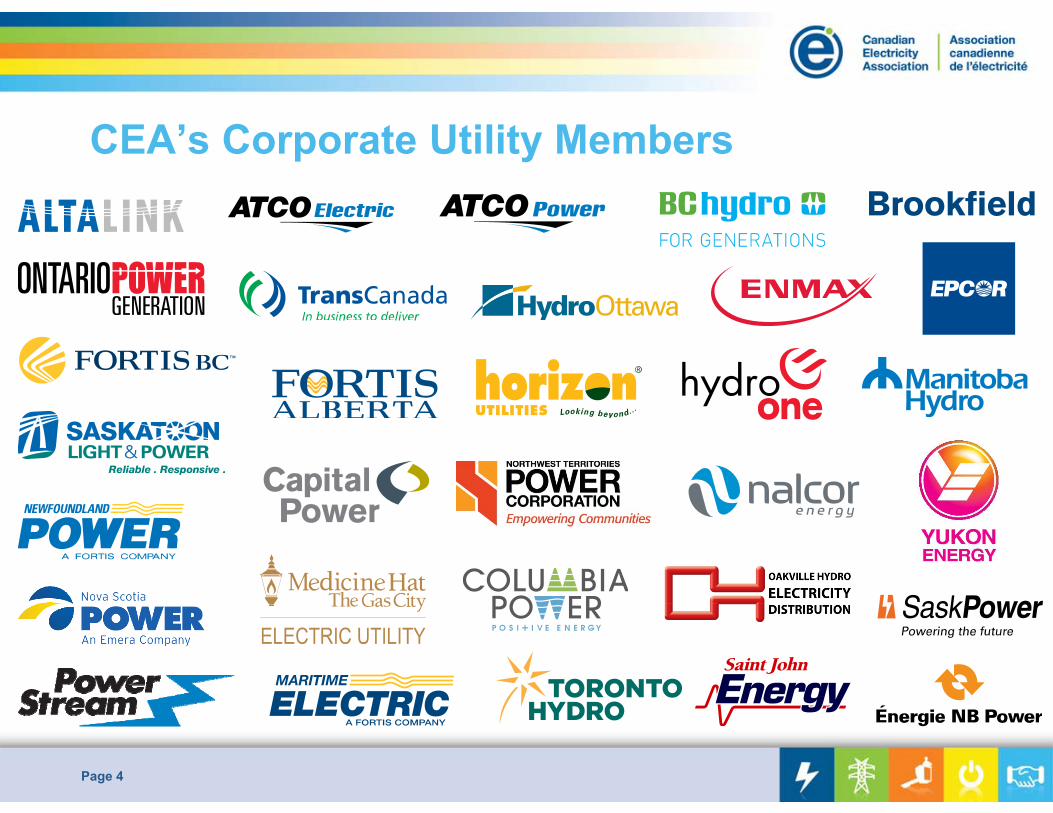
CEA’s Corporate Utility Members
Page 4
CEA Corporate Partners Program Membership
Page 5

CEA Corporate Partners Program Membership
Page 6
CEA Mission Statement
A safe, secure, reliable, sustainable and competitively priced supply of electricity is essential to Canada’s prosperity. CEA is the voice of the Canadian electricity industry, promoting electricity as the critical enabler of the economy and Canadians’ expectations for an enhanced quality of life.
Page 7
CEA Strategic Goals
Infrastructure – Ability to build needed electricity infrastructure, to meet growing demand and replace aging assets.
Energy Efficiency – Ability to provide options to customers to assist them in using electricity more efficiently, manage costs and minimize environmental impacts.
Technology – Ability to maximize and deploy leading-edge technologies.
Regulation – Need for more coordinated, effective and efficient regulatory regimes within and between governments, and more timely decisions.
Environment – Need for holistic approach and greater regulatory coherence on environmental issues.
Security – Need to ensure the long-term security, reliability and stability of the electricity system.
Page 8
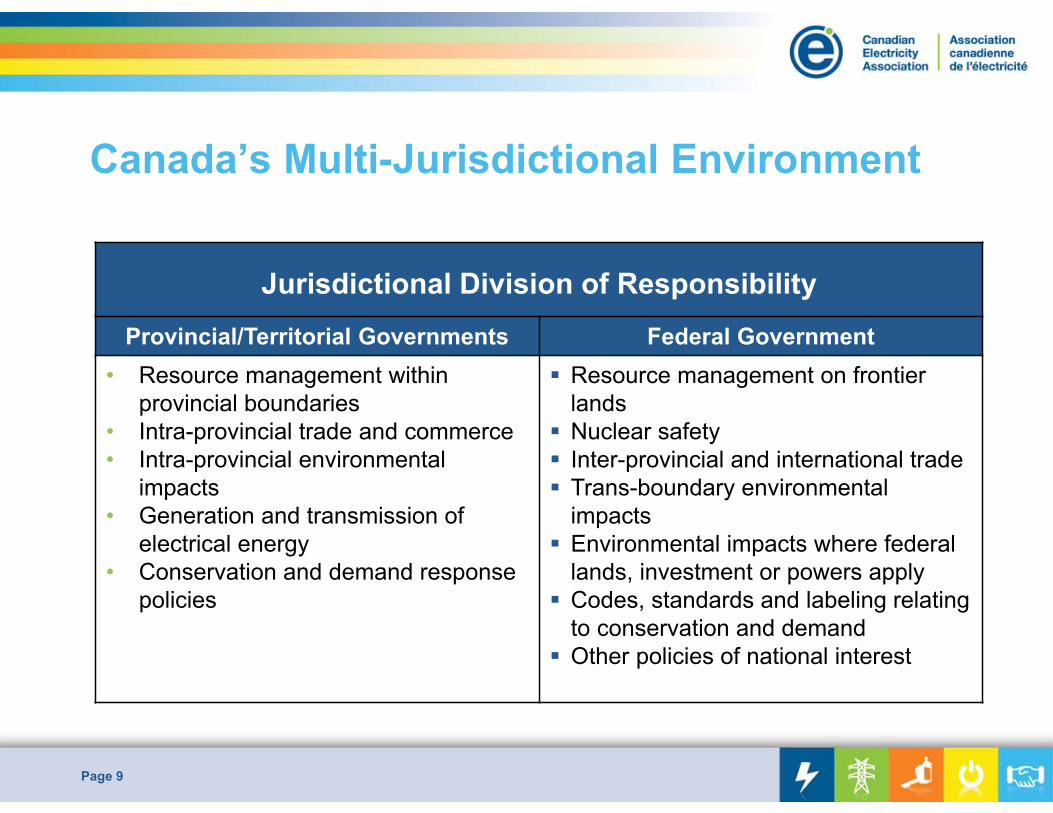
Canada’s Multi-Jurisdictional Environment
Page 9
Jurisdictional Division of ResponsibilityProvincial/Territorial Governments Federal Government
• Resource management within provincial boundaries
• Intra-provincial trade and commerce • Intra-provincial environmental
impacts• Generation and transmission of
electrical energy• Conservation and demand response
policies
Resource management on frontier lands
Nuclear safety Inter-provincial and international trade Trans-boundary environmental
impacts Environmental impacts where federal
lands, investment or powers apply Codes, standards and labeling relating
to conservation and demand Other policies of national interest
Page 10
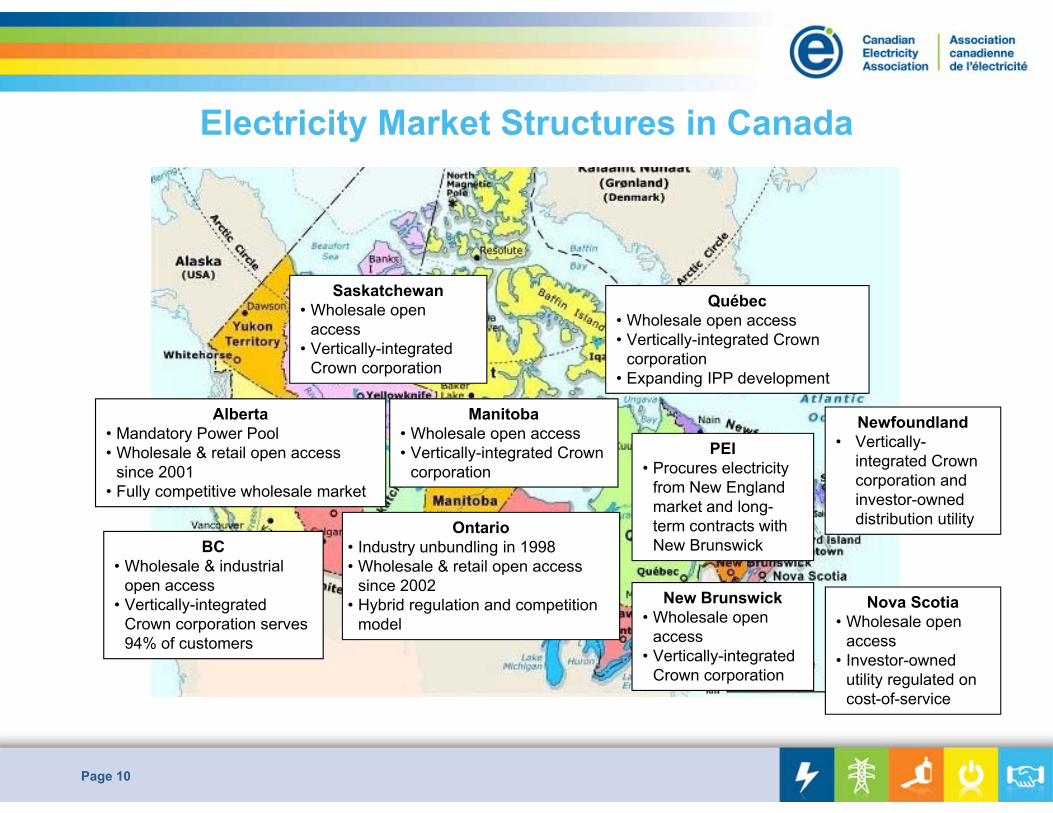
Saskatchewan• Wholesale open
access • Vertically-integrated
Crown corporation
Alberta• Mandatory Power Pool• Wholesale & retail open access
since 2001• Fully competitive wholesale market
Manitoba• Wholesale open access• Vertically-integrated Crown
corporation
Ontario• Industry unbundling in 1998• Wholesale & retail open access
since 2002• Hybrid regulation and competition
model
Québec• Wholesale open access • Vertically-integrated Crown
corporation• Expanding IPP development
Newfoundland• Vertically-
integrated Crown corporation and investor-owned distribution utility
New Brunswick• Wholesale open
access• Vertically-integrated
Crown corporation
Nova Scotia• Wholesale open
access• Investor-owned
utility regulated on cost-of-service
BC• Wholesale & industrial
open access• Vertically-integrated
Crown corporation serves 94% of customers
PEI• Procures electricity
from New England market and long-term contracts with New Brunswick
Electricity Market Structures in Canada
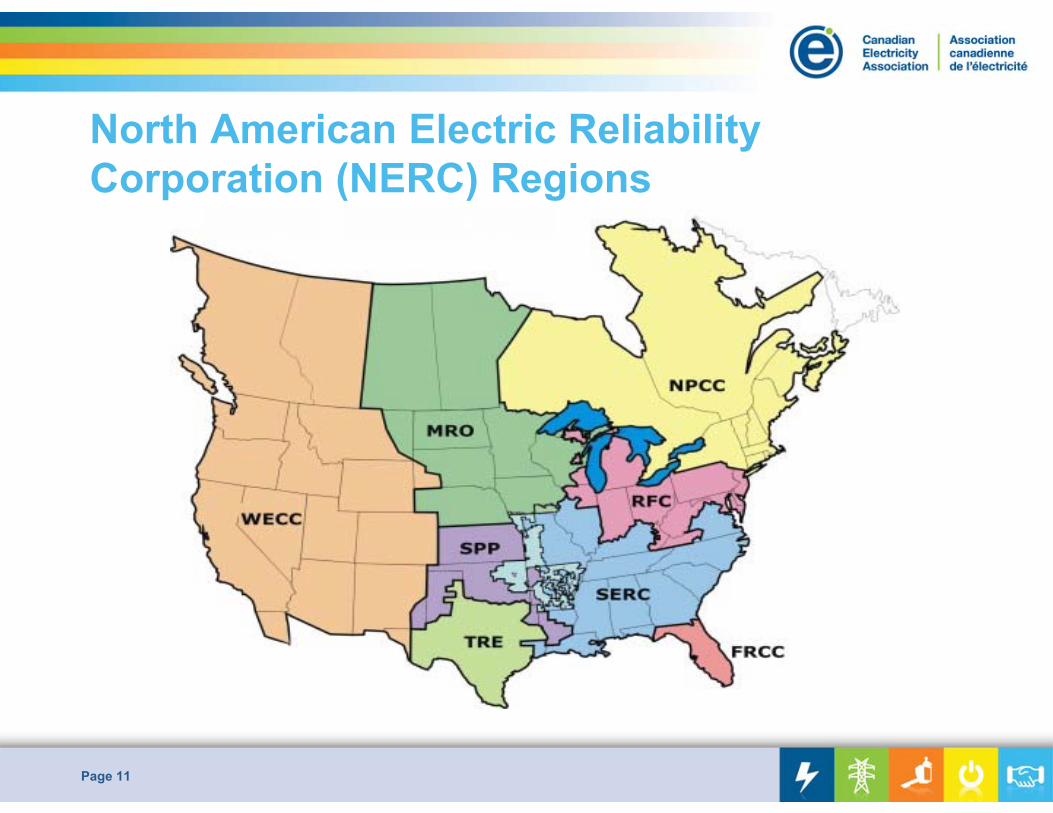
North American Electric Reliability Corporation (NERC) Regions
Page 11
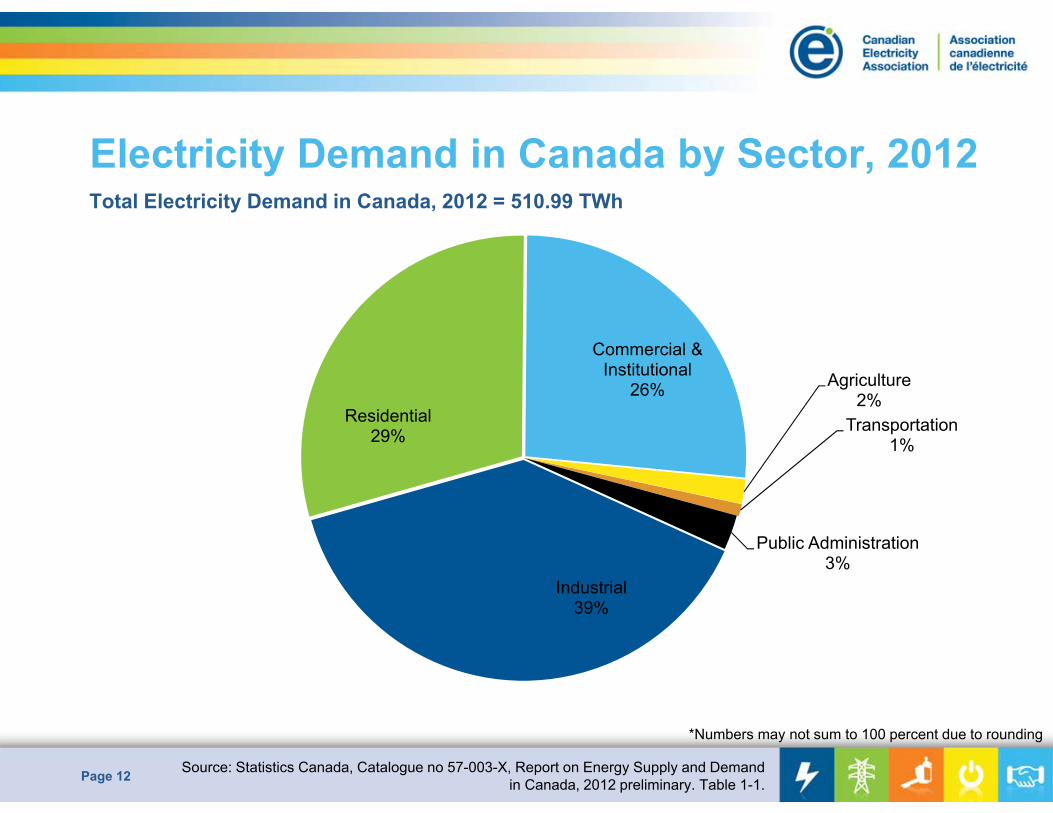
Electricity Demand in Canada by Sector, 2012
Page 12
Transportation1%
Public Administration3%
Industrial39%
Residential29%
Commercial & Institutional
26% Agriculture2%
Total Electricity Demand in Canada, 2012 = 510.99 TWh
*Numbers may not sum to 100 percent due to rounding
Source: Statistics Canada, Catalogue no 57-003-X, Report on Energy Supply and Demand in Canada, 2012 preliminary. Table 1-1.

Electricity Demand in Canada by Sector, 1990 - 2012
Page 13
Total Electricity Demand in Canada, 2012 = 510.99 TWh
0
100
200
300
400
500
600
1990 1991 1992 1993 1994 1995 1996 1997 1998 1999 2000 2001 2002 2003 2004 2005 2006 2007 2008 2009 2011 2012
Dem
and (TWh)
Commercial & Institutional AgriculturePublic Administration ResidentialTransportation Industrial
Source: Statistics Canada, Energy Statistics Handbook, Q4:2012 & Statistics Canada, Catalogue no 57-003-X, Report on Energy Supply and Demand in Canada, 2012 preliminary
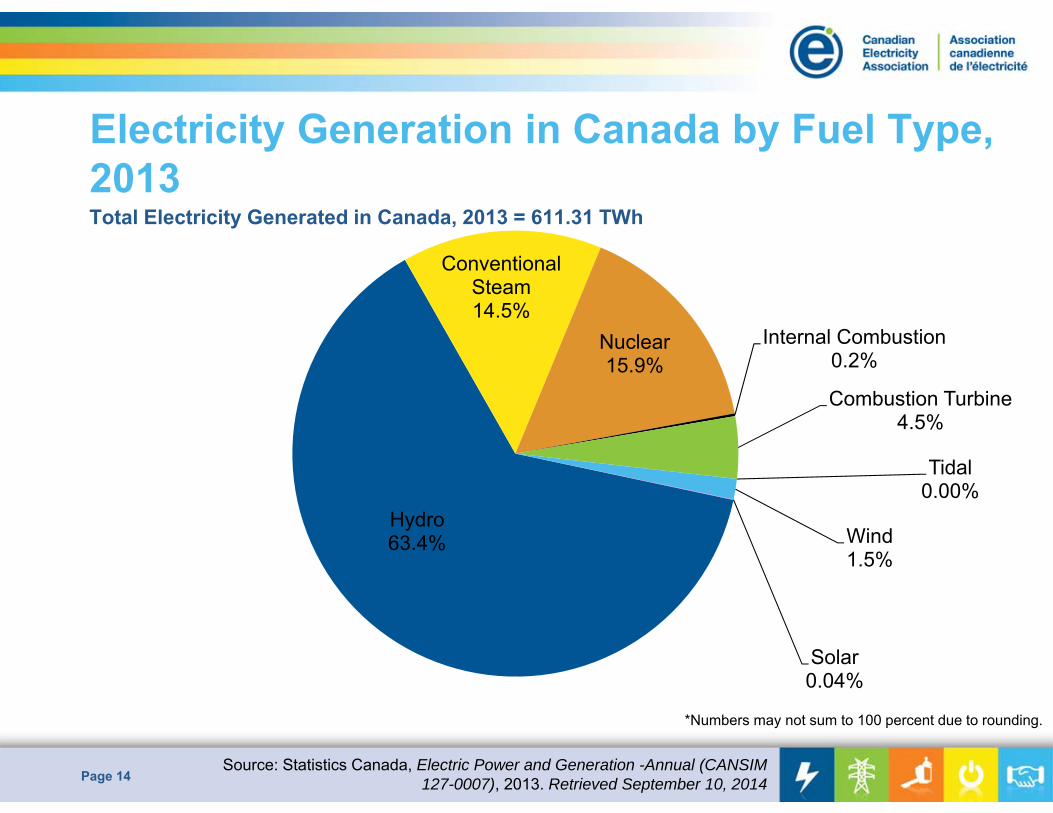
Electricity Generation in Canada by Fuel Type, 2013
Page 14
Hydro63.4%
Conventional Steam14.5%
Nuclear15.9%
Internal Combustion0.2%
Combustion Turbine4.5%
Tidal0.00%
Wind1.5%
Solar0.04%
Total Electricity Generated in Canada, 2013 = 611.31 TWh
*Numbers may not sum to 100 percent due to rounding.
Source: Statistics Canada, Electric Power and Generation -Annual (CANSIM 127-0007), 2013. Retrieved September 10, 2014
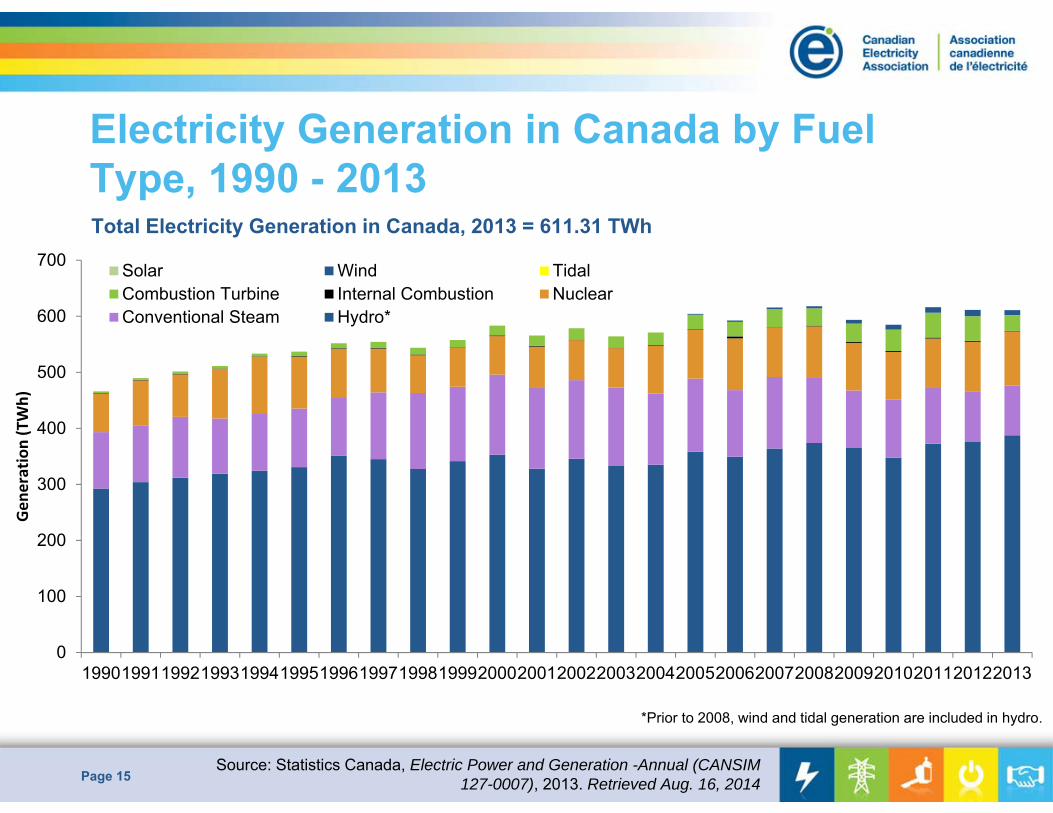
Electricity Generation in Canada by Fuel Type, 1990 - 2013
Page 15
0
100
200
300
400
500
600
700
199019911992199319941995199619971998199920002001200220032004200520062007200820092010201120122013
Gen
eration (TWh)
Solar Wind TidalCombustion Turbine Internal Combustion NuclearConventional Steam Hydro*
Total Electricity Generation in Canada, 2013 = 611.31 TWh
*Prior to 2008, wind and tidal generation are included in hydro.
Source: Statistics Canada, Electric Power and Generation -Annual (CANSIM 127-0007), 2013. Retrieved Aug. 16, 2014
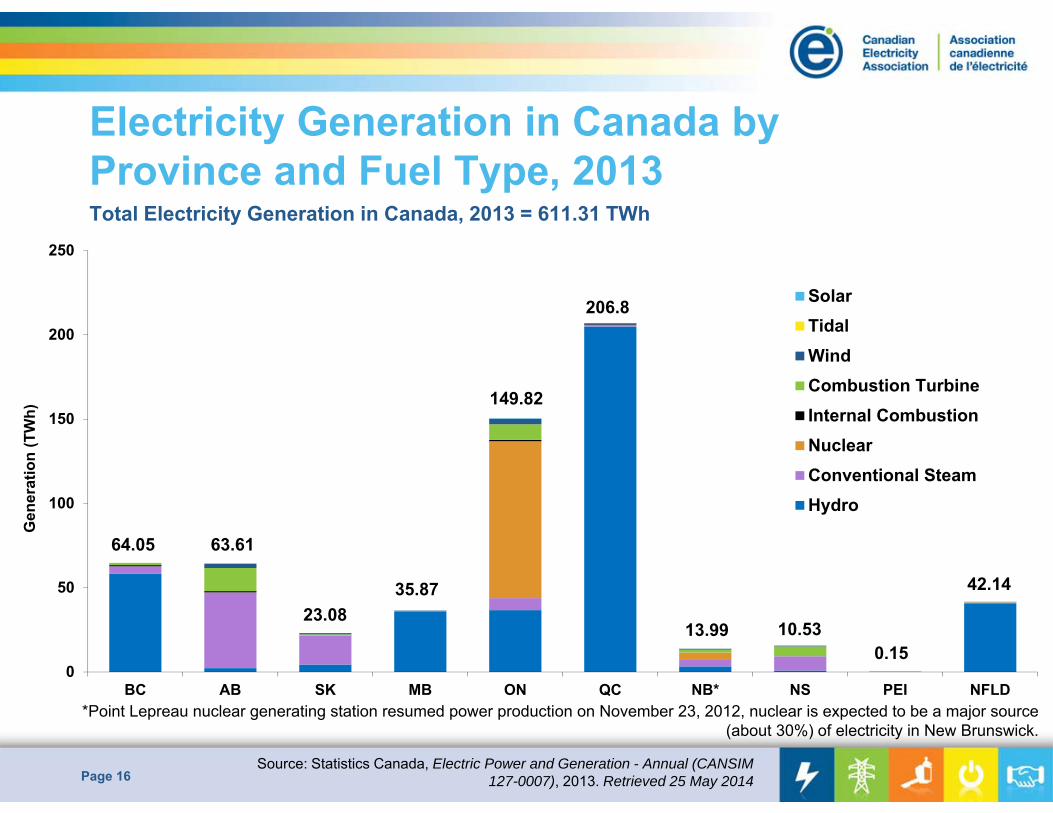
Electricity Generation in Canada by Province and Fuel Type, 2013
Page 16
Total Electricity Generation in Canada, 2013 = 611.31 TWh
0
50
100
150
200
250
BC AB SK MB ON QC NB* NS PEI NFLD
Gen
erat
ion
(TW
h)
SolarTidalWindCombustion TurbineInternal CombustionNuclearConventional SteamHydro
Source: Statistics Canada, Electric Power and Generation - Annual (CANSIM 127-0007), 2013. Retrieved 25 May 2014
63.6164.05
35.87
13.99
42.14
0.15
149.82
10.53
206.8
23.08
*Point Lepreau nuclear generating station resumed power production on November 23, 2012, nuclear is expected to be a major source (about 30%) of electricity in New Brunswick.
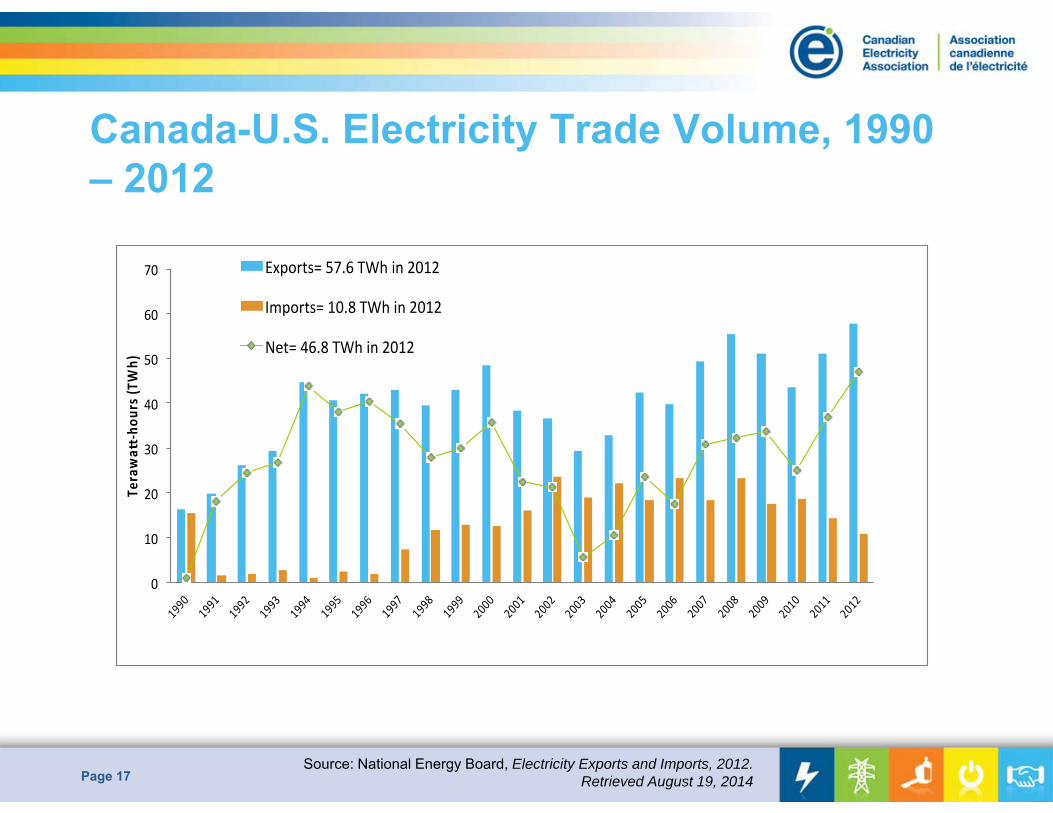
Canada-U.S. Electricity Trade Volume, 1990 – 2012
Page 17Source: National Energy Board, Electricity Exports and Imports, 2012.
Retrieved August 19, 2014
0
10
20
30
40
50
60
70
1990
19
91
1992
19
93
1994
19
95
1996
19
97
1998
19
99
2000
20
01
2002
20
03
2004
20
05
2006
20
07
2008
20
09
2010
20
11
2012
Terawa
‐hou
rs (T
Wh)
Exports= 57.6 TWh in 2012
Imports= 10.8 TWh in 2012
Net= 46.8 TWh in 2012
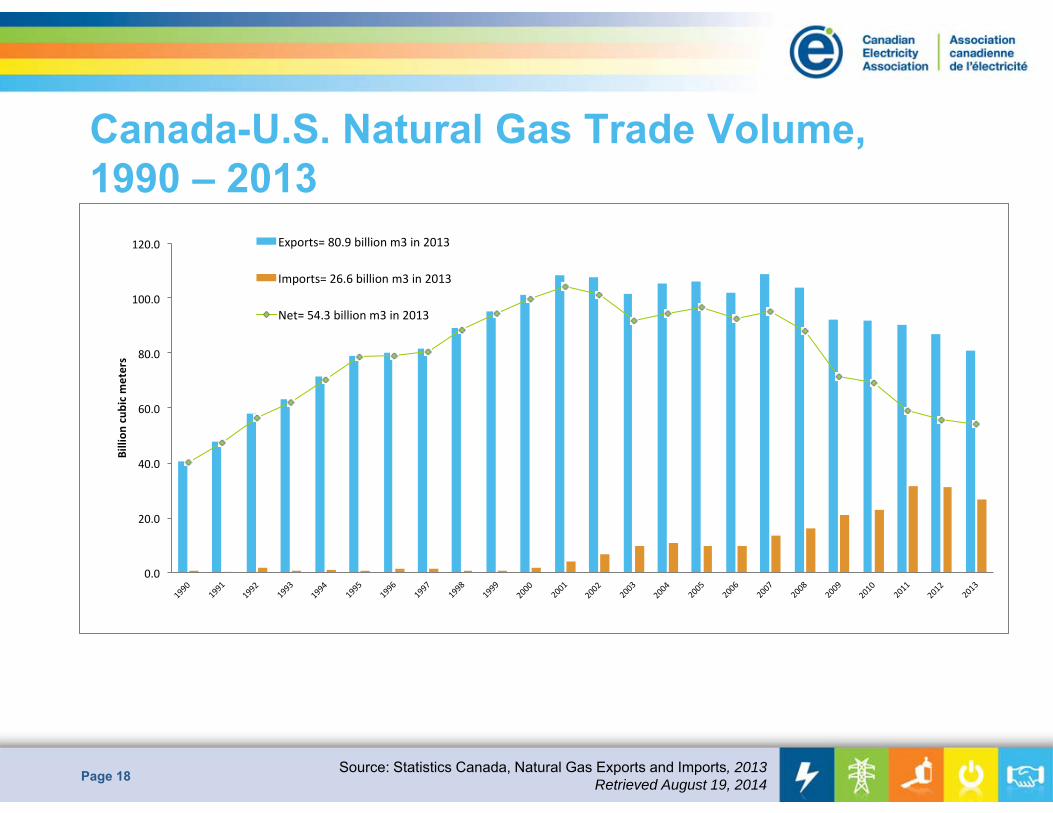
Canada-U.S. Natural Gas Trade Volume, 1990 – 2013
Page 18
0.0
20.0
40.0
60.0
80.0
100.0
120.0
1990
1991
1992
1993
1994
1995
1996
1997
1998
1999
2000
2001
2002
2003
2004
2005
2006
2007
2008
2009
2010
2011
2012
2013
Billion
cubic m
eters
Exports= 80.9 billion m3 in 2013
Imports= 26.6 billion m3 in 2013
Net= 54.3 billion m3 in 2013
Source: Statistics Canada, Natural Gas Exports and Imports, 2013Retrieved August 19, 2014
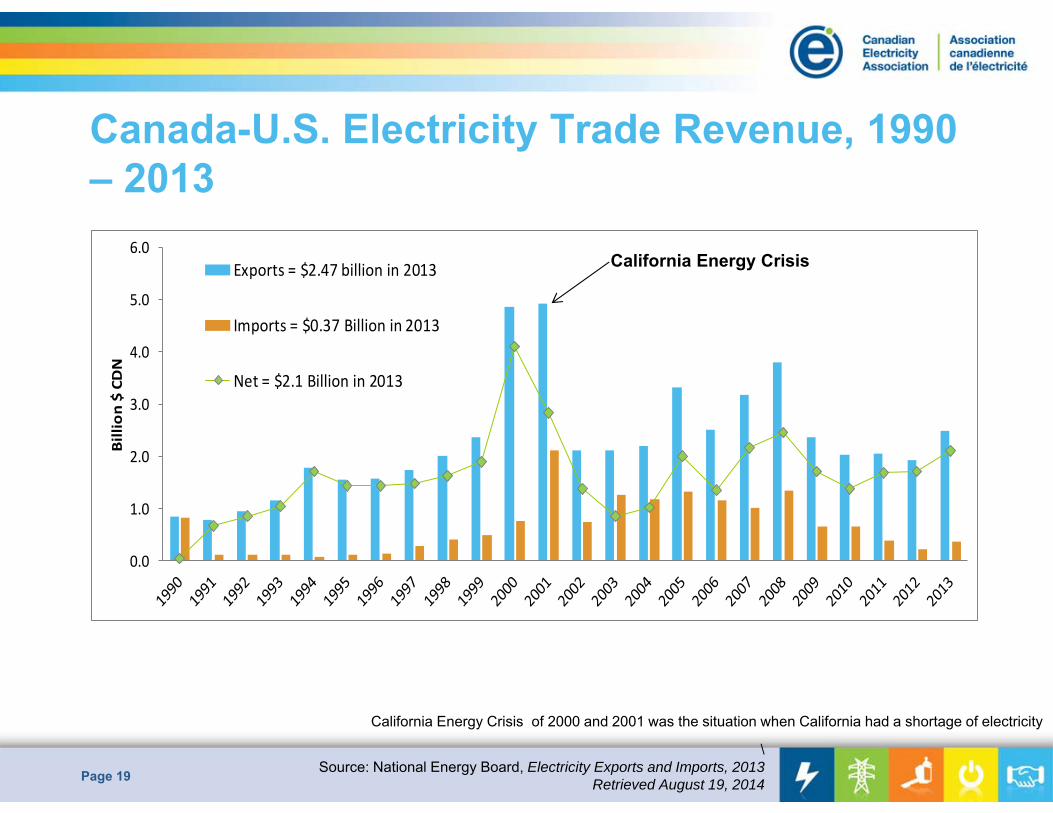
Canada-U.S. Electricity Trade Revenue, 1990 – 2013
Page 19
California Energy Crisis of 2000 and 2001 was the situation when California had a shortage of electricity
0.0
1.0
2.0
3.0
4.0
5.0
6.0
Billion $ CDN
Exports = $2.47 billion in 2013
Imports = $0.37 Billion in 2013
Net = $2.1 Billion in 2013
California Energy Crisis
\Source: National Energy Board, Electricity Exports and Imports, 2013
Retrieved August 19, 2014
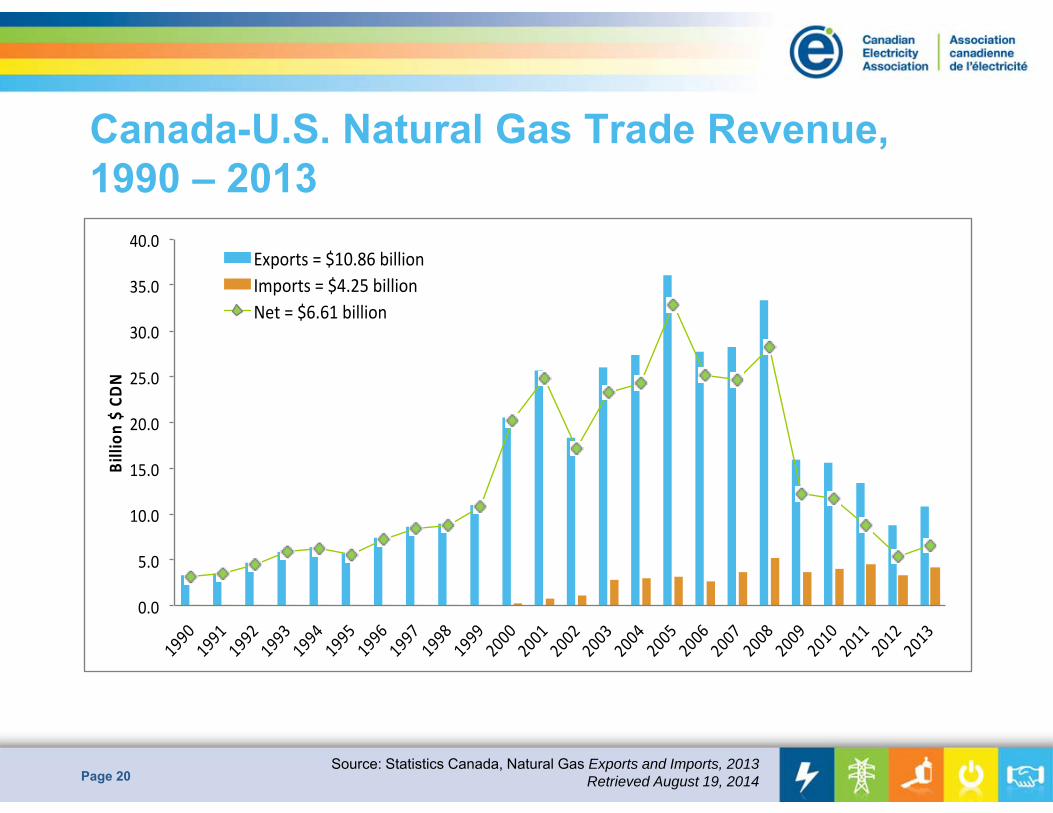
Canada-U.S. Natural Gas Trade Revenue, 1990 – 2013
Page 20
0.0
5.0
10.0
15.0
20.0
25.0
30.0
35.0
40.0
1990
19
91
1992
19
93
1994
19
95
1996
19
97
1998
19
99
2000
20
01
2002
20
03
2004
20
05
2006
20
07
2008
20
09
2010
20
11
2012
20
13
Billion
$ CDN
Exports = $10.86 billion Imports = $4.25 billion Net = $6.61 billion
Source: Statistics Canada, Natural Gas Exports and Imports, 2013Retrieved August 19, 2014
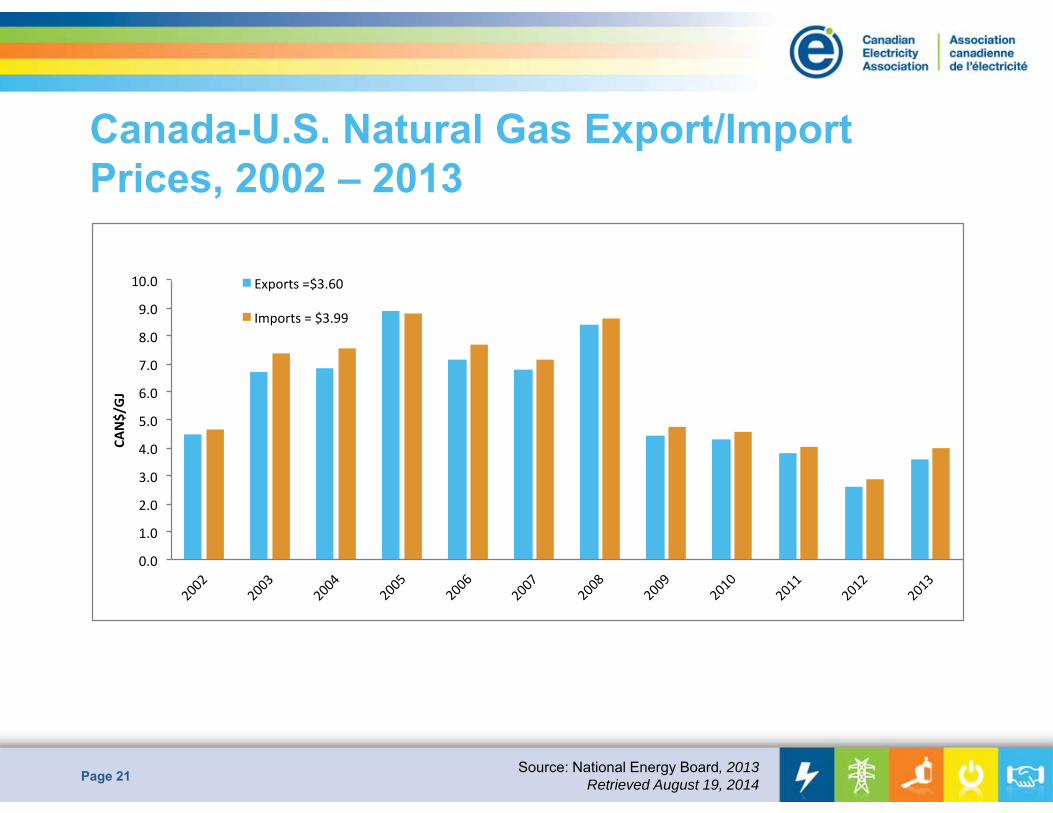
Canada-U.S. Natural Gas Export/Import Prices, 2002 – 2013
Page 21
0.0
1.0
2.0
3.0
4.0
5.0
6.0
7.0
8.0
9.0
10.0
2002
2003
2004
2005
2006
2007
2008
2009
2010
2011
2012
2013
CA
N$/GJ
Exports =$3.60
Imports = $3.99
Source: National Energy Board, 2013 Retrieved August 19, 2014
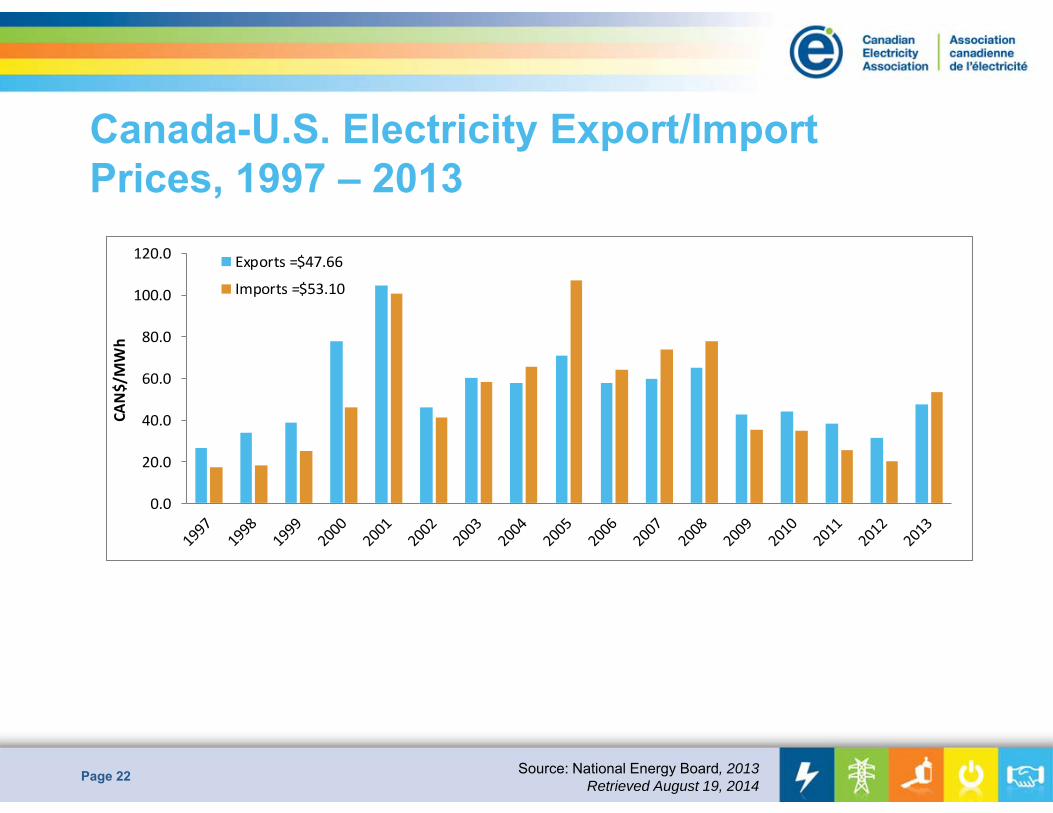
Canada-U.S. Electricity Export/Import Prices, 1997 – 2013
Page 22
0.0
20.0
40.0
60.0
80.0
100.0
120.0
CAN$/MWh
Exports =$47.66
Imports =$53.10
Source: National Energy Board, 2013 Retrieved August 19, 2014
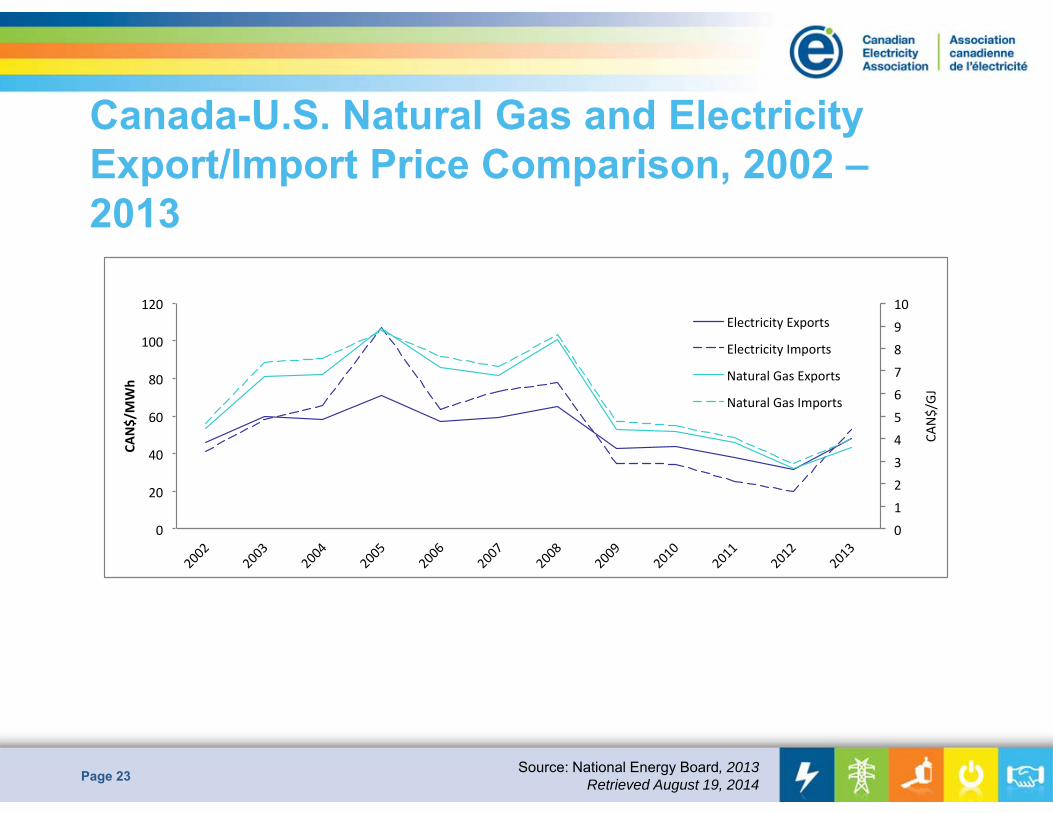
Canada-U.S. Natural Gas and Electricity Export/Import Price Comparison, 2002 –2013
Page 23
0 1 2 3 4 5 6 7 8 9 10
0
20
40
60
80
100
120
2002
2003
2004
2005
2006
2007
2008
2009
2010
2011
2012
2013
CAN$/GJ
CAN$/MWh
Electricity Exports
Electricity Imports
Natural Gas Exports
Natural Gas Imports
Source: National Energy Board, 2013Retrieved August 19, 2014
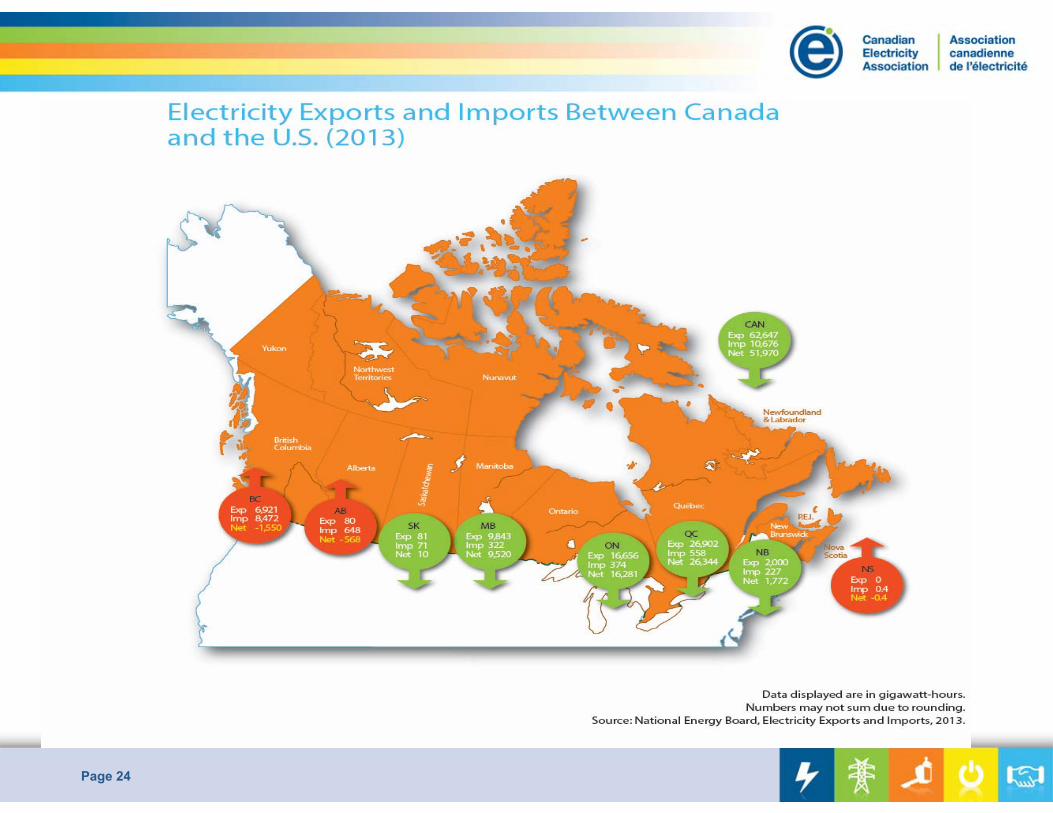
Page 24
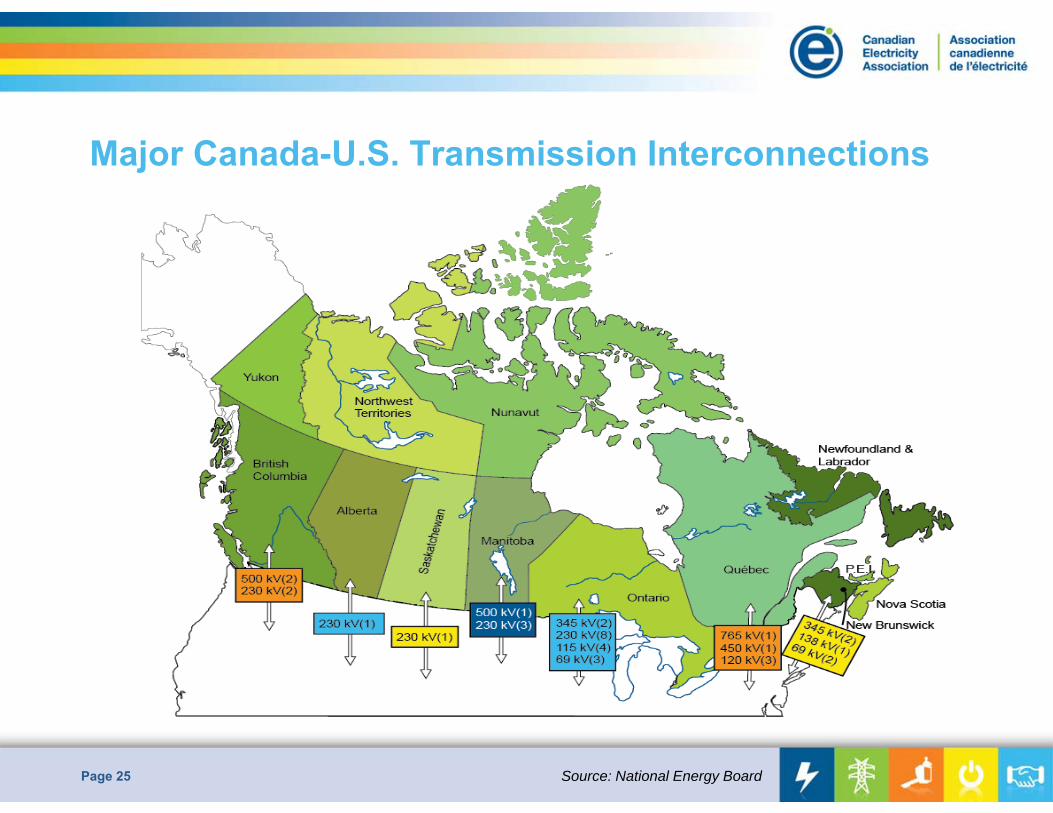
Major Canada-U.S. Transmission Interconnections
Page 25 Source: National Energy Board
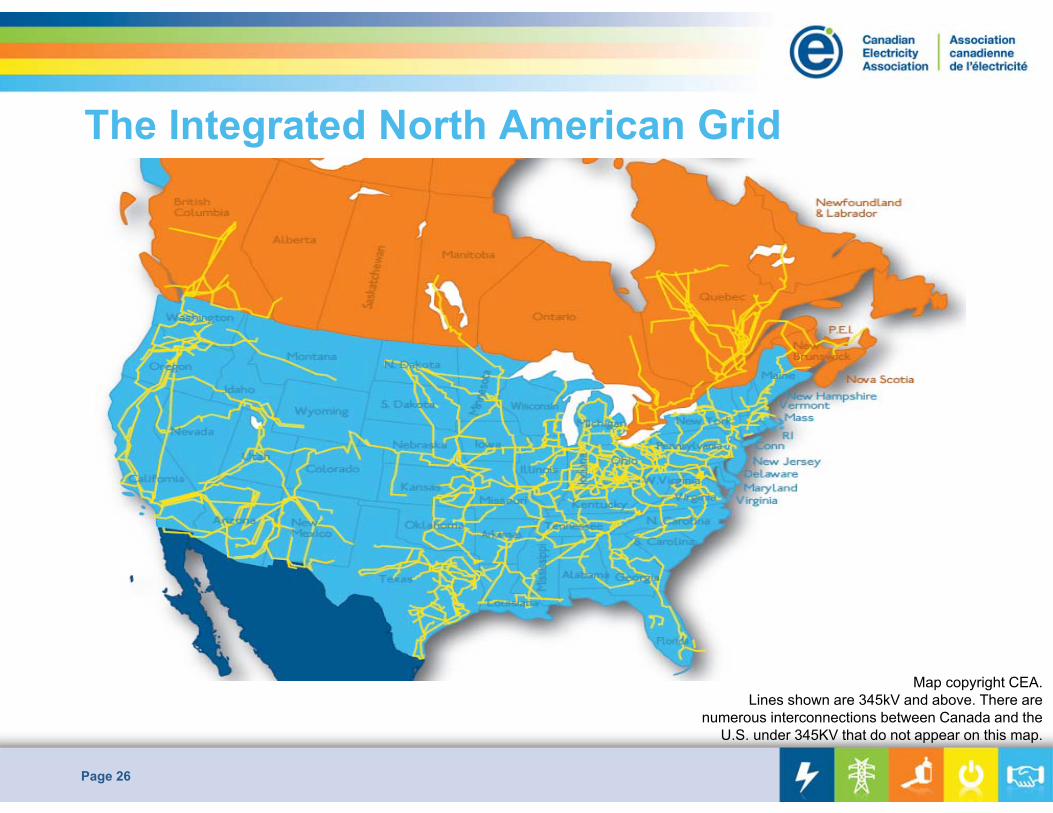
The Integrated North American Grid
Page 26
Map copyright CEA. Lines shown are 345kV and above. There are
numerous interconnections between Canada and the U.S. under 345KV that do not appear on this map.
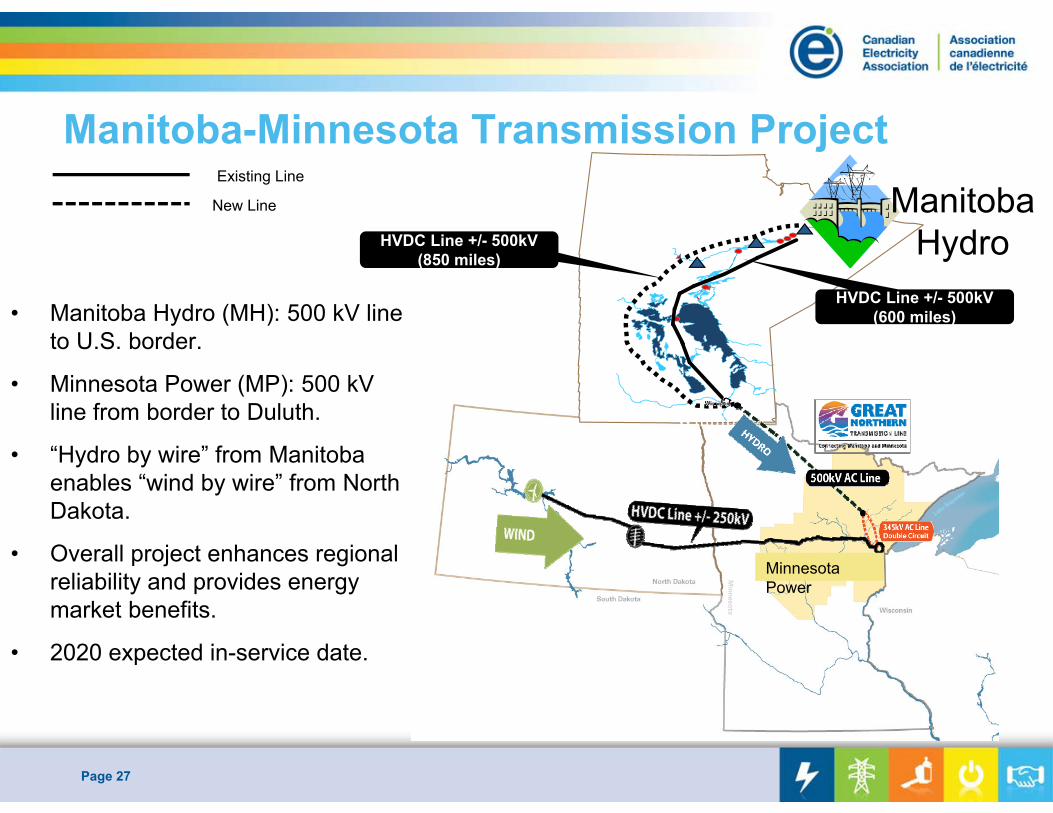
• Manitoba Hydro (MH): 500 kV line to U.S. border.
• Minnesota Power (MP): 500 kV line from border to Duluth.
• “Hydro by wire” from Manitoba enables “wind by wire” from NorthDakota.
• Overall project enhances regional reliability and provides energy market benefits.
• 2020 expected in-service date.
Page 27
Winnipeg
HVDC Line +/- 500kV(600 miles)
HVDC Line +/- 500kV(850 miles)
ManitobaHydro
Minnesota Power
Manitoba-Minnesota Transmission ProjectNew Line
Existing Line
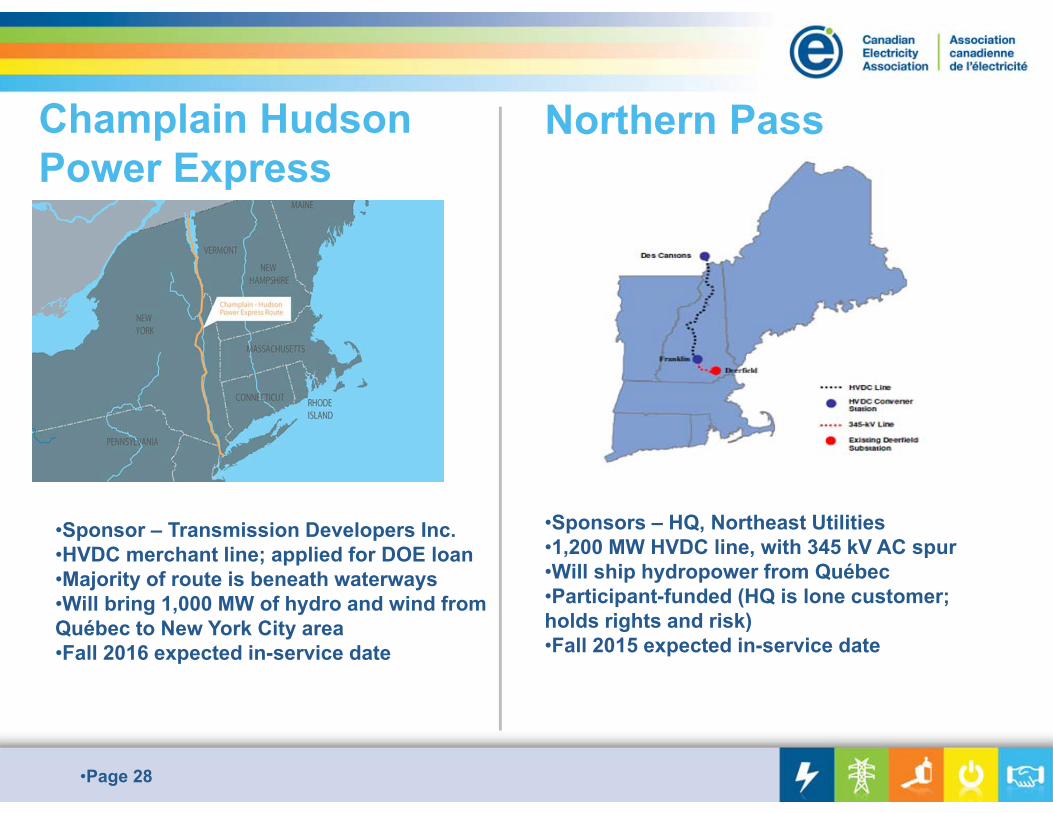
Champlain Hudson Power Express
•Sponsor – Transmission Developers Inc.•HVDC merchant line; applied for DOE loan•Majority of route is beneath waterways•Will bring 1,000 MW of hydro and wind from Québec to New York City area•Fall 2016 expected in-service date
Northern Pass
•Sponsors – HQ, Northeast Utilities•1,200 MW HVDC line, with 345 kV AC spur•Will ship hydropower from Québec•Participant-funded (HQ is lone customer; holds rights and risk)•Fall 2015 expected in-service date
•Page 28
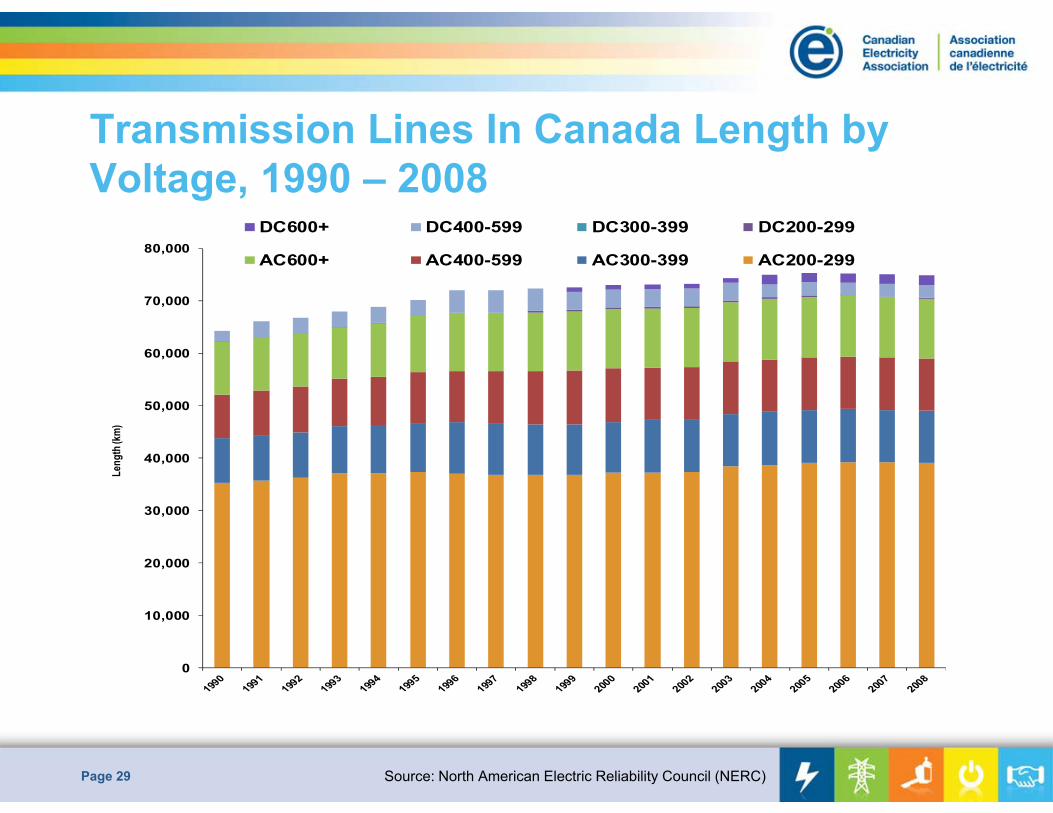
Transmission Lines In Canada Length by Voltage, 1990 – 2008
Page 29
0
10,000
20,000
30,000
40,000
50,000
60,000
70,000
80,000
Leng
th (k
m)
DC600+ DC400-599 DC300-399 DC200-299
AC600+ AC400-599 AC300-399 AC200-299
Source: North American Electric Reliability Council (NERC)
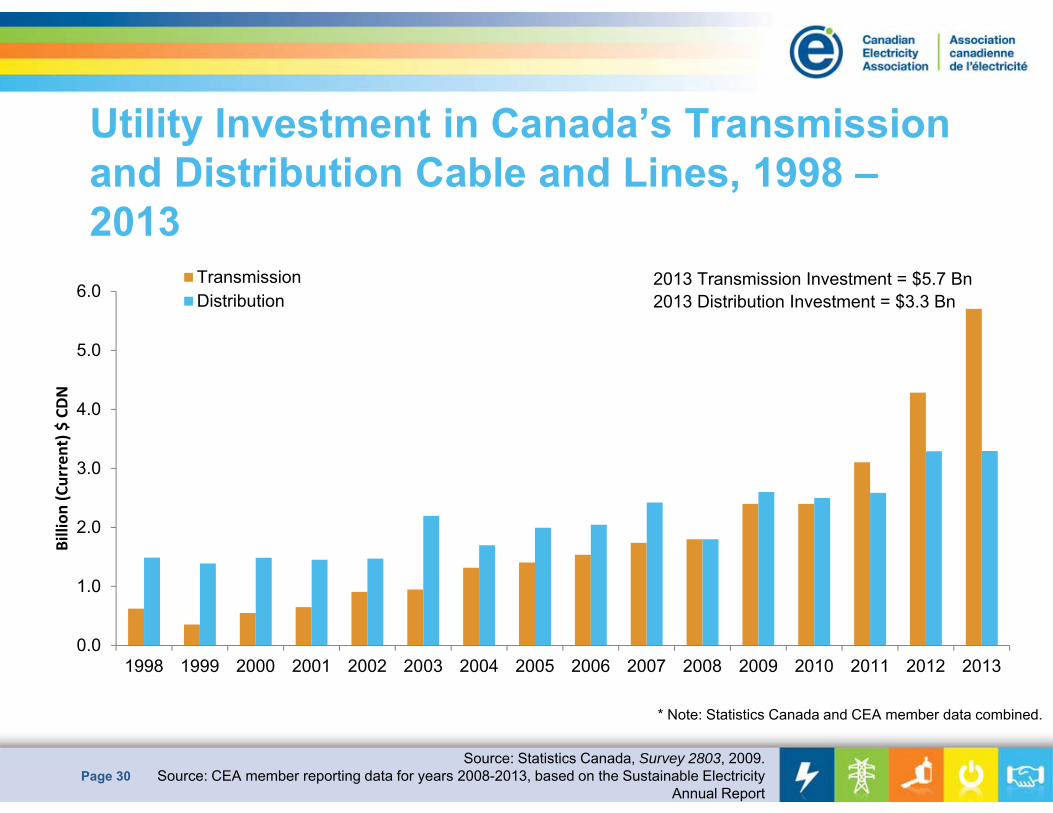
Utility Investment in Canada’s Transmission and Distribution Cable and Lines, 1998 –2013
Page 30
* Note: Statistics Canada and CEA member data combined.
Source: Statistics Canada, Survey 2803, 2009.Source: CEA member reporting data for years 2008-2013, based on the Sustainable Electricity
Annual Report
0.0
1.0
2.0
3.0
4.0
5.0
6.0
1998 1999 2000 2001 2002 2003 2004 2005 2006 2007 2008 2009 2010 2011 2012 2013
Billion
(Current) $
CDN
TransmissionDistribution
2013 Transmission Investment = $5.7 Bn2013 Distribution Investment = $3.3 Bn
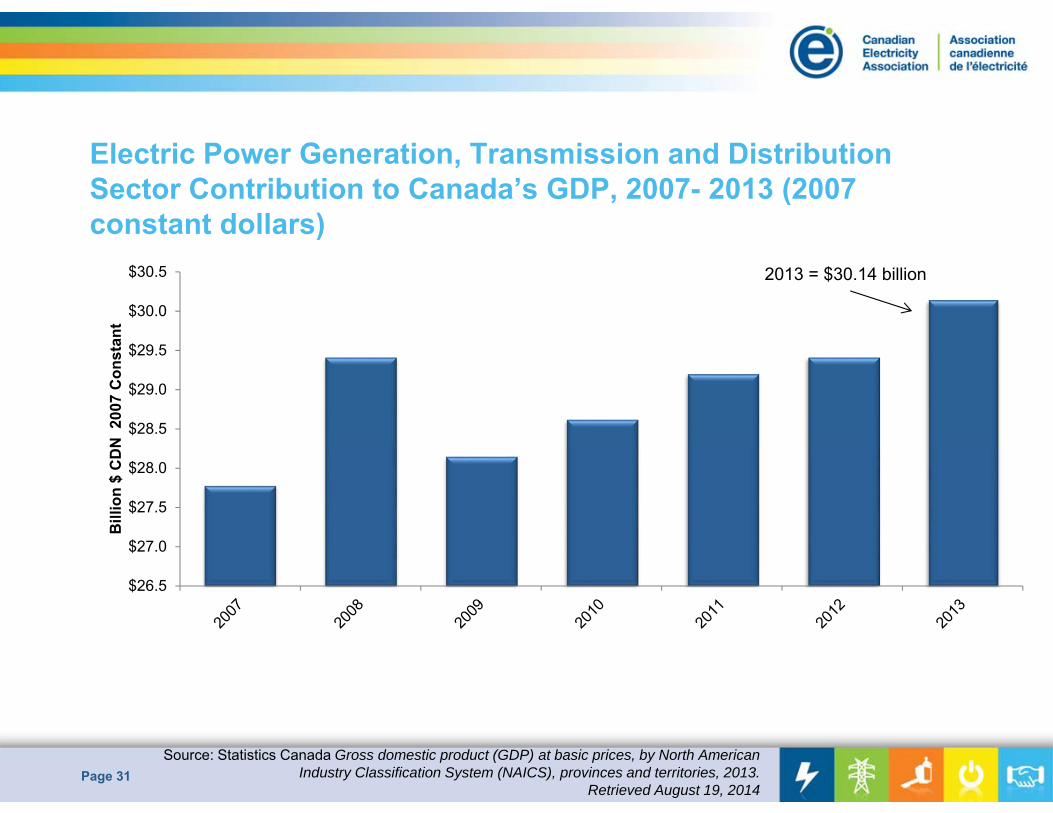
Electric Power Generation, Transmission and Distribution Sector Contribution to Canada’s GDP, 2007- 2013 (2007 constant dollars)
Page 31Source: Statistics Canada Gross domestic product (GDP) at basic prices, by North American
Industry Classification System (NAICS), provinces and territories, 2013.Retrieved August 19, 2014
$26.5
$27.0
$27.5
$28.0
$28.5
$29.0
$29.5
$30.0
$30.5
Bill
ion
$ C
DN
200
7 C
onst
ant
2013 = $30.14 billion
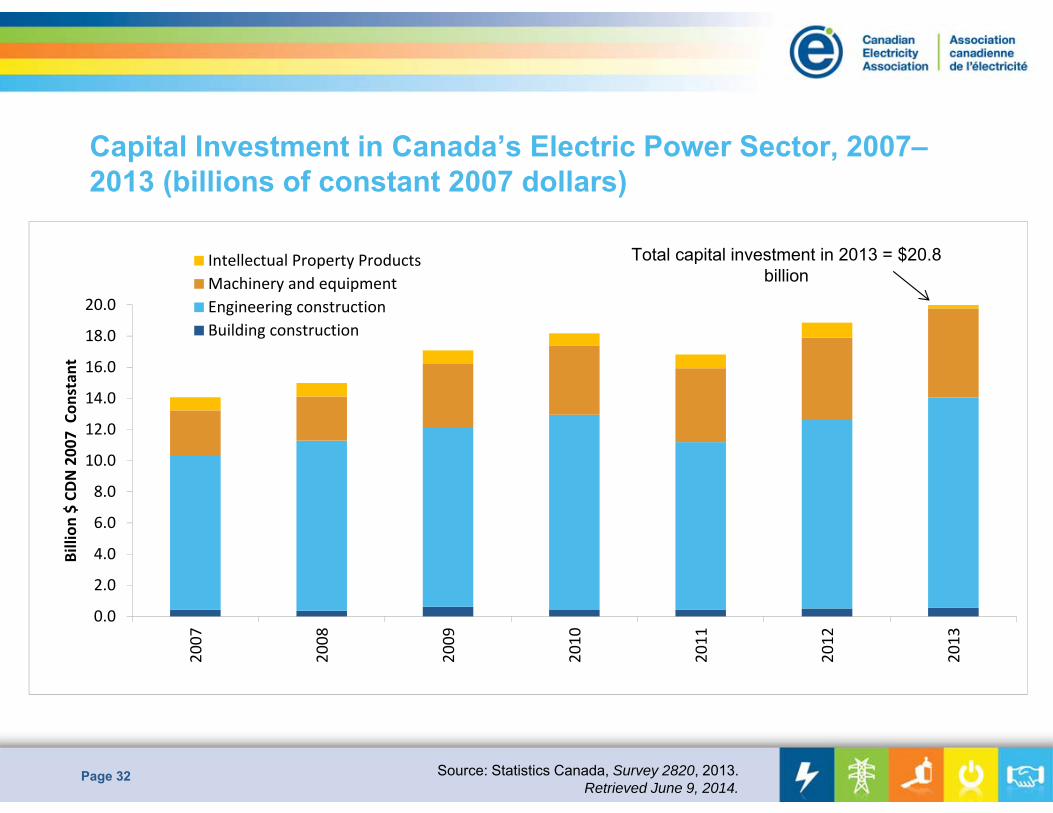
Capital Investment in Canada’s Electric Power Sector, 2007–2013 (billions of constant 2007 dollars)
Page 32 Source: Statistics Canada, Survey 2820, 2013.Retrieved June 9, 2014.
0.0
2.0
4.0
6.0
8.0
10.0
12.0
14.0
16.0
18.0
20.0
2007
2008
2009
2010
2011
2012
2013
Billion
$ CDN 200
7 Con
stan
t
Intellectual Property ProductsMachinery and equipmentEngineering constructionBuilding construction
Total capital investment in 2013 = $20.8billion
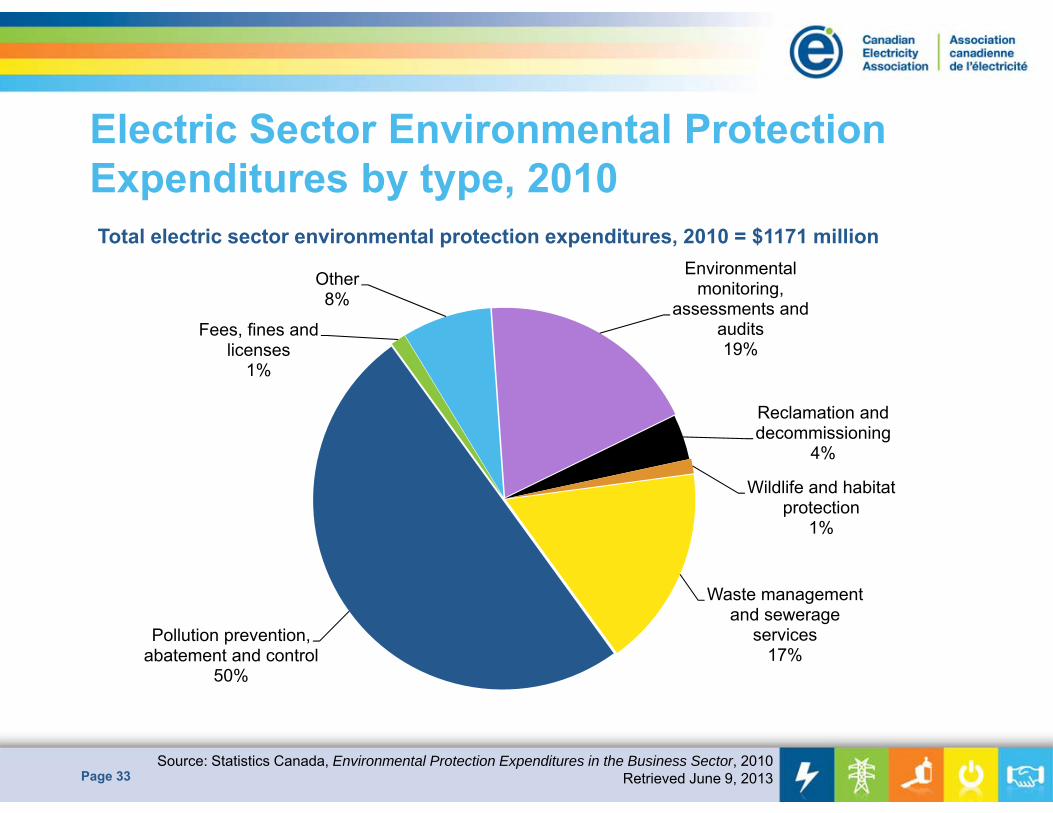
Electric Sector Environmental Protection Expenditures by type, 2010
Page 33
Total electric sector environmental protection expenditures, 2010 = $1171 millionEnvironmental
monitoring, assessments and
audits19%
Reclamation and decommissioning
4%
Wildlife and habitat protection
1%
Waste management and sewerage
services17%
Pollution prevention, abatement and control
50%
Fees, fines and licenses
1%
Other8%
Source: Statistics Canada, Environmental Protection Expenditures in the Business Sector, 2010Retrieved June 9, 2013
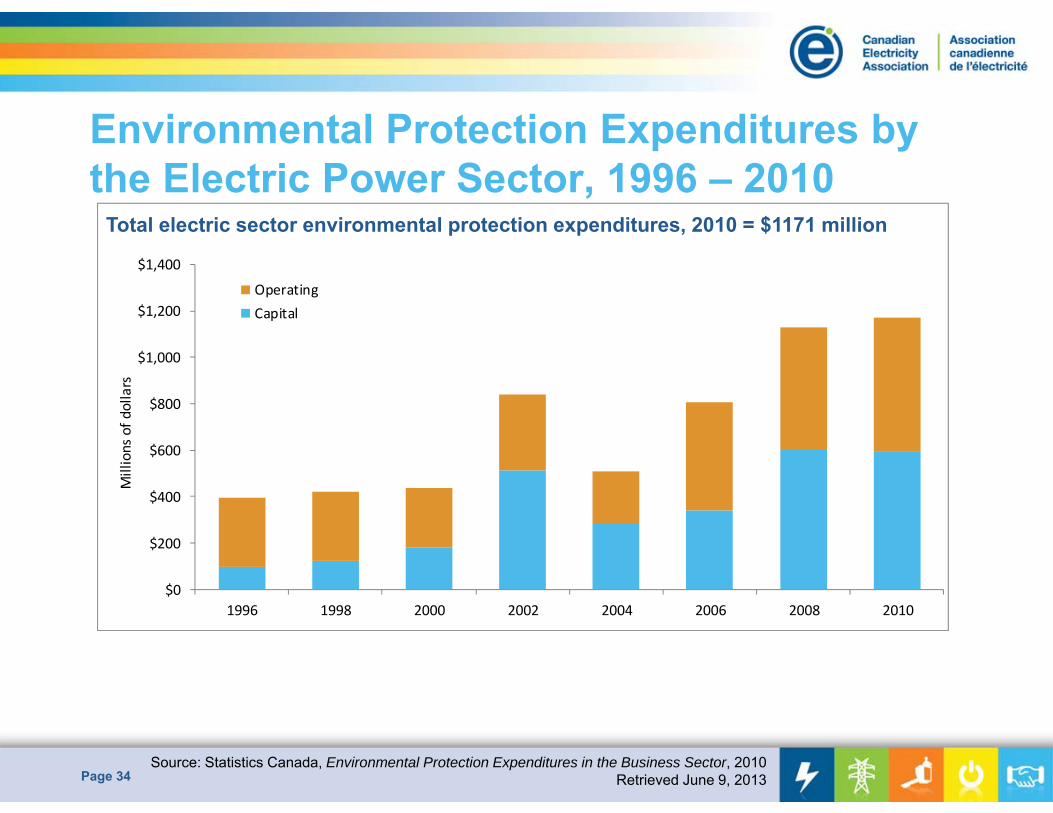
Environmental Protection Expenditures by the Electric Power Sector, 1996 – 2010
Page 34
$0
$200
$400
$600
$800
$1,000
$1,200
$1,400
1996 1998 2000 2002 2004 2006 2008 2010
Millions of d
ollars
OperatingCapital
Total electric sector environmental protection expenditures, 2010 = $1171 million
Source: Statistics Canada, Environmental Protection Expenditures in the Business Sector, 2010Retrieved June 9, 2013
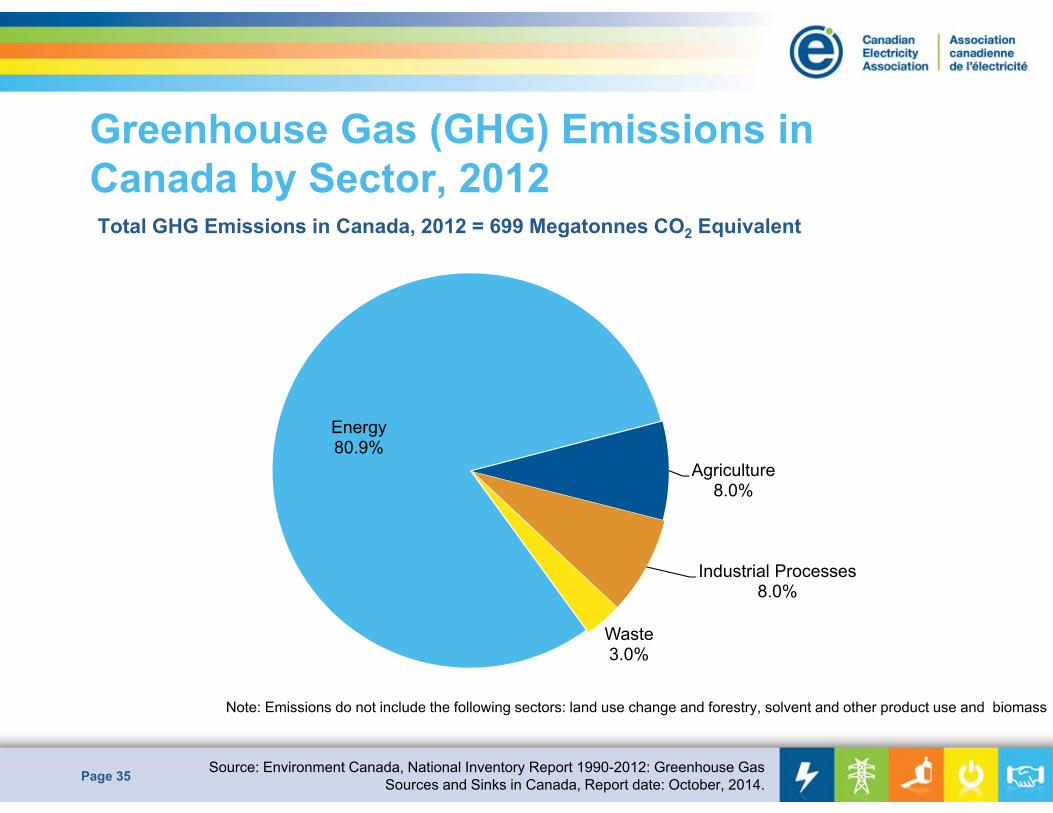
Greenhouse Gas (GHG) Emissions in Canada by Sector, 2012
Page 35
Energy80.9%
Agriculture8.0%
Industrial Processes8.0%
Waste 3.0%
Total GHG Emissions in Canada, 2012 = 699 Megatonnes CO2 Equivalent
Note: Emissions do not include the following sectors: land use change and forestry, solvent and other product use and biomass
Source: Environment Canada, National Inventory Report 1990-2012: Greenhouse Gas Sources and Sinks in Canada, Report date: October, 2014.
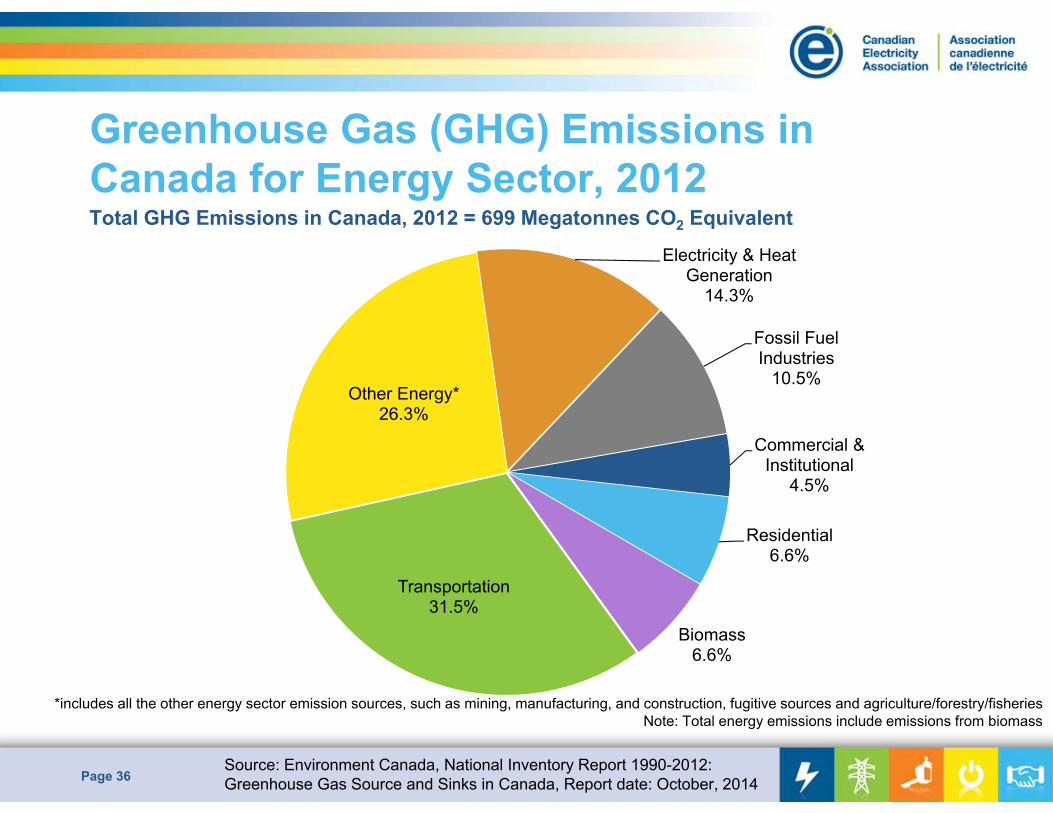
Greenhouse Gas (GHG) Emissions in Canada for Energy Sector, 2012
Page 36
Transportation31.5%
Other Energy*26.3%
Electricity & Heat Generation
14.3%
Fossil FuelIndustries
10.5%
Commercial & Institutional
4.5%
Residential6.6%
Biomass6.6%
Total GHG Emissions in Canada, 2012 = 699 Megatonnes CO2 Equivalent
*includes all the other energy sector emission sources, such as mining, manufacturing, and construction, fugitive sources and agriculture/forestry/fisheriesNote: Total energy emissions include emissions from biomass
Source: Environment Canada, National Inventory Report 1990-2012: Greenhouse Gas Source and Sinks in Canada, Report date: October, 2014
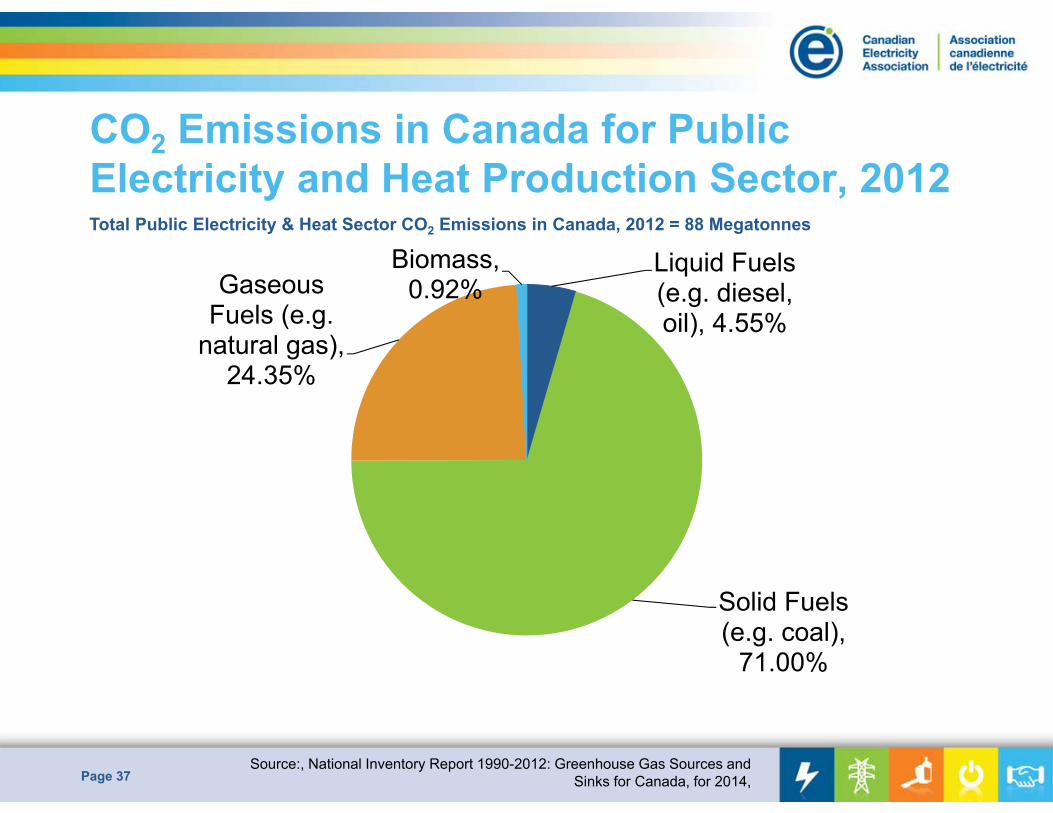
CO2 Emissions in Canada for Public Electricity and Heat Production Sector, 2012
Page 37
Liquid Fuels (e.g. diesel, oil), 4.55%
Solid Fuels (e.g. coal),
71.00%
Gaseous Fuels (e.g.
natural gas), 24.35%
Biomass, 0.92%
Source:, National Inventory Report 1990-2012: Greenhouse Gas Sources and Sinks for Canada, for 2014,
Total Public Electricity & Heat Sector CO2 Emissions in Canada, 2012 = 88 Megatonnes
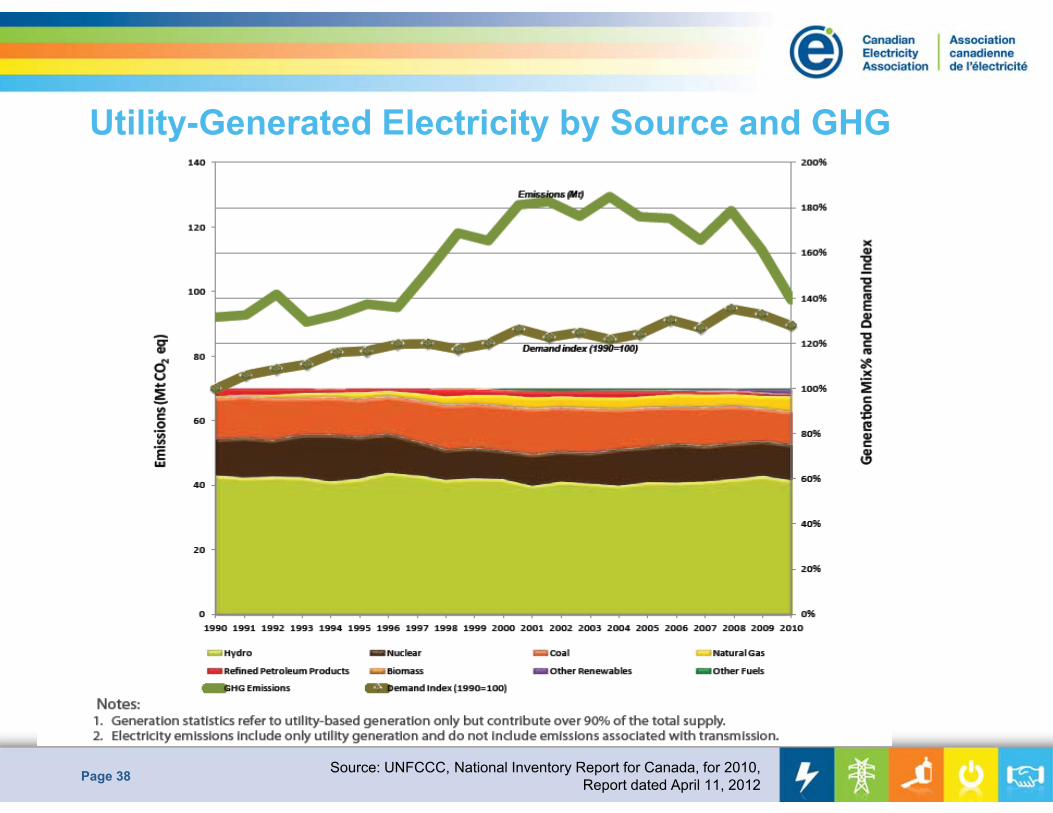
Utility-Generated Electricity by Source and GHGEmissions, 1990–2010
Page 38 Source: UNFCCC, National Inventory Report for Canada, for 2010, Report dated April 11, 2012
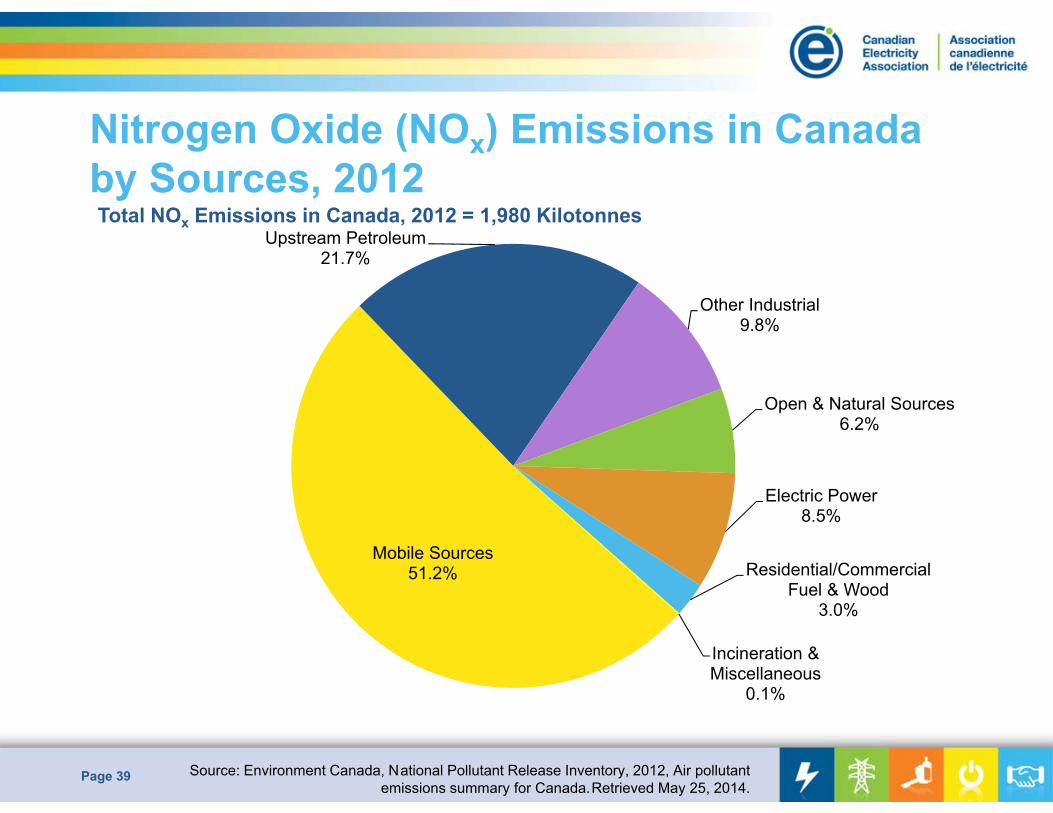
Nitrogen Oxide (NOx) Emissions in Canada by Sources, 2012
Page 39
Mobile Sources51.2%
Upstream Petroleum21.7%
Other Industrial9.8%
Open & Natural Sources6.2%
Electric Power8.5%
Residential/Commercial Fuel & Wood
3.0%
Incineration & Miscellaneous
0.1%
Total NOx Emissions in Canada, 2012 = 1,980 Kilotonnes
Source: Environment Canada, National Pollutant Release Inventory, 2012, Air pollutant emissions summary for Canada.Retrieved May 25, 2014.
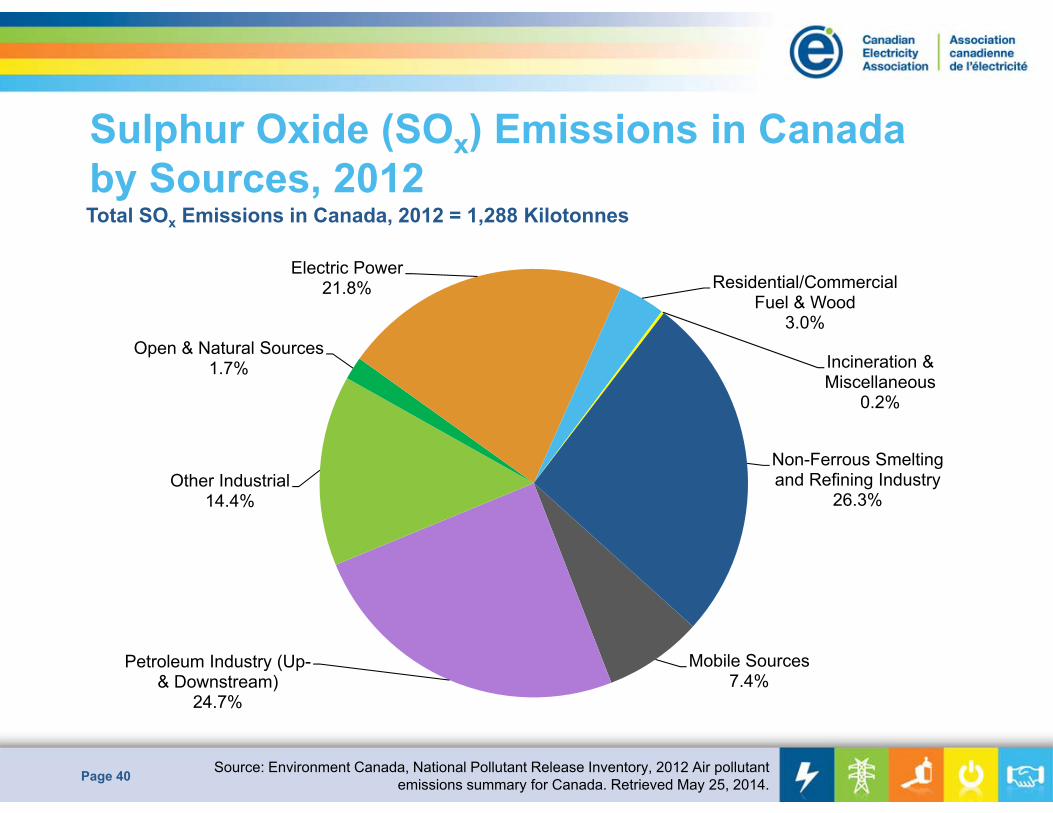
Sulphur Oxide (SOx) Emissions in Canada by Sources, 2012
Page 40 Source: Environment Canada, National Pollutant Release Inventory, 2012 Air pollutant emissions summary for Canada. Retrieved May 25, 2014.
Mobile Sources7.4%
Petroleum Industry (Up-& Downstream)
24.7%
Other Industrial14.4%
Open & Natural Sources1.7%
Electric Power21.8% Residential/Commercial
Fuel & Wood3.0%
Incineration & Miscellaneous
0.2%
Non-Ferrous Smelting and Refining Industry
26.3%
Total SOx Emissions in Canada, 2012 = 1,288 Kilotonnes
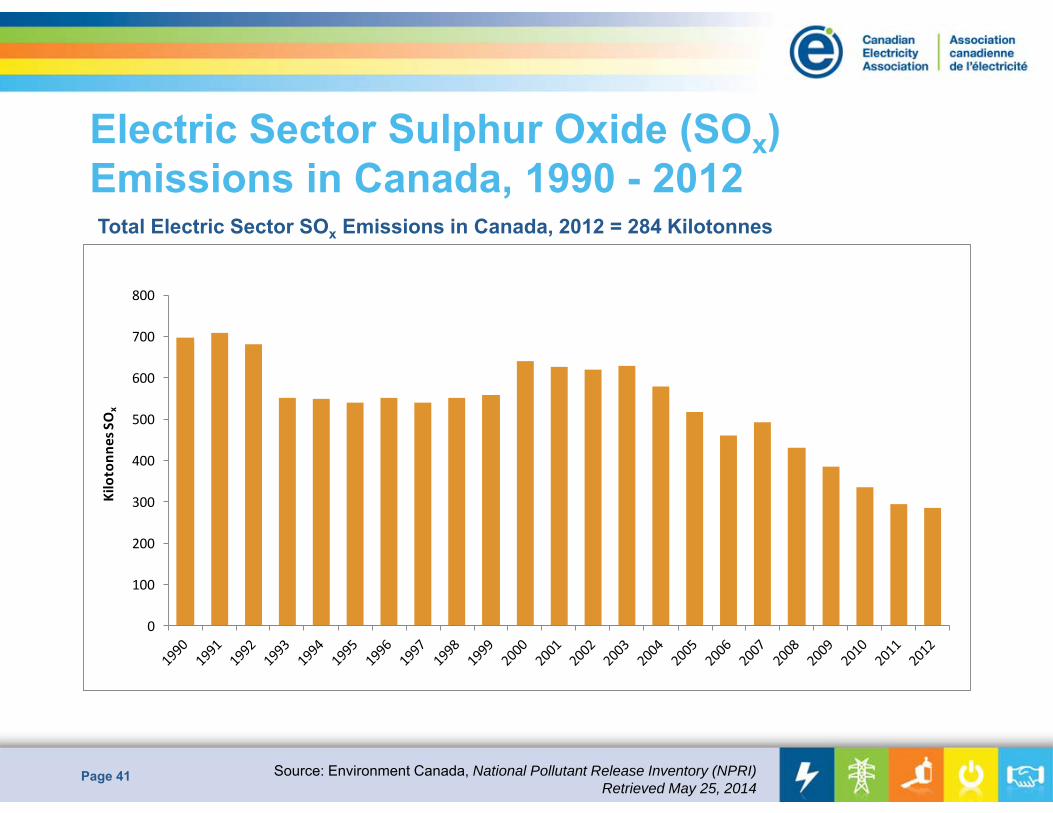
Electric Sector Sulphur Oxide (SOx) Emissions in Canada, 1990 - 2012
Page 41
Total Electric Sector SOx Emissions in Canada, 2012 = 284 Kilotonnes
0
100
200
300
400
500
600
700
800
Kilotonn
es SOx
Source: Environment Canada, National Pollutant Release Inventory (NPRI) Retrieved May 25, 2014
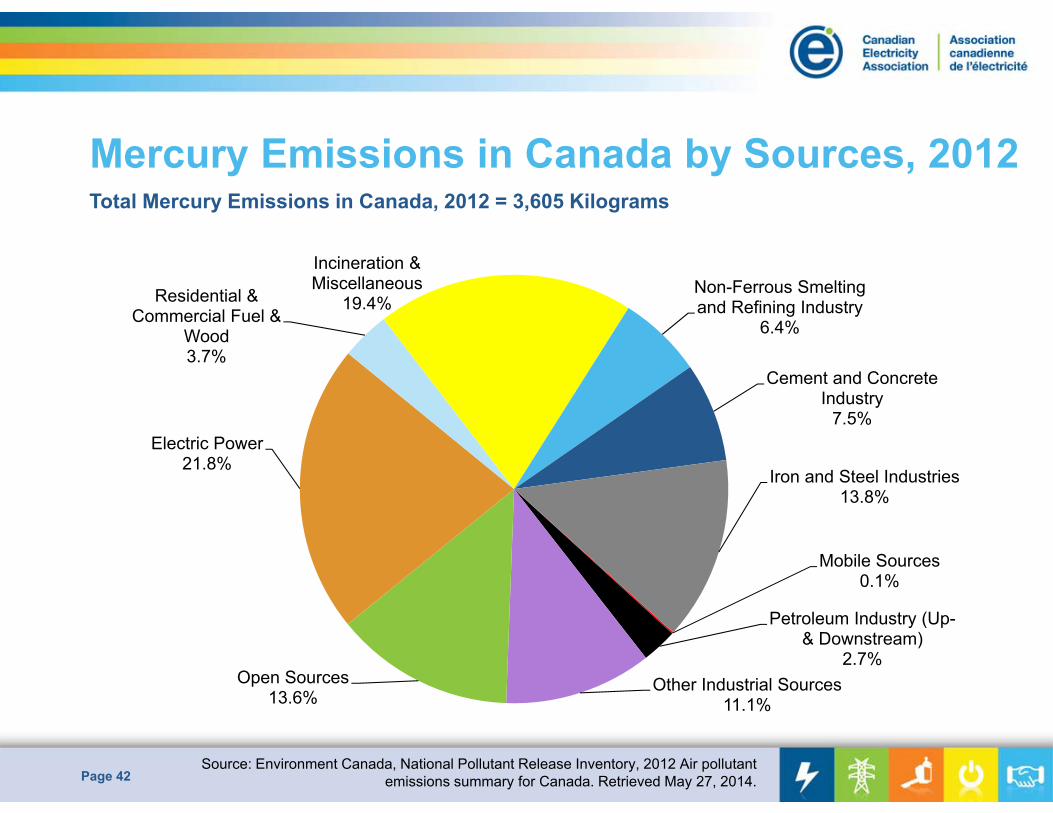
Mercury Emissions in Canada by Sources, 2012
Page 42
Mobile Sources0.1%
Petroleum Industry (Up-& Downstream)
2.7%Other Industrial Sources
11.1%Open Sources
13.6%
Electric Power21.8%
Residential & Commercial Fuel &
Wood3.7%
Incineration & Miscellaneous
19.4%Non-Ferrous Smelting and Refining Industry
6.4%
Cement and Concrete Industry
7.5%
Iron and Steel Industries13.8%
Total Mercury Emissions in Canada, 2012 = 3,605 Kilograms
Source: Environment Canada, National Pollutant Release Inventory, 2012 Air pollutant emissions summary for Canada. Retrieved May 27, 2014.
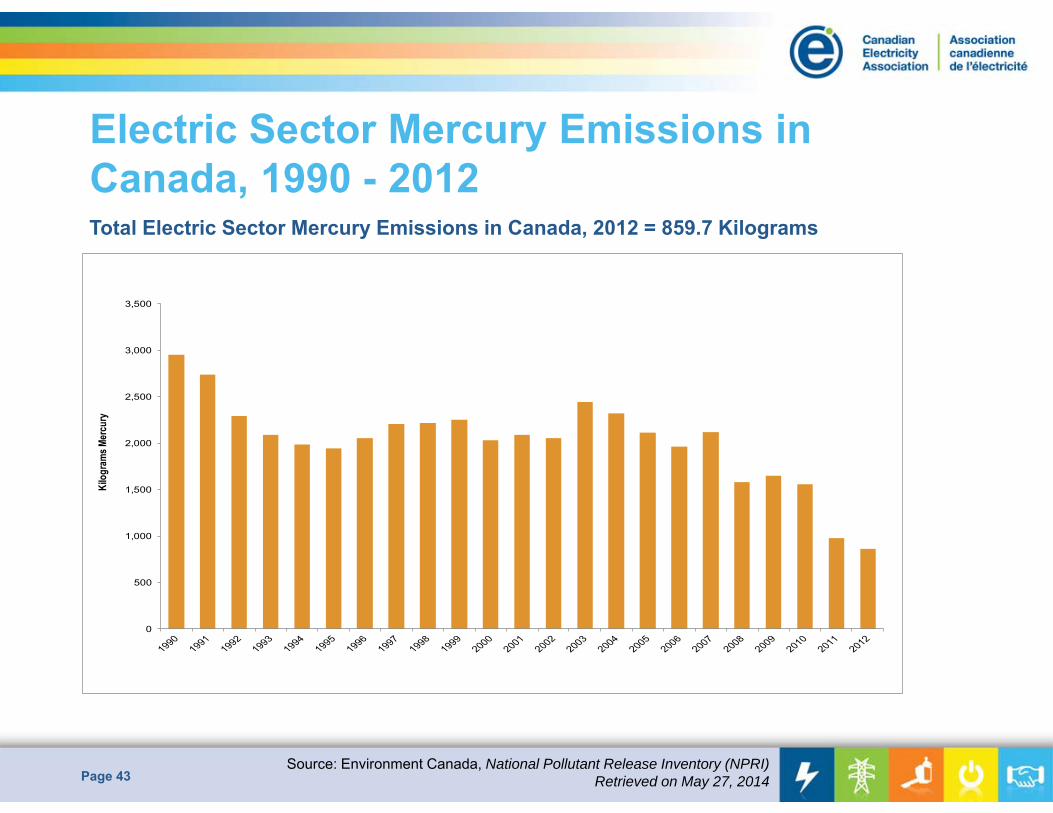
Electric Sector Mercury Emissions in Canada, 1990 - 2012
Page 43
0
500
1,000
1,500
2,000
2,500
3,000
3,500
Kilog
rams
Mer
cury
Total Electric Sector Mercury Emissions in Canada, 2012 = 859.7 Kilograms
Source: Environment Canada, National Pollutant Release Inventory (NPRI) Retrieved on May 27, 2014
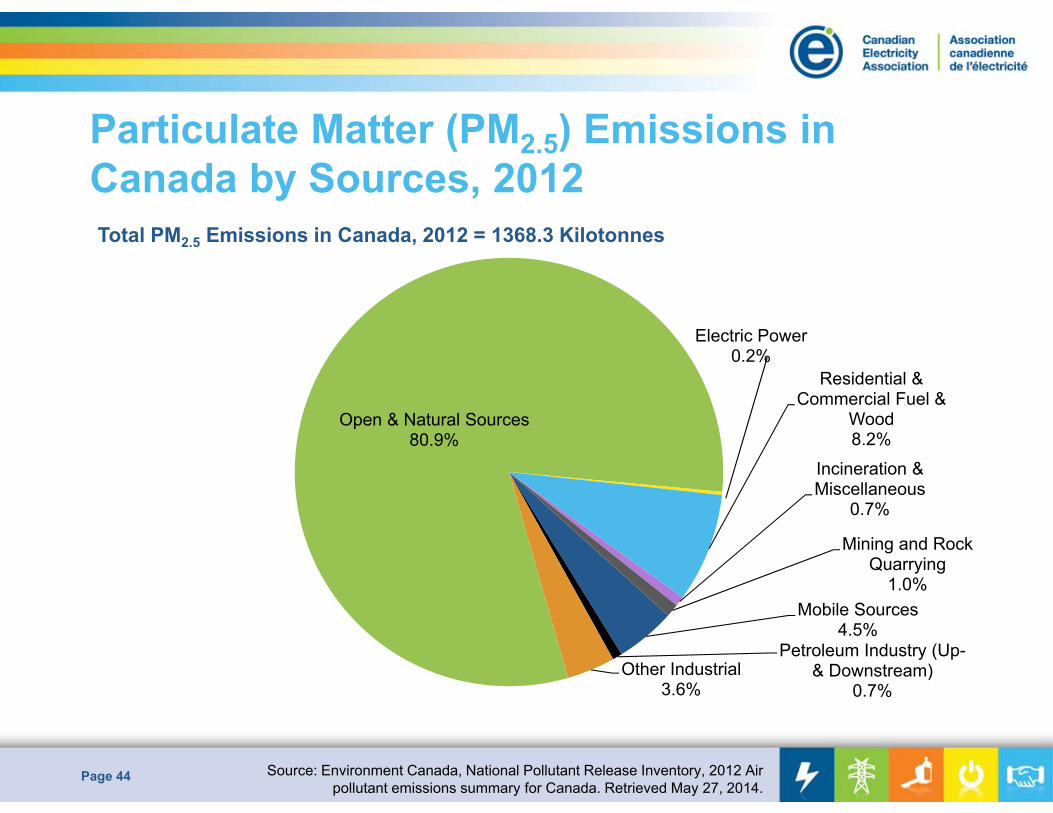
Particulate Matter (PM2.5) Emissions in Canada by Sources, 2012
Page 44
Total PM2.5 Emissions in Canada, 2012 = 1368.3 Kilotonnes
Mobile Sources4.5%
Petroleum Industry (Up-& Downstream)
0.7%Other Industrial
3.6%
Open & Natural Sources80.9%
Electric Power0.2%
Residential & Commercial Fuel &
Wood8.2%
Incineration & Miscellaneous
0.7%
Mining and Rock Quarrying
1.0%
Source: Environment Canada, National Pollutant Release Inventory, 2012 Air pollutant emissions summary for Canada. Retrieved May 27, 2014.
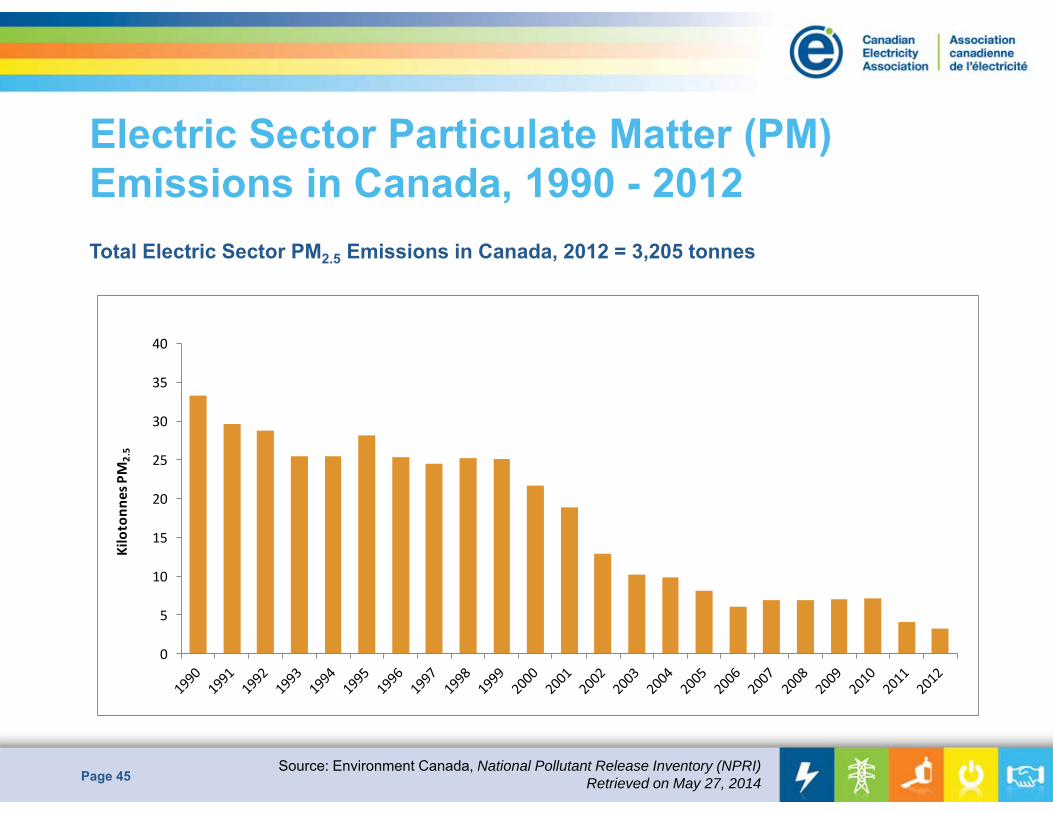
Electric Sector Particulate Matter (PM) Emissions in Canada, 1990 - 2012
Page 45
0
5
10
15
20
25
30
35
40
Kilotonn
es PM
2.5
Total Electric Sector PM2.5 Emissions in Canada, 2012 = 3,205 tonnes
Source: Environment Canada, National Pollutant Release Inventory (NPRI) Retrieved on May 27, 2014
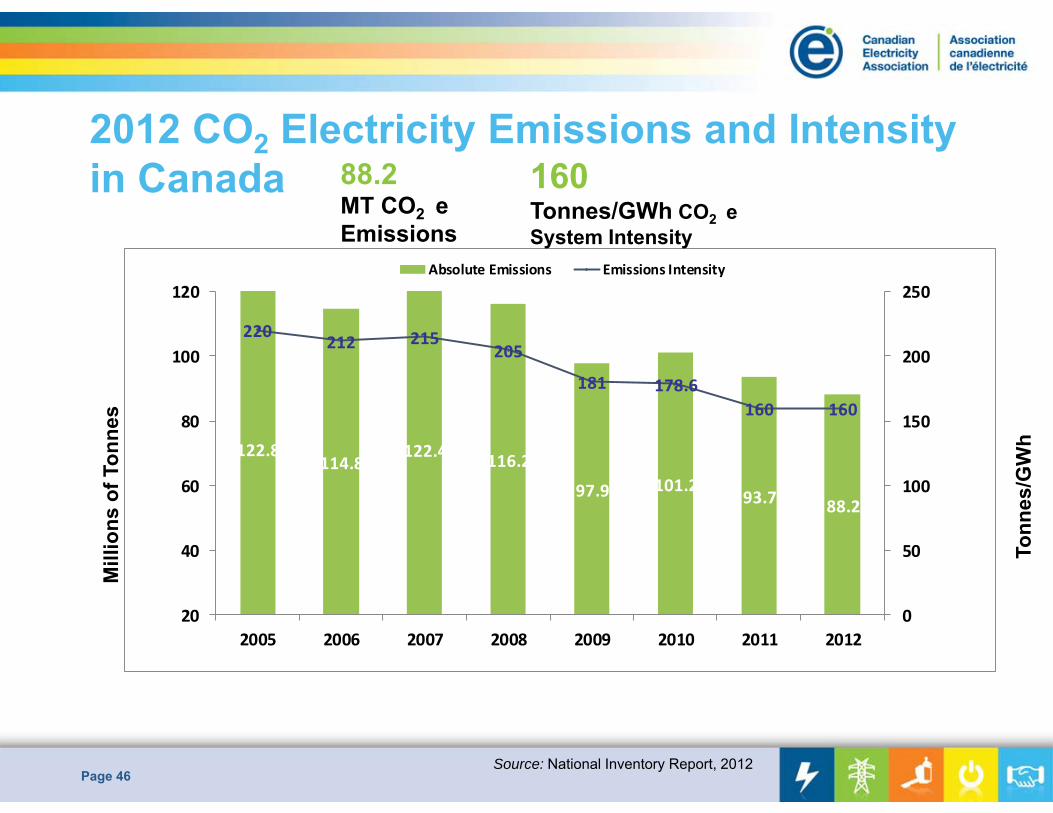
2012 CO2 Electricity Emissions and Intensity in Canada
Page 46
122.8114.8
122.4 116.2
97.9 101.293.7 88.2
220 212 215205
181 178.6160 160
0
50
100
150
200
250
20
40
60
80
100
120
2005 2006 2007 2008 2009 2010 2011 2012
Absolute Emissions Emissions Intensity
Mill
ions
of T
onne
s
Tonn
es/G
Wh
Source: National Inventory Report, 2012
88.2MT CO2 e Emissions
160Tonnes/GWh CO2 e System Intensity
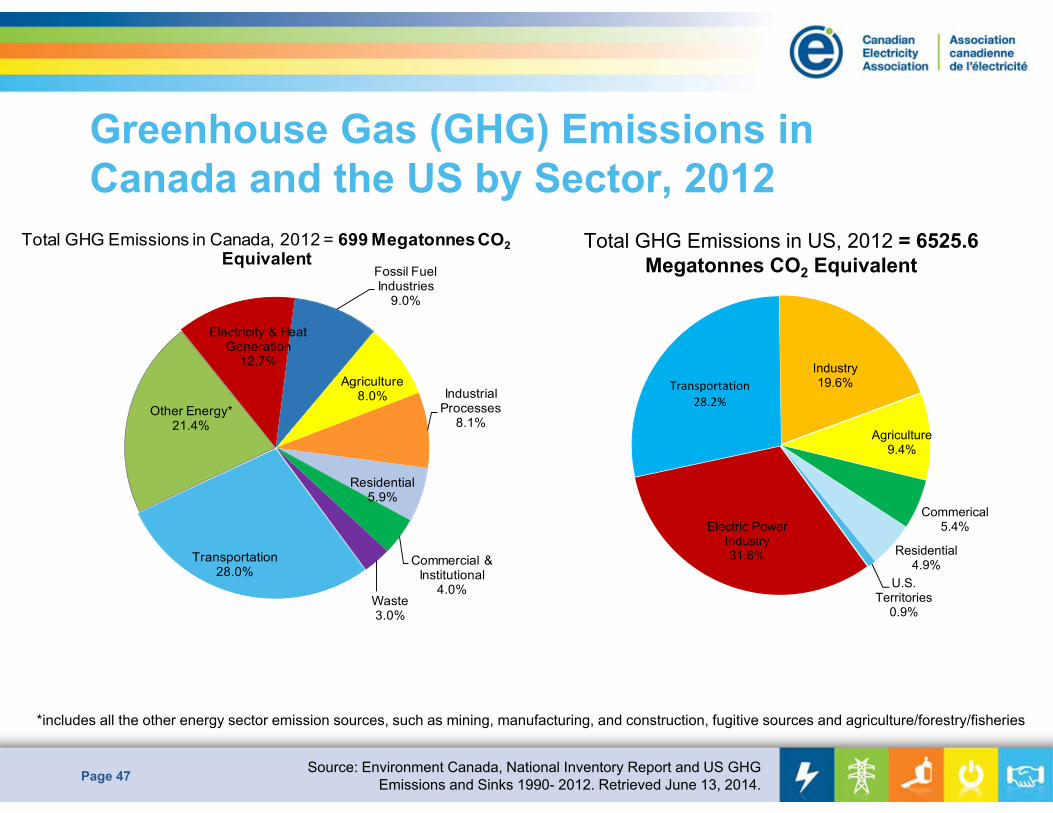
Greenhouse Gas (GHG) Emissions in Canada and the US by Sector, 2012
Page 47
Transportation28.0%
Other Energy*21.4%
Electricity & Heat Generation
12.7%
Fossil Fuel Industries
9.0%
Agriculture8.0% Industrial
Processes8.1%
Residential5.9%
Commercial & Institutional
4.0%Waste 3.0%
Total GHG Emissions in Canada, 2012 = 699 Megatonnes CO2Equivalent
*includes all the other energy sector emission sources, such as mining, manufacturing, and construction, fugitive sources and agriculture/forestry/fisheries
Electric Power Industry31.6%
Transportation28.2%
Industry19.6%
Agriculture9.4%
Commerical5.4%
Residential4.9%
U.S. Territories
0.9%
Total GHG Emissions in US, 2012 = 6525.6 Megatonnes CO2 Equivalent
Source: Environment Canada, National Inventory Report and US GHG Emissions and Sinks 1990- 2012. Retrieved June 13, 2014.
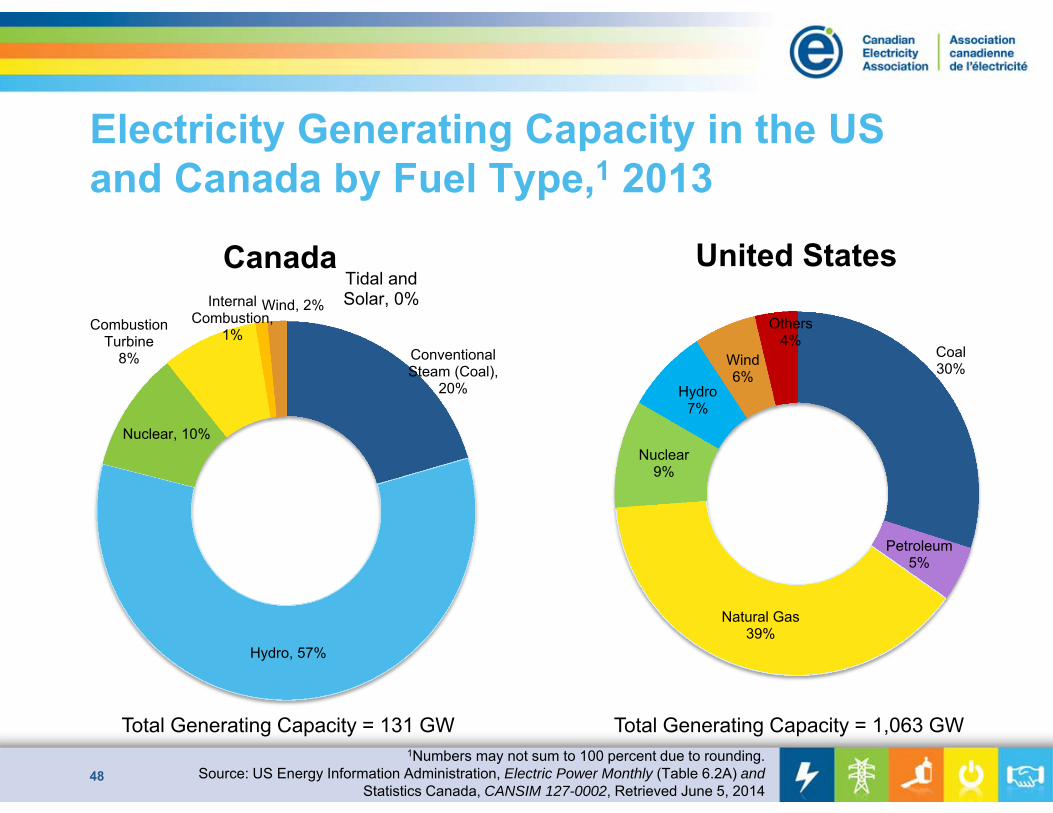
Electricity Generating Capacity in the US and Canada by Fuel Type,1 2013
48
1Numbers may not sum to 100 percent due to rounding.Source: US Energy Information Administration, Electric Power Monthly (Table 6.2A) and
Statistics Canada, CANSIM 127-0002, Retrieved June 5, 2014
Conventional Steam (Coal),
20%
Hydro, 57%
Nuclear, 10%
Combustion Turbine
8%
Internal Combustion,
1%
Tidal and Solar, 0%Wind, 2%
Canada
Total Generating Capacity = 131 GW
Coal30%
Petroleum5%
Natural Gas39%
Nuclear9%
Hydro7%
Wind6%
Others4%
United States
Total Generating Capacity = 1,063 GW
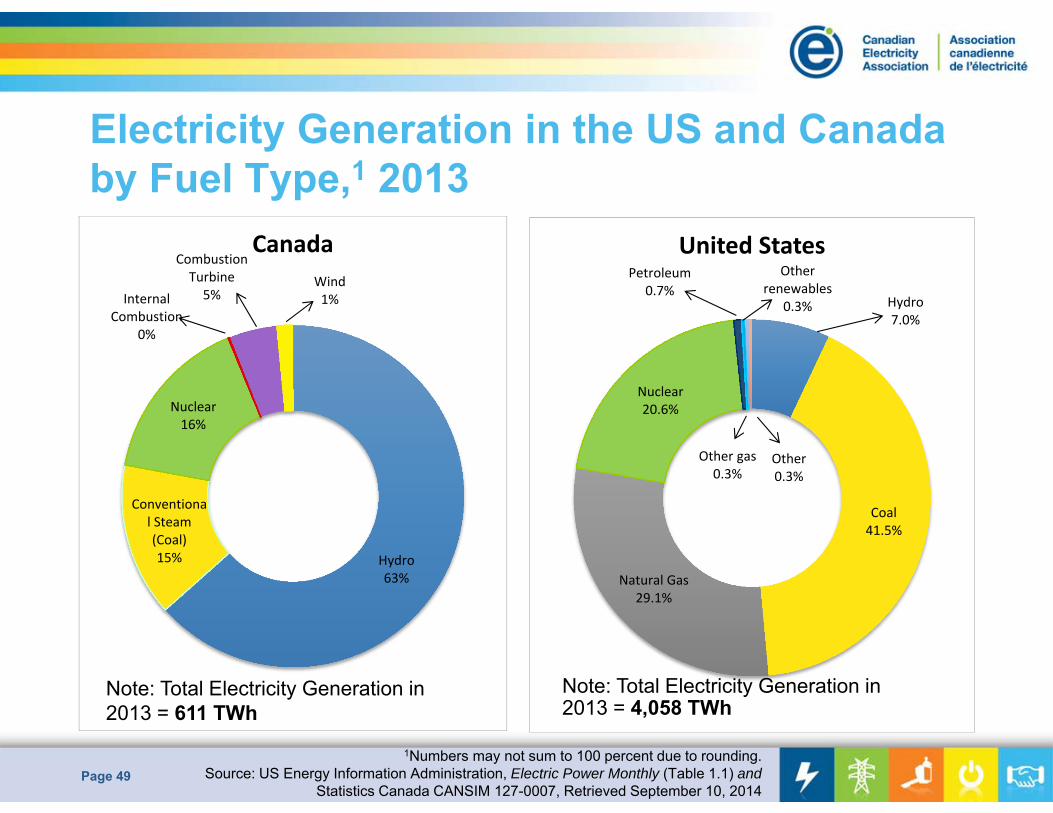
Hydro63%
Conventional Steam (Coal)15%
Nuclear16%
Combustion Turbine5%
Wind1%Internal
Combustion0%
Canada
Electricity Generation in the US and Canada by Fuel Type,1 2013
Page 49
1Numbers may not sum to 100 percent due to rounding.Source: US Energy Information Administration, Electric Power Monthly (Table 1.1) and
Statistics Canada CANSIM 127-0007, Retrieved September 10, 2014
Note: Total Electricity Generation in 2013 = 611 TWh
Hydro7.0%
Coal41.5%
Natural Gas29.1%
Nuclear20.6%
Petroleum0.7%
Other renewables
0.3%
Other gas0.3%
Other0.3%
United States
Note: Total Electricity Generation in 2013 = 4,058 TWh
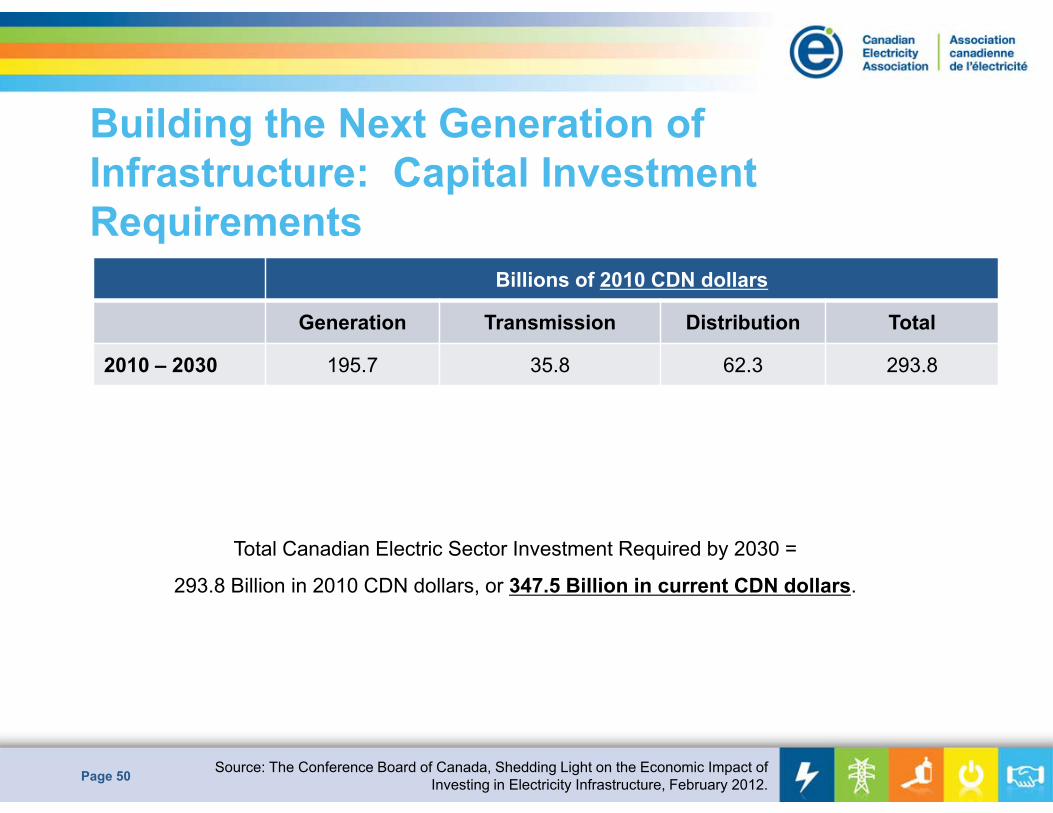
Building the Next Generation of Infrastructure: Capital Investment Requirements
Page 50
Billions of 2010 CDN dollars
Generation Transmission Distribution Total
2010 – 2030 195.7 35.8 62.3 293.8
Source: The Conference Board of Canada, Shedding Light on the Economic Impact of Investing in Electricity Infrastructure, February 2012.
Total Canadian Electric Sector Investment Required by 2030 =
293.8 Billion in 2010 CDN dollars, or 347.5 Billion in current CDN dollars.
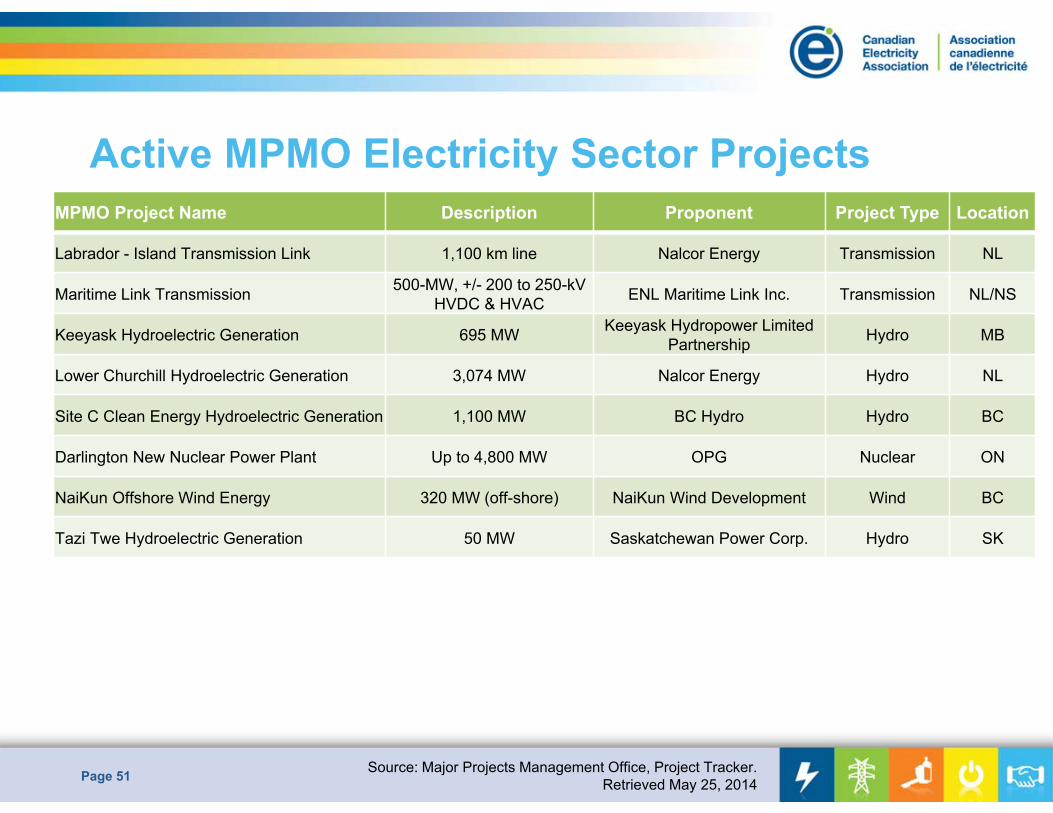
Active MPMO Electricity Sector Projects
Page 51
MPMO Project Name Description Proponent Project Type Location
Labrador - Island Transmission Link 1,100 km line Nalcor Energy Transmission NL
Maritime Link Transmission 500-MW, +/- 200 to 250-kV HVDC & HVAC ENL Maritime Link Inc. Transmission NL/NS
Keeyask Hydroelectric Generation 695 MW Keeyask Hydropower Limited Partnership Hydro MB
Lower Churchill Hydroelectric Generation 3,074 MW Nalcor Energy Hydro NL
Site C Clean Energy Hydroelectric Generation 1,100 MW BC Hydro Hydro BC
Darlington New Nuclear Power Plant Up to 4,800 MW OPG Nuclear ON
NaiKun Offshore Wind Energy 320 MW (off-shore) NaiKun Wind Development Wind BC
Tazi Twe Hydroelectric Generation 50 MW Saskatchewan Power Corp. Hydro SK
Source: Major Projects Management Office, Project Tracker. Retrieved May 25, 2014
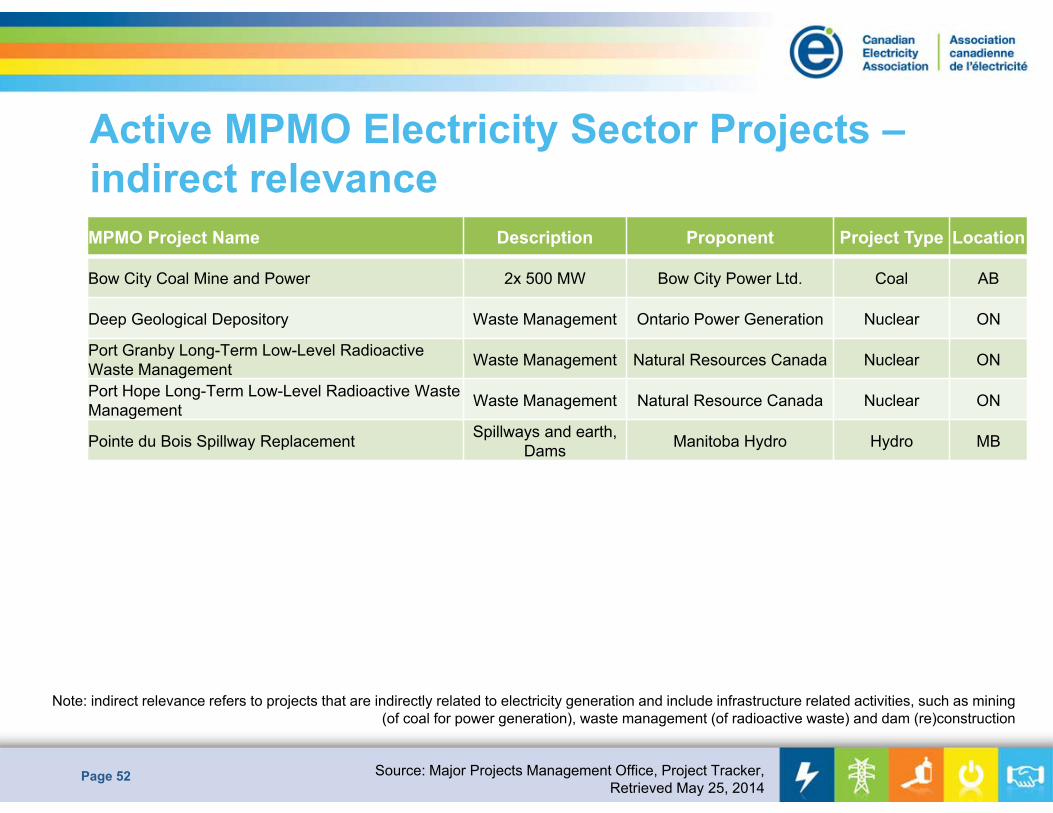
Active MPMO Electricity Sector Projects –indirect relevance
Page 52
MPMO Project Name Description Proponent Project Type Location
Bow City Coal Mine and Power 2x 500 MW Bow City Power Ltd. Coal AB
Deep Geological Depository Waste Management Ontario Power Generation Nuclear ON
Port Granby Long-Term Low-Level Radioactive Waste Management Waste Management Natural Resources Canada Nuclear ON
Port Hope Long-Term Low-Level Radioactive Waste Management Waste Management Natural Resource Canada Nuclear ON
Pointe du Bois Spillway Replacement Spillways and earth, Dams Manitoba Hydro Hydro MB
Source: Major Projects Management Office, Project Tracker, Retrieved May 25, 2014
Note: indirect relevance refers to projects that are indirectly related to electricity generation and include infrastructure related activities, such as mining (of coal for power generation), waste management (of radioactive waste) and dam (re)construction
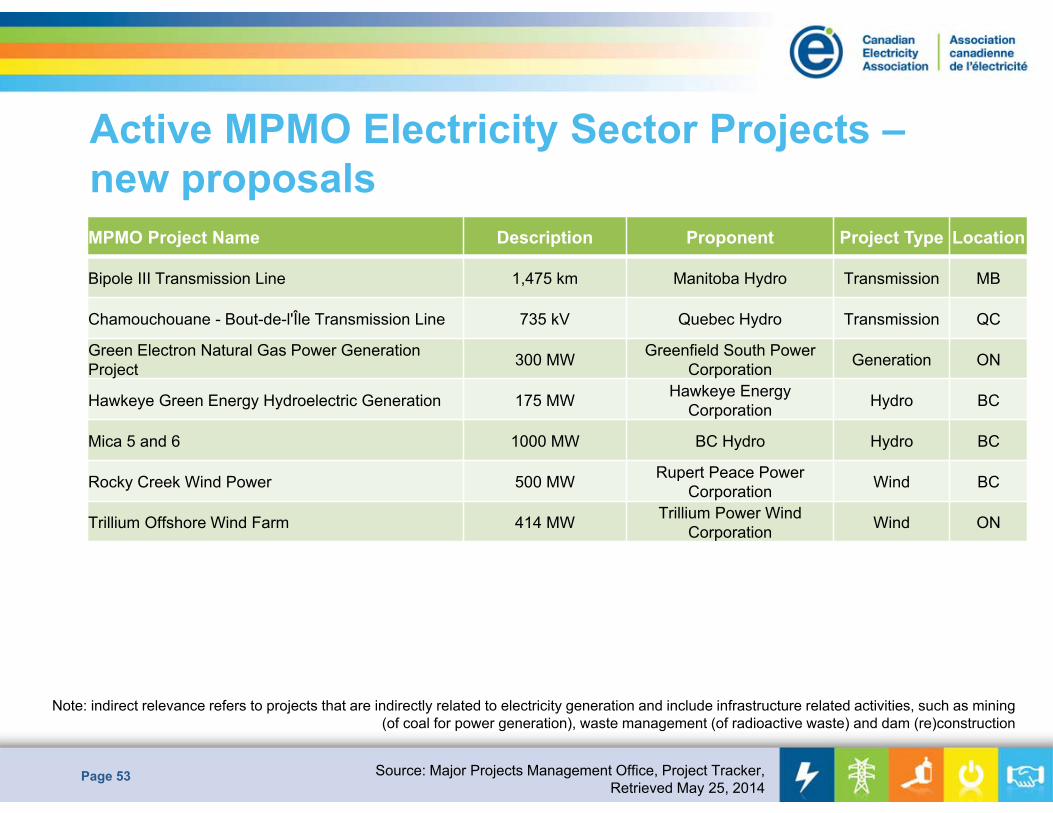
Active MPMO Electricity Sector Projects –new proposals
Page 53
MPMO Project Name Description Proponent Project Type Location
Bipole III Transmission Line 1,475 km Manitoba Hydro Transmission MB
Chamouchouane - Bout-de-l'Île Transmission Line 735 kV Quebec Hydro Transmission QC
Green Electron Natural Gas Power Generation Project 300 MW Greenfield South Power
Corporation Generation ON
Hawkeye Green Energy Hydroelectric Generation 175 MW Hawkeye Energy Corporation Hydro BC
Mica 5 and 6 1000 MW BC Hydro Hydro BC
Rocky Creek Wind Power 500 MW Rupert Peace Power Corporation Wind BC
Trillium Offshore Wind Farm 414 MW Trillium Power Wind Corporation Wind ON
Source: Major Projects Management Office, Project Tracker, Retrieved May 25, 2014
Note: indirect relevance refers to projects that are indirectly related to electricity generation and include infrastructure related activities, such as mining (of coal for power generation), waste management (of radioactive waste) and dam (re)construction
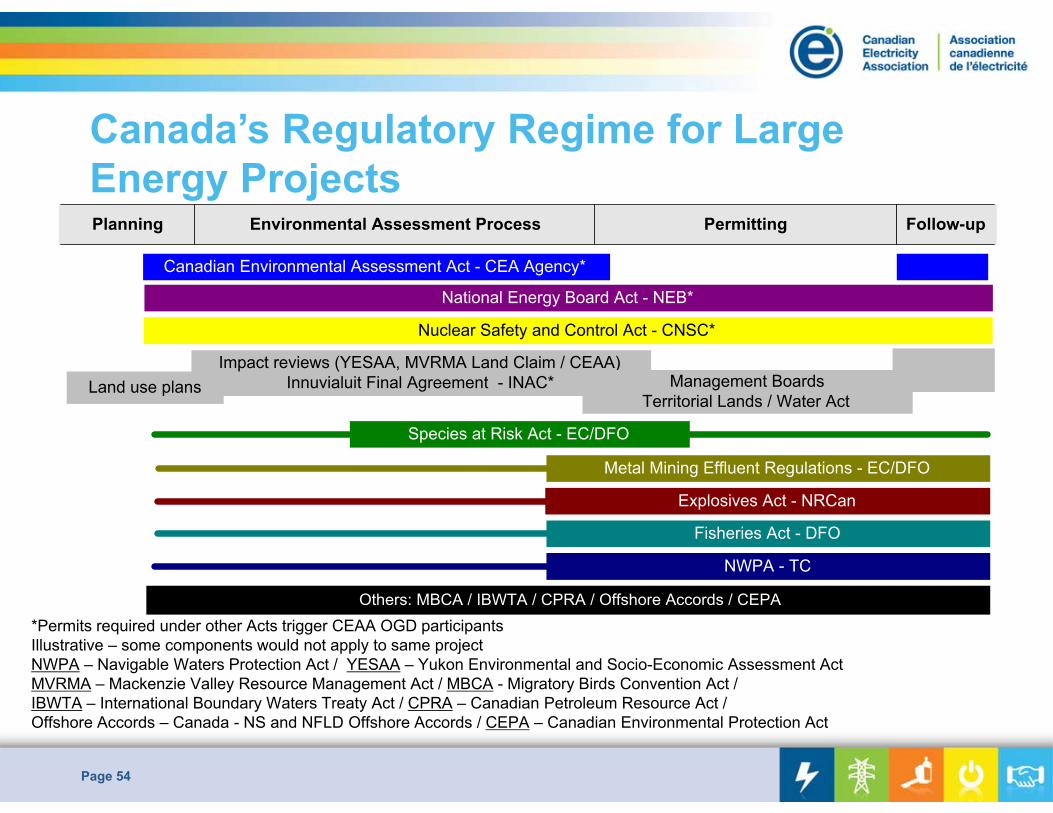
Canada’s Regulatory Regime for Large Energy Projects
Page 54
Environmental Assessment Process PermittingPlanning Follow-up
Species at Risk Act - EC/DFO
Canadian Environmental Assessment Act - CEA Agency*
Explosives Act - NRCan
Fisheries Act - DFO
NWPA - TC
Metal Mining Effluent Regulations - EC/DFO
National Energy Board Act - NEB*
Nuclear Safety and Control Act - CNSC*
Impact reviews (YESAA, MVRMA Land Claim / CEAA)Innuvialuit Final Agreement - INAC* Management Boards
Territorial Lands / Water ActLand use plans
Others: MBCA / IBWTA / CPRA / Offshore Accords / CEPA*Permits required under other Acts trigger CEAA OGD participantsIllustrative – some components would not apply to same project NWPA – Navigable Waters Protection Act / YESAA – Yukon Environmental and Socio-Economic Assessment ActMVRMA – Mackenzie Valley Resource Management Act / MBCA - Migratory Birds Convention Act / IBWTA – International Boundary Waters Treaty Act / CPRA – Canadian Petroleum Resource Act / Offshore Accords – Canada - NS and NFLD Offshore Accords / CEPA – Canadian Environmental Protection Act
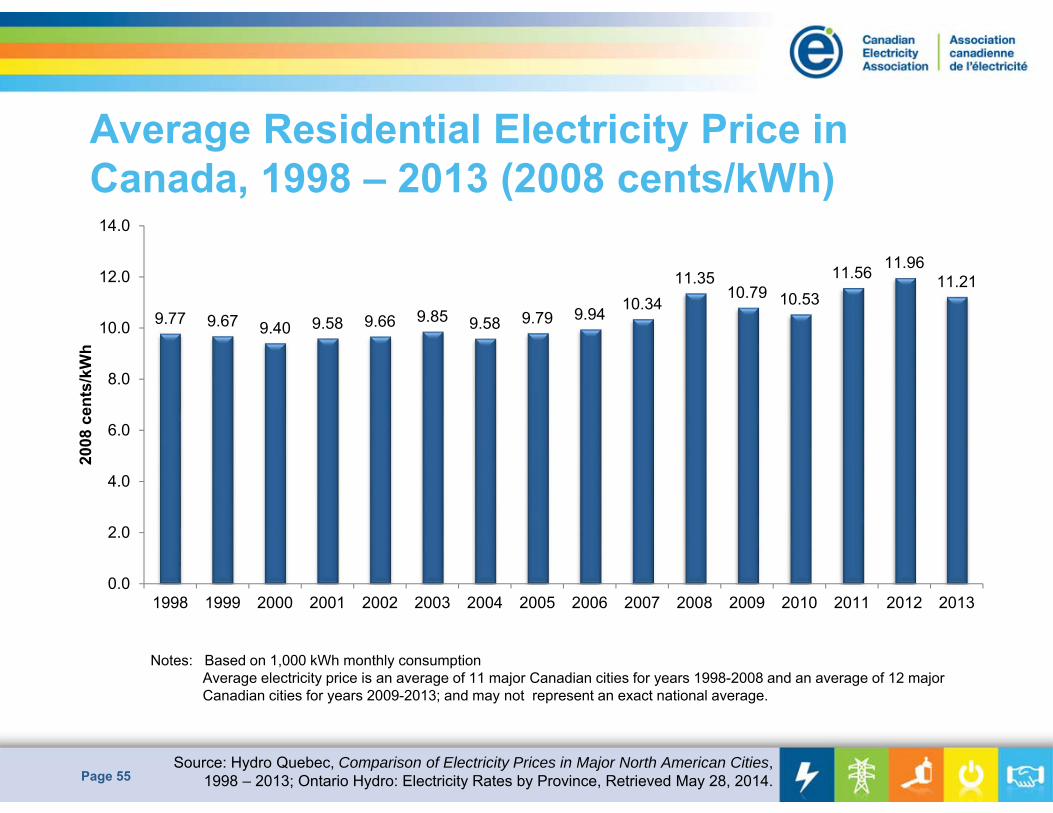
Average Residential Electricity Price in Canada, 1998 – 2013 (2008 cents/kWh)
Page 55
9.77 9.67 9.40 9.58 9.66 9.85 9.58 9.79 9.94 10.3411.35
10.79 10.5311.56 11.96
11.21
0.0
2.0
4.0
6.0
8.0
10.0
12.0
14.0
1998 1999 2000 2001 2002 2003 2004 2005 2006 2007 2008 2009 2010 2011 2012 2013
2008
cen
ts/k
Wh
Notes: Based on 1,000 kWh monthly consumptionAverage electricity price is an average of 11 major Canadian cities for years 1998-2008 and an average of 12 major Canadian cities for years 2009-2013; and may not represent an exact national average.
Source: Hydro Quebec, Comparison of Electricity Prices in Major North American Cities, 1998 – 2013; Ontario Hydro: Electricity Rates by Province, Retrieved May 28, 2014.
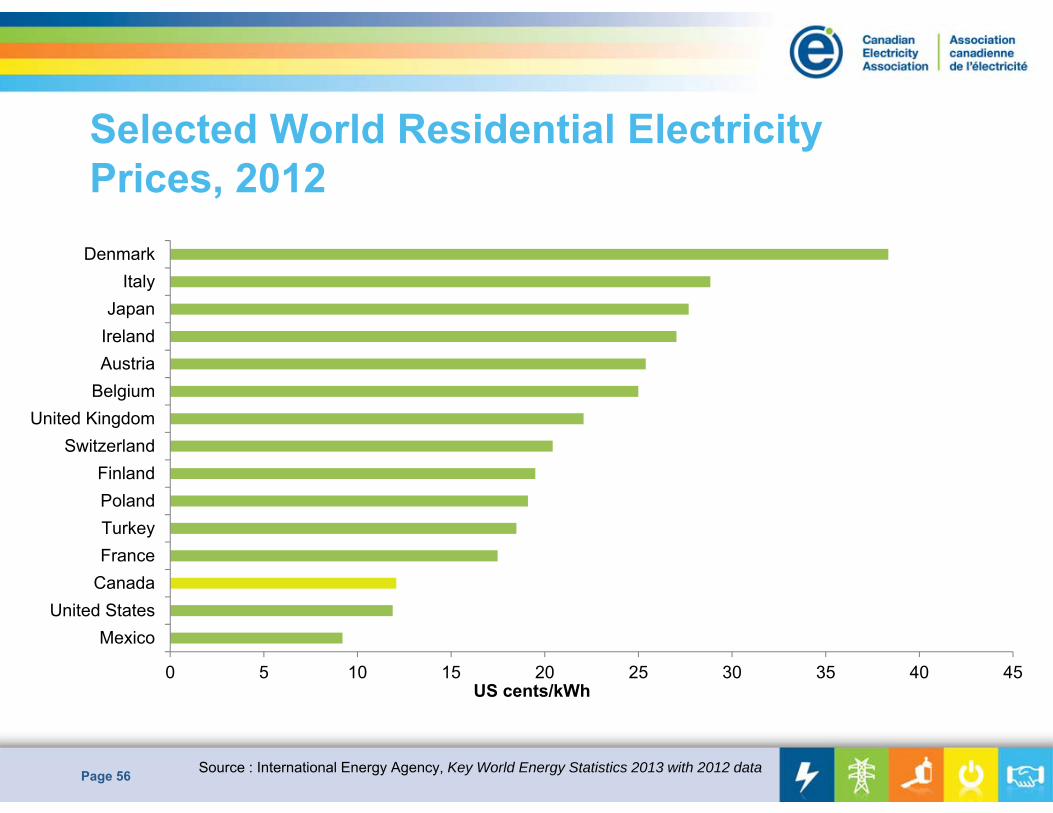
Selected World Residential Electricity Prices, 2012
Page 56
0 5 10 15 20 25 30 35 40 45
MexicoUnited States
CanadaFranceTurkeyPolandFinland
SwitzerlandUnited Kingdom
BelgiumAustriaIrelandJapan
ItalyDenmark
US cents/kWh
Source : International Energy Agency, Key World Energy Statistics 2013 with 2012 data
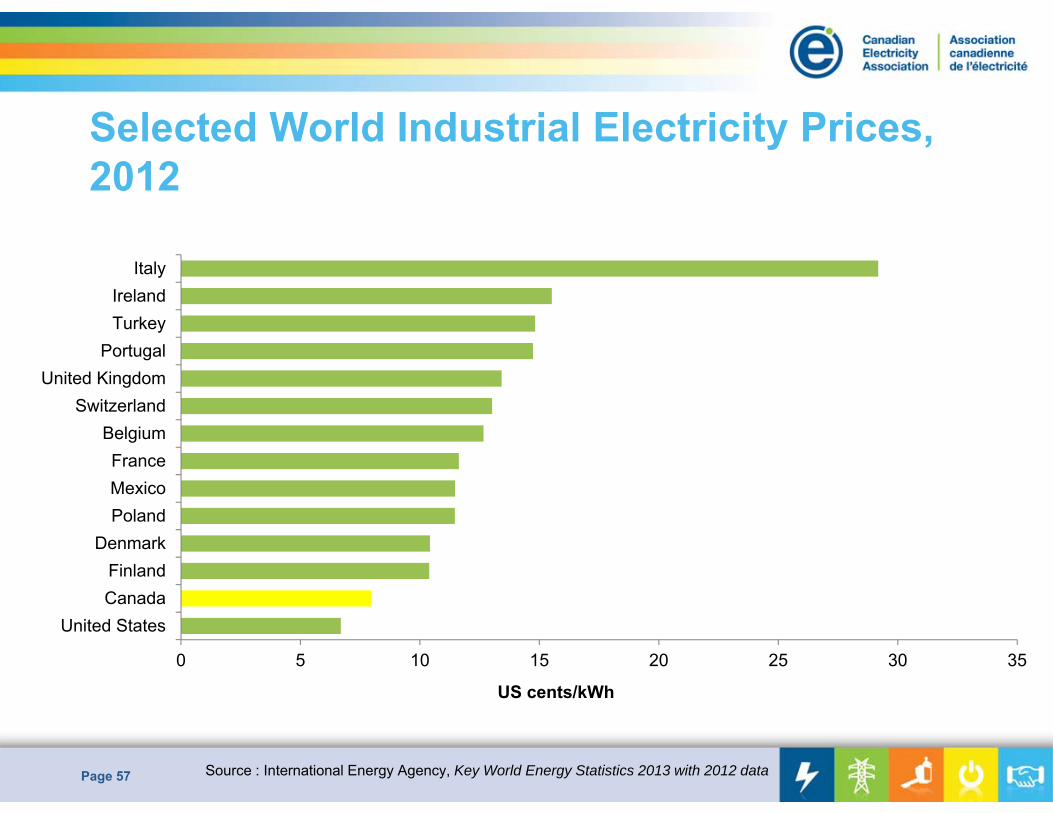
0 5 10 15 20 25 30 35
United StatesCanadaFinland
DenmarkPolandMexicoFrance
BelgiumSwitzerland
United KingdomPortugal
TurkeyIreland
Italy
US cents/kWh
Selected World Industrial Electricity Prices, 2012
Page 57 Source : International Energy Agency, Key World Energy Statistics 2013 with 2012 data
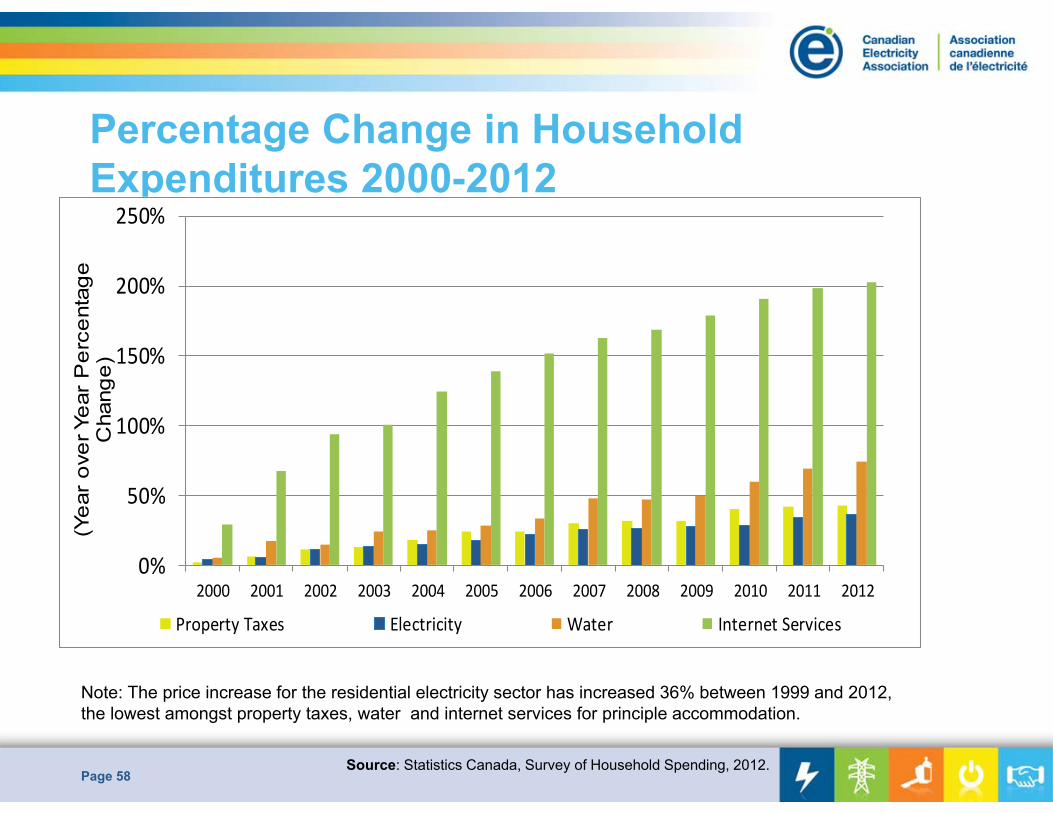
Percentage Change in Household Expenditures 2000-2012
Page 58
0%
50%
100%
150%
200%
250%
2000 2001 2002 2003 2004 2005 2006 2007 2008 2009 2010 2011 2012
(Yea
r ov
er Y
ear
Per
cent
age
Cha
nge)
Property Taxes Electricity Water Internet Services
Note: The price increase for the residential electricity sector has increased 36% between 1999 and 2012, the lowest amongst property taxes, water and internet services for principle accommodation.
Source: Statistics Canada, Survey of Household Spending, 2012.
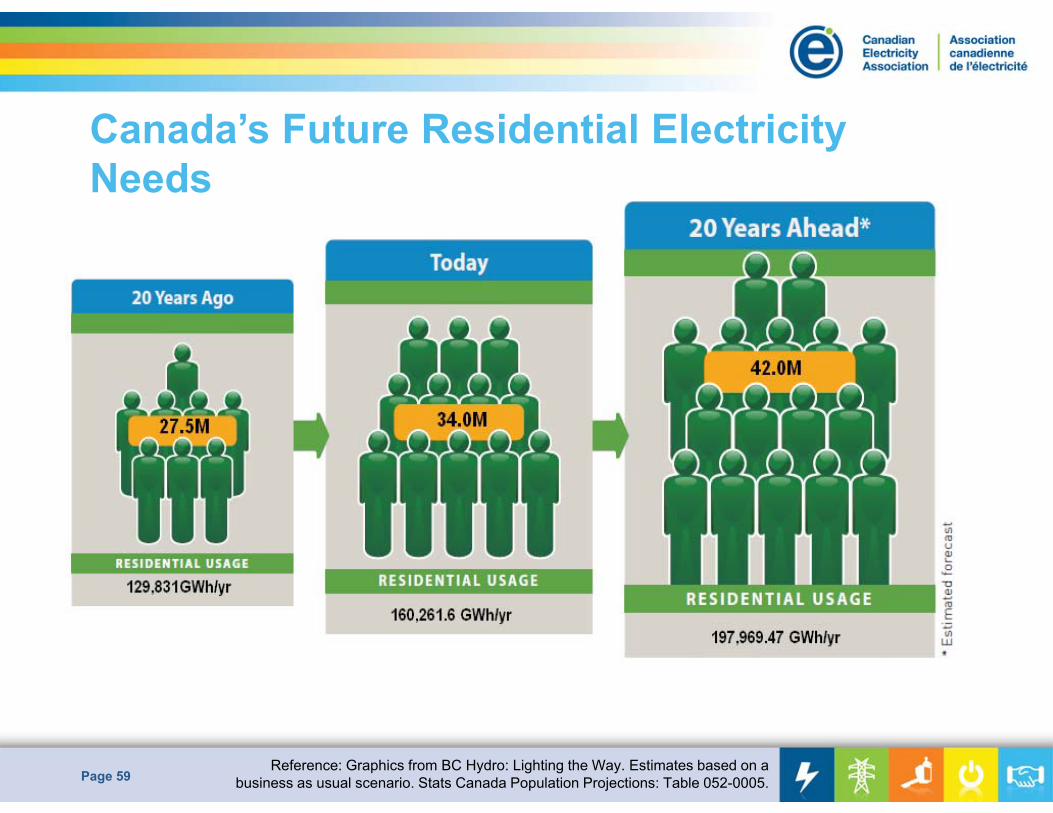
Canada’s Future Residential Electricity Needs
Page 59Reference: Graphics from BC Hydro: Lighting the Way. Estimates based on a
business as usual scenario. Stats Canada Population Projections: Table 052-0005.
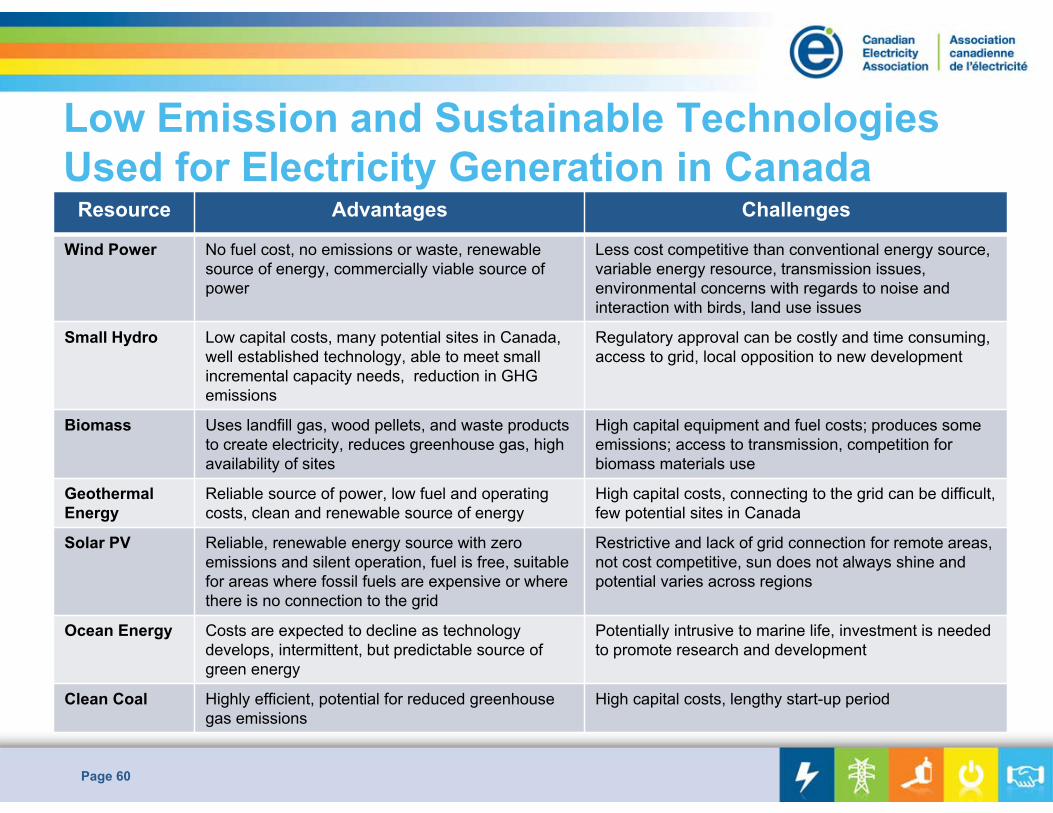
Low Emission and Sustainable Technologies Used for Electricity Generation in Canada
Page 60
Resource Advantages Challenges
Wind Power No fuel cost, no emissions or waste, renewable source of energy, commercially viable source of power
Less cost competitive than conventional energy source, variable energy resource, transmission issues, environmental concerns with regards to noise and interaction with birds, land use issues
Small Hydro Low capital costs, many potential sites in Canada, well established technology, able to meet small incremental capacity needs, reduction in GHG emissions
Regulatory approval can be costly and time consuming, access to grid, local opposition to new development
Biomass Uses landfill gas, wood pellets, and waste products to create electricity, reduces greenhouse gas, high availability of sites
High capital equipment and fuel costs; produces some emissions; access to transmission, competition for biomass materials use
Geothermal Energy
Reliable source of power, low fuel and operating costs, clean and renewable source of energy
High capital costs, connecting to the grid can be difficult, few potential sites in Canada
Solar PV Reliable, renewable energy source with zero emissions and silent operation, fuel is free, suitable for areas where fossil fuels are expensive or where there is no connection to the grid
Restrictive and lack of grid connection for remote areas, not cost competitive, sun does not always shine and potential varies across regions
Ocean Energy Costs are expected to decline as technology develops, intermittent, but predictable source of green energy
Potentially intrusive to marine life, investment is needed to promote research and development
Clean Coal Highly efficient, potential for reduced greenhouse gas emissions
High capital costs, lengthy start-up period
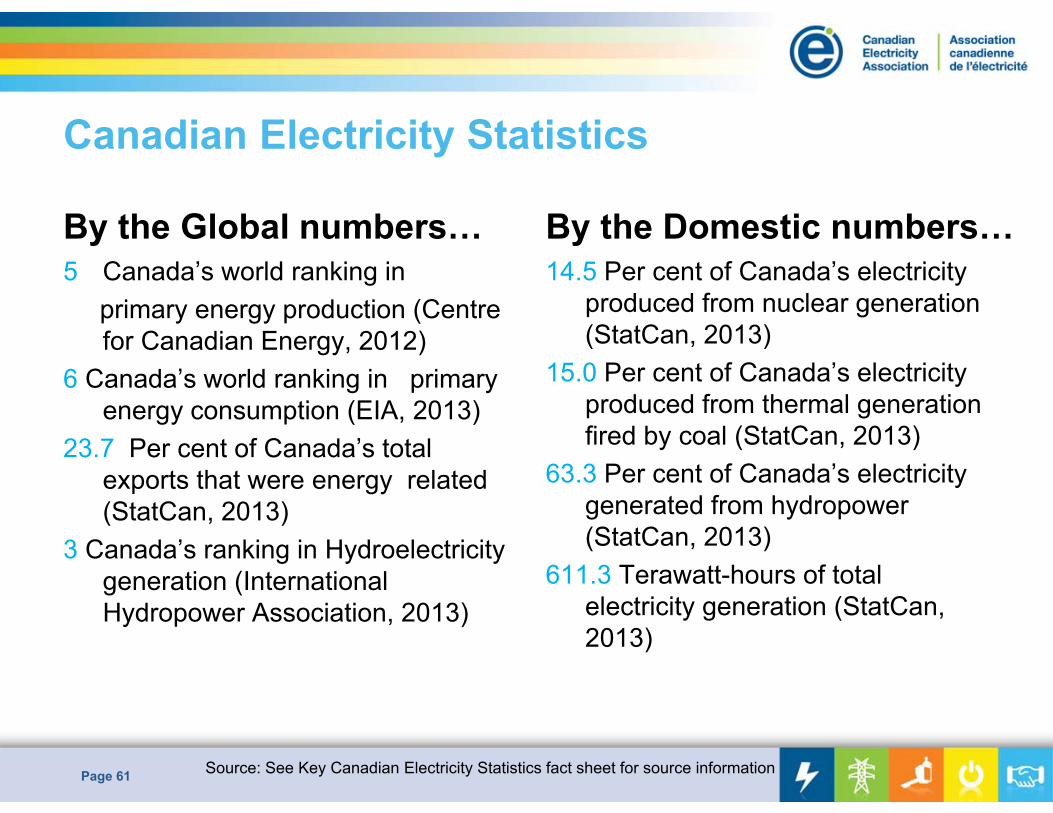
Canadian Electricity Statistics
By the Global numbers…5 Canada’s world ranking in
primary energy production (Centre for Canadian Energy, 2012)
6 Canada’s world ranking in primary energy consumption (EIA, 2013)
23.7 Per cent of Canada’s total exports that were energy related (StatCan, 2013)
3 Canada’s ranking in Hydroelectricity generation (International Hydropower Association, 2013)
By the Domestic numbers…14.5 Per cent of Canada’s electricity
produced from nuclear generation (StatCan, 2013)
15.0 Per cent of Canada’s electricity produced from thermal generation fired by coal (StatCan, 2013)
63.3 Per cent of Canada’s electricity generated from hydropower (StatCan, 2013)
611.3 Terawatt-hours of total electricity generation (StatCan, 2013)
Page 61 Source: See Key Canadian Electricity Statistics fact sheet for source information
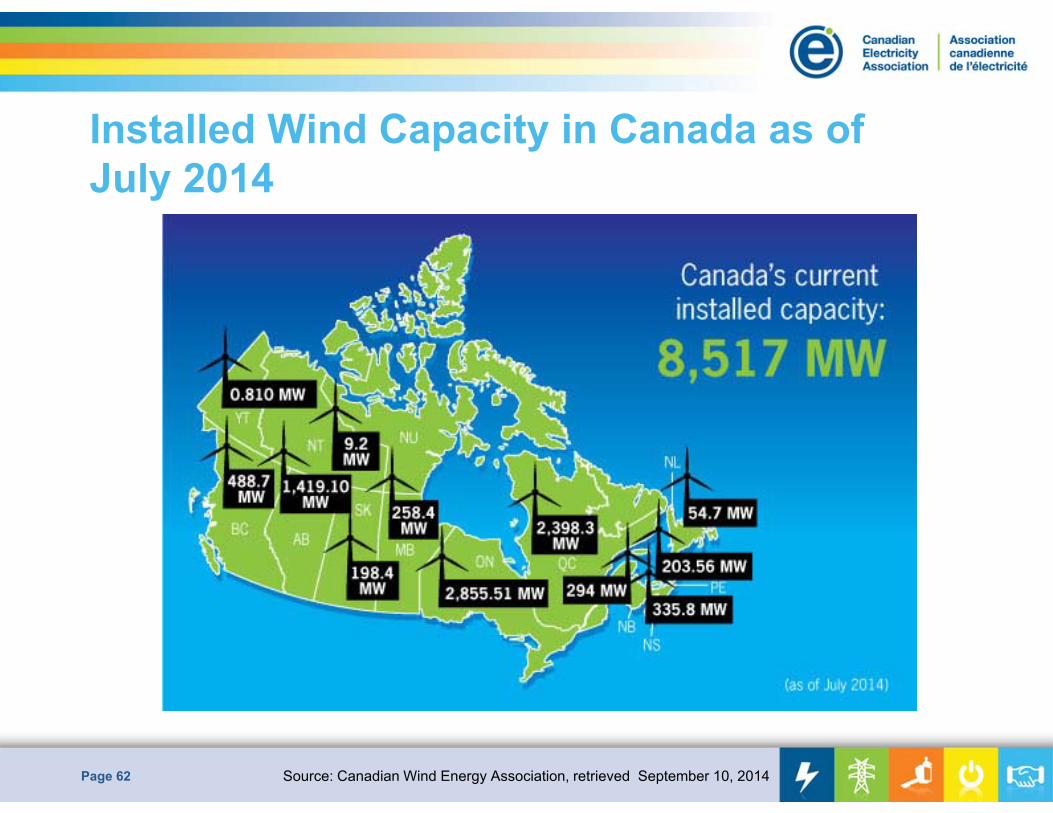
Installed Wind Capacity in Canada as of July 2014
Page 62 Source: Canadian Wind Energy Association, retrieved September 10, 2014
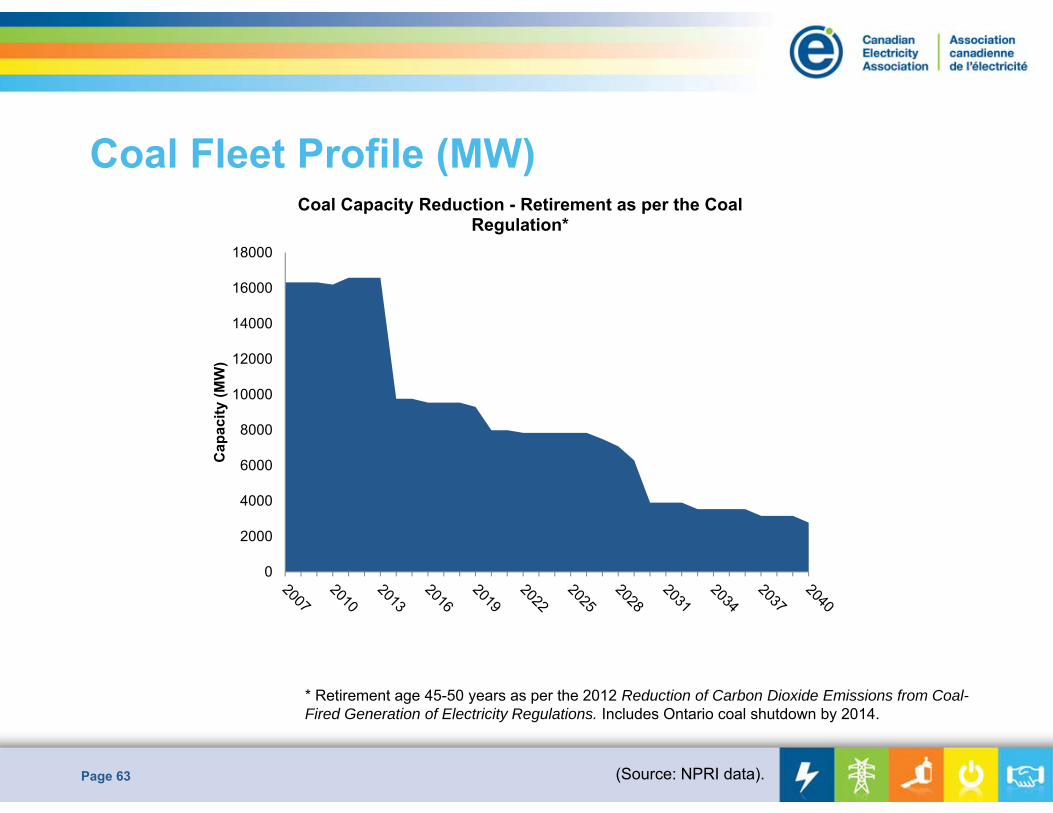
Coal Fleet Profile (MW)
Page 63 (Source: NPRI data).
0
2000
4000
6000
8000
10000
12000
14000
16000
18000
Cap
acity
(MW
)Coal Capacity Reduction - Retirement as per the Coal
Regulation*
* Retirement age 45-50 years as per the 2012 Reduction of Carbon Dioxide Emissions from Coal-Fired Generation of Electricity Regulations. Includes Ontario coal shutdown by 2014.
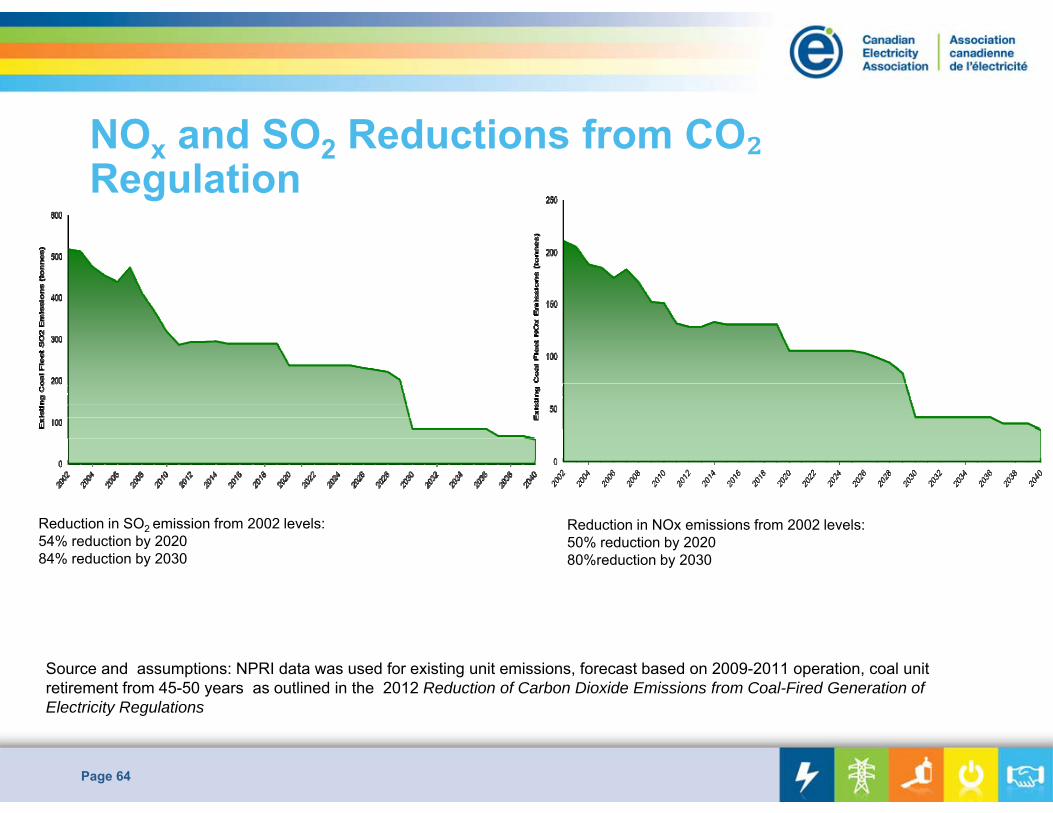
NOx and SO2 Reductions from CORegulation
Page 64
Source and assumptions: NPRI data was used for existing unit emissions, forecast based on 2009-2011 operation, coal unit retirement from 45-50 years as outlined in the 2012 Reduction of Carbon Dioxide Emissions from Coal-Fired Generation of Electricity Regulations
Reduction in NOx emissions from 2002 levels:50% reduction by 2020 80%reduction by 2030
Reduction in SO2 emission from 2002 levels:54% reduction by 2020 84% reduction by 2030
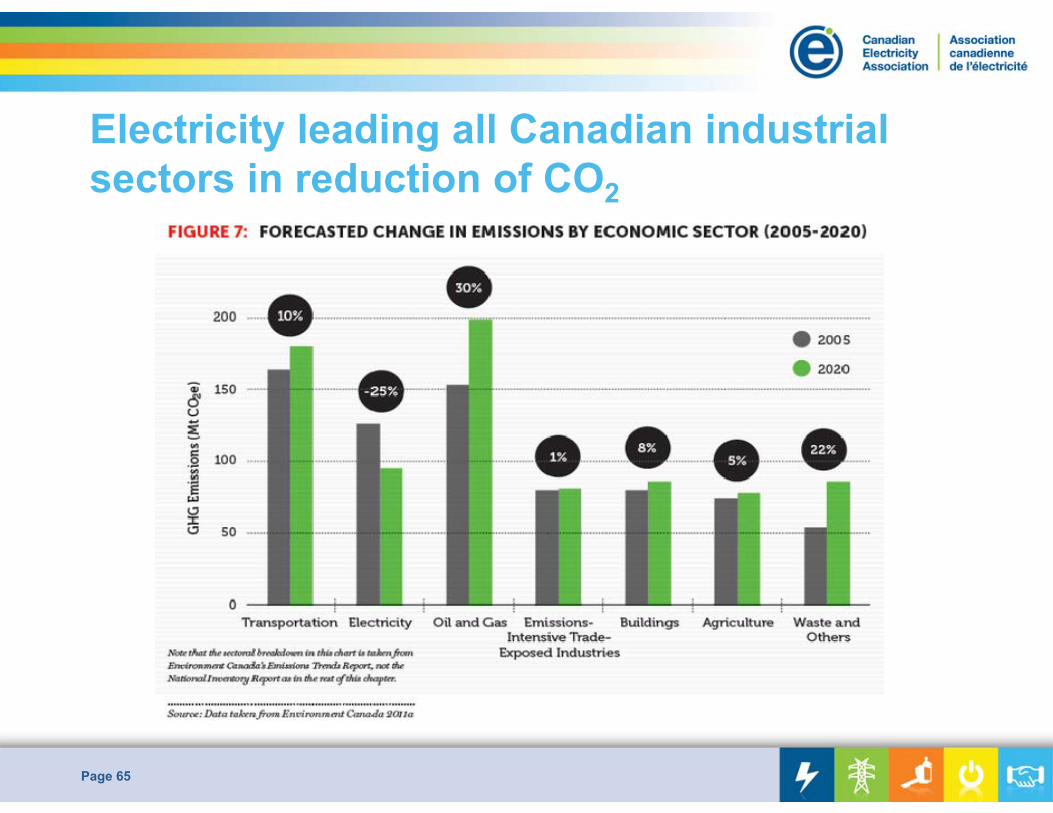
Electricity leading all Canadian industrial sectors in reduction of CO2
Page 65
Regulations to address GHG emissions from coal-fired electricity (Sept. 2012)• Establish an emissions performance standard of 420 tonnes of CO2 per gigawatt
hour of electricity produced for new coal-fired electricity generation units (those commissioned after July 1,2015), and units that have reached the end of their life.
• The proposed Regulations are to be promulgated under the Canadian Environmental Protection Act (CEPA) and are set to come into effect on July 1, 2015.
• Existing and new units may apply for a deferral in meeting the performance standard until January 1, 2025, if the technology for Carbon Capture and Storage (CCS) is incorporated.
• The regulation will be effective only if compliance is achievable.• Compliance will contribute to clarity and stability for industry that will enable
investment in electricity infrastructure to flow.• Cumulative reduction in GHG emissions of approximately 214 megatonnes and
cumulative health benefits of $4.2 billion expected in the first 21 years.• Some jurisdictions will be more heavily impacted than others.
Page 66Source: Environment Canada, Reducing Greenhouse Gas Emissions from Electricity Generation. Retrieved June 30, 2014
The CEA Councils• Generation Council
• Develops and influences policy associated with investment in electricity generation infrastructure, as well as manages environmental and health impacts related to generation
• Transmission Council• Formulates positions on transmission, including cross border reliability,
electric and magnetic fields and utility properties• Distribution Council
• Focuses on technological and regulatory developments associated with smart grid development and deployment, advanced meter performance, power quality issues, and national trends in provincial distribution utility regulation
• Customer Council• Seeks to increase the value of electricity service to Canadians
• Power Marketers Council• Promotes competitive and efficient electricity markets in Canada and the
United States
Page 67
Energy Efficiency
• Commitment to sustainability through efficient production, delivery and use of energy, while promoting energy conservation and demand side management
• CEA’s involvement in initiatives• Old refrigerator removal • Exchange programs to lower air conditioner levels during peak summer demand• Support for implementation of new technologies – smart meters for time-of-use pricing
• Promotion of conservation programs by CEA member utilities for their larger commercial, industrial and direct customers
• Demand Side Management• can be a least cost option,• postpones the development of new power plants, • improves energy efficiency
• Partnership among CEA, NRCan and utilities in promotion of ENERGY STAR qualified light fixtures
Page 68
Smart Grid
• A suite of information-based applications through increased automation of the electricity grid and the underlying automation and communication infrastructure itself
• Smart grid is posed to deliver grid resilience, environmental performance, and/or operational efficiencies
• Design and implementation of the smart grid integrated system aims to achieve desired customer priorities, interoperability with legacy infrastructure, and be appropriate for use with respect to geographical location and other needs
• Key characteristics or capabilities:• Demand response, facilitation of distributed generation, facilitation of electric vehicles,
optimization of asset use, and problem detection and mitigation• Capabilities supported by development of hard infrastructure, soft infrastructure
through stakeholder engagement• Expected results in new service offerings, reduced delivery charges, and faster
response time• Security, privacy, implementation cost, and stakeholder engagement requires collaboration
among vendors, policy-makers, regulators and utilities
Page 69
Human Resources –Commitment by CEA member utilities• Providing safe environment for general public as well as ensuring
health and safety of employees and contractors in the workplace, • Support a fair, respectful and diverse workplace for our employees and
contractors, and investing in human resources• Partnering with communities and stakeholders, communicating and
engaging in a transparent and timely manner • Engaging Aboriginal Communities while respecting their culture and
traditions
Page 70
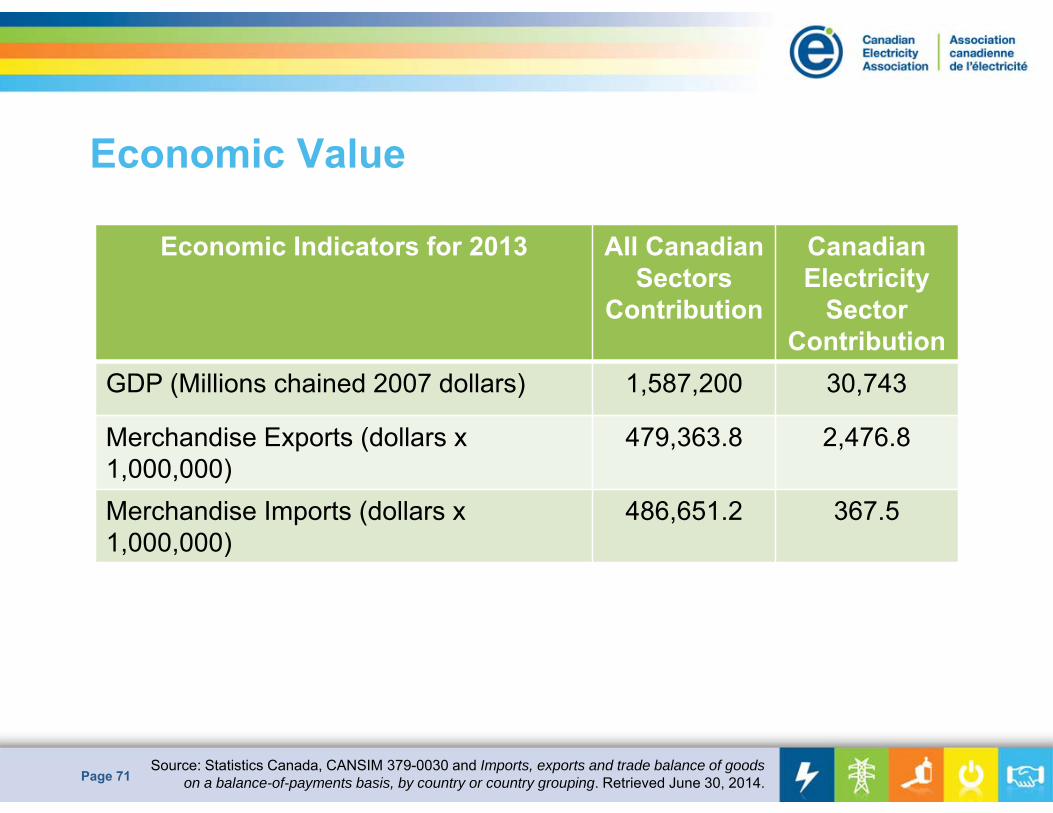
Economic Value
Page 71
Economic Indicators for 2013 All Canadian Sectors
Contribution
Canadian Electricity
Sector Contribution
GDP (Millions chained 2007 dollars) 1,587,200 30,743
Merchandise Exports (dollars x 1,000,000)
479,363.8 2,476.8
Merchandise Imports (dollars x 1,000,000)
486,651.2 367.5
Source: Statistics Canada, CANSIM 379-0030 and Imports, exports and trade balance of goods on a balance-of-payments basis, by country or country grouping. Retrieved June 30, 2014.
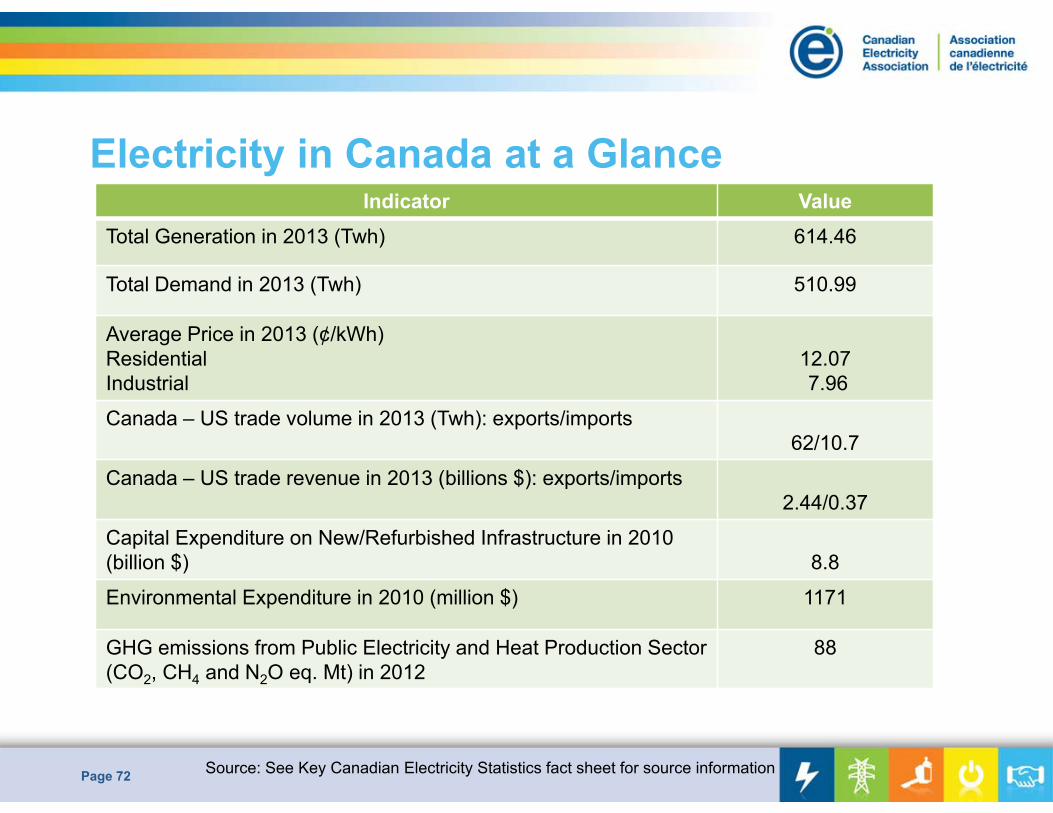
Electricity in Canada at a Glance
Page 72
Indicator ValueTotal Generation in 2013 (Twh) 614.46
Total Demand in 2013 (Twh) 510.99
Average Price in 2013 (¢/kWh) ResidentialIndustrial
12.07 7.96
Canada – US trade volume in 2013 (Twh): exports/imports62/10.7
Canada – US trade revenue in 2013 (billions $): exports/imports2.44/0.37
Capital Expenditure on New/Refurbished Infrastructure in 2010 (billion $) 8.8
Environmental Expenditure in 2010 (million $) 1171
GHG emissions from Public Electricity and Heat Production Sector (CO2, CH4 and N2O eq. Mt) in 2012
88
Source: See Key Canadian Electricity Statistics fact sheet for source information
For more information, contact:
Canadian Electricity Association275 Slater Street, Suite 1500
Ottawa, ON K1P 5H9
613 230 9263
Page 73