Embed Size (px)
Citation preview
Electricity Industry Act 2004
Electricity Distribution Licence Performance Reporting Handbook
May 2014
Economic Regulation Authority
© Economic Regulation Authority 2014
This document is available from the Economic Regulation Authority’s website at www.erawa.com.au. For further information, contact:
Economic Regulation Authority Perth, Western Australia Phone: (08) 6557 7900
Economic Regulation Authority
Electricity Distribution Licence Performance Reporting Handbook 1
Contents
1 Background 2
2 Purpose of this Handbook 2
3 Performance Reporting Tools 3
4 Completing the Performance Report 3
5 Submission of Completed Datasheets to the Authority 1
6 Customer Connections 2
7 Network Reliability 4
8 Complaints 7
9 Compensation Payments 10
10 Timely Repair of Faulty Streetlights 11
11 Call Centre Performance 12
12 Network and Asset Information 14
Economic Regulation Authority
Electricity Distribution Licence Performance Reporting Handbook 2
1 Background
The Economic Regulation Authority (Authority) is responsible for administering the electricity licensing scheme under Part 2 of the Electricity Industry Act 2004 (Act). A business licensed by the Authority is required to comply with a range of obligations prescribed by the Act and its associated regulations and codes.
Under section 11/Schedule 1 of the Act, the Authority may determine licence terms and conditions, including requiring a licensee to provide to the Authority specified information in relation to the licence. Clause 16.1 of electricity distribution licences and electricity integrated regional licences states:
The licensee must provide to the Authority any information that the Authority may require in connection with its functions under the Act in the time, manner and form specified by the Authority.
The obligation to provide performance data only applies to the holders of electricity distribution licences and electricity integrated regional licences who supply electricity to small use customers (customers who consume less than 160MWh of electricity per annum).
Prior to 2014, the specification of the performance data to be provided by the relevant electricity retailers was specified in section 18.2 of the Electricity Compliance Reporting Manual (Manual). The Authority has decided to remove the indicators from the Manual and use this Handbook as the sole source of information about distributor’s performance reporting obligations.
2 Purpose of this Handbook
This document has been developed to inform licensees about the non-financial performance data that is to be provided to the Authority for the year ending 30 June 2014.
It is important that there is a shared understanding amongst all stakeholders of the information that is to be reported by electricity retail licensees, including the definitions to be applied to the performance indicators and the Authority’s expectations as to the manner in which the information should be presented. Consistent with this objective, the Authority has issued this guide to inform electricity distribution licensees about:
the performance indicators that distributor are required to report against;
the definitions to be applied to the performance indicators in the performance reports;
how to calculate the performance data (where applicable); and
how and when the data is to be provided to the Authority.
Where reference is made to other documents within this Handbook, the Authority recommends that the licensee familiarises themselves with these documents in order to obtain a fuller understanding of the reporting context. Of particular note is the Code of Conduct for the Supply of Electricity to Small Use Customers 2012 (Code of Conduct), the
Economic Regulation Authority
Electricity Distribution Licence Performance Reporting Handbook 3
Electricity Industry (Network Quality and Reliability of Supply) Code 2005 (NQ&R Code) and the 2007 SCONRRR Report.12
3 Performance Reporting Tools
The Authority has issued a two Microsoft Excel workbooks which together are called the Performance Reporting Datasheets – Electricity Distributors (Distribution Datasheets). The first workbook covers obligations arising from the Customer Code while the second workbook covers obligations arising from the NQ&R Code. It is mandatory for licensees to provide completed Distribution Datasheets for the year ending 30 June 2014 to the Authority by 20 September 2014. The latest version of the Distribution Datasheets can be found on the Authority’s website.3
The Datasheets relating to the Customer Code has five sections:
Customer Connections;
Complaints;
Compensation Payments;
Timely Repair of Faulty Streetlights; and
Call Centre Performance.
The Datasheets relating to the NQ&R Code has four sections:
Network Reliability;
Complaints;
Compensation Payments; and
Network and Asset Information.
4 Completing the Distribution Datasheets
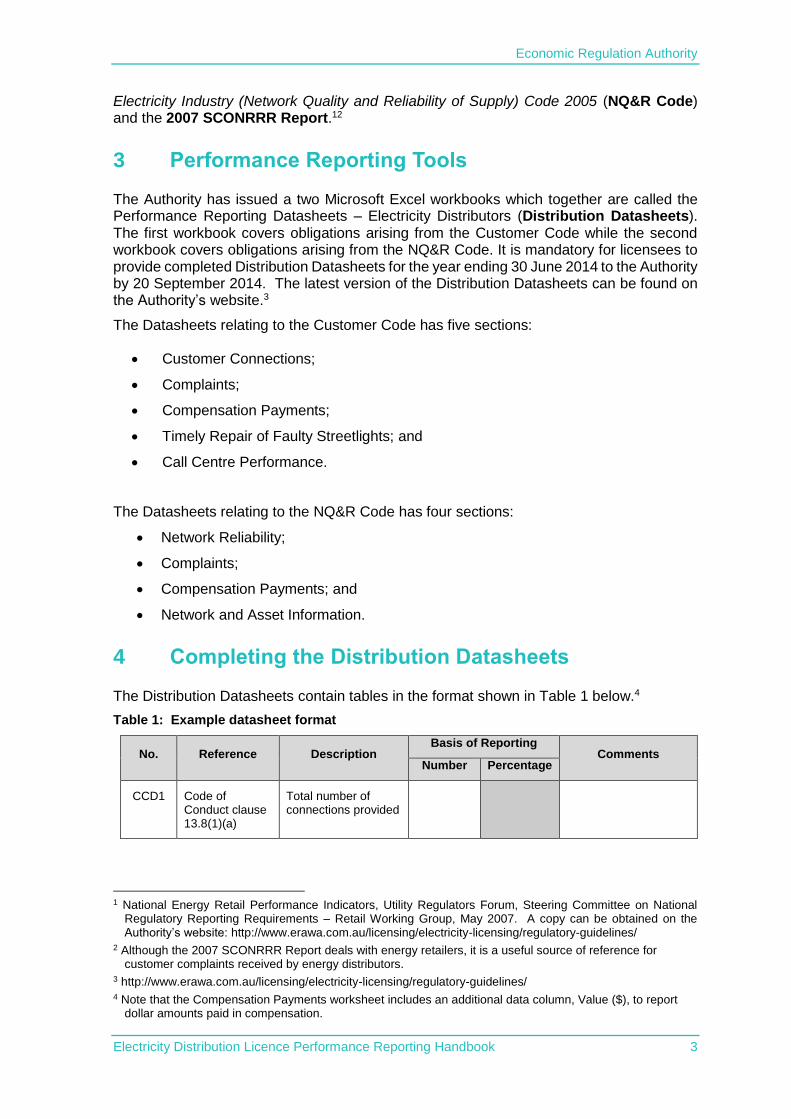
The Distribution Datasheets contain tables in the format shown in Table 1 below.4
Table 1: Example datasheet format
No. Reference Description Basis of Reporting
Comments Number Percentage
CCD1 Code of Conduct clause 13.8(1)(a)
Total number of connections provided
1 National Energy Retail Performance Indicators, Utility Regulators Forum, Steering Committee on National
Regulatory Reporting Requirements – Retail Working Group, May 2007. A copy can be obtained on the Authority’s website: http://www.erawa.com.au/licensing/electricity-licensing/regulatory-guidelines/
2 Although the 2007 SCONRRR Report deals with energy retailers, it is a useful source of reference for customer complaints received by energy distributors.
3 http://www.erawa.com.au/licensing/electricity-licensing/regulatory-guidelines/ 4 Note that the Compensation Payments worksheet includes an additional data column, Value ($), to report
dollar amounts paid in compensation.
Economic Regulation Authority
Electricity Distribution Licence Performance Reporting Handbook 4
When completing the Distribution Datasheets it is important that the structure of the data entry cells is not modified by inserting, deleting or re-ordering rows/columns. A number of cells contain values that are calculated from data that has been entered into other cells. These cells have been shaded yellow for identification purposes.
Only enter data into the cells that are not shaded grey or yellow. In relation to network reliability and network asset information, enter the data by completing the tables in Annexure 1 and Annexure 2.
If it is necessary to add a comment in relation to an indicator, add the comment in the ‘Comments' column.
Referring to the example in Table 1:
The No. column contains the unique reference number for the indicator. In this case the indicator is in the Customers table.
The reference column identifies the document from which the indicator has been derived, if applicable. In this case, it is the Code of Conduct.
The description column provides a short form explanation of what the indicator is intended to measure.
The basis of reporting column offers 2 or 3 options (depending on the category):
– Number (this is used to enter any numerical value other than a percentage or a dollar value).
– Percentage (in most cases, this is automatically generated from numerical data).
– Value ($).
The data entry cells have been formatted to align with the required degree of accuracy (i.e. the number of decimal places) appropriate for each indicator.
If it is not possible to provide the required data for an indicator then the cell should be left blank and a comment added in the ‘Comments’ cell to explain why the data cannot be provided.
The ‘Comments’ cell should also be used to add explanatory notes where there has been significant change in values from previous reporting periods, or where the licensee feels that additional context to the data provided is necessary.
5 Submission of Completed Distribution Datasheets to the Authority
The Authority requires the following licensees to lodge completed Distribution Datasheets:
Electricity Networks Corporation (t/a Western Power)
Regional Power Corporation (t/a Horizon Power)
Rottnest Island Authority
The completed Datasheets are to be provided to the Authority electronically by email at: [email protected]
The document can also be submitted on a USB memory stick or CD-ROM:
By post at: PO Box 8469, PERTH BC WA 6849
By hand at: Level 4, Albert Facey House, 469 Wellington Street, PERTH WA 6000
It is important to note that compliance with clause 16.1 of the licence will not be achieved until an electronic copy of the Distribution Datasheets has been received by the Authority.
.
6 Customer Connections
Purpose
To report on:
the number of small use customer5 connections supplied by each gas distribution network; and
the number of reconnections that were not provided on time.
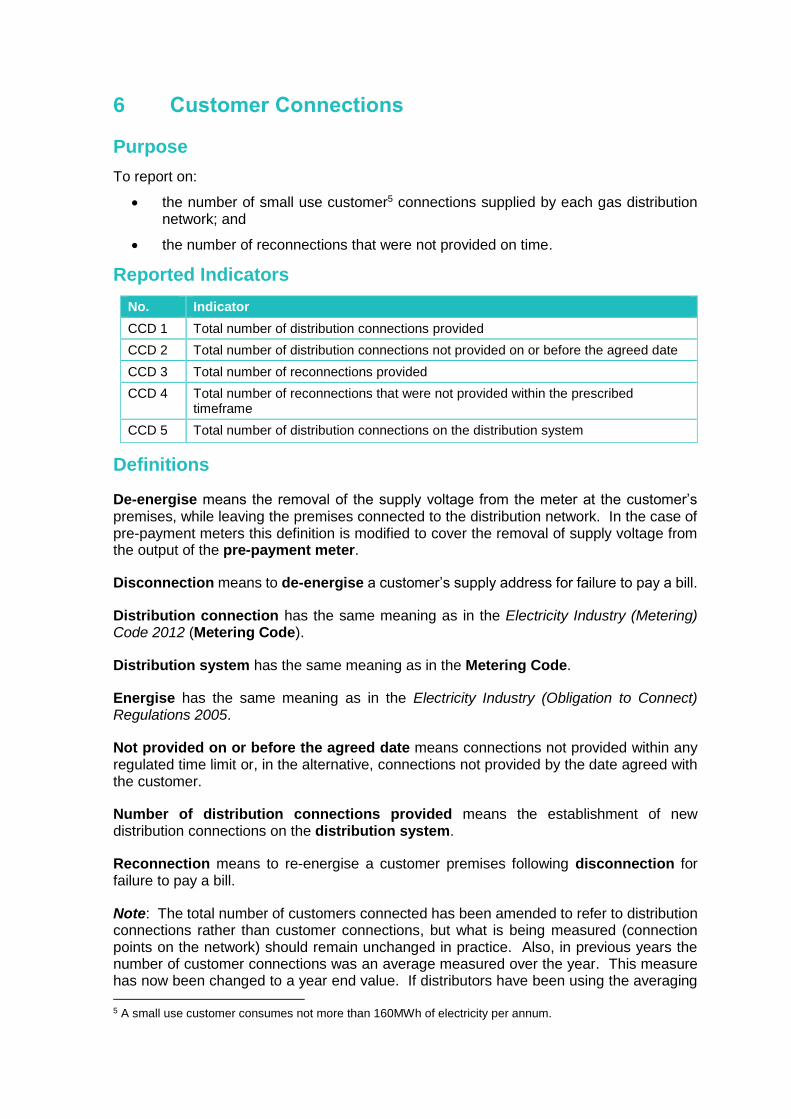
Reported Indicators
No. Indicator
CCD 1 Total number of distribution connections provided
CCD 2 Total number of distribution connections not provided on or before the agreed date
CCD 3 Total number of reconnections provided
CCD 4 Total number of reconnections that were not provided within the prescribed timeframe
CCD 5 Total number of distribution connections on the distribution system
Definitions
De-energise means the removal of the supply voltage from the meter at the customer’s premises, while leaving the premises connected to the distribution network. In the case of pre-payment meters this definition is modified to cover the removal of supply voltage from the output of the pre-payment meter.
Disconnection means to de-energise a customer’s supply address for failure to pay a bill.
Distribution connection has the same meaning as in the Electricity Industry (Metering) Code 2012 (Metering Code).
Distribution system has the same meaning as in the Metering Code.
Energise has the same meaning as in the Electricity Industry (Obligation to Connect) Regulations 2005.
Not provided on or before the agreed date means connections not provided within any regulated time limit or, in the alternative, connections not provided by the date agreed with the customer.
Number of distribution connections provided means the establishment of new distribution connections on the distribution system.
Reconnection means to re-energise a customer premises following disconnection for failure to pay a bill.
Note: The total number of customers connected has been amended to refer to distribution connections rather than customer connections, but what is being measured (connection points on the network) should remain unchanged in practice. Also, in previous years the number of customer connections was an average measured over the year. This measure has now been changed to a year end value. If distributors have been using the averaging
5 A small use customer consumes not more than 160MWh of electricity per annum.

method in previous years then they have the option to continue doing so, subject to including a comment to this effect in the datasheet.
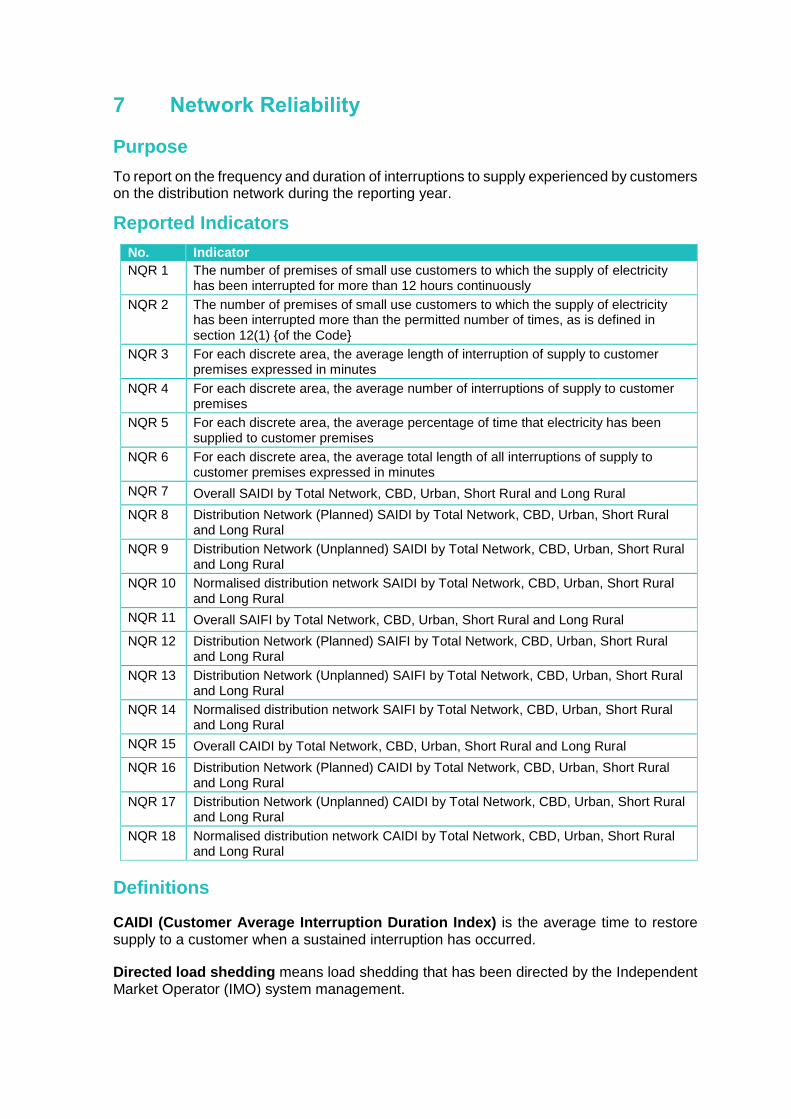
7 Network Reliability
Purpose
To report on the frequency and duration of interruptions to supply experienced by customers on the distribution network during the reporting year.
Reported Indicators
No. Indicator
NQR 1 The number of premises of small use customers to which the supply of electricity has been interrupted for more than 12 hours continuously
NQR 2 The number of premises of small use customers to which the supply of electricity has been interrupted more than the permitted number of times, as is defined in section 12(1) {of the Code}
NQR 3 For each discrete area, the average length of interruption of supply to customer premises expressed in minutes
NQR 4 For each discrete area, the average number of interruptions of supply to customer premises
NQR 5 For each discrete area, the average percentage of time that electricity has been supplied to customer premises
NQR 6 For each discrete area, the average total length of all interruptions of supply to customer premises expressed in minutes
NQR 7 Overall SAIDI by Total Network, CBD, Urban, Short Rural and Long Rural
NQR 8 Distribution Network (Planned) SAIDI by Total Network, CBD, Urban, Short Rural and Long Rural
NQR 9 Distribution Network (Unplanned) SAIDI by Total Network, CBD, Urban, Short Rural and Long Rural
NQR 10 Normalised distribution network SAIDI by Total Network, CBD, Urban, Short Rural and Long Rural
NQR 11 Overall SAIFI by Total Network, CBD, Urban, Short Rural and Long Rural
NQR 12 Distribution Network (Planned) SAIFI by Total Network, CBD, Urban, Short Rural and Long Rural
NQR 13 Distribution Network (Unplanned) SAIFI by Total Network, CBD, Urban, Short Rural and Long Rural
NQR 14 Normalised distribution network SAIFI by Total Network, CBD, Urban, Short Rural and Long Rural
NQR 15 Overall CAIDI by Total Network, CBD, Urban, Short Rural and Long Rural
NQR 16 Distribution Network (Planned) CAIDI by Total Network, CBD, Urban, Short Rural and Long Rural
NQR 17 Distribution Network (Unplanned) CAIDI by Total Network, CBD, Urban, Short Rural and Long Rural
NQR 18 Normalised distribution network CAIDI by Total Network, CBD, Urban, Short Rural and Long Rural
Definitions
CAIDI (Customer Average Interruption Duration Index) is the average time to restore supply to a customer when a sustained interruption has occurred.
Directed load shedding means load shedding that has been directed by the Independent Market Operator (IMO) system management.
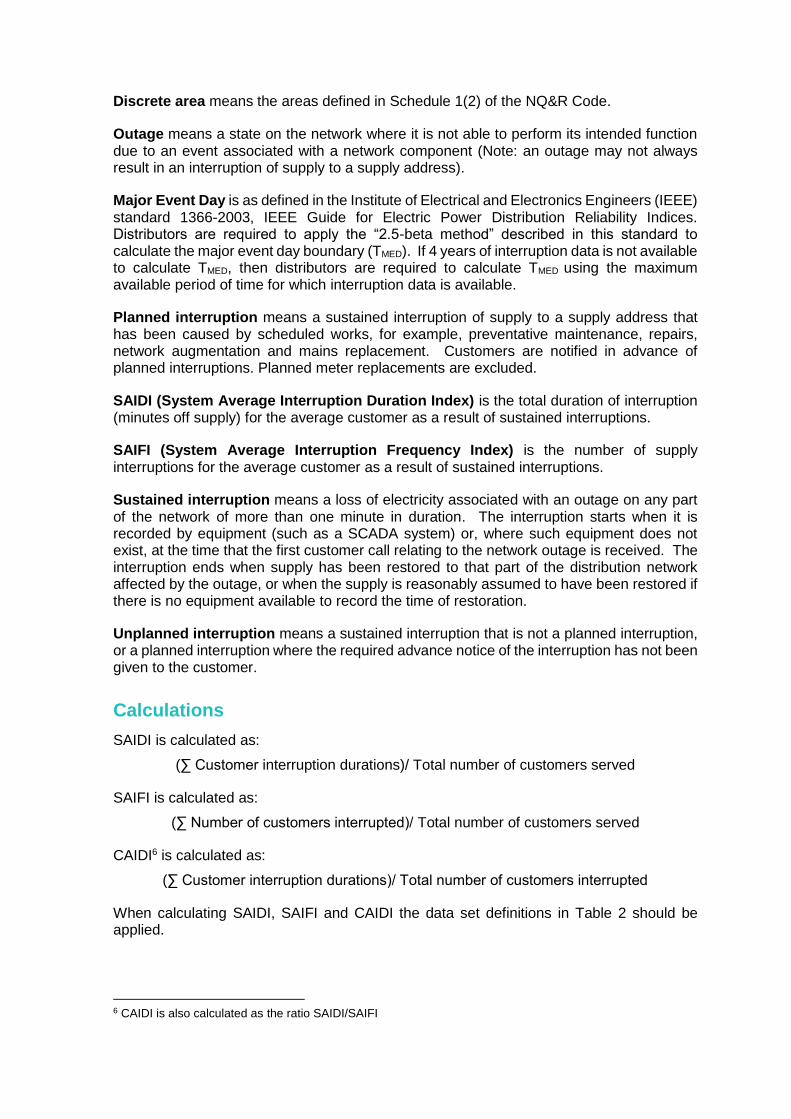
Discrete area means the areas defined in Schedule 1(2) of the NQ&R Code.
Outage means a state on the network where it is not able to perform its intended function due to an event associated with a network component (Note: an outage may not always result in an interruption of supply to a supply address).
Major Event Day is as defined in the Institute of Electrical and Electronics Engineers (IEEE) standard 1366-2003, IEEE Guide for Electric Power Distribution Reliability Indices. Distributors are required to apply the “2.5-beta method” described in this standard to calculate the major event day boundary (TMED). If 4 years of interruption data is not available to calculate TMED, then distributors are required to calculate TMED using the maximum available period of time for which interruption data is available.
Planned interruption means a sustained interruption of supply to a supply address that has been caused by scheduled works, for example, preventative maintenance, repairs, network augmentation and mains replacement. Customers are notified in advance of planned interruptions. Planned meter replacements are excluded.
SAIDI (System Average Interruption Duration Index) is the total duration of interruption (minutes off supply) for the average customer as a result of sustained interruptions.
SAIFI (System Average Interruption Frequency Index) is the number of supply interruptions for the average customer as a result of sustained interruptions.
Sustained interruption means a loss of electricity associated with an outage on any part of the network of more than one minute in duration. The interruption starts when it is recorded by equipment (such as a SCADA system) or, where such equipment does not exist, at the time that the first customer call relating to the network outage is received. The interruption ends when supply has been restored to that part of the distribution network affected by the outage, or when the supply is reasonably assumed to have been restored if there is no equipment available to record the time of restoration.
Unplanned interruption means a sustained interruption that is not a planned interruption, or a planned interruption where the required advance notice of the interruption has not been given to the customer.
Calculations
SAIDI is calculated as:
(∑ Customer interruption durations)/ Total number of customers served
SAIFI is calculated as:
(∑ Number of customers interrupted)/ Total number of customers served
CAIDI6 is calculated as:
(∑ Customer interruption durations)/ Total number of customers interrupted
When calculating SAIDI, SAIFI and CAIDI the data set definitions in Table 2 should be applied.
6 CAIDI is also calculated as the ratio SAIDI/SAIFI
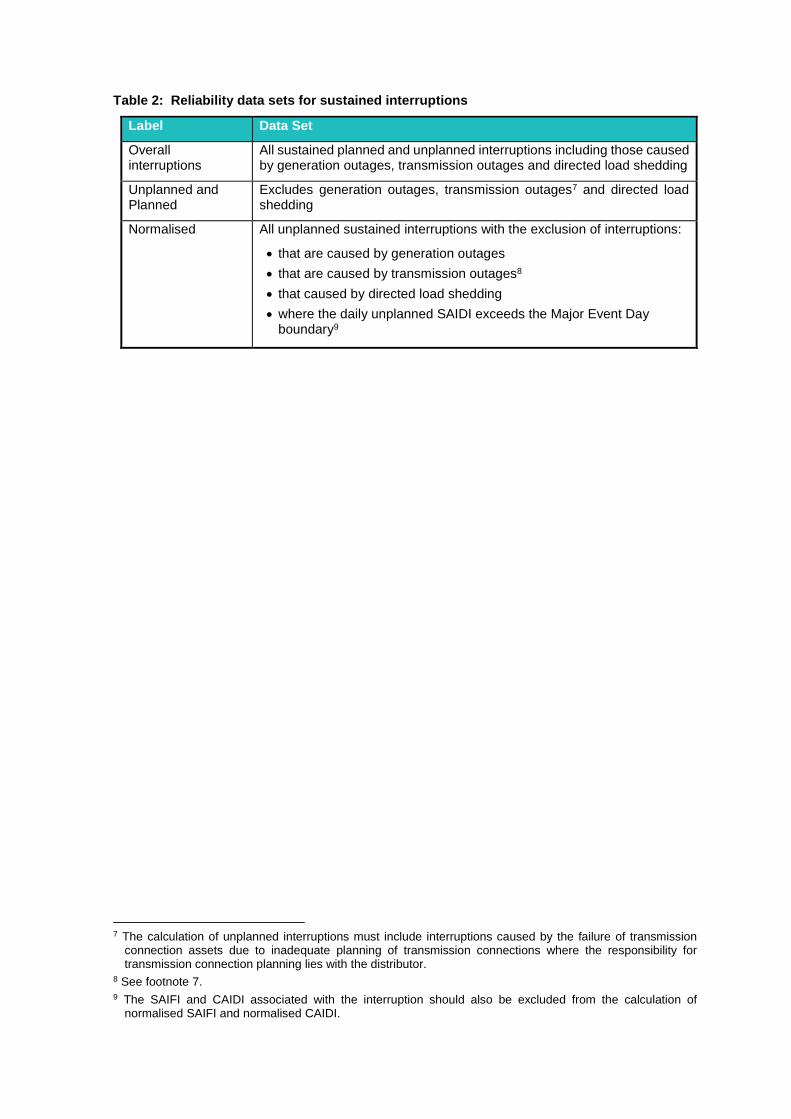
Table 2: Reliability data sets for sustained interruptions
Label Data Set
Overall interruptions
All sustained planned and unplanned interruptions including those caused by generation outages, transmission outages and directed load shedding
Unplanned and Planned
Excludes generation outages, transmission outages7 and directed load shedding
Normalised All unplanned sustained interruptions with the exclusion of interruptions:
that are caused by generation outages
that are caused by transmission outages8
that caused by directed load shedding
where the daily unplanned SAIDI exceeds the Major Event Day boundary9
7 The calculation of unplanned interruptions must include interruptions caused by the failure of transmission
connection assets due to inadequate planning of transmission connections where the responsibility for transmission connection planning lies with the distributor.
8 See footnote 7. 9 The SAIFI and CAIDI associated with the interruption should also be excluded from the calculation of
normalised SAIFI and normalised CAIDI.
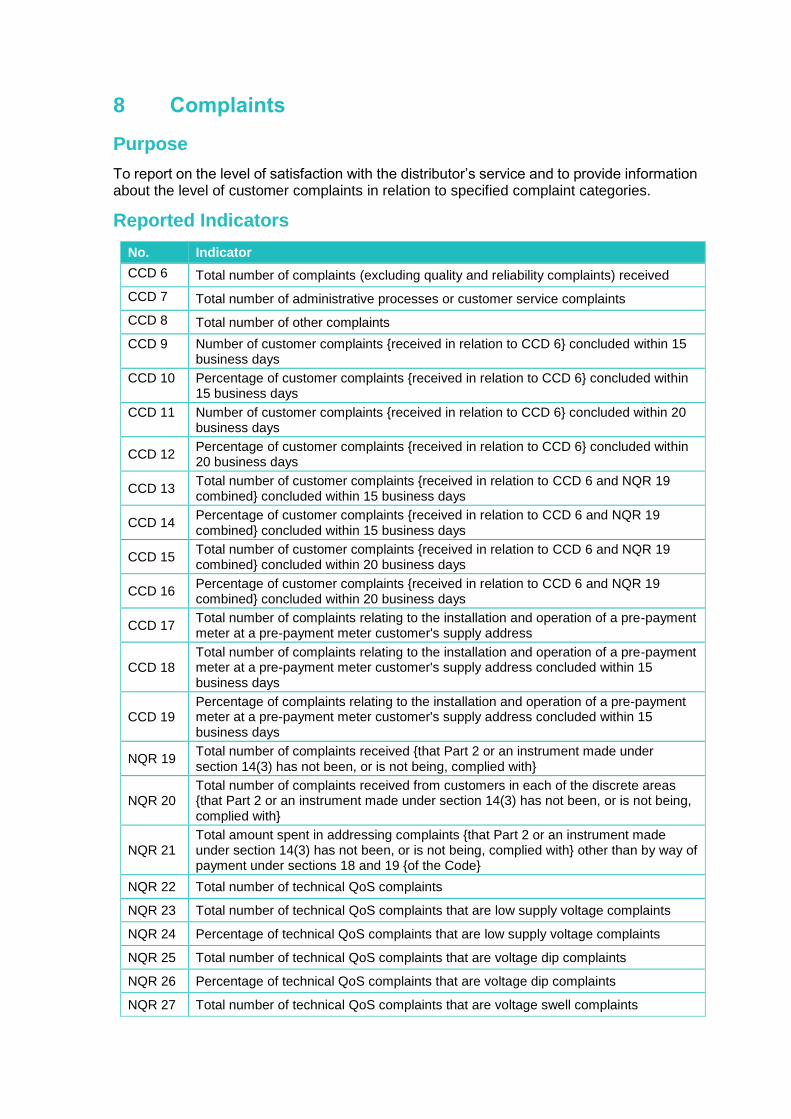
8 Complaints
Purpose
To report on the level of satisfaction with the distributor’s service and to provide information about the level of customer complaints in relation to specified complaint categories.
Reported Indicators
No. Indicator
CCD 6 Total number of complaints (excluding quality and reliability complaints) received
CCD 7 Total number of administrative processes or customer service complaints
CCD 8 Total number of other complaints
CCD 9 Number of customer complaints {received in relation to CCD 6} concluded within 15 business days
CCD 10 Percentage of customer complaints {received in relation to CCD 6} concluded within 15 business days
CCD 11 Number of customer complaints {received in relation to CCD 6} concluded within 20 business days
CCD 12 Percentage of customer complaints {received in relation to CCD 6} concluded within 20 business days
CCD 13 Total number of customer complaints {received in relation to CCD 6 and NQR 19 combined} concluded within 15 business days
CCD 14 Percentage of customer complaints {received in relation to CCD 6 and NQR 19 combined} concluded within 15 business days
CCD 15 Total number of customer complaints {received in relation to CCD 6 and NQR 19 combined} concluded within 20 business days
CCD 16 Percentage of customer complaints {received in relation to CCD 6 and NQR 19 combined} concluded within 20 business days
CCD 17 Total number of complaints relating to the installation and operation of a pre-payment meter at a pre-payment meter customer's supply address
CCD 18 Total number of complaints relating to the installation and operation of a pre-payment meter at a pre-payment meter customer's supply address concluded within 15 business days
CCD 19 Percentage of complaints relating to the installation and operation of a pre-payment meter at a pre-payment meter customer's supply address concluded within 15 business days
NQR 19 Total number of complaints received {that Part 2 or an instrument made under section 14(3) has not been, or is not being, complied with}
NQR 20 Total number of complaints received from customers in each of the discrete areas {that Part 2 or an instrument made under section 14(3) has not been, or is not being, complied with}
NQR 21 Total amount spent in addressing complaints {that Part 2 or an instrument made under section 14(3) has not been, or is not being, complied with} other than by way of payment under sections 18 and 19 {of the Code}
NQR 22 Total number of technical QoS complaints
NQR 23 Total number of technical QoS complaints that are low supply voltage complaints
NQR 24 Percentage of technical QoS complaints that are low supply voltage complaints
NQR 25 Total number of technical QoS complaints that are voltage dip complaints
NQR 26 Percentage of technical QoS complaints that are voltage dip complaints
NQR 27 Total number of technical QoS complaints that are voltage swell complaints
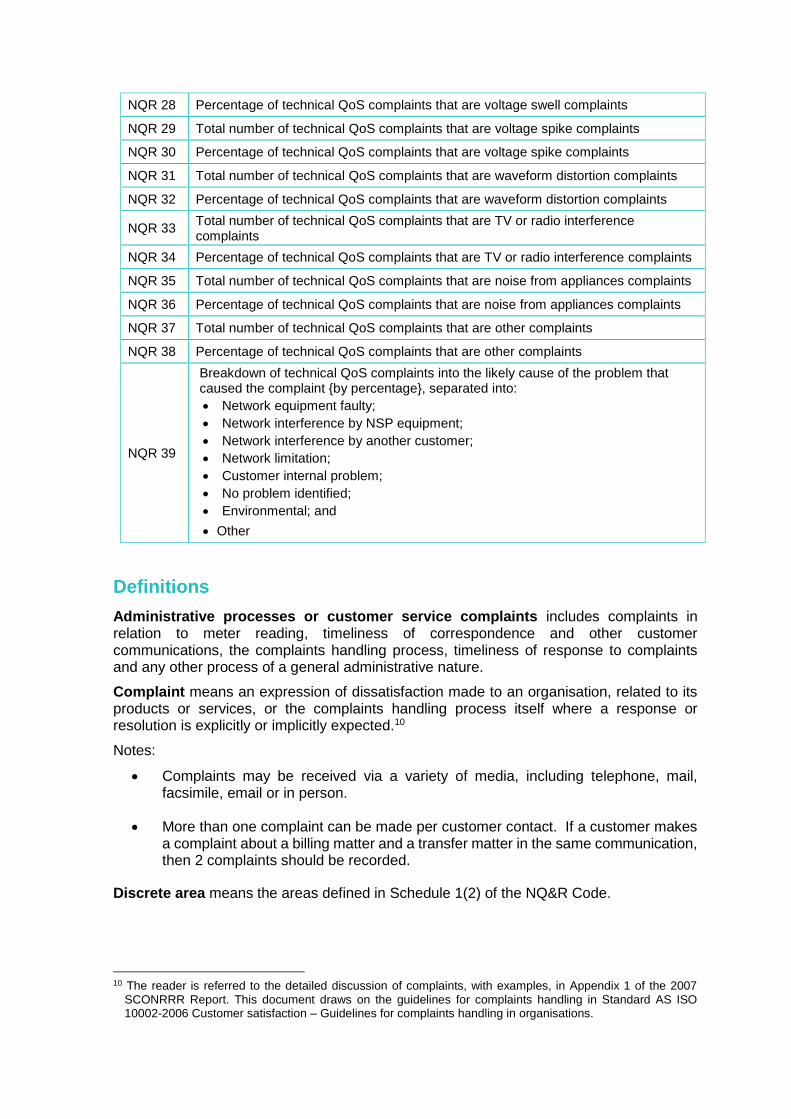
NQR 28 Percentage of technical QoS complaints that are voltage swell complaints
NQR 29 Total number of technical QoS complaints that are voltage spike complaints
NQR 30 Percentage of technical QoS complaints that are voltage spike complaints
NQR 31 Total number of technical QoS complaints that are waveform distortion complaints
NQR 32 Percentage of technical QoS complaints that are waveform distortion complaints
NQR 33 Total number of technical QoS complaints that are TV or radio interference complaints
NQR 34 Percentage of technical QoS complaints that are TV or radio interference complaints
NQR 35 Total number of technical QoS complaints that are noise from appliances complaints
NQR 36 Percentage of technical QoS complaints that are noise from appliances complaints
NQR 37 Total number of technical QoS complaints that are other complaints
NQR 38 Percentage of technical QoS complaints that are other complaints
NQR 39
Breakdown of technical QoS complaints into the likely cause of the problem that caused the complaint {by percentage}, separated into:
Network equipment faulty;
Network interference by NSP equipment;
Network interference by another customer;
Network limitation;
Customer internal problem;
No problem identified;
Environmental; and
Other
Definitions
Administrative processes or customer service complaints includes complaints in relation to meter reading, timeliness of correspondence and other customer communications, the complaints handling process, timeliness of response to complaints and any other process of a general administrative nature.
Complaint means an expression of dissatisfaction made to an organisation, related to its products or services, or the complaints handling process itself where a response or resolution is explicitly or implicitly expected.10
Notes:
Complaints may be received via a variety of media, including telephone, mail, facsimile, email or in person.
More than one complaint can be made per customer contact. If a customer makes a complaint about a billing matter and a transfer matter in the same communication, then 2 complaints should be recorded.
Discrete area means the areas defined in Schedule 1(2) of the NQ&R Code.
10 The reader is referred to the detailed discussion of complaints, with examples, in Appendix 1 of the 2007
SCONRRR Report. This document draws on the guidelines for complaints handling in Standard AS ISO 10002-2006 Customer satisfaction – Guidelines for complaints handling in organisations.
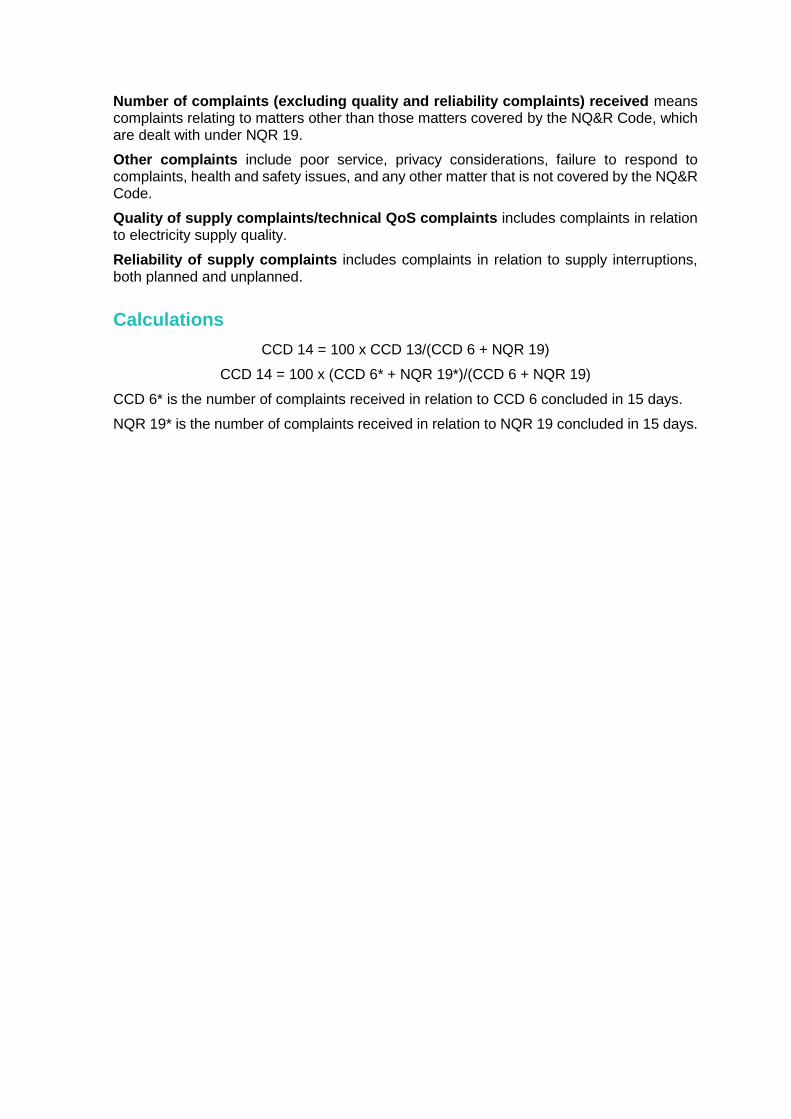
Number of complaints (excluding quality and reliability complaints) received means complaints relating to matters other than those matters covered by the NQ&R Code, which are dealt with under NQR 19.
Other complaints include poor service, privacy considerations, failure to respond to complaints, health and safety issues, and any other matter that is not covered by the NQ&R Code.
Quality of supply complaints/technical QoS complaints includes complaints in relation to electricity supply quality.
Reliability of supply complaints includes complaints in relation to supply interruptions, both planned and unplanned.
Calculations
CCD 14 = 100 x CCD 13/(CCD 6 + NQR 19)
CCD 14 = 100 x (CCD 6* + NQR 19*)/(CCD 6 + NQR 19)
CCD 6* is the number of complaints received in relation to CCD 6 concluded in 15 days.
NQR 19* is the number of complaints received in relation to NQR 19 concluded in 15 days.
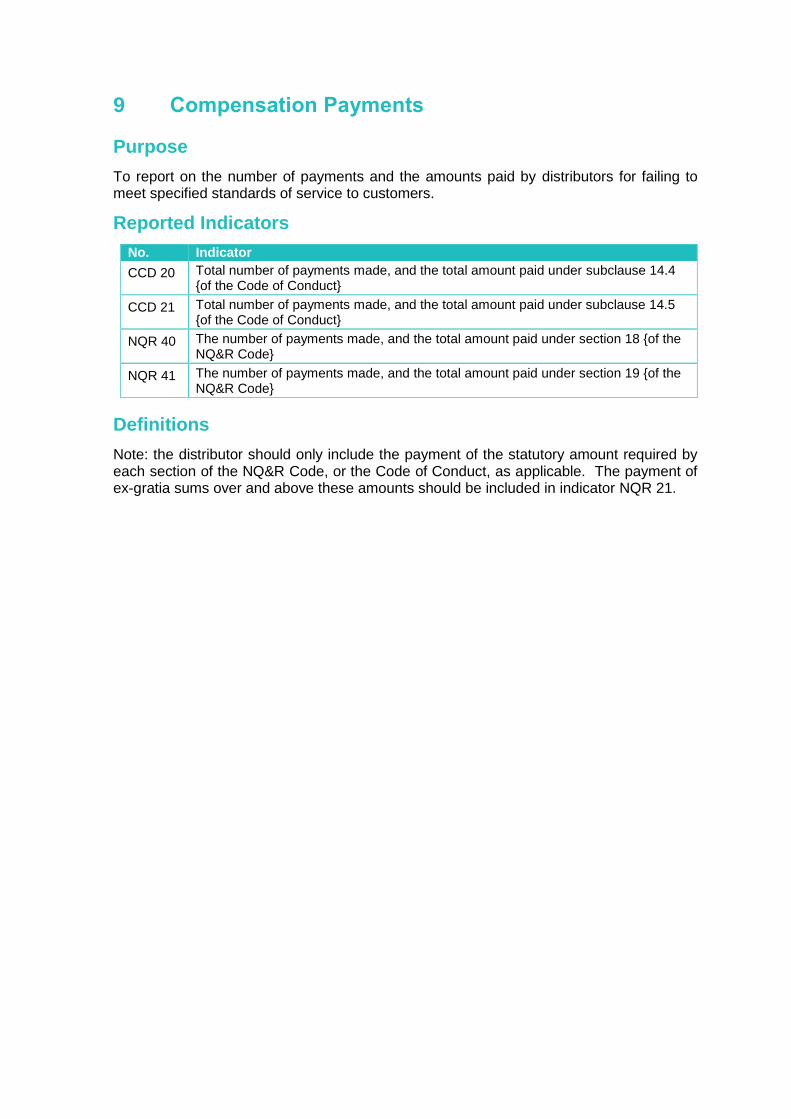
9 Compensation Payments
Purpose
To report on the number of payments and the amounts paid by distributors for failing to meet specified standards of service to customers.
Reported Indicators
No. Indicator
CCD 20 Total number of payments made, and the total amount paid under subclause 14.4 {of the Code of Conduct}
CCD 21 Total number of payments made, and the total amount paid under subclause 14.5 {of the Code of Conduct}
NQR 40 The number of payments made, and the total amount paid under section 18 {of the NQ&R Code}
NQR 41 The number of payments made, and the total amount paid under section 19 {of the NQ&R Code}
Definitions
Note: the distributor should only include the payment of the statutory amount required by each section of the NQ&R Code, or the Code of Conduct, as applicable. The payment of ex-gratia sums over and above these amounts should be included in indicator NQR 21.
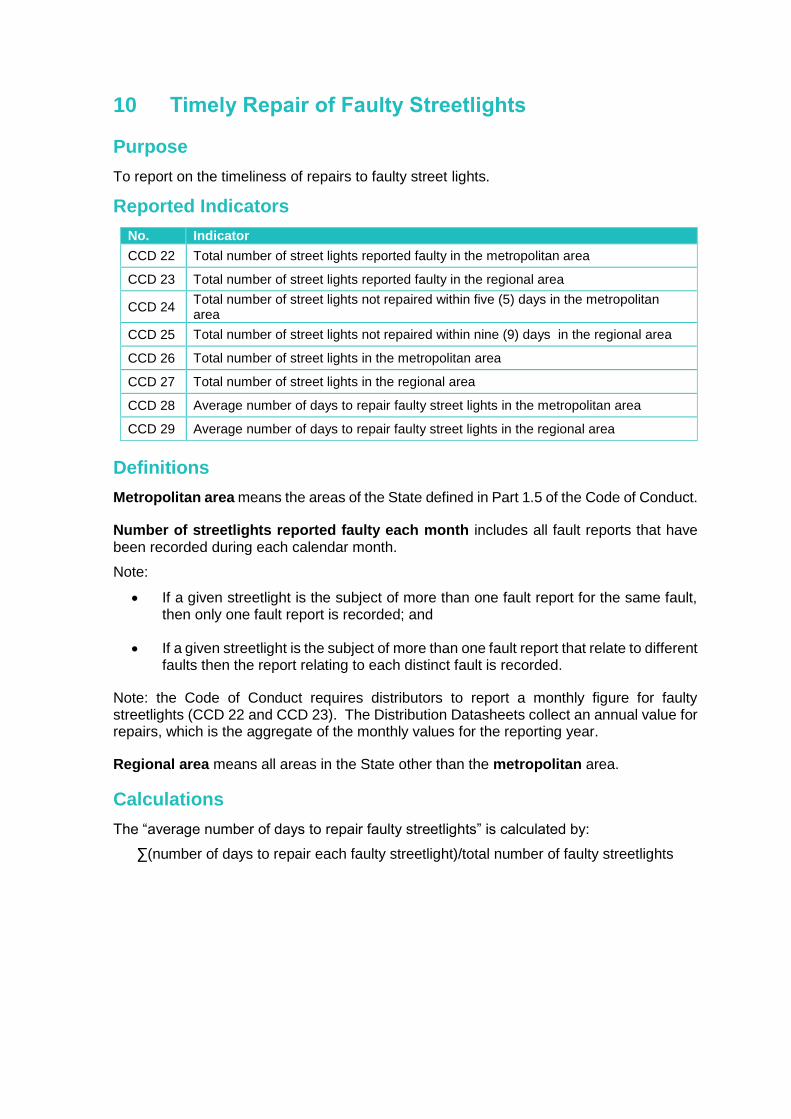
10 Timely Repair of Faulty Streetlights
Purpose
To report on the timeliness of repairs to faulty street lights.
Reported Indicators
No. Indicator
CCD 22 Total number of street lights reported faulty in the metropolitan area
CCD 23 Total number of street lights reported faulty in the regional area
CCD 24 Total number of street lights not repaired within five (5) days in the metropolitan area
CCD 25 Total number of street lights not repaired within nine (9) days in the regional area
CCD 26 Total number of street lights in the metropolitan area
CCD 27 Total number of street lights in the regional area
CCD 28 Average number of days to repair faulty street lights in the metropolitan area
CCD 29 Average number of days to repair faulty street lights in the regional area
Definitions
Metropolitan area means the areas of the State defined in Part 1.5 of the Code of Conduct.
Number of streetlights reported faulty each month includes all fault reports that have been recorded during each calendar month.
Note:
If a given streetlight is the subject of more than one fault report for the same fault, then only one fault report is recorded; and
If a given streetlight is the subject of more than one fault report that relate to different faults then the report relating to each distinct fault is recorded.
Note: the Code of Conduct requires distributors to report a monthly figure for faulty streetlights (CCD 22 and CCD 23). The Distribution Datasheets collect an annual value for repairs, which is the aggregate of the monthly values for the reporting year.
Regional area means all areas in the State other than the metropolitan area.
Calculations
The “average number of days to repair faulty streetlights” is calculated by:
∑(number of days to repair each faulty streetlight)/total number of faulty streetlights
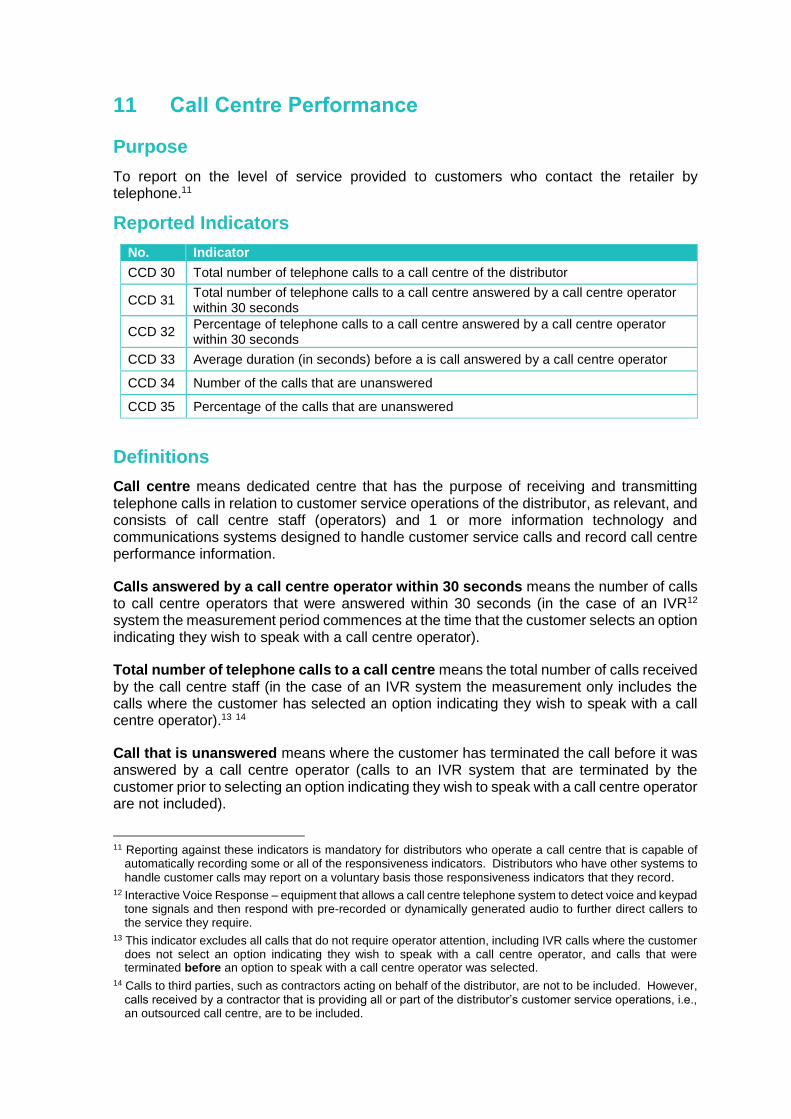
11 Call Centre Performance
Purpose
To report on the level of service provided to customers who contact the retailer by telephone.11
Reported Indicators
No. Indicator
CCD 30 Total number of telephone calls to a call centre of the distributor
CCD 31 Total number of telephone calls to a call centre answered by a call centre operator within 30 seconds
CCD 32 Percentage of telephone calls to a call centre answered by a call centre operator within 30 seconds
CCD 33 Average duration (in seconds) before a is call answered by a call centre operator
CCD 34 Number of the calls that are unanswered
CCD 35 Percentage of the calls that are unanswered
Definitions
Call centre means dedicated centre that has the purpose of receiving and transmitting telephone calls in relation to customer service operations of the distributor, as relevant, and consists of call centre staff (operators) and 1 or more information technology and communications systems designed to handle customer service calls and record call centre performance information.
Calls answered by a call centre operator within 30 seconds means the number of calls to call centre operators that were answered within 30 seconds (in the case of an IVR12 system the measurement period commences at the time that the customer selects an option indicating they wish to speak with a call centre operator).
Total number of telephone calls to a call centre means the total number of calls received by the call centre staff (in the case of an IVR system the measurement only includes the calls where the customer has selected an option indicating they wish to speak with a call centre operator).13 14
Call that is unanswered means where the customer has terminated the call before it was answered by a call centre operator (calls to an IVR system that are terminated by the customer prior to selecting an option indicating they wish to speak with a call centre operator are not included).
11 Reporting against these indicators is mandatory for distributors who operate a call centre that is capable of
automatically recording some or all of the responsiveness indicators. Distributors who have other systems to handle customer calls may report on a voluntary basis those responsiveness indicators that they record.
12 Interactive Voice Response – equipment that allows a call centre telephone system to detect voice and keypad tone signals and then respond with pre-recorded or dynamically generated audio to further direct callers to the service they require.
13 This indicator excludes all calls that do not require operator attention, including IVR calls where the customer does not select an option indicating they wish to speak with a call centre operator, and calls that were terminated before an option to speak with a call centre operator was selected.
14 Calls to third parties, such as contractors acting on behalf of the distributor, are not to be included. However, calls received by a contractor that is providing all or part of the distributor’s customer service operations, i.e., an outsourced call centre, are to be included.
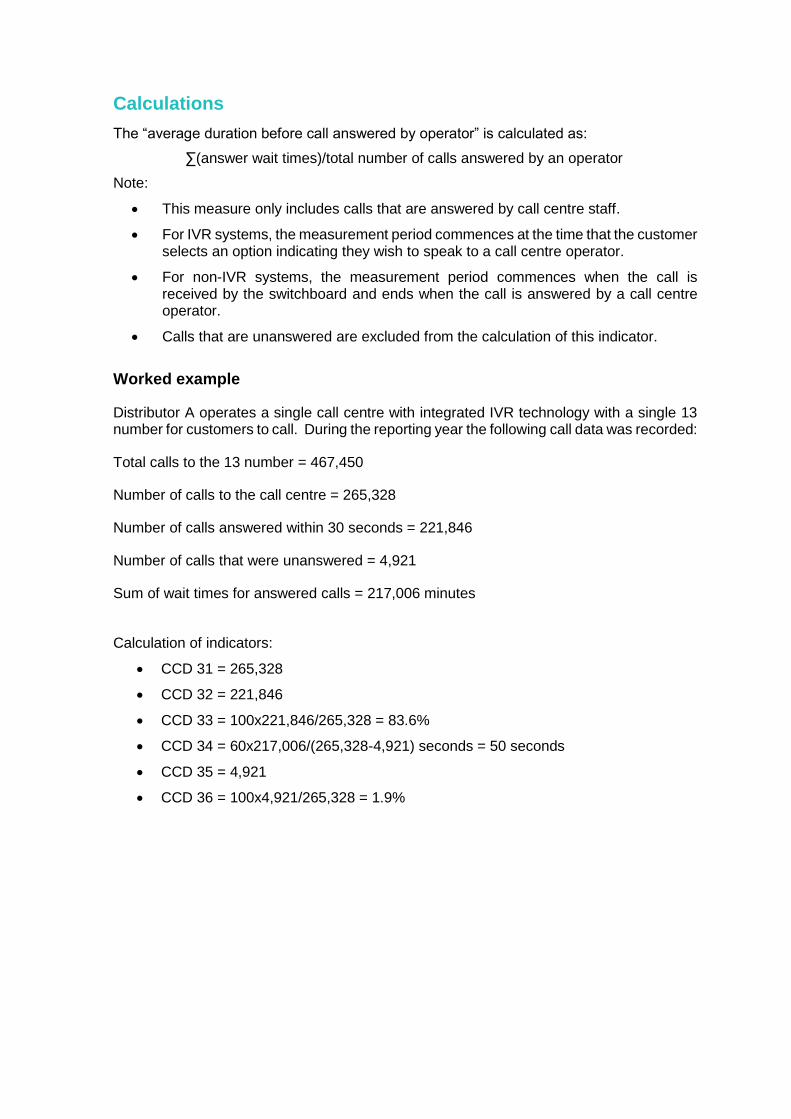
Calculations
The “average duration before call answered by operator” is calculated as:
∑(answer wait times)/total number of calls answered by an operator
Note:
This measure only includes calls that are answered by call centre staff.
For IVR systems, the measurement period commences at the time that the customer selects an option indicating they wish to speak to a call centre operator.
For non-IVR systems, the measurement period commences when the call is received by the switchboard and ends when the call is answered by a call centre operator.
Calls that are unanswered are excluded from the calculation of this indicator.
Worked example
Distributor A operates a single call centre with integrated IVR technology with a single 13 number for customers to call. During the reporting year the following call data was recorded:
Total calls to the 13 number = 467,450
Number of calls to the call centre = 265,328
Number of calls answered within 30 seconds = 221,846
Number of calls that were unanswered = 4,921
Sum of wait times for answered calls = 217,006 minutes
Calculation of indicators:
CCD 31 = 265,328
CCD 32 = 221,846
CCD 33 = 100x221,846/265,328 = 83.6%
CCD 34 = 60x217,006/(265,328-4,921) seconds = 50 seconds
CCD 35 = 4,921
CCD 36 = 100x4,921/265,328 = 1.9%
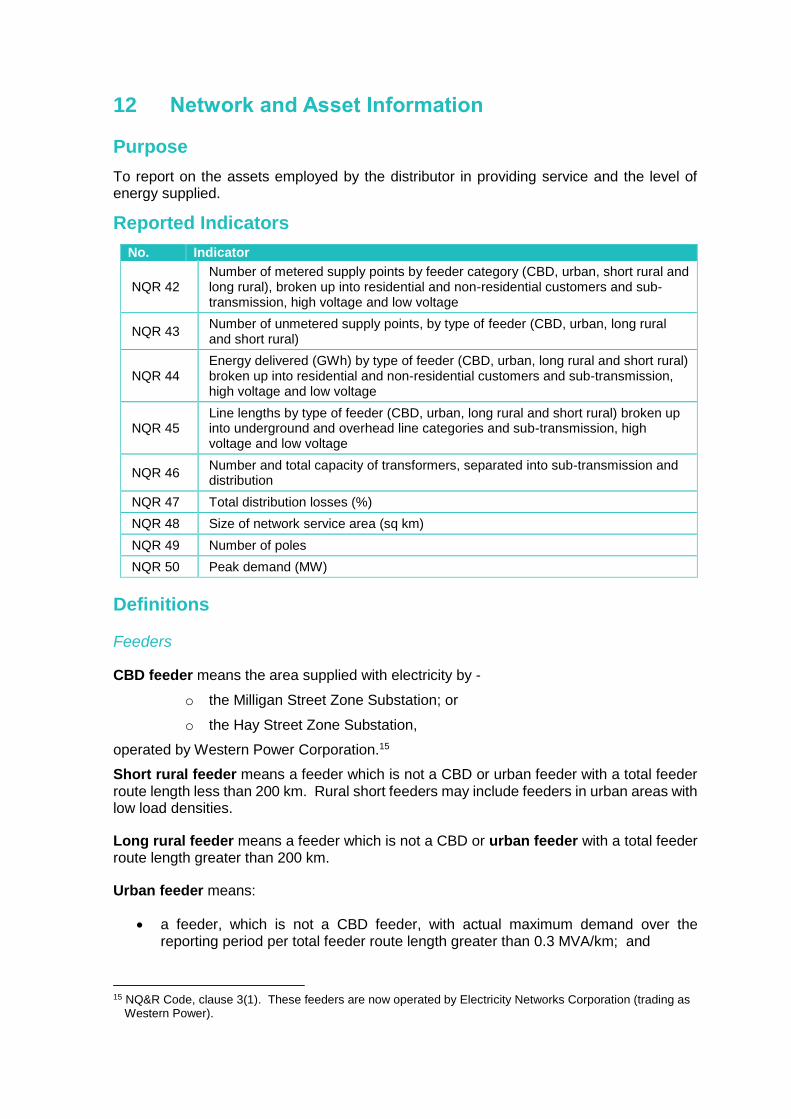
12 Network and Asset Information
Purpose
To report on the assets employed by the distributor in providing service and the level of energy supplied.
Reported Indicators
No. Indicator
NQR 42 Number of metered supply points by feeder category (CBD, urban, short rural and long rural), broken up into residential and non-residential customers and sub-transmission, high voltage and low voltage
NQR 43 Number of unmetered supply points, by type of feeder (CBD, urban, long rural and short rural)
NQR 44 Energy delivered (GWh) by type of feeder (CBD, urban, long rural and short rural) broken up into residential and non-residential customers and sub-transmission, high voltage and low voltage
NQR 45 Line lengths by type of feeder (CBD, urban, long rural and short rural) broken up into underground and overhead line categories and sub-transmission, high voltage and low voltage
NQR 46 Number and total capacity of transformers, separated into sub-transmission and distribution
NQR 47 Total distribution losses (%)
NQR 48 Size of network service area (sq km)
NQR 49 Number of poles
NQR 50 Peak demand (MW)
Definitions
Feeders
CBD feeder means the area supplied with electricity by -
o the Milligan Street Zone Substation; or
o the Hay Street Zone Substation,
operated by Western Power Corporation.15
Short rural feeder means a feeder which is not a CBD or urban feeder with a total feeder route length less than 200 km. Rural short feeders may include feeders in urban areas with low load densities.
Long rural feeder means a feeder which is not a CBD or urban feeder with a total feeder route length greater than 200 km.
Urban feeder means:
a feeder, which is not a CBD feeder, with actual maximum demand over the reporting period per total feeder route length greater than 0.3 MVA/km; and
15 NQ&R Code, clause 3(1). These feeders are now operated by Electricity Networks Corporation (trading as
Western Power).
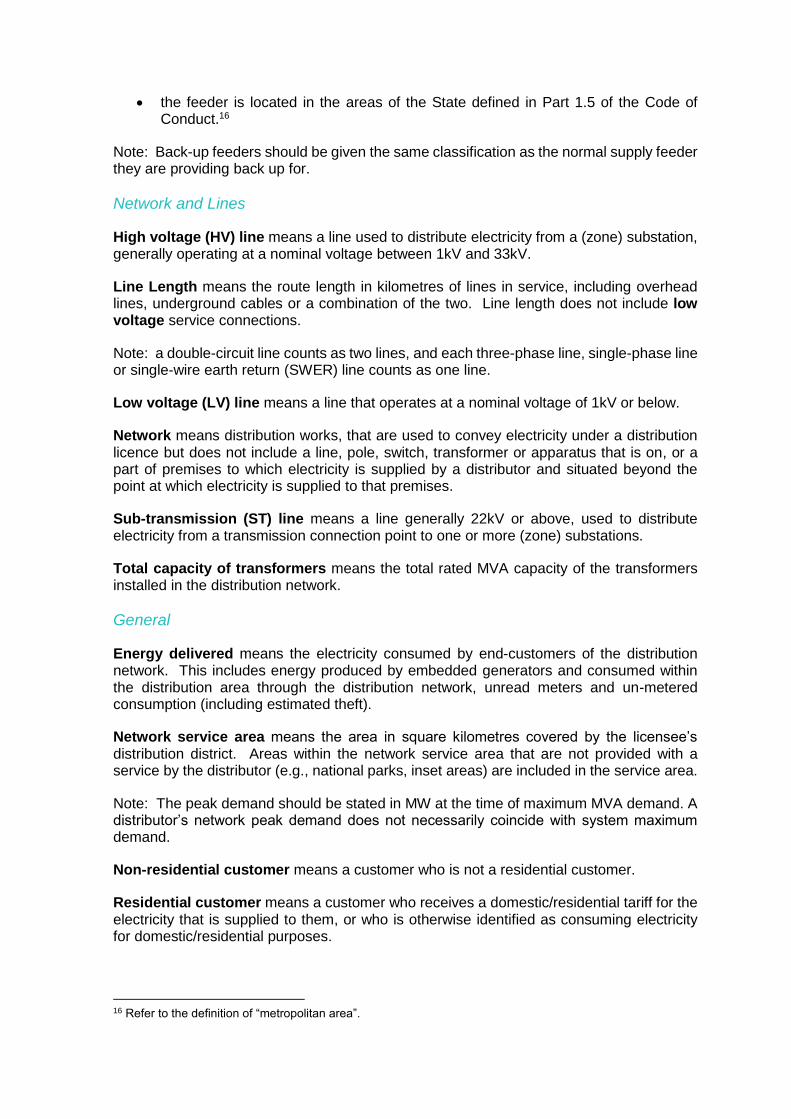
the feeder is located in the areas of the State defined in Part 1.5 of the Code of Conduct.16
Note: Back-up feeders should be given the same classification as the normal supply feeder they are providing back up for.
Network and Lines
High voltage (HV) line means a line used to distribute electricity from a (zone) substation, generally operating at a nominal voltage between 1kV and 33kV.
Line Length means the route length in kilometres of lines in service, including overhead lines, underground cables or a combination of the two. Line length does not include low voltage service connections.
Note: a double-circuit line counts as two lines, and each three-phase line, single-phase line or single-wire earth return (SWER) line counts as one line.
Low voltage (LV) line means a line that operates at a nominal voltage of 1kV or below.
Network means distribution works, that are used to convey electricity under a distribution licence but does not include a line, pole, switch, transformer or apparatus that is on, or a part of premises to which electricity is supplied by a distributor and situated beyond the point at which electricity is supplied to that premises.
Sub-transmission (ST) line means a line generally 22kV or above, used to distribute electricity from a transmission connection point to one or more (zone) substations.
Total capacity of transformers means the total rated MVA capacity of the transformers installed in the distribution network.
General
Energy delivered means the electricity consumed by end-customers of the distribution network. This includes energy produced by embedded generators and consumed within the distribution area through the distribution network, unread meters and un-metered consumption (including estimated theft).
Network service area means the area in square kilometres covered by the licensee’s distribution district. Areas within the network service area that are not provided with a service by the distributor (e.g., national parks, inset areas) are included in the service area.
Note: The peak demand should be stated in MW at the time of maximum MVA demand. A distributor’s network peak demand does not necessarily coincide with system maximum demand.
Non-residential customer means a customer who is not a residential customer.
Residential customer means a customer who receives a domestic/residential tariff for the electricity that is supplied to them, or who is otherwise identified as consuming electricity for domestic/residential purposes.
16 Refer to the definition of “metropolitan area”.
Calculations
Distribution Losses (%) is calculated as:
100 x (electricity supplied – electricity delivered)/electricity supplied
Peak demand is calculated as the maximum coincident demand on each network type at the terminal stations feeding the sub-transmission network, and at the zone substations feeding the high voltage network. The total peak demand is the maximum coincident demand in each of the network types. The total network peak demand is the maximum coincident demand of the distributor’s network.