Embed Size (px)
Citation preview
Canada Research Published by Raymond James Ltd.
Please read domestic and foreign disclosure/risk information beginning on page 29 and Analyst Certification on page 28. Raymond James Ltd. | 2100 – 925 West Georgia Street | Vancouver BC Canada V6C 3L2
Newmarket Gold Inc. August 26, 2015 NMI-TSX Company Report - Initiation of Coverage Chris Thompson M.Sc. (Eng), P.Geo | 604.659.8439 | [email protected]
Brian Martin CFA (Associate) | 604.654.1236 | [email protected]
Mining | Precious Metals - Gold
Sharpening its Teeth for a New Market Down Under
Recommendation We are initiating coverage on Newmarket Gold (NMI-TSX) with an OP2 rating and C$1.70 target price. We view NMI (the merged combination of Newmarket Gold and Crocodile Gold) as a steady FCF generator at current metal prices from a portfolio of Australian gold mines run by a team of seasoned mining industry and capital market professionals. Crocodile (now NMI) has delivered ~4 quarters of improving operating performance and is now positioned (aided by lower energy costs and Australian dollar [A$] weakness) to add significant cash to its balance sheet and continue to build on the turnaround and exploration success that operations are yielding. NMI’s current FCF capability and attractive valuation relative to our covered gold producer peers supports our OP2 rating.
Analysis Sharpening its Teeth Down Under – Crocodile (now NMI) has emerged from a ~2
year turnaround period as a financially stronger, FCF generator (2016E FCF yield: 28%) positioned to further unlock development/exploration potential offered by its mines. Management has ridded the company of an onerous royalty (AuRico), strengthened its balance sheet, enhanced operational performance and revealed substantial exploration upside at its assets. Further, the addition of an experienced Board/management primes NMI for growth, organically and/or via potential M&A.
Australia – A Welcomed Forex-Driven Tailwind – With the A$ depreciating 23% vs. the US$ over a 1 year period, gold in A$ currently trades at ~A$1,600 (+11% YTD). Furthermore, gold in A$ is ~15% below peak prices of ~A$1,800/oz (2011) vs. the gold price in US$ which is down ~40% since 2011. This has allowed NMI to invest in their operations and allocate funds to expand/refine mine lives (which is bearing fruit).
Balance Sheet Strong, FCF Generation Continues – NMI had ~$39 mln in cash and ~C$34.5 mln in convertible debentures (trading at the money) at 2Q15. RJL estimates at least 4 years of healthy FCF generation (2015E: $38 mln or $0.24/share; 2016E: $31 mln or $0.20/share; 2017E: $41 mln or $0.26/share). We view near-term FCF generation as a key element to our investment thesis on NMI.
Exploration / Development Upside – NMI’s focus is aimed at continuing to optimize the operational performance of its existing operations and target mine-site exploration and near-term development focused opportunities. These include: (1) continuing to follow up on the significant high grade exploration and development success at Fosterville; (2) expand resources through underground drilling at Cosmo; and, (3) add near-term mine life to Stawell by drill testing the East Flank. The Big Hill project (in permitting) also offers potential for production longevity at Stawell.
Valuation Our C$1.70 target price is derived by applying a 50/50 blend of 3.0x our 2016 CFPS estimate and a 1.0x multiple to our NAV estimate, which we feel is justified given the 4 to 5 year mine lives of NMI’s operations. See Valuation section for details.
CFPS 1Q 2Q 3Q 4Q Full Revenues NAV Mar Jun Sep Dec Year (mln)
2014A US$0.03 US$0.03 US$0.04 US$0.04 US$0.15 US$283
2015E 0.06A 0.20A 0.13 0.13 0.59 268 C$1.37
2016E 0.14 0.14 0.13 0.11 0.52 258 NA
Source: Raymond James Ltd., Thomson ONE
Outperform 2 C$1.70 target price
Current Price ( Aug-24-15 ) C$1.09 Total Return to Target 56% 52-Week Range C$1.35 - C$0.13 Suitability High Risk
Market Data Market Capitalization (mln) C$146 Current Net Debt (mln) -US$39 Enterprise Value (mln) C$115 Shares Outstanding (mln, f.d.) 190.9 10 Day Avg Daily Volume (000s) 483 Dividend/Yield C$0.00/0.0%
Key Financial Metrics 2014A 2015E 2016E
P/CFPS 1.3x 1.4x 1.6x
P/NAV 0.7x NA
Au Price (US$/oz) US$1,266 US$1,178 US$1,150
Au Production (k oz) 222 228 224
Au Total Cash Cost (US$/oz) US$901 US$708 US$722
EPS US$0.07 US$0.25 US$0.21
Company Description Newmarket Gold is an emerging mid-tier gold producer, with production from three operating mines in Australia.

Canada Research | Page 2 of 32 Newmarket Gold Inc.
Raymond James Ltd. | 2100 – 925 West Georgia Street | Vancouver BC Canada V6C 3L2
Table of Contents
Investment Overview........................................................................................................................................... 3
Company Overview .............................................................................................................................................. 5
Valuation & Recommendation ............................................................................................................................ 15
Costs, Balance Sheet Strength & FCF Potential ................................................................................................... 17
Mine-Level AISC ................................................................................................................................................... 18
Profitability Index – Asset Level ........................................................................................................................... 19
Corporate Structure & Ownership ....................................................................................................................... 20
Appendix A: Management & Board of Directors ................................................................................................. 21
Appendix B: Financial Statements ....................................................................................................................... 23
Appendix C: Corporate Tearsheet........................................................................................................................ 25
Appendix D: RJL Gold Universe Comps ................................................................................................................ 26

Newmarket Gold Inc. Canada Research | Page 3 of 32
Raymond James Ltd. | 2100 – 925 West Georgia Street | Vancouver BC Canada V6C 3L2
Investment Overview
Newmarket Gold (NMI-TSX) offers a significant Australian domiciled gold production base (~200 k oz/year), a recent track record of improving operating economics, and a vehicle for a seasoned management team to exploit further potential M&A opportunities in the gold sector. The core asset strength of NMI is its three operating gold mines and a small portfolio of exploration assets located in Australia, acquired by merging with predecessor company Crocodile Gold (CRK).
NMI’s operating assets are the Fosterville and Stawell gold mines in the State of Victoria and the Cosmo gold mine in the Northern Territory, Australia. We view the Fosterville mine as providing the bulk of NMI’s near-term value (~50% of NAV) and near-term cash flow generating ability (~65% of mine-site EBITDA, ~50% of 2015E production), leveraging from recent exploration success and supported to a lesser (but still significant) degree by development/exploration upside offered at Cosmo and Stawell.
We view the recent business combination with Crocodile Gold favourably as we believe it combines a strong (and much improved) operating portfolio with a team of seasoned mining industry and capital market professionals in creating a platform for further consolidation in the gold sector. NMI’s management team is led by Douglas Forster (President and CEO) and a Board of Directors which includes Raymond Threlkeld (Chairman), Lukas Lundin, Chairman of Lundin Mining (LUN-TSX) and Randall Oliphant, Executive Chairman of New Gold (NGD-TSX). Management is actively seeking to fill the role vacated by Rodney Lamond (COO) who plans to resign for personal reasons effective September 15, 2015. Mr. Lamond was President and CEO of Crocodile Gold.
NMI has benefited significantly from a weakening Australian dollar (A$), which has depreciated 23% vs. the US$ over a 1 year period, resulting in gold in A$ currently trading at ~A$1,600 (+11% YTD). Furthermore, gold in A$ is only ~15% below peak prices of ~A$1,800/oz (in 2011), vs. the gold price in US$ which has weakened ~40% since its peak in 2011. As NMI reports in US$, the result is a significant reduction in US$ denominated costs.
NMI has a strong and flexible balance sheet with ~$39 mln in cash and ~C$34.5 mln in convertible debentures (trading at the money, conversion price C$1.02) at 2Q15. With a strengthening operational base, NMI (as CRK) generated ~$31 mln in FCF over the last nine months (4Q14 to 2Q15), including ~$7 mln in FCF in 2Q15. We believe that NMI is on the verge of significant FCF generation in 2015/16E, even at current depressed metal prices (we use $1,150/oz and a US$/A$ FX rate of $0.75 as our base case assumptions). RJL estimates ~$38 mln in FCF in 2015E ($21 mln delivered in 1H15E) and ~$31 mln in 2016E.
Key reasons to own NMI include: (1) Operational expertise; (2) a recent track record of delivering on guidance; (3) sustainable free cash flow generation; (4) exploration and development upside, specifically at Fosterville and Cosmo; (5) strong and flexible balance sheet; and (6) leverage to the gold price.
Operational Expertise
NMI’s operating expertise, recently reflected by success in unlocking and exploiting higher grade discoveries at the Fosterville mine (the Phoenix and Lower Phoenix Zones) has enabled the company to increase head grade to the mill (2Q14: 3.95 g/t -> 2Q15: 5.92 g/t) and improve the cash flow generating potential of the mine, despite current depressed metal prices. Fosterville generated ~$54 mln in mine level EBITDA during 2014 (at an average gold price of $1,260/oz). Despite recent metal price weakness we see Fosterville continuing to generate a healthy EBITDA (+$60 mln in 2015E and 2016E, at $1,150/oz in 2H15E). Management has succeeded in placing Cosmo and Stawell on secure economic platforms and is committed to maximizing both mine’s profitability in the current weak metal price environment (recently helped by lower fuel costs and A$ weakness).
Management’s Track Record – Delivering on Expectations
Management beat 2014 consolidated annual production guidance (222 k oz vs. guidance of 200-210 k oz) and delivered cash costs at the low end of guidance (~$900/oz). The company is on track to meet or potentially beat both 2015 production guidance (2015E: 228 k oz vs. guidance of 205-220 k oz) and cash cost guidance (2015E: ~$710/oz vs. guidance of $780-$860/oz).

Canada Research | Page 4 of 32 Newmarket Gold Inc.
Raymond James Ltd. | 2100 – 925 West Georgia Street | Vancouver BC Canada V6C 3L2
FCF Generation
RJL estimates 4 years of sustainable FCF (2015E: ~$38 mln or ~$0.24/share; 2016E: ~$31 mln or ~$0.20/share; 2017E: ~$41 mln or ~$0.26/share, 2018E: ~$41 mln or ~$0.22/share), using RJL base case assumptions of $1,150/oz and an US$/A$ FX rate of $0.75.
Development/Exploration Upside
NMI’s focus is aimed at continuing to optimize the operational performance of its existing operations and target mine-site exploration and near-term development focused opportunities. These include: (1) continuing to follow up on the exploration and development of the newly discovered East Dipping, and Kestrall structures, and Eagle Fault at Fosterville; (2) expand resources through underground drilling at Cosmo and at Stawell; (3) continue to test the exploration potential offered by East Flank mineralization and engage with the local community and modify the operating plan for the Big Hill development stage project. NMI is also continuing to look for ways to improve Stawell’s operational efficiencies and economics.
Potential M&A – On the Lookout for Value
In time, we expect to see NMI engage in M&A activity with a view to grow production and leverage off the company’s cash flow, as well as the capital and operational expertise of management and the Board. NMI is positioned to partake in precious metal industry consolidation in Australia, Canada, United States and mining-friendly Central and South America. Management has indicated that preferred targets are assets that have 100-200 k oz of annual production potential, with large mineral resources and exploration upside.
Strong and Flexible Balance Sheet
NMI had a cash balance of ~$39 mln at June 30, 2015. With the transaction between Crocodile Gold and Newmarket closed on July 10, 2015, and the subsequent C$25 mln private placement and C$20 mln cash consideration paid to CRK shareholders, we estimate a 3Q15 cash balance of ~$47 mln. NMI also has C$34.5 mln in convertible debentures outstanding (April 2018 maturity, 8% coupon), convertible at the holder’s option into NMI shares at C$1.02/share. The debentures become callable if NMI’s shares trade above C$1.53 (for a period of 20 days). For the purpose of our valuation we include the convertible debentures as equity. We also note that NMI had working capital of ~$25 mln as of June 30, 2015.
Risks to Our 6 to 12 Month Outlook
Development Risk. 2015 and 2016 are critical years for NMI as the company builds out and converts resources to reserves at its operations, specifically at Cosmo and Stawell. Also, regulatory approvals (environmental and public approvals pending), the ability of Stawell to sustain itself economically until Big Hill is developed and Big Hill’s development potential will determine the longevity of Stawell.
Geopolitical Risk. Australia is recognized as a stable and low risk jurisdiction with access to infrastructure and skills.
Gold Price Risk. A drop in the gold price could cause deterioration in NMI’s ability to fund its operations. On an operating cash cost basis NMI is a relatively low cost producer, producing ounces at ~$710/oz (2015E). However, significant Capex is currently being deployed to its operations (specifically at Fosterville and Cosmo) to ensure their longevity which adds to their AISC profile (2015E Fosterville: ~$880/oz and Cosmo; $1,050/oz) and provides little protection (especially at Cosmo and Stawell) should the gold price fall.
Cost Inflation Risk. Our outlook assumes certain future capital and operating costs for development projects. Although we apply conservative estimates to these assumptions there is a risk that we have understated these costs or that these costs may increase in the future.
Operational and Labour Risk. There is a risk that NMI’s operations suffer accidents or disruptions to production or development which could impair the value of the assets. Risks of labour disruptions due to strike action may also impact production and profitability.

Newmarket Gold Inc. Canada Research | Page 5 of 32
Raymond James Ltd. | 2100 – 925 West Georgia Street | Vancouver BC Canada V6C 3L2
Company Overview
Newmarket Gold (NMI-TSX) is the product of a recent merger between Newmarket Gold, a former gold-focused explorer, and Crocodile Gold (CRK), a gold miner with three operating gold mines and a portfolio of exploration assets located in Australia. Newmarket is listed on the Toronto stock exchange under the ticker NMI. The company’s three primary operating assets are the Fosterville and Stawell gold mines in the State of Victoria and the Cosmo mine in the Northern Territory, Australia. We view NMI’s asset strength from predecessor company Crocodile Gold’s assets, specifically the Fosterville mine.
Of particular note, the combination of the two companies marries an experienced mining-focused management team and Board of Directors with a significant (~200 k oz/year) gold production base in a mining-friendly jurisdiction (Australia) supported by a large resource base (~4.8 mln oz measured and indicated resource) with relatively low operating costs (2015E: ~$710/oz). NMI’s management team is led by Douglas Forster (President and CEO) and a Board of Directors that includes Raymond Threlkeld (Chairman), Lukas Lundin, Chairman of Lundin Mining (LUN-TSX) and Randall Oliphant, Executive Chairman of New Gold (NGD-TSX).
Over the last year CRK has demonstrated its operational abilities by improving the operating performance of its mines and achieving mine-site exploration success at Fosterville, which has transformed the asset into a profitable operation that offers a healthy multi-year mine life supported by a robust resource base. We view Fosterville as NMI’s most attractive asset (NAV5%: ~$131 mln or ~50% of NAV) and the main driver of near-term free cash flow.
Key reasons to own NMI include: (1) Operational expertise; (2) a recent track record of delivering on guidance; (3) sustainable free cash flow generation; (4) exploration and development upside, specifically at Fosterville and Cosmo; (5) strong and flexible balance sheet; and (6) leverage to the gold price.
The Former Crocodile Gold – Turning from Swimming against the Tide
CRK purchased the Fosterville and Stawell gold mines from AuRico Gold in 2012, in a transaction which included consideration of C$55 mln in cash and C$10 mln in stock, plus a share in the future net free cash flows generated by these assets (under a net free cash flow sharing agreement). Whilst the transaction offered CRK an enlarged production base (~200 k oz/year) and the ability to generate free cash flow in the 2012 metal price environment (gold price average: $1,669/oz), in today’s price environment the net free cash flow sharing arrangement hampered CRK’s ability to generate adequate returns. In 1Q15, CRK successfully negotiated the termination of the net free cash flow sharing arrangement with AuRico for a cash payment of C$20 mln and a 2% NSR on the Fosterville mine and 1% on the Stawell mine (Stawell NSR begins January 1, 2016). With the net free cash flow agreement terminated, CRK enjoyed the full benefit of improved operating performance and delivered strong 1H15 financial performance, generating $21 mln in FCF.
CRK has enjoyed successive quarters (2Q14 to 1Q15) of consolidated production growth (55 k oz -> 60 k oz) with lowering cash operating costs (~$960 -> $680/oz). Whilst production in 2Q15 (56 k oz) was slightly lower than 1Q15, cash operating costs ($681/oz) were similar to those in 1Q15 (see Exhibit 1). We believe the key elements that enabled this operational improvement will continue to allow NMI to generate positive FCF despite a lower gold price environment. While a weakening A$ has provided cost relief tailwinds, much of the positive performance (2Q14 to 2Q15) was driven by improving head grades (3.95 -> 5.92 g/t) and plant efficiencies (recoveries: 86% -> 89%) at Fosterville (see Exhibit 2), both of which drove production growth (~22 -> ~30 k oz) at lower cash operating costs ($891 -> $532/oz).
Operational strength and financial prudence began to instill market confidence in CRK, reflected by an attractive YTD share price performance (+93% prior to the announcement of NMI merger on May 11, 2015) handily beating peers and the GDXJ’s performance (1.3%). We see this trend continuing – which justifies our OP2 rating.

Canada Research | Page 6 of 32 Newmarket Gold Inc.
Raymond James Ltd. | 2100 – 925 West Georgia Street | Vancouver BC Canada V6C 3L2
Exhibit 1: NMI Production and Cash Costs (2Q14 – 2Q15A) Exhibit 2: Fosterville Production and Cash Costs (2Q14 – 2Q15A)
0
200
400
600
800
1,000
1,200
40
45
50
55
60
65
2Q14 3Q14 4Q14 1Q15 2Q15
Ca
sh O
pe
rati
ng
Co
sts
(US
$ /
oz)
Pro
du
cti
on
(k o
z)
Production (k oz) Cash Operating Costs (US$/oz)
0
100
200
300
400
500
600
700
800
900
1,000
0
5
10
15
20
25
30
35
2Q14 3Q14 4Q14 1Q15 2Q15
Ca
sh O
pe
rati
ng
Co
sts
(U
S$ /
oz)
Pro
du
cti
on
(k o
z)
Production (k oz) Cash Operating Costs (US$/oz)
Source: Newmarket Gold Inc., Raymond James Ltd.
The Currency Effect – A$ Tailwinds
NMI has benefited significantly from a weakening Australian dollar (A$) which has depreciated 23% vs. the USD over a 1 year period, resulting in gold in A$ currently trading at ~A$1,600 (+11% YTD). Furthermore, gold in A$ is only ~15% below peak prices of ~A$1,800/oz (in late 2011), vs. the gold price in US$ which has weakened ~40% since late 2011.
On an average quarterly basis between 2Q14 to 2Q15 (inclusive), the A$ has depreciated 20% vs. the US$, while NMI’s consolidated cash operating cost has declined 41% over the same period (see Exhibits 3 and 4).
We see potential for further FX-related cost improvements as QTD 3Q15 the A$ has depreciated another 5.5% vs. the US$, currently trading at a US$/A$ rate of $0.72.
Exhibit 3: Gold in US$ vs. Gold in A$ (2014-Present) Exhibit 4: NMI Costs vs. US$/A$ Quarterly Averages
0.70
0.75
0.80
0.85
0.90
0.95
$400
$500
$600
$700
$800
$900
$1,000
2Q14 3Q14 4Q14 1Q15 2Q15
US
D /
AU
D
Ca
sh
Op
era
tin
g C
osts
(U
S$
/o
z)
Cash Op. Costs USD/AUD FX Rate
$1,000
$1,100
$1,200
$1,300
$1,400
$1,500
$1,600
$1,700
Go
ld P
rice
-U
S$
vs.
A$
Gold - AUD Gold - USD
Source: Newmarket Gold Inc., Capital IQ, Raymond James Ltd.

Newmarket Gold Inc. Canada Research | Page 7 of 32
Raymond James Ltd. | 2100 – 925 West Georgia Street | Vancouver BC Canada V6C 3L2
Fosterville – A Phoenix Rising from the Ashes
Fosterville is an underground mine sourcing sulphide ore from the Central, Phoenix and Harrier mine areas. Underground mining is conducted using a conventional fleet including jumbos, production drills, loaders, trucks and ancillary equipment. Fosterville operates a processing facility that incorporates flotation, bacterial oxidation and CIL circuits with a capacity of ~2,300 tpd. The bacterial oxidation process uses BIOX technology, operated under license from Goldfields Pty Ltd. Production at the Fosterville mine has been steadily increasing over the last 12 months with quarterly production increasing from ~22 k oz (2Q14) to ~30 k oz (2Q15), driven by the delivery of higher grade to the mill and improved blending practices of carbonaceous ore and ongoing optimization of the leaching circuit (recoveries: 84% (1Q14) to 89% (2Q15)). Mining is currently transitioning from the Harrier zone to the Central and Phoenix lodes which include the higher-grade Lower Phoenix area.
Fosterville has enjoyed a history of reserve replacement that has added over 1 mln oz of reserves over the past 10 years (current P&P reserves total ~1.5 mln tonnes grading 6.6 g/t for in-situ ~300 k oz). NMI is aggressively advancing underground development at Fosterville (~651 m per month for a total of 1,954 m in 2Q15), a strategy which we expect to continue.
Exploration Potential – Drill results released this year focused on Phoenix and Lower Phoenix mineralization and reveal encouraging high-grade gold intercepts along-strike (down-plunge) from current mineral reserves. Drilling has confirmed continuous mineralization along the newly identified structures (Phoenix, Lower Phoenix, Lower Phoenix Footwall or LPFW, East Dipping, Kestrel and Eagle Faults) (see Exhibit 5). Also, visible gold has been observed in addition to the more common disseminated sulphide gold mineralization.
Recent high-grade intercepts support potential to expand mineral resources and reserves southwards down-plunge and potentially provide multiple ore sources accessible from existing infrastructure (the Phoenix decline). Further, the presence of visible gold which appears to be introduced by a second gold event offers potential to significantly increase gold grades.
Exploration success at Fosterville in 2014 provided increased definition and confidence in the mine’s geological model which resulted in a ~3% increase in mineral reserve grade (to 6.6 g/t) as well as a ~8% increase in measured and indicated resource grade (to 4.2 g/t). Current reserves total ~1 mln tonnes grading 5.56 g/t (excluding the CIL tailings) for ~180 k in-situ oz which yield ~2 years of reserve supported mine-life. A global resource base (measured, indicated and inferred resources) of ~16.6 mln tonnes grading 4.02 g/t (2.1 mln in-situ oz) offers reserve growth potential.
Drilling is ongoing to better understand the extent, orientation, geometries and metallurgical characteristics of newly identified mineralized structures. Drilling is planned to occur in conjunction with the Phoenix and Lower Phoenix Footwall exploration programs.
Operating Assumptions – At Fosterville, RJL models ~5 years (mid-2015E to mid-2019E) of underground ore production (3.1 mln tonnes grading 5.44 g/t) at a mill rate of 2,000 tpd (see Exhibit 6). We note that reserves of 1.5 mln tonnes (~2 years) grading 6.57 g/t, M&I resources of 16.6 mln tonnes grading 4.02 g/t and inferred resources of 5.9 mln tonnes grading 3.71 g/t have been defined at Fosterville (as of December 31, 2014). M&I resources are inclusive of reserves.
RJL forecasts 113 k oz in 2015E at an AISC cost of $884/oz which compares with company production guidance of 100-105 k oz, and operating cash costs of ~$572/oz which compares with company guidance of $670-$750/oz (see Exhibit 6). For 2016, we forecast 110 k oz at an AISC cost of ~$834/oz. RJL assumes capital costs of ~A$45 mln in 2015E and ~A$35 mln for 2016E. Using the RJL base case metal price assumption ($1,150/oz 2H15E/2016E) we estimate the Fosterville mine generating mine level EBITDA of ~$60 mln in 2015E and 2016E. Recent exploration success supports reserve and resource expansion potential to expand Fosterville’s mine-life beyond 2019E, in our view.

Canada Research | Page 8 of 32 Newmarket Gold Inc.
Raymond James Ltd. | 2100 – 925 West Georgia Street | Vancouver BC Canada V6C 3L2
Exhibit 5: Fosterville Drill Results
Source: Newmarket Gold Inc.
Exhibit 6: Fosterville Operating Assumptions, Production and Cost Profile
Fosterville 2015E 2016E 2017E 2018E 2019E
Tonnes Milled (k tonnes) 717 732 730 730 196
Grade (g/t) 5.52 5.35 5.45 5.45 5.45
Recoveries (%) 89% 88% 88% 88% 88%
Gold Production (k oz) 113 110 112 112 30
Cash Operating Costs (US$/oz) $572 $596 $586 $586 $586
AISC (US$/oz) $884 $834 $821 $821 $756
0
100
200
300
400
500
600
700
800
900
1,000
0
20
40
60
80
100
120
2015E 2016E 2017E 2018E 2019E
Co
sts
(US
$ /
oz)
Pro
du
cti
on
(k o
z A
u)
Gold Production (k oz) AISC (US$/oz) Cash Operating Costs (US$/oz)
Source: Raymond James Ltd.
Newmarket Gold Inc. Canada Research | Page 9 of 32
Raymond James Ltd. | 2100 – 925 West Georgia Street | Vancouver BC Canada V6C 3L2
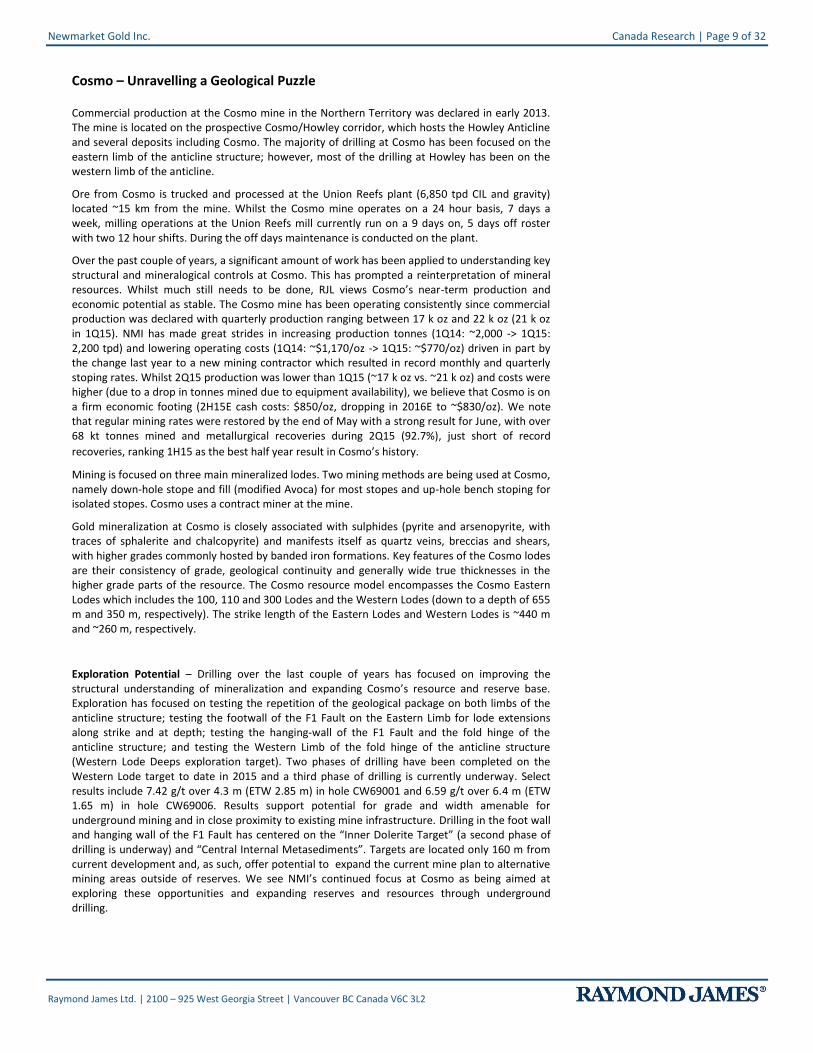
Cosmo – Unravelling a Geological Puzzle
Commercial production at the Cosmo mine in the Northern Territory was declared in early 2013. The mine is located on the prospective Cosmo/Howley corridor, which hosts the Howley Anticline and several deposits including Cosmo. The majority of drilling at Cosmo has been focused on the eastern limb of the anticline structure; however, most of the drilling at Howley has been on the western limb of the anticline.
Ore from Cosmo is trucked and processed at the Union Reefs plant (6,850 tpd CIL and gravity) located ~15 km from the mine. Whilst the Cosmo mine operates on a 24 hour basis, 7 days a week, milling operations at the Union Reefs mill currently run on a 9 days on, 5 days off roster with two 12 hour shifts. During the off days maintenance is conducted on the plant.
Over the past couple of years, a significant amount of work has been applied to understanding key structural and mineralogical controls at Cosmo. This has prompted a reinterpretation of mineral resources. Whilst much still needs to be done, RJL views Cosmo’s near-term production and economic potential as stable. The Cosmo mine has been operating consistently since commercial production was declared with quarterly production ranging between 17 k oz and 22 k oz (21 k oz in 1Q15). NMI has made great strides in increasing production tonnes (1Q14: ~2,000 -> 1Q15: 2,200 tpd) and lowering operating costs (1Q14: ~$1,170/oz -> 1Q15: ~$770/oz) driven in part by the change last year to a new mining contractor which resulted in record monthly and quarterly stoping rates. Whilst 2Q15 production was lower than 1Q15 (~17 k oz vs. ~21 k oz) and costs were higher (due to a drop in tonnes mined due to equipment availability), we believe that Cosmo is on a firm economic footing (2H15E cash costs: $850/oz, dropping in 2016E to ~$830/oz). We note that regular mining rates were restored by the end of May with a strong result for June, with over 68 kt tonnes mined and metallurgical recoveries during 2Q15 (92.7%), just short of record
recoveries, ranking 1H15 as the best half year result in Cosmo’s history.
Mining is focused on three main mineralized lodes. Two mining methods are being used at Cosmo, namely down-hole stope and fill (modified Avoca) for most stopes and up-hole bench stoping for isolated stopes. Cosmo uses a contract miner at the mine.
Gold mineralization at Cosmo is closely associated with sulphides (pyrite and arsenopyrite, with traces of sphalerite and chalcopyrite) and manifests itself as quartz veins, breccias and shears, with higher grades commonly hosted by banded iron formations. Key features of the Cosmo lodes are their consistency of grade, geological continuity and generally wide true thicknesses in the higher grade parts of the resource. The Cosmo resource model encompasses the Cosmo Eastern Lodes which includes the 100, 110 and 300 Lodes and the Western Lodes (down to a depth of 655 m and 350 m, respectively). The strike length of the Eastern Lodes and Western Lodes is ~440 m and ~260 m, respectively.
Exploration Potential – Drilling over the last couple of years has focused on improving the structural understanding of mineralization and expanding Cosmo’s resource and reserve base. Exploration has focused on testing the repetition of the geological package on both limbs of the anticline structure; testing the footwall of the F1 Fault on the Eastern Limb for lode extensions along strike and at depth; testing the hanging‐wall of the F1 Fault and the fold hinge of the anticline structure; and testing the Western Limb of the fold hinge of the anticline structure (Western Lode Deeps exploration target). Two phases of drilling have been completed on the Western Lode target to date in 2015 and a third phase of drilling is currently underway. Select results include 7.42 g/t over 4.3 m (ETW 2.85 m) in hole CW69001 and 6.59 g/t over 6.4 m (ETW 1.65 m) in hole CW69006. Results support potential for grade and width amenable for underground mining and in close proximity to existing mine infrastructure. Drilling in the foot wall and hanging wall of the F1 Fault has centered on the “Inner Dolerite Target” (a second phase of drilling is underway) and “Central Internal Metasediments”. Targets are located only 160 m from current development and, as such, offer potential to expand the current mine plan to alternative mining areas outside of reserves. We see NMI’s continued focus at Cosmo as being aimed at exploring these opportunities and expanding reserves and resources through underground drilling.

Canada Research | Page 10 of 32 Newmarket Gold Inc.
Raymond James Ltd. | 2100 – 925 West Georgia Street | Vancouver BC Canada V6C 3L2
Exhibit 7: Cosmo Drill Results
Source: Newmarket Gold Inc.
Operating Assumptions – RJL models ~6 years (mid-2015E to mid-2021E) of underground ore production (~5.0 mln tonnes grading 3.34 g/t) at a mill rate of 2,100 tpd (30% of the Union Reef plant capacity) (see Exhibit 8). We note that reserves of 1.3 mln tonnes (~2 years) grading 3.57 g/t, M&I resources of 5 mln tonnes grading 3.35 g/t and inferred resources of 1 mln tonnes grading 2.72 g/t have been defined at Cosmo (December 31, 2014). M&I resources are inclusive of reserves.
RJL forecasts ~77 k oz in 2015E at an AISC cost of $1,055/oz which compares with production guidance of 75-85 k oz, and 2015E operating cash costs of $834/oz which compares with guidance of $850-$930/oz. For 2016E, we forecast ~80 k oz at an AISC cost of ~$1,014/oz. RJL assumes capital costs of ~A$20 mln in 2015E/2016E. Using RJL metal price assumption ($1,150/oz) RJL estimates the Cosmo mine generating mine level EBITDA of ~$25 mln in 2015E and 2016E.
Exhibit 8: Cosmo Operating Assumptions, Production and Cost Profile Cosmo 2015E 2016E 2017E 2018E 2019E 2020E
Tonnes Milled (k tonnes) 770 769 767 767 767 769
Grade (g/t) 3.40 3.58 3.27 3.27 3.27 3.27
Recoveries (%) 91% 91% 91% 91% 91% 91%
Gold Production (k oz) 77 80 73 73 73 73
Cash Operating Costs (US$/oz) $834 $827 $905 $905 $905 $905
AISC (US$/oz) $1,055 $1,014 $1,111 $1,111 $1,111 $1,110
0
200
400
600
800
1,000
1,200
50
55
60
65
70
75
80
85
2015E 2016E 2017E 2018E 2019E 2020E
Co
sts
(US
$ /
oz)
Pro
du
cti
on
(k o
z A
u)
Gold Production (k oz) AISC (US$/oz) Cash Operating Costs (US$/oz)
Source: Raymond James Ltd.

Newmarket Gold Inc. Canada Research | Page 11 of 32
Raymond James Ltd. | 2100 – 925 West Georgia Street | Vancouver BC Canada V6C 3L2
Stawell – Pared Back and Profitable
The Stawell mine has been in operation for over 25 years, while in recent years mining activity has been reduced. The lower portion of the mine was closed in 2013, since then mining has focused remnant resource and mining pillars in the upper levels as well as surface stockpiles. The closure of lower levels of the mine and an adjusted cost model has resulted in lower operating costs (cash operating costs: 1Q13: ~$1,200/oz -> 2Q15: ~$815/oz). This has allowed for the consideration of lower grade material. Over the last 12 months NMI has achieved operational sustainability at Stawell by streamlining operating activities, reducing manpower, and infrastructure.
The Stawell plant was commissioned in 1984 and has undergone a number of upgrades. Current mill capacity is ~2,600 tpd on underground hard rock and up to ~3,600 tpd on softer oxide ore types. The treatment facility employs gravity, flotation and fine grind and CIL processes.
During 2Q15, production at Stawell totaled 9,277 oz representing the 8th
consecutive quarter of production above 9,200 oz. Mill feed continued to be sourced from combining underground ore and surface oxide; as such, grade decreased to 1.57 g/t compared with 1.75 g/t in 1Q15, reflecting the lower-grade nature from the mining of the upper levels of the mine. Metallurgical recoveries continued to improve (2Q15: 83.1% vs. 1Q15: 80%) due to lower graphitic ore content in the mill feed and modifying the plant circuitry to remove high preg robbing materials and re-introducing concentrate down circuit. The operating strategy at Stawell remains focused on cost reduction activities and the downsizing of mine operations to ensure profitability of mined tonnes.
Potential for a significant boost in Stawell’s mine life is offered by the Big Hill development stage project, located on publically accessible Crown land which is partly leased by the Stawell mine. The project is currently the subject of an Environmental Effects Statement and ministerial assessment. In October 2014 the Victorian Government recommended that the project not proceed in its current form. Prior to the merger between NMI and Crocodile Gold, recommendations provided by the Victorian Government were being reviewed. A benching configuration, reduced blasting, dust suppressants, back filling of pits noise attenuation and restricted hours of operation are being considered.
Big Hill was the focus of an economic evaluation and a Feasibility Study in 2014 which called for the mining of 2.9 mln tonnes of ore (classified as Probable Reserve) grading ~1.5 g/t (~145 k in-situ oz) over a 2.5 to 4 year time frame.
Exploration potential – Near-term exploration work is being directed at in-fill drilling to confirm continuity and test for faulted extremities of the ore body as well as underground channel sampling to assist in identifying recoverable reserves. Recent drill results from the “Aurora B” drilling program on the East Flank are encouraging (see Exhibit 9). Little work exploration/ development has been done on the East Flank whereas over 2.3 mln ounces has been produced from the West Flank at Stawell. Select results include 7.06 g/t over 17.80 m (ETW 8.3 m) in MD6339 (located 500 m from existing underground infrastructure). Drilling is ongoing.

Canada Research | Page 12 of 32 Newmarket Gold Inc.
Raymond James Ltd. | 2100 – 925 West Georgia Street | Vancouver BC Canada V6C 3L2
Exhibit 9: Stawell Drill Results
Source: Newmarket Gold Inc.
Operating Assumptions – We model ~2 years of underground ore production (~1 mln tonnes of underground ore and low grade stock piles (combined grade = 1.7 g/t), at a mill rate of 2,000 tpd (below plant capacity). We note that reserves (including Big Hill) of 3.7 mln tonnes grading 1.5 g/t, M&I resources of 4.2 mln tonnes grading 1.83 g/t and inferred resources of 1 mln tonnes of 2.76 g/t have been defined at Stawell (December 31, 2014). M&I resources are inclusive of reserves. Reserves, outside of Big Hill, total 0.3 mln tonnes have been defined.
RJL forecasts ~38 k oz in 2015E at an AISC of ~$931/oz vs. production guidance of 30 k oz. RJL forecasts operating cash costs of $856/oz vs. guidance of $945- $1,025/oz. For 2016E, we forecast a similar production and cost profile as 2015. Capex of ~A$4mln in 2015E and ~A$13 mln in 2016E (Big Hill) are assumed. Using RJL base case metal price assumption ($1,150/oz in 2H15E/2016E) RJL estimates the Stawell mine generating mine level EBITDA of ~$10 mln in 2015E and 2016E.
Exhibit 10: Stawell / Big Hill Operating Assumptions Stawell 2015E 2016E 2017E 2018E 2019E 2020E
Tonnes Milled (k tonnes) 810 682 730 730 730 710
Grade (g/t) 1.87 1.93 1.70 1.68 1.40 1.40
Recoveries (%) 81% 80% 90% 90% 90% 90%
Gold Production (k oz) 38 34 36 35 29 29
Cash Operating Costs (US$/oz) $856 $887 $705 $715 $856 $856
AISC (US$/oz) $931 $921 $758 $769 $918 $920
0
100
200
300
400
500
600
700
800
900
1,000
0
5
10
15
20
25
30
35
40
2015E 2016E 2017E 2018E 2019E 2020E
Co
sts
(US
$ /
oz)
Pro
du
cti
on
(k o
z A
u)
Gold Production (k oz) AISC (US$/oz) Cash Operating Costs (US$/oz)
Source: Raymond James Ltd.

Newmarket Gold Inc. Canada Research | Page 13 of 32
Raymond James Ltd. | 2100 – 925 West Georgia Street | Vancouver BC Canada V6C 3L2
Consolidated = ~230 k oz / Year at ~$986/oz AISC (2015E)
Combining production from NMI’s three operations supports our estimates for ~220 k oz/year of sustainable production at an AISC of $950/oz, until 2019E (see Exhibit 11). We anticipate additional mine life through resource expansion, reflective of the exploration potential offered by NMI’s assets.
Exhibit 11: Consolidated Production and Cost Profile
0
200
400
600
800
1,000
1,200
1,400
1,600
0
50
100
150
200
250
2014 2015E 2016E 2017E 2018E 2019E 2020E 2021E
US
$ /
oz
Pro
du
cti
on
(k o
z)
Stawell Fosterville Cosmo AISC (US$/oz) TCC (US$/oz)
Source: Newmarket Gold Inc., Raymond James Ltd.
Other Exploration Stage Assets
Besides NMI’s operating mines, the company holds property interests in Australia and Canada. These include the Point Leamington Au-Zn-Cu-Ag-Pb deposit in Newfoundland, Canada, the Maud Creek Au deposit in the Northern Territory, Australia as well as properties in the Northern Territory (excluding Cosmo) that host reserves and resources. NMI’s near-term focus is its operations and the mine-site exploration potential offered by each. From NMI’s varied property portfolio, only the Point Leamington and Maud Creek projects are worthy of mention, in our view.
Point Leamington
The Point Leamington gold-zinc-copper-silver-lead massive sulphide deposit in Newfoundland, Canada was discovered by Noranda in 1971. An inferred resource estimate (2013) based on 24,152 m of drilling in 77 drill holes estimated 14.1 mln tonnes grading 1.07 g/t Au, 1.88% Zn, 0.42% Cu, 0.02% Pb, 17.12 g/t Ag (at a 4.0% ZnEq cut-off grade). The deposit contains a high grade core and the resource is open for expansion. No work is planned for Point Leamington and as such RJL ascribes no value to the project in our valuation for NMI.
Maud Creek
The Maud Creek project is located approximately 110 km from Union Reefs mill and approximately 285 km south-southeast of Darwin. Maud Creek hosts a significant underground probable reserve (~1 mln tonnes grading 5.4 g/t Au) and resource (~7.7 mln tonnes grading 3.5 g/t Au). It is open at depth and along strike. The mineralized material is refractory, containing arsenopyrite, and requires additional study before becoming part of NMI’s development plan. As such, RJL ascribes no value to the project in our valuation for NMI.
NMI has commenced a phased feasibility study (PEA, Pre-feasibility, feasibility) at Maud Creek (SRK Consulting). PEA results are anticipated in 1Q16 and based on the successful completion of a PEA, Pre-Feasibility and Feasibility Stages may be undertaken throughout 2016. Proximity to the Union Reefs mill offers potential to leverage existing infrastructure.

Canada Research | Page 14 of 32 Newmarket Gold Inc.
Raymond James Ltd. | 2100 – 925 West Georgia Street | Vancouver BC Canada V6C 3L2
Strong and Flexible Balance Sheet – Consistent Free Cash Flow Generation
NMI had a cash balance of ~$39 mln at June 30, 2015. With the transaction between Crocodile Gold and Newmarket closed on July 10, 2015, the subsequent C$25 mln private placement, and C$20 mln cash consideration paid to CRK shareholders, we estimate a 3Q15 cash balance of ~$47 mln. NMI also has C$34.5 mln in convertible debentures outstanding (April 2018 maturity, 8% coupon). The debentures are convertible at the holder’s option into NMI shares at C$1.02/share, and become callable if NMI’s shares trade above C$1.53 (for a period of 20 days). For the purpose of our valuation we include the convertible debentures as equity. We also note that NMI had working capital of ~$25 mln, as of June 30, 2015.
We forecast steady FCF generation in 2015E and 2016E, with cash balance increasing to ~$61 mln by year-end 2015E and ~$99 mln by year-end 2016E (assuming: $1,150/oz and a US$/A$ FX rate of $0.75).
Exhibit 12: Net Cash Flow (2014A-2018E) Exhibit 13: Cumulative FCF at Various Metal Prices (2014A-2018E)
-$100
-$50
$0
$50
$100
$150
$200
2014A 2015E 2016E 2017E 2018E
US
$ m
ln
Cash From Operations Cash From Investing
Cash From Financing Net Cash Flow
$0
$50
$100
$150
$200
$250
$300
2014A 2015E 2016E 2017E 2018E
US
$ m
ln
Cumulative FCF before debt at $1300
Cumulative FCF before debt at $1150
Cumulative FCF before debt at $1000
Source: Newmarket Gold Inc., Raymond James Ltd.
Gold Price and Operating Cost Sensitivity
Our valuation of NMI is sensitive to the price of gold and operating costs. RJL assumes a flat $1,150/oz gold price (from 3Q15 onwards). See Exhibit 14.
Exhibit 14: Raymond James Ltd.’s Gold Price Deck
Year 2014 2015E 2016E 2017E 2018E LT
Gold Price (US$/oz) $1,266 $1,178 $1,150 $1,150 $1,150 $1,150 Source: Raymond James Ltd.
A 10% increase in the gold from our base case (2016E: $1,150) delivers a NAVPS of C$2.10 estimate (53% increase from our C$1.37 base case estimate), all other assumptions being held constant. A 10% increase in operating costs from our base case delivers a NAVPS of C$0.92 estimate (33% decrease from our C$1.37 base case), all other assumptions being held constant (see Exhibit 15).

Newmarket Gold Inc. Canada Research | Page 15 of 32
Raymond James Ltd. | 2100 – 925 West Georgia Street | Vancouver BC Canada V6C 3L2
Exhibit 15: NAVPS Sensitivity Analysis to Gold Price/Operating Costs
$1 -30% -20% -10% 0% 10% 20% 30%
30% -$2.17 -$1.44 -$0.70 $0.03 $0.76 $1.50 $2.23
20% -$1.72 -$0.99 -$0.26 $0.48 $1.21 $1.94 $2.68
10% -$1.28 -$0.54 $0.19 $0.92 $1.66 $2.39 $3.12
0% -$0.83 -$0.10 $0.64 $1.37 $2.10 $2.84 $3.57
-10% -$0.38 $0.35 $1.08 $1.82 $2.55 $3.28 $3.97
-20% $0.06 $0.80 $1.53 $2.26 $3.00 $3.73 $4.33
-30% $0.51 $1.24 $1.98 $2.71 $3.44 $4.13 $4.71
Gold Price (US$/oz)O
pe
rati
ng
Co
sts
Source: Raymond James Ltd.
Based on our base case estimate for 2016E CFPS of $0.52/share, which is key component used to derive our target price, a 10% increase in the gold price from our base case assumptions delivers a $0.69/share estimate (a 31% increase over our base case). A 10% increase in operating costs delivers a $0.44/share estimate of 2016E CFPS (a 16% decrease in our base case) (see Exhibit 16).
Exhibit 16: Operating Cash Flow/Share Sensitivity Analysis (US$)
0.52 -30% -20% -10% 0% 10% 20% 30%
30% -$0.21 -$0.05 $0.11 $0.28 $0.44 $0.60 $0.76
20% -$0.13 $0.03 $0.20 $0.36 $0.52 $0.68 $0.85
10% -$0.05 $0.12 $0.28 $0.44 $0.60 $0.77 $0.93
0% $0.04 $0.20 $0.36 $0.52 $0.69 $0.85 $1.01
-10% $0.12 $0.28 $0.44 $0.61 $0.77 $0.93 $1.09
-20% $0.20 $0.36 $0.53 $0.69 $0.85 $1.01 $1.18
-30% $0.28 $0.45 $0.61 $0.77 $0.93 $1.10 $1.26
Gold Price (US$/oz)
Op
era
tin
g C
osts
Source: Raymond James Ltd.
Valuation & Recommendation
We are initiating coverage on Newmarket Gold (NMI-TSX) with an Outperform rating and a C$1.70 target price. To derive our target we apply a 50/50 weighting on a 1x NAV and a 3x 2016E CFPS.
In our view our valuation adequately captures the value of NMI’s operating assets and the free cash flow generating opportunity presented by exploiting these assets. We recognize management’s track record in delivering value by (1) growing production and mine lives organically through exploration, (2) maintaining a hold on operating costs, and (3) delivering on annual production and cost guidance.
NMI is trading at ~1.6x 2016E CFPS, a significant discount to our junior gold producer peer group average of ~5.4x and our intermediate producer peer group at 8.1x. In our view, this discount is due to the relatively short reserve-supported mine lives (less than two years) of NMI’s operations. We see near-term potential for reserve expansion driven by mine-site exploration efforts at each of NMI’s mines. On a NAV basis, however, NMI trades at 0.71x Adj. NAV, at a discount to our junior gold producer peer group average at 0.84x and our intermediate producer group at 1.12x.
RJL estimates a NAV for NMI’s operating assets (Fosterville, Cosmo, Stawell) of ~C$184 mln or C$0.97/share. We also include a corporate adjustment of C$77 mln or C$0.40/share which justifies a total NAV of ~C$262 mln or $1.37/share. For the purpose of our valuation we include NMI’s C$34.5 mln in convertible debentures as equity.
See Exhibits 17-20 and Appendix D for valuations vs. RJL’s gold producer peer group.

Canada Research | Page 16 of 32 Newmarket Gold Inc.
Raymond James Ltd. | 2100 – 925 West Georgia Street | Vancouver BC Canada V6C 3L2
Exhibit 17: NAV Estimate Summary Exhibit 18: Target Price Calculation
Valuation Summary C$ 000 C$/fd % NAV Value Multiple%
Weighted
Target
Value
Project (Comp Based) Blended Target Price
Cosmo (DCF 5%) $23,449 $0.12 9% 2016 CFPS (C$) $0.65 3.0x 50% $0.98
Fosterville (DCF 5%) $131,141 $0.69 50% NAVPS (C$) $1.37 1.0x 50% $0.69
Stawell (DCF 5%) $29,768 $0.16 11% Value $1.67
Project Total $184,358 $0.97 70% Target Price $1.70
Return to Target 56%
Corporate NAV
Working Capital $61,831 $0.32 24% P/NAV 0.71x
Additional Capital $15,380 $0.08 6% Target P/NAV 1.34x
LT Debt $0 $0.00 0% P/CFPS (2016E) 1.57x
$77,212 $0.40 30% Target P/CFPS (2016E) 2.60x
Net Asset Value $261,570 $1.37 100% US$/A$ FX Rate $0.75
US$/C$ FX Rate $0.80
Market P/NAV 0.71x
Target P/NAV 1.34x I/O F/D - ITM
Share Count (000's) 134,221 190,869 Source: Raymond James Ltd.
Exhibit 19: P/CF and TP/CF (2016E) Exhibit 20: P/NAV and TP/NAV
0.0x
0.5x
1.0x
1.5x
2.0x
2.5x
AS
R
NM
I
NG
D
AG
I
ED
V
YR
I
MN
D
DG
C
BT
O
SM
F K
TH
O
ELD
AB
X G
IMG
AE
M
P/N
AV
(x
)
P/NAV
Target P/NAV
0.0x
2.0x
4.0x
6.0x
8.0x
10.0x
12.0x
14.0x
NM
I
ED
V K
AB
X
YR
I
MN
D
NG
D
SM
F
BT
O
DG
C
TH
O
AG
I
AE
M
AS
R
IMG G
ELD
P/C
FP
S (
x)
P/2016E CFPS
TP/2016E CFPS
Source: Raymond James Ltd.

Newmarket Gold Inc. Canada Research | Page 17 of 32
Raymond James Ltd. | 2100 – 925 West Georgia Street | Vancouver BC Canada V6C 3L2
Costs, Balance Sheet Strength & FCF Potential
We note that NMI’s (previously Crocodile Gold) costs have steadily decreased driven by high grade discoveries at Fosterville, ranking the company as a sub-$1,000/oz producer (on an AISC basis).
A noteable differentiator that NMI enjoys is their potential to deliver FCF, something that we feel the market doesn’t fully appreciate, based on sector leading 2016E FCF yields (see Exhibit 23).
NMI has a clean balance sheet (as of 2Q15) compared with peers (see Exhibit 24).
Exhibit 21: Total Cash Costs US$/oz (2015/16E) Exhibit 22 AISC - US$/oz (2015/16E)
$0
$200
$400
$600
$800
$1,000
$1,200
$1,400
SM
F
ASR
TH
O
BTO
NG
D G
AEM
MN
D
NM
I
DG
C
YRI
ED
V
AG
I K
ABX
ELD
IMG
AIS
C (
US
$/
oz A
uEq
)
AISC - (2015E) AISC (2016E)
$0
$100
$200
$300
$400
$500
$600
$700
$800
$900
$1,000
SM
F
ABX
ASR
AEM G
TH
O
ELD
BTO
YRI
MN
D
DG
C
AG
I
NM
I K
NG
D
ED
V
IMG
To
tal
Ca
sh
Co
sts
(U
S$
/o
z A
uEq
)
TCC (2015E) TCC (2016E)
Source: Raymond James Ltd.
Exhibit 23: FCF Yield (2015/16E) - % Exhibit 24: Net Debt (US$ mln)
-30%
-20%
-10%
0%
10%
20%
30%
40%
50%
NM
I
ED
V
MN
D
SM
F
TH
O
ABX K
DG
C
AEM
YRI G
ELD
BTO
AG
I
ASR
NG
D
IMG
FCF
Yie
ld (%
)
FCF Yield - 2015E
FCF Yield - 2016E
-$1,000
-$500
$0
$500
$1,000
$1,500
$2,000
$2,500
$3,000
$3,500
$4,000
ASR
IMG
TH
O
AG
I
NM
I
SM
F
MN
D
ELD
ED
V
DG
C
BTO
NG
D K
AEM
YRI G
ABX
Ne
t D
eb
t (U
S$
mln
s)
Net Debt (US$ mlns)
Sources: Raymond James Ltd.

Canada Research | Page 18 of 32 Newmarket Gold Inc.
Raymond James Ltd. | 2100 – 925 West Georgia Street | Vancouver BC Canada V6C 3L2
Mine-Level AISC
Of the ~90 mines and projects of our gold producers under coverage, NMI’s mines rank below average on a mine-level all-in cost basis (average LOM). Fosterville ranks in the lower third on an AISC basis, while NMI’s Stawell and Cosmo mines rank as higher costs assets.
Exhibit 25: Mine-Level AISC
$0
$200
$400
$600
$800
$1,000
$1,200
$1,400
East
ern
Dra
gon
Otj
iko
to
La I
ndia
Agb
aou
Co
rte
z
Espe
ranz
a
Tanj
ians
han
Oly
mp
ias
Feko
la
Cop
ler
Kup
ol D
voin
oye
Man
a
Kir
azl
i
Me
liad
ine
Gol
dex
New
Aft
on
Ho
un
de
Esco
bal
Agi
Da
gi
Pasc
ua
Lam
a
Lagu
nas
No
rte
Cerr
o N
egro
Ma
lart
ic
Mea
dow
bank
Cert
ej
La L
iber
tad
Upp
er B
eave
r
Cost
erfie
ld
Lapa
Fost
ervi
lle
Aur
ora
Gol
dstr
ike
Pino
s A
ltos
Shah
uind
o
Kis
lad
ag
Eleo
nore
Efe
mcu
ku
ru
Roun
d M
ount
ain
Mul
ato
s
Ra
iny
Riv
er
Sko
urie
s
Los
Filo
s
Re
d L
ake
Pueb
lo V
iejo
Pueb
lo V
iejo
LaR
onde
Det
our
Lake
Bjo
rkd
al
Turq
uoise
Rid
ge
Pen
asqu
ito
Mas
bate
La A
ren
a
Ve
lad
ero
Porg
era
Wh
ite
Mo
un
tain
Sa
dio
la
Me
squ
ite
Asa
nko
Go
ld M
ine
Po
rcu
pin
e
Cerr
o Sa
n P
edro
Chir
ano
He
mlo
Kitt
ila
Ess
ak
ane
Tasi
ast
Kett
le R
iver
Sta
we
ll
Taba
koto
Kalg
oorl
ie
El L
imon
Jinfe
ng
Pea
k M
ines
Youg
a
Ruby
Hill
We
stw
oo
d
Pa
raca
tu
Fo
rt K
no
x
Youn
g D
avid
son
Gol
den
Sun
light
No
rth
Ma
ra
El C
hana
te
Buly
anhu
lu
Ba
ld M
ou
nta
in
Mu
sse
lwh
ite
Ma
rlin
Nze
ma
Buzw
agi
Co
sm
o
Mar
icun
ga
Ro
seb
el
Co
st P
er
Ou
nce
NMI Royalty Per Ounce Taxes Per Ounce Sustaining CAPEX Per Ounce Operating Cost Per Ounce Average Mine-Level All-In Costs
Source: Raymond James Ltd.

Newmarket Gold Inc. Canada Research | Page 19 of 32
Raymond James Ltd. | 2100 – 925 West Georgia Street | Vancouver BC Canada V6C 3L2
Profitability Index – Asset Level
We utilize Profitability Index (PI) as a measure to analyze the individual mines and projects of our 85 gold producing assets currently under coverage. We rank the assets on a total PI score for each company that represents the present value of cash flow divided by the present value of total capital invested (development + sustaining). NMI’s Fosterville and Stawell mines rank near the middle of the peer group, while NMI’s Cosmo ranks near the low end of the group (due to its high costs).
Exhibit 26: NMI Assets – Profitability Index Total Capital
0
1
2
3
4
5
6
7
8
9
10
Mar
icu
nga
Kalg
oorli
e
Nze
ma
Lum
wan
a
Jaco
bin
a
He
mlo
Ta
sia
st
Wes
two
od
Bald
Mou
ntai
n
Cosm
o
Turq
uois
e Ri
dge
Mus
selw
hite
Kit
tila
El L
imo
n
C1 S
anta
Luz
Mar
lin
Los
Filo
s
Porc
upin
e
Taba
koto
Fort
Kno
x
Ruby
Hill
Go
lden
Sun
light
Para
catu
Copl
er
Pila
r
La L
ibe
rta
d
Chap
ada
Buly
anhu
lu
Yo
un
g D
avi
dso
n
No
rth
Mar
a
Mas
bat
e
Mer
ced
es
Vel
ader
o
Red
Lak
e
El C
hana
te
Gu
alca
may
o
Pea
k M
ines
Jin
fen
g
Ch
iran
o
Essa
kane
El P
enon
Min
era
Flo
rida
Staw
ell
Kisl
adag
Whi
te M
ount
ain
Fost
ervi
lle
Man
a
Ele
on
ore
Faz
en
da
Bra
silie
ro
Bjo
rkd
al
Cerr
o N
egro
Pin
os A
ltos
Sad
iola
Efem
cuku
ru
Mes
qui
te
Roun
d M
oun
tain
Go
ldex
Kett
le R
iver
LaR
on
de
Go
ldst
rike
Det
our
Lak
e
Cerr
o B
ayo
Cana
dian
Mal
arti
c
Mul
ato
s
Otji
koto
La A
ren
a
Ce
rro
Sa
n P
ed
ro
Youg
a
Lagu
nas
Nor
te
Pueb
lo V
iejo
Pena
squ
ito
Zald
ivar
Cres
ton
Mas
cota
New
Aft
on
Cost
erfi
eld
Buzw
agi
Cort
ez
Lapa
Mea
dow
bank
Agb
aou
Tanj
ian
shan
Kup
ol D
voin
oye
Esco
bal
Alu
mb
rera
La In
dia
Profitability Index - Total Capital NMI Assets
Source: Raymond James Ltd.
Canada Research | Page 20 of 32 Newmarket Gold Inc. Newmarket Gold Inc.
Raymond James Ltd. | 2100 – 925 West Georgia Street | Vancouver BC Canada V6C 3L2
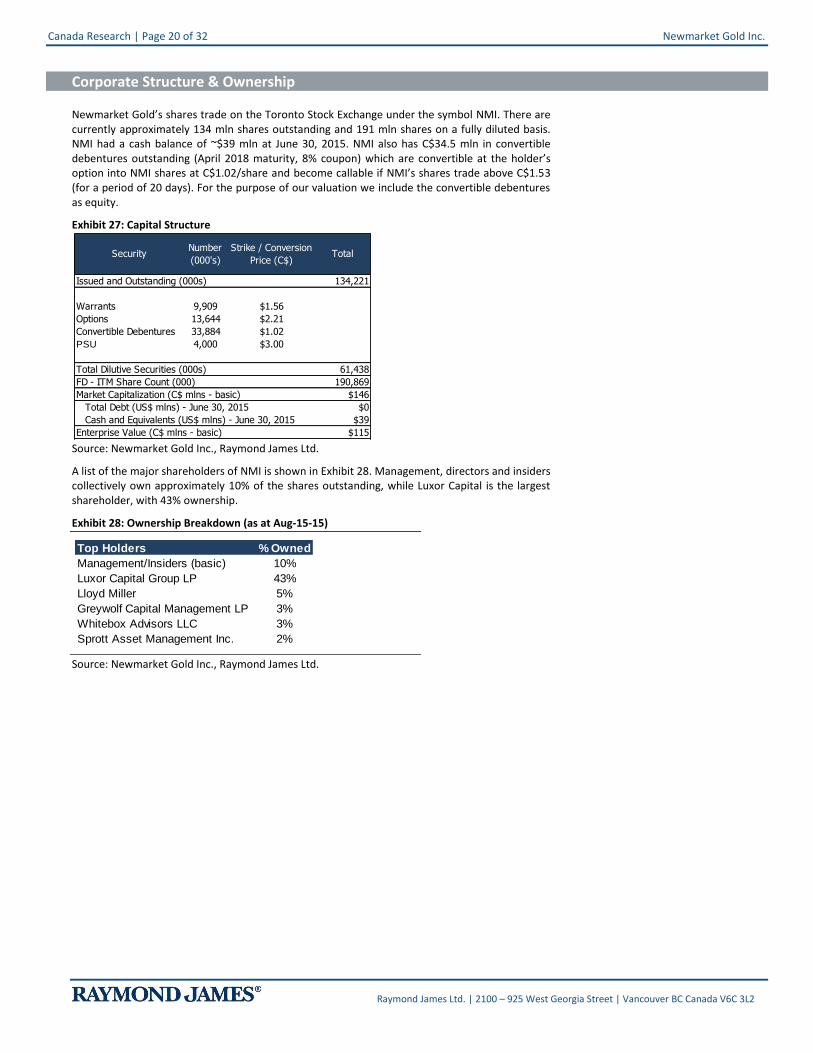
Corporate Structure & Ownership
Newmarket Gold’s shares trade on the Toronto Stock Exchange under the symbol NMI. There are currently approximately 134 mln shares outstanding and 191 mln shares on a fully diluted basis. NMI had a cash balance of ~$39 mln at June 30, 2015. NMI also has C$34.5 mln in convertible debentures outstanding (April 2018 maturity, 8% coupon) which are convertible at the holder’s option into NMI shares at C$1.02/share and become callable if NMI’s shares trade above C$1.53 (for a period of 20 days). For the purpose of our valuation we include the convertible debentures as equity.
Exhibit 27: Capital Structure
Issued and Outstanding (000s) 134,221
Warrants 9,909 $1.56
Options 13,644 $2.21
Convertible Debentures 33,884 $1.02
PSU 4,000 $3.00
Total Dilutive Securities (000s) 61,438
FD - ITM Share Count (000) 190,869
Market Capitalization (C$ mlns - basic) $146
Total Debt (US$ mlns) - June 30, 2015 $0
Cash and Equivalents (US$ mlns) - June 30, 2015 $39
Enterprise Value (C$ mlns - basic) $115
SecurityNumber
(000's)
Strike / Conversion
Price (C$)Total
Source: Newmarket Gold Inc., Raymond James Ltd.
A list of the major shareholders of NMI is shown in Exhibit 28. Management, directors and insiders collectively own approximately 10% of the shares outstanding, while Luxor Capital is the largest shareholder, with 43% ownership.
Exhibit 28: Ownership Breakdown (as at Aug-15-15)
Top Holders % Owned
Management/Insiders (basic) 10%
Luxor Capital Group LP 43%
Lloyd Miller 5%
Greywolf Capital Management LP 3%
Whitebox Advisors LLC 3%
Sprott Asset Management Inc. 2%
Source: Newmarket Gold Inc., Raymond James Ltd.

Newmarket Gold Inc. Canada Research | Page 21 of 32
Raymond James Ltd. | 2100 – 925 West Georgia Street | Vancouver BC Canada V6C 3L2
Appendix A: Management & Board of Directors
Management Team
President and CEO: Douglas Forster, M.Sc., P.Geo. – Mr. Forster has been associated with the mining industry for over 30 years as a geologist, senior executive, Director, and company founder. He holds a B.Sc. (1981) and M.Sc. (1984) in Economic Geology from the University of British Columbia, Canada. Mr. Forster has worked with numerous companies, including Terrane Metals which was acquired by Thompson Creek in 2010 for $750 mln and Potash One that was acquired by K+S in 2011 for $434 mln. Over the past 25 years Mr. Forster has been involved in a number of large-scale Canadian mine development projects including the Mt. Milligan gold-copper mine, the Kemess South gold-copper mine, the Golden Bear gold mine and the Legacy potash project. Mr. Forster has a proven track record in resource project development, mergers and acquisition, equity finance and public company management. He is a registered member of the Association of Professional Engineers and Geoscientists of British Columbia.
CFO: Robert Dufour, CA, CPA – Robert Dufour was appointed Chief Financial Officer of Newmarket Gold in July 2015. Prior to this appointment and the Newmarket Gold merger, Mr. Dufour was CFO of Crocodile Gold. Mr. Dufour joined Crocodile Gold in June 2012 as Director of Finance and was appointed Chief Financial Officer in April 2013. Mr. Dufour is a Chartered Accountant with over 10 years of finance and accounting experience. He started his career with the Toronto office of PriceWaterhouseCoopers. He later joined Northgate Minerals Corporation as Corporate Controller and subsequently was promoted to Group Financial Controller for Northgate’s Australian subsidiaries, and was based out of Victoria, Australia until its acquisition by AuRico Gold.
Executive Vice President: Blayne Johnson – Mr. Johnson has been involved in the investment community for the over 27 years. As a Vice President of First Marathon Securities he played a key role in providing institutional financing to junior resource companies. During his tenure at the firm, First Marathon participated in over $5 bln of equity financings for natural resource companies. His work at First Marathon involved equity and debt financings as well as mergers and acquisitions. Mr. Johnson also advised institutional clients on investments. Mr. Johnson was a founder of Terrane Metals which was acquired by Thompson Creek in 2010 for $750 mln. He is currently Chairman of Featherstone Capital Inc.
Board of Directors
Non-Executive Chairman: Raymond Threlkeld – Mr. Threlkeld is a seasoned mining professional with more than 32 years of experience in mineral exploration, mine operations and construction and executive management. Most recently he was President and CEO of Rainy River Resources that was developing the 4.0 mln ounce Rainy River gold deposit in Ontario. New Gold purchased Rainy River for $310 mln in 2013. From 2006 to 2009, Mr. Threlkeld led the team along with Randall Oliphant that acquired, developed and put into operation the Mesquite gold mine in California with Western Goldfields subsequently being purchased by New Gold for $314 mln in 2009. From 1996 to 2004, he held a variety of senior executive positions with Barrick Gold Corporation rising to the position of Vice President, Project Development. During his tenure at Barrick, Mr. Threlkeld was responsible for placing more than 30 mln ounces of gold resources into production in Africa, South America and Australia. Among his accomplishments were the Pierina Mine in Peru, Bulyanhulu Mine in Tanzania, Veladero Mine in Argentina, Lagunas Norte Mine in Peru and the Cowel Mine in Australia. Mr. Threlkeld holds a B.Sc. degree in Geology from the University of Nevada.
Director: Lukas Lundin – Mr. Lundin is Chairman of Lundin Mining Corporation. He graduated from the New Mexico Institute of Mining and Technology (Engineering). He has been responsible for various resource discoveries including the multi-million ounce Veladero gold deposit in Argentina that was sold to Homestake for $300 mln in 1999. He has led numerous companies through very profitable business acquisition and mergers including the $7.1 bln sale of Red Back Mining in 2010.
Director: Randall Oliphant, CA – Mr. Oliphant is Executive Chairman of New Gold and was recently appointed Chairman of the World Gold Council. Mr. Oliphant is on the Advisory

Canada Research | Page 22 of 32 Newmarket Gold Inc. Newmarket Gold Inc.
Raymond James Ltd. | 2100 – 925 West Georgia Street | Vancouver BC Canada V6C 3L2
Board of Metalmark Capital LLC (formally Morgan Stanley Capital Partners) and serves on the Boards of WesternZagros Resources Ltd. and Franco-Nevada Corporation. Since 2003, Mr. Oliphant has served on the Boards of a number of public and private companies and not-for-profit organizations. From 1999 to 2003 he was President and Chief Executive Officer of Barrick Gold Corporation, the largest gold producer in the world. From 2006 to 2009 he served as Chairman of Western Goldfields Inc. where he oversaw the successful sale of the company to New Gold for $314 mln. Mr. Oliphant is a Chartered Accountant.

Newmarket Gold Inc. Canada Research | Page 23 of 32
Raymond James Ltd. | 2100 – 925 West Georgia Street | Vancouver BC Canada V6C 3L2
Appendix B: Financial Statements
Income Statement (US$ 000's) 2013 2014 2015E 2016E
Revenues 300,825 282,739 267,737 257,764
Operating Expenses
Production Costs 218,900 202,034 161,562 162,315
Depreciation and Depletion 76,857 39,424 42,163 48,742
Total Operating Expenses 295,757 241,458 203,725 211,057
Mine Operating Profit 81,925 41,281 64,012 46,707
Total Other Expenses 166,360 11,310 14,214 11,000
Operating Income (161,291) 29,971 49,799 35,707
Non-Operating Income (Expenses) 74,373 (6,939) (2,677) (2,208)
Adj. Net Income (Loss) 54,435 32,977 43,302 30,979
Adj. Basic EPS (Loss) per share 0.13 0.07 0.25 0.21
WA Shares Outstanding
Basic Shares Outstanding (000's) 406,379 464,798 138,888 144,130
F/D Shares Outstanding (000's) 406,379 471,874 156,985 156,985
Adj. EBITDA 126,319 84,549 92,580 82,241
Adj. EBITDA Margin % 42% 30% 35% 32%
BALANCE SHEET (US$ 000's) 2013 2014 2015E 2016E
Assets
Cash & Equivalents 27,591 33,775 60,676 99,308
Total Current Assets 66,952 62,750 82,424 115,244
Mining Assets 128,243 157,794 147,734 149,992
Total Assets 234,842 256,129 260,001 295,079
Liabilities
Current Liabilities
Trade & Other Payables 36,276 30,579 22,649 17,500
Interest Bearing Loans and Borrowings 9,676 3,887 3,160 3,160
Total Current Liabilities 51,642 50,150 32,959 27,809
Non Current Liabilities
Interest Bearing Loans and Borrowing 24,568 25,205 23,432 23,432
ARO 36,588 35,555 31,623 31,623
Total Liabilities 135,122 132,348 88,014 82,864
Shareholders' Equity
Share Capital 306,773 322,303 330,075 336,804
Equity Reserves 21,493 21,844 21,990 21,990
Accumulated Other Comp. Income (21,269) (33,041) (38,657) (38,657)
Retained Earnings (deficit) (207,276) (187,324) (141,421) (107,922)
Total Equity 99,721 123,781 171,987 212,215
Total Liabilities & Shareholders' Equity 234,842 256,129 260,001 295,079
Source: Newmarket Gold Inc., Raymond James Ltd.

Canada Research | Page 24 of 32 Newmarket Gold Inc. Newmarket Gold Inc.
Raymond James Ltd. | 2100 – 925 West Georgia Street | Vancouver BC Canada V6C 3L2
Cash Flow Statement (US$ 000's) 2013 2014 2015E 2016E
Operating Activities
Net Income (92,766) 19,952 44,642 30,979
Add:Non-Cash items:
Depreciation & Depletion 76,857 39,424 42,163 48,742
Stock Based Comp 921 368 242 0
Impairments etc. 92,687 (7,357) 1,108 0
Operating CF before changes in WC 73,849 73,020 93,197 82,241
Net change in non-cash WC (6,386) 1,137 (713) 662
Cash flow from Operations 67,463 74,157 92,483 82,903
CFO/ diluted share (Excluding WC) 0.18 0.15 0.59 0.52
Investing Activities
Capital Expenditures (67,578) (59,437) (47,401) (51,000)
Cash flow from Investing (68,156) (70,996) (85,138) (51,000)
Financing Activities
Cash flow from Financing 10,177 5,405 21,480 6,729
Net Change in Cash 2,850 6,184 26,900 38,632
Cash, BOP 24,741 27,591 33,775 60,676
Cash, EOP 27,591 33,775 60,676 99,307
Free Cash Flow
Free Cash Flow (5,298) 7,414 37,858 31,241
FCF/Diluted Share (0.01) 0.02 0.24 0.20
Source: Newmarket Gold Inc., Raymond James Ltd.

Newmarket Gold Inc. Canada Research | Page 25 of 32
Raymond James Ltd. | 2100 – 925 West Georgia Street | Vancouver BC Canada V6C 3L2
Appendix C: Corporate Tearsheet
RAYMOND JAMES LTD. RESEARCH
Rating: OUTPERFORM 2 Share Price: $1.09 Analyst: Chris Thompson 604 659 8439
6-12 Mth Target C$ 1.70 NAVPS $1.37 Associate: Brian Martin 604 654 1236
Projected Return: 56% YR-END: 31-Dec
Reporting Currency: US
Investment Thesis Management % Ownership Significant Shareholders % Ownership
Management/Insiders 10% Luxor Capital Group LP 43%
Lloyd Miller 5%
Greywolf Capital Management LP 3%
Key Attributes:
Market Statistics
- Benefited from a weakening A$ vs. US$ = Significant cost reductions Share Price C$ 1.09 Shares Basic (mln) 134.2
- Stable ~200 k oz producer with competitive AISC profile 52 Week High/Low (C$) 1.35 - 0.13 Shares Fully Diluted (mln) 190.9
- Management has successfully mine lives through exploration Market Cap. (C$mln) $146 Adj. Shares used in NAV calc (mln) 190.9
- Exploration Upside Enterprise Value (C$mln) $115 Avg Daily Volume: 333
Financial Metrics 2013A 2014A 2015E 2016E 2017E
Cash & Equiv. (mlns) 28 34 61 99 140
Key Concerns Working capital (mlns) 15 13 49 87 128
-Development Risk -Cost Inflation -Gold Price Risk Current ratio (x) 1.3x 1.3x 2.5x 4.1x 5.6x
-Political Risk -Operational / Labour Risk Debt (mlns) 34 - - - -
Common Equity (mlns) 100 124 172 212 247
(As of Dec-31-14) Project Category Tonnes (000) Au (g/t) Au (k oz) Price/book (x) 1.1x 1.0x 0.9x 0.7x 0.6x
Fostervil le P&P 1,458 6.57 308 ROE 0% 16% 26% 15% 13%
Reserves Cosmo P&P 1,295 3.57 149
Stawell P&P 3,727 1.50 180 CFO (US$mln) 67 74 92 83 83
Other P&P 2,770 3.35 299 CFI (US$mln) (68) (71) (85) (51) (43)
Total 9,250 3.14 935 CFF (US$ mln) 10 5 21 7 0
Resources FCF (US$mln) (5) 7 38 31 41
Fostervil le M&I + Inf 22,500 3.94 2,850
Cosmo M&I + Inf 5,967 3.25 623
Stawell M&I + Inf 5,137 2.00 330
Other M&I + Inf 44,500 2.08 2,981 Earnings/Cash Flow 2013A 2014A 2015E 2016E 2017E
Total M&I + Inf 78,104 2.70 6,784 RJL Gold Forecast US$/oz 1,413 1,266 1,178 1,150 1,150
Revenue ($mln) 300.8 282.7 267.7 257.8 253.9
Adj. EBITDA ($mln) 126.3 84.5 92.6 82.2 83.3
Operating Summary 2013 2014 2015E 2016E 2017E EBITDA margin (%) 42% 30% 35% 32% 33%
Production - Au (k oz) - 100% basis EV/EBITDA (x) 0.6 0.8 0.8 0.9 0.9
Fostervil le 98 105 113 110 112 Net Earnings ($mln) -92.8 20.0 44.6 31.0 32.0
Cosmo 74 78 77 80 73 Adj. Earnings ($ mlns) 54.4 33.0 43.3 31.0 32.0
Stawell 38 39 38 34 36
Total - Au (k oz) 211 222 228 224 221 Adj. EPS (US$) 0.13 0.07 0.25 0.21 0.22
P/E (x) 1.5x 2.9x 3.3x 3.8x 3.7x
Cash Costs (US$/oz Au) CFPS (US$) 0.18 0.15 0.59 0.52 0.53
Fostervil le 829 738 572 596 586 P/CF (x) 1.1x 1.3x 1.4x 1.6x 1.6x
Cosmo 1162 997 834 827 905
Stawell 1288 1151 856 887 705 Capex ($mln) (73) (67) (54) (51) (43)
Consolidated (US$/oz) 1029 901 708 722 711
AISC (US$/oz) 1365 1211 986 958 954
Valuation (C$)
Blended Target Price Value Multiple % Weighted Target Value
2016 CFPS (C$) $0.65 3.0x $0.50 $0.98
NAVPS (C$) $1.37 1.0x $0.50 $0.69
$1.67
Target Price $1.70
Return to Target 56%
P/NAV 0.71x
Target P/NAV 1.34x
P/CFPS (2016E) 1.57x
Target P/CFPS (2016E) 2.60x
US$/C$ FX Rate $0.80
US$/A$ FX Rate $0.75
Share Count Used in Valuation (000's) - FD ITM 190,869
RJL Covered Gold's P/CFPS Multiples (2016E) RJL Covered Gold's P/NAV Multiples
Newmarket Gold Inc.
Newmarket Gold produces ~200 k oz year from three gold mines in Australia.
- Sustainable FCF Generation in current metal price environment
0.0x
0.5x
1.0x
1.5x
2.0x
2.5x
AS
R
NM
I
NG
D
AG
I
ED
V
YR
I
MN
D
DG
C
BT
O
SM
F K
TH
O
ELD
AB
X G
IMG
AE
M
P/N
AV
(x
)
P/NAV Target P/NAV
0.0x
2.0x
4.0x
6.0x
8.0x
10.0x
12.0x
14.0x
NM
I
ED
V K
AB
X
YR
I
MN
D
NG
D
SM
F
BT
O
AG
I
DG
C
TH
O
AE
M
AS
R
IMG G
ELD
P/C
FP
S (
x)
P/2016E CFPS TP/2016E CFPS
0
200
400
600
800
1,000
1,200
1,400
1,600
0
50
100
150
200
250
2013 2014 2015E 2016E 2017E
US
$ /
oz
Pro
du
cti
on
(k o
z A
uE
q)
Stawell Cosmo Fosterville AISC (US$/oz) Cash Costs (US$/oz Au)
Source: Newmarket Gold Inc., Raymond James Ltd.
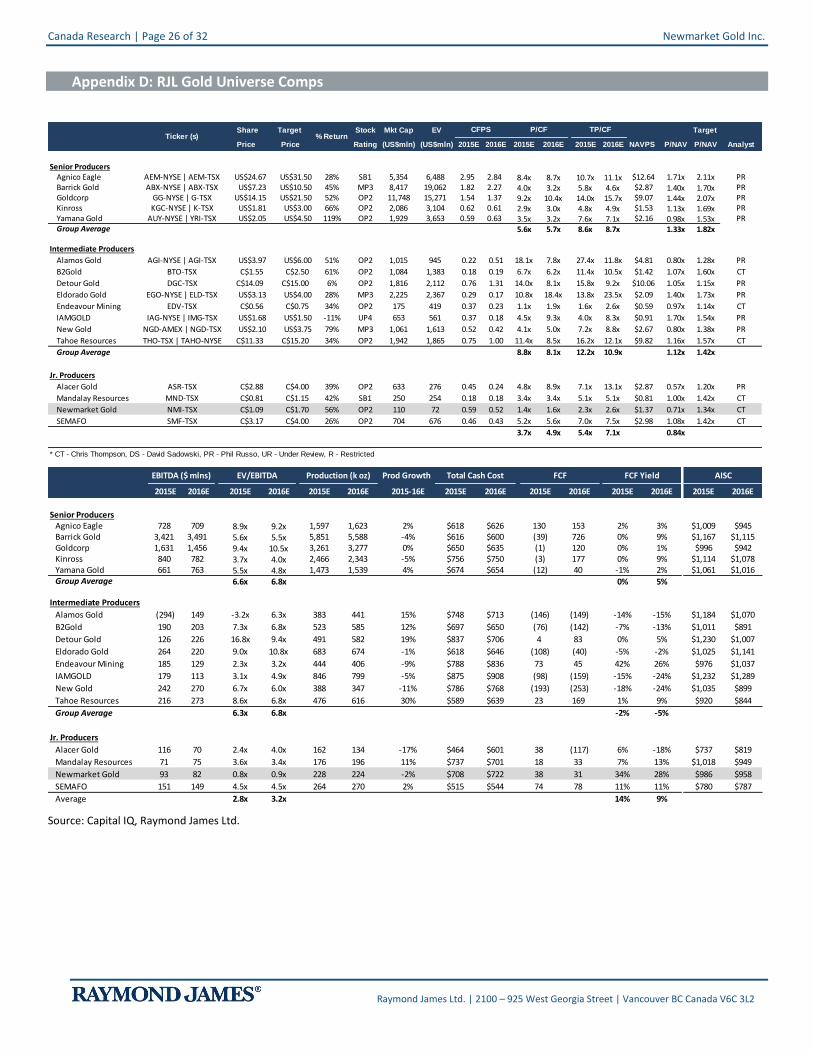
Canada Research | Page 26 of 32 Newmarket Gold Inc. Newmarket Gold Inc.
Raymond James Ltd. | 2100 – 925 West Georgia Street | Vancouver BC Canada V6C 3L2
Appendix D: RJL Gold Universe Comps
Share Target Stock Mkt Cap EV Target
Price Price Rating (US$mln) (US$mln) 2015E 2016E 2015E 2016E 2015E 2016E NAVPS P/NAV P/NAV Analyst
Senior ProducersAgnico Eagle AEM-NYSE | AEM-TSX US$24.67 US$31.50 28% SB1 5,354 6,488 2.95 2.84 8.4x 8.7x 10.7x 11.1x $12.64 1.71x 2.11x PRBarrick Gold ABX-NYSE | ABX-TSX US$7.23 US$10.50 45% MP3 8,417 19,062 1.82 2.27 4.0x 3.2x 5.8x 4.6x $2.87 1.40x 1.70x PRGoldcorp GG-NYSE | G-TSX US$14.15 US$21.50 52% OP2 11,748 15,271 1.54 1.37 9.2x 10.4x 14.0x 15.7x $9.07 1.44x 2.07x PRKinross KGC-NYSE | K-TSX US$1.81 US$3.00 66% OP2 2,086 3,104 0.62 0.61 2.9x 3.0x 4.8x 4.9x $1.53 1.13x 1.69x PRYamana Gold AUY-NYSE | YRI-TSX US$2.05 US$4.50 119% OP2 1,929 3,653 0.59 0.63 3.5x 3.2x 7.6x 7.1x $2.16 0.98x 1.53x PRGroup Average 5.6x 5.7x 8.6x 8.7x 1.33x 1.82x
Intermediate Producers
Alamos Gold AGI-NYSE | AGI-TSX US$3.97 US$6.00 51% OP2 1,015 945 0.22 0.51 18.1x 7.8x 27.4x 11.8x $4.81 0.80x 1.28x PR
B2Gold BTO-TSX C$1.55 C$2.50 61% OP2 1,084 1,383 0.18 0.19 6.7x 6.2x 11.4x 10.5x $1.42 1.07x 1.60x CT
Detour Gold DGC-TSX C$14.09 C$15.00 6% OP2 1,816 2,112 0.76 1.31 14.0x 8.1x 15.8x 9.2x $10.06 1.05x 1.15x PR
Eldorado Gold EGO-NYSE | ELD-TSX US$3.13 US$4.00 28% MP3 2,225 2,367 0.29 0.17 10.8x 18.4x 13.8x 23.5x $2.09 1.40x 1.73x PR
Endeavour Mining EDV-TSX C$0.56 C$0.75 34% OP2 175 419 0.37 0.23 1.1x 1.9x 1.6x 2.6x $0.59 0.97x 1.14x CT
IAMGOLD IAG-NYSE | IMG-TSX US$1.68 US$1.50 -11% UP4 653 561 0.37 0.18 4.5x 9.3x 4.0x 8.3x $0.91 1.70x 1.54x PR
New Gold NGD-AMEX | NGD-TSX US$2.10 US$3.75 79% MP3 1,061 1,613 0.52 0.42 4.1x 5.0x 7.2x 8.8x $2.67 0.80x 1.38x PR
Tahoe Resources THO-TSX | TAHO-NYSE C$11.33 C$15.20 34% OP2 1,942 1,865 0.75 1.00 11.4x 8.5x 16.2x 12.1x $9.82 1.16x 1.57x CT
Group Average 8.8x 8.1x 12.2x 10.9x 1.12x 1.42x
Jr. Producers
Alacer Gold ASR-TSX C$2.88 C$4.00 39% OP2 633 276 0.45 0.24 4.8x 8.9x 7.1x 13.1x $2.87 0.57x 1.20x PR
Mandalay Resources MND-TSX C$0.81 C$1.15 42% SB1 250 254 0.18 0.18 3.4x 3.4x 5.1x 5.1x $0.81 1.00x 1.42x CT
Newmarket Gold NMI-TSX C$1.09 C$1.70 56% OP2 110 72 0.59 0.52 1.4x 1.6x 2.3x 2.6x $1.37 0.71x 1.34x CT
SEMAFO SMF-TSX C$3.17 C$4.00 26% OP2 704 676 0.46 0.43 5.2x 5.6x 7.0x 7.5x $2.98 1.08x 1.42x CT
3.7x 4.9x 5.4x 7.1x 0.84x
* CT - Chris Thompson, DS - David Sadowski, PR - Phil Russo, UR - Under Review, R - Restricted
P/CF TP/CFTicker (s) % Return
CFPS
Prod Growth
2015E 2016E 2015E 2016E 2015E 2016E 2015-16E 2015E 2016E 2015E 2016E 2015E 2016E 2015E 2016E
Senior ProducersAgnico Eagle 728 709 8.9x 9.2x 1,597 1,623 2% $618 $626 130 153 2% 3% $1,009 $945Barrick Gold 3,421 3,491 5.6x 5.5x 5,851 5,588 -4% $616 $600 (39) 726 0% 9% $1,167 $1,115Goldcorp 1,631 1,456 9.4x 10.5x 3,261 3,277 0% $650 $635 (1) 120 0% 1% $996 $942Kinross 840 782 3.7x 4.0x 2,466 2,343 -5% $756 $750 (3) 177 0% 9% $1,114 $1,078Yamana Gold 661 763 5.5x 4.8x 1,473 1,539 4% $674 $654 (12) 40 -1% 2% $1,061 $1,016Group Average 6.6x 6.8x 0% 5%
Intermediate Producers
Alamos Gold (294) 149 -3.2x 6.3x 383 441 15% $748 $713 (146) (149) -14% -15% $1,184 $1,070
B2Gold 190 203 7.3x 6.8x 523 585 12% $697 $650 (76) (142) -7% -13% $1,011 $891
Detour Gold 126 226 16.8x 9.4x 491 582 19% $837 $706 4 83 0% 5% $1,230 $1,007
Eldorado Gold 264 220 9.0x 10.8x 683 674 -1% $618 $646 (108) (40) -5% -2% $1,025 $1,141
Endeavour Mining 185 129 2.3x 3.2x 444 406 -9% $788 $836 73 45 42% 26% $976 $1,037
IAMGOLD 179 113 3.1x 4.9x 846 799 -5% $875 $908 (98) (159) -15% -24% $1,232 $1,289
New Gold 242 270 6.7x 6.0x 388 347 -11% $786 $768 (193) (253) -18% -24% $1,035 $899
Tahoe Resources 216 273 8.6x 6.8x 476 616 30% $589 $639 23 169 1% 9% $920 $844
Group Average 6.3x 6.8x -2% -5%
Jr. Producers
Alacer Gold 116 70 2.4x 4.0x 162 134 -17% $464 $601 38 (117) 6% -18% $737 $819
Mandalay Resources 71 75 3.6x 3.4x 176 196 11% $737 $701 18 33 7% 13% $1,018 $949
Newmarket Gold 93 82 0.8x 0.9x 228 224 -2% $708 $722 38 31 34% 28% $986 $958
SEMAFO 151 149 4.5x 4.5x 264 270 2% $515 $544 74 78 11% 11% $780 $787
Average 2.8x 3.2x 14% 9%
AISCProduction (k oz) FCF YieldFCFEBITDA ($ mlns) EV/EBITDA Total Cash Cost
Source: Capital IQ, Raymond James Ltd.

Newmarket Gold Inc. Canada Research | Page 27 of 32
Raymond James Ltd. | 2100 – 925 West Georgia Street | Vancouver BC Canada V6C 3L2
Company Citations
Company Name Ticker Exchange Currency Closing Price RJ Rating RJ Entity
Agnico Eagle Mines AEM NYSE US$ 24.67 1 RJ LTD. Alacer Gold Corp ASR TSX C$ 2.88 2 RJ LTD. Alamos Gold Inc. AGI NYSE US$ 3.97 2 RJ LTD. B2Gold Corp. BTO TSX C$ 1.55 2 RJ LTD. Barrick Gold Corporation ABX NYSE US$ 7.23 3 RJ LTD. Detour Gold Corp. DGC TSX C$ 14.09 2 RJ LTD. Eldorado Gold Corp. EGO NYSE US$ 3.13 3 RJ LTD. Endeavour Mining Corp. EDV TSX C$ 0.56 2 RJ LTD. Franco-Nevada Corp. FNV NYSE US$ 43.71 2 RJ LTD. Goldcorp Inc. GG NYSE US$ 14.15 2 RJ LTD. IAMGOLD Corp. IAG NYSE C$ 2.21 4 RJ LTD. Kinross Gold Corporation KGC NYSE US$ 1.81 2 RJ LTD. Lundin Mining Corporation LUN TSX C$ 3.86 1 RJ LTD. Mandalay Resources Corp. MND TSX C$ 0.81 1 RJ LTD. New Gold, Inc. NGD NYSE MKT C$ 2.76 3 RJ LTD. SEMAFO Inc. SMF TSX C$ 3.17 2 RJ LTD. Tahoe Resources Inc. THO TSX C$ 11.33 2 RJ LTD. Yamana Gold Inc. AUY NYSE US$ 2.05 2 RJ LTD.
Notes: Prices are as of the most recent close on the indicated exchange and may not be in US$. See Disclosure section for rating definitions. Stocks that do not trade on a U.S. national exchange may not be registered for sale in all U.S. states. NC=not covered.
Canada Research | Page 28 of 32 Newmarket Gold Inc. Newmarket Gold Inc.
Raymond James Ltd. | 2100 – 925 West Georgia Street | Vancouver BC Canada V6C 3L2
IMPORTANT INVESTOR DISCLOSURES Raymond James & Associates (RJA) is a FINRA member firm and is responsible for the preparation and distribution of research created in the United States. Raymond James & Associates is located at The Raymond James Financial Center, 880 Carillon Parkway, St. Petersburg, FL 33716, (727) 567-1000. Non-U.S. affiliates, which are not FINRA member firms, include the following entities which are responsible for the creation and distribution of research in their respective areas; In Canada, Raymond James Ltd., Suite 2100, 925 West Georgia Street, Vancouver, BC V6C 3L2, (604) 659-8200; In Latin America, Raymond James Latin America, Ruta 8, km 17, 500, 91600 Montevideo, Uruguay, 00598 2 518 2033; In Europe, Raymond James Euro Equities, SAS, 40, rue La Boetie, 75008, Paris, France, +33 1 45 61 64 90, and Raymond James Financial International Ltd., Broadwalk House, 5 Appold Street, London, England EC2A 2AG, +44 203 798 5600.
This document is not directed to, or intended for distribution to or use by, any person or entity that is a citizen or resident of or located in any locality, state, country, or other jurisdiction where such distribution, publication, availability or use would be contrary to law or regulation. The securities discussed in this document may not be eligible for sale in some jurisdictions. This research is not an offer to sell or the solicitation of an offer to buy any security in any jurisdiction where such an offer or solicitation would be illegal. It does not constitute a personal recommendation nor does it take into account the particular investment objectives, financial situations, or needs of individual clients. Information in this report should not be construed as advice designed to meet the individual objectives of any particular investor. Investors should consider this report as only a single factor in making their investment decision. Consultation with your investment advisor is recommended. Past performance is not a guide to future performance, future returns are not guaranteed, and a loss of original capital may occur.
The information provided is as of the date above and subject to change, and it should not be deemed a recommendation to buy or sell any security. Certain information has been obtained from third-party sources we consider reliable, but we do not guarantee that such information is accurate or complete. Persons within the Raymond James family of companies may have information that is not available to the contributors of the information contained in this publication. Raymond James, including affiliates and employees, may execute transactions in the securities listed in this publication that may not be consistent with the ratings appearing in this publication.
With respect to materials prepared by Raymond James Ltd. (“RJL”), all expressions of opinion reflect the judgment of the Research Department of RJL, or its affiliates, at this date and are subject to change. RJL may perform investment banking or other services for, or solicit investment banking business from, any company mentioned in this document.
All Raymond James Ltd. research reports are distributed electronically and are available to clients at the same time via the firm’s website (http://www.raymondjames.ca). Immediately upon being posted to the firm’s website, the research reports are then distributed electronically to clients via email upon request and to clients with access to Bloomberg (home page: RJLC), Capital IQ and Thomson Reuters. Selected research reports are also printed and mailed at the same time to clients upon request. Requests for Raymond James Ltd. research may be made by contacting the Raymond James Product Group during market hours at (604) 659‐8000.
In the event that this is a compendium report (i.e., covers 6 or more subject companies), Raymond James Ltd. may choose to provide specific disclosures for the subject companies by reference. To access these disclosures, clients should refer to: http://www.raymondjames.ca (click on Equity Capital Markets / Equity Research / Research Disclosures) or call toll‐free at 1‐800‐667‐2899.
ANALYST INFORMATION
Analyst Compensation: Equity research analysts and associates at Raymond James are compensated on a salary and bonus system. Several factors enter into the compensation determination for an analyst, including i) research quality and overall productivity, including success in rating stocks on an absolute basis and relative to the local exchange composite Index and/or a sector index, ii) recognition from institutional investors, iii) support effectiveness to the institutional and retail sales forces and traders, iv) commissions generated in stocks under coverage that are attributable to the analyst’s efforts, v) net revenues of the overall Equity Capital Markets Group, and vi) compensation levels for analysts at competing investment dealers.
Analyst Stock Holdings: Effective September 2002, Raymond James equity research analysts and associates or members of their households are forbidden from investing in securities of companies covered by them. Analysts and associates are permitted to hold long positions in the securities of companies they cover which were in place prior to September 2002 but are only permitted to sell those positions five days after the rating has been lowered to Underperform.
The views expressed in this report accurately reflect the personal views of the analyst(s) covering the subject securities. No part of said person's compensation was, is, or will be directly or indirectly related to the specific recommendations or views contained in this research report. In addition, said analyst has not received compensation from any subject company in the last 12 months.
RATINGS AND DEFINITIONS
Raymond James Ltd. (Canada) definitions: Strong Buy (SB1) The stock is expected to appreciate and produce a total return of at least 15% and outperform the S&P/TSX Composite Index over the next six months. Outperform (MO2) The stock is expected to appreciate and outperform the S&P/TSX Composite Index over the next twelve months. Market Perform (MP3) The stock is expected to perform

Newmarket Gold Inc. Canada Research | Page 29 of 32
Raymond James Ltd. | 2100 – 925 West Georgia Street | Vancouver BC Canada V6C 3L2
generally in line with the S&P/TSX Composite Index over the next twelve months and is potentially a source of funds for more highly rated securities. Underperform (MU4) The stock is expected to underperform the S&P/TSX Composite Index or its sector over the next six to twelve months and should be sold.
Raymond James & Associates (U.S.) definitions: Strong Buy (SB1) Expected to appreciate, produce a total return of at least 15%, and outperform the S&P 500 over the next six to 12 months. For higher yielding and more conservative equities, such as REITs and certain MLPs, a total return of at least 15% is expected to be realized over the next 12 months. Outperform (MO2) Expected to appreciate and outperform the S&P 500 over the next 12-18 months. For higher yielding and more conservative equities, such as REITs and certain MLPs, an Outperform rating is used for securities where we are comfortable with the relative safety of the dividend and expect a total return modestly exceeding the dividend yield over the next 12-18 months. Market Perform (MP3) Expected to perform generally in line with the S&P 500 over the next 12 months. Underperform (MU4) Expected to underperform the S&P 500 or its sector over the next six to 12 months and should be sold. Suspended (S) The rating and price target have been suspended temporarily. This action may be due to market events that made coverage impracticable, or to comply with applicable regulations or firm policies in certain circumstances, including when Raymond James may be providing investment banking services to the company. The previous rating and price target are no longer in effect for this security and should not be relied upon.
Raymond James Latin American rating definitions: Strong Buy (SB1) Expected to appreciate and produce a total return of at least 25.0% over the next twelve months. Outperform (MO2) Expected to appreciate and produce a total return of between 15.0% and 25.0% over the next twelve months. Market Perform (MP3) Expected to perform in line with the underlying country index. Underperform (MU4) Expected to underperform the underlying country index. Suspended (S) The rating and price target have been suspended temporarily. This action may be due to market events that made coverage impracticable, or to comply with applicable regulations or firm policies in certain circumstances, including when Raymond James may be providing investment banking services to the company. The previous rating and price target are no longer in effect for this security and should not be relied upon.
Raymond James Europe (Raymond Euro Equities SAS & Raymond James Financial International Limited) rating definitions: Strong Buy (1) Expected to appreciate, produce a total return of at least 15%, and outperform the Stoxx 600 over the next 6 to 12 months. Outperform (2) Expected to appreciate and outperform the Stoxx 600 over the next 12 months. Market Perform (3) Expected to perform generally in line with the Stoxx 600 over the next 12 months. Underperform (4) Expected to underperform the Stoxx 600 or its sector over the next 6 to 12 months. Suspended (S) The rating and target price have been suspended temporarily. This action may be due to market events that made coverage impracticable, or to comply with applicable regulations or firm policies in certain circumstances, including when Raymond James may be providing investment banking services to the company. The previous rating and target price are no longer in effect for this security and should not be relied upon.
In transacting in any security, investors should be aware that other securities in the Raymond James research coverage universe might carry a higher or lower rating. Investors should feel free to contact their Financial Advisor to discuss the merits of other available investments.
Suitability Categories (SR): Total Return (TR) Lower risk equities possessing dividend yields above that of the S&P 500 and greater stability of principal. Growth (G) Low to average risk equities with sound financials, more consistent earnings growth, at least a small dividend, and the potential for long-term price appreciation. Aggressive Growth (AG) Medium or higher risk equities of companies in fast growing and competitive industries, with less predictable earnings and acceptable, but possibly more leveraged balance sheets. High Risk (HR) Companies with less predictable earnings (or losses), rapidly changing market dynamics, financial and competitive issues, higher price volatility (beta), and risk of principal. Venture Risk (VR) Companies with a short or unprofitable operating history, limited or less predictable revenues, very high risk associated with success, and a substantial risk of principal.
RATING DISTRIBUTIONS
Coverage Universe Rating Distribution* Investment Banking Distribution
RJL RJA RJ LatAm RJEE RJL RJA RJ LatAm RJEE
Strong Buy and Outperform (Buy) 64% 56% 64% 40% 45% 22% 0% 0%
Market Perform (Hold) 35% 38% 36% 34% 23% 9% 0% 0%
Underperform (Sell) 2% 5% 0% 25% 33% 6% 0% 0%
* Columns may not add to 100% due to rounding.
RAYMOND JAMES RELATIONSHIP DISCLOSURES
Raymond James Ltd. or its affiliates expects to receive or intends to seek compensation for investment banking services from all companies under research coverage within the next three months.
Company Name Disclosure
Newmarket Gold Inc. Raymond James Ltd - the analyst and/or associate has viewed the material operations of Newmarket Gold Inc.
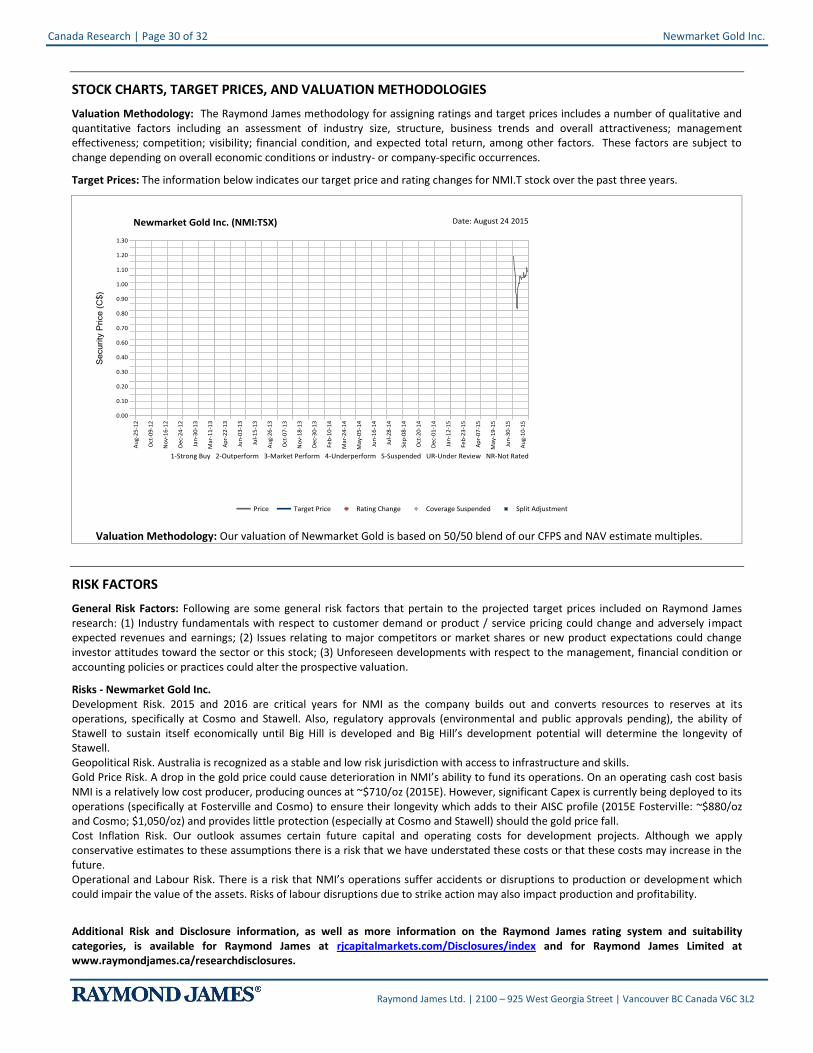
Canada Research | Page 30 of 32 Newmarket Gold Inc. Newmarket Gold Inc.
Raymond James Ltd. | 2100 – 925 West Georgia Street | Vancouver BC Canada V6C 3L2
STOCK CHARTS, TARGET PRICES, AND VALUATION METHODOLOGIES
Valuation Methodology: The Raymond James methodology for assigning ratings and target prices includes a number of qualitative and quantitative factors including an assessment of industry size, structure, business trends and overall attractiveness; management effectiveness; competition; visibility; financial condition, and expected total return, among other factors. These factors are subject to change depending on overall economic conditions or industry- or company-specific occurrences.
Target Prices: The information below indicates our target price and rating changes for NMI.T stock over the past three years.
Valuation Methodology: Our valuation of Newmarket Gold is based on 50/50 blend of our CFPS and NAV estimate multiples.
RISK FACTORS
General Risk Factors: Following are some general risk factors that pertain to the projected target prices included on Raymond James research: (1) Industry fundamentals with respect to customer demand or product / service pricing could change and adversely impact expected revenues and earnings; (2) Issues relating to major competitors or market shares or new product expectations could change investor attitudes toward the sector or this stock; (3) Unforeseen developments with respect to the management, financial condition or accounting policies or practices could alter the prospective valuation.
Risks - Newmarket Gold Inc. Development Risk. 2015 and 2016 are critical years for NMI as the company builds out and converts resources to reserves at its operations, specifically at Cosmo and Stawell. Also, regulatory approvals (environmental and public approvals pending), the ability of Stawell to sustain itself economically until Big Hill is developed and Big Hill’s development potential will determine the longevity of Stawell. Geopolitical Risk. Australia is recognized as a stable and low risk jurisdiction with access to infrastructure and skills. Gold Price Risk. A drop in the gold price could cause deterioration in NMI’s ability to fund its operations. On an operating cash cost basis NMI is a relatively low cost producer, producing ounces at ~$710/oz (2015E). However, significant Capex is currently being deployed to its operations (specifically at Fosterville and Cosmo) to ensure their longevity which adds to their AISC profile (2015E Fosterville: ~$880/oz and Cosmo; $1,050/oz) and provides little protection (especially at Cosmo and Stawell) should the gold price fall. Cost Inflation Risk. Our outlook assumes certain future capital and operating costs for development projects. Although we apply conservative estimates to these assumptions there is a risk that we have understated these costs or that these costs may increase in the future. Operational and Labour Risk. There is a risk that NMI’s operations suffer accidents or disruptions to production or development which could impair the value of the assets. Risks of labour disruptions due to strike action may also impact production and profitability.
Additional Risk and Disclosure information, as well as more information on the Raymond James rating system and suitability categories, is available for Raymond James at rjcapitalmarkets.com/Disclosures/index and for Raymond James Limited at www.raymondjames.ca/researchdisclosures.

Newmarket Gold Inc. Canada Research | Page 31 of 32
Raymond James Ltd. | 2100 – 925 West Georgia Street | Vancouver BC Canada V6C 3L2
INTERNATIONAL DISCLOSURES
FOR CLIENTS IN THE UNITED STATES:
Any foreign securities discussed in this report are generally not eligible for sale in the U.S. unless they are listed on a U.S. exchange. This report is being provided to you for informational purposes only and does not represent a solicitation for the purchase or sale of a security in any state where such a solicitation would be illegal. Investing in securities of issuers organized outside of the U.S., including ADRs, may entail certain risks. The securities of non-U.S. issuers may not be registered with, nor be subject to the reporting requirements of, the U.S. Securities and Exchange Commission. There may be limited information available on such securities. Investors who have received this report may be prohibited in certain states or other jurisdictions from purchasing the securities mentioned in this report. Please ask your Financial Advisor for additional details and to determine if a particular security is eligible for purchase in your state.
Raymond James Ltd. is not a U.S. broker‐dealer and therefore is not governed by U.S. laws, rules or regulations applicable to U.S. broker‐dealers. Consequently, the persons responsible for the content of this publication are not licensed in the U.S. as research analysts in accordance with applicable rules promulgated by the U.S. Self Regulatory Organizations.
Any U.S. Institutional Investor wishing to effect trades in any security should contact Raymond James (USA) Ltd., a U.S. broker‐dealer affiliate of Raymond James Ltd.
FOR CLIENTS IN THE UNITED KINGDOM:
For clients of Raymond James & Associates (London Branch) and Raymond James Financial International Limited (RJFI): This document and any investment to which this document relates is intended for the sole use of the persons to whom it is addressed, being persons who are Eligible Counterparties or Professional Clients as described in the FCA rules or persons described in Articles 19(5) (Investment professionals) or 49(2) (High net worth companies, unincorporated associations etc) of the Financial Services and Markets Act 2000 (Financial Promotion) Order 2005 (as amended) or any other person to whom this promotion may lawfully be directed. It is not intended to be distributed or passed on, directly or indirectly, to any other class of persons and may not be relied upon by such persons and is therefore not intended for private individuals or those who would be classified as Retail Clients.
For clients of Raymond James Investment Services, Ltd.: This report is for the use of professional investment advisers and managers and is not intended for use by clients.
For purposes of the Financial Conduct Authority requirements, this research report is classified as independent with respect to conflict of interest management. RJA, RJFI, and Raymond James Investment Services, Ltd. are authorised and regulated by the Financial Conduct Authority in the United Kingdom.
FOR CLIENTS IN FRANCE:
This document and any investment to which this document relates is intended for the sole use of the persons to whom it is addressed, being persons who are Eligible Counterparties or Professional Clients as described in “Code Monétaire et Financier” and Règlement Général de l’Autorité des Marchés Financiers. It is not intended to be distributed or passed on, directly or indirectly, to any other class of persons and may not be relied upon by such persons and is therefore not intended for private individuals or those who would be classified as Retail Clients.
For clients of Raymond James Euro Equities: Raymond James Euro Equities is authorised and regulated by the Autorité de Contrôle Prudentiel et de Résolution and the Autorité des Marchés Financiers.
For institutional clients in the European Economic Area (EEA) outside of the United Kingdom: This document (and any attachments or exhibits hereto) is intended only for EEA institutional clients or others to whom it may lawfully be submitted.
Raymond James Euro Equities is a French Investment Services Provider authorized by the Autorité de contrôle prudentiel et de résolution and regulated by the Autorité de contrôle prudentiel et de résolution and the Autorité des Marchés Financiers. For non-European exchanges, Raymond James Euro Equities operates under the name Raymond James International.
Proprietary Rights Notice: By accepting a copy of this report, you acknowledge and agree as follows:
This report is provided to clients of Raymond James only for your personal, noncommercial use. Except as expressly authorized by Raymond James, you may not copy, reproduce, transmit, sell, display, distribute, publish, broadcast, circulate, modify, disseminate or commercially exploit the information contained in this report, in printed, electronic or any other form, in any manner, without the prior express written consent of Raymond James. You also agree not to use the information provided in this report for any unlawful purpose.
This report and its contents are the property of Raymond James and are protected by applicable copyright, trade secret or other intellectual property laws (of the United States and other countries). United States law, 17 U.S.C. Sec.501 et seq, provides for civil and criminal penalties for copyright infringement. No copyright claimed in incorporated U.S. government works.
Additional information is available upon request. This document may not be reprinted without permission.
RJL is a member of the Canadian Investor Protection Fund. ©2015 Raymond James Ltd.

Canada Research | Page 32 of 32 Newmarket Gold Inc. Newmarket Gold Inc.
Raymond James Ltd. | 2100 – 925 West Georgia Street | Vancouver BC Canada V6C 3L2
RAYMOND JAMES LTD. CANADIAN INSTITUTIONAL EQUITY TEAM WWW.RAYMONDJAMES.CA EQUITY RESEARCH HEAD OF EQUITY RESEARCH
DARYL SWETLISHOFF, CFA 604.659.8246
CONSUMER
CONSUMER & RETAIL KENRIC TYGHE, MBA 416.777.7188 KRISZTINA KATAI (ASSOCIATE) 416.777.7060
ENERGY
OIL & GAS ENERGY SERVICES, HEAD OF ENERGY RESEARCH ANDREW BRADFORD, CFA 403.509.0503 TIM MONACHELLO (ASSOCIATE) 403.509.0562 MICHAEL SHAW (JR ASSOCIATE) 403.509.0534
OIL & GAS PRODUCERS KURT MOLNAR 403.221.0414 BRADEN PURKIS (SR ASSOCIATE) 403.509.0518 GORDON STEPPAN, CFA (SR ASSOCIATE) 403.221.0411
SR. OIL & GAS PRODUCERS | ENERGY INFRASTRUCTURE CHRIS COX, CFA 403.509.0523 MICHAEL BARTH (ASSOCIATE) 403.509.0511
INDUSTRIAL & TRANSPORTATION
INDUSTRIAL | TRANSPORTATION, HEAD OF INDUSTRIAL RESEARCH BEN CHERNIAVSKY 604.659.8244 THEONI PILARINOS, CFA 604.659.8234 EDWARD GUDEWILL (ASSOCIATE) 604.659.8280
INFRASTRUCTURE & CONSTRUCTION FREDERIC BASTIEN, CFA 604.659.8232 SAMIR GHAFIR (ASSOCIATE) 604.659.8470
TRANSPORTATION | AGRIBUSINESS & FOOD PRODUCTS STEVE HANSEN, CMA, CFA 604.659.8208 DANIEL CHEW (ASSOCIATE) 604.659.8238
MINING
BASE & PRECIOUS METALS ALEX TERENTIEW, MBA, P.GEO 416.777.4912 JEAN-CHRISTOPHE PARISIEN-LA SALLE (ASSOCIATE) 416.777.7144
PRECIOUS METALS PHIL RUSSO 416.777.7084
PRECIOUS METALS CHRIS THOMPSON, M.SC. (ENG), P.GEO 604.659.8439 BRIAN MARTIN, CFA (ASSOCIATE) 604.654.1236
URANIUM | JR EXPLORATION & DEVELOPMENT DAVID SADOWSKI 604.659.8255 MILTON-ANDRES BERNAL (ASSOCIATE) 604.659.8028
FINANCIAL SERVICES
DIVERSIFIED FINANCIALS MICHAEL OVERVELDE, CFA, CPA, CA 416.777.4943 BRENNA PHELAN, CFA, CPA, CA (ASSOCIATE) 416.777.7042
FOREST PRODUCTS
FOREST PRODUCTS DARYL SWETLISHOFF, CFA 604.659.8246 DAVID QUEZADA, CFA (ASSOCIATE ANALYST) 604.659.8257
REAL ESTATE
REAL ESTATE & REITS KEN AVALOS, MBA 727.567.1756 JOHANN RODRIGUES (ASSOCIATE ANALYST) 416.777.7189
TECHNOLOGY & COMMUNICATIONS
TECHNOLOGY, ALTERNATIVE ENERGY & CLEAN TECH STEVEN LI, CFA 416.777.4918 JONATHAN LO (ASSOCIATE) 416.777.6414
EQUITY RESEARCH PUBLISHING SENIOR SUPERVISORY ANALYST
HEATHER HERRON 403.509.0509 HEAD OF PUBLISHING | SUPERVISORY ANALYST
CYNTHIA LUI 604.659.8210
TYLER BOS (SUPERVISORY ANALYST | EDITOR) 416.777.4948 INDER GILL (RESEARCH EDITOR) 604.659.8202 KATE MAJOR (RESEARCH PRINCIPAL | EDITOR) 416.777.7173 CHRISTINE MARTE (RESEARCH EDITOR) 604.659.8200 ASHLEY RAMSAY (SUPERVISORY ANALYST |EDITOR) 604.659.8226
INSTITUTIONAL EQUITY SALES HEAD OF SALES
MIKE WESTCOTT 416.777.4935 GREG JACKSON (ECM, BUSINESS MANAGER) 416.777.7172 MICHELLE MARGUET ( ECM, INSTITUTIONAL MARKETING) 416.777.4951
TORONTO (CAN 1.888.601.6105 | USA 1.800.290.4847)
LAURA ARRELL (U.S. EQUITIES) 416.777.4920 SEAN BOYLE 416.777.4927 JEFF CARRUTHERS, CFA 416.777.4929 RICHARD EAKINS 416.777.4926 JONATHAN GREER 416.777.4930 DAVE MACLENNAN 416.777.4934 ROBERT MILLS, CFA 416.777.4945 BRADY PIMLOTT (ASSOCIATE) 416.777.4993 NICOLE SVEC-GRIFFIS, CFA (U.S. EQUITIES) 416.777.4942 NEIL WEBER 416.777.4931 ORNELLA BURNS (ASSISTANT) 416.777.4928 SATBIR CHATRATH (ASSISTANT) 416.777.4915
VANCOUVER (1.800.667.2899)
SCOT ATKINSON, CFA 604.659.8225 NICK POCRNIC 604.659.8230 TERRI MCEWAN (ASSISTANT) 604.659.8228
MONTREAL (514.350.4450 | 1.866.350.4455)
JOHN HART 514.350.4462 DAVID MAISLIN, CFA 514.350.4460 TANYA HATCHER (ASSISTANT) 514.350.4458
LONDON
ADAM WOOD 0.207.426.5612
INSTITUTIONAL EQUITY TRADING
CO-HEAD OF TRADING BOB MCDONALD, CFA 604.659.8222 ANDREW FOOTE, CFA 416.777.4924
TORONTO (CANADA 1.888.601.6105 | USA 1.800.290.4847) PAM BANKS 416.777.4923 OLIVER HERBST 416.777.4947 ANDY HERRMANN 416.777.4937 ERIC MUNRO, CFA 416.777.4983 JAMES SHIELDS 416.777.4941 BOB STANDING 416.777.4921 PETER MASON (ASSISTANT) 416.777.7195
VANCOUVER (1.800.667.2899) NAV CHEEMA 604.659.8224 FRASER JEFFERSON 604.659.8218 DEREK ORAM 604.659.8223
MONTREAL (514.350.4450 | 1.866.350.4455) JOE CLEMENT 514.350.4470 PATRICK SANCHE 514.350.4465
INSTITUTIONAL EQUITY OFFICES
Calgary Suite 4250 525 8th Avenue SW Calgary, AB T2P 1G1 403.509.0500
Montreal Suite 3000 1800 McGill College Montreal, PQ H3A 3J6 514.350.4450 Toll Free: 1.866.350.4455
Vancouver Suite 2100 925 West Georgia Street Vancouver, BC V6C 3L2 604.659.8000 Toll Free: 1.800.667.2899
Toronto Suite 5400, Scotia Plaza 40 King Street West Toronto, ON M5H 3Y2 416.777.4900 Toll Free Canada: .888.601.6105 Toll Free USA: 1.800.290.4847
International Headquarters The Raymond James Financial Center 880 Carillon Parkway St.Petersburg, FL USA 33716 727.567.1000