Embed Size (px)
Citation preview
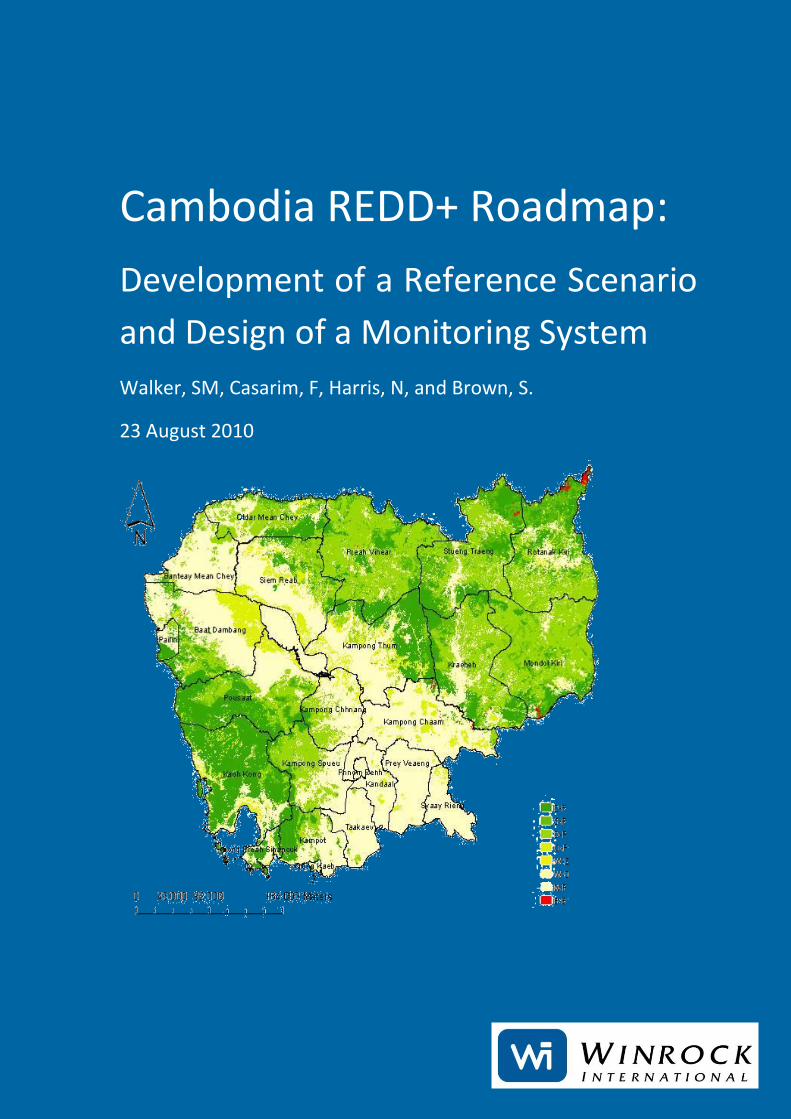
Cambodia REDD+ Roadmap:
Development of a Reference Scenario
and Design of a Monitoring System
Walker, SM, Casarim, F, Harris, N, and Brown, S.
23 August 2010

Winrock International 2009
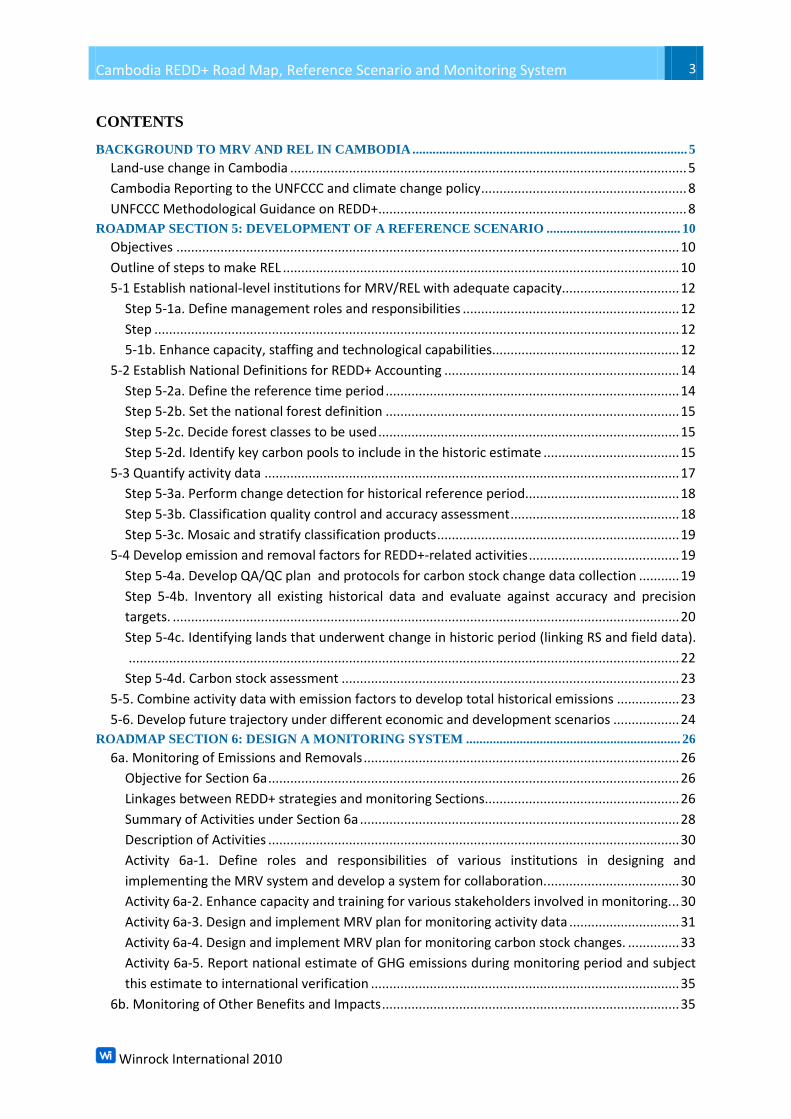
Cambodia REDD+ Road Map, Reference Scenario and Monitoring System 3
Winrock International 2010
CONTENTS
BACKGROUND TO MRV AND REL IN CAMBODIA .................................................................................. 5
Land-use change in Cambodia ............................................................................................................ 5
Cambodia Reporting to the UNFCCC and climate change policy ........................................................ 8
UNFCCC Methodological Guidance on REDD+ .................................................................................... 8
ROADMAP SECTION 5: DEVELOPMENT OF A REFERENCE SCENARIO ........................................ 10
Objectives ......................................................................................................................................... 10
Outline of steps to make REL ............................................................................................................ 10
5-1 Establish national-level institutions for MRV/REL with adequate capacity................................ 12
Step 5-1a. Define management roles and responsibilities ........................................................... 12
Step ............................................................................................................................................... 12
5-1b. Enhance capacity, staffing and technological capabilities................................................... 12
5-2 Establish National Definitions for REDD+ Accounting ................................................................ 14
Step 5-2a. Define the reference time period ................................................................................ 14
Step 5-2b. Set the national forest definition ................................................................................ 15
Step 5-2c. Decide forest classes to be used .................................................................................. 15
Step 5-2d. Identify key carbon pools to include in the historic estimate ..................................... 15
5-3 Quantify activity data ................................................................................................................. 17
Step 5-3a. Perform change detection for historical reference period.......................................... 18
Step 5-3b. Classification quality control and accuracy assessment .............................................. 18
Step 5-3c. Mosaic and stratify classification products .................................................................. 19
5-4 Develop emission and removal factors for REDD+-related activities ......................................... 19
Step 5-4a. Develop QA/QC plan and protocols for carbon stock change data collection ........... 19
Step 5-4b. Inventory all existing historical data and evaluate against accuracy and precision
targets. .......................................................................................................................................... 20
Step 5-4c. Identifying lands that underwent change in historic period (linking RS and field data).
...................................................................................................................................................... 22
Step 5-4d. Carbon stock assessment ............................................................................................ 23
5-5. Combine activity data with emission factors to develop total historical emissions ................. 23
5-6. Develop future trajectory under different economic and development scenarios .................. 24
ROADMAP SECTION 6: DESIGN A MONITORING SYSTEM ................................................................ 26
6a. Monitoring of Emissions and Removals ...................................................................................... 26
Objective for Section 6a ................................................................................................................ 26
Linkages between REDD+ strategies and monitoring Sections..................................................... 26
Summary of Activities under Section 6a ....................................................................................... 28
Description of Activities ................................................................................................................ 30
Activity 6a-1. Define roles and responsibilities of various institutions in designing and
implementing the MRV system and develop a system for collaboration. .................................... 30
Activity 6a-2. Enhance capacity and training for various stakeholders involved in monitoring. .. 30
Activity 6a-3. Design and implement MRV plan for monitoring activity data .............................. 31
Activity 6a-4. Design and implement MRV plan for monitoring carbon stock changes. .............. 33
Activity 6a-5. Report national estimate of GHG emissions during monitoring period and subject
this estimate to international verification .................................................................................... 35
6b. Monitoring of Other Benefits and Impacts ................................................................................. 35
Cambodia REDD+ Road Map, Reference Scenario and Monitoring System 4
Winrock International 2010
Background ................................................................................................................................... 35
Activity 6b-1. Environmental Monitoring ..................................................................................... 35
Activity 6b-2. Socio-economic Monitoring ................................................................................... 36
Activity 6b-3. Governance Monitoring .......................................................................................... 36
ANNEXES ........................................................................................................................................................... 37
Annex 1 Existing remote sensing data held by Cambodia ................................................................ 37
Annex 2 Existing GIS Data in Cambodia ............................................................................................ 39
Cambodia REDD+ Road Map, Reference Scenario and Monitoring System 5
Winrock International 2010
Background to MRV and REL in Cambodia
Land-use change in Cambodia
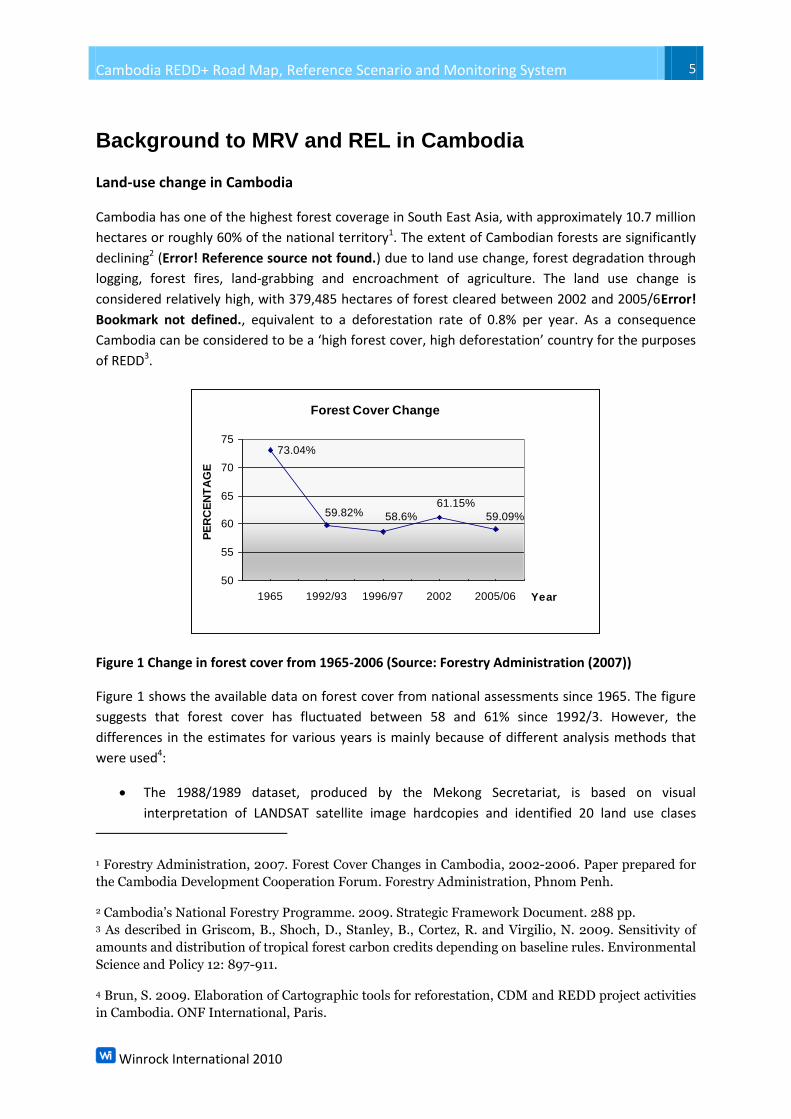
Cambodia has one of the highest forest coverage in South East Asia, with approximately 10.7 million
hectares or roughly 60% of the national territory1. The extent of Cambodian forests are significantly
declining2 (Error! Reference source not found.) due to land use change, forest degradation through
logging, forest fires, land-grabbing and encroachment of agriculture. The land use change is
considered relatively high, with 379,485 hectares of forest cleared between 2002 and 2005/6Error!
Bookmark not defined., equivalent to a deforestation rate of 0.8% per year. As a consequence
Cambodia can be considered to be a ‘high forest cover, high deforestation’ country for the purposes
of REDD3.
Forest Cover Change
73.04%
59.09%
61.15%
58.6%59.82%
50
55
60
65
70
75
1965 1992/93 1996/97 2002 2005/06 Year
PE
RC
EN
TA
GE
Figure 1 Change in forest cover from 1965-2006 (Source: Forestry Administration (2007))
Figure 1 shows the available data on forest cover from national assessments since 1965. The figure
suggests that forest cover has fluctuated between 58 and 61% since 1992/3. However, the
differences in the estimates for various years is mainly because of different analysis methods that
were used4:
The 1988/1989 dataset, produced by the Mekong Secretariat, is based on visual
interpretation of LANDSAT satellite image hardcopies and identified 20 land use clases
1 Forestry Administration, 2007. Forest Cover Changes in Cambodia, 2002-2006. Paper prepared for
the Cambodia Development Cooperation Forum. Forestry Administration, Phnom Penh.
2 Cambodia’s National Forestry Programme. 2009. Strategic Framework Document. 288 pp. 3 As described in Griscom, B., Shoch, D., Stanley, B., Cortez, R. and Virgilio, N. 2009. Sensitivity of
amounts and distribution of tropical forest carbon credits depending on baseline rules. Environmental
Science and Policy 12: 897-911.
4 Brun, S. 2009. Elaboration of Cartographic tools for reforestation, CDM and REDD project activities
in Cambodia. ONF International, Paris.
Cambodia REDD+ Road Map, Reference Scenario and Monitoring System 6
Winrock International 2010
(where 9 classes depict various forest cover) at a scale of 1:250 000, and a minimum
mapping unit of 1 km2 (4 x 4 mm at map scale).
The 1992/3 and 1996/7 datasets were produced by the Forest Cover Monitoring Project, a
Mekong River Commission initiative executed by the GTZ. The two land cover datasets are
based on the visual interpretation of 1992/1993 and 1996/1997 LANDSAT satellite image
hardcopies, at a scale of 1:250 000 with a minimum mapping unit of 1 km2. The Land use
cover analysis for 1996/1997 results in a classification in 30 land cover classes (with 15
‘’forest’’ classes).
The 2002 and 2005/6 analyses were produced by the Forestry Administration’s GIS/RS Unit
with the support of the Danida. The results of this analysis have been recently published in
English and Khmer5. These country-wide analyses have been based on manual on-screen
visual interpretation of Landsat ETM+ imagery. The digitalization process has been
conducted with false colour combinations of bands 2, 3, 4. These two latest land cover
datasets are the most accurate: a) the minimum mapping unit of 0.2 km2 (20 ha), and b) the
scale of 1:50 000, allowing a much thinner depiction of the different classes. However, the
land cover nomenclature used for the year 2002 and 2005/06 differs from the one related to
1988/89 and 1996/97 databases. For 2006, the nomenclature adopted in 2002, 4 forest
classes on a total of 8 land cover classes, has been slightly modified, as recommended by the
GRAS A/S accuracy assessment report. Due to their low accuracy, the smaller classes have
been merged with others increasing the accuracy from 71% to 74%. In the 2006
nomenclature, finally 5 land cover classes have been retained, the class ‘bamboo’ has been
included in the ‘other forest’ class, while the classes ‘wood & shrubland dry’ and ‘wood &
shrubland evergreen’ have been merged within the ‘non-forest’ class.
As a consequence of these differences, whilst the 1992/3 and 1996/7 analyses are comparable, and
the 2002 and 2005/6 analyses are also comparable, the 2002 and 2005/6 results cannot be
compared to the earlier results from the 1990s.
The forest cover in Cambodia dropped from 11,104,300 ha in 2002 to 10,730,800 ha in 20066. As
much as 380,000 ha of forests have been lost in Cambodia between 2002 and 2006, which accounts
for a total deforestation of more than 2.0% across the four years, or as much 0.9% forest loss per
year (i.e. deforestation rate) (Error! Reference source not found.).
5 Forestry Administration. 2008. Cambodian Forest Cover; Forest cover map change 2002‐2006.
6 Forestry Administration. 2007. Final report: Forest cover assessment for year 2005/2006. 14 pp.
Cambodia REDD+ Road Map, Reference Scenario and Monitoring System 7
Winrock International 2010
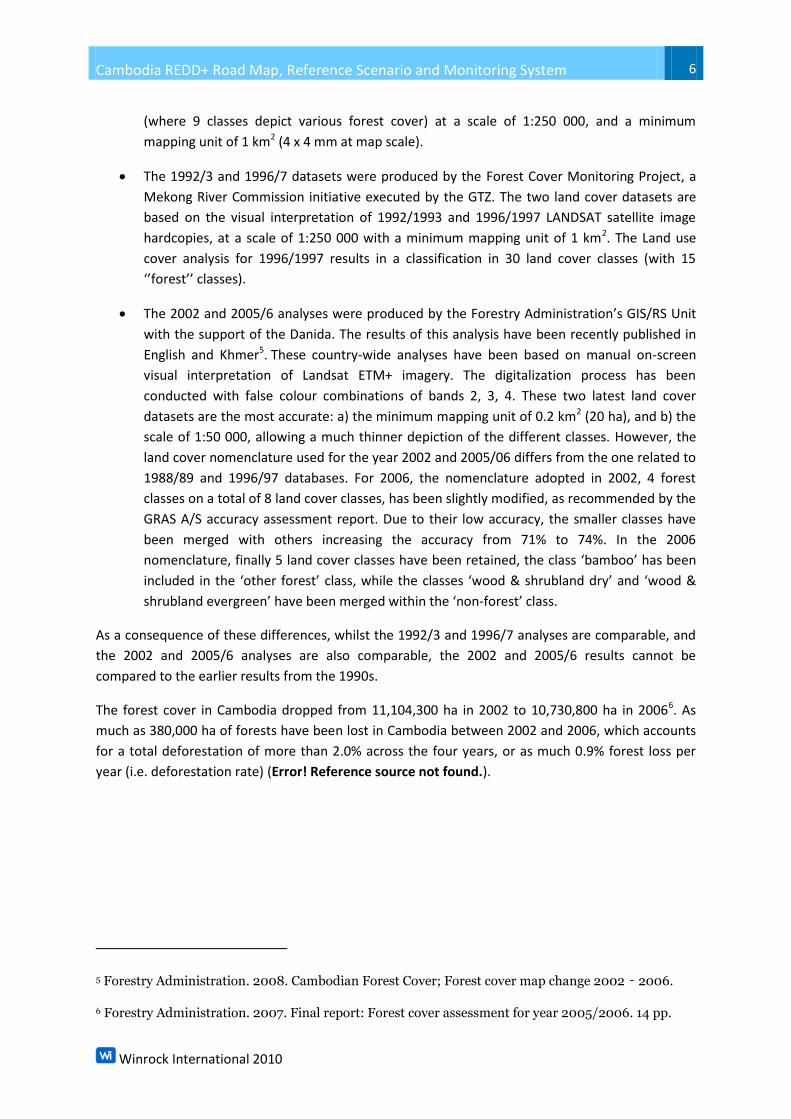
Table 1: Forest cover area and change in forest cover from 2002 to 2006
FOREST TYPES
2002 2006 Change 2002-06
AREA AREA AREA
Ha % Ha % Ha %
Evergreen Forest 3,720,493 20.49 3,668,902 20.20 -51,591 -0.28
Semi-evergreen forest 1,455,183 8.01 1,362,638 7.50 -92,545 -0.51
Deciduous forest 4,833,887 26.62 4,692,098 25.84 -141,789 -0.78
Others forest 1,094,728 6.03 1,007,143 5.55 -87,585 -0.48
TOTAL 11 104 291 61.15 10 730 781 59.09 -373 510 -2.06
Source: Adapted from the Forestry Administration (2007)
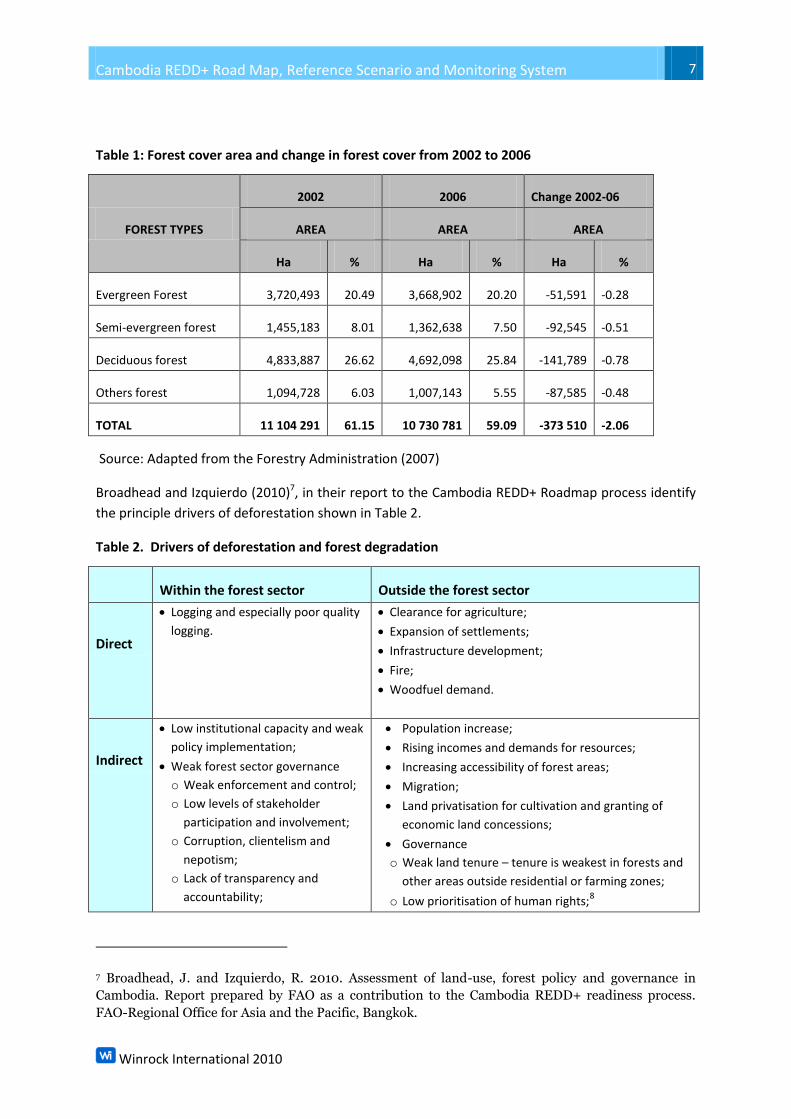
Broadhead and Izquierdo (2010)7, in their report to the Cambodia REDD+ Roadmap process identify
the principle drivers of deforestation shown in Table 2.
Table 2. Drivers of deforestation and forest degradation
Within the forest sector Outside the forest sector
Direct
Logging and especially poor quality
logging.
Clearance for agriculture;
Expansion of settlements;
Infrastructure development;
Fire;
Woodfuel demand.
Indirect
Low institutional capacity and weak
policy implementation;
Weak forest sector governance
o Weak enforcement and control;
o Low levels of stakeholder
participation and involvement;
o Corruption, clientelism and
nepotism;
o Lack of transparency and
accountability;
Population increase;
Rising incomes and demands for resources;
Increasing accessibility of forest areas;
Migration;
Land privatisation for cultivation and granting of
economic land concessions;
Governance
o Weak land tenure – tenure is weakest in forests and
other areas outside residential or farming zones;
o Low prioritisation of human rights;8
7 Broadhead, J. and Izquierdo, R. 2010. Assessment of land-use, forest policy and governance in
Cambodia. Report prepared by FAO as a contribution to the Cambodia REDD+ readiness process.
FAO-Regional Office for Asia and the Pacific, Bangkok.
Cambodia REDD+ Road Map, Reference Scenario and Monitoring System 8
Winrock International 2010
Lack of incentives promoting
sustainable management of
forests.
o Overlapping/unclear jurisdictions;
o Chronic incidence of high-level interministerial and
interagency disputes;
Social norms (claiming land through utilisation).
Cambodia Reporting to the UNFCCC and climate change policy
The first National Communication from Cambodia to the UNFCCC occurred in 2002 (for year 1994)
and the National Adaptation Programme of Action to Climate Change (NAPA) was approved by the
Royal Government in 2006. The second national communication to the UNFCCC (for year 2000) is
currently being prepared using a combination of new existing country specific data for Cambodian
forests. Implementation of the work proposed in this document will be able to feed into producing
an improved national communication in the future.
In 2003 the Ministry of Environment established an Office of Climate Change and in 2006 the Royal
Government set up the National Climate Change Committee (NCCC), with representation of 19
Government ministries and agencies. The new Department of Climate Change in the Ministry of
Environment, which was upgraded from the old office in 2009, is the Secretariat of the NCCC. The
NCCC and the Department of Climate Change have the responsibility to coordinate development of
climate change policies, including the planned Cambodia Climate Change Strategy and Action Plan
(CCCSAP), and for reporting to the UNFCCC.
UNFCCC Methodological Guidance on REDD+
In order to participate in a national REDD+ system, countries will need to establish national
monitoring systems, which include reporting and verification of emissions reductions. This is
sometimes referred to MRV: monitoring, reporting and verification. Countries will also need to
develop a national-level baseline against which results will be monitored, often referred to as the
Reference Scenario or the Reference Level (RL), or the Reference Emissions Level (REL) if only
applied to emissions from deforestation and forest degradation. The Reference Level could
potentially include both emissions (from deforestation for example) and removals of greenhouse
gases (from replanting trees for example).
According to Decision 4 of the UNFCCC Conference of the Parties at COP-159, all countries should use
the IPCC framework (2003 and 200610) to develop their monitoring systems for REDD+ and to
estimate their historic emissions for the activities under REDD+. The IPCC framework is outlined in
8 Centre for Justice and Reconciliation 2010. CJR Law Review Issue 01 A, March 2010.
http://www.cjr-cambodia.org/pdf/CJR_LawReview_Mar2010_English.pdf
9 COP15 decision (4/CP.15) recommended that the most recent IPCC guidance and guidelines should
be used as a basis for estimating the anthropogenic forest-related greenhouse gas emissions by
sources and removals by sinks (Article 1(c)).
10 Refers to IPCC 2003 Good Practice Guidance for Land Use, Land Use Change and Forestry and the
IPCC 2006 GHG Inventory guidelines for the agriculture, forestry and other land use (AFOLU) sector.
Cambodia REDD+ Road Map, Reference Scenario and Monitoring System 9
Winrock International 2010
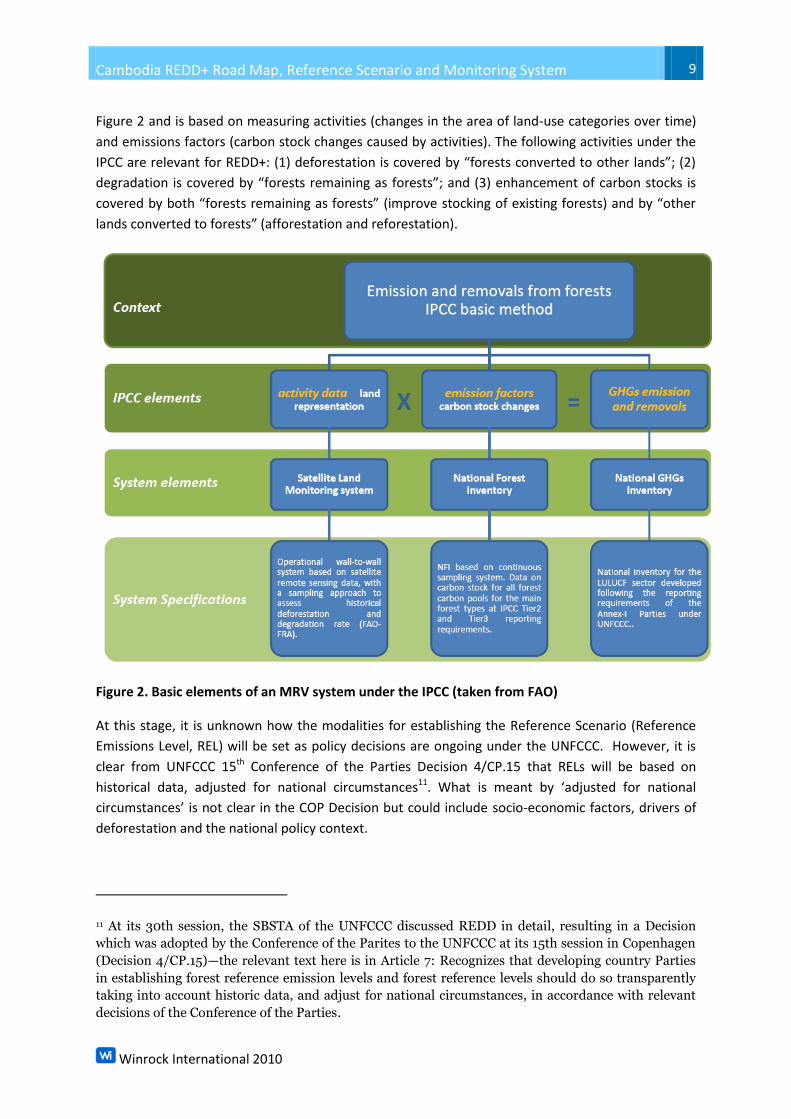
Figure 2 and is based on measuring activities (changes in the area of land-use categories over time)
and emissions factors (carbon stock changes caused by activities). The following activities under the
IPCC are relevant for REDD+: (1) deforestation is covered by “forests converted to other lands”; (2)
degradation is covered by “forests remaining as forests”; and (3) enhancement of carbon stocks is
covered by both “forests remaining as forests” (improve stocking of existing forests) and by “other
lands converted to forests” (afforestation and reforestation).
Figure 2. Basic elements of an MRV system under the IPCC (taken from FAO)
At this stage, it is unknown how the modalities for establishing the Reference Scenario (Reference
Emissions Level, REL) will be set as policy decisions are ongoing under the UNFCCC. However, it is
clear from UNFCCC 15th Conference of the Parties Decision 4/CP.15 that RELs will be based on
historical data, adjusted for national circumstances11. What is meant by ‘adjusted for national
circumstances’ is not clear in the COP Decision but could include socio-economic factors, drivers of
deforestation and the national policy context.
11 At its 30th session, the SBSTA of the UNFCCC discussed REDD in detail, resulting in a Decision
which was adopted by the Conference of the Parites to the UNFCCC at its 15th session in Copenhagen
(Decision 4/CP.15)—the relevant text here is in Article 7: Recognizes that developing country Parties
in establishing forest reference emission levels and forest reference levels should do so transparently
taking into account historic data, and adjust for national circumstances, in accordance with relevant
decisions of the Conference of the Parties.

Cambodia REDD+ Road Map, Reference Scenario and Monitoring System 10
Winrock International 2010
Roadmap Section 5: Development of a Reference Scenario
Objectives
The overall objective of this section is to develop a scenario for the reference level (REL) that
projects emissions and removals of CO2 into the future in the absence of REDD+ incentives. The REL,
while based on historical information, will also reflect national circumstances and relevant policies as
well as meet international standards and requirements. The REL will be developed in a way so that
emissions and removals that are monitored in the future can be compared directly to the emissions
and removals in the reference scenario—in other words there will be consistency between the
approaches used for the REL and the MRV (Monitoring, Reporting and Verification) system.
Accomplishment of this objective involves two sub-goals:
Quantification of historic emissions/removals from deforestation, degradation and
enhancement of carbon stocks for the proposed period between 2000 to 2010 at a national
scale, using the IPCC framework, and spatially represented to reflect differences in sub
national activities in use and cover of the land; and
Development of future trajectories of emissions/removals over different time periods (e.g. 5
yr and 10 yr periods) and under different economic and development scenarios. This will
take into consideration such factors as Cambodia’s Rectangular Strategy for Growth,
Employment, Equity and Efficiency – Phase II, Cambodia’s National Strategic Development
Plan Update 2009-2013, the Cambodia Millennium Development Goals12, and the Cambodia
REDD+ Strategies. Other current country indicators will also be taken into consideration,
such as: GDP, population growth, agricultural expansion, industry growth, sectoral
development plans, specific investment programs, and/or adjustment coefficients otherwise
derived from such factors and data.
The National REDD+ Taskforce will need to track the international negotiations process during the
implementation stage of the Cambodia REDD+ Roadmap so as to ensure work being done on this
topic will meet the policy requirements. However, any process agreed to for setting a reference
scenario will be based on the historic emissions as a starting point.
Outline of steps to make REL
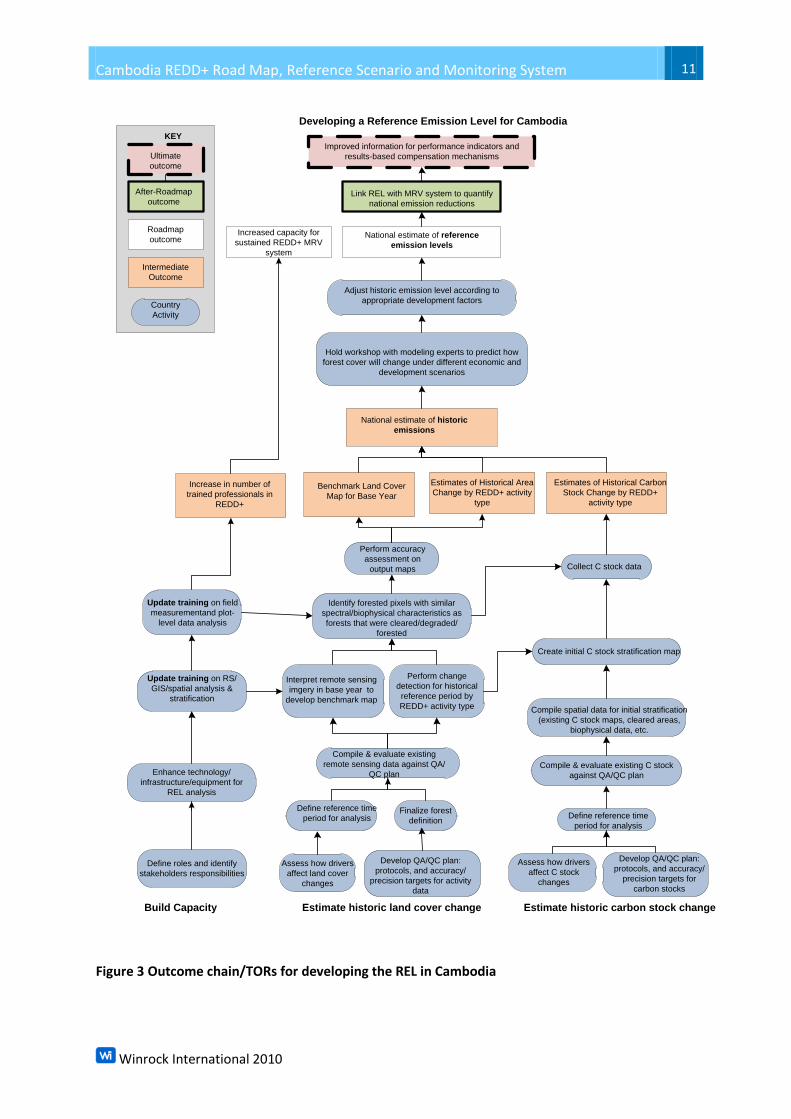
An outline of the activities and steps that need to be accomplished to attain the objectives of this
Section are presented the outcome chain diagram in Figure . The proposed steps in Figure 3 are
essentially the terms of reference that would need to be accomplished to meet the objectives of this
Section.
12 See REDD+ Roadmap Background Report for further details on these three plans.
Cambodia REDD+ Road Map, Reference Scenario and Monitoring System 11
Winrock International 2010
Country
Activity
Intermediate
Outcome
Roadmap
outcome
After-Roadmap
outcome
Ultimate
outcome
KEY
Improved information for performance indicators and
results-based compensation mechanisms
National estimate of reference
emission levels
National estimate of historic
emissions
Hold workshop with modeling experts to predict how
forest cover will change under different economic and
development scenarios
Adjust historic emission level according to
appropriate development factors
Estimate historic land cover change Estimate historic carbon stock change
Assess how drivers
affect C stock
changes
Assess how drivers
affect land cover
changes
Compile & evaluate existing C stock
against QA/QC plan
Compile & evaluate existing
remote sensing data against QA/
QC plan
Define roles and identify
stakeholders responsibilities
Enhance technology/
infrastructure/equipment for
REL analysis
Benchmark Land Cover
Map for Base Year
Estimates of Historical Area
Change by REDD+ activity
type
Estimates of Historical Carbon
Stock Change by REDD+
activity type
Define reference time
period for analysis
Interpret remote sensing
imgery in base year to
develop benchmark map
Perform change
detection for historical
reference period by
REDD+ activity type
Build Capacity
Develop QA/QC plan:
protocols, and accuracy/
precision targets for activity
data
Develop QA/QC plan:
protocols, and accuracy/
precision targets for
carbon stocks
Create initial C stock stratification map
Compile spatial data for initial stratification
(existing C stock maps, cleared areas,
biophysical data, etc.
Finalize forest
definition
Link REL with MRV system to quantify
national emission reductions
Collect C stock data
Update training on RS/
GIS/spatial analysis &
stratification
Update training on field
measurementand plot-
level data analysis
Perform accuracy
assessment on
output maps
Identify forested pixels with similar
spectral/biophysical characteristics as
forests that were cleared/degraded/
forested
Increase in number of
trained professionals in
REDD+
Increased capacity for
sustained REDD+ MRV
system
Define reference time
period for analysis
Developing a Reference Emission Level for Cambodia
Figure 3 Outcome chain/TORs for developing the REL in Cambodia
Cambodia REDD+ Road Map, Reference Scenario and Monitoring System 12
Winrock International 2010
5-1 Establish national-level institutions for MRV/REL with adequate capacity
Step 5-1a. Define management roles and responsibilities
The National REDD+ Taskforce will be responsible for the implementation of a REDD+ program in
Cambodia (for further details on roles and responsibilities of the relevant government agencies see
the Cambodia REDD+ Roadmap). The REDD+ Taskforce will coordinate the Cambodia National
REDD+ Readiness process. Its specific roles will include:
Development of National REDD+ registry
Development of Guidelines for REDD+ projects in Cambodia, including procedures for
Government approval
Determine benefit-sharing and REDD+ revenue management
Setting Cambodia’s RELs and rules for MRV via the REL/MRV Working Group, including
national forest carbon accounting methods (e.g. methods to be used, definitions of forests,
etc.)
A management structure for the REL/MRV Working Group will need to be developed and roles and
responsibilities of various institutions defined to ensure that groups are working together towards a
common goal. A key aspect for this work will be the enhancement and formalization of existing
collaboration and cooperation among key agencies and organizations (governmental and non-
governmental) leading to improved sharing of data and information relevant to developing the REL
and the MRV system.
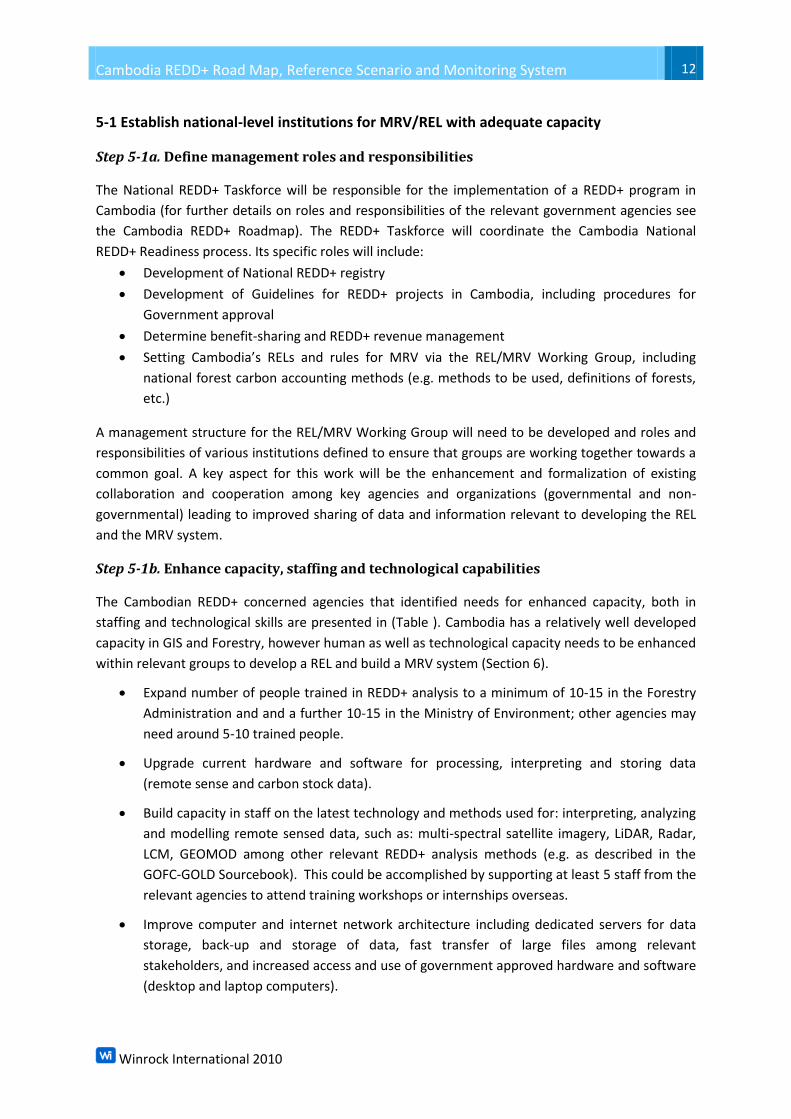
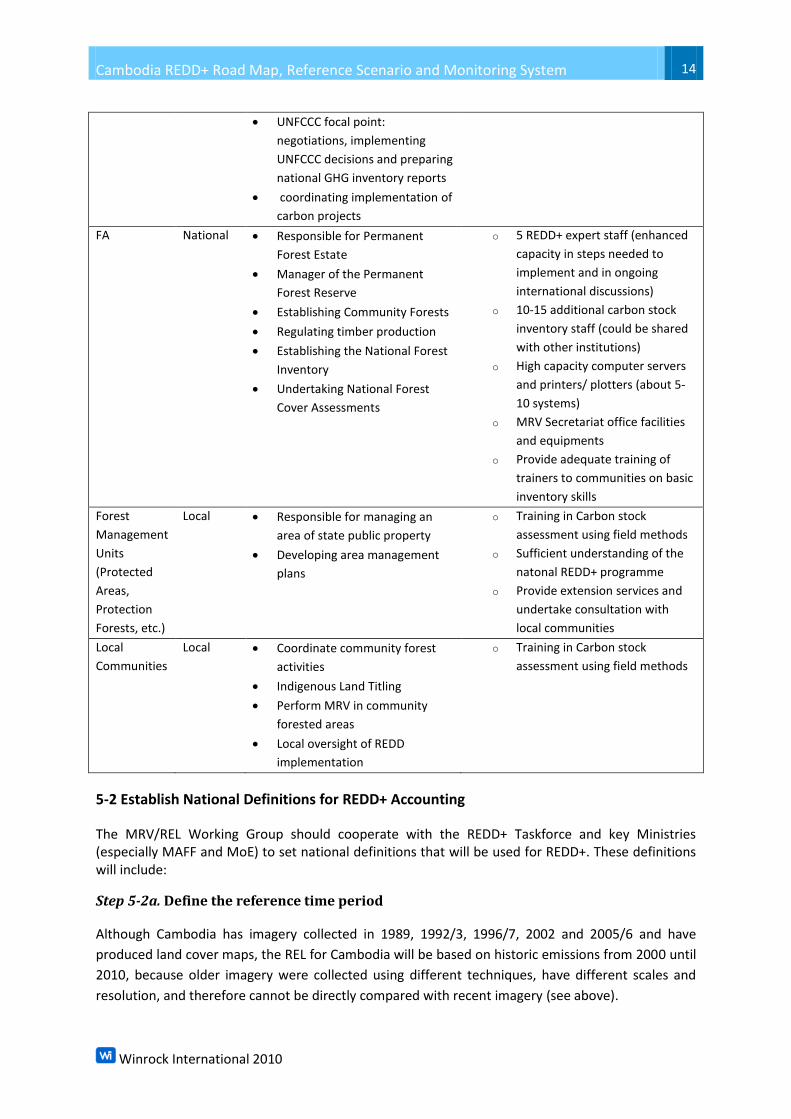
Step 5-1b. Enhance capacity, staffing and technological capabilities
The Cambodian REDD+ concerned agencies that identified needs for enhanced capacity, both in
staffing and technological skills are presented in (Table ). Cambodia has a relatively well developed
capacity in GIS and Forestry, however human as well as technological capacity needs to be enhanced
within relevant groups to develop a REL and build a MRV system (Section 6).
Expand number of people trained in REDD+ analysis to a minimum of 10-15 in the Forestry
Administration and and a further 10-15 in the Ministry of Environment; other agencies may
need around 5-10 trained people.
Upgrade current hardware and software for processing, interpreting and storing data
(remote sense and carbon stock data).
Build capacity in staff on the latest technology and methods used for: interpreting, analyzing
and modelling remote sensed data, such as: multi-spectral satellite imagery, LiDAR, Radar,
LCM, GEOMOD among other relevant REDD+ analysis methods (e.g. as described in the
GOFC-GOLD Sourcebook). This could be accomplished by supporting at least 5 staff from the
relevant agencies to attend training workshops or internships overseas.
Improve computer and internet network architecture including dedicated servers for data
storage, back-up and storage of data, fast transfer of large files among relevant
stakeholders, and increased access and use of government approved hardware and software
(desktop and laptop computers).

Cambodia REDD+ Road Map, Reference Scenario and Monitoring System 13
Winrock International 2010
In addition, it is important to also build capacity on internationally accepted and credible IPCC
approaches and methodologies for estimating GHG emissions and removals at the national scale
(e.g. as described in the IPCC 2003 GPG and 2006 AFOLU). Capacity in information management and
information technology will also be needed due to large amounts of data that will be generated and
managed. Such steps will ensure Cambodia’s ownership of the REL process and provide a sustained
capacity for future REDD+ monitoring.
Table 3 Overview of Cambodian government institutions participating in the establishment of
REDD+ REL and MRV system and expected increased capacity needs
Institutions
involved
Scale of
operation Expected role Capacity needed
RGC National Adoption of REDD+ policies,
strategies, new laws and
subsidiary regulations
o Finance
o Advisory group
o At least 1-2 technical staff
NCCC National Oversee Climate Changes
Programs
o Finance
o Technical staff
o Updated computing and field
equipment, infrastructure, etc
REDD+
Taskforce
National Implementation for REDD+
activities/ interventions
Following international
negotiations on REDD+
o Support staff (up to 2 persons)
o Finance expert
o REDD+ expert staff from MEF
o Updated computing and
equipment, infrastructure, etc
MRV/REL
Working
Group
National Implementation of MRV and REL
sections of the Roadmap
o Lead representatives from FA,
MoE, FiA and Department of
Geography
o Training in overall MRV and REL
planning
o Training in Carbon stock
assessment (RS/GIS/Field
methods)
o Updated computing and field
equipment, infrastructure, etc
MoE National Management of Protected areas
Review environmental impacts
assessments
CDM interim designated
national authority
Developing and implementing
National Protected Areas
Strategic Management Plan
Cooperate with relevant
institutions to: develop national
climate change strategies, and
carbon credit policy, manage
climate change trust funds
o REDD+ expert staff
o Training in Carbon stock
assessment (RS/GIS/Field
methods)
o Technical support (equipments,
infrastructure, etc)
Cambodia REDD+ Road Map, Reference Scenario and Monitoring System 14
Winrock International 2010
UNFCCC focal point:
negotiations, implementing
UNFCCC decisions and preparing
national GHG inventory reports
coordinating implementation of
carbon projects
FA National Responsible for Permanent
Forest Estate
Manager of the Permanent
Forest Reserve
Establishing Community Forests
Regulating timber production
Establishing the National Forest
Inventory
Undertaking National Forest
Cover Assessments
o 5 REDD+ expert staff (enhanced
capacity in steps needed to
implement and in ongoing
international discussions)
o 10-15 additional carbon stock
inventory staff (could be shared
with other institutions)
o High capacity computer servers
and printers/ plotters (about 5-
10 systems)
o MRV Secretariat office facilities
and equipments
o Provide adequate training of
trainers to communities on basic
inventory skills
Forest
Management
Units
(Protected
Areas,
Protection
Forests, etc.)
Local Responsible for managing an
area of state public property
Developing area management
plans
o Training in Carbon stock
assessment using field methods
o Sufficient understanding of the
natonal REDD+ programme
o Provide extension services and
undertake consultation with
local communities
Local
Communities
Local Coordinate community forest
activities
Indigenous Land Titling
Perform MRV in community
forested areas
Local oversight of REDD
implementation
o Training in Carbon stock
assessment using field methods
5-2 Establish National Definitions for REDD+ Accounting
The MRV/REL Working Group should cooperate with the REDD+ Taskforce and key Ministries (especially MAFF and MoE) to set national definitions that will be used for REDD+. These definitions will include:
Step 5-2a. Define the reference time period
Although Cambodia has imagery collected in 1989, 1992/3, 1996/7, 2002 and 2005/6 and have
produced land cover maps, the REL for Cambodia will be based on historic emissions from 2000 until
2010, because older imagery were collected using different techniques, have different scales and
resolution, and therefore cannot be directly compared with recent imagery (see above).
Cambodia REDD+ Road Map, Reference Scenario and Monitoring System 15
Winrock International 2010
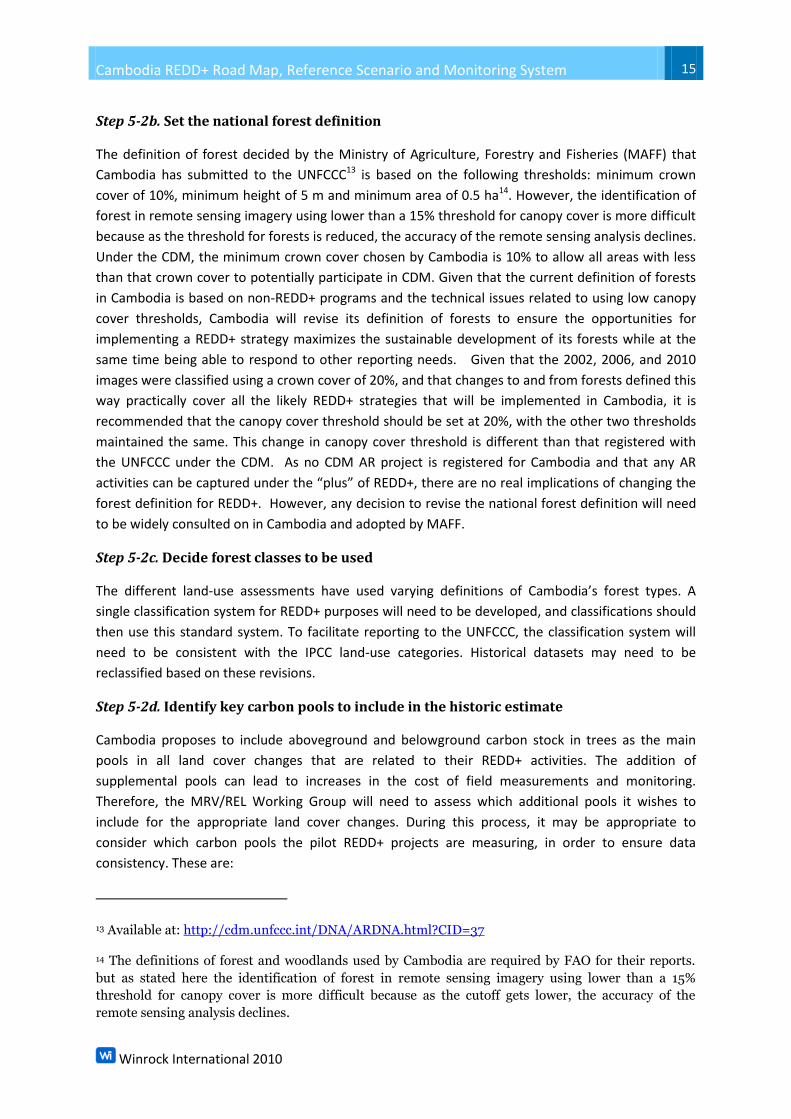
Step 5-2b. Set the national forest definition
The definition of forest decided by the Ministry of Agriculture, Forestry and Fisheries (MAFF) that
Cambodia has submitted to the UNFCCC13 is based on the following thresholds: minimum crown
cover of 10%, minimum height of 5 m and minimum area of 0.5 ha14. However, the identification of
forest in remote sensing imagery using lower than a 15% threshold for canopy cover is more difficult
because as the threshold for forests is reduced, the accuracy of the remote sensing analysis declines.
Under the CDM, the minimum crown cover chosen by Cambodia is 10% to allow all areas with less
than that crown cover to potentially participate in CDM. Given that the current definition of forests
in Cambodia is based on non-REDD+ programs and the technical issues related to using low canopy
cover thresholds, Cambodia will revise its definition of forests to ensure the opportunities for
implementing a REDD+ strategy maximizes the sustainable development of its forests while at the
same time being able to respond to other reporting needs. Given that the 2002, 2006, and 2010
images were classified using a crown cover of 20%, and that changes to and from forests defined this
way practically cover all the likely REDD+ strategies that will be implemented in Cambodia, it is
recommended that the canopy cover threshold should be set at 20%, with the other two thresholds
maintained the same. This change in canopy cover threshold is different than that registered with
the UNFCCC under the CDM. As no CDM AR project is registered for Cambodia and that any AR
activities can be captured under the “plus” of REDD+, there are no real implications of changing the
forest definition for REDD+. However, any decision to revise the national forest definition will need
to be widely consulted on in Cambodia and adopted by MAFF.
Step 5-2c. Decide forest classes to be used
The different land-use assessments have used varying definitions of Cambodia’s forest types. A
single classification system for REDD+ purposes will need to be developed, and classifications should
then use this standard system. To facilitate reporting to the UNFCCC, the classification system will
need to be consistent with the IPCC land-use categories. Historical datasets may need to be
reclassified based on these revisions.
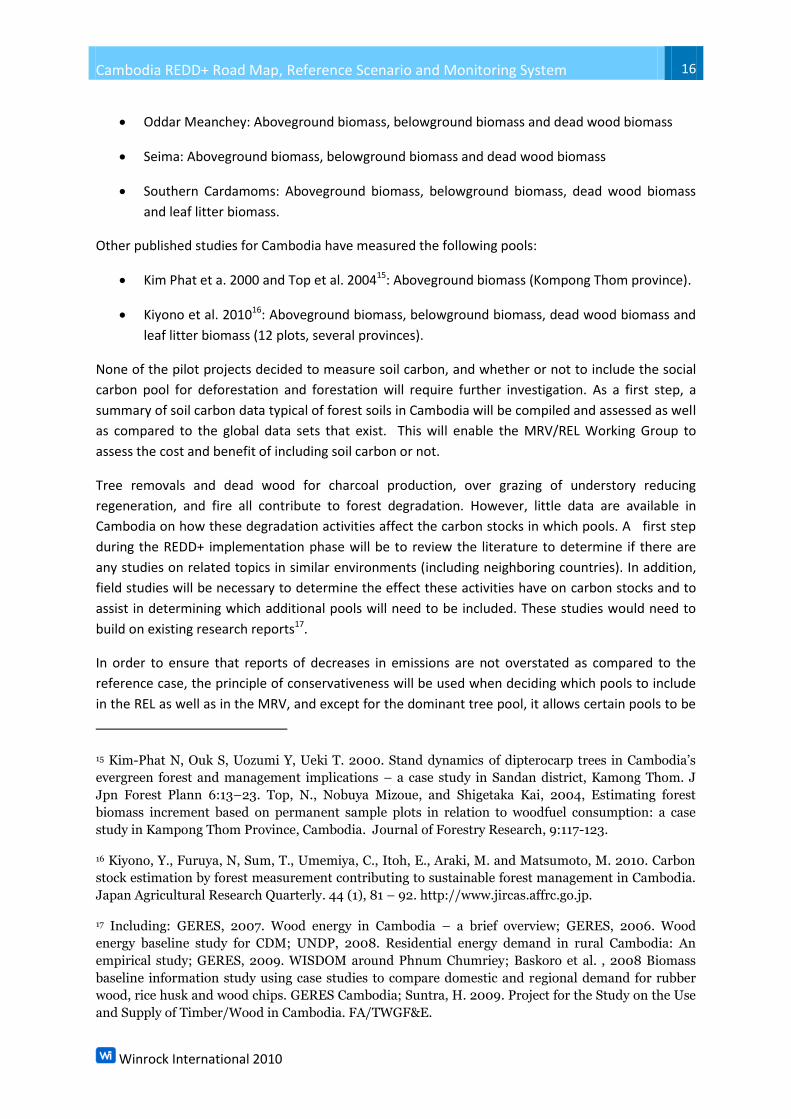
Step 5-2d. Identify key carbon pools to include in the historic estimate
Cambodia proposes to include aboveground and belowground carbon stock in trees as the main
pools in all land cover changes that are related to their REDD+ activities. The addition of
supplemental pools can lead to increases in the cost of field measurements and monitoring.
Therefore, the MRV/REL Working Group will need to assess which additional pools it wishes to
include for the appropriate land cover changes. During this process, it may be appropriate to
consider which carbon pools the pilot REDD+ projects are measuring, in order to ensure data
consistency. These are:
13 Available at: http://cdm.unfccc.int/DNA/ARDNA.html?CID=37
14 The definitions of forest and woodlands used by Cambodia are required by FAO for their reports.
but as stated here the identification of forest in remote sensing imagery using lower than a 15%
threshold for canopy cover is more difficult because as the cutoff gets lower, the accuracy of the
remote sensing analysis declines.
Cambodia REDD+ Road Map, Reference Scenario and Monitoring System 16
Winrock International 2010
Oddar Meanchey: Aboveground biomass, belowground biomass and dead wood biomass
Seima: Aboveground biomass, belowground biomass and dead wood biomass
Southern Cardamoms: Aboveground biomass, belowground biomass, dead wood biomass
and leaf litter biomass.
Other published studies for Cambodia have measured the following pools:
Kim Phat et a. 2000 and Top et al. 200415: Aboveground biomass (Kompong Thom province).
Kiyono et al. 201016: Aboveground biomass, belowground biomass, dead wood biomass and
leaf litter biomass (12 plots, several provinces).
None of the pilot projects decided to measure soil carbon, and whether or not to include the social
carbon pool for deforestation and forestation will require further investigation. As a first step, a
summary of soil carbon data typical of forest soils in Cambodia will be compiled and assessed as well
as compared to the global data sets that exist. This will enable the MRV/REL Working Group to
assess the cost and benefit of including soil carbon or not.
Tree removals and dead wood for charcoal production, over grazing of understory reducing
regeneration, and fire all contribute to forest degradation. However, little data are available in
Cambodia on how these degradation activities affect the carbon stocks in which pools. A first step
during the REDD+ implementation phase will be to review the literature to determine if there are
any studies on related topics in similar environments (including neighboring countries). In addition,
field studies will be necessary to determine the effect these activities have on carbon stocks and to
assist in determining which additional pools will need to be included. These studies would need to
build on existing research reports17.
In order to ensure that reports of decreases in emissions are not overstated as compared to the
reference case, the principle of conservativeness will be used when deciding which pools to include
in the REL as well as in the MRV, and except for the dominant tree pool, it allows certain pools to be
15 Kim-Phat N, Ouk S, Uozumi Y, Ueki T. 2000. Stand dynamics of dipterocarp trees in Cambodia’s
evergreen forest and management implications – a case study in Sandan district, Kamong Thom. J
Jpn Forest Plann 6:13–23. Top, N., Nobuya Mizoue, and Shigetaka Kai, 2004, Estimating forest
biomass increment based on permanent sample plots in relation to woodfuel consumption: a case
study in Kampong Thom Province, Cambodia. Journal of Forestry Research, 9:117-123.
16 Kiyono, Y., Furuya, N, Sum, T., Umemiya, C., Itoh, E., Araki, M. and Matsumoto, M. 2010. Carbon
stock estimation by forest measurement contributing to sustainable forest management in Cambodia.
Japan Agricultural Research Quarterly. 44 (1), 81 – 92. http://www.jircas.affrc.go.jp.
17 Including: GERES, 2007. Wood energy in Cambodia – a brief overview; GERES, 2006. Wood
energy baseline study for CDM; UNDP, 2008. Residential energy demand in rural Cambodia: An
empirical study; GERES, 2009. WISDOM around Phnum Chumriey; Baskoro et al. , 2008 Biomass
baseline information study using case studies to compare domestic and regional demand for rubber
wood, rice husk and wood chips. GERES Cambodia; Suntra, H. 2009. Project for the Study on the Use
and Supply of Timber/Wood in Cambodia. FA/TWGF&E.
Cambodia REDD+ Road Map, Reference Scenario and Monitoring System 17
Winrock International 2010
omitted. However, it is clear that once established, the REL and subsequent MRV estimations must
remain constant and include exactly the same pools.
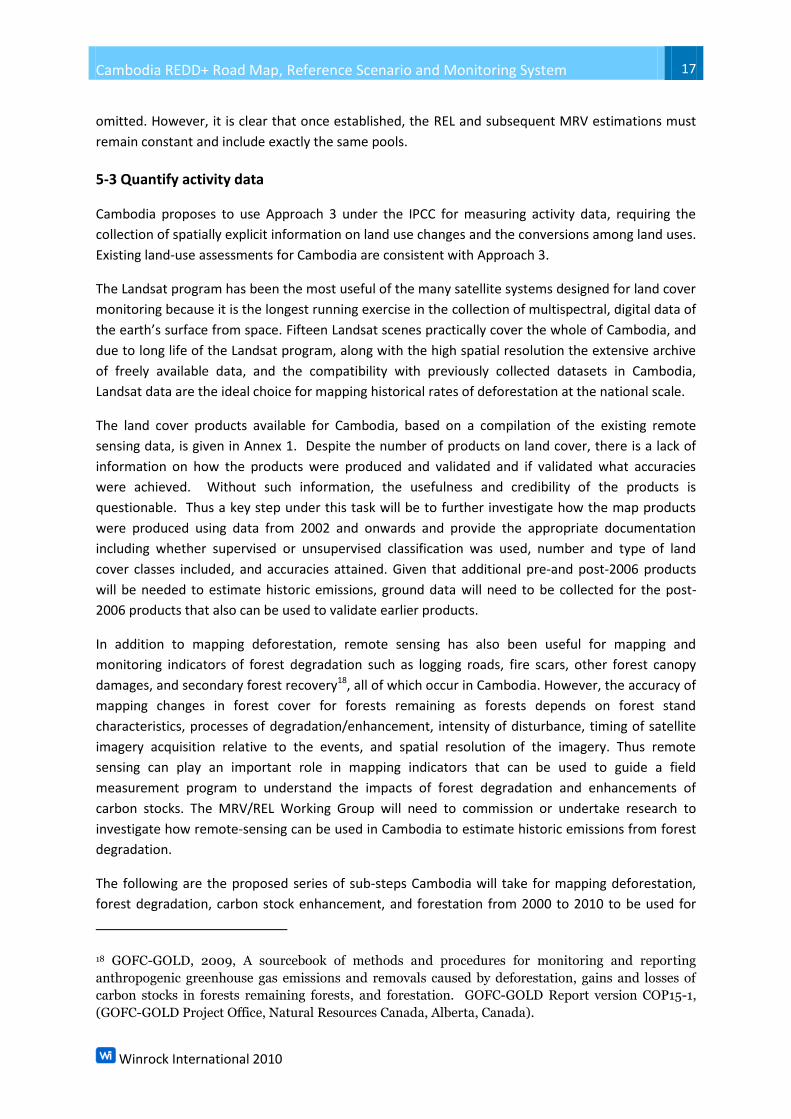
5-3 Quantify activity data
Cambodia proposes to use Approach 3 under the IPCC for measuring activity data, requiring the
collection of spatially explicit information on land use changes and the conversions among land uses.
Existing land-use assessments for Cambodia are consistent with Approach 3.
The Landsat program has been the most useful of the many satellite systems designed for land cover
monitoring because it is the longest running exercise in the collection of multispectral, digital data of
the earth’s surface from space. Fifteen Landsat scenes practically cover the whole of Cambodia, and
due to long life of the Landsat program, along with the high spatial resolution the extensive archive
of freely available data, and the compatibility with previously collected datasets in Cambodia,
Landsat data are the ideal choice for mapping historical rates of deforestation at the national scale.
The land cover products available for Cambodia, based on a compilation of the existing remote
sensing data, is given in Annex 1. Despite the number of products on land cover, there is a lack of
information on how the products were produced and validated and if validated what accuracies
were achieved. Without such information, the usefulness and credibility of the products is
questionable. Thus a key step under this task will be to further investigate how the map products
were produced using data from 2002 and onwards and provide the appropriate documentation
including whether supervised or unsupervised classification was used, number and type of land
cover classes included, and accuracies attained. Given that additional pre-and post-2006 products
will be needed to estimate historic emissions, ground data will need to be collected for the post-
2006 products that also can be used to validate earlier products.
In addition to mapping deforestation, remote sensing has also been useful for mapping and
monitoring indicators of forest degradation such as logging roads, fire scars, other forest canopy
damages, and secondary forest recovery18, all of which occur in Cambodia. However, the accuracy of
mapping changes in forest cover for forests remaining as forests depends on forest stand
characteristics, processes of degradation/enhancement, intensity of disturbance, timing of satellite
imagery acquisition relative to the events, and spatial resolution of the imagery. Thus remote
sensing can play an important role in mapping indicators that can be used to guide a field
measurement program to understand the impacts of forest degradation and enhancements of
carbon stocks. The MRV/REL Working Group will need to commission or undertake research to
investigate how remote-sensing can be used in Cambodia to estimate historic emissions from forest
degradation.
The following are the proposed series of sub-steps Cambodia will take for mapping deforestation,
forest degradation, carbon stock enhancement, and forestation from 2000 to 2010 to be used for
18 GOFC-GOLD, 2009, A sourcebook of methods and procedures for monitoring and reporting
anthropogenic greenhouse gas emissions and removals caused by deforestation, gains and losses of
carbon stocks in forests remaining forests, and forestation. GOFC-GOLD Report version COP15-1,
(GOFC-GOLD Project Office, Natural Resources Canada, Alberta, Canada).
Cambodia REDD+ Road Map, Reference Scenario and Monitoring System 18
Winrock International 2010
estimating historic emissions/removals. It is expected that advice will be solicited from national and
international experts as needed.
Step 5-3a. Perform change detection for historical reference period
Imagery will be compiled and interpreted based on the selected definition of forest to create a land
cover map with classes relevant to REDD+ activities and drivers. The years for which satellite data
already exist are 2002 and 2006. Data will need to be acquired for 2010 at a minimum, which is
already underway by the Forestry Administration, and preferably 2000. A 2000 product will serve as
the benchmark map for the historic period against which changes from 2000-2010 will be
determined using standard remote sensing protocols for change detection. The 2010 product will be
updated resulting in a benchmark map for future monitoring. Land cover change will be mapped
over the reference period using the Landsat imagery (2000, 2002, 2006 and 2010+) using standard
approaches and the expertise of staff within the Government agencies responsible.
Step 5-3b. Classification quality control and accuracy assessment
All map products will undergo quality control to ensure that the interpretation and classification
provides accurate products. As shown in the outcome change (Figure 3), a plan for assuring quality
of the mapping products will be developed and then used in this step. The selection of
methodologies and algorithms for classification and accuracy assessments for mapping changes in
forest cover (gains and losses) will be based on existing experience in remote sensing interpretation
coupled with a review of peer-reviewed methodologies and discussions with the international
remote sensing community. Visual interpretation of the imagery will be used to evaluate the
success/effectiveness of the classification routines.
The accuracy assessment can be conducted by comparing maps of deforestation derived from
remote sensing with field observations or high resolution aerial imagery. This will be done in
collaboration with new initiatives already being implemented in Cambodia—e.g. the national forest
inventory effort. For historical imagery (pre-2010), the use of existing aerial imagery and scattered
very high resolution (<5 meters) imagery will be investigated. Standard methods used by the remote
sensing community (e.g. described in the GOFC-GOLD 2009 Sourcebook19) will be used to assess the
overall accuracies of the land cover classification to provide a statistically valid representation of
map accuracy.
Based on results from the quality control step, the classification results will be adjusted either
manually in the GIS or by adjusting the parameters used to assign Landsat spectral information to
the forest and non-forest classes. All image processing methods and evaluation results will be
permanently documented and recorded for verification and complete transparency.
19 GOFC-GOLD, 2009, A sourcebook of methods and procedures for monitoring and reporting
anthropogenic greenhouse gas emissions and removals caused by deforestation, gain and losses of
carbon stocks in forests remaining forests, and forestation, GOFC-GOLD Report version COP15-1.
Hence forth document referred to as: GOFC-GOLD, 2009

Cambodia REDD+ Road Map, Reference Scenario and Monitoring System 19
Winrock International 2010
Step 5-3c. Mosaic and stratify classification products
Individual Landsat products will be stitched together (15 Landsat scenes per point in time) to create
the final wall-to-wall benchmark and change maps. In addition, these products will be stratified by
forest type, ecoregion, etc. to facilitate integration with carbon products and to understand regional
differences in rates and patterns of forest cover change. We anticipate that, at a minimum, the
following products will be created by: (1) deforestation and (2) forestation maps for 2000 to 2006
and 2006 to 2010+ (to a maximum of 2012). These maps will indicate areas of forest lost and forest
gained during each census period for each stratum identified.
Maps of forest degradation and stock enhancement are more difficult to detect using Landsat
imagery and require higher resolution imagery. Forest degradation was not taken into account
during the preparation of the national land cover maps and therefore forest degradation has not
been mapped at the national scale. Large-scale logging during the 1990s in many areas almost
certainly has caused considerable forest degradation. Present day deforestation and forest
degradation are particularly intensive on the boundary between agricultural and the major forests
cover and in the flooded forest. The development of new access roads through isolated forest
enables deforestation and degradation of primary forest. Methods for addressing degradation will
be developed during the implementation stage of the Cambodia REDD+ Roadmap, and taken into
consideration in the planning of the National Forest Inventory plan.
Methods to assist in stratifying into area of degradation and enhancement of stocks have been
described in the GOFC-GOLD Sourcebook. These methods use other spatial data layers such as
transport networks, bio-geophysical characteristics of the landscape, population centers, already
cleared land and the like. Cambodia has abundant spatial data bases covering the bio-geo-physical,
economic and transportation sectors present in its territory (

Cambodia REDD+ Road Map, Reference Scenario and Monitoring System 20
Winrock International 2010
Annex 2 Existing GIS Data in Cambodia).
As a starting point for stratifying the forests into degraded or enhanced classes, a workshop of
experts will be convened to plan a strategy for estimating emissions/removals from these activities
during the historic time period. The workshop shall gather all REDD+ concerned partitions and define
the information, data and preparation gaps that exist in Cambodia, and therefore the action plans to
cover them.
5-4 Develop emission and removal factors for REDD+-related activities
Cambodia will aim for at least a Tier 2 level of data for its estimate of historic emissions/removal.
The sub-sections below describe the steps we propose to collect Tier 2 level data for emission and
removal factors to be pooled with the activity data collected in Section 6.
Step 5-4a. Develop QA/QC plan and protocols for carbon stock change data collection
A data archiving framework and Quality Assurance/Quality Control (QA/QC) plan will be formulated
so that field data on carbon stocks measured at various locations and for various attribute
combinations will be transparently and accurately mapped and tracked.
Well established, commonly accepted principles of forest inventory, soil sampling, and ecological
surveys form the basis for the techniques and methods used for measuring and estimating the
carbon stocks of terrestrial carbon pools. There are a number of sources (e.g., IPCC 2003 GPG
LULUCF, World Bank’s BioCarbon Sourcebook for LULUCF, GOFC-GOLD Sourcebook, etc.) and the
Standard Operating Procedures (SOPs) for the REDD voluntary carbon projects under development
(including Oddar Meanchey, Seima and the Southern Cardamoms) that provide standard methods
for measuring and estimating the carbon stocks of the key carbon pools that will be identified from
step 5-2d. After reviewing these sources a set of standard field measurement protocols will be
finalized by the MRV/REL Working Group that suite Cambodia’s circumstances for each selected
pool.
It is likely that the carbon stocks of some forested types will be more variable than others. There is a
relationship between the targeted accuracy/precision and the cost to sample that is related to the
spatial variability of carbon stocks across the landscape—the more variable the carbon stocks and
the higher the targeted precision the more costly it will be to measure in general. Therefore a cost to
monitor versus a desired accuracy/precision will be investigated before the final protocols are
developed.
A sampling plan and protocols for conducting the national carbon stock inventory will be defined
during the implementation of the steps needed to develop a REL. This sampling scheme will describe
the technical methods that will be used to conduct the carbon stock assessments, the appropriate
stratification of the land area to be monitored according to the real vegetation and stocks present
on the ground. Collection of preliminary data using a draft of the sampling design adopted will be
required to adjust design to specific needs and finalizing the sampling scheme. With finalized
sampling design, the MRV/REL working group will develop the national carbon stock assessment.
Cambodia REDD+ Road Map, Reference Scenario and Monitoring System 21
Winrock International 2010
Based on the assessment, national values for key parameters will be calculated and a database
associating the emission/removal factors will be created to facilitate in the future monitoring.
The sampling plan and protocols will include details on stratification of the wooded lands for
measurement, estimation of sampling intensity (number of plots), plot size, and standard operating
procedures for collecting measurements for each key carbon pool. Relevant FA, MoE and FiA staff
(as appropriate) will be trained on these methods.
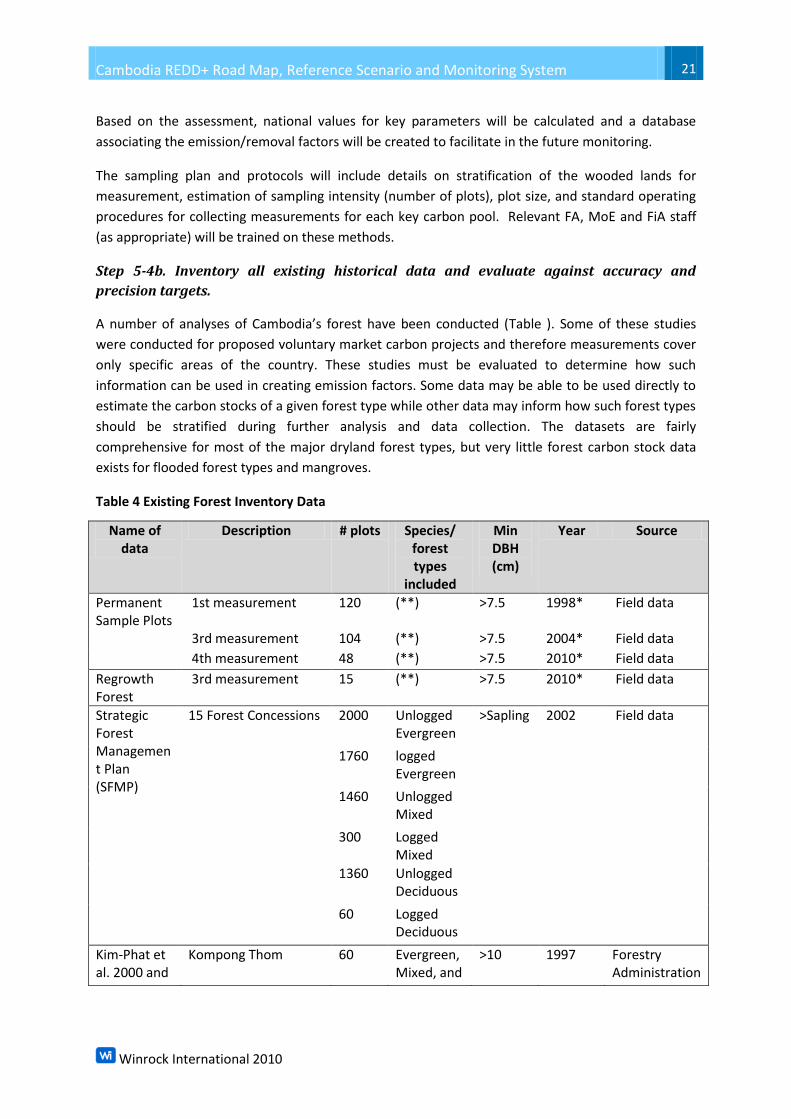
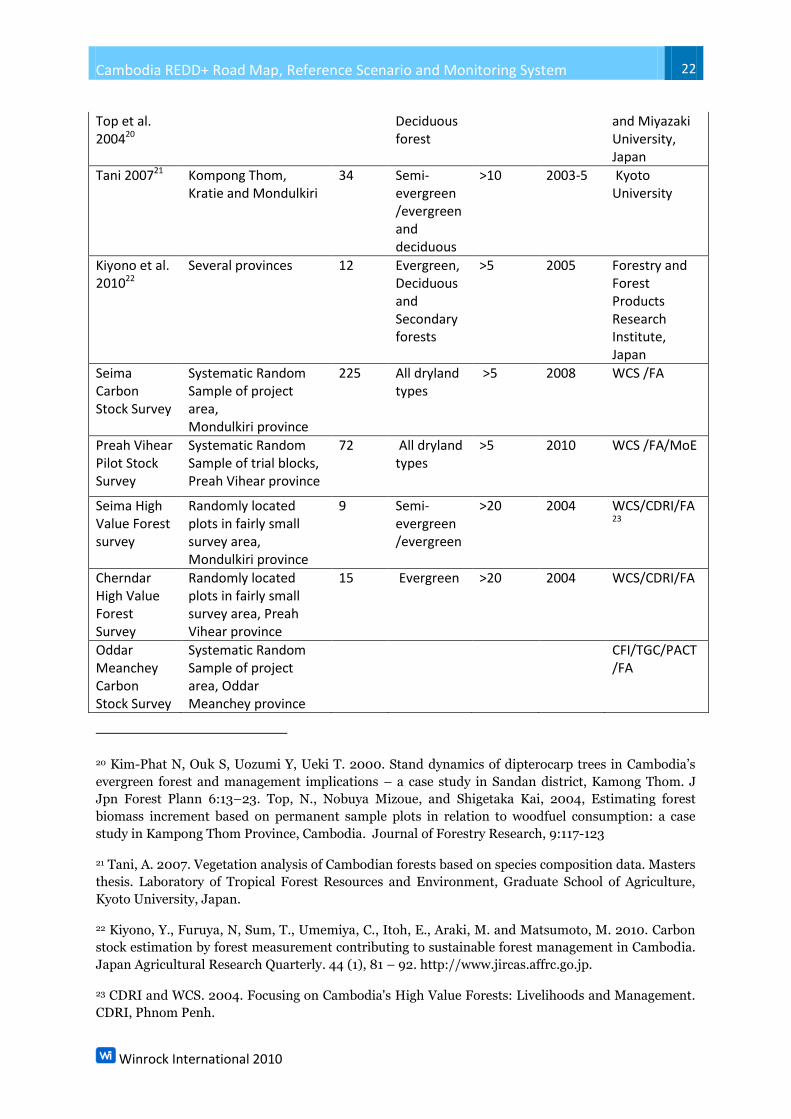
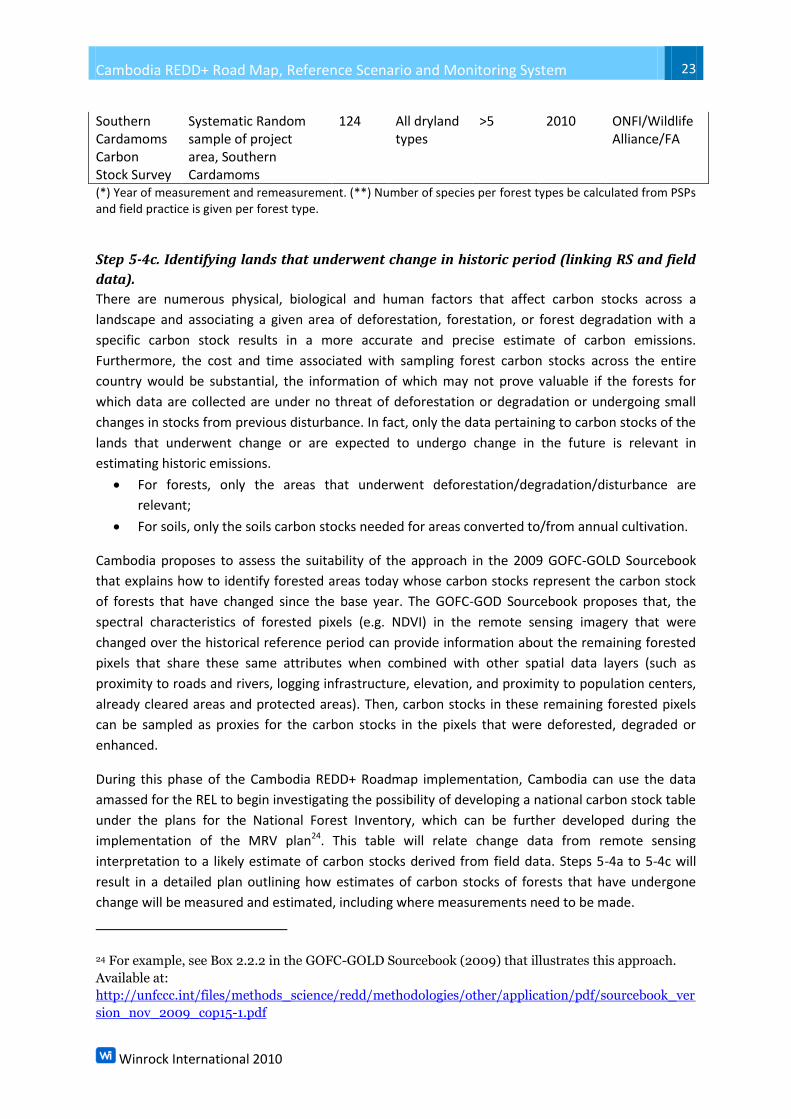
Step 5-4b. Inventory all existing historical data and evaluate against accuracy and
precision targets.
A number of analyses of Cambodia’s forest have been conducted (Table ). Some of these studies
were conducted for proposed voluntary market carbon projects and therefore measurements cover
only specific areas of the country. These studies must be evaluated to determine how such
information can be used in creating emission factors. Some data may be able to be used directly to
estimate the carbon stocks of a given forest type while other data may inform how such forest types
should be stratified during further analysis and data collection. The datasets are fairly
comprehensive for most of the major dryland forest types, but very little forest carbon stock data
exists for flooded forest types and mangroves.
Table 4 Existing Forest Inventory Data
Name of data
Description # plots Species/ forest types
included
Min DBH (cm)
Year Source
Permanent Sample Plots
1st measurement 120 (**) >7.5 1998* Field data
3rd measurement 104 (**) >7.5 2004* Field data
4th measurement 48 (**) >7.5 2010* Field data
Regrowth Forest
3rd measurement 15 (**) >7.5 2010* Field data
Strategic Forest Management Plan (SFMP)
15 Forest Concessions 2000 Unlogged Evergreen
>Sapling 2002 Field data
1760 logged Evergreen
1460 Unlogged Mixed
300 Logged Mixed
1360 Unlogged Deciduous
60 Logged Deciduous
Kim-Phat et al. 2000 and
Kompong Thom 60 Evergreen, Mixed, and
>10 1997 Forestry Administration
Cambodia REDD+ Road Map, Reference Scenario and Monitoring System 22
Winrock International 2010
Top et al. 200420
Deciduous forest
and Miyazaki University, Japan
Tani 200721 Kompong Thom, Kratie and Mondulkiri
34 Semi-evergreen /evergreen and deciduous
>10 2003-5 Kyoto University
Kiyono et al. 201022
Several provinces 12 Evergreen, Deciduous and Secondary forests
>5 2005 Forestry and Forest Products Research Institute, Japan
Seima Carbon Stock Survey
Systematic Random Sample of project area, Mondulkiri province
225 All dryland types
>5 2008 WCS /FA
Preah Vihear Pilot Stock Survey
Systematic Random Sample of trial blocks, Preah Vihear province
72 All dryland types
>5 2010 WCS /FA/MoE
Seima High Value Forest survey
Randomly located plots in fairly small survey area, Mondulkiri province
9 Semi-evergreen /evergreen
>20 2004 WCS/CDRI/FA23
Cherndar High Value Forest Survey
Randomly located plots in fairly small survey area, Preah Vihear province
15 Evergreen >20 2004 WCS/CDRI/FA
Oddar Meanchey Carbon Stock Survey
Systematic Random Sample of project area, Oddar Meanchey province
CFI/TGC/PACT/FA
20 Kim-Phat N, Ouk S, Uozumi Y, Ueki T. 2000. Stand dynamics of dipterocarp trees in Cambodia’s
evergreen forest and management implications – a case study in Sandan district, Kamong Thom. J
Jpn Forest Plann 6:13–23. Top, N., Nobuya Mizoue, and Shigetaka Kai, 2004, Estimating forest
biomass increment based on permanent sample plots in relation to woodfuel consumption: a case
study in Kampong Thom Province, Cambodia. Journal of Forestry Research, 9:117-123
21 Tani, A. 2007. Vegetation analysis of Cambodian forests based on species composition data. Masters
thesis. Laboratory of Tropical Forest Resources and Environment, Graduate School of Agriculture,
Kyoto University, Japan.
22 Kiyono, Y., Furuya, N, Sum, T., Umemiya, C., Itoh, E., Araki, M. and Matsumoto, M. 2010. Carbon
stock estimation by forest measurement contributing to sustainable forest management in Cambodia.
Japan Agricultural Research Quarterly. 44 (1), 81 – 92. http://www.jircas.affrc.go.jp.
23 CDRI and WCS. 2004. Focusing on Cambodia's High Value Forests: Livelihoods and Management.
CDRI, Phnom Penh.
Cambodia REDD+ Road Map, Reference Scenario and Monitoring System 23
Winrock International 2010
Southern Cardamoms Carbon Stock Survey
Systematic Random sample of project area, Southern Cardamoms
124 All dryland types
>5 2010 ONFI/Wildlife Alliance/FA
(*) Year of measurement and remeasurement. (**) Number of species per forest types be calculated from PSPs and field practice is given per forest type.
Step 5-4c. Identifying lands that underwent change in historic period (linking RS and field
data).
There are numerous physical, biological and human factors that affect carbon stocks across a
landscape and associating a given area of deforestation, forestation, or forest degradation with a
specific carbon stock results in a more accurate and precise estimate of carbon emissions.
Furthermore, the cost and time associated with sampling forest carbon stocks across the entire
country would be substantial, the information of which may not prove valuable if the forests for
which data are collected are under no threat of deforestation or degradation or undergoing small
changes in stocks from previous disturbance. In fact, only the data pertaining to carbon stocks of the
lands that underwent change or are expected to undergo change in the future is relevant in
estimating historic emissions.
For forests, only the areas that underwent deforestation/degradation/disturbance are
relevant;
For soils, only the soils carbon stocks needed for areas converted to/from annual cultivation.
Cambodia proposes to assess the suitability of the approach in the 2009 GOFC-GOLD Sourcebook
that explains how to identify forested areas today whose carbon stocks represent the carbon stock
of forests that have changed since the base year. The GOFC-GOD Sourcebook proposes that, the
spectral characteristics of forested pixels (e.g. NDVI) in the remote sensing imagery that were
changed over the historical reference period can provide information about the remaining forested
pixels that share these same attributes when combined with other spatial data layers (such as
proximity to roads and rivers, logging infrastructure, elevation, and proximity to population centers,
already cleared areas and protected areas). Then, carbon stocks in these remaining forested pixels
can be sampled as proxies for the carbon stocks in the pixels that were deforested, degraded or
enhanced.
During this phase of the Cambodia REDD+ Roadmap implementation, Cambodia can use the data
amassed for the REL to begin investigating the possibility of developing a national carbon stock table
under the plans for the National Forest Inventory, which can be further developed during the
implementation of the MRV plan24. This table will relate change data from remote sensing
interpretation to a likely estimate of carbon stocks derived from field data. Steps 5-4a to 5-4c will
result in a detailed plan outlining how estimates of carbon stocks of forests that have undergone
change will be measured and estimated, including where measurements need to be made.
24 For example, see Box 2.2.2 in the GOFC-GOLD Sourcebook (2009) that illustrates this approach.
Available at:
http://unfccc.int/files/methods_science/redd/methodologies/other/application/pdf/sourcebook_ver
sion_nov_2009_cop15-1.pdf
Cambodia REDD+ Road Map, Reference Scenario and Monitoring System 24
Winrock International 2010
Step 5-4d. Carbon stock assessment
The stratification plan, sampling plan, and protocols developed from the prior steps will be
implemented and the forest areas to be measured identified on a map. The sampling strategy
adopted will ensure that carbon stocks measured in each stratum attain an acceptable level of
accuracy and precision as defined in the QA/QC plan and field protocols. Results from the field
measurements will be used to estimate emission factors for various land cover changes
(deforestation, degradation, forestation, enhancement of carbon stocks) using the IPCC GPG
framework, along with the estimated uncertainty around each emission factor.
5-5. Combine activity data with emission factors to develop total historical emissions
The purpose of this step is to estimate the annual historical emissions and removals, based on
changes in carbon stocks, for the time periods in the reference time frame. These historic emissions
and removals can be produced for any subnational scale such as by province or ecological zone or as
well as nationally.
The IPCC framework will be used for this step, applying the stock change approach for deforestation
and forestation, meaning that the area of change and the carbon stocks before and after the change
event will be combined. In this circumstance the gain loss-approach will most likely be favoured for
degradation and enhancement of carbon stocks. Rates of growth would account for carbon stock
gains. For losses in carbon stock, data referring to timber harvests, removals of trees for charcoal/
fuel, and transfers to the dead organic matter pool due to disturbances would be used.
For fire, the IPCC AFOLU 2006 report (Chapter 2) provides detailed methods (equations and
combustion factors for both CO2 and non-CO2 GHGs) that would be used. This would combine the
area burned with the carbon stock before and after a burn along with IPCC default values for
combustion and efficiency factors.
5-6. Develop future trajectory under different economic and development scenarios
After estimating historical emissions and removals, international experts in the fields of financial and
economic modelling will be required to advise on modelling future reference emission scenarios. The
impacts of development policies, global trends in demand and prices for Cambodia’s land based
commodities, and other economic factors will be included in these models. A workshop will be held
in this regard, to consult with national and international modelling experts and Cambodian
Ministries related to planning and finance. The outcome of this workshop would be a methodology
by which the historic emissions can be projected over different time periods and under different
economic and development scenarios, taking into consideration such factors as GDP, population
growth, past and present agricultural expansion, forest industry growth, sectoral development plans,
subnational development plans, specific investment programs, and/or adjustment coefficients
otherwise derived from such factors and data.
Work on this activity will require coordination and inputs from other government departments. In
addition to REDD+ Taskforce and MRV/REL working group members, national experts and university
staff/researchers will be engaged and consulted with for their assistance in developing the data
Cambodia REDD+ Road Map, Reference Scenario and Monitoring System 25
Winrock International 2010
bases and models to derive adjustment coefficients to modify the historical emission levels for
developing future trajectories.
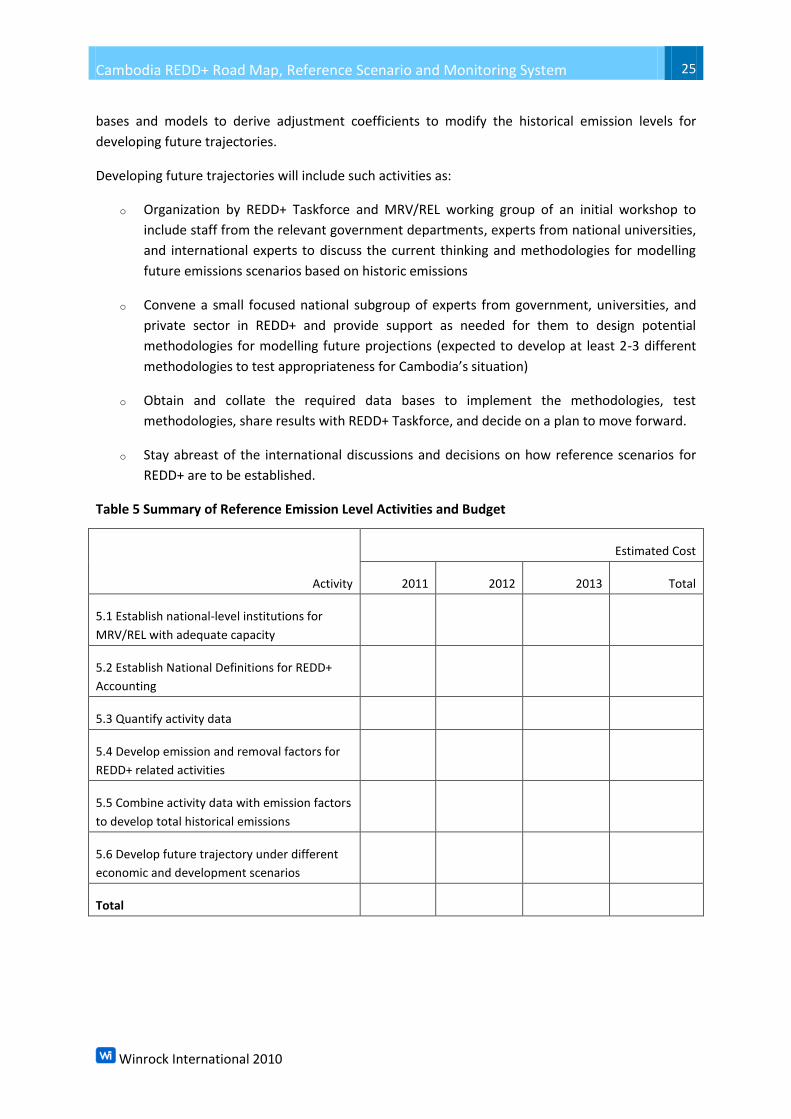
Developing future trajectories will include such activities as:
o Organization by REDD+ Taskforce and MRV/REL working group of an initial workshop to
include staff from the relevant government departments, experts from national universities,
and international experts to discuss the current thinking and methodologies for modelling
future emissions scenarios based on historic emissions
o Convene a small focused national subgroup of experts from government, universities, and
private sector in REDD+ and provide support as needed for them to design potential
methodologies for modelling future projections (expected to develop at least 2-3 different
methodologies to test appropriateness for Cambodia’s situation)
o Obtain and collate the required data bases to implement the methodologies, test
methodologies, share results with REDD+ Taskforce, and decide on a plan to move forward.
o Stay abreast of the international discussions and decisions on how reference scenarios for
REDD+ are to be established.
Table 5 Summary of Reference Emission Level Activities and Budget
Activity
Estimated Cost
2011 2012 2013 Total
5.1 Establish national-level institutions for
MRV/REL with adequate capacity
5.2 Establish National Definitions for REDD+
Accounting
5.3 Quantify activity data
5.4 Develop emission and removal factors for
REDD+ related activities
5.5 Combine activity data with emission factors
to develop total historical emissions
5.6 Develop future trajectory under different
economic and development scenarios
Total

Cambodia REDD+ Road Map, Reference Scenario and Monitoring System 26
Winrock International 2010
Roadmap Section 6: Design a Monitoring System
6a. Monitoring of Emissions and Removals
Objective for Section 6a
The overall objective of Section 6a is to develop a monitoring, reporting and verification (MRV)
system that allows for transparent and conservative accounting of emissions and removals of CO2
through time that can be compared against the projected reference scenario. An important question
to answer before designing a REDD+ MRV system is: “what should be monitored?” If the objective of
the MRV system is to evaluate the degree to which Cambodia’s candidate REDD+ strategies have or
have not been effective in reducing GHG emissions and/or increasing removals, it is logical to think
that monitoring indicators should be linked to each candidate REDD+ strategy. However, the
implementation of an individual REDD+ strategy may have indirect rather than direct impacts on
emission reductions. For example, an improvement in forest governance may have profound
impacts on how forests are managed in Cambodia, yet developing a specific indicator to ascribe the
impact of this action to reducing emissions or enhancing removals of CO2 would be difficult.
Examples of monitoring indictors related to candidate REDD+ strategies are presented in the main
text that will be taken into consideration during the design of the MRV system.
The MRV section is composed of two phases — a MRV development phase and a MRV
implementation phase. The outcome of the implementation of this section will be a functional MRV
system for evaluating the performance of REDD+ interventions in Cambodia. The exact details of the
MRV system will be adapted and finalized during the Cambodia REDD+ Roadmap implementation
phase as it is tested at demonstration sites, but key features of the system design are presented as a
starting point for further development. The design of the MRV system will build upon the framework
already established for estimating historical emissions in Section 5, as the methods for estimating
emissions and removals during the monitoring period will need to be comparable to those used for
estimating historical emissions, so that the performance of REDD+ interventions can be measured.
Thus many of the steps outlined in Section 5 will carry over into Section 6a.
Linkages between REDD+ strategies and monitoring Sections
Broadly, the REDD+ strategies proposed to Cambodia are based on existing policy frameworks, laws
and subsidiary regulations, such as: (i) the National Forestry Programme (NFP) for the Permanent
Forest Estate, including community forestry, protection forests, concession forests, etc., (ii) the
National Protected Areas Strategic Management Plan for Protected Areas (under development) and,
(iii) the Strategic Planning Framework for Fisheries for flooded forests and mangroves outside of
protected areas.
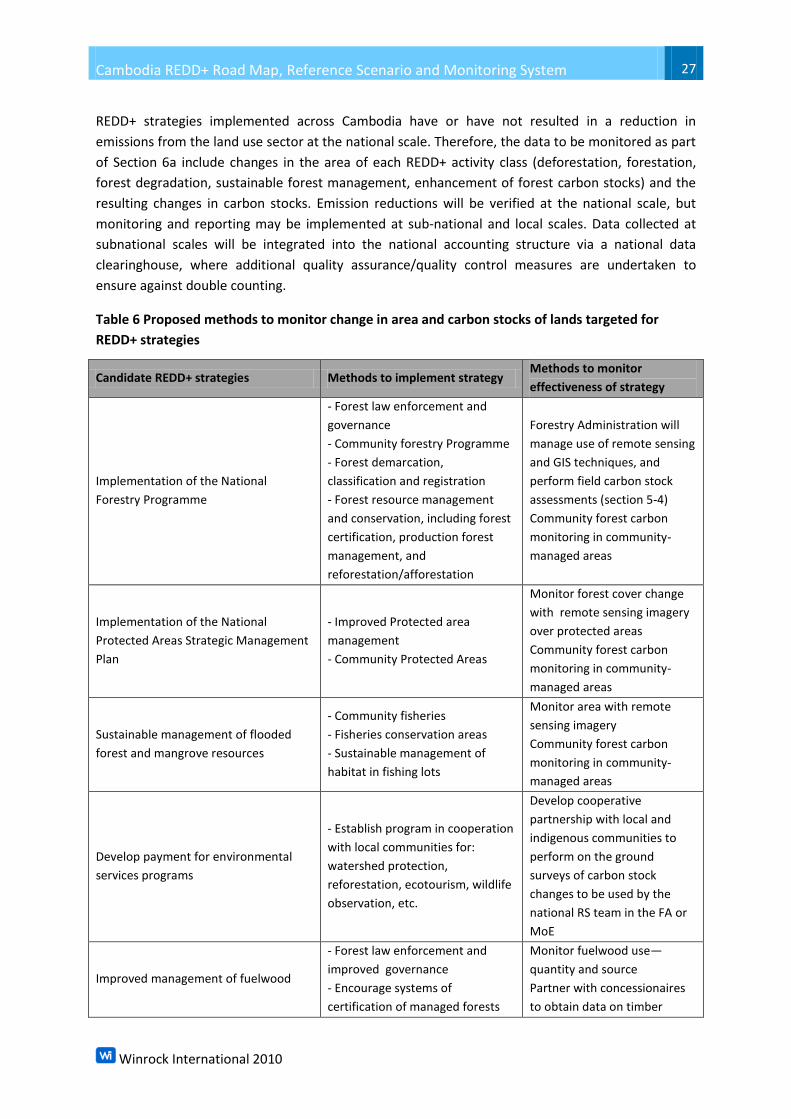
Although REDD+ strategies are still under discussion and agreements, Table 6 below indicates the
main lines on the ongoing discussion and methods and indicators that will be taken into account to
monitor the particular needs of candidate REDD+ intervention strategies going forward. We propose
that the essence of the MRV system will be to determine the degree to which the sum total of all
Cambodia REDD+ Road Map, Reference Scenario and Monitoring System 27
Winrock International 2010
REDD+ strategies implemented across Cambodia have or have not resulted in a reduction in
emissions from the land use sector at the national scale. Therefore, the data to be monitored as part
of Section 6a include changes in the area of each REDD+ activity class (deforestation, forestation,
forest degradation, sustainable forest management, enhancement of forest carbon stocks) and the
resulting changes in carbon stocks. Emission reductions will be verified at the national scale, but
monitoring and reporting may be implemented at sub-national and local scales. Data collected at
subnational scales will be integrated into the national accounting structure via a national data
clearinghouse, where additional quality assurance/quality control measures are undertaken to
ensure against double counting.
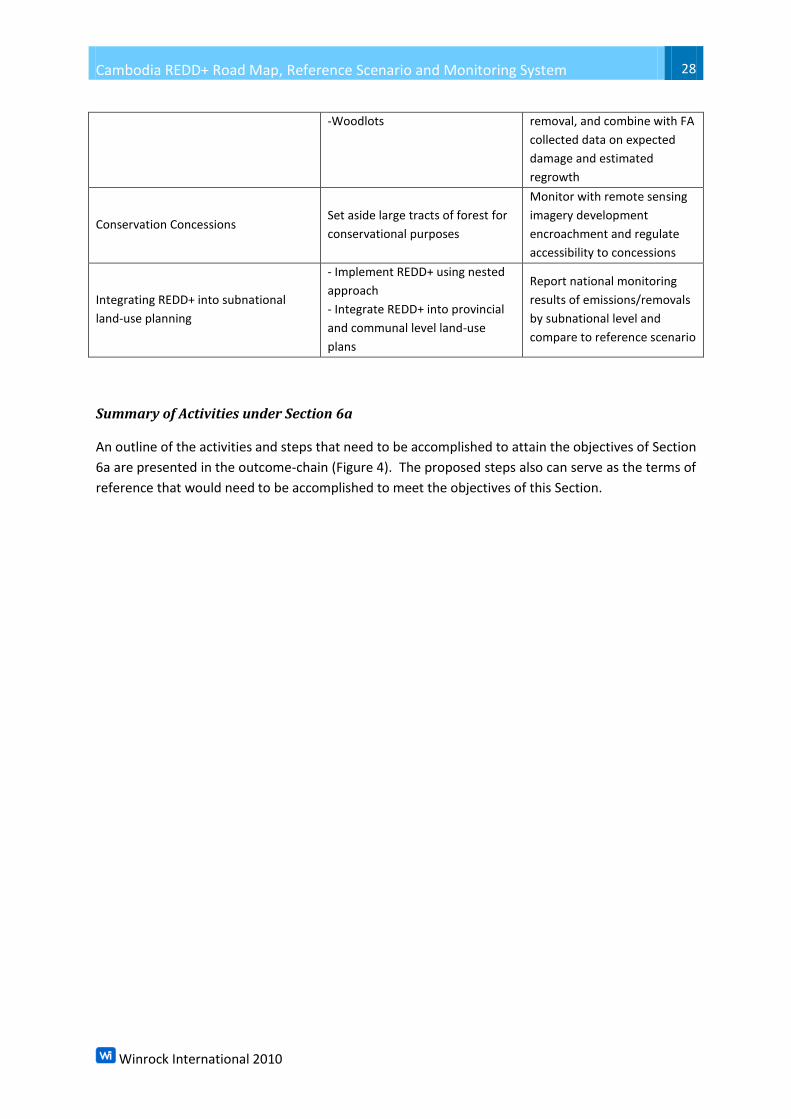
Table 6 Proposed methods to monitor change in area and carbon stocks of lands targeted for
REDD+ strategies
Candidate REDD+ strategies Methods to implement strategy Methods to monitor
effectiveness of strategy
Implementation of the National
Forestry Programme
- Forest law enforcement and
governance
- Community forestry Programme
- Forest demarcation,
classification and registration
- Forest resource management
and conservation, including forest
certification, production forest
management, and
reforestation/afforestation
Forestry Administration will
manage use of remote sensing
and GIS techniques, and
perform field carbon stock
assessments (section 5-4)
Community forest carbon
monitoring in community-
managed areas
Implementation of the National
Protected Areas Strategic Management
Plan
- Improved Protected area
management
- Community Protected Areas
Monitor forest cover change
with remote sensing imagery
over protected areas
Community forest carbon
monitoring in community-
managed areas
Sustainable management of flooded
forest and mangrove resources
- Community fisheries
- Fisheries conservation areas
- Sustainable management of
habitat in fishing lots
Monitor area with remote
sensing imagery
Community forest carbon
monitoring in community-
managed areas
Develop payment for environmental
services programs
- Establish program in cooperation
with local communities for:
watershed protection,
reforestation, ecotourism, wildlife
observation, etc.
Develop cooperative
partnership with local and
indigenous communities to
perform on the ground
surveys of carbon stock
changes to be used by the
national RS team in the FA or
MoE
Improved management of fuelwood
- Forest law enforcement and
improved governance
- Encourage systems of
certification of managed forests
Monitor fuelwood use—
quantity and source
Partner with concessionaires
to obtain data on timber
Cambodia REDD+ Road Map, Reference Scenario and Monitoring System 28
Winrock International 2010
-Woodlots removal, and combine with FA
collected data on expected
damage and estimated
regrowth
Conservation Concessions Set aside large tracts of forest for
conservational purposes
Monitor with remote sensing
imagery development
encroachment and regulate
accessibility to concessions
Integrating REDD+ into subnational
land-use planning
- Implement REDD+ using nested
approach
- Integrate REDD+ into provincial
and communal level land-use
plans
Report national monitoring
results of emissions/removals
by subnational level and
compare to reference scenario
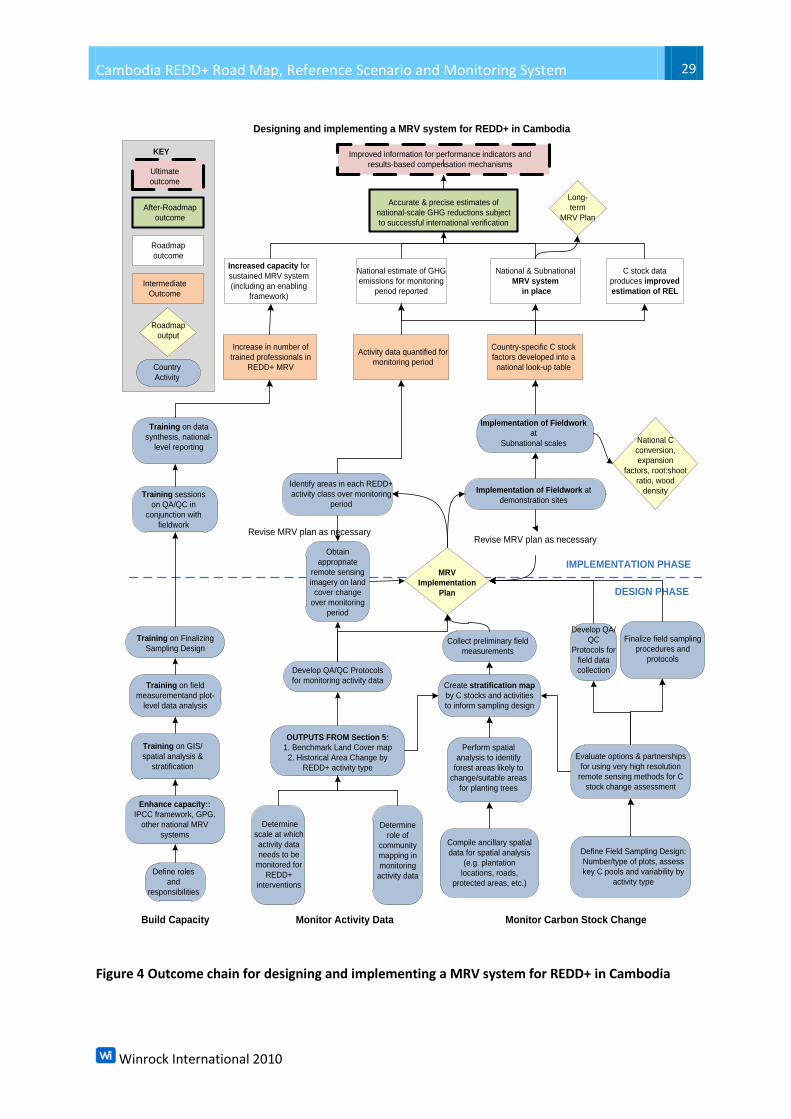
Summary of Activities under Section 6a
An outline of the activities and steps that need to be accomplished to attain the objectives of Section
6a are presented in the outcome-chain (Figure 4). The proposed steps also can serve as the terms of
reference that would need to be accomplished to meet the objectives of this Section.
Cambodia REDD+ Road Map, Reference Scenario and Monitoring System 29
Winrock International 2010
Accurate & precise estimates of
national-scale GHG reductions subject
to successful international verification
Designing and implementing a MRV system for REDD+ in Cambodia
Long-
term
MRV Plan
Improved information for performance indicators and
results-based compensation mechanisms
Define Field Sampling Design:
Number/type of plots, assess
key C pools and variability by
activity type
C stock data
produces improved
estimation of REL
National & Subnational
MRV system
in place
Increased capacity for
sustained MRV system
(including an enabling
framework)
Increase in number of
trained professionals in
REDD+ MRV
Training sessions
on QA/QC in
conjunction with
fieldwork
MRV
Implementation
Plan
Training on Finalizing
Sampling Design
Evaluate options & partnerships
for using very high resolution
remote sensing methods for C
stock change assessment
Collect preliminary field
measurements
Create stratification map
by C stocks and activities
to inform sampling design
Perform spatial
analysis to identify
forest areas likely to
change/suitable areas
for planting trees
Training on field
measurementand plot-
level data analysis
Enhance capacity::
IPCC framework, GPG.
other national MRV
systems
Determine
scale at which
activity data
needs to be
monitored for
REDD+
interventions
Country-specific C stock
factors developed into a
national look-up table
Implementation of Fieldwork at
demonstration sites
IMPLEMENTATION PHASE
DESIGN PHASE
Build Capacity Monitor Carbon Stock Change
Country
Activity
Roadmap
output
Intermediate
Outcome
Roadmap
outcome
After-Roadmap
outcome
Ultimate
outcome
KEY
Training on data
synthesis, national-
level reporting
Finalize field sampling
procedures and
protocols
Training on GIS/
spatial analysis &
stratification
Implementation of Fieldwork
at
Subnational scales
Develop QA/
QC
Protocols for
field data
collection
Compile ancillary spatial
data for spatial analysis
(e.g. plantation
locations, roads,
protected areas, etc.)
Obtain
appropriate
remote sensing
imagery on land
cover change
over monitoring
period
Revise MRV plan as necessary
Define roles
and
responsibilities
Monitor Activity Data
Identify areas in each REDD+
activity class over monitoring
period
National estimate of GHG
emissions for monitoring
period reported
Activity data quantified for
monitoring period
National C
conversion,
expansion
factors, root:shoot
ratio, wood
density
OUTPUTS FROM Section 5:
1. Benchmark Land Cover map
2. Historical Area Change by
REDD+ activity type
Determine
role of
community
mapping in
monitoring
activity data
Develop QA/QC Protocols
for monitoring activity data
Revise MRV plan as necessary
Figure 4 Outcome chain for designing and implementing a MRV system for REDD+ in Cambodia
Cambodia REDD+ Road Map, Reference Scenario and Monitoring System 30
Winrock International 2010
Description of Activities
Activity 6a-1. Define roles and responsibilities of various institutions in designing and
implementing the MRV system and develop a system for collaboration.
The roles and responsibilities for Section 6a are likely to be similar to those established in Section 5.
However, the role of local communities and local management authorities (protected areas, forestry
units, etc.) is likely to be more significant in Section 6a, because new data will need to be collected
going forward and therefore these stakeholders will be important for collecting information on both
area changes and carbon stock changes that are not detectable using remote sensing imagery, such
as activities related to reductions in the extent of degradation, improvements in use and
management of protected areas and protection forests, production forest areas, community forests
(CFs), community protected areas (CPAs), community fisheries (CFis), fishing lots, tree planting
activities outside forests, etc. The MRV/REL working group, especially FA, MoE and FiA
representatives, will need to compile the data collected at the local level and across the
communities. The identification of technologies commonly and widely used across the communities
to improve compilation and storing of this data must be assessed. For instance, the use of mobile
phones may be a form of collaboration among institutions and allow, by using a set of standard
operating procedures for data input, that information collected at the local level to be sent via text
message and be compiled and archived automatically using simple computer programming scripts.
This would automate and streamline the data collection process and provide a linkage between data
collected at project/sub-national scales and data compiled for the national monitoring system.
Activity 6a-2. Enhance capacity and training for various stakeholders involved in
monitoring.
Once roles and responsibilities are established by the REDD+ Taskforce, stakeholders engaged in
monitoring efforts will be trained in relevant methods for monitoring land cover changes and carbon
stock changes. Training will build on that gained during implementation of the steps to develop the
ReL and occur at multiple levels:
REDD+ Taskforce and REL/MRV working group: Engage with international experts to become
more familiar with other national MRV systems already in place. Through this process,
Cambodia will be able to apply lessons learned when developing and implementing an MRV
system. Carbon stock measurement teams will be formed at subntational level and will be
further trained (building on expertise attained during work on the REL Section) by experts in
plot-level measurement and data analysis. The FA, and MoE and FiA as appropriate, should
have high end capacity on RS/GIS in order to efficiently manage the MRV data achieve and
registry.
FA, MoE, FiA, Management Authorities for forested areas, and Department of Geography:
Staff will receive training on GIS/spatial analysis relevant to monitoring REDD+ activities,
including how to apply various land change models (e.g., GEOMOD, LCM, others) and how to
develop a field sampling design within a GIS.
Local communities (CFs, CFis, CPAs, indigenous communities): Will need training carbon
stock measurement and monitoring methods, including field plot measurement techniques
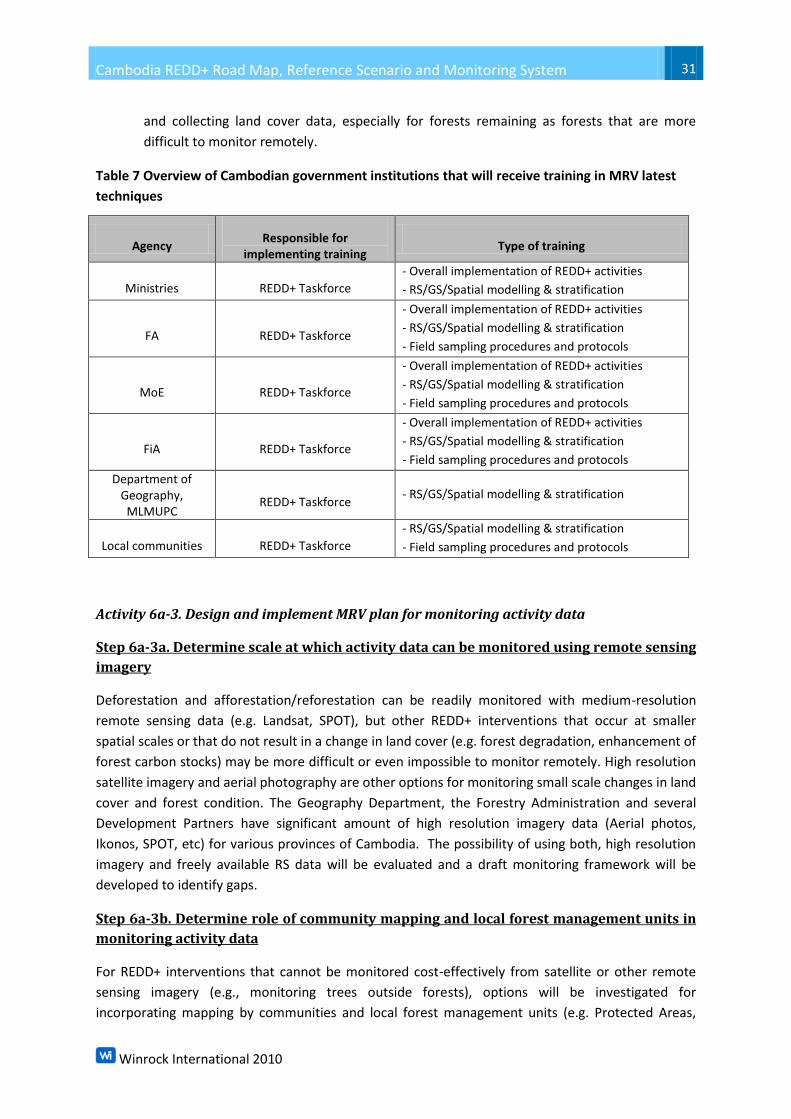
Cambodia REDD+ Road Map, Reference Scenario and Monitoring System 31
Winrock International 2010
and collecting land cover data, especially for forests remaining as forests that are more
difficult to monitor remotely.
Table 7 Overview of Cambodian government institutions that will receive training in MRV latest
techniques
Agency Responsible for
implementing training Type of training
Ministries REDD+ Taskforce
- Overall implementation of REDD+ activities
- RS/GS/Spatial modelling & stratification
FA REDD+ Taskforce
- Overall implementation of REDD+ activities
- RS/GS/Spatial modelling & stratification
- Field sampling procedures and protocols
MoE REDD+ Taskforce
- Overall implementation of REDD+ activities
- RS/GS/Spatial modelling & stratification
- Field sampling procedures and protocols
FiA REDD+ Taskforce
- Overall implementation of REDD+ activities
- RS/GS/Spatial modelling & stratification
- Field sampling procedures and protocols
Department of Geography, MLMUPC
REDD+ Taskforce - RS/GS/Spatial modelling & stratification
Local communities REDD+ Taskforce
- RS/GS/Spatial modelling & stratification
- Field sampling procedures and protocols
Activity 6a-3. Design and implement MRV plan for monitoring activity data
Step 6a-3a. Determine scale at which activity data can be monitored using remote sensing
imagery
Deforestation and afforestation/reforestation can be readily monitored with medium-resolution
remote sensing data (e.g. Landsat, SPOT), but other REDD+ interventions that occur at smaller
spatial scales or that do not result in a change in land cover (e.g. forest degradation, enhancement of
forest carbon stocks) may be more difficult or even impossible to monitor remotely. High resolution
satellite imagery and aerial photography are other options for monitoring small scale changes in land
cover and forest condition. The Geography Department, the Forestry Administration and several
Development Partners have significant amount of high resolution imagery data (Aerial photos,
Ikonos, SPOT, etc) for various provinces of Cambodia. The possibility of using both, high resolution
imagery and freely available RS data will be evaluated and a draft monitoring framework will be
developed to identify gaps.
Step 6a-3b. Determine role of community mapping and local forest management units in
monitoring activity data
For REDD+ interventions that cannot be monitored cost-effectively from satellite or other remote
sensing imagery (e.g., monitoring trees outside forests), options will be investigated for
incorporating mapping by communities and local forest management units (e.g. Protected Areas,
Cambodia REDD+ Road Map, Reference Scenario and Monitoring System 32
Winrock International 2010
Protected Forests) into the monitoring framework. For local mapping activities a sampling
methodology, sampling design and QA/QC protocols will need to be developed during the design
phase and incorporated into the final MRV Implementation Plan.
Step 6a-3c. Decide on scale for remote-sensing based area change based on cost-benefit
analysis
Some area changes are easy to measure and result in large changes in carbon stocks (e.g.,
deforestation) while others involve much more intensive measurement and may not result in large
emissions (or emission reductions). Prior to finalizing methods for monitoring land cover change at
various scales, pilot areas will be monitored to evaluate the costs of monitoring small changes and a
cost-benefit analysis (costs of monitoring vs. carbon benefits generated) will be conducted. Based on
the analysis of these pilot projects, a detailed description on how to perform MRV in different scales
will be formulated.
Step 6a-3d. Develop QA/QC procedures for monitoring activity data, test draft MRV plan
at demonstration sites and revise MRV plan as necessary
QA/QC procedures for monitoring area change will be developed including recommendations on
expected standards and methodologies for mapping rates of land cover change, as will methods for
addressing the use of different data sources through time for quantifying activity data. A description
of all decisions made and methods developed in steps 6-3a through d will be compiled into an initial
MRV implementation plan. (This plan will also include descriptions on carbon stock changes,
summarized in Activity 6a-4 below). The plan will be tested at demonstration sites and revised as
necessary to ensure that the finalized MRV plan is functional and high quality.
During future monitoring periods, an assessment will be made during this step of opportunities for
using the most up-to-date satellite-based or airborne-based methodologies for improved monitoring
of performance of REDD+ activities at the national to regional scales and the MRV plan will be
revised as necessary.
Step 6a-3e. Obtain appropriate data on area change over monitoring period
The MRV implementation plan, including collection of activity data and data on carbon stock
changes, will be tested in demonstration sites and modified to adjust the plan as necessary to
account for lessons learned. After this initial testing phase, appropriate data (including remote
sensing data as well as other data collected by local communities as applicable) will be collected
during each monitoring period.
Step 6a-3f. Divide activity data by each REDD+ activity class over monitoring period
Once activity data have been collected for the monitoring period, these data will be analyzed and
broken down by the areas in each REDD+ activity class (deforestation, forest degradation,
afforestation/reforestation, sustainable forest management, enhancement of forest carbon stocks)
so that the area data can be combined with emission/removal factors developed in Activity 6a-4
below.
Cambodia REDD+ Road Map, Reference Scenario and Monitoring System 33
Winrock International 2010
Activity 6a-4. Design and implement MRV plan for monitoring carbon stock changes.
Step 6a-4a. Stratification of land area to be monitored
Although national forest inventories are useful for many purposes, it is proposed that not all lands
need to be monitored as part of an MRV system for REDD+, because monitoring lands that do not
undergo changes in land cover and/or changes in carbon stocks over the monitoring period – and
therefore do not generate carbon benefits – would be resources poorly spent. Instead, it is proposed
to stratify the land area to be monitored by potential REDD+ activity and potential change in carbon
stocks.
Outputs from Section 5 (benchmark land cover map and historical area change by REDD+ activity
type) will be needed to inform this stratification process. Combining historical area changes
(deforestation, afforestation/reforestation, forest degradation, improved forest management, areas
undergoing carbon stock enhancement) with other ancillary data that provide information about the
likelihood of future changes will allow the identification of currently forested areas that are under
threat of deforestation and forest degradation or that could undergo sustainable forest
management or carbon stock enhancement, as well as the identification of currently non-forested
areas that that are suitable for supporting tree cover. Such ancillary data could include, but are not
limited to, biophysical data such as elevation, rainfall, slope, soil type, etc. as well as data related to
how people use lands, such as locations of existing forest plantations, charcoal-producing regions,
roads, protected areas, previously burned areas, forest communities, areas under agricultural
production, etc. It is planned to use geospatial analysis and geospatial modelling to combine these
data layers together to identify which areas within Cambodia are most suitable for each proposed
REDD+ intervention. Monitoring intensity and type will strongly depend on the deforestation threat
and type of REDD+ intervention.
Step 6a-4b. Develop draft field sampling design
The stratification map will be used to inform the sampling design for carbon stock assessment. This
will be based on the protocols and sampling design used in Section 5 for the historic emissions.
Additional design considerations (additional to historic emissions work) will include the timing and
frequency of different types of measurements (e.g., which measurements must occur up front vs.
through time and which measurements must be collected once vs. once per monitoring period vs.
once per year, etc.), Standard operating procedures developed for the historic emissions work
(section 5) for all field measurements will be revised as needed and incorporated into the MRV
Implementation Plan.
Step 6a-4c. Evaluate options and partnerships for using very high resolution remote
sensing methods for carbon stock change assessment
High resolution remote sensing methods have emerged recently to map and monitor indicators of
forest degradation such as logging roads, fire scars and other forest canopy damages, and secondary
forest recovery. In addition, high resolution, airborne imagery has been used in combination with
Cambodia REDD+ Road Map, Reference Scenario and Monitoring System 34
Winrock International 2010
satellite imagery to estimate forest carbon stock changes over large areas25. The approach enables
high resolution monitoring of forest cover and disturbance to estimate carbon emissions. This option
for using state-of-the art methods for assessing carbon stock changes will be evaluated by the
REL/MRV Working Group when making final decisions on sampling design.
Step 6a-4d. Collect preliminary field measurements, finalize sampling plan and
incorporate into draft MRV Implementation Plan
Preliminary field measurements will be collected in each stratum to determine the number of plots
that will likely be necessary to achieve desired accuracy and precision targets for measuring carbon
stock changes. A description of all decisions made and methods developed in steps 6-4 a through c
will be compiled into an initial MRV implementation plan.
Step 6a-4e. Test draft MRV Implementation plan at demonstration sites and revise MRV
plan as necessary
The full MRV plan (that includes monitoring activity data and carbon stock changes) will be tested at
demonstration sites (locations to be determined after REDD+ interventions are implemented) and
revised as necessary to ensure that the finalized MRV plan is functional and of high quality. The
monitoring system will ultimately allow for national-scale, (but reportable at sub-national scales),
annual to bi-annual reporting of GHG reductions achieved as compared to the reference scenario.
During future monitoring periods, an assessment will be made during this step of opportunities for
using the most up-to-date methodologies for improved monitoring of performance of REDD+
activities at the national to regional scales and the MRV plan will be revised as necessary. After this
initial testing phase, appropriate carbon stock data will be collected during each monitoring period
at sub-national scales.
Select members of line agencies, Cambodian forest communities (CFs, CPAs, CFis, indigenous
communities, etc.), local forest management units (Protected Areas, Protected Forests, etc.) and
relevant private sector companies will be trained and engaged in future monitoring as appropriate.
These stakeholders will be identified early on by the REL/MRV Working Group in the MRV design
process so that they will be engaged from the outset.
Step 6a-4f. Develop national values for key default parameters
Once carbon stock data have been collected at sub-national scales, the data will be used to develop
sub-national and/or national-level values such as carbon conversion factors, biomass expansion
factors (if applicable), allometric equations for biomass estimation, root:shoot ratios, wood density,
etc. These values will be compiled into one table so that calculations associated with monitoring will
be able to be performed transparently, quickly and efficiently.
25 Asner, GP. 2009. Tropical forest carbon assessment: integrating satellite and airborne mapping
approaches. Environmental Research Letters 4: 034009.
Cambodia REDD+ Road Map, Reference Scenario and Monitoring System 35
Winrock International 2010
Step 6a-4g. Compile sub-national database of emission/removal factors
Activity data for each REDD+ activity class (deforestation, forest degradation, afforestation and
reforestation, sustainable forest management, enhancement of carbon stocks) must be paired with
a corresponding emission or removal factor to calculate total emissions or removals. Therefore, the
carbon stock data collected within each stratum will be compiled into a sub-national database
(“lookup table”) of emission and removal factors (t CO2/ha) by REDD+ activity class that can be used
with activity data to quickly estimate emissions or removals across all REDD+ activity types.
Activity 6a-5. Report national estimate of GHG emissions during monitoring period and
subject this estimate to international verification
In this activity, the outcome of the monitoring system will be synthesized and compared against the
reference scenario to provide timely reporting of emissions/removals for REDD+ activities. The MRV
implementation plan will be developed to allow for complete transparency so as to be open for
verification and peer review.
6b. Monitoring of Other Benefits and Impacts
Background
Section 6b outlines a monitoring and reporting system for social, environment and other impacts of
increased forest cover resulting from implementation of REDD+ activities. Increased forest cover will
also protect soils from erosion, increase biodiversity, and provide timber and fuel for local
communities.
REDD+ strategies to reduce deforestation and degradation will have substantial social and
environmental impacts beyond climate change and carbon accumulation. Those impacts will be felt
at the national level (for example through improved water supply, quality and electricity) and at local
levels (for example through maintenance of forest areas and the resources they provide) and at
various levels in between through other benefits such as jobs related to the forest industry, forest
based tourism, etc. Some individuals or groups may be negatively impacted by the proposed REDD+
strategies and these impacts must also be identified and mitigated. For example, stopping
agricultural encroachment and expanding the forest area will leave less land available for food crop
production, while addressing unsustainable use of forests will reduce the quantities of forest
products available for harvest in the short term. These social and environmental and other impacts
of the REDD+ strategies will be monitored.
Section 6b builds on the Strategic Environmental and Social Assessment (SESA) prepared in the
Roadmap Implementation Framework (Roadmap Section 4). It will put into place a monitoring
methodology framework for environmental, socio-economic and governance components.
Activity 6b-1. Environmental Monitoring
The outputs of the SESA will be used to gather the relevant data. This will include defining
biodiversity indicators, and creating a biodiversity monitoring system using indicators of a
recognized standard, e.g. IUCN RED List. The monitoring system will use existing site-based
biodiversity and species monitoring programs established in protected areas and other forest
Cambodia REDD+ Road Map, Reference Scenario and Monitoring System 36
Winrock International 2010
management units by conservation projects throughout Cambodia. The stakeholders responsible for
such monitoring will be identified by the REL/MRV Working Group, and the existing capacities and
resources will be examined and the capacity and resource needs established.
Activity 6b-2. Socio-economic Monitoring
The socio-economic impact of the REDD+ Strategy on local forest-dependent and rural communities
on employment, poverty reduction, health, education, gender, and food security according to
existing indices (e.g. Human Development Index) will be monitored. The monitoring system
developed will assess the distribution of costs and benefits for implementation of REDD+ activities.
The stakeholders responsible for such monitoring will be identified. The existing capacities and
resources will be examined and the capacity and resource needs established.
Activity 6b-3. Governance Monitoring
Limited institutional capacity, scarcity of resource, illegal forest logging, and forestland clearing were
identified as the major drivers of deforestation and degradation and a number of candidate
strategies are proposed to address this. Improved governance measures to enforce local regulations
and support programs are considered essential to ensure the other measures have a lasting impact.
Monitoring the impact of governance measures requires assessment of the governance measures
and an assessment of their impact on carbon accumulation.
The performance of implementation of REDD-specific governance bodies will be monitored along
with the enforcement of laws relating to forest governance in respect of transparency and
accountability, quality of and respect for procedures and preventive measures against corruption.
The methods used to ensure free prior and informed consent will be assessed and indicators
developed including meeting minutes, meeting attendance list of various stakeholders, resolutions,
work plans and activity reports.
Table 2 Summary of Monitoring Activities and Budget
Activity Estimated Cost
2011 2012 2013 Total
Design the M&E plan for other benefits
and impacts
Assess capacities and resources and build
capacity
Select indicators and collect baseline data
Total
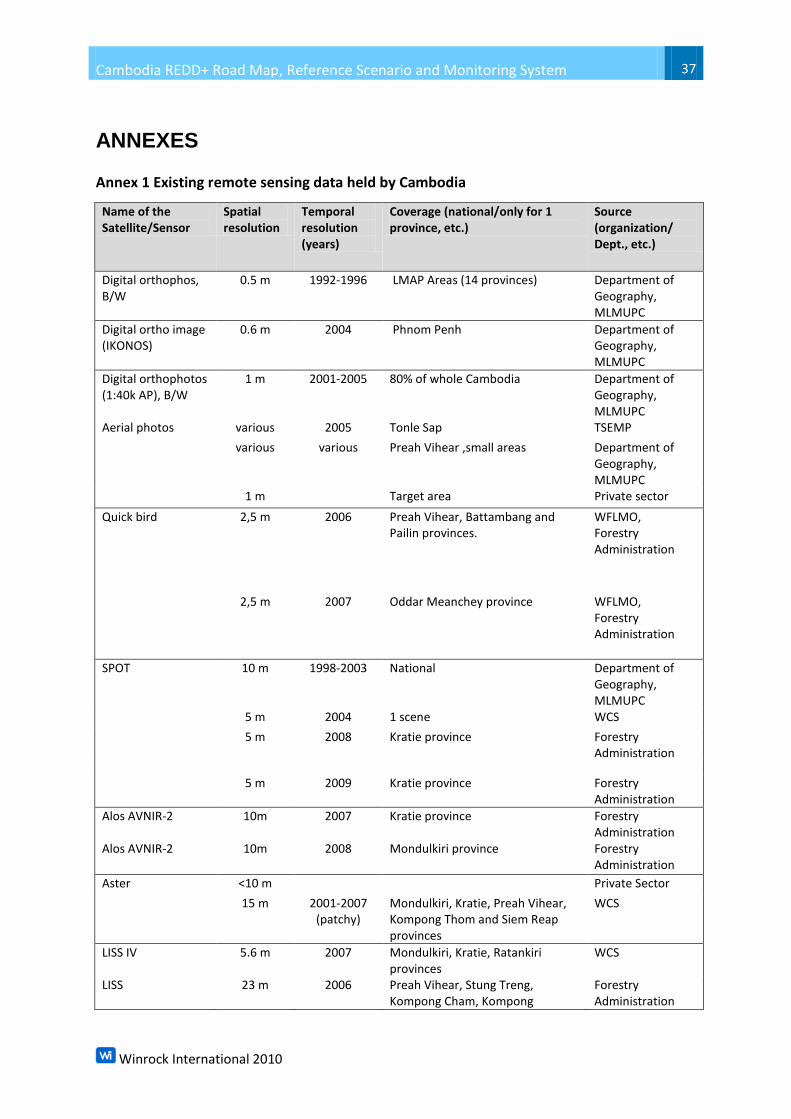
Cambodia REDD+ Road Map, Reference Scenario and Monitoring System 37
Winrock International 2010
ANNEXES
Annex 1 Existing remote sensing data held by Cambodia
Name of the Satellite/Sensor
Spatial resolution
Temporal resolution (years)
Coverage (national/only for 1 province, etc.)
Source (organization/ Dept., etc.)
Digital orthophos, B/W
0.5 m 1992-1996 LMAP Areas (14 provinces) Department of Geography, MLMUPC
Digital ortho image (IKONOS)
0.6 m 2004 Phnom Penh Department of Geography, MLMUPC
Digital orthophotos (1:40k AP), B/W
1 m 2001-2005 80% of whole Cambodia Department of Geography, MLMUPC
Aerial photos various 2005 Tonle Sap TSEMP
various various Preah Vihear ,small areas Department of Geography, MLMUPC
1 m Target area Private sector
Quick bird 2,5 m 2006 Preah Vihear, Battambang and Pailin provinces.
WFLMO, Forestry Administration
2,5 m 2007 Oddar Meanchey province WFLMO, Forestry Administration
SPOT 10 m 1998-2003 National Department of Geography, MLMUPC
5 m 2004 1 scene WCS
5 m 2008 Kratie province Forestry Administration
5 m 2009 Kratie province Forestry Administration
Alos AVNIR-2 10m 2007 Kratie province Forestry Administration
Alos AVNIR-2 10m 2008 Mondulkiri province Forestry Administration
Aster <10 m Private Sector
15 m 2001-2007 (patchy)
Mondulkiri, Kratie, Preah Vihear, Kompong Thom and Siem Reap provinces
WCS
LISS IV 5.6 m 2007 Mondulkiri, Kratie, Ratankiri provinces
WCS
LISS 23 m 2006 Preah Vihear, Stung Treng, Kompong Cham, Kompong
Forestry Administration
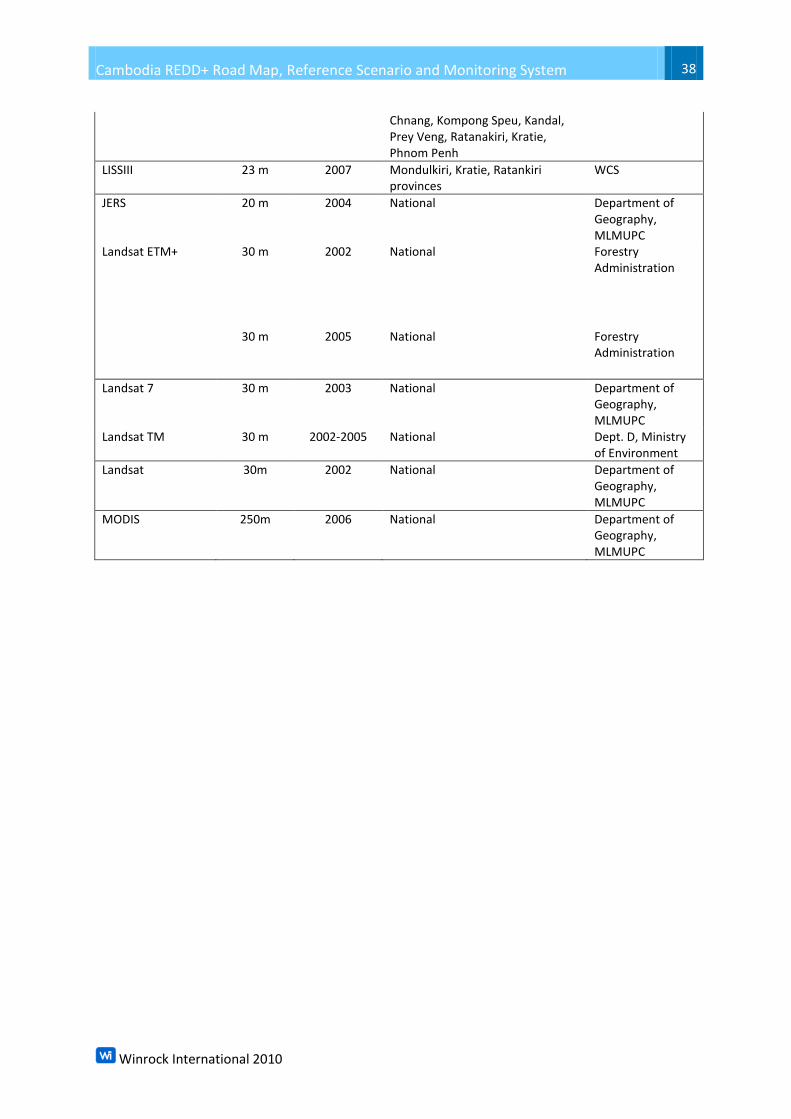
Cambodia REDD+ Road Map, Reference Scenario and Monitoring System 38
Winrock International 2010
Chnang, Kompong Speu, Kandal, Prey Veng, Ratanakiri, Kratie, Phnom Penh
LISSIII 23 m 2007 Mondulkiri, Kratie, Ratankiri provinces
WCS
JERS 20 m 2004 National Department of Geography, MLMUPC
Landsat ETM+ 30 m 2002 National Forestry Administration
30 m 2005 National Forestry Administration
Landsat 7 30 m 2003 National Department of Geography, MLMUPC
Landsat TM 30 m 2002-2005 National Dept. D, Ministry of Environment
Landsat 30m 2002 National Department of Geography, MLMUPC
MODIS 250m 2006 National Department of Geography, MLMUPC
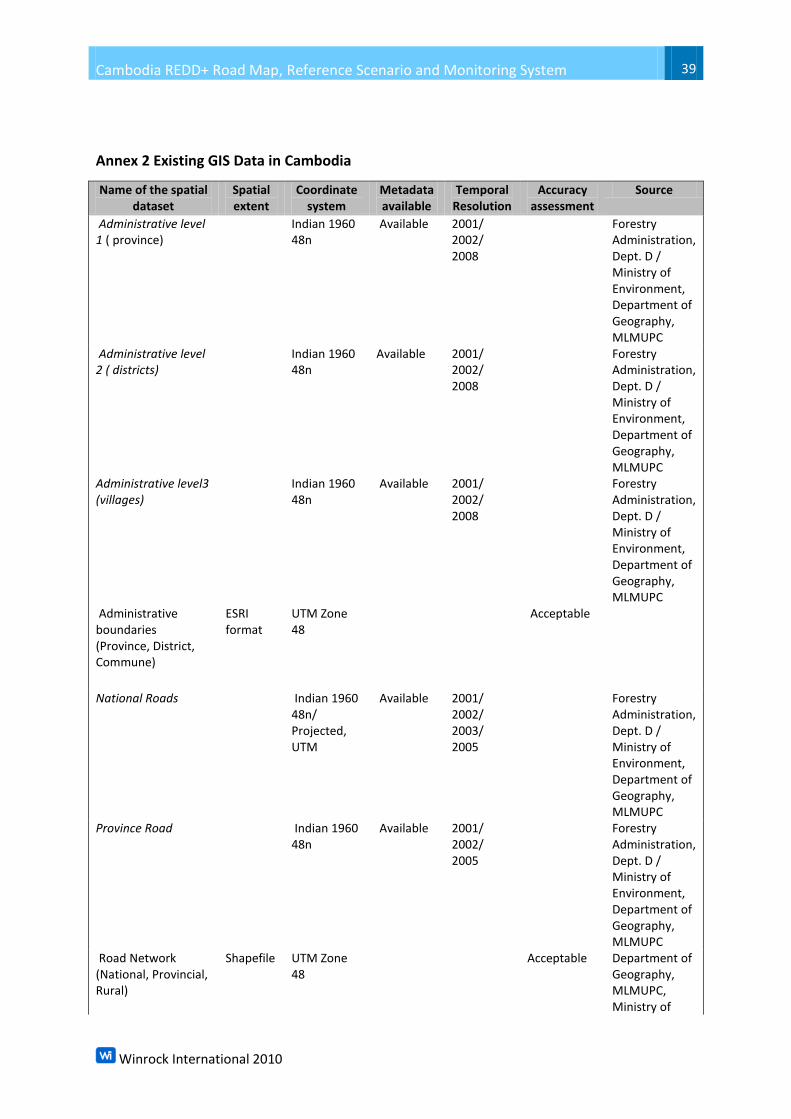
Cambodia REDD+ Road Map, Reference Scenario and Monitoring System 39
Winrock International 2010
Annex 2 Existing GIS Data in Cambodia
Name of the spatial dataset
Spatial extent
Coordinate system
Metadata available
Temporal Resolution
Accuracy assessment
Source
Administrative level 1 ( province)
Indian 1960 48n
Available 2001/ 2002/ 2008
Forestry Administration, Dept. D / Ministry of Environment, Department of Geography, MLMUPC
Administrative level 2 ( districts)
Indian 1960 48n
Available 2001/ 2002/ 2008
Forestry Administration, Dept. D / Ministry of Environment, Department of Geography, MLMUPC
Administrative level3 (villages)
Indian 1960 48n
Available 2001/ 2002/ 2008
Forestry Administration, Dept. D / Ministry of Environment, Department of Geography, MLMUPC
Administrative boundaries (Province, District, Commune)
ESRI format
UTM Zone 48
Acceptable
National Roads Indian 1960 48n/ Projected, UTM
Available 2001/ 2002/ 2003/ 2005
Forestry Administration, Dept. D / Ministry of Environment, Department of Geography, MLMUPC
Province Road Indian 1960 48n
Available 2001/ 2002/ 2005
Forestry Administration, Dept. D / Ministry of Environment, Department of Geography, MLMUPC
Road Network (National, Provincial, Rural)
Shapefile UTM Zone 48
Acceptable Department of Geography, MLMUPC, Ministry of
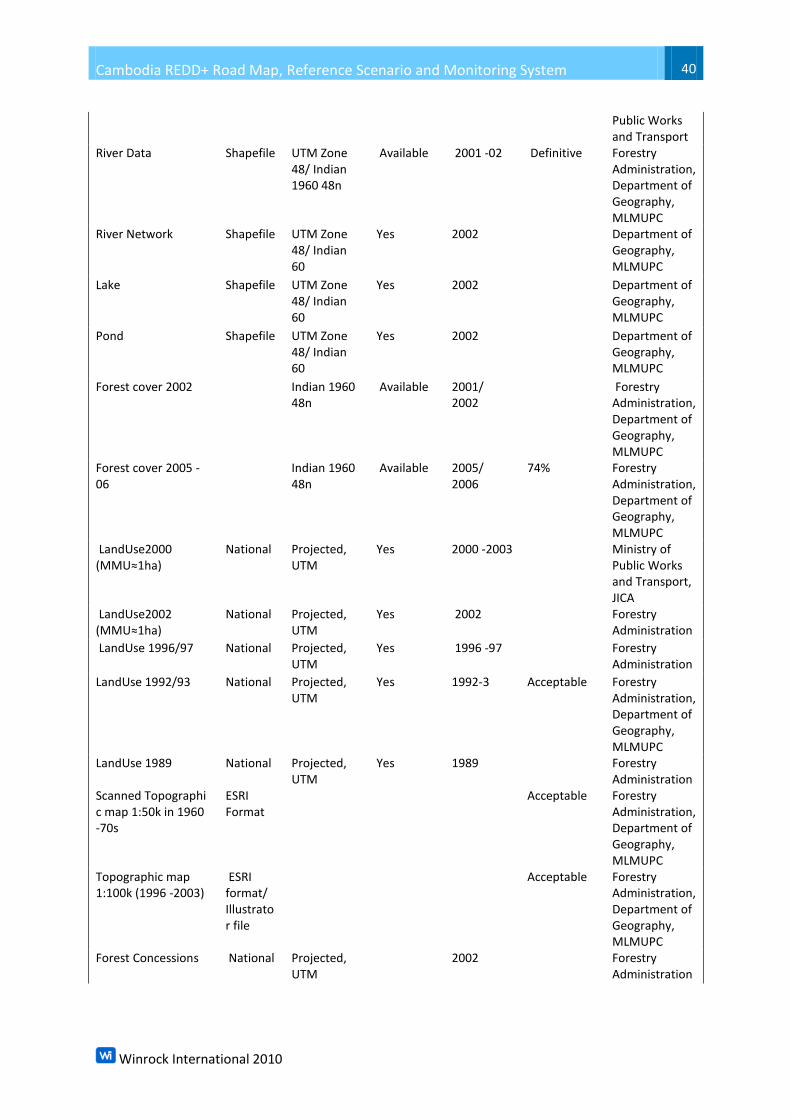
Cambodia REDD+ Road Map, Reference Scenario and Monitoring System 40
Winrock International 2010
Public Works and Transport
River Data Shapefile UTM Zone 48/ Indian 1960 48n
Available 2001 -02 Definitive Forestry Administration, Department of Geography, MLMUPC
River Network Shapefile UTM Zone 48/ Indian 60
Yes 2002 Department of Geography, MLMUPC
Lake Shapefile UTM Zone 48/ Indian 60
Yes 2002 Department of Geography, MLMUPC
Pond Shapefile UTM Zone 48/ Indian 60
Yes 2002 Department of Geography, MLMUPC
Forest cover 2002 Indian 1960 48n
Available 2001/ 2002
Forestry Administration, Department of Geography, MLMUPC
Forest cover 2005 -06
Indian 1960 48n
Available 2005/ 2006
74% Forestry Administration, Department of Geography, MLMUPC
LandUse2000 (MMU≈1ha)
National Projected, UTM
Yes 2000 -2003 Ministry of Public Works and Transport, JICA
LandUse2002 (MMU≈1ha)
National Projected, UTM
Yes 2002 Forestry Administration
LandUse 1996/97 National Projected, UTM
Yes 1996 -97 Forestry Administration
LandUse 1992/93 National Projected, UTM
Yes 1992-3 Acceptable Forestry Administration, Department of Geography, MLMUPC
LandUse 1989 National Projected, UTM
Yes 1989 Forestry Administration
Scanned Topographic map 1:50k in 1960 -70s
ESRI Format
Acceptable Forestry Administration, Department of Geography, MLMUPC
Topographic map 1:100k (1996 -2003)
ESRI format/ Illustrator file
Acceptable Forestry Administration, Department of Geography, MLMUPC
Forest Concessions National Projected, UTM
2002 Forestry Administration
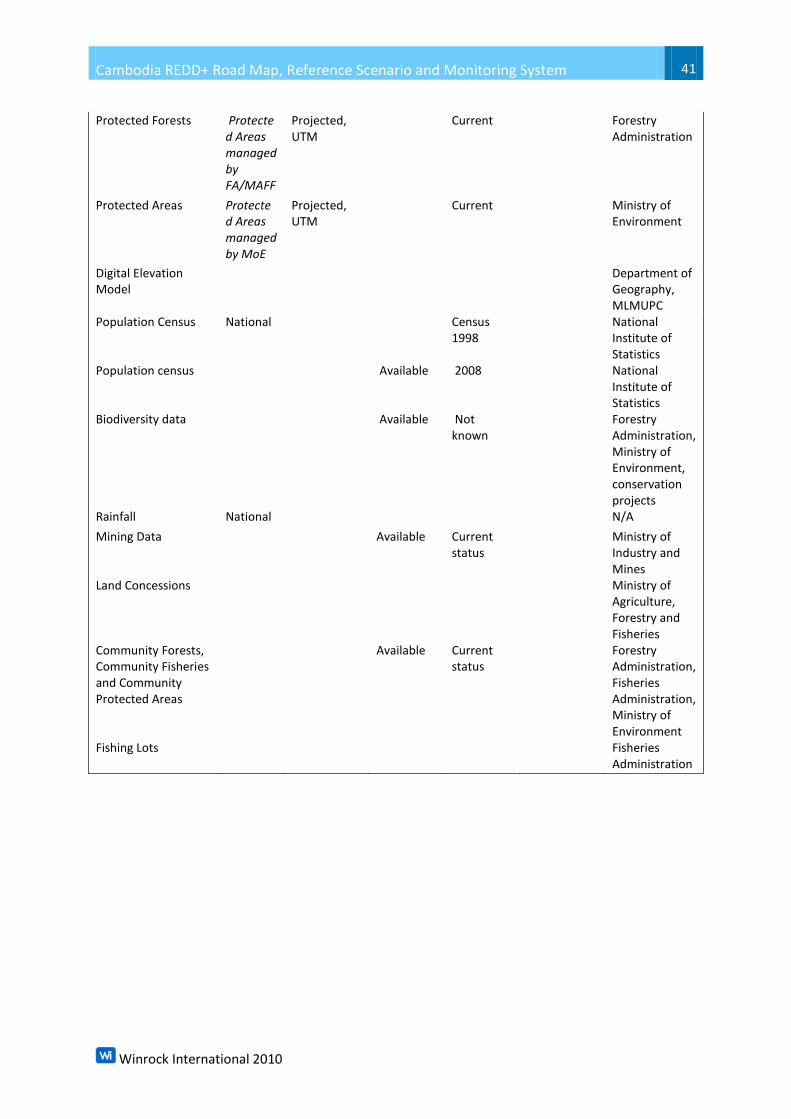
Cambodia REDD+ Road Map, Reference Scenario and Monitoring System 41
Winrock International 2010
Protected Forests Protected Areas managed by FA/MAFF
Projected, UTM
Current Forestry Administration
Protected Areas Protected Areas managed by MoE
Projected, UTM
Current Ministry of Environment
Digital Elevation Model
Department of Geography, MLMUPC
Population Census National Census 1998
National Institute of Statistics
Population census Available 2008 National Institute of Statistics
Biodiversity data Available Not known
Forestry Administration, Ministry of Environment, conservation projects
Rainfall National N/A
Mining Data Available Current status
Ministry of Industry and Mines
Land Concessions Ministry of Agriculture, Forestry and Fisheries
Community Forests, Community Fisheries and Community Protected Areas
Available Current status
Forestry Administration, Fisheries Administration, Ministry of Environment
Fishing Lots Fisheries Administration