Embed Size (px)
Citation preview

Calibration issues for the CALICE 1m3 AHCAL
LCWS11 - International Workshop on Future Linear Colliders
Granada, Spain 2011/9/28
Jaroslav ZalesakInstitute of Physics, Prague
• Equalization of the cell response in AHCAL• MIP & Gain & Saturation of SiPMs• Validation of the AHCAL calibration
Jaroslav Zalesak, Institute of Physics, Prague LCWS11 in Granada, Sep 28, 2011 2
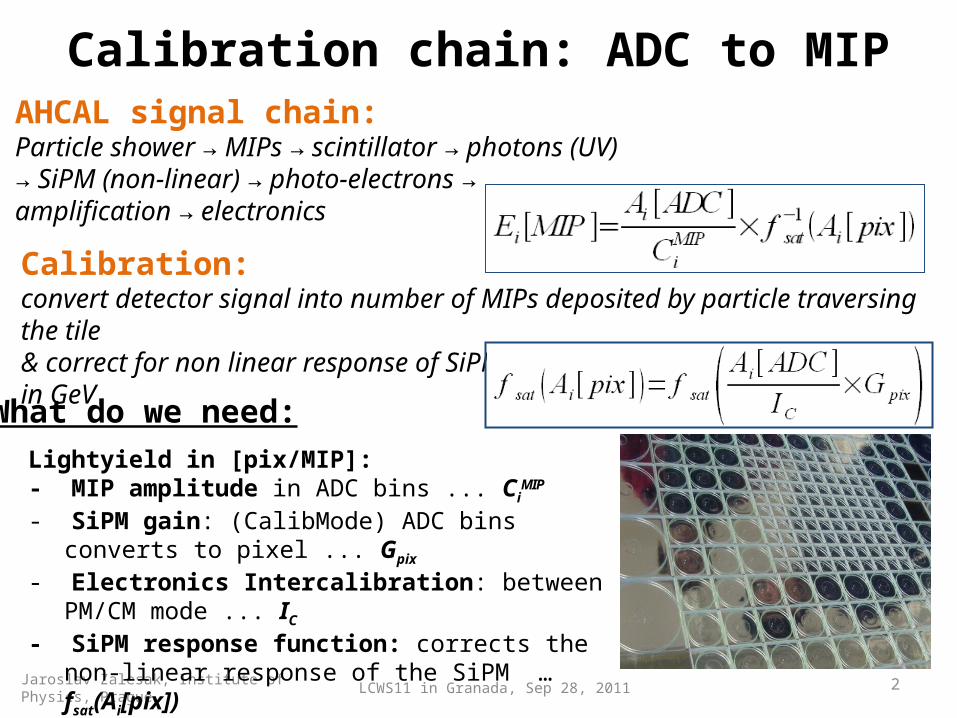
Calibration chain: ADC to MIP
What do we need:Lightyield in [pix/MIP]:- MIP amplitude in ADC bins ... Ci
MIP
- SiPM gain: (CalibMode) ADC bins converts to pixel ... Gpix
- Electronics Intercalibration: between PM/CM mode ... IC
- SiPM response function: corrects the non-linear response of the SiPM … fsat(Ai[pix])
AHCAL signal chain:Particle shower → MIPs → scintillator → photons (UV)→ SiPM (non-linear) → photo-electrons → amplification → electronics
Calibration:convert detector signal into number of MIPs deposited by particle traversing the tile& correct for non linear response of SiPM & scale vis. MIP to tot. dep. energy in GeV

LCWS11 in Granada, Sep 28, 2011
Cell response equalization with MIP
Jaroslav Zalesak, Institute of Physics, Prague 3
Using muon signalm track in HCAL
Using pion showerselect MIP stubs using the high granularity of the HCAL
Luminosity requirement for in-situ calibration with MIP stabs from jets (ILC detector)
more statistics obtained from Z0 mm events
1 MIP ↔ ~13 pixels

LCWS11 in Granada, Sep 28, 2011
MIP calibration
Jaroslav Zalesak, Institute of Physics, Prague 4
Calibration obtained at CERN with ~2 M muon events (80 GeV)- broad muon beam covering the whole 1x1 m2 calorimeter face- minimum 500 events required for a good fit (G L) in one cell
MIP detection efficiency above 0.5*MIP threshold ~ 93%
Signal to noise ratio ~10
MIP error uncertainty (coming mainly from fits) is 2% of energy scale

LCWS11 in Granada, Sep 28, 2011Jaroslav Zalesak, Institute of Physics, Prague 5
AHCAL layer (1CMB=12LEDs) = 216 tiles
SiPM response is non-linearRedundant calibration system delivers:• Low intensity light for SiPM Gain calibration• High intensity of light for saturation monitoring• Medium intensity light for electronics intercalibration
Light intensity for 7608 channels within factor 2 > 94% calibration efficiency on full calorimeter
Importance of monitoring/calibration

LCWS11 in Granada, Sep 28, 2011
SiPM gain calibration
Jaroslav Zalesak, Institute of Physics, Prague 6
Efficiency (#ch. calibrated): CERN 96%, FNAL 97% Mainly quality of LED system
• Gain extracted from a multi-Gaussian fit to LED calibration data ~15 min data taking necessary for one gain scan• Repeated ~every 6-8h during data taking
Uncertainty on Gain determination (mainly due to fit) is ~2% for good cells

LCWS11 in Granada, Sep 28, 2011 7Jaroslav Zalesak, Institute of Physics, Prague
ASIC mode inter-calibration• values for 94% of all channels (6-13)• ≈ 4% of channels failed due to problems
with the CMB hardware• ≈ 2% dead channels• method efficiency near 100%
• stability: 2% RMS over data taking period stability & efficiency better later (FNAL)
CM mode
PM mode
IC coefficient uncertainty is better than 1 %

LCWS11 in Granada, Sep 28, 2011
Temperature and voltage dependence
Jaroslav Zalesak, Institute of Physics, Prague 8
• SiPMs (operated in Geiger mode): Gain G, Geiger efficiency ε• G, ε (Ubias – Ubd) O(2%/100mV)• Ubd → T G, ε (-T) -1.7%/K• Muons response AMIP ε G ) -3.7%/K Compensation of Temperature Changes (HV Adjustment, approx. 100mV / 2K) compensate the effect of T increase (increase of Ubd) by increasing the bias voltage (increase of DU)Price to pay: increase of noise above threshold

LCWS11 in Granada, Sep 28, 2011
Temperature variations at TB
Jaroslav Zalesak, Institute of Physics, Prague 9
gradient along the calorimeter length gradient across a module (<0.5 deg)
data samples variations
Important point for a ILC detector: cell equalization (with muon) cannot be repeated in situ test beam calibration can be ported to the ILC detector what about correction of long term T fluctuation (if any)?

Jaroslav Zalesak, Institute of Physics, Prague LCWS11 in Granada, Sep 28, 2011 10
MIP &Gain T&V dependence
MIP (T)
Gain (T)Gain (V)
1/G dG/U = 2%/100mV 1/G dG/dT = -1.7%/K

Jaroslav Zalesak, Institute of Physics, Prague LCWS11 in Granada, Sep 28, 2011 11
Calibration (MIP scale) transfer
T=4.5K, Difference before -10.8%, after +4.2% Still MIP energy scale shift down by 4% Remaining offset cannot be explained by different muon beam energy (80x32Gev) still under investigation: • Different reference values affect 1/Mip dMip/dX , X={T,U}• Nonlinearity in change of photon detection efficiency dM/dT=dG/dT+dEff/dT (saturation) → level of ~5% for comparison data FNAL vs CERN (@MIP scale)
CERNFNAL CERN
FNAL temp corr.

LCWS11 in Granada, Sep 28, 2011 12Jaroslav Zalesak, Institute of Physics, Prague
Saturation curves for single SiPMshould be universal…BUT: Disagreement between ITEP (bare SiPM) and in-situ (on-tile) measurement
Not all pixels illuminated by WLS light! Ratio of geometrical area it is expected that only 78.5 % of the SiPM area (square) is illuminated by the WLF fiber different number of dead pixels in each SiPM could change this number
→ determination saturation factor for each channel separately• extract saturation factor for all channels • apply calibration to pixels & temp corrections • averaged over all runs → consistent results?
test-bench response curve @ITEP
Saturation curvesTotal number of pixels in a SiPM = 1156

LCWS11 in Granada, Sep 28, 2011 13Jaroslav Zalesak, Institute of Physics, Prague
Saturation: temperature correction
Temperature corr.
Temperature correction works well
Efficiency 97% in TB data period 75% (5524 of 7406) channels vary by less 3% of RMS over all data taking time
Pixels Tcorr Pixels
RMS/Npix in %per channel

LCWS11 in Granada, Sep 28, 2011 14Jaroslav Zalesak, Institute of Physics, Prague
Saturation: FNAL versus CERN
% of Tcorr Pixel / 1156
Good correlation between saturation point extracted from CERN and FNAL data Temperature correction cancels the differences in mean. Both data sets shows average effective number of pixels at a level of 80% of phys. number (w/ RMS ~ 7%) Distribution (lab vs in-situ) Nmount/Nbare gives 80.5%, with RMS 9%
Jaroslav Zalesak, Institute of Physics, Prague LCWS11 in Granada, Sep 28, 2011 15
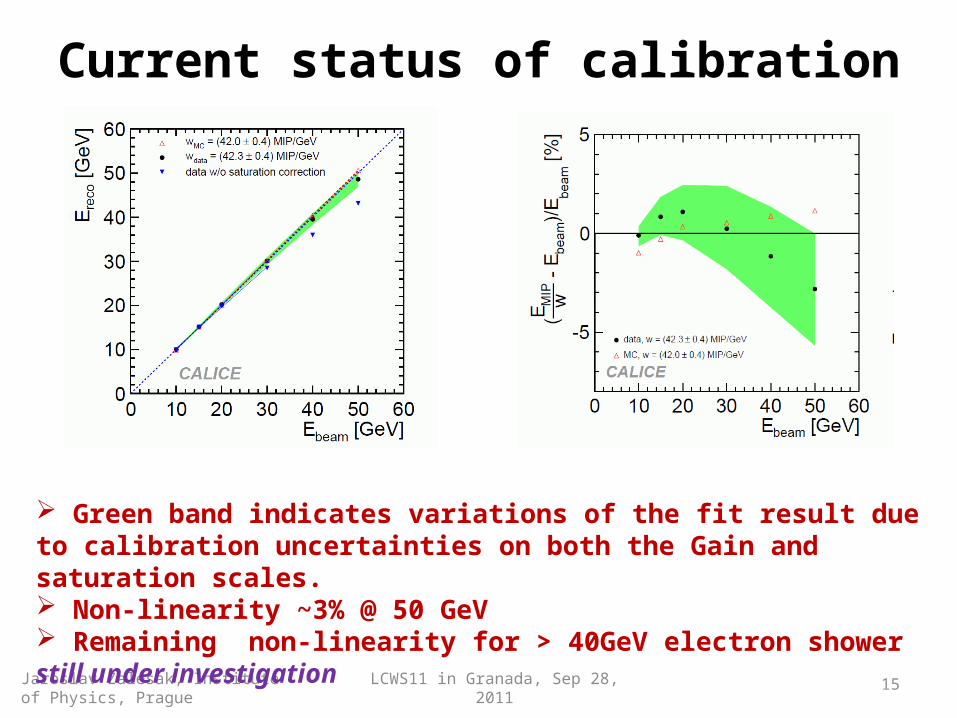
Current status of calibration
Green band indicates variations of the fit result due to calibration uncertainties on both the Gain and saturation scales. Non-linearity ~3% @ 50 GeV Remaining non-linearity for > 40GeV electron shower still under investigation

Jaroslav Zalesak, Institute of Physics, Prague LCWS11 in Granada, Sep 28, 2011 16
Energy scales for hadrons
In hadronic showers smaller energy density (Ehit/MIP)at the same particle E
→ Non-linearity (saturation) effects are less relevant for hadrons
Saturated EM vs non-saturates positrons vs pions energy density

Jaroslav Zalesak, Institute of Physics, Prague LCWS11 in Granada, Sep 28, 2011 17
Conclusion We have operated a calorimeter with ~7600 cells read out by SiPM
during 4 years test beam campaigns (next ones W-AHCAL in progress) The equalization of the cell response is done at the MIP scale
light yield ~13 pixels / mip, S/N ~ 10 SiPM response measured for each device:
Lower saturation point measured after mounting SiPM on tile Both data sets FNAL & CERN give consistent results: ~80% of pixels illuminated by WLS fiber light
Transportation of the calibration due to changing temperature and voltage works but still remaining energy shift at MIP energy scale
Calibration procedure validated with EM data Non-linearity effects are less relevant for hadrons

LCWS11 in Granada, Sep 28, 2011 18
Backup
Jaroslav Zalesak, Institute of Physics, Prague

LCWS11 in Granada, Sep 28, 2011
Temperature variations at TB
Jaroslav Zalesak, Institute of Physics, Prague 19
gradient along the calorimeter length gradient across a module (<0.5 deg)
Spring/summer variations
Important point for a ILC detector: cell equalization (with muon) cannot be repeated in situ test beam calibration can be ported to the ILC detector what about correction of long term T fluctuation (if any)?

Jaroslav Zalesak, Institute of Physics, Prague LCWS11 in Granada, Sep 28, 2011 20
Correction to MIP calibration set

LCWS11 in Granada, Sep 28, 2011 21Jaroslav Zalesak, Institute of Physics, Prague
Saturation: mounted/bare

LCWS11 in Granada, Sep 28, 2011 22Jaroslav Zalesak, Institute of Physics, Prague
FNAL-CERN Asymmetry
Tcorr Pixels :Mean=-0.0%σ = 2.2%
FNAL: peak 82.9%, σ=5%
CERN: peak 82.9%, σ=5%
Temperature correction cancels the difference in mean. The signal does not degrade (small error of T correction factor) But still long tails with wrong fit either at CERN or FNAL or both.
~10% outside 3σ-range

LCWS11 in Granada, Sep 28, 2011 23
Effect of channel-by-channel correctionson EM analysis
Jaroslav Zalesak, Institute of Physics, Prague
Energy linearity of response Residual of linear fit to energy
single-cell calibration does not improve the linearity w.r.t. a common rescaling factor→ simplifies calibration chain of high-multi channel calor.
global rescaling factor X single cell saturation

Jaroslav Zalesak, Institute of Physics, Prague LCWS11 in Granada, Sep 28, 2011 24
Impact on hadron analysis
~5% shift between CERN reference and transported samples Corrected by the in-situ layer-by-layer calibration using MIP stubs from pion showers After transport of calibration consistent results within analysis uncertainties
after layer by layer calibration from MIP stub
before layer by layer in-situ calibration