Embed Size (px)
Citation preview
SANDIA REPORT
SAND2004-2757 Unlimited Release Printed June 2004 Calculation of the Radionuclides in PWR Spent Fuel Samples for SFR Experiment Planning
Robert E. Naegeli
Prepared by Sandia National Laboratories Albuquerque, New Mexico 87185 and Livermore, California 94550 Sandia is a multiprogram laboratory operated by Sandia Corporation, a Lockheed Martin Company, for the United States Department of Energy’s National Nuclear Security Administration under Contract DE-AC04-94AL85000. Approved for public release; further dissemination unlimited.
Issued by Sandia National Laboratories, operated for the United States Department of Energy by Sandia Corporation.
NOTICE: This report was prepared as an account of work sponsored by an agency of the United States Government. Neither the United States Government, nor any agency thereof, nor any of their employees, nor any of their contractors, subcontractors, or their employees, make any warranty, express or implied, or assume any legal liability or responsibility for the accuracy, completeness, or usefulness of any information, apparatus, product, or process disclosed, or represent that its use would not infringe privately owned rights. Reference herein to any specific commercial product, process, or service by trade name, trademark, manufacturer, or otherwise, does not necessarily constitute or imply its endorsement, recommendation, or favoring by the United States Government, any agency thereof, or any of their contractors or subcontractors. The views and opinions expressed herein do not necessarily state or reflect those of the United States Government, any agency thereof, or any of their contractors. Printed in the United States of America. This report has been reproduced directly from the best available copy. Available to DOE and DOE contractors from
U.S. Department of Energy Office of Scientific and Technical Information P.O. Box 62 Oak Ridge, TN 37831 Telephone: (865)576-8401 Facsimile: (865)576-5728 E-Mail: [email protected] Online ordering: http://www.osti.gov/bridge
Available to the public from
U.S. Department of Commerce National Technical Information Service 5285 Port Royal Rd Springfield, VA 22161 Telephone: (800)553-6847 Facsimile: (703)605-6900 E-Mail: [email protected] Online order: http://www.ntis.gov/help/ordermethods.asp?loc=7-4-0#online
June 2004 3 PWR Nuclides for SFR Experiments
SAND2004-2757 Unlimited Release Printed June 2004
Calculation of the Radionuclides
in PWR Spent Fuel Samples for
SFR Experiment Planning
Robert E. Naegeli
American Staff Augmentation Providers, LLC Albuquerque, NM 87123
Abstract This report documents the calculation of radionuclide content in the pressurized water reactor (PWR) spent fuel samples planned for use in the Spent Fuel Ratio (SPR) Experiments at Sandia National Laboratories, Albuquerque, New Mexico (SNL) to aid in experiment planning. The calculation methods using the ORIGEN2 and ORIGEN-ARP computer codes and the input modeling of the planned PWR spent fuel from the H. B. Robinson and the Surry nuclear power plants are discussed. The safety hazards for the calculated nuclide inventories in the spent fuel samples are characterized by the potential airborne dose and by the portion of the nuclear facility hazard category 2 and 3 thresholds that the experiment samples would present. In addition, the gamma ray photon energy source for the nuclide inventories is tabulated to facilitate subsequent calculation of the direct and shielded dose rates expected from the samples. The relative hazards of the high burnup 72 gigawatt-day per metric ton of uranium (GWd/MTU) spent fuel from H. B. Robinson and the medium burnup 36 GWd/MTU spent fuel from Surry are compared against a parametric calculation of various fuel burnups to assess the potential for higher hazard PWR fuel samples.
June 2004 4 PWR Nuclides for SFR Experiments
Acknowledgements The author wishes to thank those who contributed to the calculations presented in this report. M. C. Billone and Hanchung Tsai of Argonne National Laboratory were very helpful in providing fuel dimension and reactor burnup information for the nuclide composition calculations of the spent fuel from H. B Robinson and Surry nuclear power plants. Richard Coats and Michael Gregson of Sandia National Laboratories provided much helpful discussion and suggestion for refinement of the nuclide composition calculations.
June 2004 5 PWR Nuclides for SFR Experiments
Contents Introduction ..................................................................................................................................7 Description of PWR Spent Fuel and Experiment Samples........................................................8
High-Burnup H. B. Robinson PWR Spent Fuel ........................................................................8 H. B. Robinson PWR SFR Experiment Samples.....................................................................10 Medium-Burnup Surry PWR Spent Fuel.................................................................................11 Surry PWR SFR Experiment Samples.....................................................................................15
Burnup Calculation Tools for Nuclide Inventory Calculation ................................................16 ORIGEN2 Computer Code ......................................................................................................16 ORIGEN-ARP Computer Code System ..................................................................................16 Use of ORIGEN2 and ORIGEN-ARP.....................................................................................17
Modeling and Calculation of the Spent Fuel Nuclide Compositions.......................................18 H. B. Robinson Spent Fuel Nuclide Composition Calculations with ORIGEN2....................18
ORIGEN2 Output Cutoff Parameters for pwru72l.u5 .......................................................18 ORIGEN2 Cross-Section Libraries for pwru72l.u5...........................................................19 ORIGEN2 Fuel Irradiation and Decay Commands for the Fuel Burnup for pwru72l.u5..19
H. B. Robinson 67 GWd/MTU Fuel Rod Average Burnup.....................................................21 ORIGEN2 Decay Commands for Decay after Completion of Burnup for pwru72l.u5.....23 ORIGEN2 Composition of the UO2 Fuel Irradiated for pwru72l.u5.................................23
H. B. Robinson Spent Fuel Nuclide Composition Calculations with ORIGEN-ARP.............24 ORIGEN-ARP Calculation of H. B. Robinson 67 GWd/MTU Burnup ............................24 ORIGEN-ARP Decay of Siemens/Framatome H. B. Robinson 67 GWd/MTU Burnup ..28
Surry Spent Fuel Nuclide Composition Calculations with ORIGEN-ARP.............................31 ORIGEN-ARP Calculation of Surry 38.6 GWd/MTU Average Burnup ..........................31 ORIGEN-ARP Calculation of Surry 38.6 GWd/MTU Realistic Burnup..........................32
Parametric Spent Fuel Nuclide Composition Calculations with ORIGEN-ARP ....................35 Calculated Spent Fuel Nuclide Compositions ...........................................................................37
Nuclide Composition of H. B. Robinson 72 GWd/MTU Spent Fuel ......................................37 Nuclide Composition of H. B. Robinson 67 GWd/MTU Spent Fuel Comparison..................38
Actinide Activity Comparisons for 67 GWd/MTU Burnup Calculations .........................39 Fission Product Activity Comparisons for 67 GWd/MTU Burnup Calculations ..............40
Nuclide Composition of Surry 38.6 GWd/MTU Spent Fuel ...................................................40 Radiological Safety Hazards of the Spent Fuel Samples..........................................................41
Potential Dose of Airborne UO2 Particles from the Spent Fuel Samples ................................41 Fraction of the Nuclear Facility Hazard Category 3 and 2 Thresholds for Spent Fuel UO2
Samples ..............................................................................................................................42 Measures of Nuclide Importance for the H. B. Robinson 72 GWD/MTU Fuel......................44 Parametric Spent Fuel Radiological Hazards Compared to SFR Experiment Sample
Radiological Hazards .........................................................................................................46 References ................................................................................................................................48
June 2004 6 PWR Nuclides for SFR Experiments
Appendix A – ORIGEN2 Input pwru72l.u5 for H. B. Robinson 72 GWd/MTU Burnup ....51 Appendix B – H. B. Robinson Nuclide Composition and Other ORIGEN2 Calculated
Values for 72 GWd/MTU Spent Fuel.................................................................56 Appendix C – H. B. Robinson Nuclide Composition Comparison for Various Calculation
Methods of 67 GWd/MTU Burnup ....................................................................65 Appendix D – Surry Nuclide Composition ORIGEN-ARP Activities for 38.6 GWd/MTU
Spent Fuel .............................................................................................................69 Appendix E – Airborne Dose Per Gram of Spent Fuel UO2 as Respirable Size Particles ....86 Appendix F – Hazard Category 3 and 2 Fraction Per Gram of Spent Fuel UO2 ..................92 Figures Figure 1. Fuel rod power history, ROB G38M04/S15HR01 ........................................................9 Figure 2. H. B. Robinson Rod R01 Power History for the ORIGEN 2 Calculation...................22 Figure 3. H. B. Robinson Rod R01 Burnup History for the ORIGEN 2 Calculation .................22 Figure 4. Surry Power History for the ORIGEN-ARP Calculation ............................................35 Figure 5. Airborne dose of spent fuel with decay for a PWR, 3% U-235 enriched....................47 Figure 6. HC3 threshold fraction of spent fuel with decay for a PWR, 3% U-235 enriched......47 Tables Table 1. H. B. Robinson UO2 fuel characteristics for SFR experiment samples.......................10 Table 2. Surry 2, cycle 3 operating history ................................................................................12 Table 3. Surry 2, cycle 4 operating history ................................................................................13 Table 4. Surry 2, cycle 5 operating history ................................................................................14 Table 5. Surry UO2 fuel characteristics for SFR experiment samples.......................................15 Table 6. Computer codes used for nuclide composition calculations........................................17 Table 7. ORIGEN2 power, duration and cumulative burnup for the 72 and 67 GWd/MTU ....21 Table 8. Mass for 1 MTU of H. B. Robinson UO2 initial fuel composition..............................23 Table 9. ORIGEN-ARP H. B. Robinson 67 GWd/MTU irradiation and decay cases...............26 Table 10. Siemens calculated actinide activity for rod R01 with 5 years decay..........................30 Table 11. Siemens calculated fission product activity for rod R01 with 5 years decay ..............30 Table 12. Surry average power history for each of three cycles for 38.6 GWd/MTU burnup ....32 Table 13. Surry power history model for cycles 3 and 4 (six irradiation cases)..........................33 Table 14. Surry power history model for cycle 5 (four irradiation and two decay cases) ...........34 Table 15. Parametric average power history for each cycle for 12 GWd/MTU burnup..............36 Table 16. Activity of each nuclide component for the 72 GWd/MTU spent fuel .......................38 Table 17. Activity and airborne dose per gram and per sample rod of spent fuel UO2 ...............42 Table 18. Activity and hazard category 3 and 2 per gram and per sample rod of spent fuel.......43 Table 19. Measures of nuclide importance for the H. B. Robinson 72 GWD/MTU fuel............45
June 2004 7 PWR Nuclides for SFR Experiments
Calculation of the Radionuclides in PWR Spent Fuel Samples for
SFR Experiment Planning
Introduction The radionuclide content of spent fuel from pressurized water reactor (PWR) nuclear power plants (NPPs) was calculated to support the proposed Spent Fuel Ratio (SFR) experiments at Sandia National Laboratories (SNM), Technical Area V (TA-V), at Albuquerque New Mexico. The experiments would use short sections of spent fuel elements from PWR NPPs. The nuclide content was needed to quantify the radiological material hazard for the experiment planning process. Two computer codes developed by Oak Ridge National Laboratory (ORIGEN2 and ORIGEN-ARP computer codes) were used to calculate the radionuclide content of the PWR spent fuel from two different nuclear power reactors. The two PWR spent fuels represent different fuel exposures or burnups for a high burnup 72 gigawatt-day per metric ton of uranium (GWd/MTU) spent fuel sample from the H. B. Robinson NPP and a medium burnup 36 GWd/MTU spent fuel sample from the Surry NPP. The actual experiment samples would be prepared by Argonne National Laboratory (ANL) as a continuation of their research on changes to PWR fuel elements due to burnup. Argonne National Laboratory will also provide measurements of the actual nuclide content of the spent fuels as an aid to further validate the nuclide content calculation methods developed by Oak Ridge National Laboratory and others. The detailed radionuclide content of the spent fuel samples is also necessary to support some of the goals of the SFR experiments. The measured nuclide content of the two PWR spent fuel samples would be available late in the experiment planning process so the calculations in this report were necessary to estimate the nuclide content and radiological material safety hazard for the experiment. This report documents the PWR spent fuel nuclide content (or fuel burnup) calculations and the radiological hazard characterization of the resulting experiment sample nuclide inventories. The calculated PWR spent fuel nuclide inventories and the related gamma ray, neutron and alpha radiation sources are tabulated in appendices. The inputs used for the calculations are discussed and tabulated. Limited comparison calculations between the two computer codes were provided to qualify the results where the calculation range of one code was exceeded or the burnup range of validation of the code cross-sections were exceeded. The safety hazards for the calculated nuclide inventories in the spent fuel samples are characterized by the potential airborne dose and by the fraction of the nuclear facility hazard category 3 and 2 thresholds that the experiment samples would present.

June 2004 8 PWR Nuclides for SFR Experiments
Description of PWR Spent Fuel and Experiment Samples
The two PWR spent fuels available for production of the Spent Fuel Ratio (SFR) experiment samples were derived from the Argonne National Laboratory (ANL) research programs for high burnup fuel element (or rod) performance. High-burnup PWR and boiling water reactor (BWR) rods and dry-cask-stored PWR rods were acquired by ANL under the sponsorship of the U.S. Nuclear Regulatory Commission (NRC), the U.S. Department of Energy (DOE), and the Electric Power Research Institute to conduct a range of research programs on fuel rod performance. Since the as-irradiated condition of the fuel rods was the prerequisite for test planning and data evaluation at ANL, characterization of these fuel rods was undertaken including venting of fission gases, disassembly of sections of the fuel rods, examination of the fuel pellets, examination of the fuel rod cladding and measurement of the nuclide composition of the spent fuel pellets. ANL committed to fabricating the short spent fuel rod sections needed for the SNL SFR experiment PWR samples by cutting them from portions of the high burnup spent fuel rods obtained for the ANL rod performance research. NRC and DOE also fund the SNL SFR experiment program, which has different objectives than the ANL research. The two spent fuel rods were obtained from H. B. Robinson NPP and Surry NPP operations and have undergone extensive decay for 8 and 22 years respectively. The highest burnup sections of the respective fuel rods were committed for SFR experiment sample production. The two spent fuel types are described below. M. C. Billone and Hanchung Tsai of ANL were very helpful in providing the information for the nuclide composition calculations. High-Burnup H. B. Robinson PWR Spent Fuel The high-burnup PWR rods examined were from a 15 x 15 assembly of the H. B. Robinson plant Unit 2 (EPRI 2001). They operated for seven cycles and reached a rod-average burnup of 67 GWd/MTU (73 GWd/MTU peak pellet). The initial fuel enrichment was 2.90%. The nominal initial fuel pellet dimensions were 9.06 mm (0.3565 inch) diameter by 6.93 mm (0.273 inch) height and the active fuel height was 3.66 m (144 inches). The pellet density was 94% of the theoretical density of UO2. The cladding was cold-worked/stress-relieved Zircaloy-4, initial dimensions of 10.77 mm (0.464 inch) OD x 9.25 mm (0.364 inch) ID, with a nominal tin content of 1.42%. The SFR experiment samples would be fabricated from high burnup sections of the rods with a burnup of approximately 72 GWd/MTU. Rod R01 (serial number RA110889) was selected for fabrication of the SFR experiment samples (4 or 5 short rod sections). Rod R01 of assembly S-15H was discharged from the H. B. Robinson reactor on April 28, 1995 (Ruzauskas 2001) and was subsequently examined, sectioned and shipped to ANL in May 2001 (Tsai 2001). R01 was irradiated in assembly S-15H for cycles 15 and 16 from 1992–1995 for its final irradiation. The initial irradiation of R01 was done in assembly G-38 (position M04) for cycles 4, 5, 6, 7, and 8 from 1975–1982. During the ten years between cycles 8 and 15, rod R01 was in the reactor cooling pool (Tsai 2001). It was chosen with several others for subsequent irradiation in the reactor to provide high burnup fuel rods for the ANL research. The research purpose for rod R01 is source term characterization so it would have its nuclide composition measured (Ruzauskas 2001).
June 2004 9 PWR Nuclides for SFR Experiments
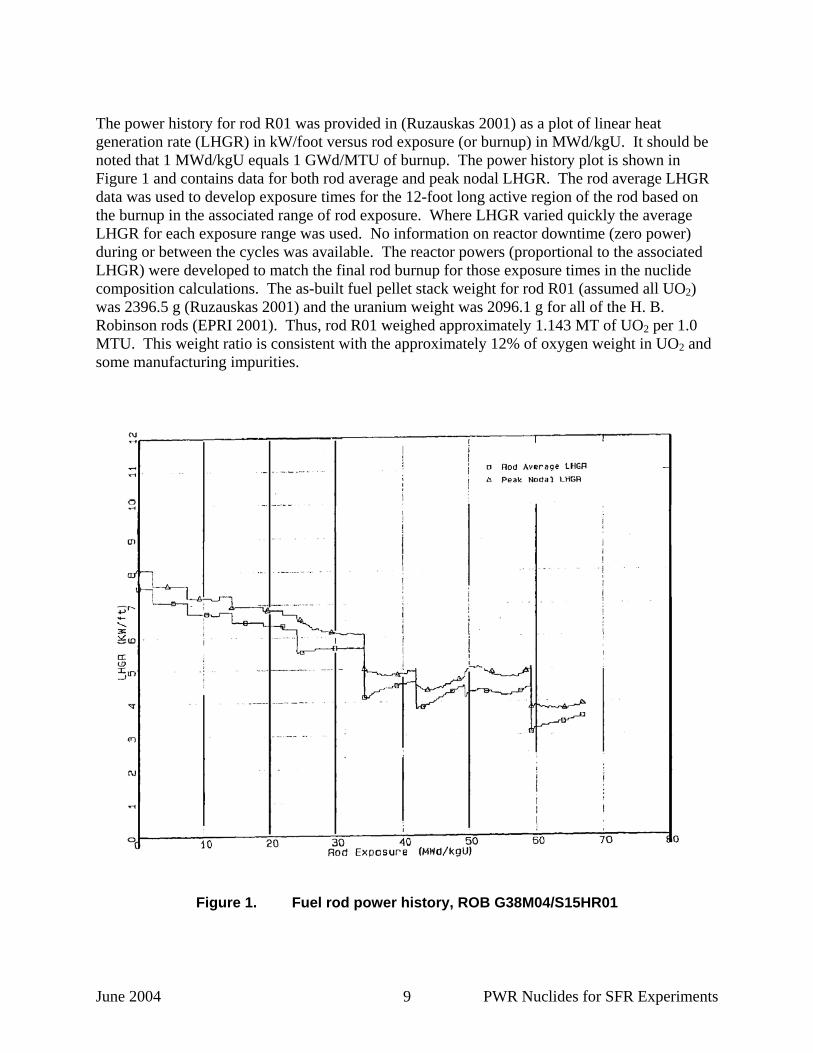
The power history for rod R01 was provided in (Ruzauskas 2001) as a plot of linear heat generation rate (LHGR) in kW/foot versus rod exposure (or burnup) in MWd/kgU. It should be noted that 1 MWd/kgU equals 1 GWd/MTU of burnup. The power history plot is shown in Figure 1 and contains data for both rod average and peak nodal LHGR. The rod average LHGR data was used to develop exposure times for the 12-foot long active region of the rod based on the burnup in the associated range of rod exposure. Where LHGR varied quickly the average LHGR for each exposure range was used. No information on reactor downtime (zero power) during or between the cycles was available. The reactor powers (proportional to the associated LHGR) were developed to match the final rod burnup for those exposure times in the nuclide composition calculations. The as-built fuel pellet stack weight for rod R01 (assumed all UO2) was 2396.5 g (Ruzauskas 2001) and the uranium weight was 2096.1 g for all of the H. B. Robinson rods (EPRI 2001). Thus, rod R01 weighed approximately 1.143 MT of UO2 per 1.0 MTU. This weight ratio is consistent with the approximately 12% of oxygen weight in UO2 and some manufacturing impurities.
Figure 1. Fuel rod power history, ROB G38M04/S15HR01
June 2004 10 PWR Nuclides for SFR Experiments
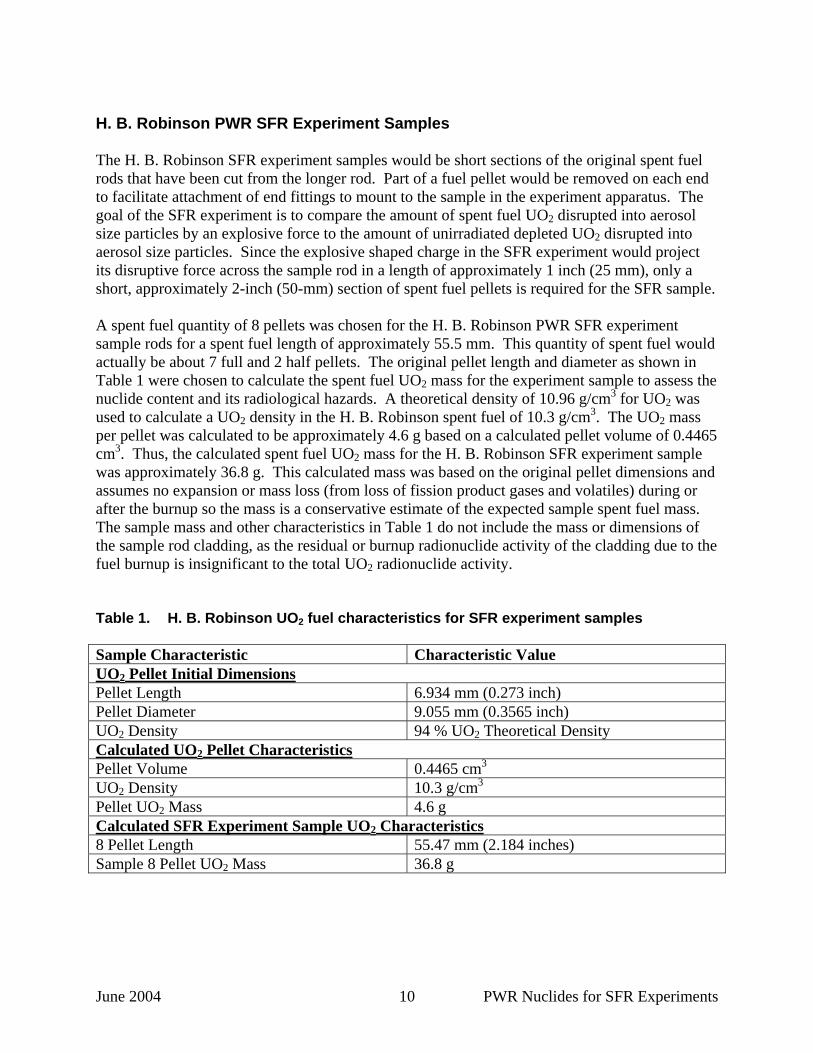
H. B. Robinson PWR SFR Experiment Samples The H. B. Robinson SFR experiment samples would be short sections of the original spent fuel rods that have been cut from the longer rod. Part of a fuel pellet would be removed on each end to facilitate attachment of end fittings to mount to the sample in the experiment apparatus. The goal of the SFR experiment is to compare the amount of spent fuel UO2 disrupted into aerosol size particles by an explosive force to the amount of unirradiated depleted UO2 disrupted into aerosol size particles. Since the explosive shaped charge in the SFR experiment would project its disruptive force across the sample rod in a length of approximately 1 inch (25 mm), only a short, approximately 2-inch (50-mm) section of spent fuel pellets is required for the SFR sample. A spent fuel quantity of 8 pellets was chosen for the H. B. Robinson PWR SFR experiment sample rods for a spent fuel length of approximately 55.5 mm. This quantity of spent fuel would actually be about 7 full and 2 half pellets. The original pellet length and diameter as shown in Table 1 were chosen to calculate the spent fuel UO2 mass for the experiment sample to assess the nuclide content and its radiological hazards. A theoretical density of 10.96 g/cm3 for UO2 was used to calculate a UO2 density in the H. B. Robinson spent fuel of 10.3 g/cm3. The UO2 mass per pellet was calculated to be approximately 4.6 g based on a calculated pellet volume of 0.4465 cm3. Thus, the calculated spent fuel UO2 mass for the H. B. Robinson SFR experiment sample was approximately 36.8 g. This calculated mass was based on the original pellet dimensions and assumes no expansion or mass loss (from loss of fission product gases and volatiles) during or after the burnup so the mass is a conservative estimate of the expected sample spent fuel mass. The sample mass and other characteristics in Table 1 do not include the mass or dimensions of the sample rod cladding, as the residual or burnup radionuclide activity of the cladding due to the fuel burnup is insignificant to the total UO2 radionuclide activity. Table 1. H. B. Robinson UO2 fuel characteristics for SFR experiment samples Sample Characteristic Characteristic Value UO2 Pellet Initial Dimensions Pellet Length 6.934 mm (0.273 inch) Pellet Diameter 9.055 mm (0.3565 inch) UO2 Density 94 % UO2 Theoretical Density Calculated UO2 Pellet Characteristics Pellet Volume 0.4465 cm3 UO2 Density 10.3 g/cm3 Pellet UO2 Mass 4.6 g Calculated SFR Experiment Sample UO2 Characteristics 8 Pellet Length 55.47 mm (2.184 inches) Sample 8 Pellet UO2 Mass 36.8 g
June 2004 11 PWR Nuclides for SFR Experiments
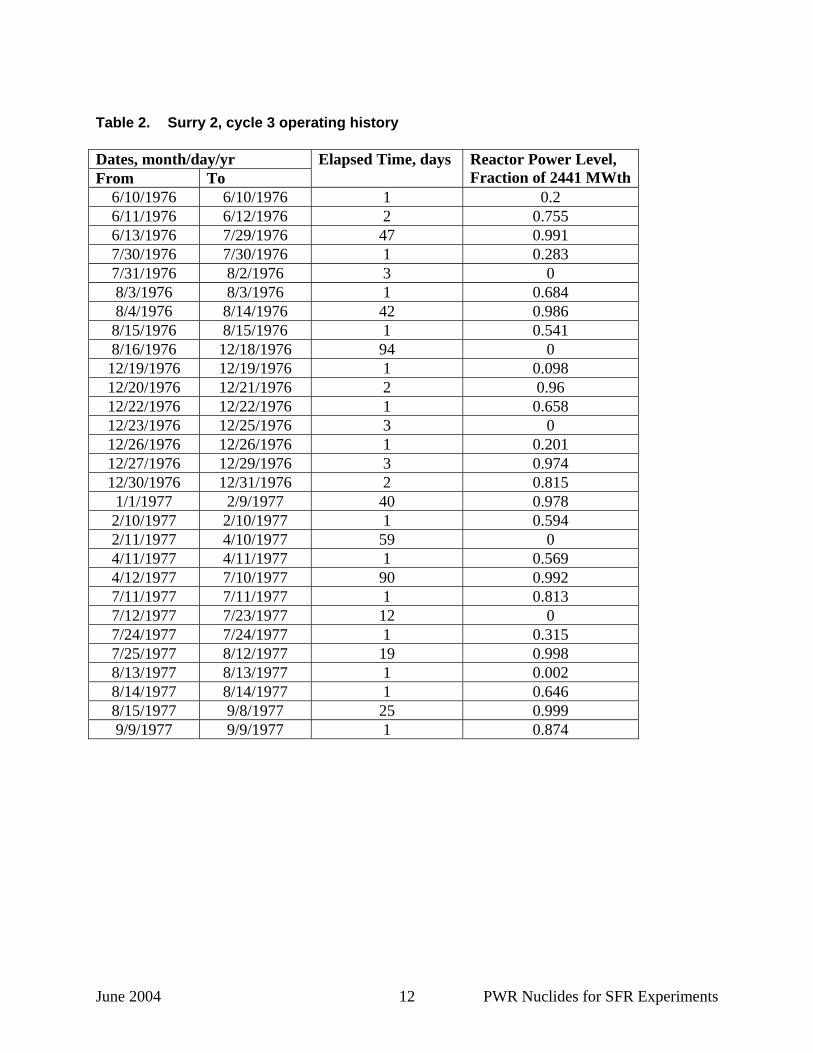
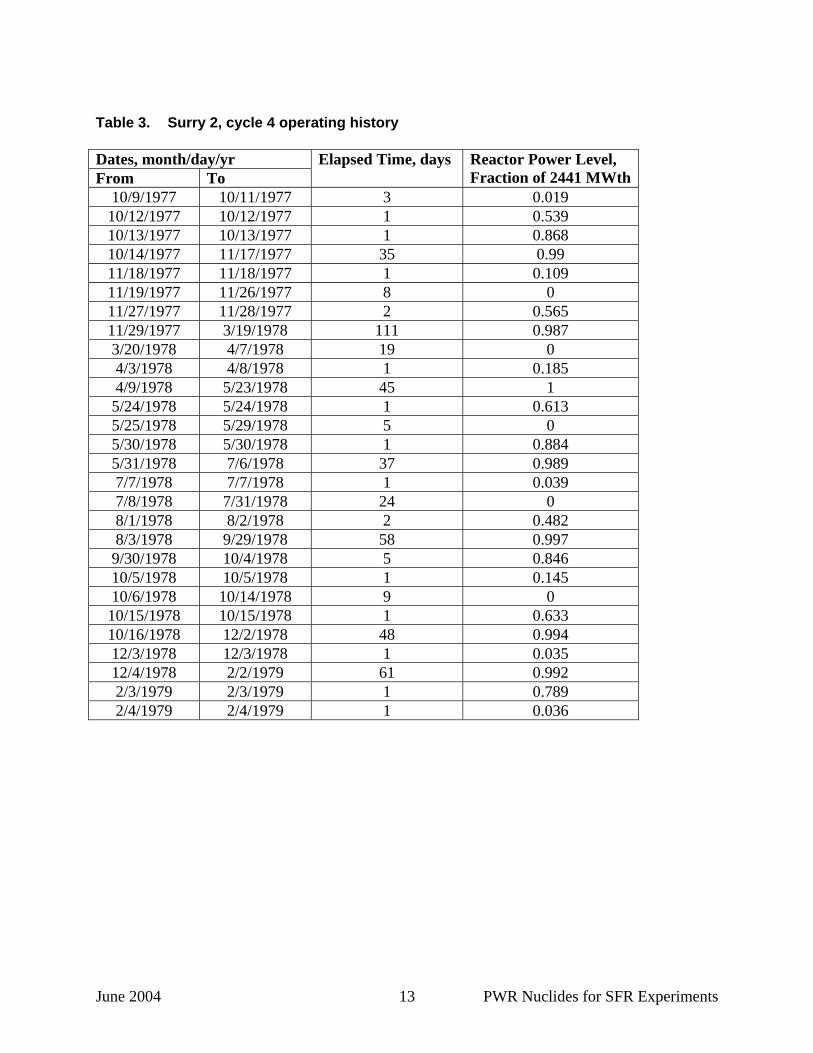
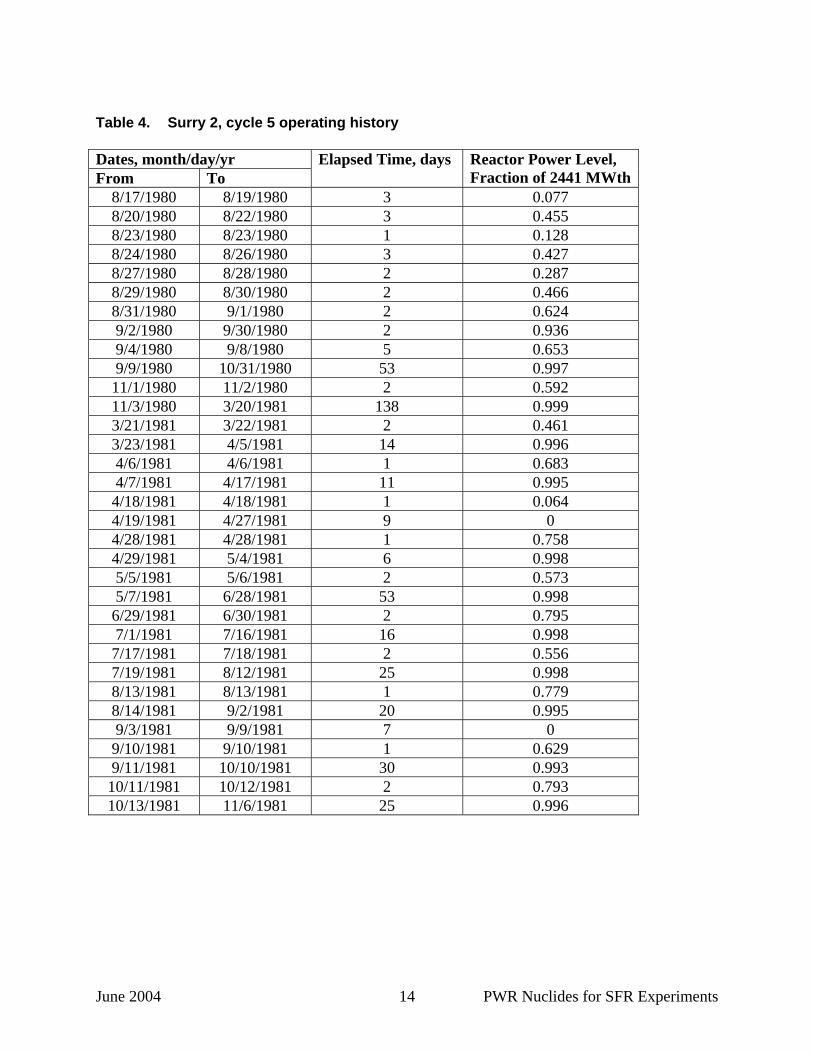
Medium-Burnup Surry PWR Spent Fuel The medium-burnup PWR rods examined were from a 15 x 15 assembly of the Surry unit 2 NPP that was exposed during cycles 3, 4 and 5 to exit the reactor on November 6, 1981 (EPRI 1986). The medium-burnup PWR rods had an average burnup of 36 GWd/MTU (40 GWd/MTU peak pellet). The initial fuel enrichment was 3.11% and the nominal initial fuel pellet dimensions were 9.295 mm diameter x 15 mm height, with an active fuel height of 3.66 m (144 inches). The pellet density was 95% of the theoretical density of UO2. The cladding was Zircaloy-4, cold-worked and partially annealed, with a dimension of 10.719 mm OD x 9.484 mm ID. The Surry spent fuel rod H7 from the T11 fuel assembly was selected for fabrication of the SFR experiment samples. The H7 rod had an average burnup of 35.7 GWd/MTU and the peak burnup section where the samples would be taken had a burnup of 38.6 GWd/MTU. After 1301 days of cooling (on June 1, 1985), selected fuel rods from the center of the assembly were loaded in a Castor-V/21 dry cask for benchmarking the thermal and radiological codes for dry-cask storage. After the benchmarking tests, the cask was left undisturbed with an inert internal atmosphere for 15 years until the rods were retrieved for the ANL rod performance research. The power history for rod H7 was provided in (EPRI 1986) as tables of the fraction of peak reactor power (2441 MWth) versus exposure duration for each of the three cycles. Those tables are shown as Tables 2-4 below. The operating history tables also provide the dates for the respective power durations. Downtime periods of zero power during the cycles are shown and the duration of downtime for refueling between the cycles was derived from the dates in the tables. The analysis showed a very long downtime of 559 days (18.6 months) between cycle 4 and 5 and a much shorter one of 29 days between cycles 3 and 4. The fraction of peak reactor power was used to calculate an effective burnup from the operating history for the three cycles. The power levels for the nuclide composition calculations were developed from the ratio of the actual burnup to the effective burnup.
June 2004 12 PWR Nuclides for SFR Experiments
Table 2. Surry 2, cycle 3 operating history Dates, month/day/yr From To
Elapsed Time, days Reactor Power Level, Fraction of 2441 MWth
6/10/1976 6/10/1976 1 0.2 6/11/1976 6/12/1976 2 0.755 6/13/1976 7/29/1976 47 0.991 7/30/1976 7/30/1976 1 0.283 7/31/1976 8/2/1976 3 0 8/3/1976 8/3/1976 1 0.684 8/4/1976 8/14/1976 42 0.986 8/15/1976 8/15/1976 1 0.541 8/16/1976 12/18/1976 94 0 12/19/1976 12/19/1976 1 0.098 12/20/1976 12/21/1976 2 0.96 12/22/1976 12/22/1976 1 0.658 12/23/1976 12/25/1976 3 0 12/26/1976 12/26/1976 1 0.201 12/27/1976 12/29/1976 3 0.974 12/30/1976 12/31/1976 2 0.815 1/1/1977 2/9/1977 40 0.978 2/10/1977 2/10/1977 1 0.594 2/11/1977 4/10/1977 59 0 4/11/1977 4/11/1977 1 0.569 4/12/1977 7/10/1977 90 0.992 7/11/1977 7/11/1977 1 0.813 7/12/1977 7/23/1977 12 0 7/24/1977 7/24/1977 1 0.315 7/25/1977 8/12/1977 19 0.998 8/13/1977 8/13/1977 1 0.002 8/14/1977 8/14/1977 1 0.646 8/15/1977 9/8/1977 25 0.999 9/9/1977 9/9/1977 1 0.874
June 2004 13 PWR Nuclides for SFR Experiments
Table 3. Surry 2, cycle 4 operating history Dates, month/day/yr From To
Elapsed Time, days Reactor Power Level, Fraction of 2441 MWth
10/9/1977 10/11/1977 3 0.019 10/12/1977 10/12/1977 1 0.539 10/13/1977 10/13/1977 1 0.868 10/14/1977 11/17/1977 35 0.99 11/18/1977 11/18/1977 1 0.109 11/19/1977 11/26/1977 8 0 11/27/1977 11/28/1977 2 0.565 11/29/1977 3/19/1978 111 0.987 3/20/1978 4/7/1978 19 0 4/3/1978 4/8/1978 1 0.185 4/9/1978 5/23/1978 45 1 5/24/1978 5/24/1978 1 0.613 5/25/1978 5/29/1978 5 0 5/30/1978 5/30/1978 1 0.884 5/31/1978 7/6/1978 37 0.989 7/7/1978 7/7/1978 1 0.039 7/8/1978 7/31/1978 24 0 8/1/1978 8/2/1978 2 0.482 8/3/1978 9/29/1978 58 0.997 9/30/1978 10/4/1978 5 0.846 10/5/1978 10/5/1978 1 0.145 10/6/1978 10/14/1978 9 0 10/15/1978 10/15/1978 1 0.633 10/16/1978 12/2/1978 48 0.994 12/3/1978 12/3/1978 1 0.035 12/4/1978 2/2/1979 61 0.992 2/3/1979 2/3/1979 1 0.789 2/4/1979 2/4/1979 1 0.036
June 2004 14 PWR Nuclides for SFR Experiments
Table 4. Surry 2, cycle 5 operating history Dates, month/day/yr From To
Elapsed Time, days Reactor Power Level, Fraction of 2441 MWth
8/17/1980 8/19/1980 3 0.077 8/20/1980 8/22/1980 3 0.455 8/23/1980 8/23/1980 1 0.128 8/24/1980 8/26/1980 3 0.427 8/27/1980 8/28/1980 2 0.287 8/29/1980 8/30/1980 2 0.466 8/31/1980 9/1/1980 2 0.624 9/2/1980 9/30/1980 2 0.936 9/4/1980 9/8/1980 5 0.653 9/9/1980 10/31/1980 53 0.997 11/1/1980 11/2/1980 2 0.592 11/3/1980 3/20/1981 138 0.999 3/21/1981 3/22/1981 2 0.461 3/23/1981 4/5/1981 14 0.996 4/6/1981 4/6/1981 1 0.683 4/7/1981 4/17/1981 11 0.995 4/18/1981 4/18/1981 1 0.064 4/19/1981 4/27/1981 9 0 4/28/1981 4/28/1981 1 0.758 4/29/1981 5/4/1981 6 0.998 5/5/1981 5/6/1981 2 0.573 5/7/1981 6/28/1981 53 0.998 6/29/1981 6/30/1981 2 0.795 7/1/1981 7/16/1981 16 0.998 7/17/1981 7/18/1981 2 0.556 7/19/1981 8/12/1981 25 0.998 8/13/1981 8/13/1981 1 0.779 8/14/1981 9/2/1981 20 0.995 9/3/1981 9/9/1981 7 0 9/10/1981 9/10/1981 1 0.629 9/11/1981 10/10/1981 30 0.993 10/11/1981 10/12/1981 2 0.793 10/13/1981 11/6/1981 25 0.996
June 2004 15 PWR Nuclides for SFR Experiments
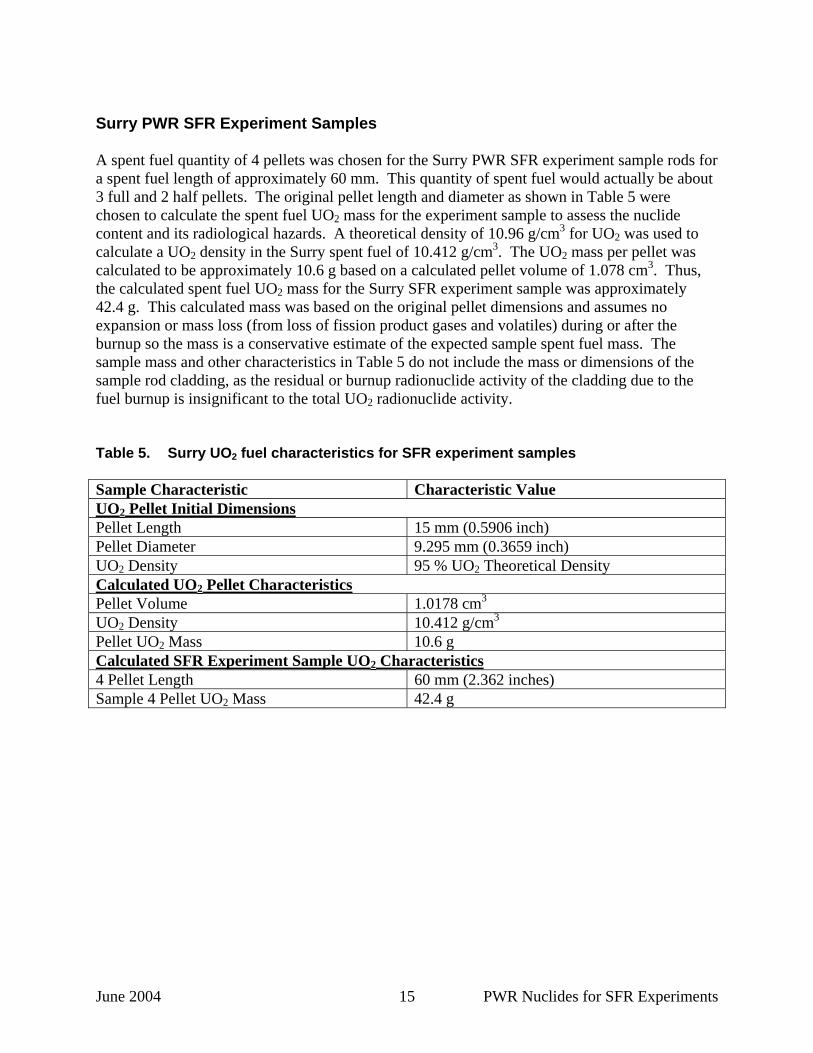
Surry PWR SFR Experiment Samples A spent fuel quantity of 4 pellets was chosen for the Surry PWR SFR experiment sample rods for a spent fuel length of approximately 60 mm. This quantity of spent fuel would actually be about 3 full and 2 half pellets. The original pellet length and diameter as shown in Table 5 were chosen to calculate the spent fuel UO2 mass for the experiment sample to assess the nuclide content and its radiological hazards. A theoretical density of 10.96 g/cm3 for UO2 was used to calculate a UO2 density in the Surry spent fuel of 10.412 g/cm3. The UO2 mass per pellet was calculated to be approximately 10.6 g based on a calculated pellet volume of 1.078 cm3. Thus, the calculated spent fuel UO2 mass for the Surry SFR experiment sample was approximately 42.4 g. This calculated mass was based on the original pellet dimensions and assumes no expansion or mass loss (from loss of fission product gases and volatiles) during or after the burnup so the mass is a conservative estimate of the expected sample spent fuel mass. The sample mass and other characteristics in Table 5 do not include the mass or dimensions of the sample rod cladding, as the residual or burnup radionuclide activity of the cladding due to the fuel burnup is insignificant to the total UO2 radionuclide activity. Table 5. Surry UO2 fuel characteristics for SFR experiment samples Sample Characteristic Characteristic Value UO2 Pellet Initial Dimensions Pellet Length 15 mm (0.5906 inch) Pellet Diameter 9.295 mm (0.3659 inch) UO2 Density 95 % UO2 Theoretical Density Calculated UO2 Pellet Characteristics Pellet Volume 1.0178 cm3 UO2 Density 10.412 g/cm3 Pellet UO2 Mass 10.6 g Calculated SFR Experiment Sample UO2 Characteristics 4 Pellet Length 60 mm (2.362 inches) Sample 4 Pellet UO2 Mass 42.4 g
June 2004 16 PWR Nuclides for SFR Experiments
Burnup Calculation Tools for Nuclide Inventory Calculation
Two computer codes developed by Oak Ridge National Laboratory (ORIGEN2 and ORIGEN-ARP computer codes) were used to calculate the radionuclide content of the PWR spent fuel from the two different nuclear power reactors. These computer codes were obtained from the Radiation Safety Information Computational Center (RSICC). ORIGEN2 Computer Code ORIGEN2 is a versatile point-depletion and radioactive-decay computer code for use in simulating nuclear fuel cycles and calculating the nuclide compositions and characteristics of materials contained in nuclear reactors. The ORIGEN2, version 2.1 code is described in (ORNL 1991) as a nuclide generation and fuel depletion code that uses the matrix exponential method for calculating the buildup, decay, and processing of radioactive materials. ORIGEN2, version 2.1 incorporates updates of the reactor models, cross-sections, fission product yields, decay data, and decay photon data, and includes additional libraries for standard and extended burnup PWR and BWR calculations, which are documented in ORNL/TM-11018 (Ludwig and Renier 1989). ORIGEN-ARP Computer Code System ORIGEN-ARP is fast, accurate, and easy-to-use standalone ORIGEN package for nuclide composition calculation. ORIGEN-ARP combines the ARP graphical user interface (GUI) that allows input development in a Windows environment with standard forms and plotting utilities and the ORIGEN-S version of the ORIGEN code (Bowman et al. 2002). ORIGEN-ARP provides an automatic rapid process for generating problem-dependent cross-section libraries for use in point-depletion calculations of spent fuel nuclide composition. ARP generates the cross-section libraries suitable to the ORIGEN-S code by interpolation over pre-generated cross-section libraries that were generated for five U-235 enrichments and ten fuel burnup ranges for each of five standard fuel assembly designs. The ORIGEN-S code performs the point-depletion calculations that result in final nuclide compositions of the reactor fuel. The problem setup by ARP uses different burnup dependent cross-section libraries as the ORIGEN-S calculation proceeds through the increasing burnup of the reactor fuel to improve accuracy of the resulting nuclide composition. The standard cross-section libraries provided with the ORIGEN-ARP package were produced with the SAS2H module of the SCALE code system of Oak Ridge National Laboratory. ARP is further described in (Leal et al. 1998) while ORIGEN-S is described in (Gauld et al. 2002). ORIGEN-ARP is intended to satisfy the primary objective of ORIGEN2 to perform a broad range of fuel cycle analyses with simple input specifications and a few select cross-section data libraries and with short computer execution time. It does this while providing the flexible and efficient interface of ORIGEN-S with neutronic codes for burnup-dependent cross sections based on assembly design information to improve accuracy of the resulting nuclide composition. This ORIGEN-ARP approach saves considerable computer time with comparable accuracy over the coupled, iterative SAS2H and ORIGEN-S method of calculating reactor burnup nuclide compositions as a function of time for each problem in a full SCALE code system calculation.
June 2004 17 PWR Nuclides for SFR Experiments
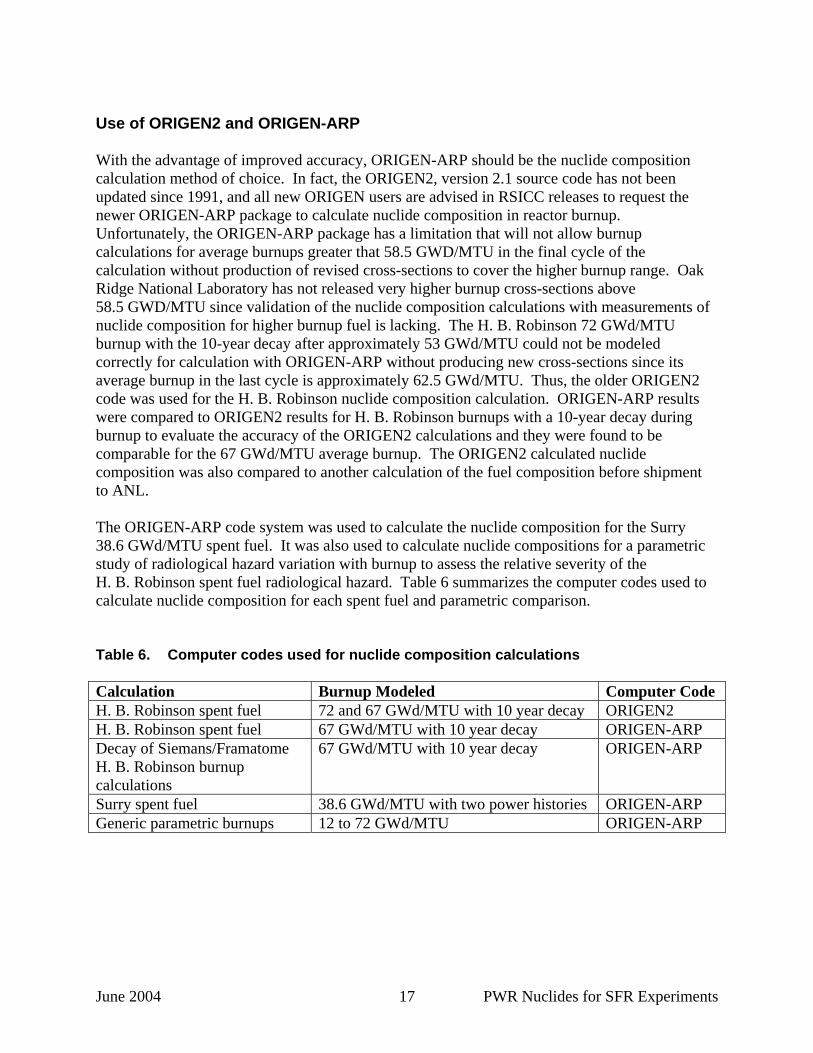
Use of ORIGEN2 and ORIGEN-ARP With the advantage of improved accuracy, ORIGEN-ARP should be the nuclide composition calculation method of choice. In fact, the ORIGEN2, version 2.1 source code has not been updated since 1991, and all new ORIGEN users are advised in RSICC releases to request the newer ORIGEN-ARP package to calculate nuclide composition in reactor burnup. Unfortunately, the ORIGEN-ARP package has a limitation that will not allow burnup calculations for average burnups greater that 58.5 GWD/MTU in the final cycle of the calculation without production of revised cross-sections to cover the higher burnup range. Oak Ridge National Laboratory has not released very higher burnup cross-sections above 58.5 GWD/MTU since validation of the nuclide composition calculations with measurements of nuclide composition for higher burnup fuel is lacking. The H. B. Robinson 72 GWd/MTU burnup with the 10-year decay after approximately 53 GWd/MTU could not be modeled correctly for calculation with ORIGEN-ARP without producing new cross-sections since its average burnup in the last cycle is approximately 62.5 GWd/MTU. Thus, the older ORIGEN2 code was used for the H. B. Robinson nuclide composition calculation. ORIGEN-ARP results were compared to ORIGEN2 results for H. B. Robinson burnups with a 10-year decay during burnup to evaluate the accuracy of the ORIGEN2 calculations and they were found to be comparable for the 67 GWd/MTU average burnup. The ORIGEN2 calculated nuclide composition was also compared to another calculation of the fuel composition before shipment to ANL. The ORIGEN-ARP code system was used to calculate the nuclide composition for the Surry 38.6 GWd/MTU spent fuel. It was also used to calculate nuclide compositions for a parametric study of radiological hazard variation with burnup to assess the relative severity of the H. B. Robinson spent fuel radiological hazard. Table 6 summarizes the computer codes used to calculate nuclide composition for each spent fuel and parametric comparison. Table 6. Computer codes used for nuclide composition calculations Calculation Burnup Modeled Computer Code H. B. Robinson spent fuel 72 and 67 GWd/MTU with 10 year decay ORIGEN2 H. B. Robinson spent fuel 67 GWd/MTU with 10 year decay ORIGEN-ARP Decay of Siemans/Framatome H. B. Robinson burnup calculations
67 GWd/MTU with 10 year decay ORIGEN-ARP
Surry spent fuel 38.6 GWd/MTU with two power histories ORIGEN-ARP Generic parametric burnups 12 to 72 GWd/MTU ORIGEN-ARP

June 2004 18 PWR Nuclides for SFR Experiments
Modeling and Calculation of the Spent Fuel Nuclide
Compositions The modeling of the fuel burnup calculations for nuclide composition of the spent fuels for the SFR experiment samples will be discussed in this section. The modeling will be translated into the inputs required for the ORIGEN2 and ORIGEN-ARP computer codes for each calculation case. Then, the outputs of the calculations will be discussed to extract the nuclide composition information. A Dell Precision™ 340 computer with a 2.8 GHz Intel® Pentium® 4 processor running the Windows® 2000 Professional operating system with Service Pack 3 was used for all of the burnup calculations. H. B. Robinson Spent Fuel Nuclide Composition Calculations with ORIGEN2 The ORIGEN2 computer code used for the 72 GWd/MTU burnup calculations requires a simple text input file for the program execution in disk operating system (DOS) batch file format. The example PWR input, pwru50.inp, from the ORIGEN2 distribution package was modified for the 2.9% U-235 enrichment of the H. B. Robinson fuel and the power history for irradiations in the input was changed to provide total burnups of 72 and 67 GWd/MTU for the two nuclide content calculations. The pwru50.inp input was included in the ORIGEN2 code distribution package to illustrate calculations with the new extended burnup cross-sections discussed in (Ludwig and Renier 1989) for a burnup of 50 GWd/MTU in 5 cycles so it provided the best starting point for the very high burnup H. B. Robinson PWR fuel. The pwru50.inp input is designed to irradiate fuel cladding materials as well as the fuel UO2 but the resulting radionuclide composition of the cladding was not tabulated or used for the H. B. Robinson spent fuel calculations because the activity of cladding materials is small compared to the activity of the UO2 fuel. Five areas of the modified input file will be discussed to explain the calculation modeling for the H. B. Robinson fuel. The areas include the output cutoff parameters, the cross-section libraries, the fuel irradiation and decay commands for the fuel burnup, the decay commands for decay after completion of burnup, and composition of the UO2 fuel irradiated. The ORIGEN2 users manual (Croff 1980) can be consulted for more information on the lines of the input file. The modified input file for the 72 GWd/MTU calculations (pwru72l.u5) is shown in Appendix A. ORIGEN2 Output Cutoff Parameters for pwru72l.u5 The output cutoff parameters in the ORIGEN2 command “CUT” define the cutoff fractions for the summary tables in the output as an override to the default values. The output cutoff fractions provide a filter on the number of nuclides in the output tables and thus define the completeness of the list of radionuclides included in the composition of the fuel. If an output value for a particular nuclide is less than the cutoff fraction multiplied by the total table value for all vectors (output sets) being tested (in this case all of the decay times being output), then that particular nuclide is not included in the output summary table.

June 2004 19 PWR Nuclides for SFR Experiments
The CUT command line for the pwru72l.u5 input file is shown in the top third of the first page of Appendix A as “CUT 5 1.0E-10 7 1.0E-10 9 1.0E-10 -1”. The cutoff fraction is a very small 1.0 x 10⁻¹⁰ for a very complete list of nuclides in the identified outputs for composition in grams, radioactivity in curies and thermal power in watts. The thermal power was not needed in these nuclide composition calculations. The ORIGEN2 code includes nuclide output summary tables for activation products (or light nuclides), actinides and fission products as part of the output. ORIGEN2 Cross-Section Libraries for pwru72l.u5 The cross-section libraries read for the H. B. Robinson calculation were specified by the “LIB” and the “PHO” commands in the input. The LIB command tells what decay and reaction cross-section libraries to use for the problem from the set of libraries available to the code while the PHO command tells what photon library to use for the problem. The cross-section library is of particular importance to the calculation since the cross-sections will vary with burnup due to depletion and buildup of nuclides in the fuel during the burnup. Since the simple ORIGEN2 code uses only one cross-section library for the whole time of burnup, the library calculated for that range of burnup should be used. The LIB and PHO command lines for the pwru72l.u5 input file are shown in the top third of the first page of Appendix A as: “RDA DECAY LIB XSECT LIB VAR. XSECT LIB 0 1 2 3 219 220 221 9 50 0 1 9 RDA PHOTON LIB PHO 101 102 103 10” The RDA is a comment line. The decay libraries are specified as 1 2 3 for the activation products, actinides and fission products respectively. Similarly, the cross-section libraries are specified as 219 220 221 for the 50 GWd/MTU burnup enriched U-235 UO2 problems. The photon libraries are specified as 101 102 103 that apply to decay photon emissions from nuclides in UO2 fuel. The photon libraries are used in the calculation of gamma ray photon spectra emitted by the decayed fuel as included in the output. ORIGEN2 Fuel Irradiation and Decay Commands for the Fuel Burnup for pwru72l.u5 The fuel irradiation and decay during burnup are specified by the “IRP” and “DEC” command lines respectively. The IRP command specifies neutron irradiation of the fuel at the indicated power level from fission of the fissile nuclides. The ORIGEN2 code calculates the corresponding neutron flux for the IRP irradiation. The command “IRF”, used for irradiation of cladding material in the input, is for irradiation with the neutron flux developed by previous IRP commands. Much of the second and third page of the pwru72l.u5 input file in Appendix A contains IRF irradiations of cladding materials. The nuclide composition of the cladding is ignored in the calculation of nuclide content of the H. B. Robinson spent fuel sample. The IRP and DEC command lines for the pwru72l.u5 input file are shown in the bottom third of the first page of Appendix A as:
June 2004 20 PWR Nuclides for SFR Experiments
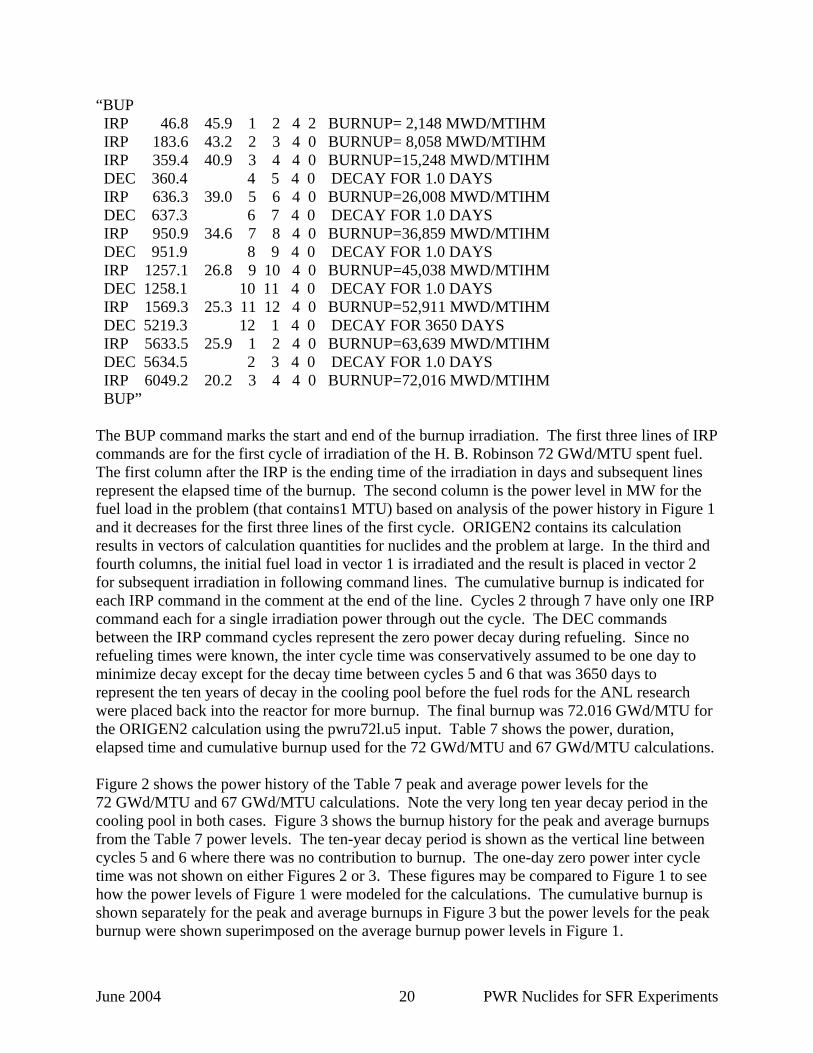
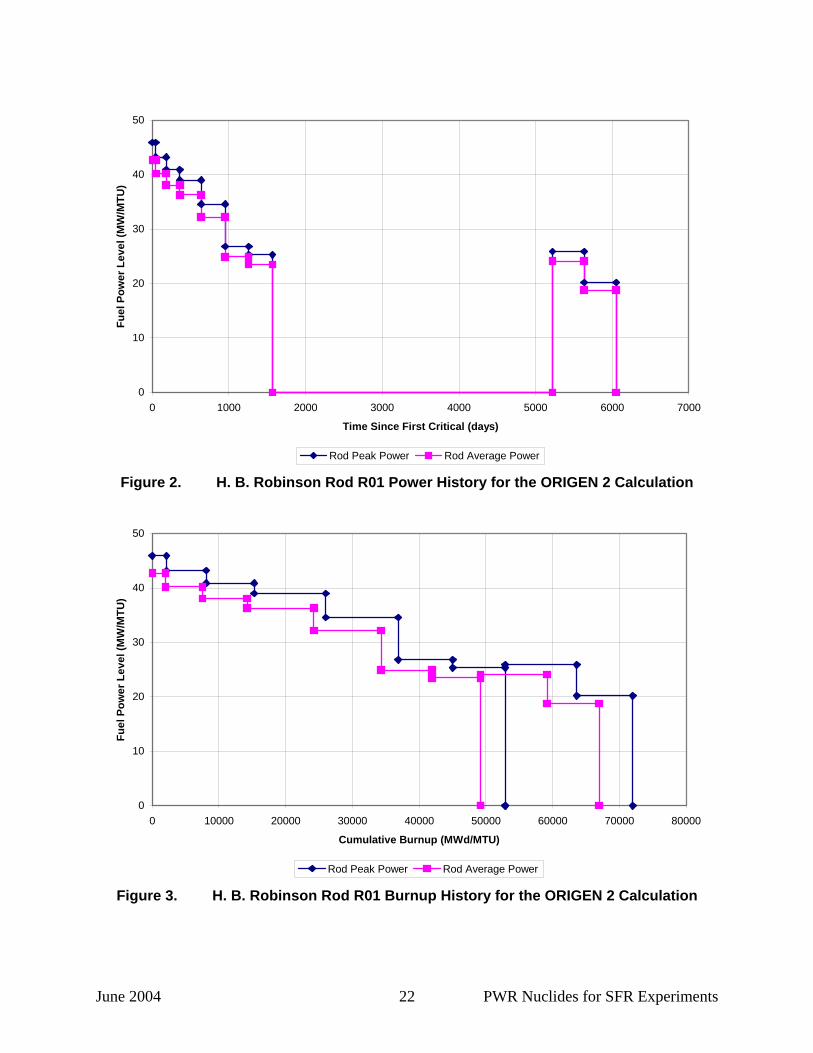
“BUP IRP 46.8 45.9 1 2 4 2 BURNUP= 2,148 MWD/MTIHM IRP 183.6 43.2 2 3 4 0 BURNUP= 8,058 MWD/MTIHM IRP 359.4 40.9 3 4 4 0 BURNUP=15,248 MWD/MTIHM DEC 360.4 4 5 4 0 DECAY FOR 1.0 DAYS IRP 636.3 39.0 5 6 4 0 BURNUP=26,008 MWD/MTIHM DEC 637.3 6 7 4 0 DECAY FOR 1.0 DAYS IRP 950.9 34.6 7 8 4 0 BURNUP=36,859 MWD/MTIHM DEC 951.9 8 9 4 0 DECAY FOR 1.0 DAYS IRP 1257.1 26.8 9 10 4 0 BURNUP=45,038 MWD/MTIHM DEC 1258.1 10 11 4 0 DECAY FOR 1.0 DAYS IRP 1569.3 25.3 11 12 4 0 BURNUP=52,911 MWD/MTIHM DEC 5219.3 12 1 4 0 DECAY FOR 3650 DAYS IRP 5633.5 25.9 1 2 4 0 BURNUP=63,639 MWD/MTIHM DEC 5634.5 2 3 4 0 DECAY FOR 1.0 DAYS IRP 6049.2 20.2 3 4 4 0 BURNUP=72,016 MWD/MTIHM BUP” The BUP command marks the start and end of the burnup irradiation. The first three lines of IRP commands are for the first cycle of irradiation of the H. B. Robinson 72 GWd/MTU spent fuel. The first column after the IRP is the ending time of the irradiation in days and subsequent lines represent the elapsed time of the burnup. The second column is the power level in MW for the fuel load in the problem (that contains1 MTU) based on analysis of the power history in Figure 1 and it decreases for the first three lines of the first cycle. ORIGEN2 contains its calculation results in vectors of calculation quantities for nuclides and the problem at large. In the third and fourth columns, the initial fuel load in vector 1 is irradiated and the result is placed in vector 2 for subsequent irradiation in following command lines. The cumulative burnup is indicated for each IRP command in the comment at the end of the line. Cycles 2 through 7 have only one IRP command each for a single irradiation power through out the cycle. The DEC commands between the IRP command cycles represent the zero power decay during refueling. Since no refueling times were known, the inter cycle time was conservatively assumed to be one day to minimize decay except for the decay time between cycles 5 and 6 that was 3650 days to represent the ten years of decay in the cooling pool before the fuel rods for the ANL research were placed back into the reactor for more burnup. The final burnup was 72.016 GWd/MTU for the ORIGEN2 calculation using the pwru72l.u5 input. Table 7 shows the power, duration, elapsed time and cumulative burnup used for the 72 GWd/MTU and 67 GWd/MTU calculations. Figure 2 shows the power history of the Table 7 peak and average power levels for the 72 GWd/MTU and 67 GWd/MTU calculations. Note the very long ten year decay period in the cooling pool in both cases. Figure 3 shows the burnup history for the peak and average burnups from the Table 7 power levels. The ten-year decay period is shown as the vertical line between cycles 5 and 6 where there was no contribution to burnup. The one-day zero power inter cycle time was not shown on either Figures 2 or 3. These figures may be compared to Figure 1 to see how the power levels of Figure 1 were modeled for the calculations. The cumulative burnup is shown separately for the peak and average burnups in Figure 3 but the power levels for the peak burnup were shown superimposed on the average burnup power levels in Figure 1.

June 2004 21 PWR Nuclides for SFR Experiments
Table 7. ORIGEN2 power, duration and cumulative burnup for the 72 and 67 GWd/MTU
Cycle Power (MW/MTU)
Irradiation/Decay Time (days)
Cumulative Time (days)
Cumulative Burnup (MWd/MTU)
H. B. Robinson 72 GWd/MTU Peak Fuel Rod Section Burnup 45.9 46.8 46.8 2,148 43.2 136.8 183.6 8,058
1
40.9 175.8 359.4 15,248 Downtime 0.0 1.0 360.4 Decay for 1.0 days 2 39.0 275.9 636.3 26,008 Downtime 0.0 1.0 637.3 Decay for 1.0 days 3 34.6 313.6 950.9 36,859 Downtime 0.0 1.0 951.9 Decay for 1.0 days 4 26.8 305.2 1257.1 45,038 Downtime 0.0 1.0 1258.1 Decay for 1.0 days 5 25.3 311.2 1569.3 52,911 Downtime 0.0 3650.0 5219.3 Decay for 3650 days 6 25.9 414.2 5633.5 63,639 Downtime 0.0 1.0 5634.5 Decay for 1.0 days 7 20.2 414.7 6049.2 72,016 H. B. Robinson 67 GWd/MTU Fuel Rod Average Burnup
42.7 46.8 46.8 1,998 40.2 136.8 183.6 7,498
1
38.1 175.8 359.4 14,196 Downtime 0.0 1.0 360.4 Decay for 1.0 days 2 36.3 275.9 636.3 24,211 Downtime 0.0 1.0 637.3 Decay for 1.0 days 3 32.2 313.6 950.9 34,309 Downtime 0.0 1.0 951.9 Decay for 1.0 days 4 24.9 305.2 1257.1 41,908 Downtime 0.0 1.0 1258.1 Decay for 1.0 days 5 23.5 311.2 1569.3 49,221 Downtime 0.0 3650.0 5219.3 Decay for 3650 days 6 24.1 414.2 5633.5 59,204 Downtime 0.0 1.0 5634.5 Decay for 1.0 days 7 18.8 414.7 6049.2 67,000
June 2004 22 PWR Nuclides for SFR Experiments
0
10
20
30
40
50
0 1000 2000 3000 4000 5000 6000 7000
Time Since First Critical (days)
Fuel
Pow
er L
evel
(MW
/MTU
)
Rod Peak Power Rod Average Power
Figure 2. H. B. Robinson Rod R01 Power History for the ORIGEN 2 Calculation
0
10
20
30
40
50
0 10000 20000 30000 40000 50000 60000 70000 80000
Cumulative Burnup (MWd/MTU)
Fuel
Pow
er L
evel
(MW
/MTU
)
Rod Peak Power Rod Average Power
Figure 3. H. B. Robinson Rod R01 Burnup History for the ORIGEN 2 Calculation

June 2004 23 PWR Nuclides for SFR Experiments
ORIGEN2 Decay Commands for Decay after Completion of Burnup for pwru72l.u5 The DEC decay commands for the UO2 spent fuel after burnup was completed for the pwru72l.u5 input file are found at the bottom of the third page of Appendix A. The DEC commands perform decays of the spent fuel for cumulative times of 0.5, 1.0, 4.0, 8.0, and 10.0 years after the fuel is removed from the reactor. Since fuel rod R01 discharge from H. B. Robinson was on April 28, 1995 (Ruzauskas 2001), the decay time of 8 years was used to characterize the spent fuel for its estimated nuclide composition on April 28, 2003. ORIGEN2 Composition of the UO2 Fuel Irradiated for pwru72l.u5 The composition of the H. B. Robinson UO2 fuel before irradiation was modeled as the first section of data after the end of the input commands for the pwru72l.u5 input file in the middle of the fourth page of Appendix A. The first line of the fuel composition data shows the isotopic composition of the uranium for the 2.9% enriched fuel. The next eight lines contain the composition of the oxygen and the impurity elements in the UO2 as assumed in the exampled input file pwrU50.inp. The addition of the impurities in the UO2 composition provided only a minor activation product activity component to the nuclide composition of the spent fuel. The composition of the UO2 fuel used in the ORIGEN2 calculations is shown in Table 8 that applies to both of the 72 and 67 GWd/MTU burnups for H. B. Robinson Fuel for a total mass of 1,134,810.2 g/MTU. Table 8. Mass for 1 MTU of H. B. Robinson UO2 initial fuel composition
72 GWD/MTU, pwru72l.u5 and 67 GWD/MTU, Pwru67l.u5 ORIGEN 2 Inputs (2.9% Enriched in U-235)
Component Mass (g) Component Mass (g) 92 Uranium-234 258.3 22 Titanium 1.0 92 Uranium-235 29000.0 23 Vanadium 3.0 92 Uranium-238 970741.7 24 Chromium 4.0 3 Lithium 1.0 25 Manganese 1.7 5 Boron 1.0 26 Iron 18.0 6 Carbon 89.4 27 Cobalt 1.0 7 Nitrogen 25.0 28 Nickel 24.0 8 Oxygen 134454.0 29 Copper 1.0 9 Fluorine 10.7 47 Silver 0.1 11 Sodium 15.0 48 Cadmium 25.0 12 Magnesium 2.0 49 Indium 2.0 13 Aluminum 16.7 50 Tin 4.0 14 Silicon 12.1 64 Gadolinium 2.5 15 Phosphorus 35.0 74 Tungsten 2.0 17 Chlorine 5.3 82 Lead 1.0 20 Calcium 2.0 83 Bismuth 0.4 Total 1134810.2
June 2004 24 PWR Nuclides for SFR Experiments
H. B. Robinson Spent Fuel Nuclide Composition Calculations with ORIGEN-ARP ORIGEN-ARP was used to calculate the nuclide content of H. B. Robinson spent fuel for a 67 GWd/MTU burnup with the 10 year downtime in the cooling pool between cycles 5 and 6 for comparison to the ORIGEN2 calculation of the same burnup. In addition, ORIGEN-ARP was used to decay calculations of nuclide content performed by Siemens Power Corporation for Framatome ANP Richland, Inc. of the 67 GWd/MTU average burnup H. B. Robinson fuel with a somewhat different calculation method (EPRI 2001). The decayed Framatome nuclide content was used for further comparison with the ORIGEN2 and ORIGEN-ARP calculations presented in this report. ORIGEN-ARP uses a GUI interface that is a Windows application that writes a text file based on user inputs for execution in DOS within the framework of the SCALE5 code system components that were provided with the ORIGEN-ARP distribution package. ORIGEN-ARP executes the input file and can display the resulting output file. The text output file can be printed or data can be extracted to obtain the nuclide content of the fuel in ORIGEN-ARP or with other programs such as a spreadsheet program. In addition, an associated plotting program called PlotOPUS can be called within the ORIGEN-ARP GUI interface to graph results requested when the problem input was created in ORIGEN-ARP. PlotOPUS was not used to calculate nuclide composition for the burnup or decay calculations but it was used as a qualitative check of the trends in the results during the analysis. The ORIGEN-ARP GUI interface has a number of screens to specify various aspects of the calculation input. The Origen Express screen is a shortcut method of specifying simple burnup problem inputs. Detailed input screens are available as an alternative to Origen Express for more complicated calculations. The detailed input screens were used for all of the ORIGEN-ARP calculations discussed in this report. The screens are selected by pressing buttons on the ORIGEN-ARP window. The detailed screens to specify inputs are Compositions, Neutron Groups, Gamma Groups, Case Data, and Plot Setup. In addition, detailed screens for Setup and Summary allow setting up the calculation framework and displaying the inputs collected on the ORIGEN-ARP window (press Summary) that can be printed to aid in checking and correction of inputs. The detailed screen inputs will be discussed in the context of inputs for modeling the H. B. Robinson 67 GWd/MTU burnup with 10-year decay in the cooling pool between cycles 5 and 6. The Plot Setup screen inputs will not be discussed since plots were not used to calculate the nuclide compositions. ORIGEN-ARP Calculation of H. B. Robinson 67 GWd/MTU Burnup The H. B. Robinson 67 GWd/MTU burnup with 10-year decay calculation used information presented previously for this burnup in the ORIGEN2 calculation. This discussion will describe how the same and additional required inputs were specified for ORIGEN-ARP.
June 2004 25 PWR Nuclides for SFR Experiments
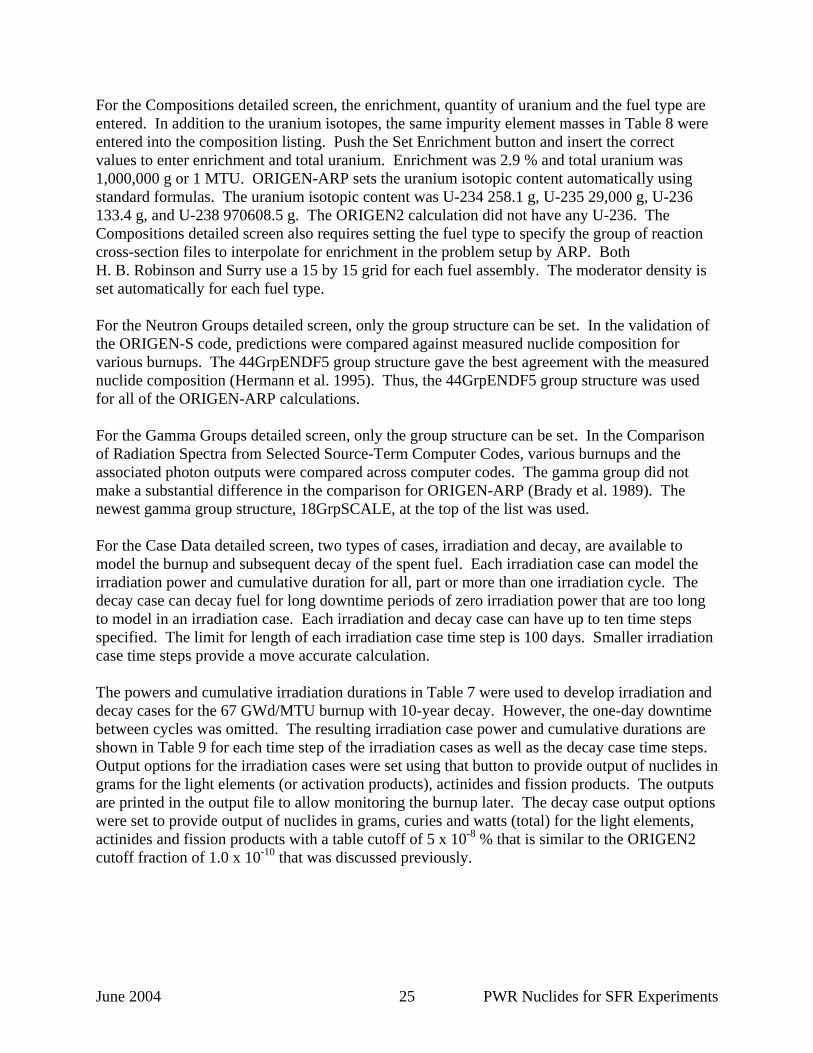
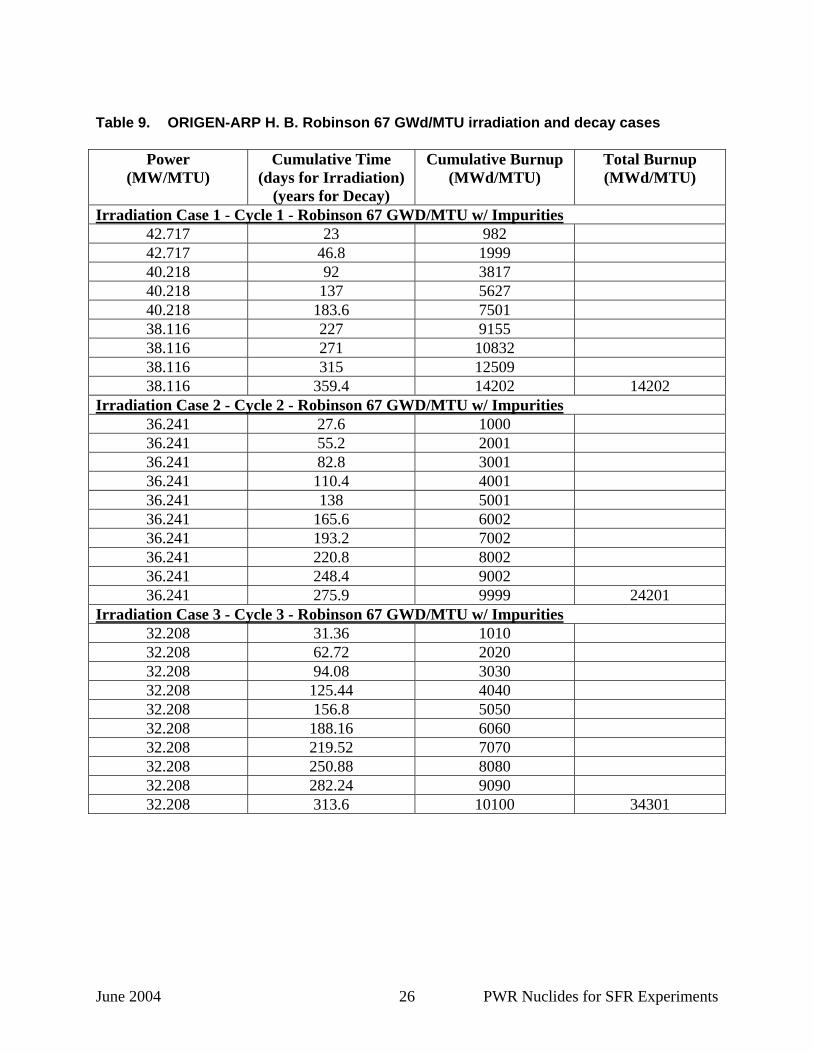
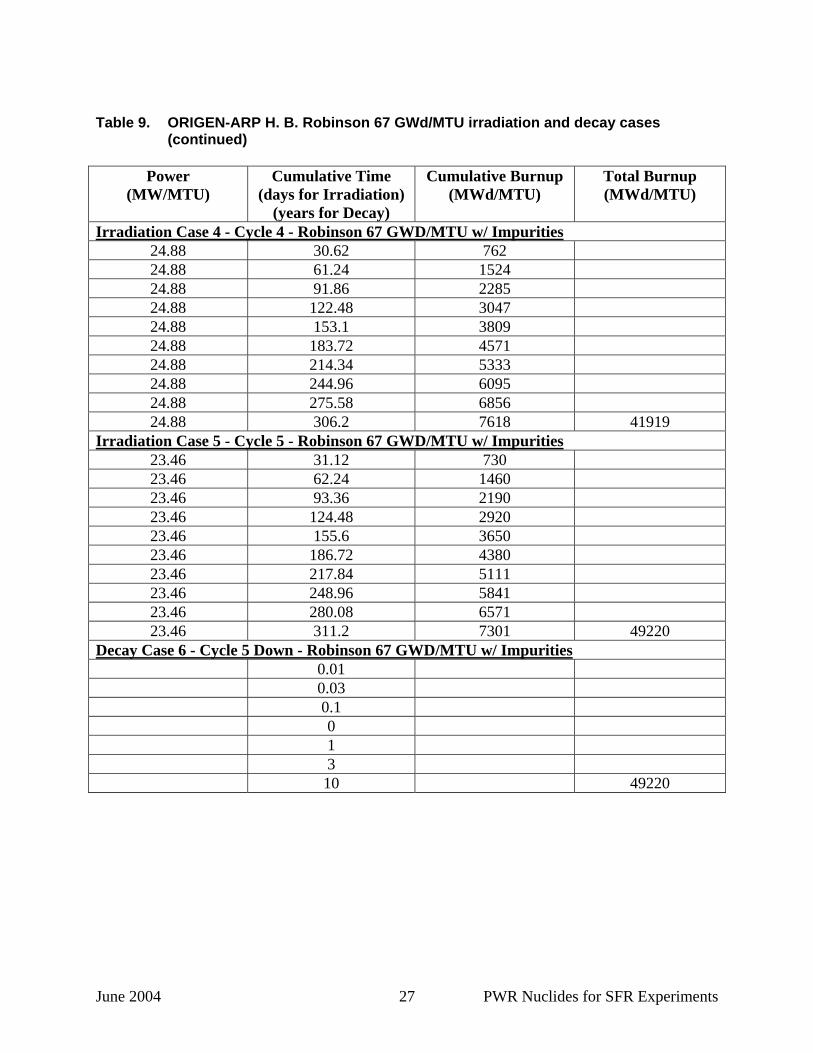
For the Compositions detailed screen, the enrichment, quantity of uranium and the fuel type are entered. In addition to the uranium isotopes, the same impurity element masses in Table 8 were entered into the composition listing. Push the Set Enrichment button and insert the correct values to enter enrichment and total uranium. Enrichment was 2.9 % and total uranium was 1,000,000 g or 1 MTU. ORIGEN-ARP sets the uranium isotopic content automatically using standard formulas. The uranium isotopic content was U-234 258.1 g, U-235 29,000 g, U-236 133.4 g, and U-238 970608.5 g. The ORIGEN2 calculation did not have any U-236. The Compositions detailed screen also requires setting the fuel type to specify the group of reaction cross-section files to interpolate for enrichment in the problem setup by ARP. Both H. B. Robinson and Surry use a 15 by 15 grid for each fuel assembly. The moderator density is set automatically for each fuel type. For the Neutron Groups detailed screen, only the group structure can be set. In the validation of the ORIGEN-S code, predictions were compared against measured nuclide composition for various burnups. The 44GrpENDF5 group structure gave the best agreement with the measured nuclide composition (Hermann et al. 1995). Thus, the 44GrpENDF5 group structure was used for all of the ORIGEN-ARP calculations. For the Gamma Groups detailed screen, only the group structure can be set. In the Comparison of Radiation Spectra from Selected Source-Term Computer Codes, various burnups and the associated photon outputs were compared across computer codes. The gamma group did not make a substantial difference in the comparison for ORIGEN-ARP (Brady et al. 1989). The newest gamma group structure, 18GrpSCALE, at the top of the list was used. For the Case Data detailed screen, two types of cases, irradiation and decay, are available to model the burnup and subsequent decay of the spent fuel. Each irradiation case can model the irradiation power and cumulative duration for all, part or more than one irradiation cycle. The decay case can decay fuel for long downtime periods of zero irradiation power that are too long to model in an irradiation case. Each irradiation and decay case can have up to ten time steps specified. The limit for length of each irradiation case time step is 100 days. Smaller irradiation case time steps provide a move accurate calculation. The powers and cumulative irradiation durations in Table 7 were used to develop irradiation and decay cases for the 67 GWd/MTU burnup with 10-year decay. However, the one-day downtime between cycles was omitted. The resulting irradiation case power and cumulative durations are shown in Table 9 for each time step of the irradiation cases as well as the decay case time steps. Output options for the irradiation cases were set using that button to provide output of nuclides in grams for the light elements (or activation products), actinides and fission products. The outputs are printed in the output file to allow monitoring the burnup later. The decay case output options were set to provide output of nuclides in grams, curies and watts (total) for the light elements, actinides and fission products with a table cutoff of 5 x 10⁻⁸ % that is similar to the ORIGEN2 cutoff fraction of 1.0 x 10⁻¹⁰ that was discussed previously.
June 2004 26 PWR Nuclides for SFR Experiments
Table 9. ORIGEN-ARP H. B. Robinson 67 GWd/MTU irradiation and decay cases
Power (MW/MTU)
Cumulative Time (days for Irradiation)
(years for Decay)
Cumulative Burnup (MWd/MTU)
Total Burnup (MWd/MTU)
Irradiation Case 1 - Cycle 1 - Robinson 67 GWD/MTU w/ Impurities 42.717 23 982 42.717 46.8 1999 40.218 92 3817 40.218 137 5627 40.218 183.6 7501 38.116 227 9155 38.116 271 10832 38.116 315 12509 38.116 359.4 14202 14202
Irradiation Case 2 - Cycle 2 - Robinson 67 GWD/MTU w/ Impurities 36.241 27.6 1000 36.241 55.2 2001 36.241 82.8 3001 36.241 110.4 4001 36.241 138 5001 36.241 165.6 6002 36.241 193.2 7002 36.241 220.8 8002 36.241 248.4 9002 36.241 275.9 9999 24201
Irradiation Case 3 - Cycle 3 - Robinson 67 GWD/MTU w/ Impurities 32.208 31.36 1010 32.208 62.72 2020 32.208 94.08 3030 32.208 125.44 4040 32.208 156.8 5050 32.208 188.16 6060 32.208 219.52 7070 32.208 250.88 8080 32.208 282.24 9090 32.208 313.6 10100 34301
June 2004 27 PWR Nuclides for SFR Experiments
Table 9. ORIGEN-ARP H. B. Robinson 67 GWd/MTU irradiation and decay cases
(continued)
Power (MW/MTU)
Cumulative Time (days for Irradiation)
(years for Decay)
Cumulative Burnup (MWd/MTU)
Total Burnup (MWd/MTU)
Irradiation Case 4 - Cycle 4 - Robinson 67 GWD/MTU w/ Impurities 24.88 30.62 762 24.88 61.24 1524 24.88 91.86 2285 24.88 122.48 3047 24.88 153.1 3809 24.88 183.72 4571 24.88 214.34 5333 24.88 244.96 6095 24.88 275.58 6856 24.88 306.2 7618 41919
Irradiation Case 5 - Cycle 5 - Robinson 67 GWD/MTU w/ Impurities 23.46 31.12 730 23.46 62.24 1460 23.46 93.36 2190 23.46 124.48 2920 23.46 155.6 3650 23.46 186.72 4380 23.46 217.84 5111 23.46 248.96 5841 23.46 280.08 6571 23.46 311.2 7301 49220
Decay Case 6 - Cycle 5 Down - Robinson 67 GWD/MTU w/ Impurities 0.01 0.03 0.1 0 1 3 10 49220
June 2004 28 PWR Nuclides for SFR Experiments
Table 9. ORIGEN-ARP H. B. Robinson 67 GWd/MTU irradiation and decay cases
(continued)
Power (MW/MTU)
Cumulative Time (days for Irradiation)
(years for Decay)
Cumulative Burnup (MWd/MTU)
Total Burnup (MWd/MTU)
Irradiation Case 7 - Cycle 6 & 7 - Robinson 67 GWD/MTU w/ Impurities 24.142 82 1980 24.142 165 3983 24.142 248 5987 24.142 331 7991 24.142 414.2 10000 18.8 496 11537 18.8 579 13098 18.8 662 14658 18.8 745 16219 18.8 828.9 17796 67016
Decay Case 8 - Cycle 6 & 7 Down - Robinson 67 GWD/MTU w/ Impurities 0.01 0.03 0.1 0 1 3 5 8 10 67016
ORIGEN-ARP Decay of Siemens/Framatome H. B. Robinson 67 GWd/MTU Burnup ORIGEN-ARP was used to decay calculations of nuclide content performed by Siemens Power Corporation for Framatome ANP Richland, Inc. of the 67 GWd/MTU burnup H. B. Robinson fuel with a somewhat different calculation method (EPRI 2001). The decayed Siemans/Framatome nuclide content was used for further comparison with the ORIGEN2 and ORIGEN-ARP calculations presented in this report. As described in (EPRI 2001), neutronics calculations were performed to support the shipment of the 12 fuel rods removed from the S-15H assembly of H. B. Robinson to the hot cell facility at ANL. Data required for shipping and handling of these rods included fissile content in the rods, decay heat of the rods, and the activities of the radionuclides in the rods. Power histories were generated for these rods and were used in conjunction with the ORIGEN code to obtain the required data. Cooling time for fuel assembly S-15H was based on a discharge date of April 28, 1995. The data calculated by ORIGEN included a cooling time of 1829 days for a calculated date of April 30, 2000 (5 years decay) for the shipment.
June 2004 29 PWR Nuclides for SFR Experiments
A newer methodology was used to regenerate power histories for (EPRI 2001). This methodology used PRISM, a 3-dimensional reactor physics nodal simulator, and included a rod power reconstruction methodology that provided rod-by-rod powers and burnups. The methodology used in PRISM is more advanced than that used in previous methodologies, and was expected to provide a more accurate representation of the actual rod burnup. (EPRI 2001) indicated that the uranium mass for each rod was 2096.1 g. The ORIGEN calculations were for only the uranium in the UO2 fuel and did not include oxygen or impurities. (EPRI 2001) ORIGEN calculations included the nuclide content of the rod cladding as a separate tabulation from the actinides and the fission product tables. The version of the ORIGEN code used for the calculations was not given. The burnup listed for rod R01 from the PRISM methodology was 66.904 GWd/MTU, which is slightly less than the 67 GWd/MTU burnup provided previously by ANL for the average rod burnup. Rod R0l used the activities listed for rod B01 in the (EPRI 2001) nuclide composition listings due to their symmetric locations in the S-15H fuel assembly. All 12 of the assembly S-15H rods that were shipped to ANL had been in H. B. Robinson fuel assembly G-38 for the first five cycles of their total seven cycles of burnup (EPRI 2001). However, the positions of R01 and rod B01 may not have been symmetric during the initial five cycles in fuel assembly G38. Since the principle investigators are listed as E. J. Ruzauskas and K. N. Fardell for the May 2001 (EPRI 2001) report, it was assumed that the power histories transmitted to GE Vallecitos Nuclear Center by Ruzauskas in (Ruzauskas 2001) were the same power element histories referred to as calculated in (EPRI 2001). Comparing the rod power history for R01 shown in Figure 1 with the corresponding with rod power history for B01 from (Ruzauskas 2001) confirms that they are identical for the portion of the burnup from approximately 49 GWD/MTU of the burnup though the last two cycles. Rod B01 has slightly lower power histories for the first three cycles than rod R01, the same power levels for the fourth cycle and slightly higher power history for the fifth cycle. Thus, the power history for rod B01 was probably a good approximation for rod R01. ORIGEN-ARP was used to decay the (EPRI 2001) Siemans/Framatome nuclide compositions from a 5-year to an 8-year decay to match the standard 8-year decay time in the nuclide composition calculations for H. B. Robinson. The ORIGEN-ARP inputs used for the additional 3-year decay are described below. For the Compositions detailed screen of ORIGEN-ARP, no uranium enrichment was listed for the decay only calculation but a fuel type of 15 by 15 was used. The initial nuclide composition activities in curies were listed for the actinides and for the fission products for a total of 145 entries. The (EPRI 2001) rod calculated activities used were as listed in Tables 10 and 11 for the actinides and the fission products respectively. For the Neutron Groups detailed screen, only the group structure can be set. The 44GrpENDF5 group structure was used for this as for all other ORIGEN-ARP calculations. For the Gamma Groups detailed screen, only the group structure can be set. The 18GrpSCALE group structure was used.

June 2004 30 PWR Nuclides for SFR Experiments
For the Case Data detailed screen, one decay case was used to model the decay of the spent fuel. Cumulative decay times chosen were 0.01, 0.03, 0.1, 0.3, 1, 2, 3, 5, 8, and 10 years. Output results for nuclides were printed in grams and curies for the light elements, actinides and fission products with a table cutoff of 5 x 10⁻¹⁰ %. Table 10. Siemens calculated actinide activity for rod R01 with 5 years decay Actinide Activity
(Ci) Actinide Activity
(Ci) Actinide Activity
(Ci) Actinide Activity
(Ci) Tl207 6.62E-09 Rn219 6.64E-09 Pa234m 6.06E-04 Am242m 7.56E-02Tl208 4.36E-05 Rn220 1.21E-04 Pa234 6.06E-07 Am242 7.56E-02Tl209 8.32E-11 Rn222 1.17E-10 U232 1.47E-04 Am243 2.76E-01Pb209 3.78E-09 Fr221 3.78E-09 U233 6.96E-08 Am244 1.19E-16Pb210 1.89E-11 Fr223 9.30E-11 U234 7.92E-04 Am245 3.76E-09Pb211 6.64E-09 Ra223 6.64E-09 U235 3.40E-06 Cm242 2.58E-01Pb212 1.21E-04 Ra224 1.21E-04 U236 4.90E-04 Cm243 1.16E-01Pb214 1.17E-10 Ra225 3.78E-09 U237 6.04E-03 Cm244 9.00E+01Bi210 1.89E-11 Ra226 1.17E-10 U238 6.06E-04 Cm245 2.58E-02Bi211 6.64E-09 Ra228 3.00E-13 U240 9.16E-14 Cm246 1.79E-02Bi212 1.21E-04 Ac225 3.78E-09 Np237 1.21E-03 Cm247 1.84E-07Bi213 3.78E-09 Ac227 6.64E-09 Np239 2.76E-01 Cm248 1.76E-06Bi214 1.17E-10 Ac228 3.00E-13 Np240m 9.16E-14 Cm250 6.42E-13Po210 1.89E-11 Th227 6.54E-09 Pu236 7.80E-04 Bk249 2.42E-04Po211 1.99E-11 Th228 1.21E-04 Pu238 3.06E+01 Bk250 6.42E-13Po212 7.70E-05 Th229 3.78E-09 Pu239 6.80E-01 Cf249 4.28E-05Po213 3.70E-09 Th230 4.06E-08 Pu240 1.22E+00 Cf250 1.62E-04Po214 1.17E-10 Th231 3.40E-06 Pu241 2.52E+02 Cf251 2.12E-06Po215 6.84E-08 Th232 5.00E-13 Pu242 9.04E-03 Cf252 2.94E-04Po216 1.21E-04 Th234 6.06E-04 Pu243 1.64E-07 Cf254 2.70E-17Po218 1.17E-10 Pa231 3.08E-08 Pu244 9.18E-14 Total 3.78E+02At217 3.78E-09 Pa233 1.21E-03 Am241 2.84E+00 Table 11. Siemens calculated fission product activity for rod R01 with 5 years decay Actinide Activity
(Ci) Actinide Activity
(Ci) Actinide Activity
(Ci) Actinide Activity
(Ci) H3 1.85E+00 Rh103m 2.48E-11 Te123m 1.75E-07 Ba137m 3.06E+02Se79 1.49E-03 Ru106 3.80E+01 Sb124 1.43E-09 Ce141 1.81E-14Kr85 1.48E+01 Rh106 3.80E+01 Sb125 5.58E+00 Ce144 1.47E+01Rb87 6.38E-08 Pd107 6.84E-04 Te125m 2.30E+00 Pr144 1.47E+01Sr89 1.74E-08 Ag109m 4.98E-08 Sn126 3.08E-03 Pm147 4.50E+01Sr90 1.73E+02 Cd109 4.98E-08 Sb126 3.04E-03 Pm148 3.80E-13Y90 1.73E+02 Ag110 1.67E-02 Sb126m 3.08E-03 Pm148m 4.72E-12Y91 4.14E-07 Ag110m 1.28E-01 Te127 2.48E-04 Sm151 3.72E+00Zr93 6.70E-03 Cd113m 1.20E-01 Te127m 2.50E-04 Eu152 3.88E-02Nb93m 3.70E-03 In114 1.11E-12 Te129 3.66E-15 Gd153 5.56E-03Zr95 5.92E-06 In114m 1.15E-12 Te129m 5.70E-15 Eu154 3.38E+01Nb95 1.28E-05 Cd115m 1.76E-13 I129 1.63E-04 Eu155 6.06E+00Nb95m 1.26E-07 Sn119m 1.96E-04 Cs134 1.69E+02 Tb160 1.56E-07Tc99 5.38E-02 Sn121m 7.20E-06 Cs135 1.12E-03 Ho166m 3.78E-05Ru103 2.48E-11 Sn123 6.28E-04 Cs137 3.28E+02 Total 1.37E+03
June 2004 31 PWR Nuclides for SFR Experiments
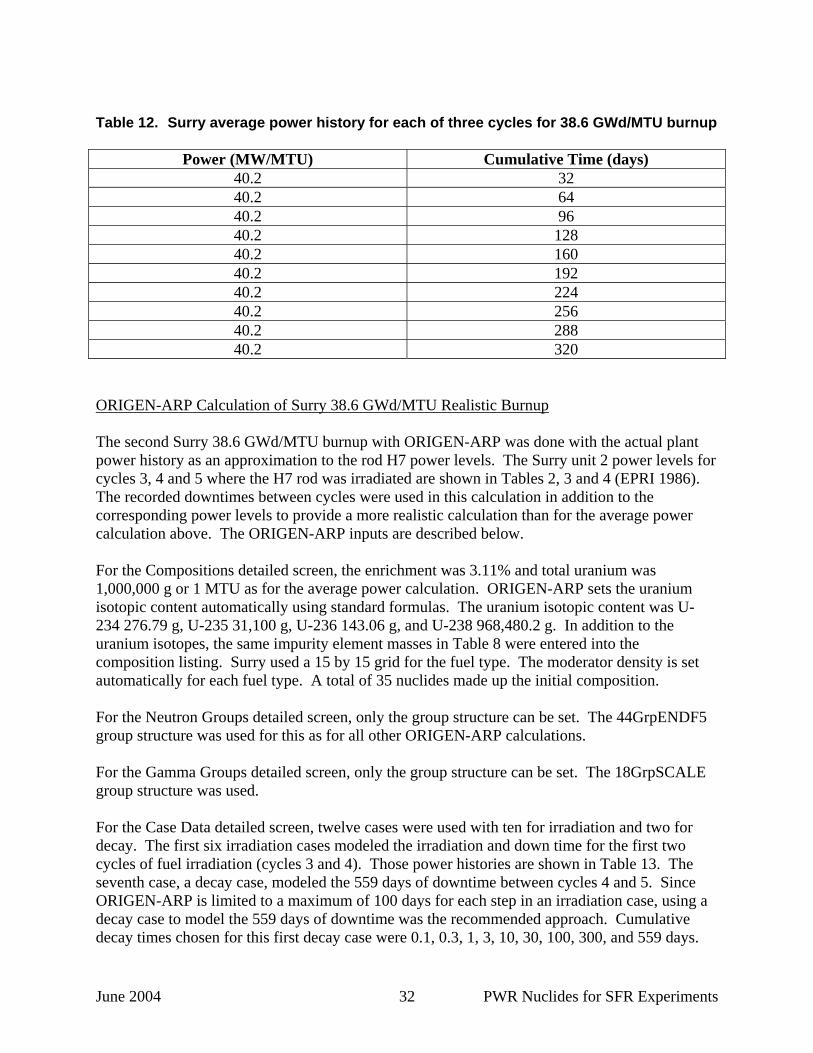
Surry Spent Fuel Nuclide Composition Calculations with ORIGEN-ARP The Surry spent fuel rod H7 from the T11 fuel assembly was irradiated to an average burnup of 35.7 GWd/MTU. The peak burnup section where the samples would be taken had a burnup of 38.6 GWd/MTU. The fuel exited the reactor on November 6, 1981 (EPRI 1986). Two calculations of nuclide composition were done for the Surry spent fuel. The first used an average power history with no downtime between cycles as it was done before the real power history was known. The second calculation was done using the actual (realistic) power history and inter-cycle downtime. The two calculations were called the average burnup and the realistic burnup. Both calculations included a 22-year decay of the spent fuel to November 6, 2003. ORIGEN-ARP Calculation of Surry 38.6 GWd/MTU Average Burnup The Surry fuel had an enrichment of 3.11% U-235. The oxygen and UO2 impurities of Table 8 were used along with the uranium for the initial UO2 composition. The power history assumed for this early scoping calculation was a constant power of 40.2 MW/MTU for 320 days in each of the three cycles of fuel irradiation. The ORIGEN-ARP inputs are described below. For the Compositions detailed screen, the enrichment was 3.11% and total uranium was 1,000,000 g or 1 MTU. ORIGEN-ARP sets the uranium isotopic content automatically using standard formulas. The uranium isotopic content was U-234 276.79 g, U-235 31,100 g, U-236 143.06 g, and U-238 968,480.2 g. In addition to the uranium isotopes, the same impurity element masses in Table 8 were entered into the composition listing. Surry used a 15 by 15 grid for the fuel type. The moderator density is set automatically for each fuel type. A total of 35 nuclides made up the initial composition. For the Neutron Groups detailed screen, only the group structure can be set. The 44GrpENDF5 group structure was used for this as for all other ORIGEN-ARP calculations. For the Gamma Groups detailed screen, only the group structure can be set. The 18GrpSCALE group structure was used. For the Case Data detailed screen, three cases for irradiation and one case for decay were used to model three cycles of fuel irradiation and the decay of the spent fuel after removal from the reactor. The power and irradiation time for each of the three cycles of irradiation were as shown in Table 12. Burnup for each irradiation cycle was 12.864 GWd/MTU for a total modeled burnup of 38.592 GWd/MTU. The average power and resulting irradiation times were chosen to produce a cycle time of less than one year (320 days). The resulting average power levels (40.2 MW/MTU) exceed the typical PWR power levels (33 to 34 MW/MTU) described in Appendix H of Duderstadt and Hamilton (1976) so the burnup should produce conservatively high nuclide compositions. Cumulative decay times chosen were 0.01, 0.03, 0.1, 0.3, 1, 3, 5, 8, 10, and 22 years. Output results for nuclides were printed in grams, curies and watts for the light elements, actinides and fission products with a table cutoff of 5 x 10⁻⁸ %.
June 2004 32 PWR Nuclides for SFR Experiments
Table 12. Surry average power history for each of three cycles for 38.6 GWd/MTU burnup
Power (MW/MTU) Cumulative Time (days) 40.2 32 40.2 64 40.2 96 40.2 128 40.2 160 40.2 192 40.2 224 40.2 256 40.2 288 40.2 320
ORIGEN-ARP Calculation of Surry 38.6 GWd/MTU Realistic Burnup The second Surry 38.6 GWd/MTU burnup with ORIGEN-ARP was done with the actual plant power history as an approximation to the rod H7 power levels. The Surry unit 2 power levels for cycles 3, 4 and 5 where the H7 rod was irradiated are shown in Tables 2, 3 and 4 (EPRI 1986). The recorded downtimes between cycles were used in this calculation in addition to the corresponding power levels to provide a more realistic calculation than for the average power calculation above. The ORIGEN-ARP inputs are described below. For the Compositions detailed screen, the enrichment was 3.11% and total uranium was 1,000,000 g or 1 MTU as for the average power calculation. ORIGEN-ARP sets the uranium isotopic content automatically using standard formulas. The uranium isotopic content was U-234 276.79 g, U-235 31,100 g, U-236 143.06 g, and U-238 968,480.2 g. In addition to the uranium isotopes, the same impurity element masses in Table 8 were entered into the composition listing. Surry used a 15 by 15 grid for the fuel type. The moderator density is set automatically for each fuel type. A total of 35 nuclides made up the initial composition. For the Neutron Groups detailed screen, only the group structure can be set. The 44GrpENDF5 group structure was used for this as for all other ORIGEN-ARP calculations. For the Gamma Groups detailed screen, only the group structure can be set. The 18GrpSCALE group structure was used. For the Case Data detailed screen, twelve cases were used with ten for irradiation and two for decay. The first six irradiation cases modeled the irradiation and down time for the first two cycles of fuel irradiation (cycles 3 and 4). Those power histories are shown in Table 13. The seventh case, a decay case, modeled the 559 days of downtime between cycles 4 and 5. Since ORIGEN-ARP is limited to a maximum of 100 days for each step in an irradiation case, using a decay case to model the 559 days of downtime was the recommended approach. Cumulative decay times chosen for this first decay case were 0.1, 0.3, 1, 3, 10, 30, 100, 300, and 559 days.
June 2004 33 PWR Nuclides for SFR Experiments
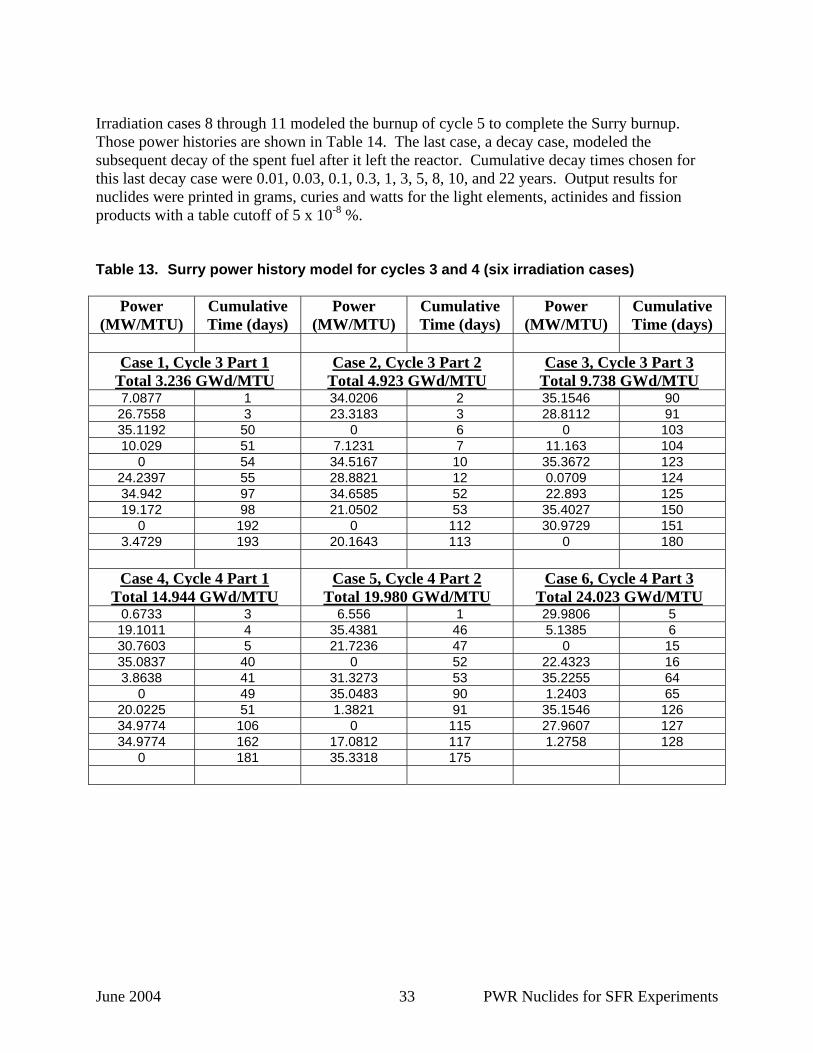
Irradiation cases 8 through 11 modeled the burnup of cycle 5 to complete the Surry burnup. Those power histories are shown in Table 14. The last case, a decay case, modeled the subsequent decay of the spent fuel after it left the reactor. Cumulative decay times chosen for this last decay case were 0.01, 0.03, 0.1, 0.3, 1, 3, 5, 8, 10, and 22 years. Output results for nuclides were printed in grams, curies and watts for the light elements, actinides and fission products with a table cutoff of 5 x 10⁻⁸ %. Table 13. Surry power history model for cycles 3 and 4 (six irradiation cases)
Power (MW/MTU)
Cumulative Time (days)
Power (MW/MTU)
Cumulative Time (days)
Power (MW/MTU)
Cumulative Time (days)
Case 1, Cycle 3 Part 1
Total 3.236 GWd/MTU Case 2, Cycle 3 Part 2
Total 4.923 GWd/MTU Case 3, Cycle 3 Part 3
Total 9.738 GWd/MTU 7.0877 1 34.0206 2 35.1546 90 26.7558 3 23.3183 3 28.8112 91 35.1192 50 0 6 0 103 10.029 51 7.1231 7 11.163 104
0 54 34.5167 10 35.3672 123 24.2397 55 28.8821 12 0.0709 124 34.942 97 34.6585 52 22.893 125 19.172 98 21.0502 53 35.4027 150
0 192 0 112 30.9729 151 3.4729 193 20.1643 113 0 180
Case 4, Cycle 4 Part 1
Total 14.944 GWd/MTU Case 5, Cycle 4 Part 2
Total 19.980 GWd/MTU Case 6, Cycle 4 Part 3
Total 24.023 GWd/MTU 0.6733 3 6.556 1 29.9806 5 19.1011 4 35.4381 46 5.1385 6 30.7603 5 21.7236 47 0 15 35.0837 40 0 52 22.4323 16 3.8638 41 31.3273 53 35.2255 64
0 49 35.0483 90 1.2403 65 20.0225 51 1.3821 91 35.1546 126 34.9774 106 0 115 27.9607 127 34.9774 162 17.0812 117 1.2758 128
0 181 35.3318 175
June 2004 34 PWR Nuclides for SFR Experiments
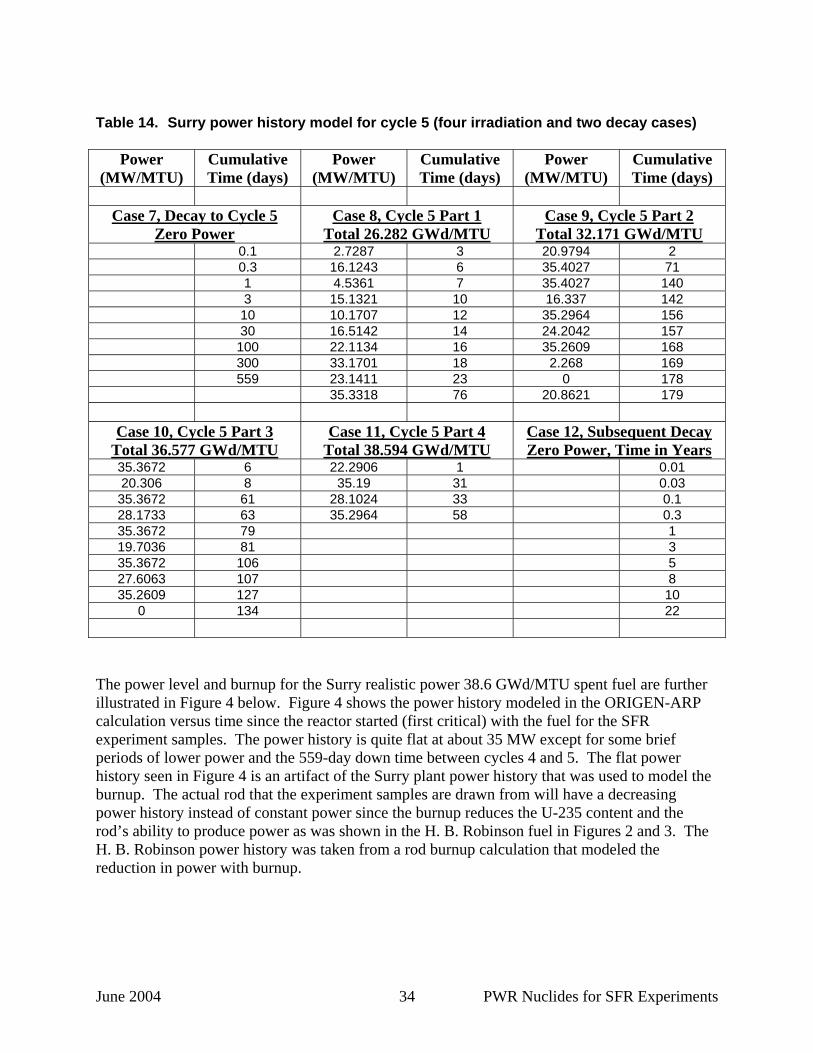
Table 14. Surry power history model for cycle 5 (four irradiation and two decay cases)
Power (MW/MTU)
Cumulative Time (days)
Power (MW/MTU)
Cumulative Time (days)
Power (MW/MTU)
Cumulative Time (days)
Case 7, Decay to Cycle 5
Zero Power Case 8, Cycle 5 Part 1
Total 26.282 GWd/MTU Case 9, Cycle 5 Part 2
Total 32.171 GWd/MTU 0.1 2.7287 3 20.9794 2 0.3 16.1243 6 35.4027 71 1 4.5361 7 35.4027 140 3 15.1321 10 16.337 142 10 10.1707 12 35.2964 156 30 16.5142 14 24.2042 157 100 22.1134 16 35.2609 168 300 33.1701 18 2.268 169 559 23.1411 23 0 178 35.3318 76 20.8621 179
Case 10, Cycle 5 Part 3
Total 36.577 GWd/MTU Case 11, Cycle 5 Part 4
Total 38.594 GWd/MTU Case 12, Subsequent Decay Zero Power, Time in Years
35.3672 6 22.2906 1 0.01 20.306 8 35.19 31 0.03 35.3672 61 28.1024 33 0.1 28.1733 63 35.2964 58 0.3 35.3672 79 1 19.7036 81 3 35.3672 106 5 27.6063 107 8 35.2609 127 10
0 134 22 The power level and burnup for the Surry realistic power 38.6 GWd/MTU spent fuel are further illustrated in Figure 4 below. Figure 4 shows the power history modeled in the ORIGEN-ARP calculation versus time since the reactor started (first critical) with the fuel for the SFR experiment samples. The power history is quite flat at about 35 MW except for some brief periods of lower power and the 559-day down time between cycles 4 and 5. The flat power history seen in Figure 4 is an artifact of the Surry plant power history that was used to model the burnup. The actual rod that the experiment samples are drawn from will have a decreasing power history instead of constant power since the burnup reduces the U-235 content and the rod’s ability to produce power as was shown in the H. B. Robinson fuel in Figures 2 and 3. The H. B. Robinson power history was taken from a rod burnup calculation that modeled the reduction in power with burnup.

June 2004 35 PWR Nuclides for SFR Experiments
0
5
10
15
20
25
30
35
40
0 200 400 600 800 1000 1200 1400 1600 1800 2000
Time Since First Critical (days)
Fuel
Pow
er L
evel
(MW
/MTU
)
Figure 4. Surry Power History for the ORIGEN-ARP Calculation
Parametric Spent Fuel Nuclide Composition Calculations with ORIGEN-ARP Parametric nuclide compositions were calculated with ORIGEN-ARP to facilitate a parametric analysis of the hazards of various spent fuel burnups with decay time. Only one fuel enrichment was calculated in the parameter study but the same methodology could be used for other enrichments. Nuclide compositions for burnups of 12 to 72 GWd/MTU in 12 GWd/MTU steps were calculated. All six calculations used an average power of 37.5 MW for 320-day irradiations to provide a burnup of 12 GWd/MTU per cycle in one irradiation case. The individual calculations used additional cycles to provide the needed burnup. No downtime was assumed between cycles. A final decay case provided a range of time since removal from the reactor to include that variation in the parameter study as well. The ORIGEN-ARP inputs are described below. For the Compositions detailed screen, the enrichment was 3.0% and total uranium was 1,000,000 g or 1 MTU as for the parametric calculations. ORIGEN-ARP sets the uranium isotopic content automatically using standard formulas. The uranium isotopic content was U-234 267.0 g, U-235 30,000 g, U-236 138.0 g, and U-238 969,595 g. In addition to the uranium isotopes, the same impurity element masses in Table 8 were entered into the composition listing. The calculations used a 15 by 15 grid for the fuel type. The moderator density is set automatically for each fuel type. A total of 35 nuclides made up the initial composition.
June 2004 36 PWR Nuclides for SFR Experiments
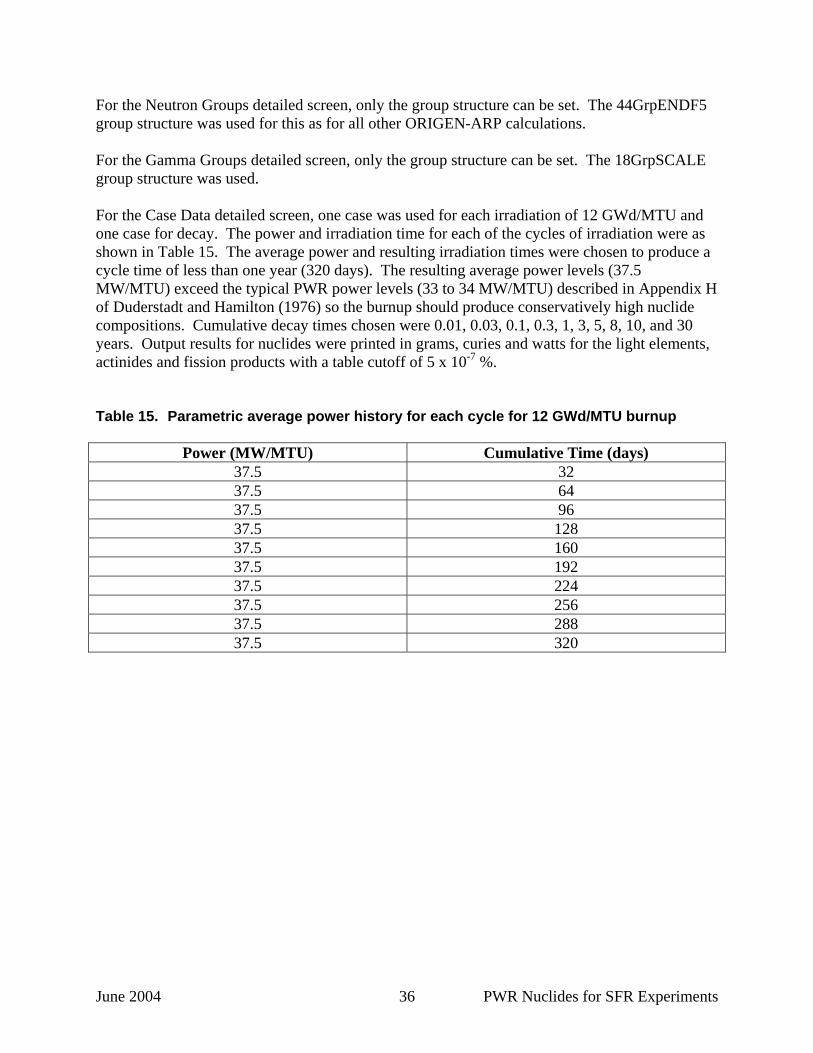
For the Neutron Groups detailed screen, only the group structure can be set. The 44GrpENDF5 group structure was used for this as for all other ORIGEN-ARP calculations. For the Gamma Groups detailed screen, only the group structure can be set. The 18GrpSCALE group structure was used. For the Case Data detailed screen, one case was used for each irradiation of 12 GWd/MTU and one case for decay. The power and irradiation time for each of the cycles of irradiation were as shown in Table 15. The average power and resulting irradiation times were chosen to produce a cycle time of less than one year (320 days). The resulting average power levels (37.5 MW/MTU) exceed the typical PWR power levels (33 to 34 MW/MTU) described in Appendix H of Duderstadt and Hamilton (1976) so the burnup should produce conservatively high nuclide compositions. Cumulative decay times chosen were 0.01, 0.03, 0.1, 0.3, 1, 3, 5, 8, 10, and 30 years. Output results for nuclides were printed in grams, curies and watts for the light elements, actinides and fission products with a table cutoff of 5 x 10⁻⁷ %. Table 15. Parametric average power history for each cycle for 12 GWd/MTU burnup
Power (MW/MTU) Cumulative Time (days) 37.5 32 37.5 64 37.5 96 37.5 128 37.5 160 37.5 192 37.5 224 37.5 256 37.5 288 37.5 320
June 2004 37 PWR Nuclides for SFR Experiments
Calculated Spent Fuel Nuclide Compositions
The nuclide composition results of the burnup calculations described in the last chapter are discussed below. Results were obtained for the H. B. Robinson 72 GWd/MTU spent fuel with ORIGEN2 and are discussed to guide their use in SFR experiment planning. Other ORIGEN2 and ORIGEN-ARP calculated nuclide compositions for H. B. Robinson 67 GWd/MTU spent fuel are discussed and compared as a check on the accuracy of the 72 GWd/MTU ORIGEN2 calculations. The ORIGEN-ARP nuclide compositions for Surry 38.6 GWd/MTU fuel are also discussed for use in SFR experiment planning. The results for the parametric burnup nuclide composition calculations are discussed with the results of the parametric hazard assessment in the next chapter. Nuclide Composition of H. B. Robinson 72 GWd/MTU Spent Fuel The nuclide composition of the H. B. Robinson NPP spent fuel was calculated using ORIGEN2 as described above. This very high burnup, 72 GWd/MTU spent fuel with a low 2.9 % U-235 enrichment produced the highest nuclide activity of any calculated. The 8 years of decay to reach April 28, 2003 resulted in a depletion of fission product activity and retention of strong actinide activity that will be shown in the next chapter to dominate most radiological hazards for this spent fuel in SFR experiment planning. Appendix B provides a tabulation of the nuclide content for 8 years of decay for activation products of the UO2 impurities (light elements), actinides and fission products as well as the combined activity for each nuclide. Table 16 presents the total activities for each component of the nuclide composition. The tabulation is for 1 MTU of UO2 and per gram of UO2 based on the initial mass of UO2 including oxygen and impurities. The nuclide content can be obtained for the SFR experiment sample size by multiplying by its UO2 mass of 38.6 g. The tabulated data includes only contributions from the spent UO2 fuel and not from irradiated cladding as the contribution from the cladding is small. Appendix B also contains the gamma photon output for activation products, actinides and fission products and the neutron and alpha particle output for the actinides for 1 MTU of spent fuel. The gamma photon output may be used for calculation of the direct exposure from a SFR experiment sample by scaling the exposure and dose rates for the 1 MTU source by the ratio of the mass of the experiment sample (38.6 g) to the initial UO2 mass of 1 MTU (1,134,810.2 g). The gamma photon output of the spent fuel is tabulated for 18 energy bins. The gamma photon output is dominated by the contribution of the fission products. Photon energy group 9 with mean photon energy of 0.575 MeV dominates the gamma photon emission with 69 % of the total photon energy emission rate. Photon energy groups 10 and 11 provide lesser dominant contributions with 16 and 8 % of the total photon energy emission rate. The other photon energy groups contribute approximately 1 % or less of the total photon energy emission rate.
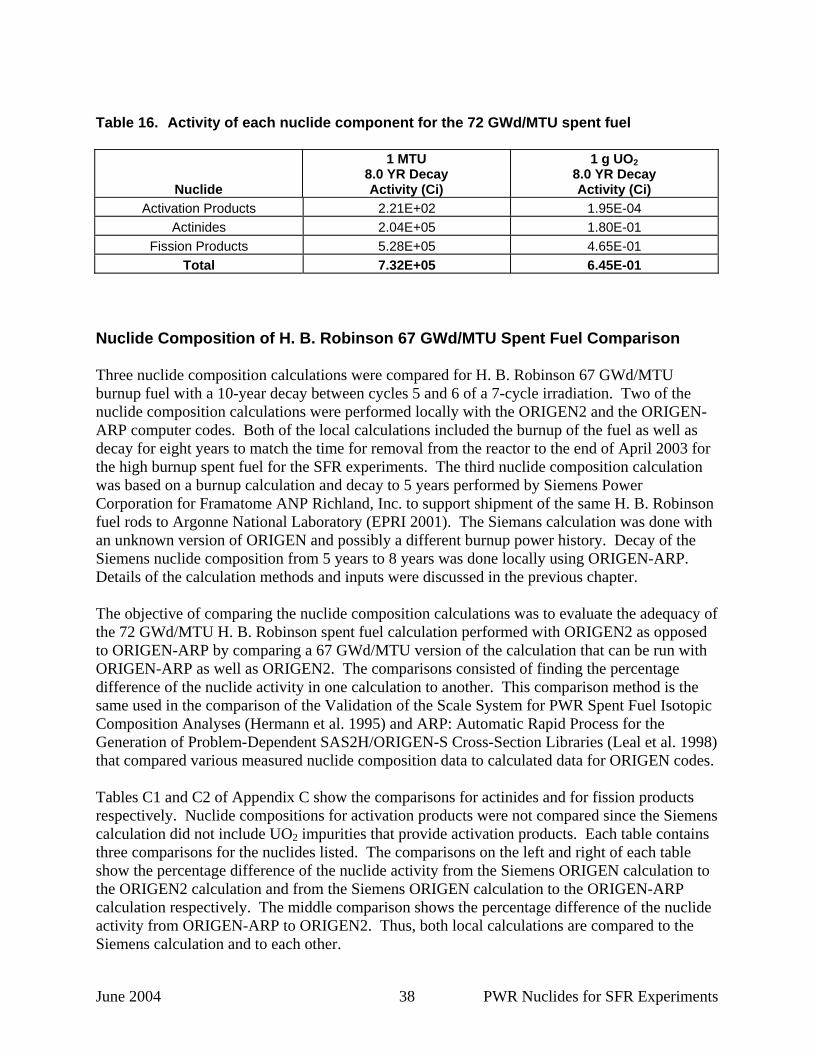
June 2004 38 PWR Nuclides for SFR Experiments
Table 16. Activity of each nuclide component for the 72 GWd/MTU spent fuel
Nuclide
1 MTU 8.0 YR Decay Activity (Ci)
1 g UO2 8.0 YR Decay Activity (Ci)
Activation Products 2.21E+02 1.95E-04 Actinides 2.04E+05 1.80E-01
Fission Products 5.28E+05 4.65E-01 Total 7.32E+05 6.45E-01
Nuclide Composition of H. B. Robinson 67 GWd/MTU Spent Fuel Comparison Three nuclide composition calculations were compared for H. B. Robinson 67 GWd/MTU burnup fuel with a 10-year decay between cycles 5 and 6 of a 7-cycle irradiation. Two of the nuclide composition calculations were performed locally with the ORIGEN2 and the ORIGEN-ARP computer codes. Both of the local calculations included the burnup of the fuel as well as decay for eight years to match the time for removal from the reactor to the end of April 2003 for the high burnup spent fuel for the SFR experiments. The third nuclide composition calculation was based on a burnup calculation and decay to 5 years performed by Siemens Power Corporation for Framatome ANP Richland, Inc. to support shipment of the same H. B. Robinson fuel rods to Argonne National Laboratory (EPRI 2001). The Siemans calculation was done with an unknown version of ORIGEN and possibly a different burnup power history. Decay of the Siemens nuclide composition from 5 years to 8 years was done locally using ORIGEN-ARP. Details of the calculation methods and inputs were discussed in the previous chapter. The objective of comparing the nuclide composition calculations was to evaluate the adequacy of the 72 GWd/MTU H. B. Robinson spent fuel calculation performed with ORIGEN2 as opposed to ORIGEN-ARP by comparing a 67 GWd/MTU version of the calculation that can be run with ORIGEN-ARP as well as ORIGEN2. The comparisons consisted of finding the percentage difference of the nuclide activity in one calculation to another. This comparison method is the same used in the comparison of the Validation of the Scale System for PWR Spent Fuel Isotopic Composition Analyses (Hermann et al. 1995) and ARP: Automatic Rapid Process for the Generation of Problem-Dependent SAS2H/ORIGEN-S Cross-Section Libraries (Leal et al. 1998) that compared various measured nuclide composition data to calculated data for ORIGEN codes. Tables C1 and C2 of Appendix C show the comparisons for actinides and for fission products respectively. Nuclide compositions for activation products were not compared since the Siemens calculation did not include UO2 impurities that provide activation products. Each table contains three comparisons for the nuclides listed. The comparisons on the left and right of each table show the percentage difference of the nuclide activity from the Siemens ORIGEN calculation to the ORIGEN2 calculation and from the Siemens ORIGEN calculation to the ORIGEN-ARP calculation respectively. The middle comparison shows the percentage difference of the nuclide activity from ORIGEN-ARP to ORIGEN2. Thus, both local calculations are compared to the Siemens calculation and to each other.

June 2004 39 PWR Nuclides for SFR Experiments
Actinide Activity Comparisons for 67 GWd/MTU Burnup Calculations For the actinide comparison of nuclide activity changes from the ORIGEN-ARP to the ORIGEN2 calculations, the percentage change of only a few actinides was 10% or less to indicate good agreement between the calculations. Most of the actinides in that comparison had changes larger than 10% and ranged as high as 50% to 70% for some nuclides with one much larger change. Missing comparisons in the tables indicated that the nuclide was not in the output of one or both calculations. Large negative changes (60% to 70%) occurred for actinides with atomic number higher than for curium (Cm) nuclides. The differences in calculated activity are probably produced by the different cross sections used for the two calculations since they used very similar burnup modeling. ORIGEN-ARP used multiple cross section sets that varied with burnup to characterize the effect of changing actinide concentrations with burnup while ORIGEN2 used the same cross section set throughout the burnup. Since most of the percentage changes and the change for the total activity were positive, the ORIGEN2 activity results were considered higher or more conservative than the ORIGEN-ARP results for the actinides. For the actinide comparison of nuclide activity changes from the Siemens to the ORIGEN-ARP calculations, the percentage changes were smaller than for the ORIGEN-ARP to the ORIGEN2 calculations with most changes ranging from 10% to 40% and a comparable number of changes less than 10%. As before, large negative changes (50% to 70%) occurred for actinides with higher atomic weight than Cm-244 and Cm-244 had a –27% change. As most ORIGEN codes use similar methods, the reason for differences was probably different cross sections or different modeling of the burnup. Since most of the percentage changes and the change for the total activity were positive, the ORIGEN-ARP activity results might be more conservative than the Siemens results for the actinides. For the actinide comparison of nuclide activity changes from the Siemens to the ORIGEN2 calculations, the percentage change of only a few actinides was 10% or less and the percentage change for most nuclides was larger than either of the previous comparisons. Again, large negative changes (50% to 70%) occurred for actinides with higher atomic weight than Cm-244 and Cm-244 had a –22% change. Since most of the percentage changes and the change for the total activity were positive, the ORIGEN-2 activity results might be more conservative than the Siemens results for the actinides. The actinides produce the most stressing part of the radiological hazards for the H. B. Robinson 72 GWd/MTU spent fuel as presented in the next chapter. In Table C1, the actinide nuclides that were assessed to produce the highest contributions to the radiological hazards are shown as bold text. These actinide nuclides were Pu-238, Pu-241, Am-241, and Cm-244. The percentage change for Pu-238 was less than 10% for all comparisons and positive for ORIGEN2 results; thus, ORIGEN2 results provided the highest radiological hazard for Pu-238. The Pu-241 and Am-241 had large positive percentage changes for ORIGEN2 compared to the other two calculations; thus ORIGEN2 results provided the highest radiological hazard. Cm-244 had a negative percentage change of –22% from the Siemens to the ORIGEN2 results and –27% from the Siemens to the ORIGEN-ARP results; thus Siemens results provided the highest radiological hazard for Cm-244 (~29% more airborne dose than for the ORIGEN2 Cm-244).

June 2004 40 PWR Nuclides for SFR Experiments
Fission Product Activity Comparisons for 67 GWd/MTU Burnup Calculations For the fission product comparison of nuclide activity changes from the ORIGEN-ARP to the ORIGEN2 calculations, the magnitudes of the percentage changes were similar to the actinide comparison with some larger differences. The percentage difference of the total activity is very small so no conclusion is made on which results are more conservative for fission products. For the fission product comparison of nuclide activity changes from the Siemens to the ORIGEN-ARP and the ORIGEN2 calculations, most percentage changes were negative with similar magnitudes to the actinide comparisons except that the absolute magnitude of the fission product percentage changes were smaller than the actinides for ORIGEN2. All of the negative percentage changes for the fission products and the total activity change indicates that the Siemens calculated results were larger and more conservative for fission products. The gamma photon output and presumably the gamma dose rate for the H. B. Robinson 72 GWd/MTU spent fuel was dominated by the contribution of the fission products. In Table C2 the fission product nuclides that provided the highest contributions to photons per second in the highest photon energy emission rate groups 9, 10 and 11 from Table B6 of Appendix B are shown in bold text. These fission products were Y-90, Rh-106, Cs-134, Ba-137m, and Eu-154. Four of these five nuclides had negative percentage changes from the Siemens to the ORIGEN-ARP and the ORIGEN2 calculations. Most of these negative percentage changes were small and only Cs-134 had a larger change of –29% for ORIGEN2. Only Eu-154 had a positive percentage change of 22% for ORIGEN2. Of the other nuclides that had very large positive percentage changes from the Siemens to the ORIGEN2 results (Cd-109, Ag-109m, Sn-119m, Sn-121m, Te-123m, Eu-155, and Ho-166m), none of them made a large contribution to gamma photon output in the highest photon energy emission rate groups. Thus, the calculated gamma photon output and gamma dose are probably comparable for ORIGEN2 and Siemens results but Siemens may be slightly higher. Nuclide Composition of Surry 38.6 GWd/MTU Spent Fuel The nuclide composition of the Surry NPP spent fuel was calculated using ORIGEN-ARP as described above. This medium burnup, 38.6 GWd/MTU spent fuel had an initial 3.11 % U-235 enrichment. Two calculations were done with different power histories, one with a constant average reactor power and the other with power proportional to the actual power history of the reactor during the cycles of irradiation with the full downtime between and within cycles. Both calculations included a 22-year decay of the spent fuel to November 6, 2003. The nuclide composition activity and associated radiological hazard for this medium burnup spent fuel was lower than for the H. B. Robinson 72 GWd/MTU burnup spent fuel. The nuclide compositions for both calculations for the Surry 38.6 GWd/MTU spent fuel are shown in Appendix D. The calculation for the realistic power history and downtime showed slightly lower total activity for all nuclide groups. The total activity of the spent fuel for the realistic power history calculation is 3.06 x 10⁵ curies/MTU or 2.70 x 10⁻¹ curies/gram of UO2 fuel. Both of these activities are less than half of the corresponding activity for H. B. Robinson 72 GWd/MTU burnup spent fuel.
June 2004 41 PWR Nuclides for SFR Experiments
Radiological Safety Hazards of the Spent Fuel Samples
Once the nuclide compositions of the two spent fuel samples were calculated, the radiological safety hazards presented by the SFR experiment samples were calculated to aid in experiment planning. The safety hazards for the calculated nuclide inventories in the spent fuel samples were characterized by the potential airborne dose and by the portion of the nuclear facility hazard category 2 and 3 thresholds that the experiment samples would present. Calculations of the dose rate from the spent fuel samples in the experiment geometry have been done but are not presented in this report. The following sections describe the calculation of the radiological safety hazard measures and the results for each spent fuel sample. Potential Dose of Airborne UO2 Particles from the Spent Fuel Samples The hypothetical airborne radiation dose from radioactive material that might escape the SFR experiment could present a hazard to the public as well as workers in the nuclear facility where the experiment would be conducted. The impact on the safety basis for the experiment facility must be examined in SFR experiment planning. Thus, the potential airborne dose to the public from spent fuel UO2 particles was calculated with the same methods used at SNL TA-V for safety basis accident analysis. DOE-STD-3009 (DOE 2002) establishes the airborne dose to the public calculation method used at TA-V to calculate the airborne dose for release of inventories of radionuclides from TA-V nuclear facilities in hypothetical accidents. The standard also requires assessments of worker safety in release accidents but does not establish a specific method for airborne releases inside a building. The airborne dose for accident analysis at TA-V is calculated at the 3000 m radius exclusion area boundary surrounding TA-V nuclear facilities and represents the 95th percentile of dose values for all directions so that it may be exceeded only 5% of the time. The dose calculation is done with the Downwind Dose Database (DWDD) of airborne dose calculations for TA-V meteorological conditions and the release heights typical of the TA-V facilities (Naegeli 2003). The DWDD calculations are consistent with the DOE-STD-3009-94 guidance. The release height chosen for airborne dose calculations for the spent fuel UO2 particles is the ground release or zero height release that provides the highest calculated dose at 3000 m. The DWDD is tabulated in (Naegeli 2003) as a list of the airborne dose for one curie (Ci) of the particular nuclide. The table lists doses for over 160 nuclides for various release heights and most of the spent fuel nuclides are included. The dose for a particular nuclide is found by multiplying the DWDD dose (rem/Ci) by the activity (Ci) of the nuclide that would be released as respirable size particles (diameters ≤ 10 micrometers). Larger particles are not included in the dose calculation in accordance with DOE-STD-3009 (DOE 2002) guidance and because larger particles would not penetrate the respiratory system deep enough to produce a long-term committed effective dose from the internally deposited radioactive material. The larger particles also might not remain airborne long enough to reach 3000 m. The dose for the inventory of nuclides released is the sum of the individual nuclide doses. The mass (and activity) of particles in the respirable range for a hypothetical release is developed in the accident analysis to assess the impact to the safety basis of the facility where the SFR experiments would be performed.
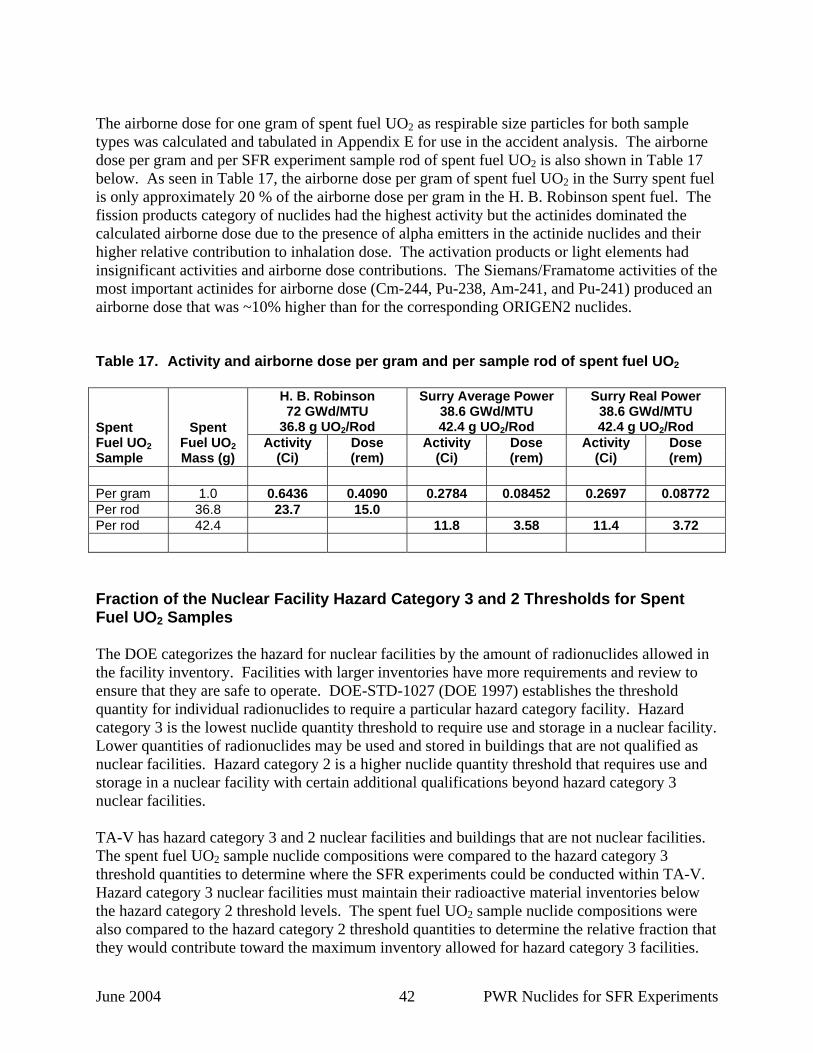
June 2004 42 PWR Nuclides for SFR Experiments
The airborne dose for one gram of spent fuel UO2 as respirable size particles for both sample types was calculated and tabulated in Appendix E for use in the accident analysis. The airborne dose per gram and per SFR experiment sample rod of spent fuel UO2 is also shown in Table 17 below. As seen in Table 17, the airborne dose per gram of spent fuel UO2 in the Surry spent fuel is only approximately 20 % of the airborne dose per gram in the H. B. Robinson spent fuel. The fission products category of nuclides had the highest activity but the actinides dominated the calculated airborne dose due to the presence of alpha emitters in the actinide nuclides and their higher relative contribution to inhalation dose. The activation products or light elements had insignificant activities and airborne dose contributions. The Siemans/Framatome activities of the most important actinides for airborne dose (Cm-244, Pu-238, Am-241, and Pu-241) produced an airborne dose that was ~10% higher than for the corresponding ORIGEN2 nuclides. Table 17. Activity and airborne dose per gram and per sample rod of spent fuel UO2
H. B. Robinson 72 GWd/MTU
36.8 g UO2/Rod
Surry Average Power 38.6 GWd/MTU 42.4 g UO2/Rod
Surry Real Power 38.6 GWd/MTU 42.4 g UO2/Rod Spent
Fuel UO2 Sample
Spent Fuel UO2 Mass (g)
Activity (Ci)
Dose (rem)
Activity (Ci)
Dose (rem)
Activity (Ci)
Dose (rem)
Per gram 1.0 0.6436 0.4090 0.2784 0.08452 0.2697 0.08772 Per rod 36.8 23.7 15.0 Per rod 42.4 11.8 3.58 11.4 3.72 Fraction of the Nuclear Facility Hazard Category 3 and 2 Thresholds for Spent Fuel UO2 Samples The DOE categorizes the hazard for nuclear facilities by the amount of radionuclides allowed in the facility inventory. Facilities with larger inventories have more requirements and review to ensure that they are safe to operate. DOE-STD-1027 (DOE 1997) establishes the threshold quantity for individual radionuclides to require a particular hazard category facility. Hazard category 3 is the lowest nuclide quantity threshold to require use and storage in a nuclear facility. Lower quantities of radionuclides may be used and stored in buildings that are not qualified as nuclear facilities. Hazard category 2 is a higher nuclide quantity threshold that requires use and storage in a nuclear facility with certain additional qualifications beyond hazard category 3 nuclear facilities. TA-V has hazard category 3 and 2 nuclear facilities and buildings that are not nuclear facilities. The spent fuel UO2 sample nuclide compositions were compared to the hazard category 3 threshold quantities to determine where the SFR experiments could be conducted within TA-V. Hazard category 3 nuclear facilities must maintain their radioactive material inventories below the hazard category 2 threshold levels. The spent fuel UO2 sample nuclide compositions were also compared to the hazard category 2 threshold quantities to determine the relative fraction that they would contribute toward the maximum inventory allowed for hazard category 3 facilities.
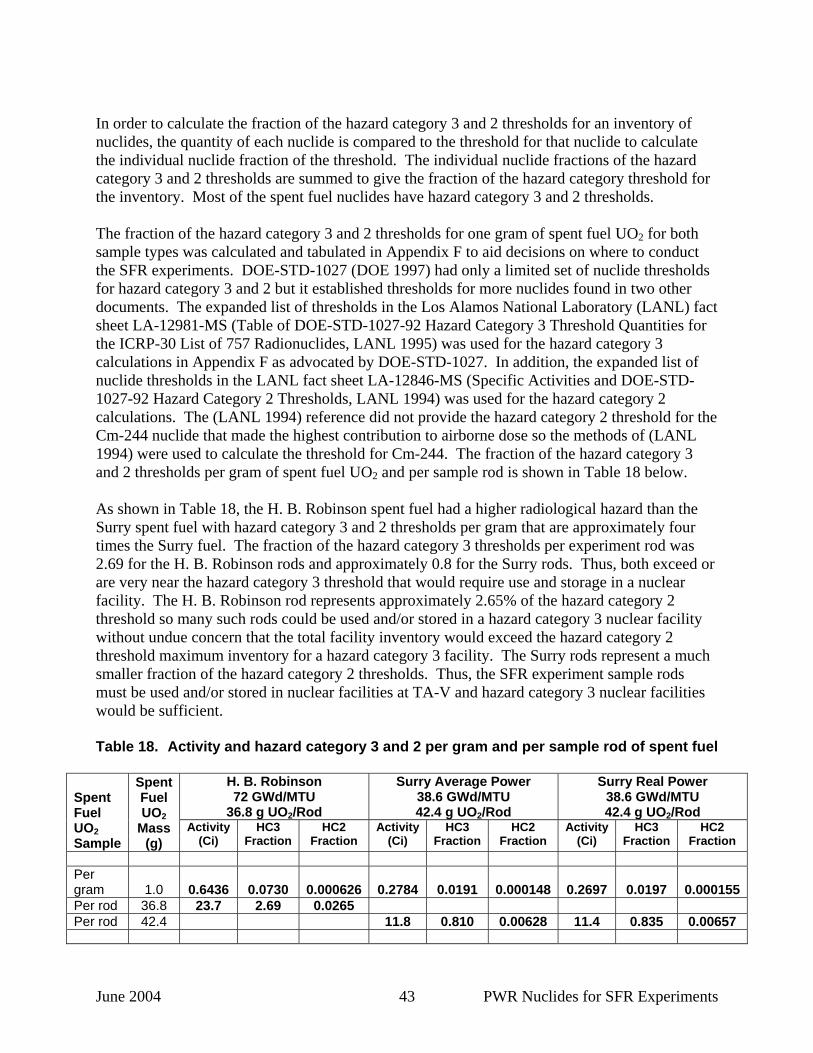
June 2004 43 PWR Nuclides for SFR Experiments
In order to calculate the fraction of the hazard category 3 and 2 thresholds for an inventory of nuclides, the quantity of each nuclide is compared to the threshold for that nuclide to calculate the individual nuclide fraction of the threshold. The individual nuclide fractions of the hazard category 3 and 2 thresholds are summed to give the fraction of the hazard category threshold for the inventory. Most of the spent fuel nuclides have hazard category 3 and 2 thresholds. The fraction of the hazard category 3 and 2 thresholds for one gram of spent fuel UO2 for both sample types was calculated and tabulated in Appendix F to aid decisions on where to conduct the SFR experiments. DOE-STD-1027 (DOE 1997) had only a limited set of nuclide thresholds for hazard category 3 and 2 but it established thresholds for more nuclides found in two other documents. The expanded list of thresholds in the Los Alamos National Laboratory (LANL) fact sheet LA-12981-MS (Table of DOE-STD-1027-92 Hazard Category 3 Threshold Quantities for the ICRP-30 List of 757 Radionuclides, LANL 1995) was used for the hazard category 3 calculations in Appendix F as advocated by DOE-STD-1027. In addition, the expanded list of nuclide thresholds in the LANL fact sheet LA-12846-MS (Specific Activities and DOE-STD-1027-92 Hazard Category 2 Thresholds, LANL 1994) was used for the hazard category 2 calculations. The (LANL 1994) reference did not provide the hazard category 2 threshold for the Cm-244 nuclide that made the highest contribution to airborne dose so the methods of (LANL 1994) were used to calculate the threshold for Cm-244. The fraction of the hazard category 3 and 2 thresholds per gram of spent fuel UO2 and per sample rod is shown in Table 18 below. As shown in Table 18, the H. B. Robinson spent fuel had a higher radiological hazard than the Surry spent fuel with hazard category 3 and 2 thresholds per gram that are approximately four times the Surry fuel. The fraction of the hazard category 3 thresholds per experiment rod was 2.69 for the H. B. Robinson rods and approximately 0.8 for the Surry rods. Thus, both exceed or are very near the hazard category 3 threshold that would require use and storage in a nuclear facility. The H. B. Robinson rod represents approximately 2.65% of the hazard category 2 threshold so many such rods could be used and/or stored in a hazard category 3 nuclear facility without undue concern that the total facility inventory would exceed the hazard category 2 threshold maximum inventory for a hazard category 3 facility. The Surry rods represent a much smaller fraction of the hazard category 2 thresholds. Thus, the SFR experiment sample rods must be used and/or stored in nuclear facilities at TA-V and hazard category 3 nuclear facilities would be sufficient. Table 18. Activity and hazard category 3 and 2 per gram and per sample rod of spent fuel
H. B. Robinson 72 GWd/MTU
36.8 g UO2/Rod
Surry Average Power 38.6 GWd/MTU 42.4 g UO2/Rod
Surry Real Power 38.6 GWd/MTU 42.4 g UO2/Rod
Spent Fuel UO2 Sample
Spent Fuel UO2
Mass (g)
Activity (Ci)
HC3 Fraction
HC2 Fraction
Activity (Ci)
HC3 Fraction
HC2 Fraction
Activity (Ci)
HC3 Fraction
HC2 Fraction
Per gram 1.0 0.6436 0.0730 0.000626 0.2784 0.0191 0.000148 0.2697 0.0197 0.000155Per rod 36.8 23.7 2.69 0.0265 Per rod 42.4 11.8 0.810 0.00628 11.4 0.835 0.00657
June 2004 44 PWR Nuclides for SFR Experiments
Measures of Nuclide Importance for the H. B. Robinson 72 GWD/MTU Fuel The contributions of individual nuclides to the calculated airborne dose and hazard category threshold fractions were used as measures of nuclide importance to the radiological hazard presented by the H. B. Robinson spent fuel. The individual nuclide contributions from Appendices E and F were examined to find the nuclides that had the highest fractions of the total radiological hazards for the H. B. Robinson spent fuel. Table 19 presents the nuclides that made the highest contribution to airborne dose and hazard category thresholds. Some of the nuclides shown in Table 19 did not have all of the measures of nuclide importance, as they were not calculated in Appendices E and F. As shown in Table 19, the four nuclides Cm-244, Pu-238, Am-241, and Pu-241 dominated the three measures of nuclide importance for the H. B. Robinson spent fuel. These four nuclides contributed over 97% of the total airborne dose, over 96% of the hazard category 2 threshold fraction and over 86% of the hazard category 3 threshold fraction. In addition the first two nuclides Cm-244 and Pu-238 provided over 70% of the total for each measure of nuclide importance to the radiological hazard for the H. B. Robinson spent fuel. All four of these dominant nuclides are actinides. The actinides dominated the calculated airborne dose due to the presence of alpha emitters in the actinide nuclides and their higher relative contribution to inhalation dose. The activation products or light elements had insignificant activities and airborne dose contributions. Both the airborne dose and hazard category 2 thresholds were calculated based on airborne dose at particular ranges. The airborne dose calculations of the DWDD used 3000 m and hazard category 2 threshold of DOE-STD-1027 used 300 m. The hazard category 3 thresholds of DOE-STD-1027 were calculated for shorter ranges approximating tens of meters and used other dose pathways (such as direct radiation) in addition to airborne dose. The hazard category 3 and 2 threshold calculations did not tabulate the threshold fraction by nuclide category. Table 19 listed 13 more nuclides with lesser measures of importance contributions. These nuclides included fission product nuclides and some actinides. The fission products Sr-90 and Cs-137 made relatively large contributions of 5.8 % and 3% respectively to the total hazard category 3 threshold fraction of the spent fuel. This large contribution was probably due to their activity and their direct gamma radiation. In fact most of the fission products listed were major contributors to the gamma photon and energy release rates of the spent fuel and thus are expected to be large contributors to calculated gamma direct radiation dose. Measurements of the actual nuclide composition were requested for all of the 18 nuclides in Table 19 with the relative importance indicated in the second column of the table.
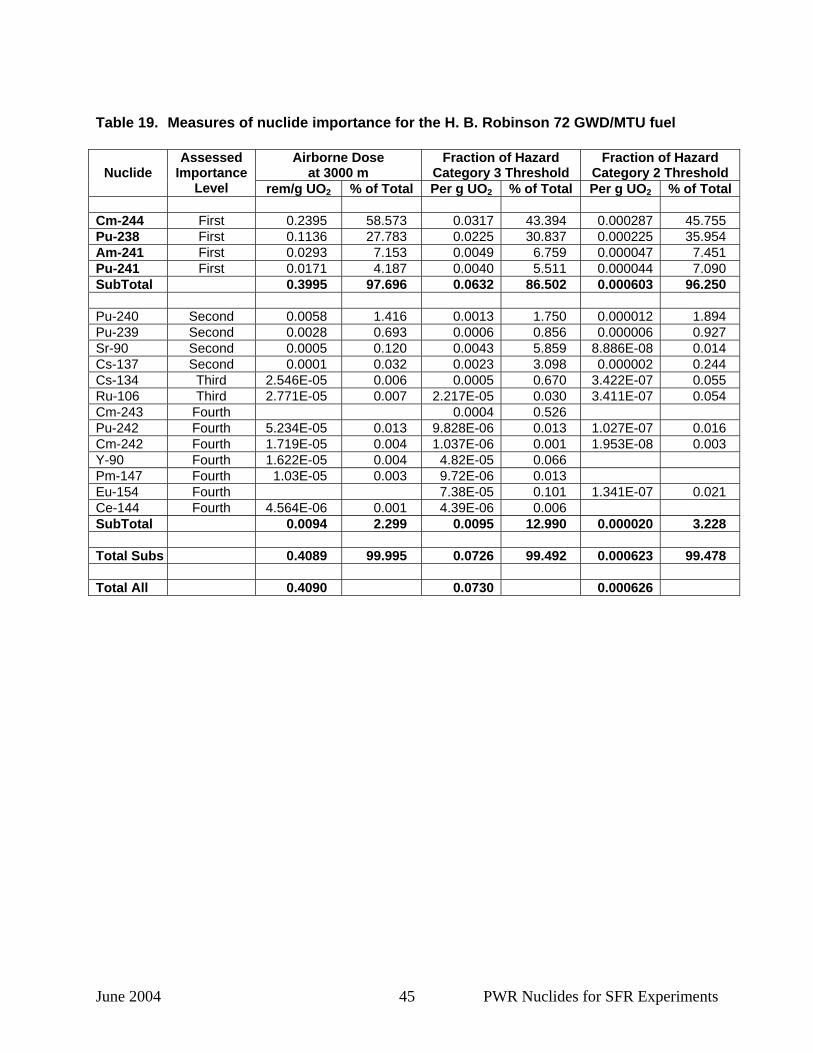
June 2004 45 PWR Nuclides for SFR Experiments
Table 19. Measures of nuclide importance for the H. B. Robinson 72 GWD/MTU fuel
Airborne Dose at 3000 m
Fraction of Hazard Category 3 Threshold
Fraction of Hazard Category 2 Threshold Nuclide
Assessed Importance
Level rem/g UO2 % of Total Per g UO2 % of Total Per g UO2 % of Total Cm-244 First 0.2395 58.573 0.0317 43.394 0.000287 45.755 Pu-238 First 0.1136 27.783 0.0225 30.837 0.000225 35.954 Am-241 First 0.0293 7.153 0.0049 6.759 0.000047 7.451 Pu-241 First 0.0171 4.187 0.0040 5.511 0.000044 7.090 SubTotal 0.3995 97.696 0.0632 86.502 0.000603 96.250 Pu-240 Second 0.0058 1.416 0.0013 1.750 0.000012 1.894 Pu-239 Second 0.0028 0.693 0.0006 0.856 0.000006 0.927 Sr-90 Second 0.0005 0.120 0.0043 5.859 8.886E-08 0.014 Cs-137 Second 0.0001 0.032 0.0023 3.098 0.000002 0.244 Cs-134 Third 2.546E-05 0.006 0.0005 0.670 3.422E-07 0.055 Ru-106 Third 2.771E-05 0.007 2.217E-05 0.030 3.411E-07 0.054 Cm-243 Fourth 0.0004 0.526 Pu-242 Fourth 5.234E-05 0.013 9.828E-06 0.013 1.027E-07 0.016 Cm-242 Fourth 1.719E-05 0.004 1.037E-06 0.001 1.953E-08 0.003 Y-90 Fourth 1.622E-05 0.004 4.82E-05 0.066 Pm-147 Fourth 1.03E-05 0.003 9.72E-06 0.013 Eu-154 Fourth 7.38E-05 0.101 1.341E-07 0.021 Ce-144 Fourth 4.564E-06 0.001 4.39E-06 0.006 SubTotal 0.0094 2.299 0.0095 12.990 0.000020 3.228 Total Subs 0.4089 99.995 0.0726 99.492 0.000623 99.478 Total All 0.4090 0.0730 0.000626
June 2004 46 PWR Nuclides for SFR Experiments
Parametric Spent Fuel Radiological Hazards Compared to SFR Experiment Sample Radiological Hazards In this section, the relative radiological hazards of the high burnup 72 GWd/MTU spent fuel from H. B. Robinson and the medium burnup 36 GWd/MTU spent fuel from Surry are compared against a parametric calculation of various fuel burnups to assess the potential for higher hazard PWR fuel samples in future experiments. Parametric nuclide compositions were calculated with ORIGEN-ARP to facilitate a parametric analysis of the hazards of various spent fuel burnups with decay time. The initial fuel enrichment used in the parameter study was 3.0% of U-235. Nuclide compositions for burnups of 12 to 72 GWd/MTU in 12 GWd/MTU steps were calculated. All six calculations used an average power of 37.5 MW for 320-day irradiations to provide a burnup of 12 GWd/MTU per cycle in one irradiation case. The individual calculations used additional cycles to provide the needed burnup. No downtime was assumed between cycles. A final decay case provided a range of time since removal from the reactor to include that variation in the parameter study as well. The ORIGEN-ARP inputs were described in a previous chapter. The radiological hazards were calculated for the results of the parametric study of burnup nuclide compositions. The radiological hazards calculated were airborne dose and fraction of the hazard category 3 thresholds. The radiological hazards varying with decay time since removal from the reactor were plotted in Figures 5 and 6 for airborne dose and fraction of the hazard category 3 thresholds respectively. The figures include curves for the six parametric burnups, the H. B. Robinson 72 GWd/MTU spent fuel and the Surry 38.6 GWd/MTU spent fuel with the realistic power history. In both figures the H. B. Robinson spent fuel hazard exceeds the 72 GWd/MTU line for all decay times and the same is true for the Surry spent fuel and the 36 GWd/MTU line. Thus, the H. B. Robinson fuel with its extra decay time during fuel burnup would match or bound the radiological hazard for similar burnup fuel with shorter decay during production. This seeming inconsistency of longer decay times during fuel irradiation producing higher radiological hazards for the H. B. Robinson fuel is explained by the buildup of actinides during and subsequent to the decay time. Both Pu-238 and Am-241 activities increased during the extra time until all burnup was terminated as compared to shorter times to complete the same total burnup. While most radionuclide activity would decrease during the 10 years that the H. B. Robinson fuel spent in the cooling pool before it was returned to finish the burnup, some actinides are produced by decay from other actinides and actually increase in activity as balanced against decay. Thus, extra down time during burnup or a lower power, longer burnup produced more of those actinides. Both Pu-238 and Am-241 are dominant contributors to airborne dose, thus increasing the total airborne dose for the H. B. Robinson fuel above that for fuels that did not have the 10-year decay during production. The hazard category 3 thresholds are similarly increased.

June 2004 47 PWR Nuclides for SFR Experiments
0.00
0.10
0.20
0.30
0.40
0.50
0.60
0.0 2.0 4.0 6.0 8.0 10.0 12.0
Decay Time Out of PWR (Years)
Airb
orne
Dos
e at
3.0
km
(rem
/g U
O2)
12 GWD/MTU 24 GWD/MTU 36 GWD/MTU48 GWD/MTU 60 GWD/MTU 72 GWD/MTURobinson 72 GWD/MTU Surry 38.6 GWD/MTU
Figure 5. Airborne dose of spent fuel with decay for a PWR, 3% U-235 enriched
0.00
0.01
0.02
0.03
0.04
0.05
0.06
0.07
0.08
0.09
0.10
0.0 2.0 4.0 6.0 8.0 10.0 12.0
Decay Time out of PWR (Years)
HC
3 Th
resh
old
Frac
tion
per g
UO
2
12 GWD/MTU 24 GWD/MTU 36 GWD/MTU48 GWD/MTU 60 GWD/MTU 72 GWD/MTURobinson 72 GWD/MTU Surry 38.6 GWD/MTU
Figure 6. HC3 threshold fraction of spent fuel with decay for a PWR, 3% U-235 enriched
June 2004 48 PWR Nuclides for SFR Experiments
References
(Bowman et al. 2002) Stephen M. Bowman, James E. Horwedel, Ian C. Gauld,
and D. L. Barnett, “ORIGEN-ARP: A New Windows PC Package for ORIGEN Users”, Paper submitted to the American Nuclear Society/Radiation Protection & Shielding Division 12th Biennial RPSD Topical Meeting, April 14_18, 2002, Santa Fe, New Mexico, Oak Ridge National Laboratory, Oak Ridge, TN, February 7, 2002.
(Brady et al. 1989) M. C. Brady, O. W. Herman and W. B. Wilson,
“Comparison of Radiation Spectra from Selected Source-Term Computer Codes,” ORNL/CSD/TM-259, prepared by Oak Ridge National Laboratory for the U.S. Department of Energy, Washington, DC, April 1989.
(Croff 1980) A. G. Croff, “A User's Manual for the ORIGEN2 Computer
Code”, ORNL/TM-7175, Oak Ridge National Laboratory, Oak Ridge, TN, July 1980.
(DOE 1997) DOE-STD-1027 (Change 1), Hazard Categorization and
Accident Analysis Techniques for Compliance with DOE Order 5480.23, Nuclear Safety Analysis Reports, U.S. Department of Energy, Washington, DC, September 1997.
(DOE 2002) DOE-STD-3009 (Change Notice 2), Preparation Guide for
U.S. Department of Energy Nonreactor Nuclear Facility Documented Safety Analyses, U.S. Department of Energy, Washington, D.C., April 2002.
(Duderstadt and Hamilton 1976) J. J. Duderstadt and L. J. Hamilton, Nuclear Reactor
Analysis, John Wiley & Sons, Inc., New York, NY, Copyright 1976.
(Eckerman et al. 1989) K.F., Eckerman, A.B. Wolbarst, and A.C.B. Richardson,
Limiting Values for Radionuclide Intake and Air Concentration and Dose Conversion Factors for Inhalation, Submersion, and Ingestion, Federal Guidance Report 11, EPA 520/1-88-020, second printing with corrections, Environmental Protection Agency, Washington, DC, 1989.
June 2004 49 PWR Nuclides for SFR Experiments
(Eckerman and Ryman 1993) K.F. Eckerman, and J.C. Ryman, External Exposure to Radionuclides in Air, Water, and Soil, Federal Guidance Report 12, EPA 402-R-93-081, Environmental Protection Agency, Washington, DC, 1993.
(EPRI 1986) “The Castor V/21 PWR Spent-Fuel Storage Cask: Testing
and Analyses”, prepared by Virginia Power Company and the U.S. Department of Energy for EPRI, EPRI Interim Report NP-4887, Electric Power Research Institute (EPRI), Palo Alto, CA, November 1986.
(EPRI 2001) “Design, Operation, and Performance Data for High
Burnup PWR Fuel from the H. B. Robinson Plant for Use in the NRC Experimental Program at Argonne National Laboratory,” prepared by Framatome ANP Richland, Inc. for EPRI, EPRI Report 1001558, Electric Power Research Institute (EPRI), Palo Alto, CA (principle investigators E. J. Ruzauskas and K. N. Fardell), May 2001.
(Gauld and Parks 2001) I. C. Gauld and C. V. Parks, “Review of Technical Issues
Related to Predicting Isotopic Compositions and Source Terms for High-Burnup LWR Fuel,” NUREG/CR–6701 ORNL/TM–2000/277, prepared by Oak Ridge National Laboratory for the U.S. Nuclear Regulatory Commission, Washington, DC, January 2001.
(Gauld et al. 2002) I. C. Gauld, O. W. Hermann and R. M. Westfall,
“ORIGEN-S: Scale System Module to Calculate Fuel Depletion, Actinide Transmutation, Fission Product Buildup and Decay, and Associated Radiation Source Terms”, NUREG/CR-0200, prepared by Oak Ridge National Laboratory for the U.S. Nuclear Regulatory Commission, Washington, DC, April 2002.
(Hermann et al. 1995) O. W. Hermann, S. M. Bowman, M. C. Brady, and C. V.
Parks, “Validation of the Scale System for PWR Spent Fuel Isotopic Composition Analyses,” ORNL/TM-12667, prepared by Oak Ridge National Laboratory for the U.S. Department of Energy, Washington, DC, March 1995.
(LANL 1994) J. Clow, J. Elder, G. Heindel, W. Inkret, and G. Miller,
“Specific Activities and DOE-STD-1027-92 Hazard Category 2 Thresholds, LANL Fact Sheet,” LA-12846-MS, Los Alamos National Laboratory (LANL), Los Alamos, NM, November 1994.
June 2004 50 PWR Nuclides for SFR Experiments
(LANL 1995) J. Clow, J. Elder, G. Heindel, W. Inkret, and G. Miller, “Table of DOE-STD-1027-92 Hazard Category 3 Threshold Quantities for the ICRP-30 List of 757 Radionuclides, LANL Fact Sheet,” LA-12981-MS, Los Alamos National Laboratory (LANL), Los Alamos, NM, August 1995.
(Leal et al. 1998) L. C. Leal, O. W. Hermann, S. M. Bowman, and C. V.
Parks, “ARP: Automatic Rapid Process for the Generation of Problem-Dependent SAS2H/ORIGEN-S Cross-Section Libraries”, ORNL/TM-13584, prepared by Oak Ridge National Laboratory for the U.S. Nuclear Regulatory Commission, Washington, DC, April 1998.
(Ludwig and Renier 1989) S. B. Ludwig and J. P. Renier, “Standard- and Extended-
Burnup PWR and BWR Reactor Models for the ORIGEN2 Computer Code”, ORNL/TM-11018, Oak Ridge National Laboratory, Oak Ridge, TN, December 1989.
(ORNL 1991) Oak Ridge National Laboratory, “ORIGEN2.1 Isotope
Generation and Depletion Code Matrix Exponential Method,” Radiation Shielding Information Center Computer Code Collection, CCC-371, Oak Ridge National Laboratory, Oak Ridge, TN, Revised December 1991.
(Naegeli 2003) R. E. Naegeli, “A MACCS2 Single Nuclide Downwind
Dose Database for Sandia National Laboratories, Technical Area V,” SAND2003-0883, Sandia National Laboratories, Albuquerque, NM, March 2003.
(Ruzauskas 2001) E. J. Ruzauskas, “H. B. Robinson Program (S-15H
Project)”, letter report to Carlos Martinez of GE Vallecitos Nuclear Center in Sunol, CA, Siemens Power Corporation, Richland, WA, January 25, 2001.
(Tsai 2001) H. Tsai, “H. B. Robinson Rod Characterization”, a
presentation for the ANL-NRC-EPRI Technical Review Meeting of July 19-20, 2001, Argonne National Laboratory, Argonne, Illinois, July 19-20, 2001.

June 2004 51 PWR Nuclides for SFR Experiments
Appendix A – ORIGEN2 Input pwru72l.u5 for H. B. Robinson
72 GWd/MTU Burnup The text input file pru72l.u5 for the ORIGEN2 calculation of nuclide composition for the H. B. Robinson 72 GWd/MTU burnup follows.
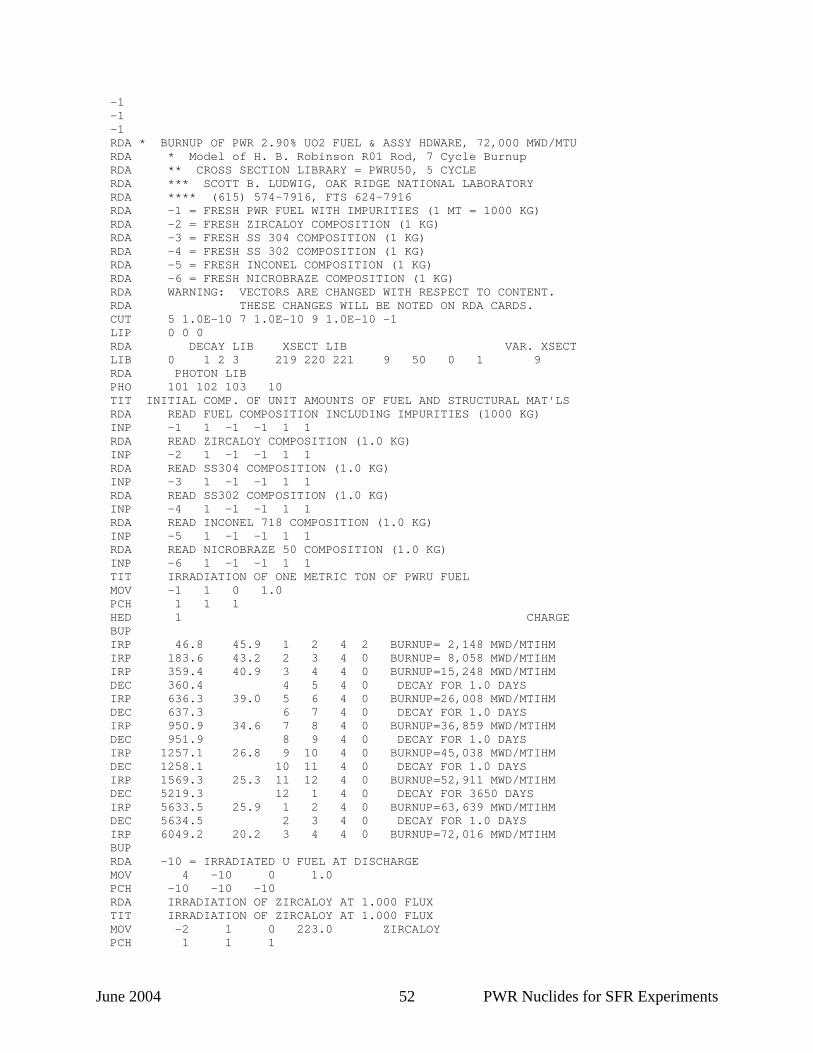
June 2004 52 PWR Nuclides for SFR Experiments
-1 -1 -1 RDA * BURNUP OF PWR 2.90% UO2 FUEL & ASSY HDWARE, 72,000 MWD/MTU RDA * Model of H. B. Robinson R01 Rod, 7 Cycle Burnup RDA ** CROSS SECTION LIBRARY = PWRU50, 5 CYCLE RDA *** SCOTT B. LUDWIG, OAK RIDGE NATIONAL LABORATORY RDA **** (615) 574-7916, FTS 624-7916 RDA -1 = FRESH PWR FUEL WITH IMPURITIES (1 MT = 1000 KG) RDA -2 = FRESH ZIRCALOY COMPOSITION (1 KG) RDA -3 = FRESH SS 304 COMPOSITION (1 KG) RDA -4 = FRESH SS 302 COMPOSITION (1 KG) RDA -5 = FRESH INCONEL COMPOSITION (1 KG) RDA -6 = FRESH NICROBRAZE COMPOSITION (1 KG) RDA WARNING: VECTORS ARE CHANGED WITH RESPECT TO CONTENT. RDA THESE CHANGES WILL BE NOTED ON RDA CARDS. CUT 5 1.0E-10 7 1.0E-10 9 1.0E-10 -1 LIP 0 0 0 RDA DECAY LIB XSECT LIB VAR. XSECT LIB 0 1 2 3 219 220 221 9 50 0 1 9 RDA PHOTON LIB PHO 101 102 103 10 TIT INITIAL COMP. OF UNIT AMOUNTS OF FUEL AND STRUCTURAL MAT'LS RDA READ FUEL COMPOSITION INCLUDING IMPURITIES (1000 KG) INP -1 1 -1 -1 1 1 RDA READ ZIRCALOY COMPOSITION (1.0 KG) INP -2 1 -1 -1 1 1 RDA READ SS304 COMPOSITION (1.0 KG) INP -3 1 -1 -1 1 1 RDA READ SS302 COMPOSITION (1.0 KG) INP -4 1 -1 -1 1 1 RDA READ INCONEL 718 COMPOSITION (1.0 KG) INP -5 1 -1 -1 1 1 RDA READ NICROBRAZE 50 COMPOSITION (1.0 KG) INP -6 1 -1 -1 1 1 TIT IRRADIATION OF ONE METRIC TON OF PWRU FUEL MOV -1 1 0 1.0 PCH 1 1 1 HED 1 CHARGE BUP IRP 46.8 45.9 1 2 4 2 BURNUP= 2,148 MWD/MTIHM IRP 183.6 43.2 2 3 4 0 BURNUP= 8,058 MWD/MTIHM IRP 359.4 40.9 3 4 4 0 BURNUP=15,248 MWD/MTIHM DEC 360.4 4 5 4 0 DECAY FOR 1.0 DAYS IRP 636.3 39.0 5 6 4 0 BURNUP=26,008 MWD/MTIHM DEC 637.3 6 7 4 0 DECAY FOR 1.0 DAYS IRP 950.9 34.6 7 8 4 0 BURNUP=36,859 MWD/MTIHM DEC 951.9 8 9 4 0 DECAY FOR 1.0 DAYS IRP 1257.1 26.8 9 10 4 0 BURNUP=45,038 MWD/MTIHM DEC 1258.1 10 11 4 0 DECAY FOR 1.0 DAYS IRP 1569.3 25.3 11 12 4 0 BURNUP=52,911 MWD/MTIHM DEC 5219.3 12 1 4 0 DECAY FOR 3650 DAYS IRP 5633.5 25.9 1 2 4 0 BURNUP=63,639 MWD/MTIHM DEC 5634.5 2 3 4 0 DECAY FOR 1.0 DAYS IRP 6049.2 20.2 3 4 4 0 BURNUP=72,016 MWD/MTIHM BUP RDA -10 = IRRADIATED U FUEL AT DISCHARGE MOV 4 -10 0 1.0 PCH -10 -10 -10 RDA IRRADIATION OF ZIRCALOY AT 1.000 FLUX TIT IRRADIATION OF ZIRCALOY AT 1.000 FLUX MOV -2 1 0 223.0 ZIRCALOY PCH 1 1 1
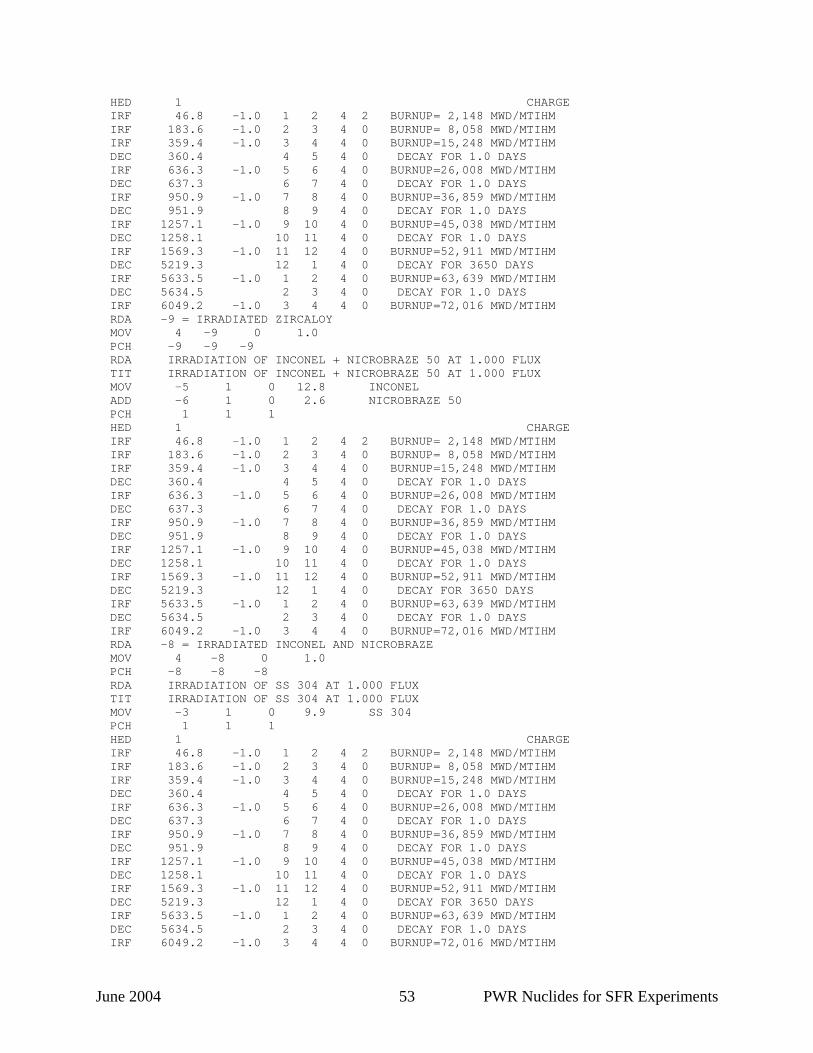
June 2004 53 PWR Nuclides for SFR Experiments
HED 1 CHARGE IRF 46.8 -1.0 1 2 4 2 BURNUP= 2,148 MWD/MTIHM IRF 183.6 -1.0 2 3 4 0 BURNUP= 8,058 MWD/MTIHM IRF 359.4 -1.0 3 4 4 0 BURNUP=15,248 MWD/MTIHM DEC 360.4 4 5 4 0 DECAY FOR 1.0 DAYS IRF 636.3 -1.0 5 6 4 0 BURNUP=26,008 MWD/MTIHM DEC 637.3 6 7 4 0 DECAY FOR 1.0 DAYS IRF 950.9 -1.0 7 8 4 0 BURNUP=36,859 MWD/MTIHM DEC 951.9 8 9 4 0 DECAY FOR 1.0 DAYS IRF 1257.1 -1.0 9 10 4 0 BURNUP=45,038 MWD/MTIHM DEC 1258.1 10 11 4 0 DECAY FOR 1.0 DAYS IRF 1569.3 -1.0 11 12 4 0 BURNUP=52,911 MWD/MTIHM DEC 5219.3 12 1 4 0 DECAY FOR 3650 DAYS IRF 5633.5 -1.0 1 2 4 0 BURNUP=63,639 MWD/MTIHM DEC 5634.5 2 3 4 0 DECAY FOR 1.0 DAYS IRF 6049.2 -1.0 3 4 4 0 BURNUP=72,016 MWD/MTIHM RDA -9 = IRRADIATED ZIRCALOY MOV 4 -9 0 1.0 PCH -9 -9 -9 RDA IRRADIATION OF INCONEL + NICROBRAZE 50 AT 1.000 FLUX TIT IRRADIATION OF INCONEL + NICROBRAZE 50 AT 1.000 FLUX MOV -5 1 0 12.8 INCONEL ADD -6 1 0 2.6 NICROBRAZE 50 PCH 1 1 1 HED 1 CHARGE IRF 46.8 -1.0 1 2 4 2 BURNUP= 2,148 MWD/MTIHM IRF 183.6 -1.0 2 3 4 0 BURNUP= 8,058 MWD/MTIHM IRF 359.4 -1.0 3 4 4 0 BURNUP=15,248 MWD/MTIHM DEC 360.4 4 5 4 0 DECAY FOR 1.0 DAYS IRF 636.3 -1.0 5 6 4 0 BURNUP=26,008 MWD/MTIHM DEC 637.3 6 7 4 0 DECAY FOR 1.0 DAYS IRF 950.9 -1.0 7 8 4 0 BURNUP=36,859 MWD/MTIHM DEC 951.9 8 9 4 0 DECAY FOR 1.0 DAYS IRF 1257.1 -1.0 9 10 4 0 BURNUP=45,038 MWD/MTIHM DEC 1258.1 10 11 4 0 DECAY FOR 1.0 DAYS IRF 1569.3 -1.0 11 12 4 0 BURNUP=52,911 MWD/MTIHM DEC 5219.3 12 1 4 0 DECAY FOR 3650 DAYS IRF 5633.5 -1.0 1 2 4 0 BURNUP=63,639 MWD/MTIHM DEC 5634.5 2 3 4 0 DECAY FOR 1.0 DAYS IRF 6049.2 -1.0 3 4 4 0 BURNUP=72,016 MWD/MTIHM RDA -8 = IRRADIATED INCONEL AND NICROBRAZE MOV 4 -8 0 1.0 PCH -8 -8 -8 RDA IRRADIATION OF SS 304 AT 1.000 FLUX TIT IRRADIATION OF SS 304 AT 1.000 FLUX MOV -3 1 0 9.9 SS 304 PCH 1 1 1 HED 1 CHARGE IRF 46.8 -1.0 1 2 4 2 BURNUP= 2,148 MWD/MTIHM IRF 183.6 -1.0 2 3 4 0 BURNUP= 8,058 MWD/MTIHM IRF 359.4 -1.0 3 4 4 0 BURNUP=15,248 MWD/MTIHM DEC 360.4 4 5 4 0 DECAY FOR 1.0 DAYS IRF 636.3 -1.0 5 6 4 0 BURNUP=26,008 MWD/MTIHM DEC 637.3 6 7 4 0 DECAY FOR 1.0 DAYS IRF 950.9 -1.0 7 8 4 0 BURNUP=36,859 MWD/MTIHM DEC 951.9 8 9 4 0 DECAY FOR 1.0 DAYS IRF 1257.1 -1.0 9 10 4 0 BURNUP=45,038 MWD/MTIHM DEC 1258.1 10 11 4 0 DECAY FOR 1.0 DAYS IRF 1569.3 -1.0 11 12 4 0 BURNUP=52,911 MWD/MTIHM DEC 5219.3 12 1 4 0 DECAY FOR 3650 DAYS IRF 5633.5 -1.0 1 2 4 0 BURNUP=63,639 MWD/MTIHM DEC 5634.5 2 3 4 0 DECAY FOR 1.0 DAYS IRF 6049.2 -1.0 3 4 4 0 BURNUP=72,016 MWD/MTIHM
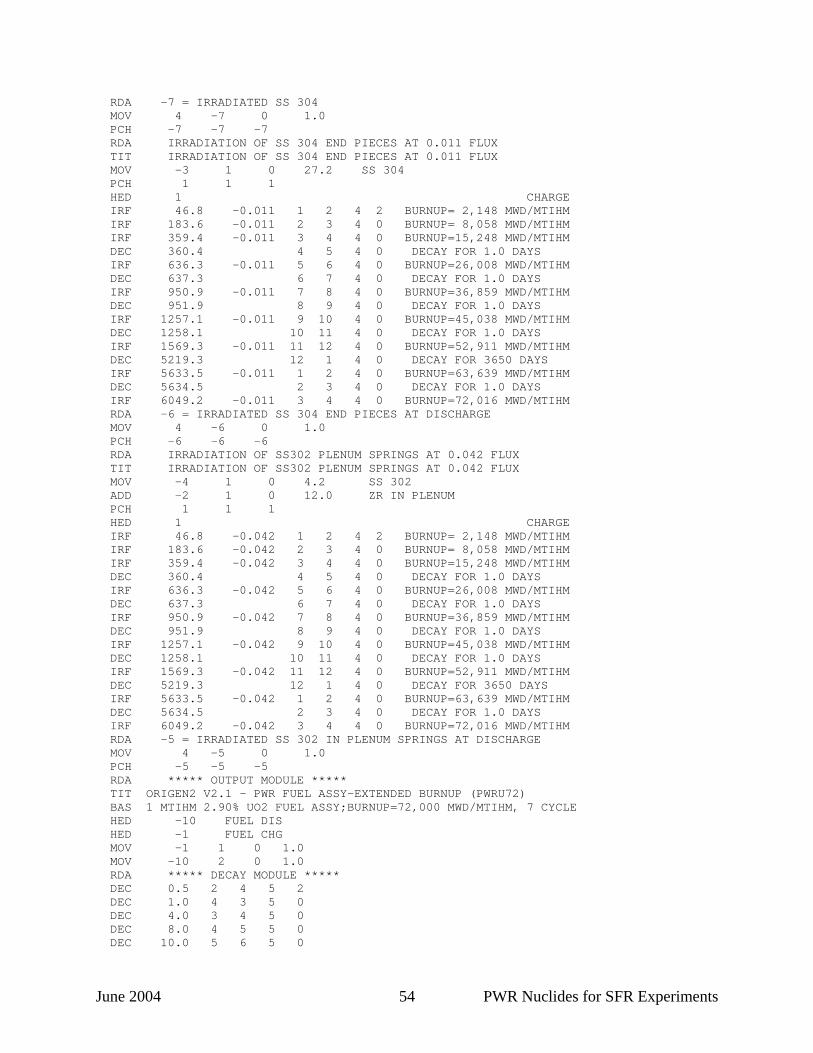
June 2004 54 PWR Nuclides for SFR Experiments
RDA -7 = IRRADIATED SS 304 MOV 4 -7 0 1.0 PCH -7 -7 -7 RDA IRRADIATION OF SS 304 END PIECES AT 0.011 FLUX TIT IRRADIATION OF SS 304 END PIECES AT 0.011 FLUX MOV -3 1 0 27.2 SS 304 PCH 1 1 1 HED 1 CHARGE IRF 46.8 -0.011 1 2 4 2 BURNUP= 2,148 MWD/MTIHM IRF 183.6 -0.011 2 3 4 0 BURNUP= 8,058 MWD/MTIHM IRF 359.4 -0.011 3 4 4 0 BURNUP=15,248 MWD/MTIHM DEC 360.4 4 5 4 0 DECAY FOR 1.0 DAYS IRF 636.3 -0.011 5 6 4 0 BURNUP=26,008 MWD/MTIHM DEC 637.3 6 7 4 0 DECAY FOR 1.0 DAYS IRF 950.9 -0.011 7 8 4 0 BURNUP=36,859 MWD/MTIHM DEC 951.9 8 9 4 0 DECAY FOR 1.0 DAYS IRF 1257.1 -0.011 9 10 4 0 BURNUP=45,038 MWD/MTIHM DEC 1258.1 10 11 4 0 DECAY FOR 1.0 DAYS IRF 1569.3 -0.011 11 12 4 0 BURNUP=52,911 MWD/MTIHM DEC 5219.3 12 1 4 0 DECAY FOR 3650 DAYS IRF 5633.5 -0.011 1 2 4 0 BURNUP=63,639 MWD/MTIHM DEC 5634.5 2 3 4 0 DECAY FOR 1.0 DAYS IRF 6049.2 -0.011 3 4 4 0 BURNUP=72,016 MWD/MTIHM RDA -6 = IRRADIATED SS 304 END PIECES AT DISCHARGE MOV 4 -6 0 1.0 PCH -6 -6 -6 RDA IRRADIATION OF SS302 PLENUM SPRINGS AT 0.042 FLUX TIT IRRADIATION OF SS302 PLENUM SPRINGS AT 0.042 FLUX MOV -4 1 0 4.2 SS 302 ADD -2 1 0 12.0 ZR IN PLENUM PCH 1 1 1 HED 1 CHARGE IRF 46.8 -0.042 1 2 4 2 BURNUP= 2,148 MWD/MTIHM IRF 183.6 -0.042 2 3 4 0 BURNUP= 8,058 MWD/MTIHM IRF 359.4 -0.042 3 4 4 0 BURNUP=15,248 MWD/MTIHM DEC 360.4 4 5 4 0 DECAY FOR 1.0 DAYS IRF 636.3 -0.042 5 6 4 0 BURNUP=26,008 MWD/MTIHM DEC 637.3 6 7 4 0 DECAY FOR 1.0 DAYS IRF 950.9 -0.042 7 8 4 0 BURNUP=36,859 MWD/MTIHM DEC 951.9 8 9 4 0 DECAY FOR 1.0 DAYS IRF 1257.1 -0.042 9 10 4 0 BURNUP=45,038 MWD/MTIHM DEC 1258.1 10 11 4 0 DECAY FOR 1.0 DAYS IRF 1569.3 -0.042 11 12 4 0 BURNUP=52,911 MWD/MTIHM DEC 5219.3 12 1 4 0 DECAY FOR 3650 DAYS IRF 5633.5 -0.042 1 2 4 0 BURNUP=63,639 MWD/MTIHM DEC 5634.5 2 3 4 0 DECAY FOR 1.0 DAYS IRF 6049.2 -0.042 3 4 4 0 BURNUP=72,016 MWD/MTIHM RDA -5 = IRRADIATED SS 302 IN PLENUM SPRINGS AT DISCHARGE MOV 4 -5 0 1.0 PCH -5 -5 -5 RDA ***** OUTPUT MODULE ***** TIT ORIGEN2 V2.1 - PWR FUEL ASSY-EXTENDED BURNUP (PWRU72) BAS 1 MTIHM 2.90% UO2 FUEL ASSY;BURNUP=72,000 MWD/MTIHM, 7 CYCLE HED -10 FUEL DIS HED -1 FUEL CHG MOV -1 1 0 1.0 MOV -10 2 0 1.0 RDA ***** DECAY MODULE ***** DEC 0.5 2 4 5 2 DEC 1.0 4 3 5 0 DEC 4.0 3 4 5 0 DEC 8.0 4 5 5 0 DEC 10.0 5 6 5 0

June 2004 55 PWR Nuclides for SFR Experiments
OPTL 4*8 7 8 7 8 7 8 8*8 5*7 8 OPTA 4*8 7 8 7 8 7 8 8*8 5*7 8 OPTF 4*8 7 8 7 8 7 8 8*8 5*7 8 OUT 6 1 -1 0 TIT ORIGEN2 V2.1 - PWR FUEL ASSY-EXTENDED BURNUP (PWRU72) BAS 1 MTIHM 2.90% UO2 FUEL ASSY;BURNUP=72,000 MWD/MTIHM, 7 CYCLE OPTL 6*8 7 8 7 8 14*8 OPTA 6*8 7 8 7 8 14*8 OPTF 6*8 7 8 7 8 14*8 MOV -10 1 0 1.0 ADD -9 1 0 1.0 ADD -8 1 0 1.0 ADD -7 1 0 1.0 ADD -6 1 0 1.0 ADD -5 1 0 1.0 HED 1 ASSY DIS RDA ***** DECAY MODULE ***** DEC 0.5 1 3 5 2 DEC 1.0 3 2 5 0 DEC 4.0 2 3 5 0 DEC 8.0 3 4 5 0 DEC 10.0 4 5 5 0 OUT 5 1 -1 0 END 2 922340 258.3 922350 29000. 922380 970741.7 0 0.0 FUEL 2.90% 4 030000 1.0 050000 1.0 060000 89.4 070000 25.0 FUEL IMPU 4 080000 134454. 090000 10.7 110000 15.0 120000 2.0 FUEL IMPU 4 130000 16.7 140000 12.1 150000 35.0 170000 5.3 FUEL IMPU 4 200000 2.0 220000 1.0 230000 3.0 240000 4.0 FUEL IMPU 4 250000 1.7 260000 18.0 270000 1.0 280000 24.0 FUEL IMPU 4 290000 1.0 300000 40.3 420000 10.0 470000 0.1 FUEL IMPU 4 480000 25.0 490000 2.0 500000 4.0 640000 2.5 FUEL IMPU 4 740000 2.0 820000 1.0 830000 0.4 0 0.0 FUEL IMPU 0 4 400000 980.91 500000 14.2 260000 2.25 240000 1.25 ZIRC-4 4 280000 0.02 130000 0.024 050000 0.00033 480000 0.00025 ZIRC-4 4 060000 0.120 270000 0.010 290000 0.020 720000 0.078 ZIRC-4 4 010000 0.013 250000 0.020 070000 0.080 080000 0.950 ZIRC-4 4 160000 0.035 220000 0.020 740000 0.020 230000 0.020 ZIRC-4 5 920000 0.0002 0 0.0 ZIRC-4 0 4 260000 688.44 240000 190.0 280000 89.2 250000 20.0 SS-304 4 060000 0.8 150000 0.45 160000 0.3 140000 10.0 SS-304 4 070000 1.3 270000 0.8 0 0.0 SS-304 0 4 260000 697.74 240000 180.0 280000 89.2 250000 20.0 SS-302 4 060000 1.5 150000 0.45 160000 0.3 140000 10.0 SS-302 4 070000 1.3 270000 0.8 0 0.0 SS-302 0 4 260000 179.766 240000 189.753 280000 519.625 130000 5.992 INC-718 4 060000 0.4 270000 4.694 290000 0.999 250000 1.997 INC-718 4 420000 29.961 070000 1.3 410000 55.458 160000 0.07 INC-718 4 140000 1.997 220000 7.99 0 0.0 INC-718 0 4 260000 0.471 240000 149.709 280000 744.438 400000 0.1 NICR-50 4 130000 0.1 050000 0.05 060000 0.1 270000 0.381 NICR-50 4 250000 0.1 070000 0.066 080000 0.043 150000 103.244 NICR-50 4 160000 0.1 140000 0.511 220000 0.1 740000 0.1 NICR-50 0 �
June 2004 56 PWR Nuclides for SFR Experiments
Appendix B – H. B. Robinson Nuclide Composition and Other
ORIGEN2 Calculated Values for 72 GWd/MTU Spent Fuel This appendix contains the nuclide composition information calculated with ORIGEN2 for the H. B. Robinson 72 GWd/MTU spent fuel with an eight-year decay after the fuel left the reactor to April 28, 2003. Nuclide composition is shown in activity for each nuclide with the mass for each actinide nuclide. Separate tabulations are provided for the activation products from the UO2 oxygen and impurities, actinides and fission products as well as a listing for the combined activity of all nuclides. The activity of alphas, neutrons from spontaneous fission of the actinides is also tabulated. Finally, the gamma photon output of the spent fuel is tabulated for 18 energy bins to aid in the calculation of direct radiation exposure to workers. The gamma photon output is dominated by the contribution of the fission products. Photon energy group 9 with mean photon energy of 0.575 MeV dominates the gamma photon emission with 69 % of the total photon energy emission rate. Photon energy groups 10 and 11 provide lesser dominant contributions with 16 and 8 % of the total photon energy emission rate. The other photon energy groups contribute 1 % or less of the total photon energy emission rate. The tabulated data includes only contributions from the spent UO2 fuel and not from irradiated cladding as the contribution from the cladding is small. The values are tabulated for the calculated 1 MTU of UO2 fuel and for one gram (g) of the UO2 fuel. The conversion to per gram UO2 was made after the ORIGEN2 calculation by dividing by the initial mass of the 1 MTU of UO2 fuel (1,134,810.2 g). The nuclide composition data tables are listed below. Tables Table B1. Activation products for 72 GWd/MTU H. B. Robinson spent fuel – ORIGEN2 Table B2. Actinides for 72 GWd/MTU H. B. Robinson spent fuel – ORIGEN2 Table B3. Fission products for 72 GWd/MTU H. B. Robinson spent fuel – ORIGEN2 Table B4. All nuclides for 72 GWd/MTU H. B. Robinson spent fuel – ORIGEN2 Table B5. Actinide mass for 72 GWd/MTU H. B. Robinson spent fuel – ORIGEN2 Table B6. Gamma photons from 72 GWd/MTU H. B. Robinson spent fuel – ORIGEN2 Table B7. Alpha activity from 72 GWd/MTU H. B. Robinson spent fuel – ORIGEN2 Table B8. Alpha,n neutrons from 72 GWd/MTU H. B. Robinson spent fuel – ORIGEN2 Table B9. Spontaneous fission neutrons from 72 GWd/MTU H. B. Robinson spent fuel –
ORIGEN2
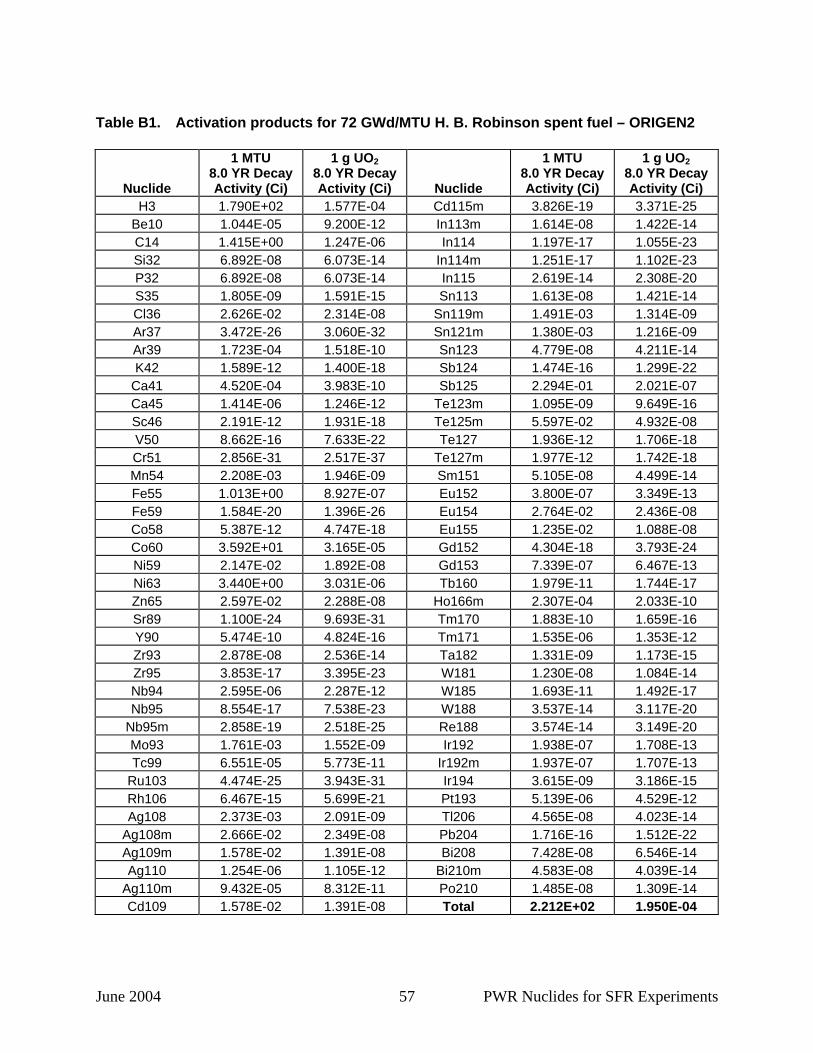
June 2004 57 PWR Nuclides for SFR Experiments
Table B1. Activation products for 72 GWd/MTU H. B. Robinson spent fuel – ORIGEN2
Nuclide
1 MTU 8.0 YR Decay Activity (Ci)
1 g UO2 8.0 YR Decay Activity (Ci) Nuclide
1 MTU 8.0 YR Decay Activity (Ci)
1 g UO2 8.0 YR Decay Activity (Ci)
H3 1.790E+02 1.577E-04 Cd115m 3.826E-19 3.371E-25 Be10 1.044E-05 9.200E-12 In113m 1.614E-08 1.422E-14 C14 1.415E+00 1.247E-06 In114 1.197E-17 1.055E-23 Si32 6.892E-08 6.073E-14 In114m 1.251E-17 1.102E-23 P32 6.892E-08 6.073E-14 In115 2.619E-14 2.308E-20 S35 1.805E-09 1.591E-15 Sn113 1.613E-08 1.421E-14 Cl36 2.626E-02 2.314E-08 Sn119m 1.491E-03 1.314E-09 Ar37 3.472E-26 3.060E-32 Sn121m 1.380E-03 1.216E-09 Ar39 1.723E-04 1.518E-10 Sn123 4.779E-08 4.211E-14 K42 1.589E-12 1.400E-18 Sb124 1.474E-16 1.299E-22
Ca41 4.520E-04 3.983E-10 Sb125 2.294E-01 2.021E-07 Ca45 1.414E-06 1.246E-12 Te123m 1.095E-09 9.649E-16 Sc46 2.191E-12 1.931E-18 Te125m 5.597E-02 4.932E-08 V50 8.662E-16 7.633E-22 Te127 1.936E-12 1.706E-18 Cr51 2.856E-31 2.517E-37 Te127m 1.977E-12 1.742E-18 Mn54 2.208E-03 1.946E-09 Sm151 5.105E-08 4.499E-14 Fe55 1.013E+00 8.927E-07 Eu152 3.800E-07 3.349E-13 Fe59 1.584E-20 1.396E-26 Eu154 2.764E-02 2.436E-08 Co58 5.387E-12 4.747E-18 Eu155 1.235E-02 1.088E-08 Co60 3.592E+01 3.165E-05 Gd152 4.304E-18 3.793E-24 Ni59 2.147E-02 1.892E-08 Gd153 7.339E-07 6.467E-13 Ni63 3.440E+00 3.031E-06 Tb160 1.979E-11 1.744E-17 Zn65 2.597E-02 2.288E-08 Ho166m 2.307E-04 2.033E-10 Sr89 1.100E-24 9.693E-31 Tm170 1.883E-10 1.659E-16 Y90 5.474E-10 4.824E-16 Tm171 1.535E-06 1.353E-12 Zr93 2.878E-08 2.536E-14 Ta182 1.331E-09 1.173E-15 Zr95 3.853E-17 3.395E-23 W181 1.230E-08 1.084E-14 Nb94 2.595E-06 2.287E-12 W185 1.693E-11 1.492E-17 Nb95 8.554E-17 7.538E-23 W188 3.537E-14 3.117E-20
Nb95m 2.858E-19 2.518E-25 Re188 3.574E-14 3.149E-20 Mo93 1.761E-03 1.552E-09 Ir192 1.938E-07 1.708E-13 Tc99 6.551E-05 5.773E-11 Ir192m 1.937E-07 1.707E-13
Ru103 4.474E-25 3.943E-31 Ir194 3.615E-09 3.186E-15 Rh106 6.467E-15 5.699E-21 Pt193 5.139E-06 4.529E-12 Ag108 2.373E-03 2.091E-09 Tl206 4.565E-08 4.023E-14
Ag108m 2.666E-02 2.349E-08 Pb204 1.716E-16 1.512E-22 Ag109m 1.578E-02 1.391E-08 Bi208 7.428E-08 6.546E-14 Ag110 1.254E-06 1.105E-12 Bi210m 4.583E-08 4.039E-14
Ag110m 9.432E-05 8.312E-11 Po210 1.485E-08 1.309E-14 Cd109 1.578E-02 1.391E-08 Total 2.212E+02 1.950E-04
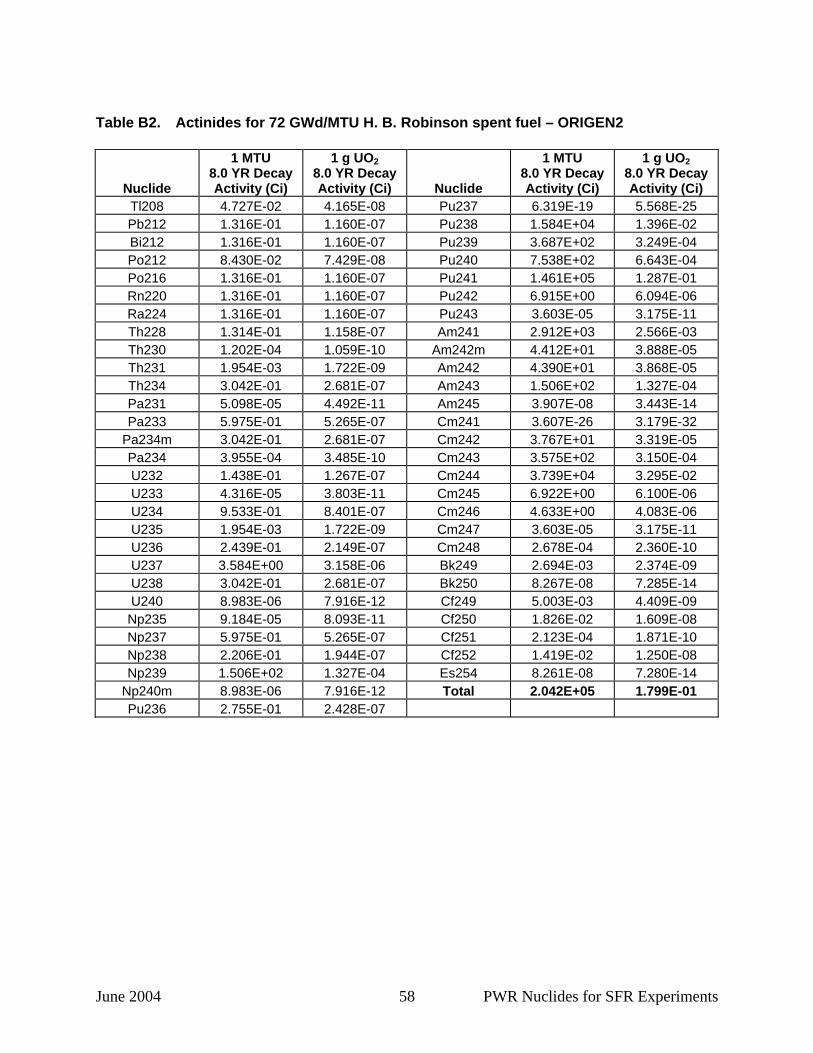
June 2004 58 PWR Nuclides for SFR Experiments
Table B2. Actinides for 72 GWd/MTU H. B. Robinson spent fuel – ORIGEN2
Nuclide
1 MTU 8.0 YR Decay Activity (Ci)
1 g UO2 8.0 YR Decay Activity (Ci) Nuclide
1 MTU 8.0 YR Decay Activity (Ci)
1 g UO2 8.0 YR Decay Activity (Ci)
Tl208 4.727E-02 4.165E-08 Pu237 6.319E-19 5.568E-25 Pb212 1.316E-01 1.160E-07 Pu238 1.584E+04 1.396E-02 Bi212 1.316E-01 1.160E-07 Pu239 3.687E+02 3.249E-04 Po212 8.430E-02 7.429E-08 Pu240 7.538E+02 6.643E-04 Po216 1.316E-01 1.160E-07 Pu241 1.461E+05 1.287E-01 Rn220 1.316E-01 1.160E-07 Pu242 6.915E+00 6.094E-06 Ra224 1.316E-01 1.160E-07 Pu243 3.603E-05 3.175E-11 Th228 1.314E-01 1.158E-07 Am241 2.912E+03 2.566E-03 Th230 1.202E-04 1.059E-10 Am242m 4.412E+01 3.888E-05 Th231 1.954E-03 1.722E-09 Am242 4.390E+01 3.868E-05 Th234 3.042E-01 2.681E-07 Am243 1.506E+02 1.327E-04 Pa231 5.098E-05 4.492E-11 Am245 3.907E-08 3.443E-14 Pa233 5.975E-01 5.265E-07 Cm241 3.607E-26 3.179E-32
Pa234m 3.042E-01 2.681E-07 Cm242 3.767E+01 3.319E-05 Pa234 3.955E-04 3.485E-10 Cm243 3.575E+02 3.150E-04 U232 1.438E-01 1.267E-07 Cm244 3.739E+04 3.295E-02 U233 4.316E-05 3.803E-11 Cm245 6.922E+00 6.100E-06 U234 9.533E-01 8.401E-07 Cm246 4.633E+00 4.083E-06 U235 1.954E-03 1.722E-09 Cm247 3.603E-05 3.175E-11 U236 2.439E-01 2.149E-07 Cm248 2.678E-04 2.360E-10 U237 3.584E+00 3.158E-06 Bk249 2.694E-03 2.374E-09 U238 3.042E-01 2.681E-07 Bk250 8.267E-08 7.285E-14 U240 8.983E-06 7.916E-12 Cf249 5.003E-03 4.409E-09 Np235 9.184E-05 8.093E-11 Cf250 1.826E-02 1.609E-08 Np237 5.975E-01 5.265E-07 Cf251 2.123E-04 1.871E-10 Np238 2.206E-01 1.944E-07 Cf252 1.419E-02 1.250E-08 Np239 1.506E+02 1.327E-04 Es254 8.261E-08 7.280E-14
Np240m 8.983E-06 7.916E-12 Total 2.042E+05 1.799E-01 Pu236 2.755E-01 2.428E-07
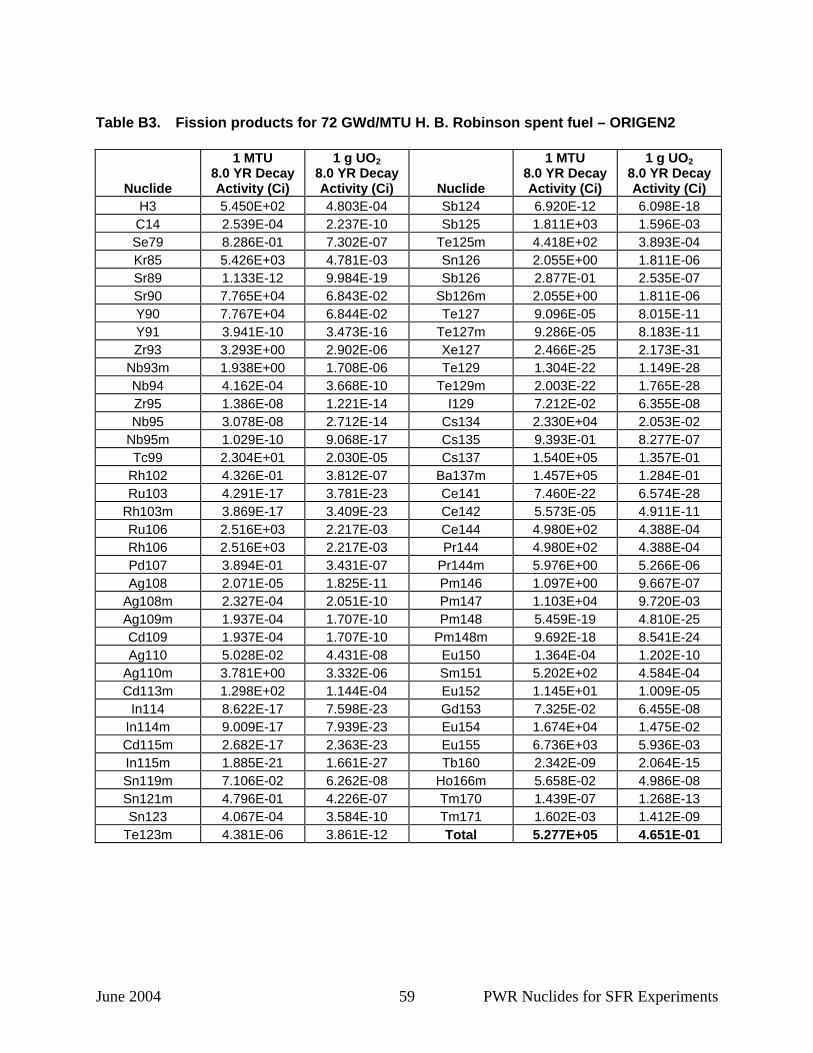
June 2004 59 PWR Nuclides for SFR Experiments
Table B3. Fission products for 72 GWd/MTU H. B. Robinson spent fuel – ORIGEN2
Nuclide
1 MTU 8.0 YR Decay Activity (Ci)
1 g UO2 8.0 YR Decay Activity (Ci) Nuclide
1 MTU 8.0 YR Decay Activity (Ci)
1 g UO2 8.0 YR Decay Activity (Ci)
H3 5.450E+02 4.803E-04 Sb124 6.920E-12 6.098E-18 C14 2.539E-04 2.237E-10 Sb125 1.811E+03 1.596E-03 Se79 8.286E-01 7.302E-07 Te125m 4.418E+02 3.893E-04 Kr85 5.426E+03 4.781E-03 Sn126 2.055E+00 1.811E-06 Sr89 1.133E-12 9.984E-19 Sb126 2.877E-01 2.535E-07 Sr90 7.765E+04 6.843E-02 Sb126m 2.055E+00 1.811E-06 Y90 7.767E+04 6.844E-02 Te127 9.096E-05 8.015E-11 Y91 3.941E-10 3.473E-16 Te127m 9.286E-05 8.183E-11 Zr93 3.293E+00 2.902E-06 Xe127 2.466E-25 2.173E-31
Nb93m 1.938E+00 1.708E-06 Te129 1.304E-22 1.149E-28 Nb94 4.162E-04 3.668E-10 Te129m 2.003E-22 1.765E-28 Zr95 1.386E-08 1.221E-14 I129 7.212E-02 6.355E-08 Nb95 3.078E-08 2.712E-14 Cs134 2.330E+04 2.053E-02
Nb95m 1.029E-10 9.068E-17 Cs135 9.393E-01 8.277E-07 Tc99 2.304E+01 2.030E-05 Cs137 1.540E+05 1.357E-01
Rh102 4.326E-01 3.812E-07 Ba137m 1.457E+05 1.284E-01 Ru103 4.291E-17 3.781E-23 Ce141 7.460E-22 6.574E-28
Rh103m 3.869E-17 3.409E-23 Ce142 5.573E-05 4.911E-11 Ru106 2.516E+03 2.217E-03 Ce144 4.980E+02 4.388E-04 Rh106 2.516E+03 2.217E-03 Pr144 4.980E+02 4.388E-04 Pd107 3.894E-01 3.431E-07 Pr144m 5.976E+00 5.266E-06 Ag108 2.071E-05 1.825E-11 Pm146 1.097E+00 9.667E-07
Ag108m 2.327E-04 2.051E-10 Pm147 1.103E+04 9.720E-03 Ag109m 1.937E-04 1.707E-10 Pm148 5.459E-19 4.810E-25 Cd109 1.937E-04 1.707E-10 Pm148m 9.692E-18 8.541E-24 Ag110 5.028E-02 4.431E-08 Eu150 1.364E-04 1.202E-10
Ag110m 3.781E+00 3.332E-06 Sm151 5.202E+02 4.584E-04 Cd113m 1.298E+02 1.144E-04 Eu152 1.145E+01 1.009E-05
In114 8.622E-17 7.598E-23 Gd153 7.325E-02 6.455E-08 In114m 9.009E-17 7.939E-23 Eu154 1.674E+04 1.475E-02 Cd115m 2.682E-17 2.363E-23 Eu155 6.736E+03 5.936E-03 In115m 1.885E-21 1.661E-27 Tb160 2.342E-09 2.064E-15 Sn119m 7.106E-02 6.262E-08 Ho166m 5.658E-02 4.986E-08 Sn121m 4.796E-01 4.226E-07 Tm170 1.439E-07 1.268E-13 Sn123 4.067E-04 3.584E-10 Tm171 1.602E-03 1.412E-09
Te123m 4.381E-06 3.861E-12 Total 5.277E+05 4.651E-01
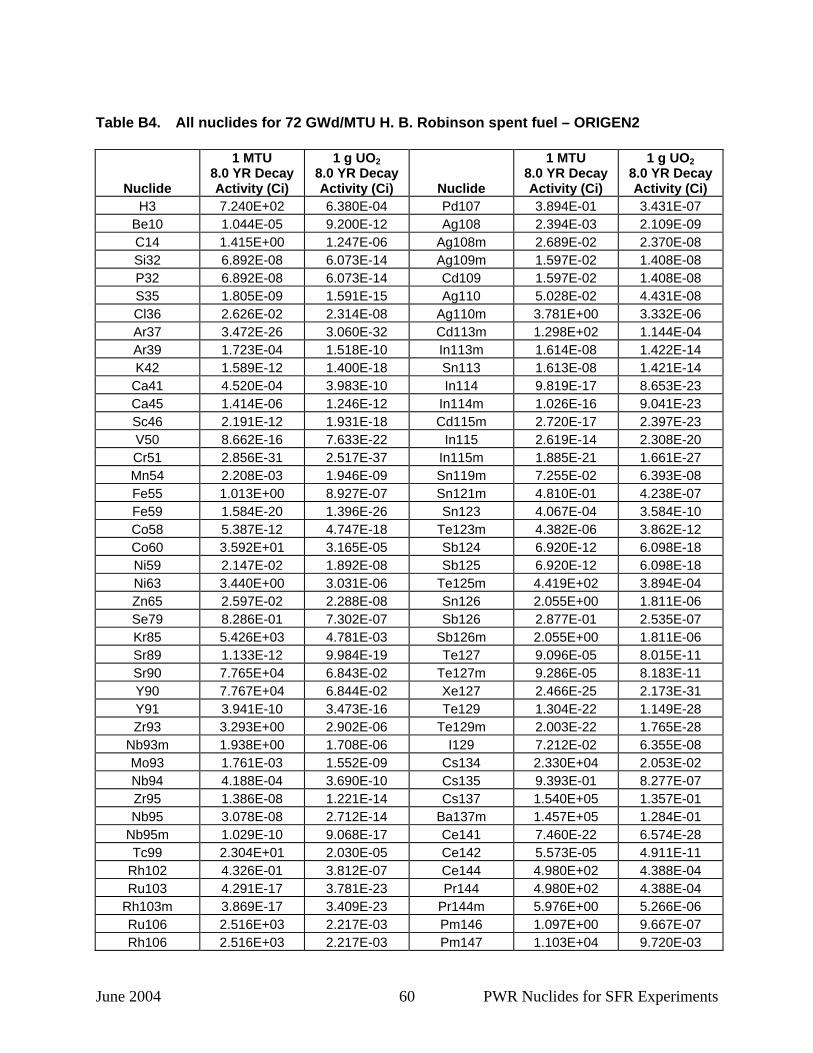
June 2004 60 PWR Nuclides for SFR Experiments
Table B4. All nuclides for 72 GWd/MTU H. B. Robinson spent fuel – ORIGEN2
Nuclide
1 MTU 8.0 YR Decay Activity (Ci)
1 g UO2 8.0 YR Decay Activity (Ci) Nuclide
1 MTU 8.0 YR Decay Activity (Ci)
1 g UO2 8.0 YR Decay Activity (Ci)
H3 7.240E+02 6.380E-04 Pd107 3.894E-01 3.431E-07 Be10 1.044E-05 9.200E-12 Ag108 2.394E-03 2.109E-09 C14 1.415E+00 1.247E-06 Ag108m 2.689E-02 2.370E-08 Si32 6.892E-08 6.073E-14 Ag109m 1.597E-02 1.408E-08 P32 6.892E-08 6.073E-14 Cd109 1.597E-02 1.408E-08 S35 1.805E-09 1.591E-15 Ag110 5.028E-02 4.431E-08 Cl36 2.626E-02 2.314E-08 Ag110m 3.781E+00 3.332E-06 Ar37 3.472E-26 3.060E-32 Cd113m 1.298E+02 1.144E-04 Ar39 1.723E-04 1.518E-10 In113m 1.614E-08 1.422E-14 K42 1.589E-12 1.400E-18 Sn113 1.613E-08 1.421E-14
Ca41 4.520E-04 3.983E-10 In114 9.819E-17 8.653E-23 Ca45 1.414E-06 1.246E-12 In114m 1.026E-16 9.041E-23 Sc46 2.191E-12 1.931E-18 Cd115m 2.720E-17 2.397E-23 V50 8.662E-16 7.633E-22 In115 2.619E-14 2.308E-20 Cr51 2.856E-31 2.517E-37 In115m 1.885E-21 1.661E-27 Mn54 2.208E-03 1.946E-09 Sn119m 7.255E-02 6.393E-08 Fe55 1.013E+00 8.927E-07 Sn121m 4.810E-01 4.238E-07 Fe59 1.584E-20 1.396E-26 Sn123 4.067E-04 3.584E-10 Co58 5.387E-12 4.747E-18 Te123m 4.382E-06 3.862E-12 Co60 3.592E+01 3.165E-05 Sb124 6.920E-12 6.098E-18 Ni59 2.147E-02 1.892E-08 Sb125 6.920E-12 6.098E-18 Ni63 3.440E+00 3.031E-06 Te125m 4.419E+02 3.894E-04 Zn65 2.597E-02 2.288E-08 Sn126 2.055E+00 1.811E-06 Se79 8.286E-01 7.302E-07 Sb126 2.877E-01 2.535E-07 Kr85 5.426E+03 4.781E-03 Sb126m 2.055E+00 1.811E-06 Sr89 1.133E-12 9.984E-19 Te127 9.096E-05 8.015E-11 Sr90 7.765E+04 6.843E-02 Te127m 9.286E-05 8.183E-11 Y90 7.767E+04 6.844E-02 Xe127 2.466E-25 2.173E-31 Y91 3.941E-10 3.473E-16 Te129 1.304E-22 1.149E-28 Zr93 3.293E+00 2.902E-06 Te129m 2.003E-22 1.765E-28
Nb93m 1.938E+00 1.708E-06 I129 7.212E-02 6.355E-08 Mo93 1.761E-03 1.552E-09 Cs134 2.330E+04 2.053E-02 Nb94 4.188E-04 3.690E-10 Cs135 9.393E-01 8.277E-07 Zr95 1.386E-08 1.221E-14 Cs137 1.540E+05 1.357E-01 Nb95 3.078E-08 2.712E-14 Ba137m 1.457E+05 1.284E-01
Nb95m 1.029E-10 9.068E-17 Ce141 7.460E-22 6.574E-28 Tc99 2.304E+01 2.030E-05 Ce142 5.573E-05 4.911E-11
Rh102 4.326E-01 3.812E-07 Ce144 4.980E+02 4.388E-04 Ru103 4.291E-17 3.781E-23 Pr144 4.980E+02 4.388E-04
Rh103m 3.869E-17 3.409E-23 Pr144m 5.976E+00 5.266E-06 Ru106 2.516E+03 2.217E-03 Pm146 1.097E+00 9.667E-07 Rh106 2.516E+03 2.217E-03 Pm147 1.103E+04 9.720E-03
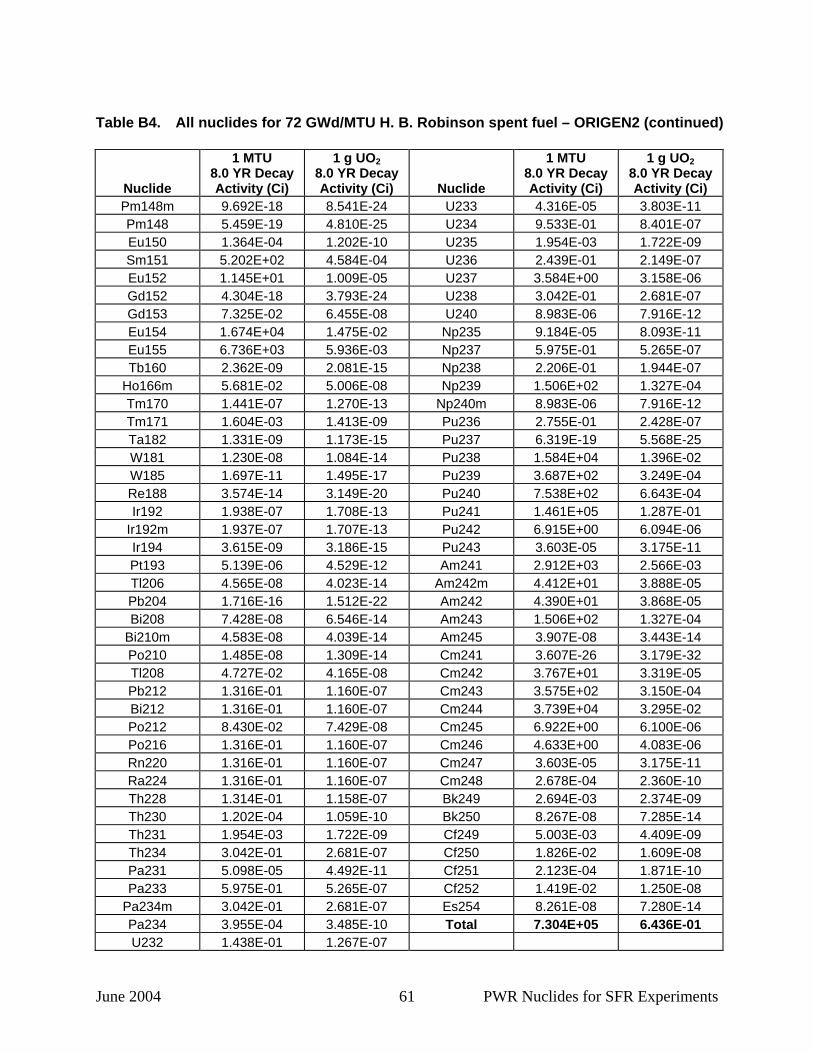
June 2004 61 PWR Nuclides for SFR Experiments
Table B4. All nuclides for 72 GWd/MTU H. B. Robinson spent fuel – ORIGEN2 (continued)
Nuclide
1 MTU 8.0 YR Decay Activity (Ci)
1 g UO2 8.0 YR Decay Activity (Ci) Nuclide
1 MTU 8.0 YR Decay Activity (Ci)
1 g UO2 8.0 YR Decay Activity (Ci)
Pm148m 9.692E-18 8.541E-24 U233 4.316E-05 3.803E-11 Pm148 5.459E-19 4.810E-25 U234 9.533E-01 8.401E-07 Eu150 1.364E-04 1.202E-10 U235 1.954E-03 1.722E-09 Sm151 5.202E+02 4.584E-04 U236 2.439E-01 2.149E-07 Eu152 1.145E+01 1.009E-05 U237 3.584E+00 3.158E-06 Gd152 4.304E-18 3.793E-24 U238 3.042E-01 2.681E-07 Gd153 7.325E-02 6.455E-08 U240 8.983E-06 7.916E-12 Eu154 1.674E+04 1.475E-02 Np235 9.184E-05 8.093E-11 Eu155 6.736E+03 5.936E-03 Np237 5.975E-01 5.265E-07 Tb160 2.362E-09 2.081E-15 Np238 2.206E-01 1.944E-07
Ho166m 5.681E-02 5.006E-08 Np239 1.506E+02 1.327E-04 Tm170 1.441E-07 1.270E-13 Np240m 8.983E-06 7.916E-12 Tm171 1.604E-03 1.413E-09 Pu236 2.755E-01 2.428E-07 Ta182 1.331E-09 1.173E-15 Pu237 6.319E-19 5.568E-25 W181 1.230E-08 1.084E-14 Pu238 1.584E+04 1.396E-02 W185 1.697E-11 1.495E-17 Pu239 3.687E+02 3.249E-04 Re188 3.574E-14 3.149E-20 Pu240 7.538E+02 6.643E-04 Ir192 1.938E-07 1.708E-13 Pu241 1.461E+05 1.287E-01
Ir192m 1.937E-07 1.707E-13 Pu242 6.915E+00 6.094E-06 Ir194 3.615E-09 3.186E-15 Pu243 3.603E-05 3.175E-11 Pt193 5.139E-06 4.529E-12 Am241 2.912E+03 2.566E-03 Tl206 4.565E-08 4.023E-14 Am242m 4.412E+01 3.888E-05 Pb204 1.716E-16 1.512E-22 Am242 4.390E+01 3.868E-05 Bi208 7.428E-08 6.546E-14 Am243 1.506E+02 1.327E-04
Bi210m 4.583E-08 4.039E-14 Am245 3.907E-08 3.443E-14 Po210 1.485E-08 1.309E-14 Cm241 3.607E-26 3.179E-32 Tl208 4.727E-02 4.165E-08 Cm242 3.767E+01 3.319E-05 Pb212 1.316E-01 1.160E-07 Cm243 3.575E+02 3.150E-04 Bi212 1.316E-01 1.160E-07 Cm244 3.739E+04 3.295E-02 Po212 8.430E-02 7.429E-08 Cm245 6.922E+00 6.100E-06 Po216 1.316E-01 1.160E-07 Cm246 4.633E+00 4.083E-06 Rn220 1.316E-01 1.160E-07 Cm247 3.603E-05 3.175E-11 Ra224 1.316E-01 1.160E-07 Cm248 2.678E-04 2.360E-10 Th228 1.314E-01 1.158E-07 Bk249 2.694E-03 2.374E-09 Th230 1.202E-04 1.059E-10 Bk250 8.267E-08 7.285E-14 Th231 1.954E-03 1.722E-09 Cf249 5.003E-03 4.409E-09 Th234 3.042E-01 2.681E-07 Cf250 1.826E-02 1.609E-08 Pa231 5.098E-05 4.492E-11 Cf251 2.123E-04 1.871E-10 Pa233 5.975E-01 5.265E-07 Cf252 1.419E-02 1.250E-08
Pa234m 3.042E-01 2.681E-07 Es254 8.261E-08 7.280E-14 Pa234 3.955E-04 3.485E-10 Total 7.304E+05 6.436E-01 U232 1.438E-01 1.267E-07

June 2004 62 PWR Nuclides for SFR Experiments
Table B5. Actinide mass for 72 GWd/MTU H. B. Robinson spent fuel – ORIGEN2
Nuclide
1 MTU 8.0 YR Decay
Mass (g)
1 g UO2 8.0 YR Decay
Mass (g) Nuclide
1 MTU 8.0 YR Decay
Mass (g)
1 g UO2 8.0 YR Decay
Mass (g) He4 1.863E+01 1.642E-05 Pu241 1.417E+03 1.249E-03
Pb208 5.683E-04 5.008E-10 Pu242 1.810E+03 1.595E-03 Th228 1.603E-04 1.413E-10 Pu243 1.384E-11 1.220E-17 Th230 5.950E-03 5.243E-09 Pu244 5.069E-01 4.467E-07 Th232 2.558E-03 2.254E-09 Am241 8.483E+02 7.475E-04 Pa231 1.079E-03 9.508E-10 Am242m 4.538E+00 3.999E-06 U232 6.714E-03 5.916E-09 Am242 5.428E-05 4.783E-11 U233 4.457E-03 3.928E-09 Am243 7.551E+02 6.654E-04 U234 1.525E+02 1.344E-04 Cm242 1.139E-02 1.004E-08 U235 9.035E+02 7.962E-04 Cm243 6.922E+00 6.100E-06 U236 3.768E+03 3.320E-03 Cm244 4.619E+02 4.070E-04 U237 4.389E-05 3.868E-11 Cm245 4.030E+01 3.551E-05 U238 9.045E+05 7.970E-01 Cm246 1.508E+01 1.329E-05
Np236 1.148E-03 1.012E-09 Cm247 3.881E-01 3.420E-07 Np237 8.473E+02 7.466E-04 Cm248 6.297E-02 5.549E-08 Np238 8.509E-07 7.498E-13 Bk249 1.643E-06 1.448E-12 Np239 6.489E-04 5.718E-10 Cf249 1.221E-03 1.076E-09 Pu236 5.182E-04 4.566E-10 Cf250 1.669E-04 1.471E-10 Pu237 5.227E-23 4.606E-29 Cf251 1.338E-04 1.179E-10 Pu238 9.249E+02 8.150E-04 Cf252 2.638E-05 2.325E-11 Pu239 5.929E+03 5.225E-03 Sf250 4.574E-04 4.031E-10 Pu240 3.307E+03 2.914E-03 Total 9.257E+05 8.157E-01
Total U 9.093E+05 8.013E-01 Total Pu 1.339E+04 1.180E-02

June 2004 63 PWR Nuclides for SFR Experiments
Table B6. Gamma photons from 72 GWd/MTU H. B. Robinson spent fuel – ORIGEN2
Gamma Photon Group
Group Mean Photon Energy
(MeV)
Fission Products
(Photons/s) Actinides
(Photons/s)
Activation Products
(Photons/s) Total
(Photons/s) 1 0.01 2.89E+15 3.51E+14 7.63E+10 3.24E+15 2 0.025 6.23E+14 2.83E+12 1.95E+10 6.26E+14 3 0.0375 9.38E+14 1.35E+12 8.89E+09 9.39E+14 4 0.0575 5.67E+14 4.04E+13 8.08E+09 6.07E+14 5 0.085 3.86E+14 6.63E+12 3.40E+09 3.93E+14 6 0.125 4.88E+14 6.88E+12 1.73E+09 4.95E+14 7 0.225 3.00E+14 6.17E+12 1.01E+09 3.06E+14 8 0.375 1.35E+14 1.99E+11 4.22E+09 1.36E+14 9 0.575 6.82E+15 3.74E+09 5.03E+09 6.82E+15
10 0.85 1.07E+15 1.21E+10 1.45E+09 1.07E+15 11 1.25 3.84E+14 5.53E+09 2.66E+12 3.87E+14 12 1.75 1.07E+13 1.98E+09 1.66E+07 1.07E+13 13 2.25 2.77E+11 1.05E+09 1.41E+07 2.78E+11 14 2.75 2.01E+10 2.27E+09 4.36E+04 2.24E+10 15 3.5 2.62E+09 5.46E+08 1.01E-06 3.16E+09 16 5 1.19E-04 2.34E+08 1.17E-07 2.34E+08 17 7 7.69E-06 2.69E+07 7.60E-09 2.69E+07 18 9.5 4.86E-07 3.09E+06 4.81E-10 3.09E+06
Total Photons/s 1.46E+16 4.15E+14 2.79E+12 1.50E+16 Total MEV/s 5.66E+15 8.87E+12 3.33E+12 5.67E+15
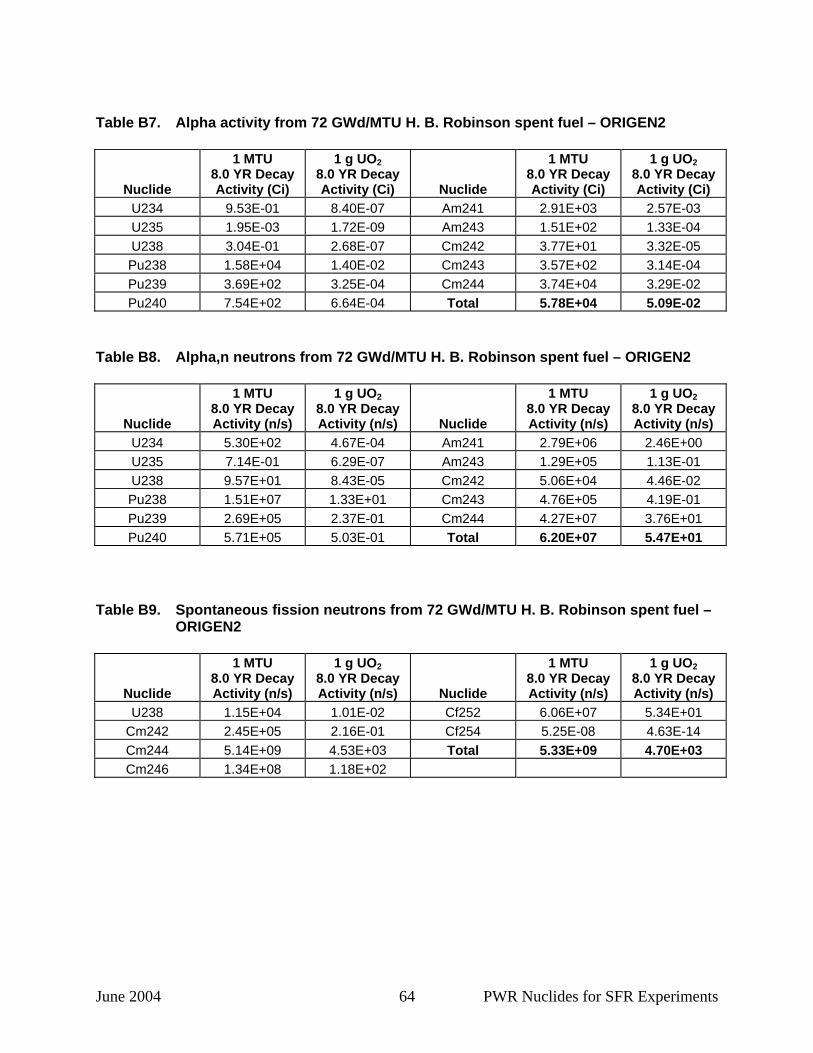
June 2004 64 PWR Nuclides for SFR Experiments
Table B7. Alpha activity from 72 GWd/MTU H. B. Robinson spent fuel – ORIGEN2
Nuclide
1 MTU 8.0 YR Decay Activity (Ci)
1 g UO2 8.0 YR Decay Activity (Ci) Nuclide
1 MTU 8.0 YR Decay Activity (Ci)
1 g UO2 8.0 YR Decay Activity (Ci)
U234 9.53E-01 8.40E-07 Am241 2.91E+03 2.57E-03 U235 1.95E-03 1.72E-09 Am243 1.51E+02 1.33E-04 U238 3.04E-01 2.68E-07 Cm242 3.77E+01 3.32E-05 Pu238 1.58E+04 1.40E-02 Cm243 3.57E+02 3.14E-04 Pu239 3.69E+02 3.25E-04 Cm244 3.74E+04 3.29E-02 Pu240 7.54E+02 6.64E-04 Total 5.78E+04 5.09E-02
Table B8. Alpha,n neutrons from 72 GWd/MTU H. B. Robinson spent fuel – ORIGEN2
Nuclide
1 MTU 8.0 YR Decay Activity (n/s)
1 g UO2 8.0 YR Decay Activity (n/s) Nuclide
1 MTU 8.0 YR Decay Activity (n/s)
1 g UO2 8.0 YR Decay Activity (n/s)
U234 5.30E+02 4.67E-04 Am241 2.79E+06 2.46E+00 U235 7.14E-01 6.29E-07 Am243 1.29E+05 1.13E-01 U238 9.57E+01 8.43E-05 Cm242 5.06E+04 4.46E-02 Pu238 1.51E+07 1.33E+01 Cm243 4.76E+05 4.19E-01 Pu239 2.69E+05 2.37E-01 Cm244 4.27E+07 3.76E+01 Pu240 5.71E+05 5.03E-01 Total 6.20E+07 5.47E+01
Table B9. Spontaneous fission neutrons from 72 GWd/MTU H. B. Robinson spent fuel –
ORIGEN2
Nuclide
1 MTU 8.0 YR Decay Activity (n/s)
1 g UO2 8.0 YR Decay Activity (n/s) Nuclide
1 MTU 8.0 YR Decay Activity (n/s)
1 g UO2 8.0 YR Decay Activity (n/s)
U238 1.15E+04 1.01E-02 Cf252 6.06E+07 5.34E+01 Cm242 2.45E+05 2.16E-01 Cf254 5.25E-08 4.63E-14 Cm244 5.14E+09 4.53E+03 Total 5.33E+09 4.70E+03 Cm246 1.34E+08 1.18E+02

June 2004 65 PWR Nuclides for SFR Experiments
Appendix C – H. B. Robinson Nuclide Composition
Comparison for Various Calculation Methods of 67 GWd/MTU Burnup
This appendix contains the comparisons of nuclide compositions for three calculations of the H. B. Robinson 67 GWd/MTU average spent fuel burnup for rod R01 that will be used for SFR experiment sample preparation. The calculated nuclide activity compositions compared include those done locally by the ORIGEN2 and the ORIGEN-ARP codes and one done by Siemens Power Corporation for Framatome ANP Richland, Inc. with an unknown version of the ORIGEN code to support shipment of the H. B. Robinson fuel rods to Argonne National Laboratory (EPRI 2001). The objective of comparing the nuclide composition calculations was to evaluate the adequacy of the 72 GWd/MTU H. B. Robinson spent fuel calculation performed with ORIGEN2 as opposed to ORIGEN-ARP by comparing a 67 GWd/MTU version of the calculation that can be run with ORIGEN-ARP as well as ORIGEN2. The comparisons consisted of finding the percentage difference of the nuclide activity in one calculation to another. Tables C1 and C2 below show the comparisons for actinides and for fission products respectively. Nuclide compositions for activation products were not compared since the Siemens calculation did not include UO2 impurities that provide activation products. Each table consists of three columns for three comparisons plus a column that lists the nuclides compared. The comparisons columns on the left and right show the percentage difference of the nuclide activity from the Siemens ORIGEN calculation to the ORIGEN2 calculation and from the Siemens ORIGEN calculation to the ORIGEN-ARP calculation respectively. The middle comparison shows the percentage difference of the nuclide activity from ORIGEN-ARP to ORIGEN2. Thus, both local calculations are compared to the Siemens calculation and to each other. Blanks in the tables had one or both of the nuclides missing for that comparison. The actinides produce the most stressing part of the radiological hazards for the H. B. Robinson 72 GWd/MTU spent fuel. In Table C1, the actinide nuclides that were assessed to produce the highest contributions to the radiological hazards are shown as bold text. These actinide nuclides were Pu-238, Pu-241, Am-241, and Cm-244. The gamma photon output and presumably the gamma dose rate for the H. B. Robinson 72 GWd/MTU spent fuel was dominated by the contribution of the fission products. In Table C2 the fission product nuclides that provided the highest contributions to the photon activity (photons per second) in the highest photon energy emission rate groups 9, 10 and 11 from Table B6 of Appendix B are shown in bold text. These fission product nuclides were Y-90, Rh-106, Cs-134, Ba-137m, and Eu-154. Tables Table C1. Actinide percentage change for three, nuclide compositions Table C2. Fission product percentage change for three, nuclide compositions
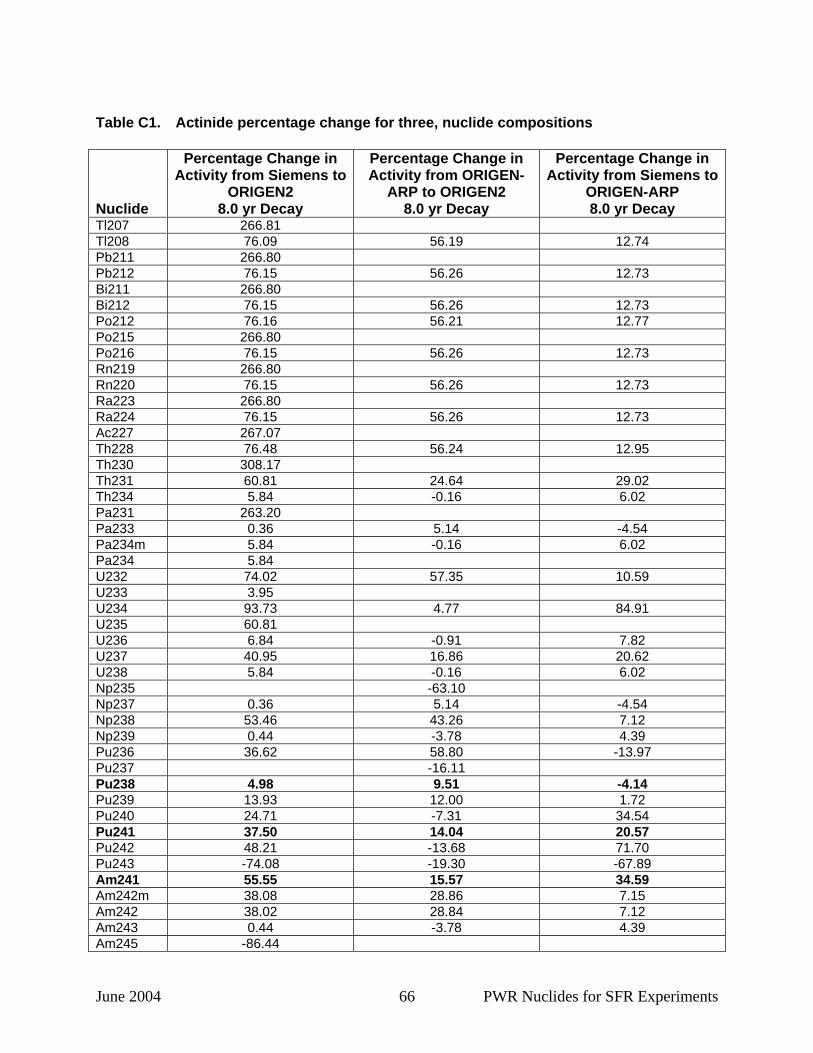
June 2004 66 PWR Nuclides for SFR Experiments
Table C1. Actinide percentage change for three, nuclide compositions Nuclide
Percentage Change in Activity from Siemens to
ORIGEN2 8.0 yr Decay
Percentage Change in Activity from ORIGEN-
ARP to ORIGEN2 8.0 yr Decay
Percentage Change in Activity from Siemens to
ORIGEN-ARP 8.0 yr Decay
Tl207 266.81 Tl208 76.09 56.19 12.74 Pb211 266.80 Pb212 76.15 56.26 12.73 Bi211 266.80 Bi212 76.15 56.26 12.73 Po212 76.16 56.21 12.77 Po215 266.80 Po216 76.15 56.26 12.73 Rn219 266.80 Rn220 76.15 56.26 12.73 Ra223 266.80 Ra224 76.15 56.26 12.73 Ac227 267.07 Th228 76.48 56.24 12.95 Th230 308.17 Th231 60.81 24.64 29.02 Th234 5.84 -0.16 6.02 Pa231 263.20 Pa233 0.36 5.14 -4.54 Pa234m 5.84 -0.16 6.02 Pa234 5.84 U232 74.02 57.35 10.59 U233 3.95 U234 93.73 4.77 84.91 U235 60.81 U236 6.84 -0.91 7.82 U237 40.95 16.86 20.62 U238 5.84 -0.16 6.02 Np235 -63.10 Np237 0.36 5.14 -4.54 Np238 53.46 43.26 7.12 Np239 0.44 -3.78 4.39 Pu236 36.62 58.80 -13.97 Pu237 -16.11 Pu238 4.98 9.51 -4.14 Pu239 13.93 12.00 1.72 Pu240 24.71 -7.31 34.54 Pu241 37.50 14.04 20.57 Pu242 48.21 -13.68 71.70 Pu243 -74.08 -19.30 -67.89 Am241 55.55 15.57 34.59 Am242m 38.08 28.86 7.15 Am242 38.02 28.84 7.12 Am243 0.44 -3.78 4.39 Am245 -86.44
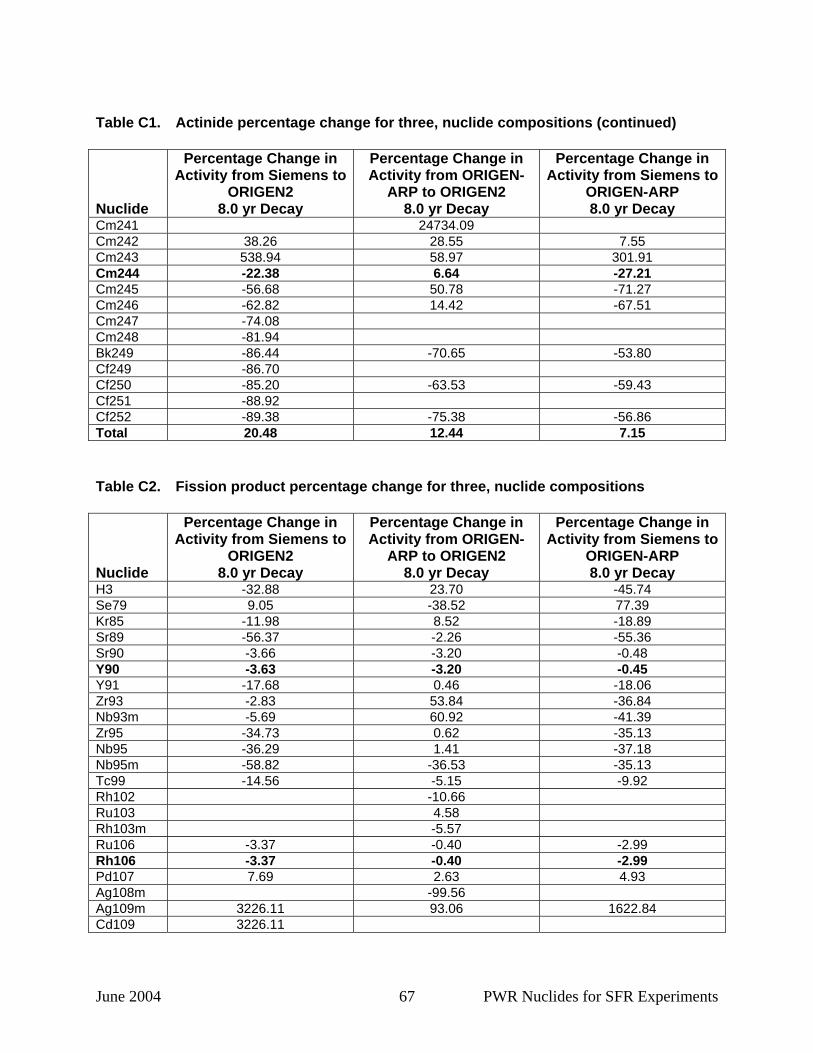
June 2004 67 PWR Nuclides for SFR Experiments
Table C1. Actinide percentage change for three, nuclide compositions (continued) Nuclide
Percentage Change in Activity from Siemens to
ORIGEN2 8.0 yr Decay
Percentage Change in Activity from ORIGEN-
ARP to ORIGEN2 8.0 yr Decay
Percentage Change in Activity from Siemens to
ORIGEN-ARP 8.0 yr Decay
Cm241 24734.09 Cm242 38.26 28.55 7.55 Cm243 538.94 58.97 301.91 Cm244 -22.38 6.64 -27.21 Cm245 -56.68 50.78 -71.27 Cm246 -62.82 14.42 -67.51 Cm247 -74.08 Cm248 -81.94 Bk249 -86.44 -70.65 -53.80 Cf249 -86.70 Cf250 -85.20 -63.53 -59.43 Cf251 -88.92 Cf252 -89.38 -75.38 -56.86 Total 20.48 12.44 7.15 Table C2. Fission product percentage change for three, nuclide compositions Nuclide
Percentage Change in Activity from Siemens to
ORIGEN2 8.0 yr Decay
Percentage Change in Activity from ORIGEN-
ARP to ORIGEN2 8.0 yr Decay
Percentage Change in Activity from Siemens to
ORIGEN-ARP 8.0 yr Decay
H3 -32.88 23.70 -45.74 Se79 9.05 -38.52 77.39 Kr85 -11.98 8.52 -18.89 Sr89 -56.37 -2.26 -55.36 Sr90 -3.66 -3.20 -0.48 Y90 -3.63 -3.20 -0.45 Y91 -17.68 0.46 -18.06 Zr93 -2.83 53.84 -36.84 Nb93m -5.69 60.92 -41.39 Zr95 -34.73 0.62 -35.13 Nb95 -36.29 1.41 -37.18 Nb95m -58.82 -36.53 -35.13 Tc99 -14.56 -5.15 -9.92 Rh102 -10.66 Ru103 4.58 Rh103m -5.57 Ru106 -3.37 -0.40 -2.99 Rh106 -3.37 -0.40 -2.99 Pd107 7.69 2.63 4.93 Ag108m -99.56 Ag109m 3226.11 93.06 1622.84 Cd109 3226.11
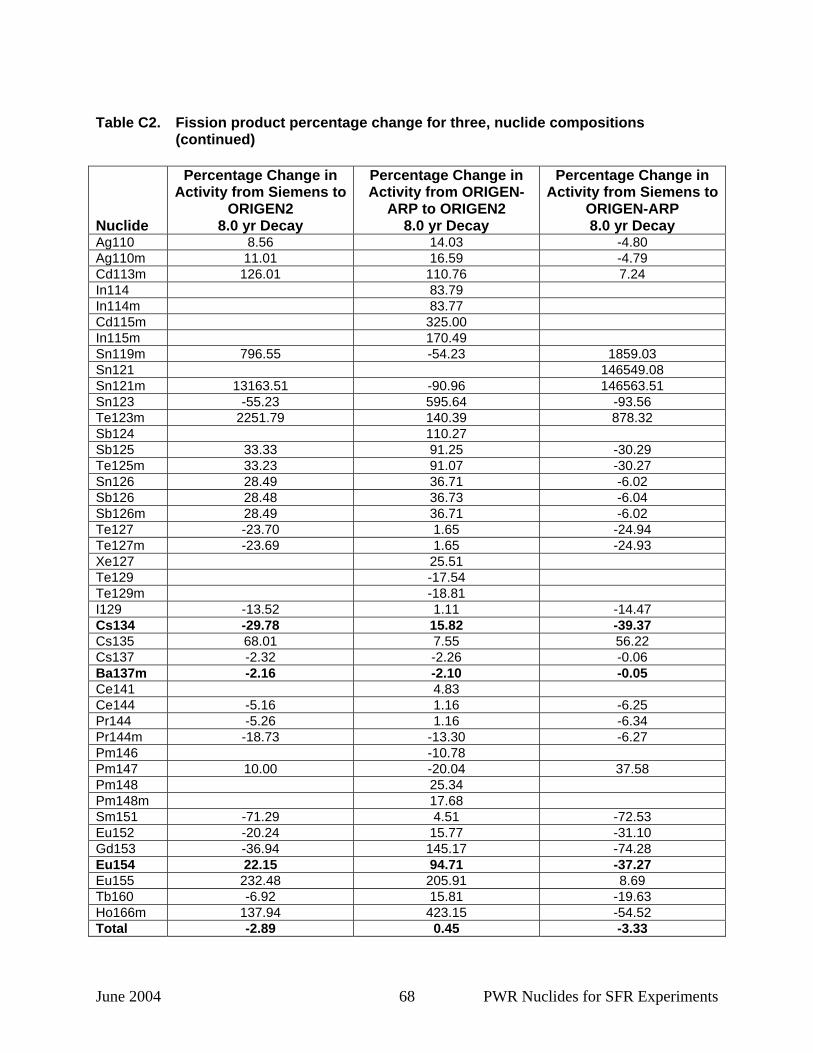
June 2004 68 PWR Nuclides for SFR Experiments
Table C2. Fission product percentage change for three, nuclide compositions
(continued) Nuclide
Percentage Change in Activity from Siemens to
ORIGEN2 8.0 yr Decay
Percentage Change in Activity from ORIGEN-
ARP to ORIGEN2 8.0 yr Decay
Percentage Change in Activity from Siemens to
ORIGEN-ARP 8.0 yr Decay
Ag110 8.56 14.03 -4.80 Ag110m 11.01 16.59 -4.79 Cd113m 126.01 110.76 7.24 In114 83.79 In114m 83.77 Cd115m 325.00 In115m 170.49 Sn119m 796.55 -54.23 1859.03 Sn121 146549.08 Sn121m 13163.51 -90.96 146563.51 Sn123 -55.23 595.64 -93.56 Te123m 2251.79 140.39 878.32 Sb124 110.27 Sb125 33.33 91.25 -30.29 Te125m 33.23 91.07 -30.27 Sn126 28.49 36.71 -6.02 Sb126 28.48 36.73 -6.04 Sb126m 28.49 36.71 -6.02 Te127 -23.70 1.65 -24.94 Te127m -23.69 1.65 -24.93 Xe127 25.51 Te129 -17.54 Te129m -18.81 I129 -13.52 1.11 -14.47 Cs134 -29.78 15.82 -39.37 Cs135 68.01 7.55 56.22 Cs137 -2.32 -2.26 -0.06 Ba137m -2.16 -2.10 -0.05 Ce141 4.83 Ce144 -5.16 1.16 -6.25 Pr144 -5.26 1.16 -6.34 Pr144m -18.73 -13.30 -6.27 Pm146 -10.78 Pm147 10.00 -20.04 37.58 Pm148 25.34 Pm148m 17.68 Sm151 -71.29 4.51 -72.53 Eu152 -20.24 15.77 -31.10 Gd153 -36.94 145.17 -74.28 Eu154 22.15 94.71 -37.27 Eu155 232.48 205.91 8.69 Tb160 -6.92 15.81 -19.63 Ho166m 137.94 423.15 -54.52 Total -2.89 0.45 -3.33
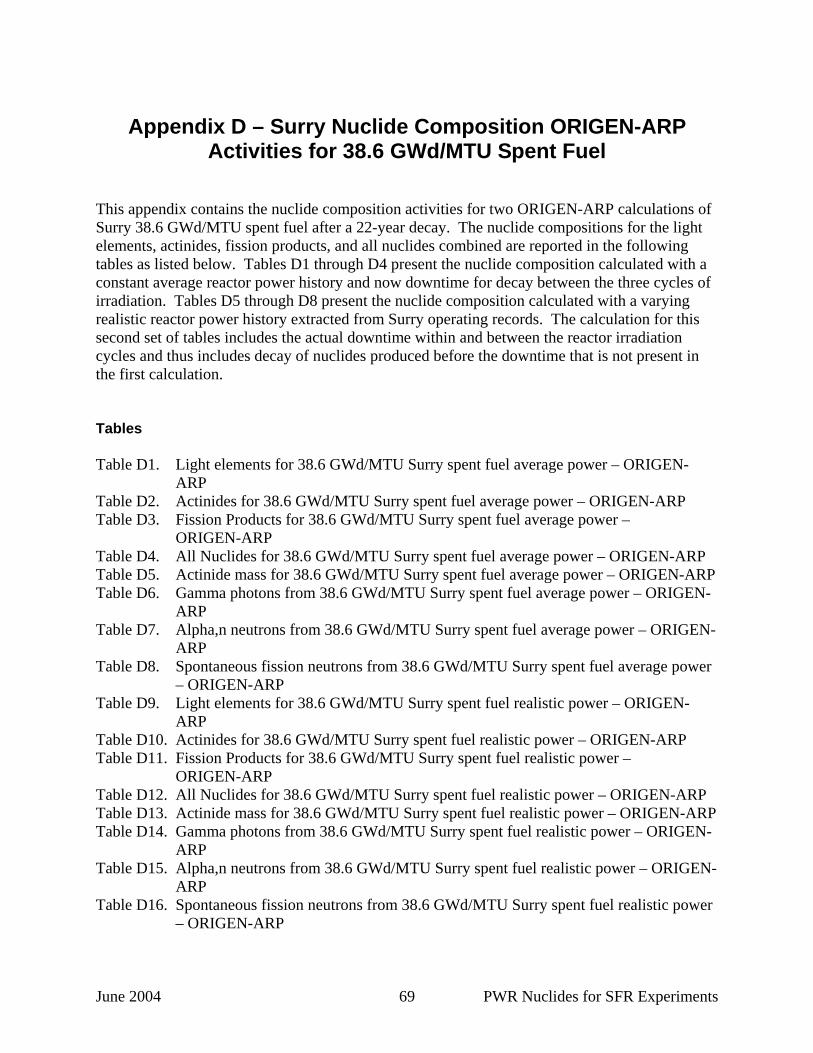
June 2004 69 PWR Nuclides for SFR Experiments
Appendix D – Surry Nuclide Composition ORIGEN-ARP
Activities for 38.6 GWd/MTU Spent Fuel This appendix contains the nuclide composition activities for two ORIGEN-ARP calculations of Surry 38.6 GWd/MTU spent fuel after a 22-year decay. The nuclide compositions for the light elements, actinides, fission products, and all nuclides combined are reported in the following tables as listed below. Tables D1 through D4 present the nuclide composition calculated with a constant average reactor power history and now downtime for decay between the three cycles of irradiation. Tables D5 through D8 present the nuclide composition calculated with a varying realistic reactor power history extracted from Surry operating records. The calculation for this second set of tables includes the actual downtime within and between the reactor irradiation cycles and thus includes decay of nuclides produced before the downtime that is not present in the first calculation. Tables Table D1. Light elements for 38.6 GWd/MTU Surry spent fuel average power – ORIGEN-
ARP Table D2. Actinides for 38.6 GWd/MTU Surry spent fuel average power – ORIGEN-ARP Table D3. Fission Products for 38.6 GWd/MTU Surry spent fuel average power –
ORIGEN-ARP Table D4. All Nuclides for 38.6 GWd/MTU Surry spent fuel average power – ORIGEN-ARP Table D5. Actinide mass for 38.6 GWd/MTU Surry spent fuel average power – ORIGEN-ARP Table D6. Gamma photons from 38.6 GWd/MTU Surry spent fuel average power – ORIGEN-
ARP Table D7. Alpha,n neutrons from 38.6 GWd/MTU Surry spent fuel average power – ORIGEN-
ARP Table D8. Spontaneous fission neutrons from 38.6 GWd/MTU Surry spent fuel average power
– ORIGEN-ARP Table D9. Light elements for 38.6 GWd/MTU Surry spent fuel realistic power – ORIGEN-
ARP Table D10. Actinides for 38.6 GWd/MTU Surry spent fuel realistic power – ORIGEN-ARP Table D11. Fission Products for 38.6 GWd/MTU Surry spent fuel realistic power –
ORIGEN-ARP Table D12. All Nuclides for 38.6 GWd/MTU Surry spent fuel realistic power – ORIGEN-ARP Table D13. Actinide mass for 38.6 GWd/MTU Surry spent fuel realistic power – ORIGEN-ARP Table D14. Gamma photons from 38.6 GWd/MTU Surry spent fuel realistic power – ORIGEN-
ARP Table D15. Alpha,n neutrons from 38.6 GWd/MTU Surry spent fuel realistic power – ORIGEN-
ARP Table D16. Spontaneous fission neutrons from 38.6 GWd/MTU Surry spent fuel realistic power
– ORIGEN-ARP
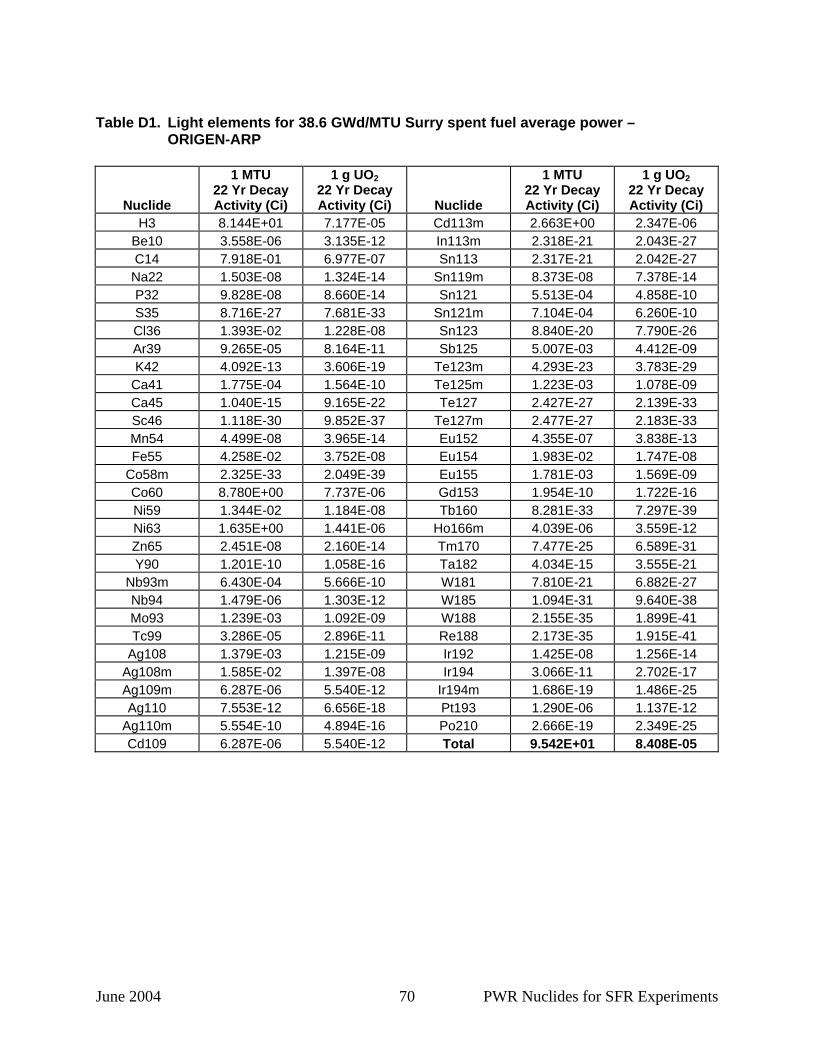
June 2004 70 PWR Nuclides for SFR Experiments
Table D1. Light elements for 38.6 GWd/MTU Surry spent fuel average power –
ORIGEN-ARP
Nuclide
1 MTU 22 Yr Decay Activity (Ci)
1 g UO2 22 Yr Decay Activity (Ci) Nuclide
1 MTU 22 Yr Decay Activity (Ci)
1 g UO2 22 Yr Decay Activity (Ci)
H3 8.144E+01 7.177E-05 Cd113m 2.663E+00 2.347E-06 Be10 3.558E-06 3.135E-12 In113m 2.318E-21 2.043E-27 C14 7.918E-01 6.977E-07 Sn113 2.317E-21 2.042E-27 Na22 1.503E-08 1.324E-14 Sn119m 8.373E-08 7.378E-14 P32 9.828E-08 8.660E-14 Sn121 5.513E-04 4.858E-10 S35 8.716E-27 7.681E-33 Sn121m 7.104E-04 6.260E-10 Cl36 1.393E-02 1.228E-08 Sn123 8.840E-20 7.790E-26 Ar39 9.265E-05 8.164E-11 Sb125 5.007E-03 4.412E-09 K42 4.092E-13 3.606E-19 Te123m 4.293E-23 3.783E-29
Ca41 1.775E-04 1.564E-10 Te125m 1.223E-03 1.078E-09 Ca45 1.040E-15 9.165E-22 Te127 2.427E-27 2.139E-33 Sc46 1.118E-30 9.852E-37 Te127m 2.477E-27 2.183E-33 Mn54 4.499E-08 3.965E-14 Eu152 4.355E-07 3.838E-13 Fe55 4.258E-02 3.752E-08 Eu154 1.983E-02 1.747E-08
Co58m 2.325E-33 2.049E-39 Eu155 1.781E-03 1.569E-09 Co60 8.780E+00 7.737E-06 Gd153 1.954E-10 1.722E-16 Ni59 1.344E-02 1.184E-08 Tb160 8.281E-33 7.297E-39 Ni63 1.635E+00 1.441E-06 Ho166m 4.039E-06 3.559E-12 Zn65 2.451E-08 2.160E-14 Tm170 7.477E-25 6.589E-31 Y90 1.201E-10 1.058E-16 Ta182 4.034E-15 3.555E-21
Nb93m 6.430E-04 5.666E-10 W181 7.810E-21 6.882E-27 Nb94 1.479E-06 1.303E-12 W185 1.094E-31 9.640E-38 Mo93 1.239E-03 1.092E-09 W188 2.155E-35 1.899E-41 Tc99 3.286E-05 2.896E-11 Re188 2.173E-35 1.915E-41
Ag108 1.379E-03 1.215E-09 Ir192 1.425E-08 1.256E-14 Ag108m 1.585E-02 1.397E-08 Ir194 3.066E-11 2.702E-17 Ag109m 6.287E-06 5.540E-12 Ir194m 1.686E-19 1.486E-25 Ag110 7.553E-12 6.656E-18 Pt193 1.290E-06 1.137E-12
Ag110m 5.554E-10 4.894E-16 Po210 2.666E-19 2.349E-25 Cd109 6.287E-06 5.540E-12 Total 9.542E+01 8.408E-05

June 2004 71 PWR Nuclides for SFR Experiments
Table D2. Actinides for 38.6 GWd/MTU Surry spent fuel average power – ORIGEN-ARP
Nuclide
1 MTU 22 Yr Decay Activity (Ci)
1 g UO2 22 Yr Decay Activity (Ci) Nuclide
1 MTU 22 Yr Decay Activity (Ci)
1 g UO2 22 Yr Decay Activity (Ci)
Th231 1.27E-02 1.120E-08 Pu239 3.33E+02 2.934E-04 Th234 3.16E-01 2.782E-07 Pu240 5.95E+02 5.240E-04 Pa233 3.83E-01 3.371E-07 Pu241 5.34E+04 4.708E-02
Pa234m 3.16E-01 2.782E-07 Pu242 2.96E+00 2.609E-06 U232 2.51E-02 2.207E-08 Pu243 6.59E-07 5.811E-13 U234 1.11E+00 9.737E-07 Am241 3.42E+03 3.010E-03 U235 1.27E-02 1.120E-08 Am242m 7.40E+00 6.519E-06 U236 2.73E-01 2.406E-07 Am242 7.37E+00 6.490E-06 U237 1.28E+00 1.127E-06 Am243 3.63E+01 3.201E-05 U238 3.16E-01 2.782E-07 Cm242 6.09E+00 5.367E-06 Np235 1.94E-08 1.713E-14 Cm243 1.42E+01 1.249E-05 Np237 3.83E-01 3.371E-07 Cm244 2.20E+03 1.936E-03 Np238 3.33E-02 2.934E-08 Cm245 3.88E-01 3.417E-07 Np239 3.63E+01 3.201E-05 Cm246 1.18E-01 1.038E-07 Pu236 2.81E-03 2.472E-09 Bk249 5.51E-10 4.855E-16 Pu238 3.11E+03 2.741E-03 Total 6.32E+04 5.569E-02
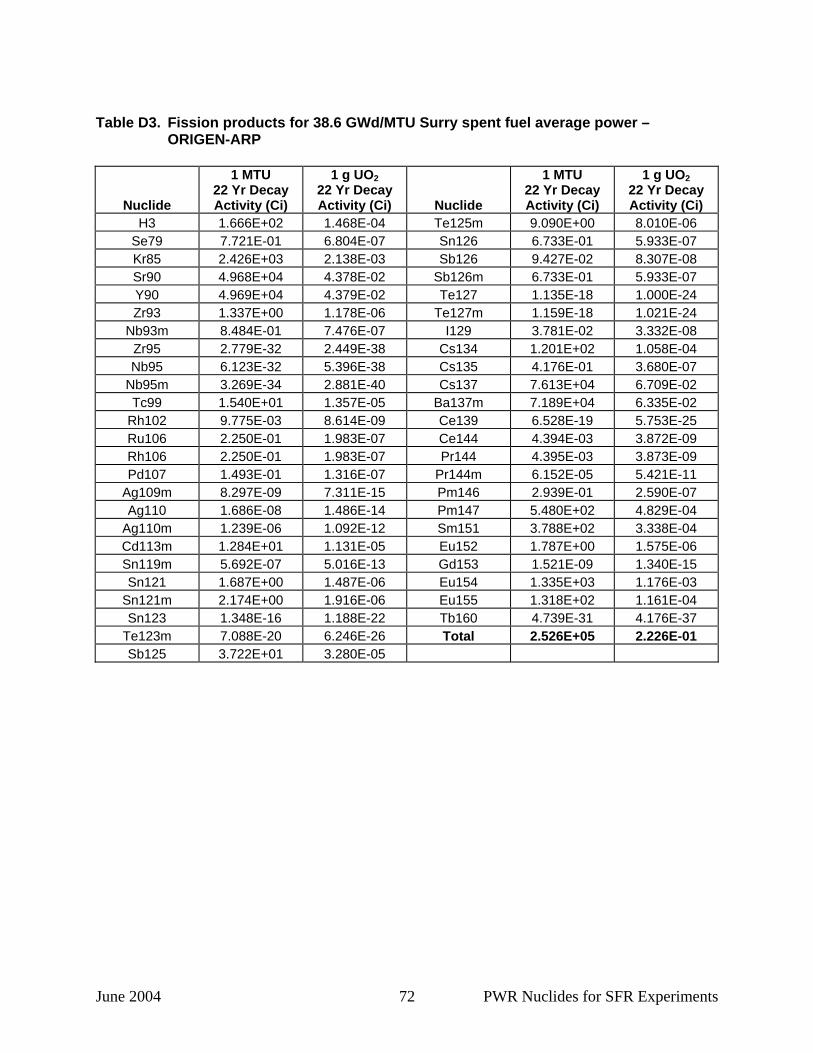
June 2004 72 PWR Nuclides for SFR Experiments
Table D3. Fission products for 38.6 GWd/MTU Surry spent fuel average power –
ORIGEN-ARP
Nuclide
1 MTU 22 Yr Decay Activity (Ci)
1 g UO2 22 Yr Decay Activity (Ci) Nuclide
1 MTU 22 Yr Decay Activity (Ci)
1 g UO2 22 Yr Decay Activity (Ci)
H3 1.666E+02 1.468E-04 Te125m 9.090E+00 8.010E-06 Se79 7.721E-01 6.804E-07 Sn126 6.733E-01 5.933E-07 Kr85 2.426E+03 2.138E-03 Sb126 9.427E-02 8.307E-08 Sr90 4.968E+04 4.378E-02 Sb126m 6.733E-01 5.933E-07 Y90 4.969E+04 4.379E-02 Te127 1.135E-18 1.000E-24 Zr93 1.337E+00 1.178E-06 Te127m 1.159E-18 1.021E-24
Nb93m 8.484E-01 7.476E-07 I129 3.781E-02 3.332E-08 Zr95 2.779E-32 2.449E-38 Cs134 1.201E+02 1.058E-04 Nb95 6.123E-32 5.396E-38 Cs135 4.176E-01 3.680E-07
Nb95m 3.269E-34 2.881E-40 Cs137 7.613E+04 6.709E-02 Tc99 1.540E+01 1.357E-05 Ba137m 7.189E+04 6.335E-02
Rh102 9.775E-03 8.614E-09 Ce139 6.528E-19 5.753E-25 Ru106 2.250E-01 1.983E-07 Ce144 4.394E-03 3.872E-09 Rh106 2.250E-01 1.983E-07 Pr144 4.395E-03 3.873E-09 Pd107 1.493E-01 1.316E-07 Pr144m 6.152E-05 5.421E-11
Ag109m 8.297E-09 7.311E-15 Pm146 2.939E-01 2.590E-07 Ag110 1.686E-08 1.486E-14 Pm147 5.480E+02 4.829E-04
Ag110m 1.239E-06 1.092E-12 Sm151 3.788E+02 3.338E-04 Cd113m 1.284E+01 1.131E-05 Eu152 1.787E+00 1.575E-06 Sn119m 5.692E-07 5.016E-13 Gd153 1.521E-09 1.340E-15 Sn121 1.687E+00 1.487E-06 Eu154 1.335E+03 1.176E-03
Sn121m 2.174E+00 1.916E-06 Eu155 1.318E+02 1.161E-04 Sn123 1.348E-16 1.188E-22 Tb160 4.739E-31 4.176E-37
Te123m 7.088E-20 6.246E-26 Total 2.526E+05 2.226E-01 Sb125 3.722E+01 3.280E-05
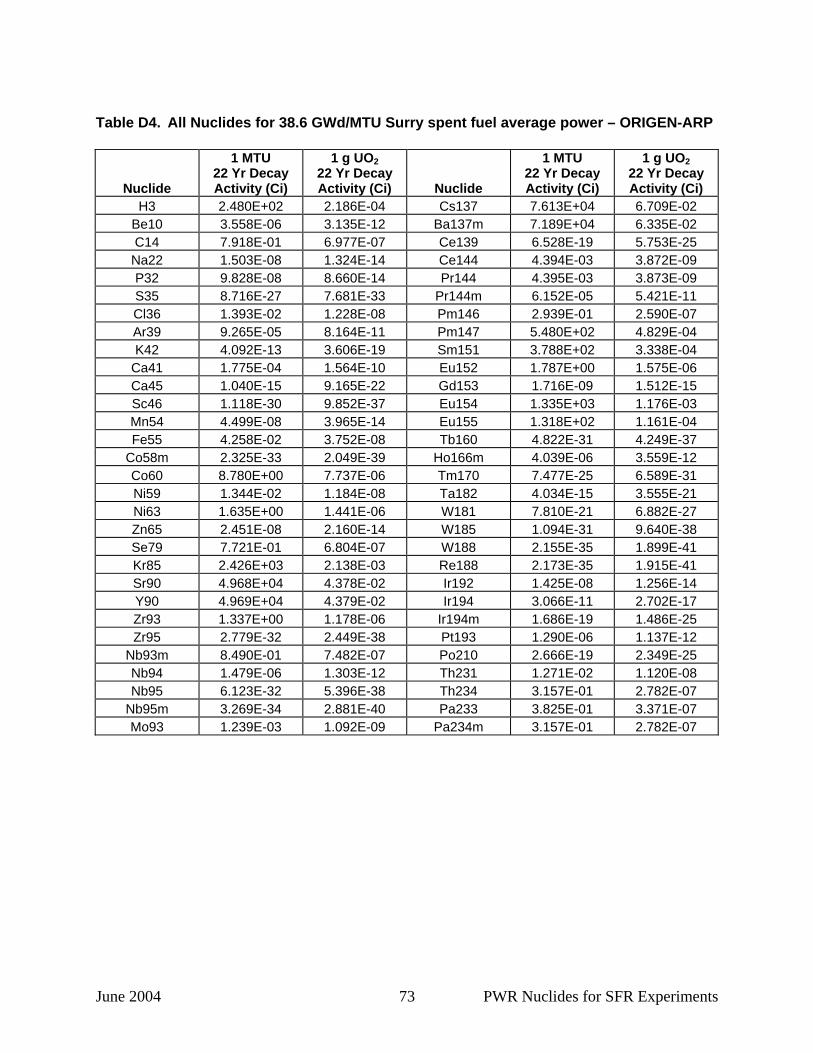
June 2004 73 PWR Nuclides for SFR Experiments
Table D4. All Nuclides for 38.6 GWd/MTU Surry spent fuel average power – ORIGEN-ARP
Nuclide
1 MTU 22 Yr Decay Activity (Ci)
1 g UO2 22 Yr Decay Activity (Ci) Nuclide
1 MTU 22 Yr Decay Activity (Ci)
1 g UO2 22 Yr Decay Activity (Ci)
H3 2.480E+02 2.186E-04 Cs137 7.613E+04 6.709E-02 Be10 3.558E-06 3.135E-12 Ba137m 7.189E+04 6.335E-02 C14 7.918E-01 6.977E-07 Ce139 6.528E-19 5.753E-25 Na22 1.503E-08 1.324E-14 Ce144 4.394E-03 3.872E-09 P32 9.828E-08 8.660E-14 Pr144 4.395E-03 3.873E-09 S35 8.716E-27 7.681E-33 Pr144m 6.152E-05 5.421E-11 Cl36 1.393E-02 1.228E-08 Pm146 2.939E-01 2.590E-07 Ar39 9.265E-05 8.164E-11 Pm147 5.480E+02 4.829E-04 K42 4.092E-13 3.606E-19 Sm151 3.788E+02 3.338E-04
Ca41 1.775E-04 1.564E-10 Eu152 1.787E+00 1.575E-06 Ca45 1.040E-15 9.165E-22 Gd153 1.716E-09 1.512E-15 Sc46 1.118E-30 9.852E-37 Eu154 1.335E+03 1.176E-03 Mn54 4.499E-08 3.965E-14 Eu155 1.318E+02 1.161E-04 Fe55 4.258E-02 3.752E-08 Tb160 4.822E-31 4.249E-37
Co58m 2.325E-33 2.049E-39 Ho166m 4.039E-06 3.559E-12 Co60 8.780E+00 7.737E-06 Tm170 7.477E-25 6.589E-31 Ni59 1.344E-02 1.184E-08 Ta182 4.034E-15 3.555E-21 Ni63 1.635E+00 1.441E-06 W181 7.810E-21 6.882E-27 Zn65 2.451E-08 2.160E-14 W185 1.094E-31 9.640E-38 Se79 7.721E-01 6.804E-07 W188 2.155E-35 1.899E-41 Kr85 2.426E+03 2.138E-03 Re188 2.173E-35 1.915E-41 Sr90 4.968E+04 4.378E-02 Ir192 1.425E-08 1.256E-14 Y90 4.969E+04 4.379E-02 Ir194 3.066E-11 2.702E-17 Zr93 1.337E+00 1.178E-06 Ir194m 1.686E-19 1.486E-25 Zr95 2.779E-32 2.449E-38 Pt193 1.290E-06 1.137E-12
Nb93m 8.490E-01 7.482E-07 Po210 2.666E-19 2.349E-25 Nb94 1.479E-06 1.303E-12 Th231 1.271E-02 1.120E-08 Nb95 6.123E-32 5.396E-38 Th234 3.157E-01 2.782E-07
Nb95m 3.269E-34 2.881E-40 Pa233 3.825E-01 3.371E-07 Mo93 1.239E-03 1.092E-09 Pa234m 3.157E-01 2.782E-07
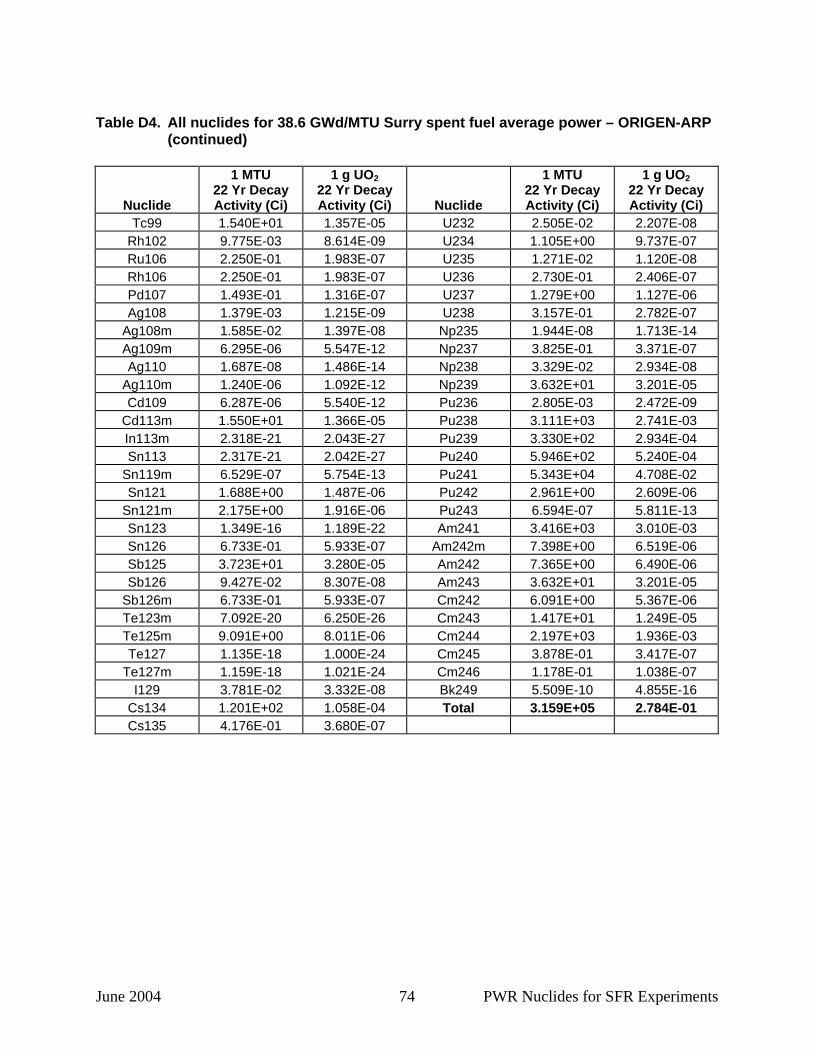
June 2004 74 PWR Nuclides for SFR Experiments
Table D4. All nuclides for 38.6 GWd/MTU Surry spent fuel average power – ORIGEN-ARP
(continued)
Nuclide
1 MTU 22 Yr Decay Activity (Ci)
1 g UO2 22 Yr Decay Activity (Ci) Nuclide
1 MTU 22 Yr Decay Activity (Ci)
1 g UO2 22 Yr Decay Activity (Ci)
Tc99 1.540E+01 1.357E-05 U232 2.505E-02 2.207E-08 Rh102 9.775E-03 8.614E-09 U234 1.105E+00 9.737E-07 Ru106 2.250E-01 1.983E-07 U235 1.271E-02 1.120E-08 Rh106 2.250E-01 1.983E-07 U236 2.730E-01 2.406E-07 Pd107 1.493E-01 1.316E-07 U237 1.279E+00 1.127E-06 Ag108 1.379E-03 1.215E-09 U238 3.157E-01 2.782E-07
Ag108m 1.585E-02 1.397E-08 Np235 1.944E-08 1.713E-14 Ag109m 6.295E-06 5.547E-12 Np237 3.825E-01 3.371E-07 Ag110 1.687E-08 1.486E-14 Np238 3.329E-02 2.934E-08
Ag110m 1.240E-06 1.092E-12 Np239 3.632E+01 3.201E-05 Cd109 6.287E-06 5.540E-12 Pu236 2.805E-03 2.472E-09
Cd113m 1.550E+01 1.366E-05 Pu238 3.111E+03 2.741E-03 In113m 2.318E-21 2.043E-27 Pu239 3.330E+02 2.934E-04 Sn113 2.317E-21 2.042E-27 Pu240 5.946E+02 5.240E-04
Sn119m 6.529E-07 5.754E-13 Pu241 5.343E+04 4.708E-02 Sn121 1.688E+00 1.487E-06 Pu242 2.961E+00 2.609E-06
Sn121m 2.175E+00 1.916E-06 Pu243 6.594E-07 5.811E-13 Sn123 1.349E-16 1.189E-22 Am241 3.416E+03 3.010E-03 Sn126 6.733E-01 5.933E-07 Am242m 7.398E+00 6.519E-06 Sb125 3.723E+01 3.280E-05 Am242 7.365E+00 6.490E-06 Sb126 9.427E-02 8.307E-08 Am243 3.632E+01 3.201E-05
Sb126m 6.733E-01 5.933E-07 Cm242 6.091E+00 5.367E-06 Te123m 7.092E-20 6.250E-26 Cm243 1.417E+01 1.249E-05 Te125m 9.091E+00 8.011E-06 Cm244 2.197E+03 1.936E-03 Te127 1.135E-18 1.000E-24 Cm245 3.878E-01 3.417E-07
Te127m 1.159E-18 1.021E-24 Cm246 1.178E-01 1.038E-07 I129 3.781E-02 3.332E-08 Bk249 5.509E-10 4.855E-16
Cs134 1.201E+02 1.058E-04 Total 3.159E+05 2.784E-01 Cs135 4.176E-01 3.680E-07
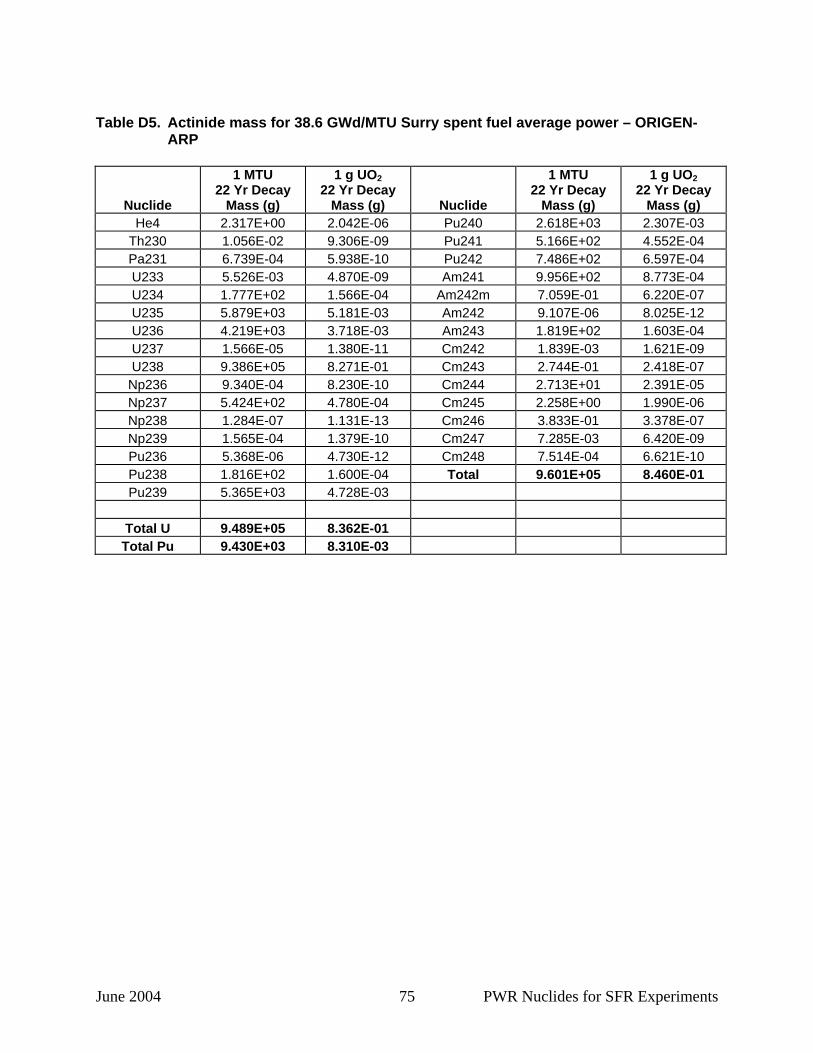
June 2004 75 PWR Nuclides for SFR Experiments
Table D5. Actinide mass for 38.6 GWd/MTU Surry spent fuel average power – ORIGEN-
ARP
Nuclide
1 MTU 22 Yr Decay
Mass (g)
1 g UO2 22 Yr Decay
Mass (g) Nuclide
1 MTU 22 Yr Decay
Mass (g)
1 g UO2 22 Yr Decay
Mass (g) He4 2.317E+00 2.042E-06 Pu240 2.618E+03 2.307E-03
Th230 1.056E-02 9.306E-09 Pu241 5.166E+02 4.552E-04 Pa231 6.739E-04 5.938E-10 Pu242 7.486E+02 6.597E-04 U233 5.526E-03 4.870E-09 Am241 9.956E+02 8.773E-04 U234 1.777E+02 1.566E-04 Am242m 7.059E-01 6.220E-07 U235 5.879E+03 5.181E-03 Am242 9.107E-06 8.025E-12 U236 4.219E+03 3.718E-03 Am243 1.819E+02 1.603E-04 U237 1.566E-05 1.380E-11 Cm242 1.839E-03 1.621E-09 U238 9.386E+05 8.271E-01 Cm243 2.744E-01 2.418E-07
Np236 9.340E-04 8.230E-10 Cm244 2.713E+01 2.391E-05 Np237 5.424E+02 4.780E-04 Cm245 2.258E+00 1.990E-06 Np238 1.284E-07 1.131E-13 Cm246 3.833E-01 3.378E-07 Np239 1.565E-04 1.379E-10 Cm247 7.285E-03 6.420E-09 Pu236 5.368E-06 4.730E-12 Cm248 7.514E-04 6.621E-10 Pu238 1.816E+02 1.600E-04 Total 9.601E+05 8.460E-01 Pu239 5.365E+03 4.728E-03
Total U 9.489E+05 8.362E-01 Total Pu 9.430E+03 8.310E-03
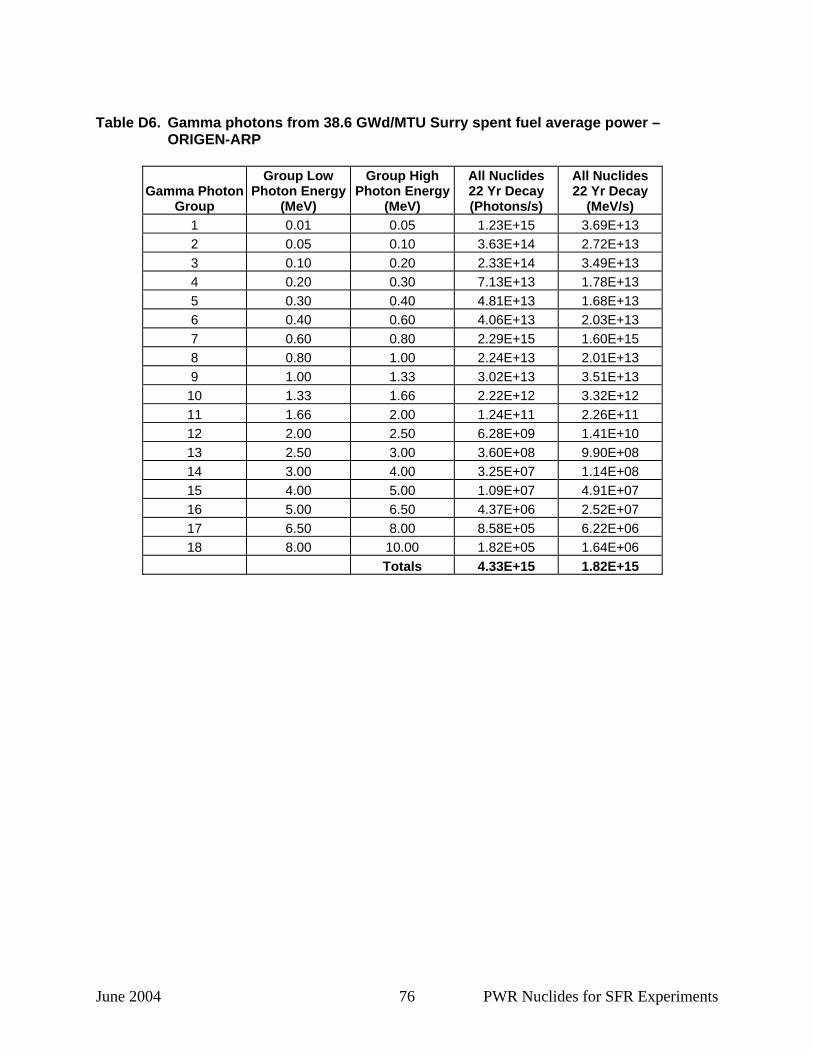
June 2004 76 PWR Nuclides for SFR Experiments
Table D6. Gamma photons from 38.6 GWd/MTU Surry spent fuel average power –
ORIGEN-ARP
Gamma Photon Group
Group Low Photon Energy
(MeV)
Group High Photon Energy
(MeV)
All Nuclides 22 Yr Decay (Photons/s)
All Nuclides 22 Yr Decay
(MeV/s) 1 0.01 0.05 1.23E+15 3.69E+13 2 0.05 0.10 3.63E+14 2.72E+13 3 0.10 0.20 2.33E+14 3.49E+13 4 0.20 0.30 7.13E+13 1.78E+13 5 0.30 0.40 4.81E+13 1.68E+13 6 0.40 0.60 4.06E+13 2.03E+13 7 0.60 0.80 2.29E+15 1.60E+15 8 0.80 1.00 2.24E+13 2.01E+13 9 1.00 1.33 3.02E+13 3.51E+13
10 1.33 1.66 2.22E+12 3.32E+12 11 1.66 2.00 1.24E+11 2.26E+11 12 2.00 2.50 6.28E+09 1.41E+10 13 2.50 3.00 3.60E+08 9.90E+08 14 3.00 4.00 3.25E+07 1.14E+08 15 4.00 5.00 1.09E+07 4.91E+07 16 5.00 6.50 4.37E+06 2.52E+07 17 6.50 8.00 8.58E+05 6.22E+06 18 8.00 10.00 1.82E+05 1.64E+06
Totals 4.33E+15 1.82E+15
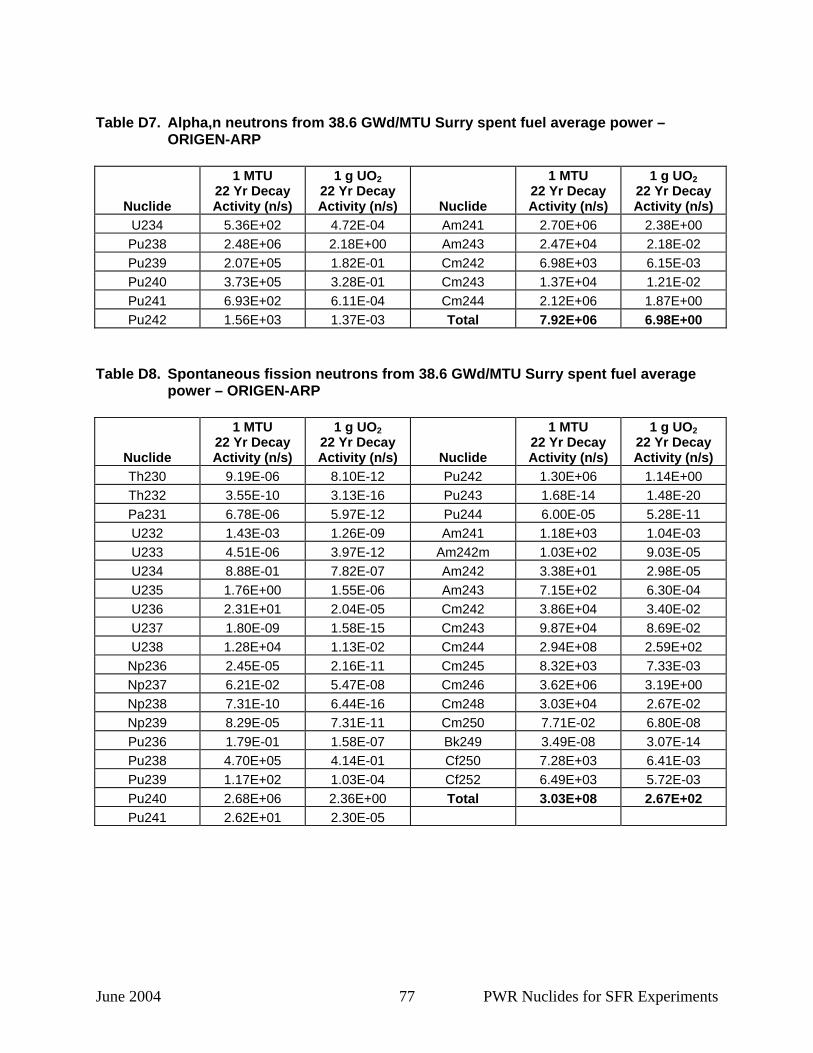
June 2004 77 PWR Nuclides for SFR Experiments
Table D7. Alpha,n neutrons from 38.6 GWd/MTU Surry spent fuel average power –
ORIGEN-ARP
Nuclide
1 MTU 22 Yr Decay Activity (n/s)
1 g UO2 22 Yr Decay Activity (n/s) Nuclide
1 MTU 22 Yr Decay Activity (n/s)
1 g UO2 22 Yr Decay Activity (n/s)
U234 5.36E+02 4.72E-04 Am241 2.70E+06 2.38E+00 Pu238 2.48E+06 2.18E+00 Am243 2.47E+04 2.18E-02 Pu239 2.07E+05 1.82E-01 Cm242 6.98E+03 6.15E-03 Pu240 3.73E+05 3.28E-01 Cm243 1.37E+04 1.21E-02 Pu241 6.93E+02 6.11E-04 Cm244 2.12E+06 1.87E+00 Pu242 1.56E+03 1.37E-03 Total 7.92E+06 6.98E+00
Table D8. Spontaneous fission neutrons from 38.6 GWd/MTU Surry spent fuel average
power – ORIGEN-ARP
Nuclide
1 MTU 22 Yr Decay Activity (n/s)
1 g UO2 22 Yr Decay Activity (n/s) Nuclide
1 MTU 22 Yr Decay Activity (n/s)
1 g UO2 22 Yr Decay Activity (n/s)
Th230 9.19E-06 8.10E-12 Pu242 1.30E+06 1.14E+00 Th232 3.55E-10 3.13E-16 Pu243 1.68E-14 1.48E-20 Pa231 6.78E-06 5.97E-12 Pu244 6.00E-05 5.28E-11 U232 1.43E-03 1.26E-09 Am241 1.18E+03 1.04E-03 U233 4.51E-06 3.97E-12 Am242m 1.03E+02 9.03E-05 U234 8.88E-01 7.82E-07 Am242 3.38E+01 2.98E-05 U235 1.76E+00 1.55E-06 Am243 7.15E+02 6.30E-04 U236 2.31E+01 2.04E-05 Cm242 3.86E+04 3.40E-02 U237 1.80E-09 1.58E-15 Cm243 9.87E+04 8.69E-02 U238 1.28E+04 1.13E-02 Cm244 2.94E+08 2.59E+02
Np236 2.45E-05 2.16E-11 Cm245 8.32E+03 7.33E-03 Np237 6.21E-02 5.47E-08 Cm246 3.62E+06 3.19E+00 Np238 7.31E-10 6.44E-16 Cm248 3.03E+04 2.67E-02 Np239 8.29E-05 7.31E-11 Cm250 7.71E-02 6.80E-08 Pu236 1.79E-01 1.58E-07 Bk249 3.49E-08 3.07E-14 Pu238 4.70E+05 4.14E-01 Cf250 7.28E+03 6.41E-03 Pu239 1.17E+02 1.03E-04 Cf252 6.49E+03 5.72E-03 Pu240 2.68E+06 2.36E+00 Total 3.03E+08 2.67E+02 Pu241 2.62E+01 2.30E-05
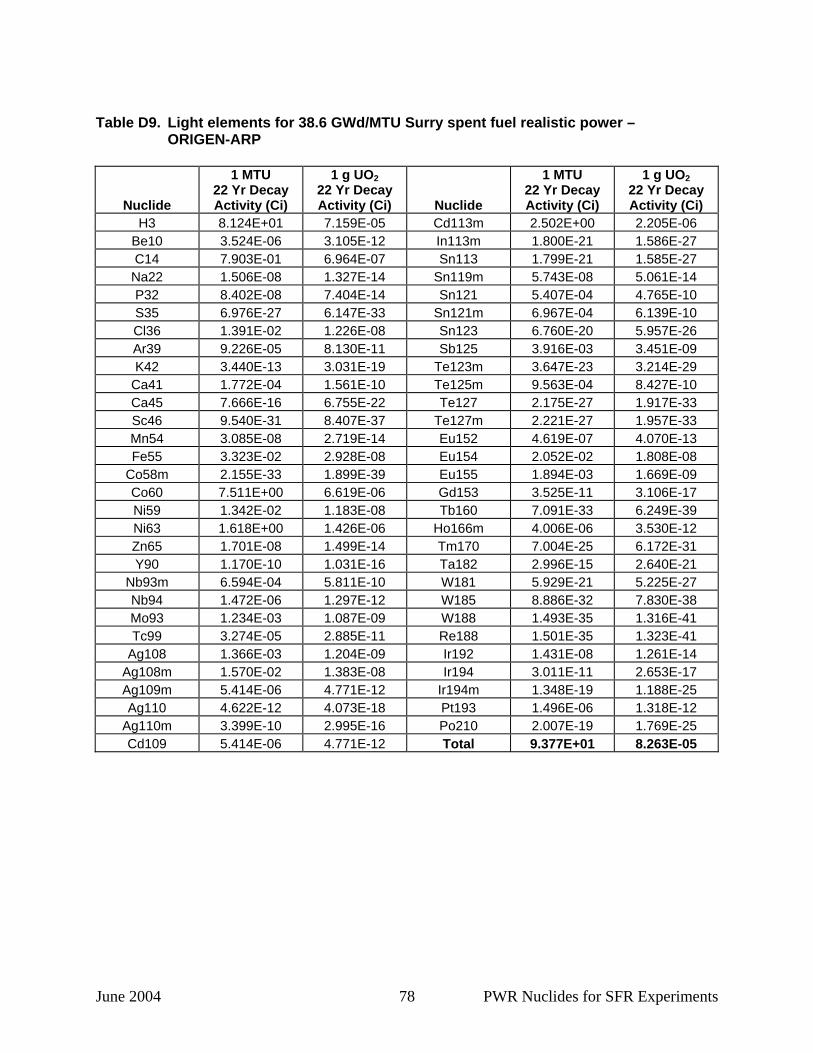
June 2004 78 PWR Nuclides for SFR Experiments
Table D9. Light elements for 38.6 GWd/MTU Surry spent fuel realistic power –
ORIGEN-ARP
Nuclide
1 MTU 22 Yr Decay Activity (Ci)
1 g UO2 22 Yr Decay Activity (Ci) Nuclide
1 MTU 22 Yr Decay Activity (Ci)
1 g UO2 22 Yr Decay Activity (Ci)
H3 8.124E+01 7.159E-05 Cd113m 2.502E+00 2.205E-06 Be10 3.524E-06 3.105E-12 In113m 1.800E-21 1.586E-27 C14 7.903E-01 6.964E-07 Sn113 1.799E-21 1.585E-27 Na22 1.506E-08 1.327E-14 Sn119m 5.743E-08 5.061E-14 P32 8.402E-08 7.404E-14 Sn121 5.407E-04 4.765E-10 S35 6.976E-27 6.147E-33 Sn121m 6.967E-04 6.139E-10 Cl36 1.391E-02 1.226E-08 Sn123 6.760E-20 5.957E-26 Ar39 9.226E-05 8.130E-11 Sb125 3.916E-03 3.451E-09 K42 3.440E-13 3.031E-19 Te123m 3.647E-23 3.214E-29
Ca41 1.772E-04 1.561E-10 Te125m 9.563E-04 8.427E-10 Ca45 7.666E-16 6.755E-22 Te127 2.175E-27 1.917E-33 Sc46 9.540E-31 8.407E-37 Te127m 2.221E-27 1.957E-33 Mn54 3.085E-08 2.719E-14 Eu152 4.619E-07 4.070E-13 Fe55 3.323E-02 2.928E-08 Eu154 2.052E-02 1.808E-08
Co58m 2.155E-33 1.899E-39 Eu155 1.894E-03 1.669E-09 Co60 7.511E+00 6.619E-06 Gd153 3.525E-11 3.106E-17 Ni59 1.342E-02 1.183E-08 Tb160 7.091E-33 6.249E-39 Ni63 1.618E+00 1.426E-06 Ho166m 4.006E-06 3.530E-12 Zn65 1.701E-08 1.499E-14 Tm170 7.004E-25 6.172E-31 Y90 1.170E-10 1.031E-16 Ta182 2.996E-15 2.640E-21
Nb93m 6.594E-04 5.811E-10 W181 5.929E-21 5.225E-27 Nb94 1.472E-06 1.297E-12 W185 8.886E-32 7.830E-38 Mo93 1.234E-03 1.087E-09 W188 1.493E-35 1.316E-41 Tc99 3.274E-05 2.885E-11 Re188 1.501E-35 1.323E-41
Ag108 1.366E-03 1.204E-09 Ir192 1.431E-08 1.261E-14 Ag108m 1.570E-02 1.383E-08 Ir194 3.011E-11 2.653E-17 Ag109m 5.414E-06 4.771E-12 Ir194m 1.348E-19 1.188E-25 Ag110 4.622E-12 4.073E-18 Pt193 1.496E-06 1.318E-12
Ag110m 3.399E-10 2.995E-16 Po210 2.007E-19 1.769E-25 Cd109 5.414E-06 4.771E-12 Total 9.377E+01 8.263E-05

June 2004 79 PWR Nuclides for SFR Experiments
Table D10. Actinides for 38.6 GWd/MTU Surry spent fuel realistic power – ORIGEN-ARP
Nuclide
1 MTU 22 Yr Decay Activity (Ci)
1 g UO2 22 Yr Decay Activity (Ci) Nuclide
1 MTU 22 Yr Decay Activity (Ci)
1 g UO2 22 Yr Decay Activity (Ci)
Pb212 2.879E-02 2.537E-08 Np239 3.523E+01 3.104E-05 Bi212 2.879E-02 2.537E-08 Pu236 2.553E-03 2.250E-09 Po216 2.879E-02 2.537E-08 Pu238 3.621E+03 3.191E-03 Rn220 2.879E-02 2.537E-08 Pu239 3.332E+02 2.936E-04 Ra224 2.879E-02 2.537E-08 Pu240 6.010E+02 5.296E-04 Th228 2.879E-02 2.537E-08 Pu241 5.239E+04 4.617E-02 Th231 1.274E-02 1.123E-08 Pu242 2.925E+00 2.578E-06 Th234 3.157E-01 2.782E-07 Pu243 6.196E-07 5.460E-13 Pa233 3.809E-01 3.357E-07 Am241 3.437E+03 3.029E-03
Pa234m 3.157E-01 2.782E-07 Am242m 1.298E+01 1.144E-05 U232 2.820E-02 2.485E-08 Am242 1.292E+01 1.139E-05 U234 1.147E+00 1.011E-06 Am243 3.523E+01 3.104E-05 U235 1.274E-02 1.123E-08 Cm242 1.068E+01 9.411E-06 U236 2.728E-01 2.404E-07 Cm243 2.812E+01 2.478E-05 U237 1.254E+00 1.105E-06 Cm244 2.105E+03 1.855E-03 U238 3.157E-01 2.782E-07 Cm245 3.687E-01 3.249E-07 Np235 1.626E-08 1.433E-14 Cm246 1.115E-01 9.825E-08 Np237 3.809E-01 3.357E-07 Bk249 5.031E-10 4.433E-16 Np238 5.840E-02 5.146E-08 Total 6.263E+04 5.519E-02
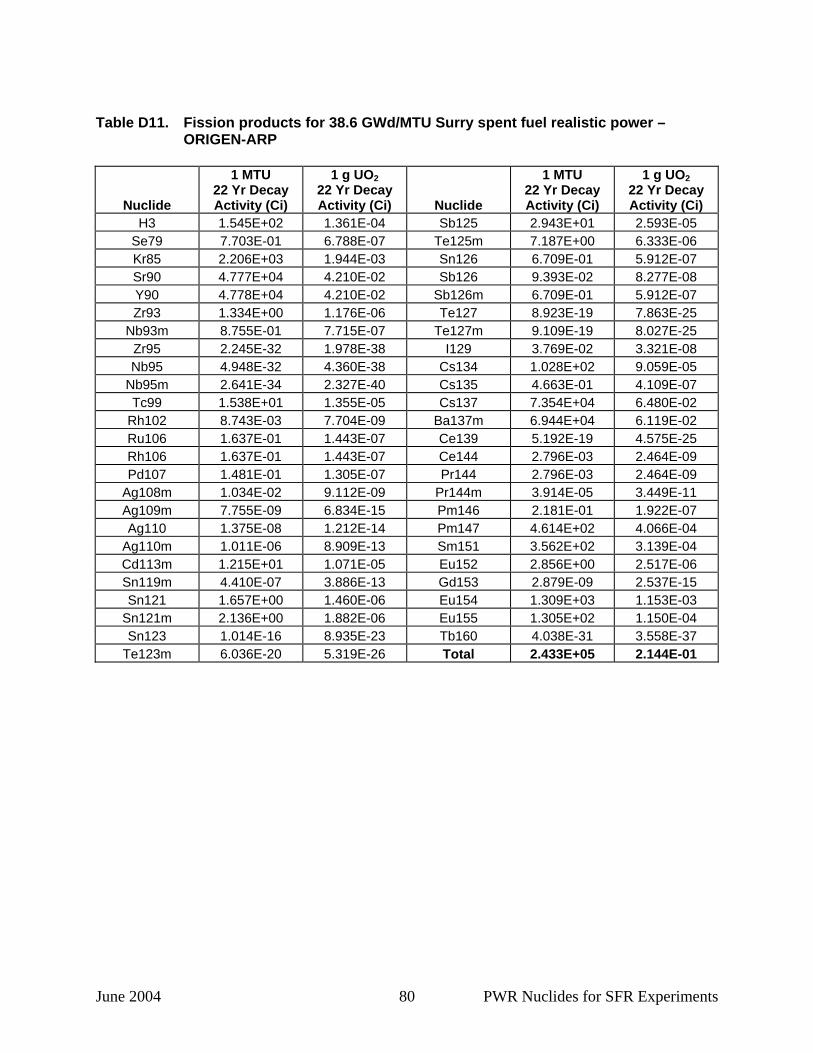
June 2004 80 PWR Nuclides for SFR Experiments
Table D11. Fission products for 38.6 GWd/MTU Surry spent fuel realistic power –
ORIGEN-ARP
Nuclide
1 MTU 22 Yr Decay Activity (Ci)
1 g UO2 22 Yr Decay Activity (Ci) Nuclide
1 MTU 22 Yr Decay Activity (Ci)
1 g UO2 22 Yr Decay Activity (Ci)
H3 1.545E+02 1.361E-04 Sb125 2.943E+01 2.593E-05 Se79 7.703E-01 6.788E-07 Te125m 7.187E+00 6.333E-06 Kr85 2.206E+03 1.944E-03 Sn126 6.709E-01 5.912E-07 Sr90 4.777E+04 4.210E-02 Sb126 9.393E-02 8.277E-08 Y90 4.778E+04 4.210E-02 Sb126m 6.709E-01 5.912E-07 Zr93 1.334E+00 1.176E-06 Te127 8.923E-19 7.863E-25
Nb93m 8.755E-01 7.715E-07 Te127m 9.109E-19 8.027E-25 Zr95 2.245E-32 1.978E-38 I129 3.769E-02 3.321E-08 Nb95 4.948E-32 4.360E-38 Cs134 1.028E+02 9.059E-05
Nb95m 2.641E-34 2.327E-40 Cs135 4.663E-01 4.109E-07 Tc99 1.538E+01 1.355E-05 Cs137 7.354E+04 6.480E-02
Rh102 8.743E-03 7.704E-09 Ba137m 6.944E+04 6.119E-02 Ru106 1.637E-01 1.443E-07 Ce139 5.192E-19 4.575E-25 Rh106 1.637E-01 1.443E-07 Ce144 2.796E-03 2.464E-09 Pd107 1.481E-01 1.305E-07 Pr144 2.796E-03 2.464E-09
Ag108m 1.034E-02 9.112E-09 Pr144m 3.914E-05 3.449E-11 Ag109m 7.755E-09 6.834E-15 Pm146 2.181E-01 1.922E-07 Ag110 1.375E-08 1.212E-14 Pm147 4.614E+02 4.066E-04
Ag110m 1.011E-06 8.909E-13 Sm151 3.562E+02 3.139E-04 Cd113m 1.215E+01 1.071E-05 Eu152 2.856E+00 2.517E-06 Sn119m 4.410E-07 3.886E-13 Gd153 2.879E-09 2.537E-15 Sn121 1.657E+00 1.460E-06 Eu154 1.309E+03 1.153E-03
Sn121m 2.136E+00 1.882E-06 Eu155 1.305E+02 1.150E-04 Sn123 1.014E-16 8.935E-23 Tb160 4.038E-31 3.558E-37
Te123m 6.036E-20 5.319E-26 Total 2.433E+05 2.144E-01
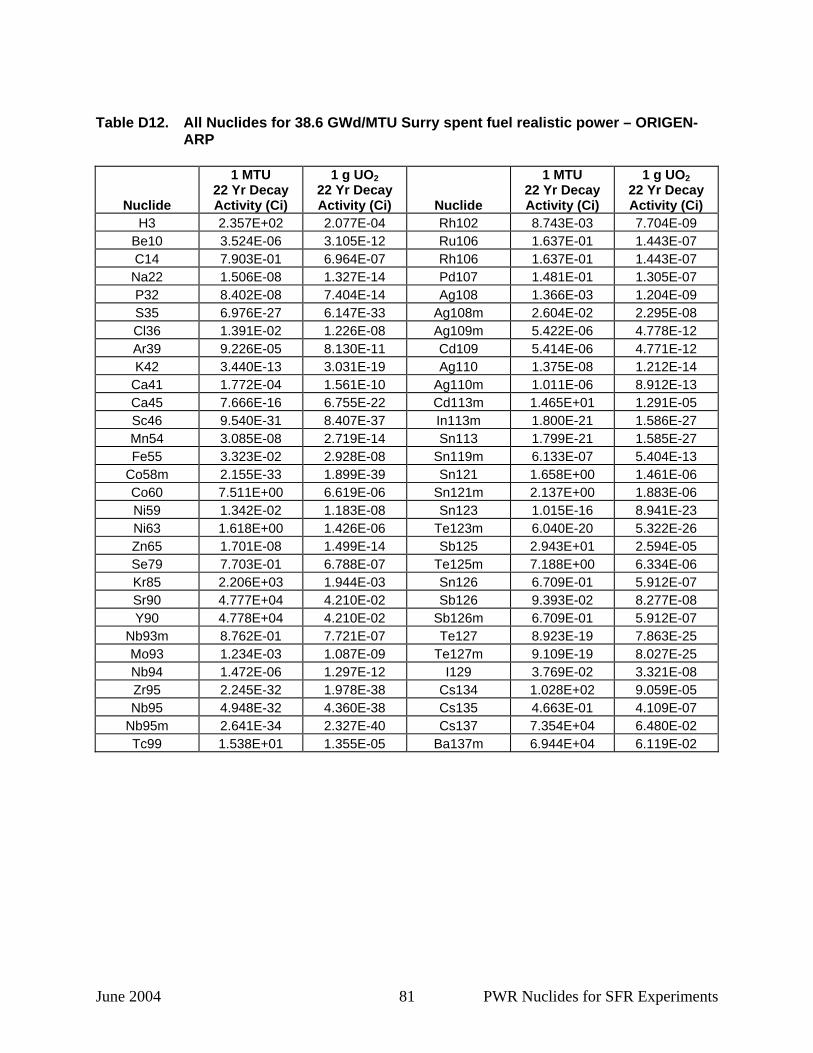
June 2004 81 PWR Nuclides for SFR Experiments
Table D12. All Nuclides for 38.6 GWd/MTU Surry spent fuel realistic power – ORIGEN-
ARP
Nuclide
1 MTU 22 Yr Decay Activity (Ci)
1 g UO2 22 Yr Decay Activity (Ci) Nuclide
1 MTU 22 Yr Decay Activity (Ci)
1 g UO2 22 Yr Decay Activity (Ci)
H3 2.357E+02 2.077E-04 Rh102 8.743E-03 7.704E-09 Be10 3.524E-06 3.105E-12 Ru106 1.637E-01 1.443E-07 C14 7.903E-01 6.964E-07 Rh106 1.637E-01 1.443E-07 Na22 1.506E-08 1.327E-14 Pd107 1.481E-01 1.305E-07 P32 8.402E-08 7.404E-14 Ag108 1.366E-03 1.204E-09 S35 6.976E-27 6.147E-33 Ag108m 2.604E-02 2.295E-08 Cl36 1.391E-02 1.226E-08 Ag109m 5.422E-06 4.778E-12 Ar39 9.226E-05 8.130E-11 Cd109 5.414E-06 4.771E-12 K42 3.440E-13 3.031E-19 Ag110 1.375E-08 1.212E-14
Ca41 1.772E-04 1.561E-10 Ag110m 1.011E-06 8.912E-13 Ca45 7.666E-16 6.755E-22 Cd113m 1.465E+01 1.291E-05 Sc46 9.540E-31 8.407E-37 In113m 1.800E-21 1.586E-27 Mn54 3.085E-08 2.719E-14 Sn113 1.799E-21 1.585E-27 Fe55 3.323E-02 2.928E-08 Sn119m 6.133E-07 5.404E-13
Co58m 2.155E-33 1.899E-39 Sn121 1.658E+00 1.461E-06 Co60 7.511E+00 6.619E-06 Sn121m 2.137E+00 1.883E-06 Ni59 1.342E-02 1.183E-08 Sn123 1.015E-16 8.941E-23 Ni63 1.618E+00 1.426E-06 Te123m 6.040E-20 5.322E-26 Zn65 1.701E-08 1.499E-14 Sb125 2.943E+01 2.594E-05 Se79 7.703E-01 6.788E-07 Te125m 7.188E+00 6.334E-06 Kr85 2.206E+03 1.944E-03 Sn126 6.709E-01 5.912E-07 Sr90 4.777E+04 4.210E-02 Sb126 9.393E-02 8.277E-08 Y90 4.778E+04 4.210E-02 Sb126m 6.709E-01 5.912E-07
Nb93m 8.762E-01 7.721E-07 Te127 8.923E-19 7.863E-25 Mo93 1.234E-03 1.087E-09 Te127m 9.109E-19 8.027E-25 Nb94 1.472E-06 1.297E-12 I129 3.769E-02 3.321E-08 Zr95 2.245E-32 1.978E-38 Cs134 1.028E+02 9.059E-05 Nb95 4.948E-32 4.360E-38 Cs135 4.663E-01 4.109E-07
Nb95m 2.641E-34 2.327E-40 Cs137 7.354E+04 6.480E-02 Tc99 1.538E+01 1.355E-05 Ba137m 6.944E+04 6.119E-02
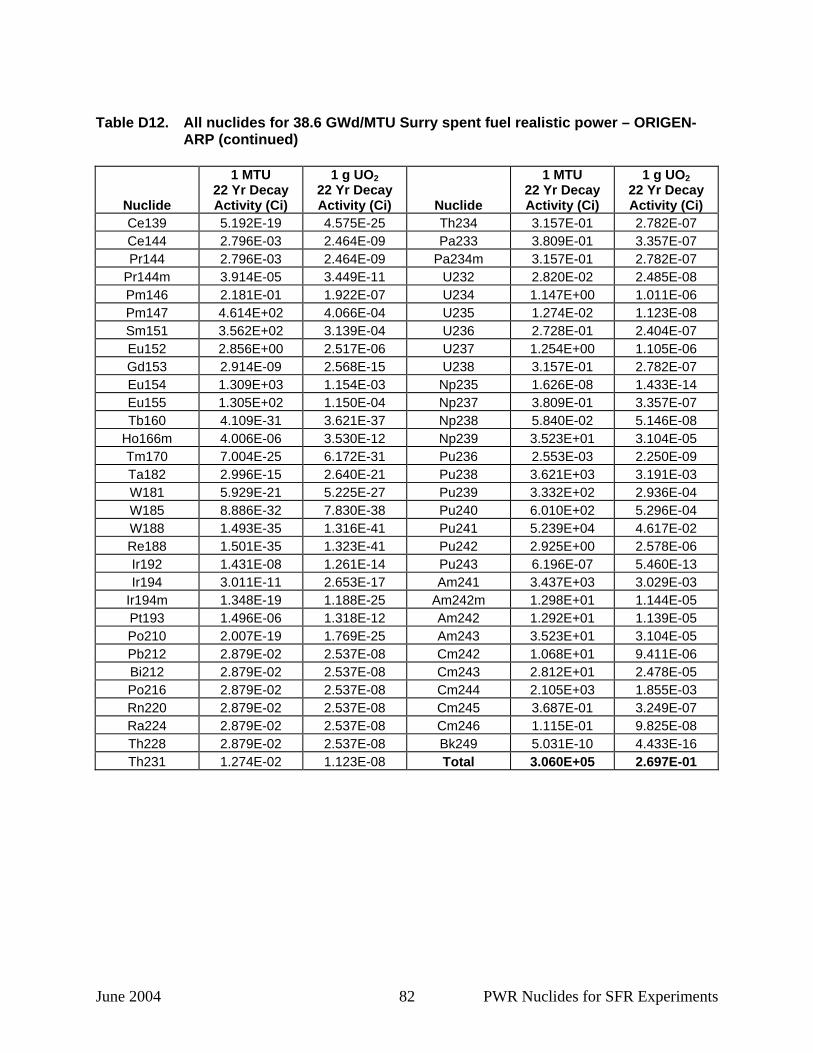
June 2004 82 PWR Nuclides for SFR Experiments
Table D12. All nuclides for 38.6 GWd/MTU Surry spent fuel realistic power – ORIGEN-
ARP (continued)
Nuclide
1 MTU 22 Yr Decay Activity (Ci)
1 g UO2 22 Yr Decay Activity (Ci) Nuclide
1 MTU 22 Yr Decay Activity (Ci)
1 g UO2 22 Yr Decay Activity (Ci)
Ce139 5.192E-19 4.575E-25 Th234 3.157E-01 2.782E-07 Ce144 2.796E-03 2.464E-09 Pa233 3.809E-01 3.357E-07 Pr144 2.796E-03 2.464E-09 Pa234m 3.157E-01 2.782E-07
Pr144m 3.914E-05 3.449E-11 U232 2.820E-02 2.485E-08 Pm146 2.181E-01 1.922E-07 U234 1.147E+00 1.011E-06 Pm147 4.614E+02 4.066E-04 U235 1.274E-02 1.123E-08 Sm151 3.562E+02 3.139E-04 U236 2.728E-01 2.404E-07 Eu152 2.856E+00 2.517E-06 U237 1.254E+00 1.105E-06 Gd153 2.914E-09 2.568E-15 U238 3.157E-01 2.782E-07 Eu154 1.309E+03 1.154E-03 Np235 1.626E-08 1.433E-14 Eu155 1.305E+02 1.150E-04 Np237 3.809E-01 3.357E-07 Tb160 4.109E-31 3.621E-37 Np238 5.840E-02 5.146E-08
Ho166m 4.006E-06 3.530E-12 Np239 3.523E+01 3.104E-05 Tm170 7.004E-25 6.172E-31 Pu236 2.553E-03 2.250E-09 Ta182 2.996E-15 2.640E-21 Pu238 3.621E+03 3.191E-03 W181 5.929E-21 5.225E-27 Pu239 3.332E+02 2.936E-04 W185 8.886E-32 7.830E-38 Pu240 6.010E+02 5.296E-04 W188 1.493E-35 1.316E-41 Pu241 5.239E+04 4.617E-02 Re188 1.501E-35 1.323E-41 Pu242 2.925E+00 2.578E-06 Ir192 1.431E-08 1.261E-14 Pu243 6.196E-07 5.460E-13 Ir194 3.011E-11 2.653E-17 Am241 3.437E+03 3.029E-03
Ir194m 1.348E-19 1.188E-25 Am242m 1.298E+01 1.144E-05 Pt193 1.496E-06 1.318E-12 Am242 1.292E+01 1.139E-05 Po210 2.007E-19 1.769E-25 Am243 3.523E+01 3.104E-05 Pb212 2.879E-02 2.537E-08 Cm242 1.068E+01 9.411E-06 Bi212 2.879E-02 2.537E-08 Cm243 2.812E+01 2.478E-05 Po216 2.879E-02 2.537E-08 Cm244 2.105E+03 1.855E-03 Rn220 2.879E-02 2.537E-08 Cm245 3.687E-01 3.249E-07 Ra224 2.879E-02 2.537E-08 Cm246 1.115E-01 9.825E-08 Th228 2.879E-02 2.537E-08 Bk249 5.031E-10 4.433E-16 Th231 1.274E-02 1.123E-08 Total 3.060E+05 2.697E-01

June 2004 83 PWR Nuclides for SFR Experiments
Table D13. Actinide mass for 38.6 GWd/MTU Surry spent fuel realistic power – ORIGEN-
ARP
Nuclide
1 MTU 22 Yr Decay
Mass (g)
1 g UO2 22 Yr Decay
Mass (g) Nuclide
1 MTU 22 Yr Decay
Mass (g)
1 g UO2 22 Yr Decay
Mass (g) He4 3.171E+00 2.794E-06 Pu239 5.367E+03 4.729E-03
Th230 1.156E-02 1.019E-08 Pu240 2.647E+03 2.333E-03 Pa231 1.286E-03 1.133E-09 Pu241 5.066E+02 4.464E-04 U232 1.277E-03 1.125E-09 Pu242 7.394E+02 6.516E-04 U233 5.642E-03 4.972E-09 Am241 1.002E+03 8.830E-04 U234 1.844E+02 1.625E-04 Am242m 1.238E+00 1.091E-06 U235 5.892E+03 5.192E-03 Am242 1.598E-05 1.408E-11 U236 4.216E+03 3.715E-03 Am243 1.764E+02 1.554E-04 U237 1.535E-05 1.353E-11 Cm242 3.226E-03 2.843E-09 U238 9.387E+05 8.272E-01 Cm243 5.444E-01 4.797E-07
Np236 9.364E-04 8.252E-10 Cm244 2.600E+01 2.291E-05 Np237 5.401E+02 4.759E-04 Cm245 2.146E+00 1.891E-06 Np238 2.253E-07 1.985E-13 Cm246 3.629E-01 3.198E-07 Np239 1.518E-04 1.338E-10 Cm247 6.846E-03 6.033E-09 Pu236 4.886E-06 4.306E-12 Cm248 7.049E-04 6.212E-10 Pu238 2.113E+02 1.862E-04 Total 9.602E+05 8.461E-01
Total U 9.490E+05 8.363E-01 Total Pu 9.471E+03 8.346E-03
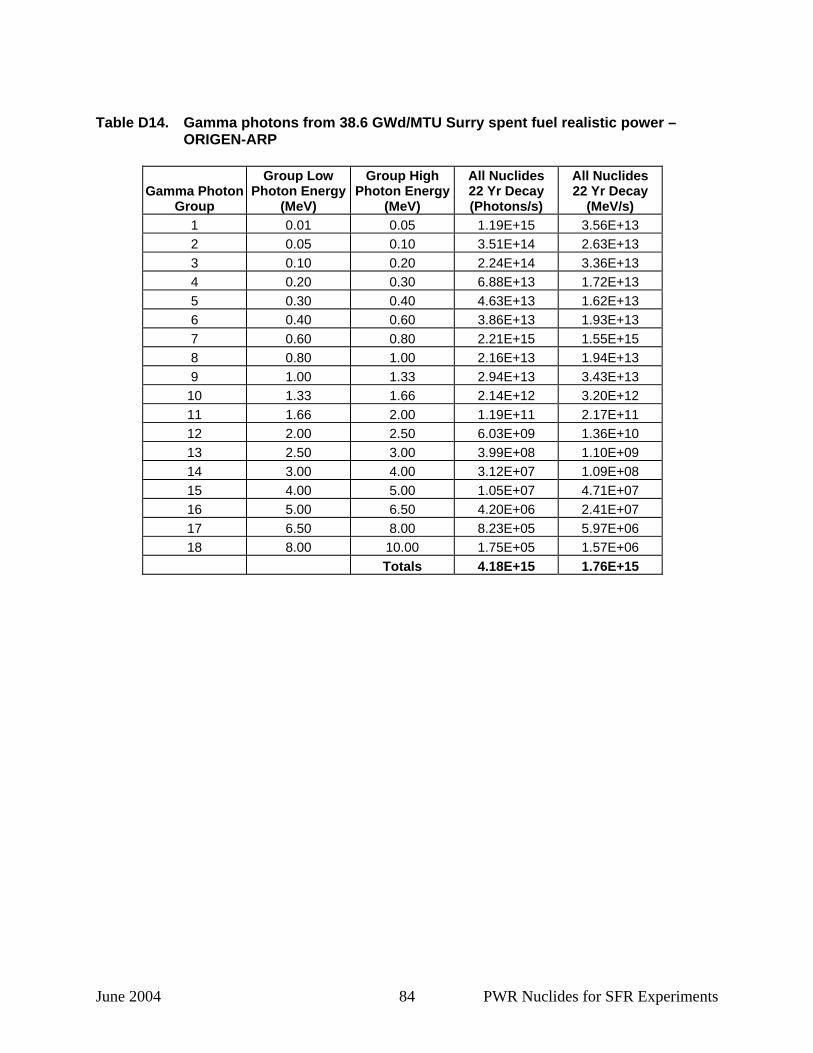
June 2004 84 PWR Nuclides for SFR Experiments
Table D14. Gamma photons from 38.6 GWd/MTU Surry spent fuel realistic power –
ORIGEN-ARP
Gamma Photon Group
Group Low Photon Energy
(MeV)
Group High Photon Energy
(MeV)
All Nuclides 22 Yr Decay (Photons/s)
All Nuclides 22 Yr Decay
(MeV/s) 1 0.01 0.05 1.19E+15 3.56E+13 2 0.05 0.10 3.51E+14 2.63E+13 3 0.10 0.20 2.24E+14 3.36E+13 4 0.20 0.30 6.88E+13 1.72E+13 5 0.30 0.40 4.63E+13 1.62E+13 6 0.40 0.60 3.86E+13 1.93E+13 7 0.60 0.80 2.21E+15 1.55E+15 8 0.80 1.00 2.16E+13 1.94E+13 9 1.00 1.33 2.94E+13 3.43E+13
10 1.33 1.66 2.14E+12 3.20E+12 11 1.66 2.00 1.19E+11 2.17E+11 12 2.00 2.50 6.03E+09 1.36E+10 13 2.50 3.00 3.99E+08 1.10E+09 14 3.00 4.00 3.12E+07 1.09E+08 15 4.00 5.00 1.05E+07 4.71E+07 16 5.00 6.50 4.20E+06 2.41E+07 17 6.50 8.00 8.23E+05 5.97E+06 18 8.00 10.00 1.75E+05 1.57E+06
Totals 4.18E+15 1.76E+15

June 2004 85 PWR Nuclides for SFR Experiments
Table D15. Alpha,n neutrons from 38.6 GWd/MTU Surry spent fuel realistic power –
ORIGEN-ARP
Nuclide
1 MTU 22 Yr Decay Activity (n/s)
1 g UO2 22 Yr Decay Activity (n/s) Nuclide
1 MTU 22 Yr Decay Activity (n/s)
1 g UO2 22 Yr Decay Activity (n/s)
Pu238 2.88E+06 2.54E+00 Am243 2.40E+04 2.11E-02 Pu239 2.07E+05 1.83E-01 Cm242 1.23E+04 1.08E-02 Pu240 3.77E+05 3.32E-01 Cm243 2.72E+04 2.40E-02 Pu241 6.80E+02 5.99E-04 Cm244 2.03E+06 1.79E+00 Pu242 1.54E+03 1.36E-03 Total 8.28E+06 7.30E+00 Am241 2.71E+06 2.39E+00
Table D16. Spontaneous fission neutrons from 38.6 GWd/MTU Surry spent fuel realistic
power – ORIGEN-ARP
Nuclide
1 MTU 22 Yr Decay Activity (n/s)
1 g UO2 22 Yr Decay Activity (n/s) Nuclide
1 MTU 22 Yr Decay Activity (n/s)
1 g UO2 22 Yr Decay Activity (n/s)
Th230 1.01E-05 8.86E-12 Pu242 1.28E+06 1.13E+00 Th232 3.82E-10 3.37E-16 Pu243 1.58E-14 1.39E-20 Pa231 1.29E-05 1.14E-11 Pu244 5.65E-05 4.97E-11 U232 1.61E-03 1.41E-09 Am241 1.18E+03 1.04E-03 U233 4.60E-06 4.06E-12 Am242m 1.80E+02 1.58E-04 U234 9.22E-01 8.12E-07 Am242 5.92E+01 5.22E-05 U235 1.76E+00 1.55E-06 Am243 6.94E+02 6.11E-04 U236 2.31E+01 2.04E-05 Cm242 6.77E+04 5.97E-02 U237 1.76E-09 1.55E-15 Cm243 1.96E+05 1.73E-01 U238 1.28E+04 1.13E-02 Cm244 2.82E+08 2.49E+02
Np236 2.45E-05 2.16E-11 Cm245 7.91E+03 6.97E-03 Np237 6.18E-02 5.45E-08 Cm246 3.43E+06 3.02E+00 Np238 1.28E-09 1.13E-15 Cm248 2.84E+04 2.50E-02 Np239 8.04E-05 7.09E-11 Cm250 6.31E-02 5.56E-08 Pu236 1.63E-01 1.44E-07 Bk249 3.18E-08 2.81E-14 Pu238 5.47E+05 4.82E-01 Cf250 6.69E+03 5.90E-03 Pu239 1.17E+02 1.03E-04 Cf252 5.90E+03 5.20E-03 Pu240 2.71E+06 2.39E+00 Total 2.91E+08 2.56E+02 Pu241 2.56E+01 2.26E-05

June 2004 86 PWR Nuclides for SFR Experiments
Appendix E – Airborne Dose Per Gram of Spent Fuel UO2 as
Respirable Size Particles This appendix contains calculations of the airborne radiation dose due to the hypothetical release of one gram of spent fuel UO2 as respirable size particles (diameters ≤ 10 micrometers). The calculation uses the airborne dose calculations of the DWDD from (Naegeli 2003) for one curie of each nuclide to calculate the dose for one gram of the spent fuel UO2 nuclide inventory. The nuclide activities for one gram of spent fuel for the nuclide compositions tabulated in Appendices B and D are used to calculate the corresponding dose for one gram of spent fuel UO2 as respirable size particles. The H. B. Robinson 72 GWd/MTU and the Surry 38.6 GWd/MTU burnup fuels are included in the airborne dose calculation. The Surry 38.6 GWd/MTU burnup fuel dose was calculated for both the average power history and the realistic power history calculated nuclide compositions. The airborne dose calculations are shown in Table E1 below. The fission products category of nuclides had the highest activity but the actinides dominated the calculated airborne dose due to the presence of alpha emitters in the actinide nuclides and their higher relative contribution to inhalation dose. The activation products or light elements had insignificant activities and airborne dose contributions. The DWDD contained airborne doses for 76 of the spent fuel nuclides in the various fuel burnup calculations of nuclide content. The Surry nuclide compositions had fewer nuclides in the DWDD than the H. B. Robinson nuclide composition. 98 nuclides in one or another of the burnup nuclide compositions were not included in the DWDD so they did not contribute to the airborne dose calculations. These nuclides that did not contribute to the dose had only 0.5% to 2.4% of the total activity for each spent fuel so any missing doses were judged to be an insignificant contribution to the total airborne dose for that spent fuel. The spent fuel nuclides that did not contribute to the airborne dose calculations are shown in Table E2 below. The activity and airborne dose for each spent fuel type is summarized in Table E3. Both per gram of UO2 and per SFR experiment sample rod values were included. Tables Table E1. Airborne dose for one gram of spent fuel UO2 as respirable particles Table E2. Nuclides in the spent fuel UO2 not in the DWDD or calculated dose Table E3. Activity and airborne dose for one SFR experiment sample rod of spent fuel UO2 as
respirable particles
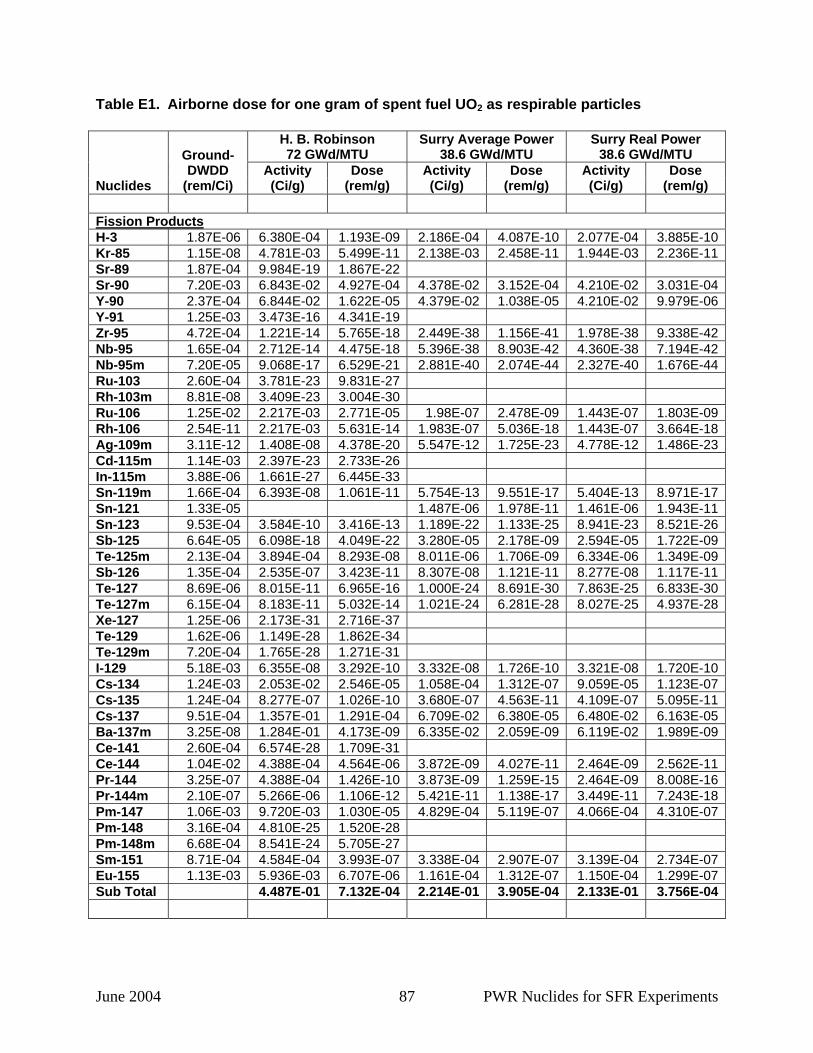
June 2004 87 PWR Nuclides for SFR Experiments
Table E1. Airborne dose for one gram of spent fuel UO2 as respirable particles
H. B. Robinson 72 GWd/MTU
Surry Average Power 38.6 GWd/MTU
Surry Real Power 38.6 GWd/MTU
Nuclides
Ground-DWDD
(rem/Ci) Activity (Ci/g)
Dose (rem/g)
Activity (Ci/g)
Dose (rem/g)
Activity (Ci/g)
Dose (rem/g)
Fission Products H-3 1.87E-06 6.380E-04 1.193E-09 2.186E-04 4.087E-10 2.077E-04 3.885E-10Kr-85 1.15E-08 4.781E-03 5.499E-11 2.138E-03 2.458E-11 1.944E-03 2.236E-11Sr-89 1.87E-04 9.984E-19 1.867E-22 Sr-90 7.20E-03 6.843E-02 4.927E-04 4.378E-02 3.152E-04 4.210E-02 3.031E-04Y-90 2.37E-04 6.844E-02 1.622E-05 4.379E-02 1.038E-05 4.210E-02 9.979E-06Y-91 1.25E-03 3.473E-16 4.341E-19 Zr-95 4.72E-04 1.221E-14 5.765E-18 2.449E-38 1.156E-41 1.978E-38 9.338E-42Nb-95 1.65E-04 2.712E-14 4.475E-18 5.396E-38 8.903E-42 4.360E-38 7.194E-42Nb-95m 7.20E-05 9.068E-17 6.529E-21 2.881E-40 2.074E-44 2.327E-40 1.676E-44Ru-103 2.60E-04 3.781E-23 9.831E-27 Rh-103m 8.81E-08 3.409E-23 3.004E-30 Ru-106 1.25E-02 2.217E-03 2.771E-05 1.98E-07 2.478E-09 1.443E-07 1.803E-09Rh-106 2.54E-11 2.217E-03 5.631E-14 1.983E-07 5.036E-18 1.443E-07 3.664E-18Ag-109m 3.11E-12 1.408E-08 4.378E-20 5.547E-12 1.725E-23 4.778E-12 1.486E-23Cd-115m 1.14E-03 2.397E-23 2.733E-26 In-115m 3.88E-06 1.661E-27 6.445E-33 Sn-119m 1.66E-04 6.393E-08 1.061E-11 5.754E-13 9.551E-17 5.404E-13 8.971E-17Sn-121 1.33E-05 1.487E-06 1.978E-11 1.461E-06 1.943E-11Sn-123 9.53E-04 3.584E-10 3.416E-13 1.189E-22 1.133E-25 8.941E-23 8.521E-26Sb-125 6.64E-05 6.098E-18 4.049E-22 3.280E-05 2.178E-09 2.594E-05 1.722E-09Te-125m 2.13E-04 3.894E-04 8.293E-08 8.011E-06 1.706E-09 6.334E-06 1.349E-09Sb-126 1.35E-04 2.535E-07 3.423E-11 8.307E-08 1.121E-11 8.277E-08 1.117E-11Te-127 8.69E-06 8.015E-11 6.965E-16 1.000E-24 8.691E-30 7.863E-25 6.833E-30Te-127m 6.15E-04 8.183E-11 5.032E-14 1.021E-24 6.281E-28 8.027E-25 4.937E-28Xe-127 1.25E-06 2.173E-31 2.716E-37 Te-129 1.62E-06 1.149E-28 1.862E-34 Te-129m 7.20E-04 1.765E-28 1.271E-31 I-129 5.18E-03 6.355E-08 3.292E-10 3.332E-08 1.726E-10 3.321E-08 1.720E-10Cs-134 1.24E-03 2.053E-02 2.546E-05 1.058E-04 1.312E-07 9.059E-05 1.123E-07Cs-135 1.24E-04 8.277E-07 1.026E-10 3.680E-07 4.563E-11 4.109E-07 5.095E-11Cs-137 9.51E-04 1.357E-01 1.291E-04 6.709E-02 6.380E-05 6.480E-02 6.163E-05Ba-137m 3.25E-08 1.284E-01 4.173E-09 6.335E-02 2.059E-09 6.119E-02 1.989E-09Ce-141 2.60E-04 6.574E-28 1.709E-31 Ce-144 1.04E-02 4.388E-04 4.564E-06 3.872E-09 4.027E-11 2.464E-09 2.562E-11Pr-144 3.25E-07 4.388E-04 1.426E-10 3.873E-09 1.259E-15 2.464E-09 8.008E-16Pr-144m 2.10E-07 5.266E-06 1.106E-12 5.421E-11 1.138E-17 3.449E-11 7.243E-18Pm-147 1.06E-03 9.720E-03 1.030E-05 4.829E-04 5.119E-07 4.066E-04 4.310E-07Pm-148 3.16E-04 4.810E-25 1.520E-28 Pm-148m 6.68E-04 8.541E-24 5.705E-27 Sm-151 8.71E-04 4.584E-04 3.993E-07 3.338E-04 2.907E-07 3.139E-04 2.734E-07Eu-155 1.13E-03 5.936E-03 6.707E-06 1.161E-04 1.312E-07 1.150E-04 1.299E-07Sub Total 4.487E-01 7.132E-04 2.214E-01 3.905E-04 2.133E-01 3.756E-04
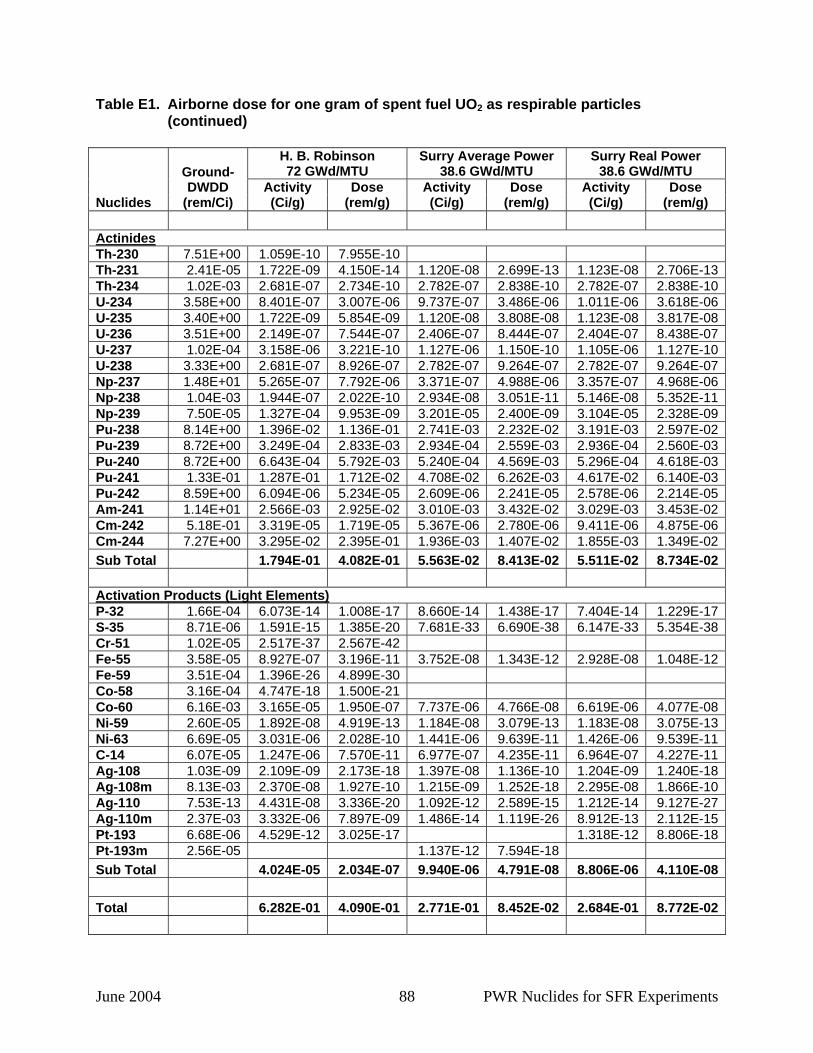
June 2004 88 PWR Nuclides for SFR Experiments
Table E1. Airborne dose for one gram of spent fuel UO2 as respirable particles (continued)
H. B. Robinson 72 GWd/MTU
Surry Average Power 38.6 GWd/MTU
Surry Real Power 38.6 GWd/MTU
Nuclides
Ground-DWDD
(rem/Ci) Activity (Ci/g)
Dose (rem/g)
Activity (Ci/g)
Dose (rem/g)
Activity (Ci/g)
Dose (rem/g)
Actinides Th-230 7.51E+00 1.059E-10 7.955E-10 Th-231 2.41E-05 1.722E-09 4.150E-14 1.120E-08 2.699E-13 1.123E-08 2.706E-13Th-234 1.02E-03 2.681E-07 2.734E-10 2.782E-07 2.838E-10 2.782E-07 2.838E-10U-234 3.58E+00 8.401E-07 3.007E-06 9.737E-07 3.486E-06 1.011E-06 3.618E-06U-235 3.40E+00 1.722E-09 5.854E-09 1.120E-08 3.808E-08 1.123E-08 3.817E-08U-236 3.51E+00 2.149E-07 7.544E-07 2.406E-07 8.444E-07 2.404E-07 8.438E-07U-237 1.02E-04 3.158E-06 3.221E-10 1.127E-06 1.150E-10 1.105E-06 1.127E-10U-238 3.33E+00 2.681E-07 8.926E-07 2.782E-07 9.264E-07 2.782E-07 9.264E-07Np-237 1.48E+01 5.265E-07 7.792E-06 3.371E-07 4.988E-06 3.357E-07 4.968E-06Np-238 1.04E-03 1.944E-07 2.022E-10 2.934E-08 3.051E-11 5.146E-08 5.352E-11Np-239 7.50E-05 1.327E-04 9.953E-09 3.201E-05 2.400E-09 3.104E-05 2.328E-09Pu-238 8.14E+00 1.396E-02 1.136E-01 2.741E-03 2.232E-02 3.191E-03 2.597E-02Pu-239 8.72E+00 3.249E-04 2.833E-03 2.934E-04 2.559E-03 2.936E-04 2.560E-03Pu-240 8.72E+00 6.643E-04 5.792E-03 5.240E-04 4.569E-03 5.296E-04 4.618E-03Pu-241 1.33E-01 1.287E-01 1.712E-02 4.708E-02 6.262E-03 4.617E-02 6.140E-03Pu-242 8.59E+00 6.094E-06 5.234E-05 2.609E-06 2.241E-05 2.578E-06 2.214E-05Am-241 1.14E+01 2.566E-03 2.925E-02 3.010E-03 3.432E-02 3.029E-03 3.453E-02Cm-242 5.18E-01 3.319E-05 1.719E-05 5.367E-06 2.780E-06 9.411E-06 4.875E-06Cm-244 7.27E+00 3.295E-02 2.395E-01 1.936E-03 1.407E-02 1.855E-03 1.349E-02Sub Total 1.794E-01 4.082E-01 5.563E-02 8.413E-02 5.511E-02 8.734E-02 Activation Products (Light Elements) P-32 1.66E-04 6.073E-14 1.008E-17 8.660E-14 1.438E-17 7.404E-14 1.229E-17S-35 8.71E-06 1.591E-15 1.385E-20 7.681E-33 6.690E-38 6.147E-33 5.354E-38Cr-51 1.02E-05 2.517E-37 2.567E-42 Fe-55 3.58E-05 8.927E-07 3.196E-11 3.752E-08 1.343E-12 2.928E-08 1.048E-12Fe-59 3.51E-04 1.396E-26 4.899E-30 Co-58 3.16E-04 4.747E-18 1.500E-21 Co-60 6.16E-03 3.165E-05 1.950E-07 7.737E-06 4.766E-08 6.619E-06 4.077E-08Ni-59 2.60E-05 1.892E-08 4.919E-13 1.184E-08 3.079E-13 1.183E-08 3.075E-13Ni-63 6.69E-05 3.031E-06 2.028E-10 1.441E-06 9.639E-11 1.426E-06 9.539E-11C-14 6.07E-05 1.247E-06 7.570E-11 6.977E-07 4.235E-11 6.964E-07 4.227E-11Ag-108 1.03E-09 2.109E-09 2.173E-18 1.397E-08 1.136E-10 1.204E-09 1.240E-18Ag-108m 8.13E-03 2.370E-08 1.927E-10 1.215E-09 1.252E-18 2.295E-08 1.866E-10Ag-110 7.53E-13 4.431E-08 3.336E-20 1.092E-12 2.589E-15 1.212E-14 9.127E-27Ag-110m 2.37E-03 3.332E-06 7.897E-09 1.486E-14 1.119E-26 8.912E-13 2.112E-15Pt-193 6.68E-06 4.529E-12 3.025E-17 1.318E-12 8.806E-18Pt-193m 2.56E-05 1.137E-12 7.594E-18 Sub Total 4.024E-05 2.034E-07 9.940E-06 4.791E-08 8.806E-06 4.110E-08 Total 6.282E-01 4.090E-01 2.771E-01 8.452E-02 2.684E-01 8.772E-02

June 2004 89 PWR Nuclides for SFR Experiments
Table E2. Nuclides in the spent fuel UO2 not in the DWDD or calculated dose
Spent Fuel Nuclides Missing from DWDD
H. B. Robinson 72 GWd/MTU Activity (Ci/g)
Surry Average Power 38.6 GWd/MTU Activity (Ci/g)
Surry Real Power 38.6 GWd/MTU Activity (Ci/g)
Be10 9.200E-12 3.135E-12 3.105E-12 Na22 1.324E-14 1.327E-14 Si32 6.073E-14 Cl36 2.314E-08 1.228E-08 1.226E-08 Ar37 3.060E-32 Ar39 1.518E-10 8.164E-11 8.130E-11 K42 1.400E-18 3.606E-19 3.031E-19 Ca41 3.983E-10 1.564E-10 1.561E-10 Ca45 1.246E-12 9.165E-22 6.755E-22 Sc46 1.931E-18 9.852E-37 8.407E-37 V50 7.633E-22 Mn54 1.946E-09 3.965E-14 2.719E-14 Co58m 2.049E-39 1.899E-39 Zn65 2.288E-08 2.160E-14 1.499E-14 Se79 7.302E-07 6.804E-07 6.788E-07 Zr93 2.902E-06 1.178E-06 Nb93m 1.708E-06 7.482E-07 7.721E-07 Mo93 1.552E-09 1.087E-09 Nb94 3.690E-10 1.303E-12 1.297E-12 Tc99 2.030E-05 1.357E-05 1.355E-05 Rh102 3.812E-07 8.614E-09 7.704E-09 Pd107 3.431E-07 1.316E-07 1.305E-07 Cd109 1.408E-08 5.540E-12 4.771E-12 Cd113m 1.144E-04 1.366E-05 1.291E-05 In113m 1.422E-14 2.043E-27 1.586E-27 Sn113 1.421E-14 2.042E-27 1.585E-27 In114 8.653E-23 In114m 9.041E-23 In115 2.308E-20 Sn121m 4.238E-07 1.916E-06 1.883E-06 Te123m 3.862E-12 6.250E-26 5.322E-26 Sb124 6.098E-18 Sn126 1.811E-06 5.933E-07 5.912E-07 Sb126m 1.811E-06 5.933E-07 5.912E-07 Ce139 5.753E-25 4.575E-25 Ce142 4.911E-11 Pm146 9.667E-07 2.590E-07 1.922E-07 Eu150 1.202E-10 Eu152 1.009E-05 1.575E-06 2.517E-06 Gd152 3.793E-24 Gd153 6.455E-08 1.512E-15 2.568E-15 Eu154 1.475E-02 1.176E-03 1.154E-03 Tb160 2.081E-15 4.249E-37 3.621E-37 Ho166m 5.006E-08 3.559E-12 3.530E-12 Tm170 1.270E-13 6.589E-31 6.172E-31
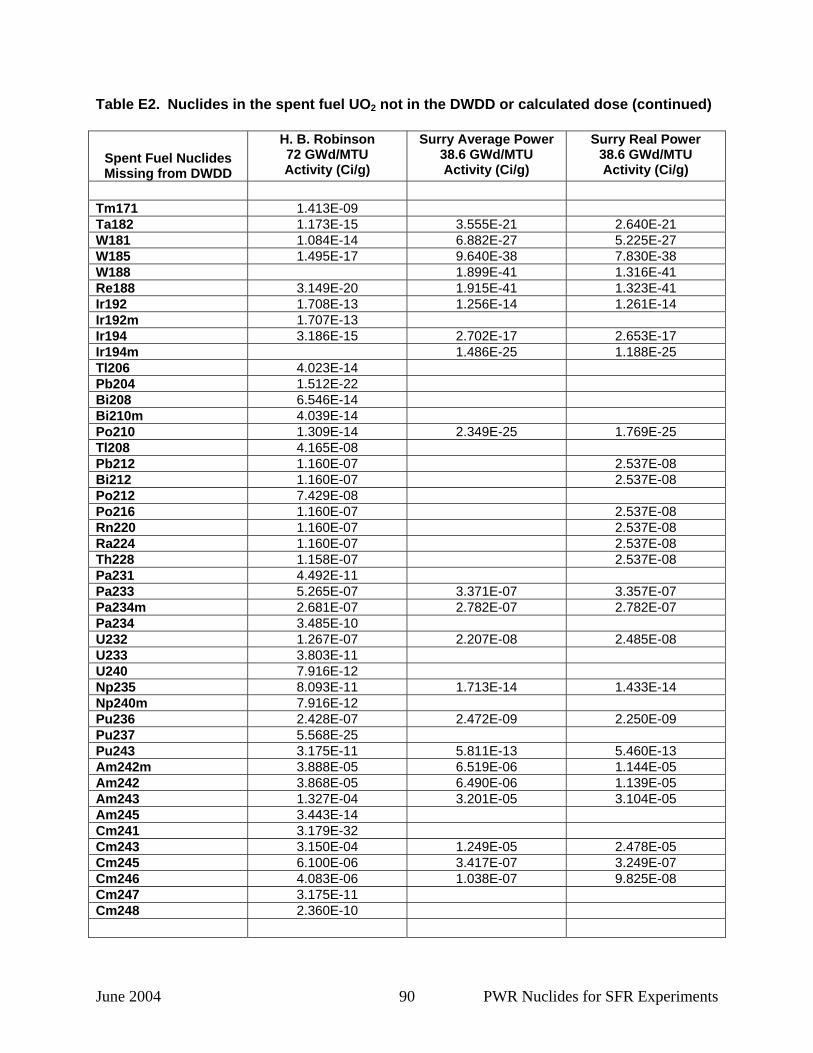
June 2004 90 PWR Nuclides for SFR Experiments
Table E2. Nuclides in the spent fuel UO2 not in the DWDD or calculated dose (continued)
Spent Fuel Nuclides Missing from DWDD
H. B. Robinson 72 GWd/MTU Activity (Ci/g)
Surry Average Power 38.6 GWd/MTU Activity (Ci/g)
Surry Real Power 38.6 GWd/MTU Activity (Ci/g)
Tm171 1.413E-09 Ta182 1.173E-15 3.555E-21 2.640E-21 W181 1.084E-14 6.882E-27 5.225E-27 W185 1.495E-17 9.640E-38 7.830E-38 W188 1.899E-41 1.316E-41 Re188 3.149E-20 1.915E-41 1.323E-41 Ir192 1.708E-13 1.256E-14 1.261E-14 Ir192m 1.707E-13 Ir194 3.186E-15 2.702E-17 2.653E-17 Ir194m 1.486E-25 1.188E-25 Tl206 4.023E-14 Pb204 1.512E-22 Bi208 6.546E-14 Bi210m 4.039E-14 Po210 1.309E-14 2.349E-25 1.769E-25 Tl208 4.165E-08 Pb212 1.160E-07 2.537E-08 Bi212 1.160E-07 2.537E-08 Po212 7.429E-08 Po216 1.160E-07 2.537E-08 Rn220 1.160E-07 2.537E-08 Ra224 1.160E-07 2.537E-08 Th228 1.158E-07 2.537E-08 Pa231 4.492E-11 Pa233 5.265E-07 3.371E-07 3.357E-07 Pa234m 2.681E-07 2.782E-07 2.782E-07 Pa234 3.485E-10 U232 1.267E-07 2.207E-08 2.485E-08 U233 3.803E-11 U240 7.916E-12 Np235 8.093E-11 1.713E-14 1.433E-14 Np240m 7.916E-12 Pu236 2.428E-07 2.472E-09 2.250E-09 Pu237 5.568E-25 Pu243 3.175E-11 5.811E-13 5.460E-13 Am242m 3.888E-05 6.519E-06 1.144E-05 Am242 3.868E-05 6.490E-06 1.139E-05 Am243 1.327E-04 3.201E-05 3.104E-05 Am245 3.443E-14 Cm241 3.179E-32 Cm243 3.150E-04 1.249E-05 2.478E-05 Cm245 6.100E-06 3.417E-07 3.249E-07 Cm246 4.083E-06 1.038E-07 9.825E-08 Cm247 3.175E-11 Cm248 2.360E-10
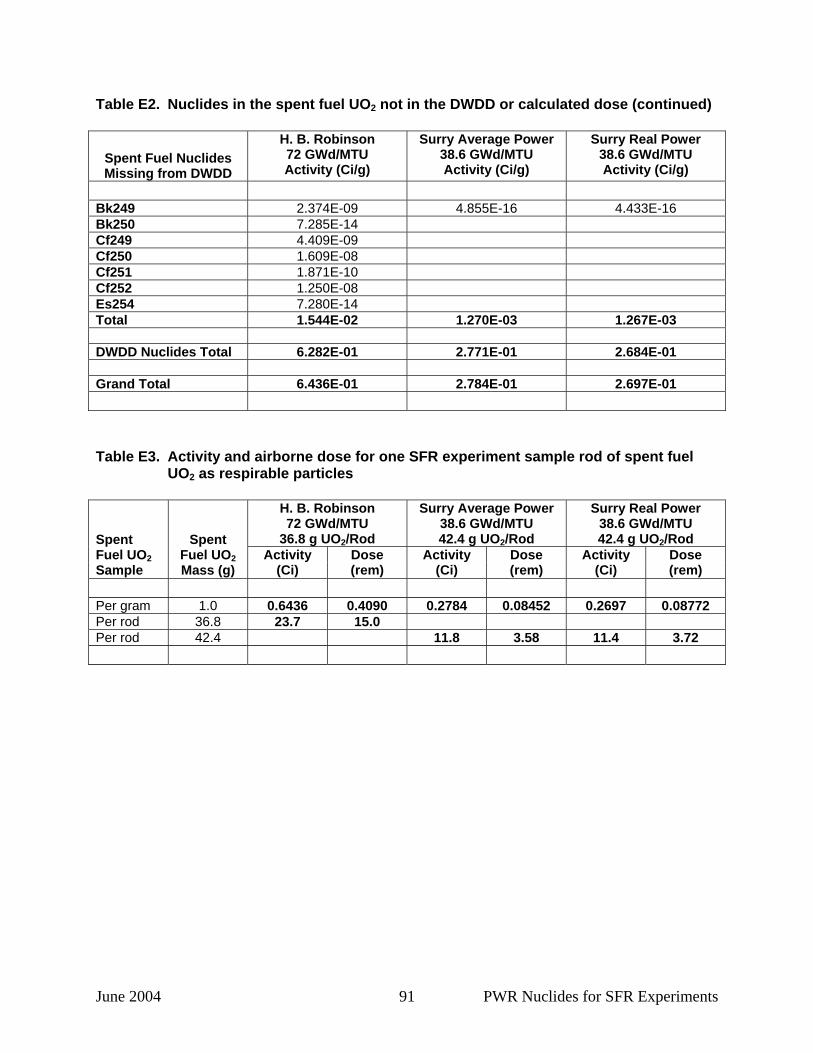
June 2004 91 PWR Nuclides for SFR Experiments
Table E2. Nuclides in the spent fuel UO2 not in the DWDD or calculated dose (continued)
Spent Fuel Nuclides Missing from DWDD
H. B. Robinson 72 GWd/MTU Activity (Ci/g)
Surry Average Power 38.6 GWd/MTU Activity (Ci/g)
Surry Real Power 38.6 GWd/MTU Activity (Ci/g)
Bk249 2.374E-09 4.855E-16 4.433E-16 Bk250 7.285E-14 Cf249 4.409E-09 Cf250 1.609E-08 Cf251 1.871E-10 Cf252 1.250E-08 Es254 7.280E-14 Total 1.544E-02 1.270E-03 1.267E-03 DWDD Nuclides Total 6.282E-01 2.771E-01 2.684E-01 Grand Total 6.436E-01 2.784E-01 2.697E-01 Table E3. Activity and airborne dose for one SFR experiment sample rod of spent fuel
UO2 as respirable particles
H. B. Robinson 72 GWd/MTU
36.8 g UO2/Rod
Surry Average Power 38.6 GWd/MTU 42.4 g UO2/Rod
Surry Real Power 38.6 GWd/MTU 42.4 g UO2/Rod Spent
Fuel UO2 Sample
Spent Fuel UO2 Mass (g)
Activity (Ci)
Dose (rem)
Activity (Ci)
Dose (rem)
Activity (Ci)
Dose (rem)
Per gram 1.0 0.6436 0.4090 0.2784 0.08452 0.2697 0.08772 Per rod 36.8 23.7 15.0 Per rod 42.4 11.8 3.58 11.4 3.72
June 2004 92 PWR Nuclides for SFR Experiments
Appendix F – Hazard Category 3 and 2 Fraction Per Gram of
Spent Fuel UO2 In this appendix the fraction of the hazard category 3 and 2 thresholds are calculated for the SFR experiment spent fuel samples. In order to calculate the fraction of the hazard category 3 and 2 thresholds for an inventory of nuclides, the quantity of each nuclide is compared to the threshold in DOE-STD-1027 (DOE 1997) for that nuclide to calculate the individual nuclide fraction of the threshold. The individual nuclide fractions of the hazard category 3 and 2 thresholds are summed to give the fraction of the hazard category threshold for the inventory shown in Tables F1 and F3 below. Most of the spent fuel nuclides have hazard category 3 and 2 thresholds but those that do not are listed in Tables 2 and 4. Table F5 summarizes the hazard category threshold fraction per gram of UO2 and per SFR experiment sample rod. The fraction of the hazard category 3 and 2 thresholds for one gram of spent fuel UO2 for both sample types was calculated and tabulated in the tables below to aid decisions on where to conduct the SFR experiments. DOE-STD-1027 (DOE 1997) had only a limited set of nuclide thresholds for hazard category 3 and 2 but it established thresholds for more nuclides found in two other documents. The expanded list of thresholds in the Los Alamos National Laboratory (LANL) fact sheet LA-12981-MS (Table of DOE-STD-1027-92 Hazard Category 3 Threshold Quantities for the ICRP-30 List of 757 Radionuclides, LANL 1995) was used for the hazard category 3 calculations as advocated by DOE-STD-1027. In addition, the expanded list of nuclide thresholds in the LANL fact sheet LA-12846-MS (Specific Activities and DOE-STD-1027-92 Hazard Category 2 Thresholds, LANL 1994) was used for the calculations. The (LANL 1994) reference did not provide the hazard category 2 threshold for the Cm-244 nuclide that made the highest contribution to airborne dose so the methods of (LANL 1994) were used to calculate the threshold for Cm-244. An atomic weight of 244 gram/mole and a half life of 18.1 years were used to calculate the specific activity of 80.99 Ci/g for Cm-244. DOE-STD-1027 Attachment 1 specifies the formula and numerical values to be used when calculating hazard category 2 thresholds. The committed effective dose equivalent and the cloud shine dose equivalent, dose conversion factors used in the hazard category 2 calculation were taken from Environmental Protection Agency Federal Guidance #11 and 12 respectively (Eckerman et al. 1989 and Eckerman and Ryman 1993). The fraction of the hazard category 3 and 2 thresholds per gram of spent fuel UO2 and per sample rod is shown in Table 18 below. Tables Table F1. Hazard category 3 threshold for one gram of spent fuel UO2 Table F2. Nuclides in the spent fuel UO2 without a hazard category 3 threshold Table F3. Hazard category 2 threshold for one gram of spent fuel UO2 Table F4. Nuclides in the spent fuel UO2 without a hazard category 2 threshold Table F5. Activity and hazard category 3 and 2 per gram and per SFR experiment sample rod of
spent fuel UO2
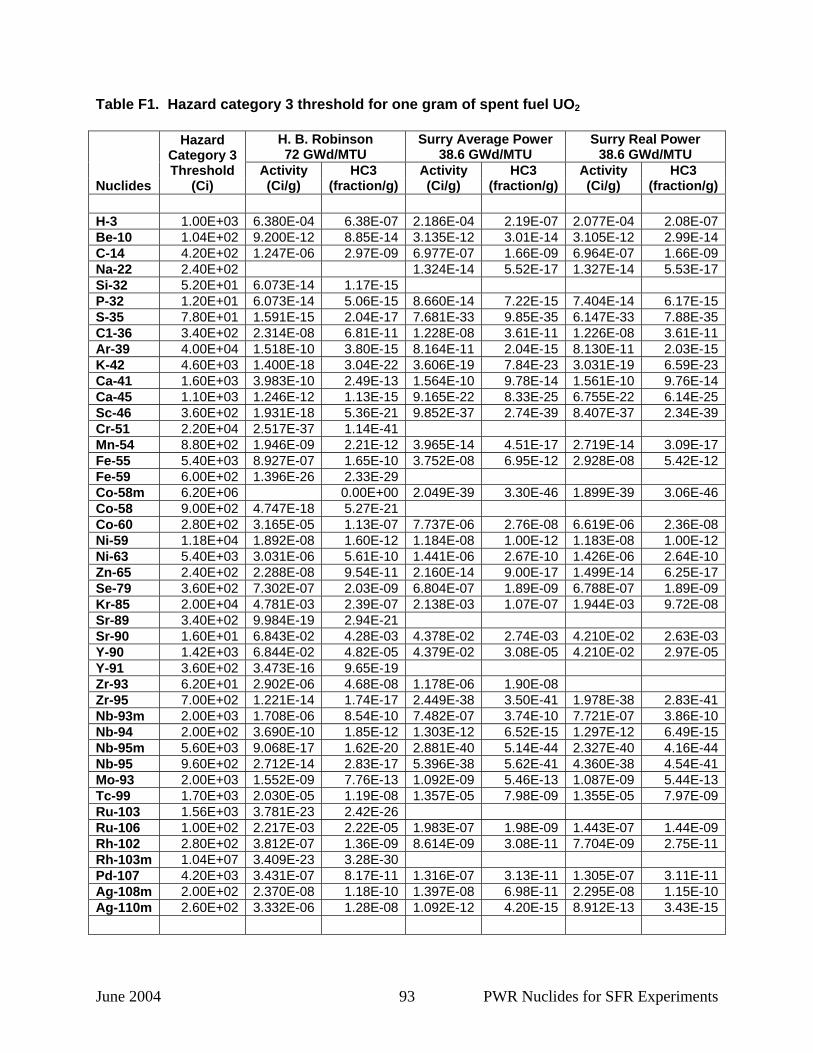
June 2004 93 PWR Nuclides for SFR Experiments
Table F1. Hazard category 3 threshold for one gram of spent fuel UO2
H. B. Robinson 72 GWd/MTU
Surry Average Power 38.6 GWd/MTU
Surry Real Power 38.6 GWd/MTU
Nuclides
Hazard Category 3 Threshold
(Ci) Activity (Ci/g)
HC3 (fraction/g)
Activity (Ci/g)
HC3 (fraction/g)
Activity (Ci/g)
HC3 (fraction/g)
H-3 1.00E+03 6.380E-04 6.38E-07 2.186E-04 2.19E-07 2.077E-04 2.08E-07Be-10 1.04E+02 9.200E-12 8.85E-14 3.135E-12 3.01E-14 3.105E-12 2.99E-14C-14 4.20E+02 1.247E-06 2.97E-09 6.977E-07 1.66E-09 6.964E-07 1.66E-09Na-22 2.40E+02 1.324E-14 5.52E-17 1.327E-14 5.53E-17Si-32 5.20E+01 6.073E-14 1.17E-15 P-32 1.20E+01 6.073E-14 5.06E-15 8.660E-14 7.22E-15 7.404E-14 6.17E-15S-35 7.80E+01 1.591E-15 2.04E-17 7.681E-33 9.85E-35 6.147E-33 7.88E-35C1-36 3.40E+02 2.314E-08 6.81E-11 1.228E-08 3.61E-11 1.226E-08 3.61E-11Ar-39 4.00E+04 1.518E-10 3.80E-15 8.164E-11 2.04E-15 8.130E-11 2.03E-15K-42 4.60E+03 1.400E-18 3.04E-22 3.606E-19 7.84E-23 3.031E-19 6.59E-23Ca-41 1.60E+03 3.983E-10 2.49E-13 1.564E-10 9.78E-14 1.561E-10 9.76E-14Ca-45 1.10E+03 1.246E-12 1.13E-15 9.165E-22 8.33E-25 6.755E-22 6.14E-25Sc-46 3.60E+02 1.931E-18 5.36E-21 9.852E-37 2.74E-39 8.407E-37 2.34E-39Cr-51 2.20E+04 2.517E-37 1.14E-41 Mn-54 8.80E+02 1.946E-09 2.21E-12 3.965E-14 4.51E-17 2.719E-14 3.09E-17Fe-55 5.40E+03 8.927E-07 1.65E-10 3.752E-08 6.95E-12 2.928E-08 5.42E-12Fe-59 6.00E+02 1.396E-26 2.33E-29 Co-58m 6.20E+06 0.00E+00 2.049E-39 3.30E-46 1.899E-39 3.06E-46Co-58 9.00E+02 4.747E-18 5.27E-21 Co-60 2.80E+02 3.165E-05 1.13E-07 7.737E-06 2.76E-08 6.619E-06 2.36E-08Ni-59 1.18E+04 1.892E-08 1.60E-12 1.184E-08 1.00E-12 1.183E-08 1.00E-12Ni-63 5.40E+03 3.031E-06 5.61E-10 1.441E-06 2.67E-10 1.426E-06 2.64E-10Zn-65 2.40E+02 2.288E-08 9.54E-11 2.160E-14 9.00E-17 1.499E-14 6.25E-17Se-79 3.60E+02 7.302E-07 2.03E-09 6.804E-07 1.89E-09 6.788E-07 1.89E-09Kr-85 2.00E+04 4.781E-03 2.39E-07 2.138E-03 1.07E-07 1.944E-03 9.72E-08Sr-89 3.40E+02 9.984E-19 2.94E-21 Sr-90 1.60E+01 6.843E-02 4.28E-03 4.378E-02 2.74E-03 4.210E-02 2.63E-03Y-90 1.42E+03 6.844E-02 4.82E-05 4.379E-02 3.08E-05 4.210E-02 2.97E-05Y-91 3.60E+02 3.473E-16 9.65E-19 Zr-93 6.20E+01 2.902E-06 4.68E-08 1.178E-06 1.90E-08 Zr-95 7.00E+02 1.221E-14 1.74E-17 2.449E-38 3.50E-41 1.978E-38 2.83E-41Nb-93m 2.00E+03 1.708E-06 8.54E-10 7.482E-07 3.74E-10 7.721E-07 3.86E-10Nb-94 2.00E+02 3.690E-10 1.85E-12 1.303E-12 6.52E-15 1.297E-12 6.49E-15Nb-95m 5.60E+03 9.068E-17 1.62E-20 2.881E-40 5.14E-44 2.327E-40 4.16E-44Nb-95 9.60E+02 2.712E-14 2.83E-17 5.396E-38 5.62E-41 4.360E-38 4.54E-41Mo-93 2.00E+03 1.552E-09 7.76E-13 1.092E-09 5.46E-13 1.087E-09 5.44E-13Tc-99 1.70E+03 2.030E-05 1.19E-08 1.357E-05 7.98E-09 1.355E-05 7.97E-09Ru-103 1.56E+03 3.781E-23 2.42E-26 Ru-106 1.00E+02 2.217E-03 2.22E-05 1.983E-07 1.98E-09 1.443E-07 1.44E-09Rh-102 2.80E+02 3.812E-07 1.36E-09 8.614E-09 3.08E-11 7.704E-09 2.75E-11Rh-103m 1.04E+07 3.409E-23 3.28E-30 Pd-107 4.20E+03 3.431E-07 8.17E-11 1.316E-07 3.13E-11 1.305E-07 3.11E-11Ag-108m 2.00E+02 2.370E-08 1.18E-10 1.397E-08 6.98E-11 2.295E-08 1.15E-10Ag-110m 2.60E+02 3.332E-06 1.28E-08 1.092E-12 4.20E-15 8.912E-13 3.43E-15
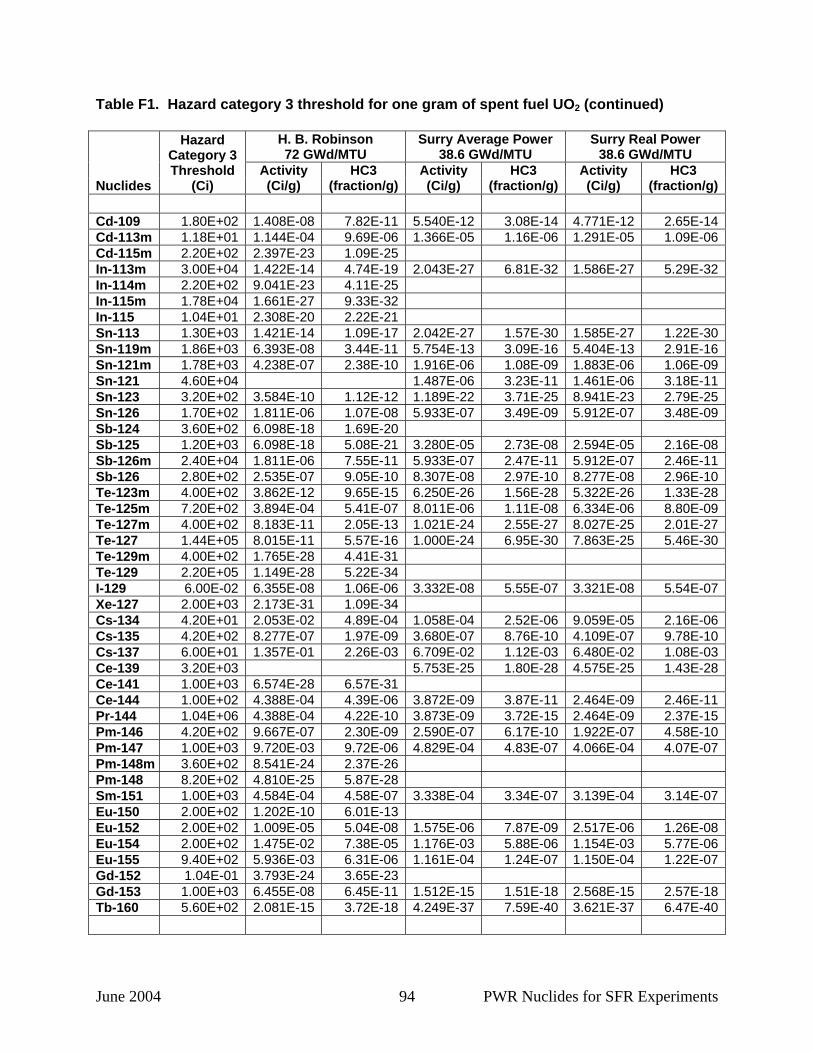
June 2004 94 PWR Nuclides for SFR Experiments
Table F1. Hazard category 3 threshold for one gram of spent fuel UO2 (continued)
H. B. Robinson 72 GWd/MTU
Surry Average Power 38.6 GWd/MTU
Surry Real Power 38.6 GWd/MTU
Nuclides
Hazard Category 3 Threshold
(Ci) Activity (Ci/g)
HC3 (fraction/g)
Activity (Ci/g)
HC3 (fraction/g)
Activity (Ci/g)
HC3 (fraction/g)
Cd-109 1.80E+02 1.408E-08 7.82E-11 5.540E-12 3.08E-14 4.771E-12 2.65E-14Cd-113m 1.18E+01 1.144E-04 9.69E-06 1.366E-05 1.16E-06 1.291E-05 1.09E-06Cd-115m 2.20E+02 2.397E-23 1.09E-25 In-113m 3.00E+04 1.422E-14 4.74E-19 2.043E-27 6.81E-32 1.586E-27 5.29E-32In-114m 2.20E+02 9.041E-23 4.11E-25 In-115m 1.78E+04 1.661E-27 9.33E-32 In-115 1.04E+01 2.308E-20 2.22E-21 Sn-113 1.30E+03 1.421E-14 1.09E-17 2.042E-27 1.57E-30 1.585E-27 1.22E-30Sn-119m 1.86E+03 6.393E-08 3.44E-11 5.754E-13 3.09E-16 5.404E-13 2.91E-16Sn-121m 1.78E+03 4.238E-07 2.38E-10 1.916E-06 1.08E-09 1.883E-06 1.06E-09Sn-121 4.60E+04 1.487E-06 3.23E-11 1.461E-06 3.18E-11Sn-123 3.20E+02 3.584E-10 1.12E-12 1.189E-22 3.71E-25 8.941E-23 2.79E-25Sn-126 1.70E+02 1.811E-06 1.07E-08 5.933E-07 3.49E-09 5.912E-07 3.48E-09Sb-124 3.60E+02 6.098E-18 1.69E-20 Sb-125 1.20E+03 6.098E-18 5.08E-21 3.280E-05 2.73E-08 2.594E-05 2.16E-08Sb-126m 2.40E+04 1.811E-06 7.55E-11 5.933E-07 2.47E-11 5.912E-07 2.46E-11Sb-126 2.80E+02 2.535E-07 9.05E-10 8.307E-08 2.97E-10 8.277E-08 2.96E-10Te-123m 4.00E+02 3.862E-12 9.65E-15 6.250E-26 1.56E-28 5.322E-26 1.33E-28Te-125m 7.20E+02 3.894E-04 5.41E-07 8.011E-06 1.11E-08 6.334E-06 8.80E-09Te-127m 4.00E+02 8.183E-11 2.05E-13 1.021E-24 2.55E-27 8.027E-25 2.01E-27Te-127 1.44E+05 8.015E-11 5.57E-16 1.000E-24 6.95E-30 7.863E-25 5.46E-30Te-129m 4.00E+02 1.765E-28 4.41E-31 Te-129 2.20E+05 1.149E-28 5.22E-34 I-129 6.00E-02 6.355E-08 1.06E-06 3.332E-08 5.55E-07 3.321E-08 5.54E-07Xe-127 2.00E+03 2.173E-31 1.09E-34 Cs-134 4.20E+01 2.053E-02 4.89E-04 1.058E-04 2.52E-06 9.059E-05 2.16E-06Cs-135 4.20E+02 8.277E-07 1.97E-09 3.680E-07 8.76E-10 4.109E-07 9.78E-10Cs-137 6.00E+01 1.357E-01 2.26E-03 6.709E-02 1.12E-03 6.480E-02 1.08E-03Ce-139 3.20E+03 5.753E-25 1.80E-28 4.575E-25 1.43E-28Ce-141 1.00E+03 6.574E-28 6.57E-31 Ce-144 1.00E+02 4.388E-04 4.39E-06 3.872E-09 3.87E-11 2.464E-09 2.46E-11Pr-144 1.04E+06 4.388E-04 4.22E-10 3.873E-09 3.72E-15 2.464E-09 2.37E-15Pm-146 4.20E+02 9.667E-07 2.30E-09 2.590E-07 6.17E-10 1.922E-07 4.58E-10Pm-147 1.00E+03 9.720E-03 9.72E-06 4.829E-04 4.83E-07 4.066E-04 4.07E-07Pm-148m 3.60E+02 8.541E-24 2.37E-26 Pm-148 8.20E+02 4.810E-25 5.87E-28 Sm-151 1.00E+03 4.584E-04 4.58E-07 3.338E-04 3.34E-07 3.139E-04 3.14E-07Eu-150 2.00E+02 1.202E-10 6.01E-13 Eu-152 2.00E+02 1.009E-05 5.04E-08 1.575E-06 7.87E-09 2.517E-06 1.26E-08Eu-154 2.00E+02 1.475E-02 7.38E-05 1.176E-03 5.88E-06 1.154E-03 5.77E-06Eu-155 9.40E+02 5.936E-03 6.31E-06 1.161E-04 1.24E-07 1.150E-04 1.22E-07Gd-152 1.04E-01 3.793E-24 3.65E-23 Gd-153 1.00E+03 6.455E-08 6.45E-11 1.512E-15 1.51E-18 2.568E-15 2.57E-18Tb-160 5.60E+02 2.081E-15 3.72E-18 4.249E-37 7.59E-40 3.621E-37 6.47E-40
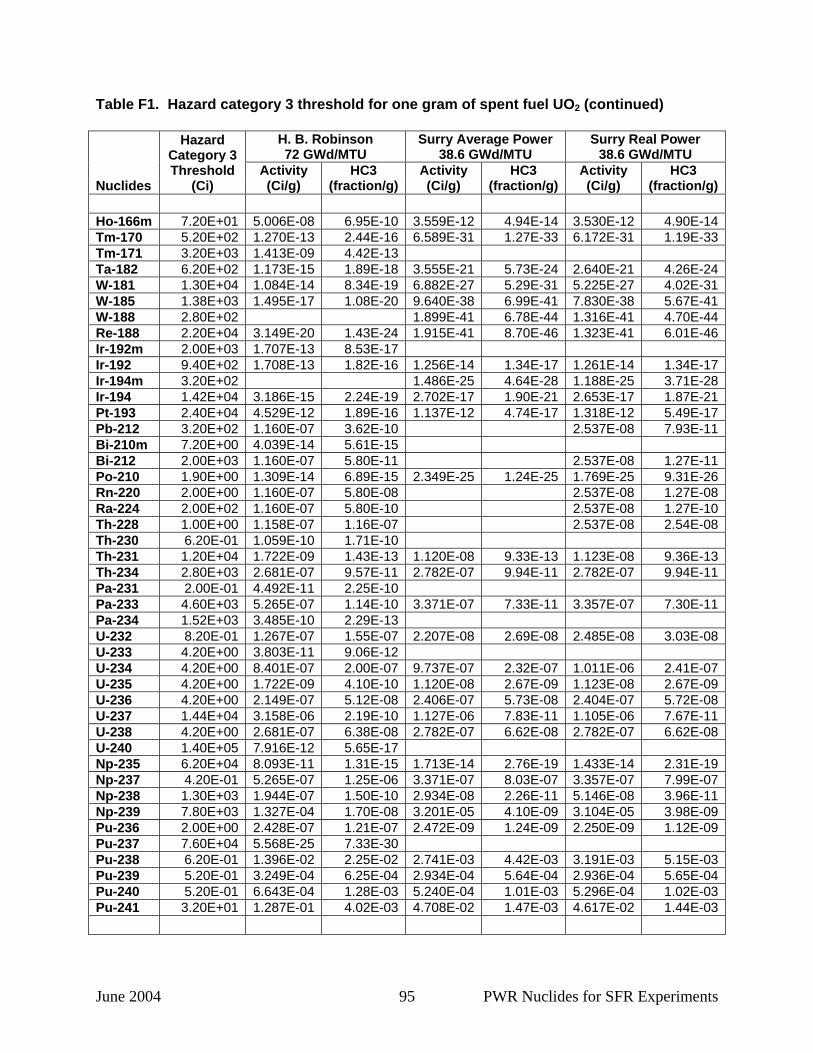
June 2004 95 PWR Nuclides for SFR Experiments
Table F1. Hazard category 3 threshold for one gram of spent fuel UO2 (continued)
H. B. Robinson 72 GWd/MTU
Surry Average Power 38.6 GWd/MTU
Surry Real Power 38.6 GWd/MTU
Nuclides
Hazard Category 3 Threshold
(Ci) Activity (Ci/g)
HC3 (fraction/g)
Activity (Ci/g)
HC3 (fraction/g)
Activity (Ci/g)
HC3 (fraction/g)
Ho-166m 7.20E+01 5.006E-08 6.95E-10 3.559E-12 4.94E-14 3.530E-12 4.90E-14Tm-170 5.20E+02 1.270E-13 2.44E-16 6.589E-31 1.27E-33 6.172E-31 1.19E-33Tm-171 3.20E+03 1.413E-09 4.42E-13 Ta-182 6.20E+02 1.173E-15 1.89E-18 3.555E-21 5.73E-24 2.640E-21 4.26E-24W-181 1.30E+04 1.084E-14 8.34E-19 6.882E-27 5.29E-31 5.225E-27 4.02E-31W-185 1.38E+03 1.495E-17 1.08E-20 9.640E-38 6.99E-41 7.830E-38 5.67E-41W-188 2.80E+02 1.899E-41 6.78E-44 1.316E-41 4.70E-44Re-188 2.20E+04 3.149E-20 1.43E-24 1.915E-41 8.70E-46 1.323E-41 6.01E-46Ir-192m 2.00E+03 1.707E-13 8.53E-17 Ir-192 9.40E+02 1.708E-13 1.82E-16 1.256E-14 1.34E-17 1.261E-14 1.34E-17Ir-194m 3.20E+02 1.486E-25 4.64E-28 1.188E-25 3.71E-28Ir-194 1.42E+04 3.186E-15 2.24E-19 2.702E-17 1.90E-21 2.653E-17 1.87E-21Pt-193 2.40E+04 4.529E-12 1.89E-16 1.137E-12 4.74E-17 1.318E-12 5.49E-17Pb-212 3.20E+02 1.160E-07 3.62E-10 2.537E-08 7.93E-11Bi-210m 7.20E+00 4.039E-14 5.61E-15 Bi-212 2.00E+03 1.160E-07 5.80E-11 2.537E-08 1.27E-11Po-210 1.90E+00 1.309E-14 6.89E-15 2.349E-25 1.24E-25 1.769E-25 9.31E-26Rn-220 2.00E+00 1.160E-07 5.80E-08 2.537E-08 1.27E-08Ra-224 2.00E+02 1.160E-07 5.80E-10 2.537E-08 1.27E-10Th-228 1.00E+00 1.158E-07 1.16E-07 2.537E-08 2.54E-08Th-230 6.20E-01 1.059E-10 1.71E-10 Th-231 1.20E+04 1.722E-09 1.43E-13 1.120E-08 9.33E-13 1.123E-08 9.36E-13Th-234 2.80E+03 2.681E-07 9.57E-11 2.782E-07 9.94E-11 2.782E-07 9.94E-11Pa-231 2.00E-01 4.492E-11 2.25E-10 Pa-233 4.60E+03 5.265E-07 1.14E-10 3.371E-07 7.33E-11 3.357E-07 7.30E-11Pa-234 1.52E+03 3.485E-10 2.29E-13 U-232 8.20E-01 1.267E-07 1.55E-07 2.207E-08 2.69E-08 2.485E-08 3.03E-08U-233 4.20E+00 3.803E-11 9.06E-12 U-234 4.20E+00 8.401E-07 2.00E-07 9.737E-07 2.32E-07 1.011E-06 2.41E-07U-235 4.20E+00 1.722E-09 4.10E-10 1.120E-08 2.67E-09 1.123E-08 2.67E-09U-236 4.20E+00 2.149E-07 5.12E-08 2.406E-07 5.73E-08 2.404E-07 5.72E-08U-237 1.44E+04 3.158E-06 2.19E-10 1.127E-06 7.83E-11 1.105E-06 7.67E-11U-238 4.20E+00 2.681E-07 6.38E-08 2.782E-07 6.62E-08 2.782E-07 6.62E-08U-240 1.40E+05 7.916E-12 5.65E-17 Np-235 6.20E+04 8.093E-11 1.31E-15 1.713E-14 2.76E-19 1.433E-14 2.31E-19Np-237 4.20E-01 5.265E-07 1.25E-06 3.371E-07 8.03E-07 3.357E-07 7.99E-07Np-238 1.30E+03 1.944E-07 1.50E-10 2.934E-08 2.26E-11 5.146E-08 3.96E-11Np-239 7.80E+03 1.327E-04 1.70E-08 3.201E-05 4.10E-09 3.104E-05 3.98E-09Pu-236 2.00E+00 2.428E-07 1.21E-07 2.472E-09 1.24E-09 2.250E-09 1.12E-09Pu-237 7.60E+04 5.568E-25 7.33E-30 Pu-238 6.20E-01 1.396E-02 2.25E-02 2.741E-03 4.42E-03 3.191E-03 5.15E-03Pu-239 5.20E-01 3.249E-04 6.25E-04 2.934E-04 5.64E-04 2.936E-04 5.65E-04Pu-240 5.20E-01 6.643E-04 1.28E-03 5.240E-04 1.01E-03 5.296E-04 1.02E-03Pu-241 3.20E+01 1.287E-01 4.02E-03 4.708E-02 1.47E-03 4.617E-02 1.44E-03
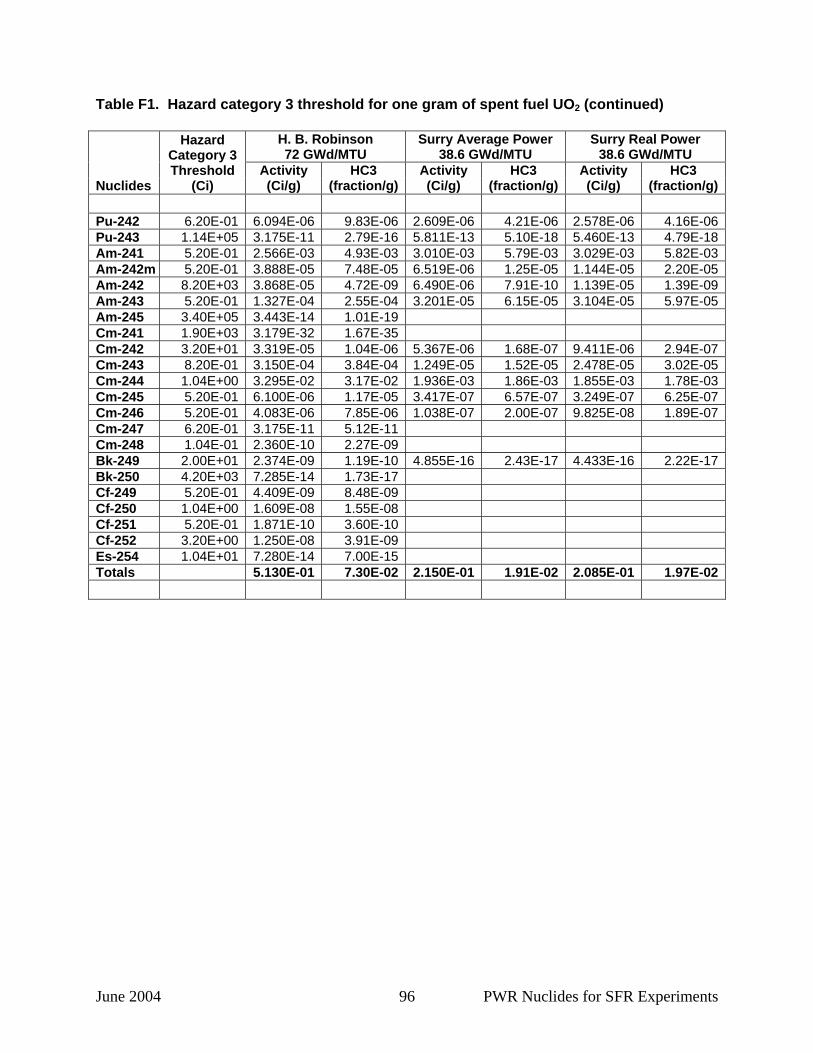
June 2004 96 PWR Nuclides for SFR Experiments
Table F1. Hazard category 3 threshold for one gram of spent fuel UO2 (continued)
H. B. Robinson 72 GWd/MTU
Surry Average Power 38.6 GWd/MTU
Surry Real Power 38.6 GWd/MTU
Nuclides
Hazard Category 3 Threshold
(Ci) Activity (Ci/g)
HC3 (fraction/g)
Activity (Ci/g)
HC3 (fraction/g)
Activity (Ci/g)
HC3 (fraction/g)
Pu-242 6.20E-01 6.094E-06 9.83E-06 2.609E-06 4.21E-06 2.578E-06 4.16E-06Pu-243 1.14E+05 3.175E-11 2.79E-16 5.811E-13 5.10E-18 5.460E-13 4.79E-18Am-241 5.20E-01 2.566E-03 4.93E-03 3.010E-03 5.79E-03 3.029E-03 5.82E-03Am-242m 5.20E-01 3.888E-05 7.48E-05 6.519E-06 1.25E-05 1.144E-05 2.20E-05Am-242 8.20E+03 3.868E-05 4.72E-09 6.490E-06 7.91E-10 1.139E-05 1.39E-09Am-243 5.20E-01 1.327E-04 2.55E-04 3.201E-05 6.15E-05 3.104E-05 5.97E-05Am-245 3.40E+05 3.443E-14 1.01E-19 Cm-241 1.90E+03 3.179E-32 1.67E-35 Cm-242 3.20E+01 3.319E-05 1.04E-06 5.367E-06 1.68E-07 9.411E-06 2.94E-07Cm-243 8.20E-01 3.150E-04 3.84E-04 1.249E-05 1.52E-05 2.478E-05 3.02E-05Cm-244 1.04E+00 3.295E-02 3.17E-02 1.936E-03 1.86E-03 1.855E-03 1.78E-03Cm-245 5.20E-01 6.100E-06 1.17E-05 3.417E-07 6.57E-07 3.249E-07 6.25E-07Cm-246 5.20E-01 4.083E-06 7.85E-06 1.038E-07 2.00E-07 9.825E-08 1.89E-07Cm-247 6.20E-01 3.175E-11 5.12E-11 Cm-248 1.04E-01 2.360E-10 2.27E-09 Bk-249 2.00E+01 2.374E-09 1.19E-10 4.855E-16 2.43E-17 4.433E-16 2.22E-17Bk-250 4.20E+03 7.285E-14 1.73E-17 Cf-249 5.20E-01 4.409E-09 8.48E-09 Cf-250 1.04E+00 1.609E-08 1.55E-08 Cf-251 5.20E-01 1.871E-10 3.60E-10 Cf-252 3.20E+00 1.250E-08 3.91E-09 Es-254 1.04E+01 7.280E-14 7.00E-15 Totals 5.130E-01 7.30E-02 2.150E-01 1.91E-02 2.085E-01 1.97E-02

June 2004 97 PWR Nuclides for SFR Experiments
Table F2. Nuclides in the spent fuel UO2 without a hazard category 3 threshold
Spent Fuel Nuclides Without a Hazard
Category 3 Threshold
H. B. Robinson 72 GWd/MTU Activity (Ci/g)
Surry Average Power 38.6 GWd/MTU Activity (Ci/g)
Surry Real Power 38.6 GWd/MTU Activity (Ci/g)
Ar37 3.060E-32 V50 7.633E-22 Rh106 2.217E-03 1.983E-07 1.443E-07Ag108 2.109E-09 1.215E-09 1.204E-09Ag109m 1.408E-08 5.547E-12 4.778E-12Ag110 4.431E-08 1.486E-14 1.212E-14In114 8.653E-23 Ba137m 1.284E-01 6.335E-02 6.119E-02Ce142 4.911E-11 Pr144m 5.266E-06 5.421E-11 3.449E-11Tl206 4.023E-14 Pb204 1.512E-22 Bi208 6.546E-14 Tl208 4.165E-08 Po212 7.429E-08 Po216 1.160E-07 2.537E-08Pa234m 2.681E-07 2.782E-07 2.782E-07Np240m 7.916E-12 Total 1.306E-01 6.335E-02 6.119E-02 Spent Fuel Total 6.436E-01 2.784E-01 2.697E-01

June 2004 98 PWR Nuclides for SFR Experiments
Table F3. Hazard category 2 threshold for one gram of spent fuel UO2
H. B. Robinson 72 GWd/MTU
Surry Average Power 38.6 GWd/MTU
Surry Real Power 38.6 GWd/MTU
Nuclides
Hazard Category 2 Threshold
(Ci) Activity (Ci/g)
HC2 (fraction/g)
Activity (Ci/g)
HC2 (fraction/g)
Activity (Ci/g)
HC2 (fraction/g)
H-3 3.00E+05 6.380E-04 2.13E-09 2.186E-04 7.29E-10 2.077E-04 6.92E-10C-14 1.40E+06 1.247E-06 8.91E-13 6.977E-07 4.98E-13 6.964E-07 4.97E-13Na-22 6.30E+03 1.324E-14 2.10E-18 1.327E-14 2.11E-18P-32 4.40E+03 6.073E-14 1.38E-17 8.660E-14 1.97E-17 7.404E-14 1.68E-17S-35 2.50E+04 1.591E-15 6.36E-20 7.681E-33 3.07E-37 6.147E-33 2.46E-37C1-36 1.40E+03 2.314E-08 1.65E-11 1.228E-08 8.77E-12 1.226E-08 8.76E-12Ca-45 4.70E+06 1.246E-12 2.65E-19 9.165E-22 1.95E-28 6.755E-22 1.44E-28Sc-46 1.40E+06 1.931E-18 1.38E-24 9.852E-37 7.04E-43 8.407E-37 6.00E-43Cr-51 1.00E+08 2.517E-37 2.52E-45 Fe-55 1.10E+07 8.927E-07 8.12E-14 3.752E-08 3.41E-15 2.928E-08 2.66E-15Fe-59 1.80E+06 1.396E-26 7.75E-33 Co-60 1.90E+05 3.165E-05 1.67E-10 7.737E-06 4.07E-11 6.619E-06 3.48E-11Ni-63 4.50E+06 3.031E-06 6.74E-13 1.441E-06 3.20E-13 1.426E-06 3.17E-13Zn-65 1.60E+06 2.288E-08 1.43E-14 2.160E-14 1.35E-20 1.499E-14 9.37E-21Kr-85 2.80E+07 4.781E-03 1.71E-10 2.138E-03 7.64E-11 1.944E-03 6.94E-11Sr-90 7.70E+05 6.843E-02 8.89E-08 4.378E-02 5.69E-08 4.210E-02 5.47E-08Y-91 6.50E+05 3.473E-16 5.34E-22 Zr-93 8.90E+04 2.902E-06 3.26E-11 1.178E-06 1.32E-11 Zr-95 1.50E+06 1.221E-14 8.14E-21 2.449E-38 1.63E-44 1.978E-38 1.32E-44Nb-94 8.60E+04 3.690E-10 4.29E-15 1.303E-12 1.52E-17 1.297E-12 1.51E-17Tc-99 3.80E+06 2.030E-05 5.34E-12 1.357E-05 3.57E-12 1.355E-05 3.57E-12Ru-106 6.50E+03 2.217E-03 3.41E-07 1.983E-07 3.05E-11 1.443E-07 2.22E-11Ag-110m 5.30E+05 3.332E-06 6.29E-12 1.092E-12 2.06E-18 8.912E-13 1.68E-18Cd-109 2.90E+05 1.408E-08 4.85E-14 5.540E-12 1.91E-17 4.771E-12 1.65E-17In-114m 3.70E+05 9.041E-23 2.44E-28 Sn-113 3.20E+06 1.421E-14 4.44E-21 2.042E-27 6.38E-34 1.585E-27 4.95E-34Sn-123 9.50E+05 3.584E-10 3.77E-16 1.189E-22 1.25E-28 8.941E-23 9.41E-29Sn-126 3.30E+05 5.933E-07 1.80E-12 5.912E-07 1.79E-12Sb-124 1.30E+06 6.098E-18 4.69E-24 Sb-126 2.50E+06 2.535E-07 1.01E-13 8.307E-08 3.32E-14 8.277E-08 3.31E-14Te-127m 1.50E+05 8.183E-11 5.46E-16 1.021E-24 6.81E-30 8.027E-25 5.35E-30Te-129m 1.40E+05 1.765E-28 1.26E-33 Cs-134 6.00E+04 2.053E-02 3.42E-07 1.058E-04 1.76E-09 9.059E-05 1.51E-09Cs-137 8.90E+04 1.357E-01 1.52E-06 6.709E-02 7.54E-07 6.480E-02 7.28E-07Ce-141 3.30E+06 6.574E-28 1.99E-34 Ce-144 8.20E+04 4.388E-04 5.35E-09 3.872E-09 4.72E-14 2.464E-09 3.00E-14Pm-147 8.40E+05 9.720E-03 1.16E-08 4.829E-04 5.75E-10 4.066E-04 4.84E-10Sm-151 9.90E+05 4.584E-04 4.63E-10 3.338E-04 3.37E-10 3.139E-04 3.17E-10Eu-152 1.30E+05 1.009E-05 7.76E-11 1.575E-06 1.21E-11 2.517E-06 1.94E-11Eu-154 1.10E+05 1.475E-02 1.34E-07 1.176E-03 1.07E-08 1.154E-03 1.05E-08Eu-155 7.30E+05 5.936E-03 8.13E-09 1.161E-04 1.59E-10 1.150E-04 1.58E-10Gd-153 1.40E+06 6.455E-08 4.61E-14 1.512E-15 1.08E-21 2.568E-15 1.83E-21Tb-160 1.30E+06 2.081E-15 1.60E-21 4.249E-37 3.27E-43 3.621E-37 2.79E-43Ho-166m 4.00E+04 5.006E-08 1.25E-12 3.559E-12 8.90E-17 3.530E-12 8.83E-17
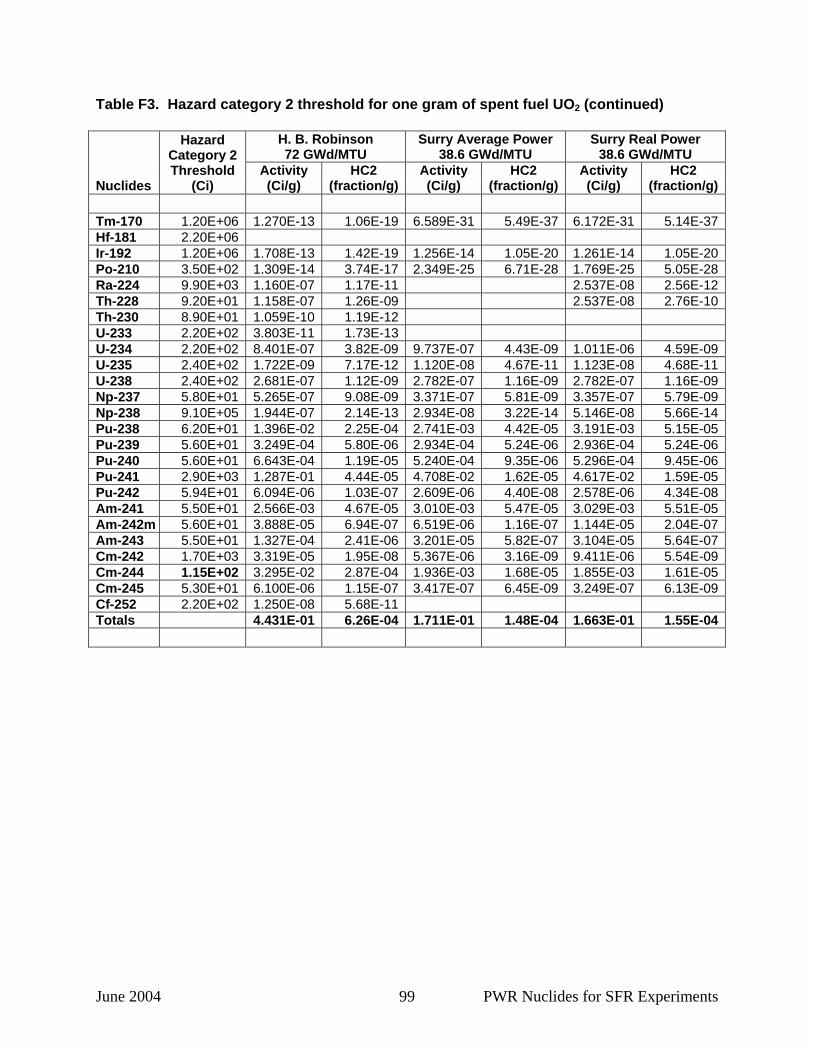
June 2004 99 PWR Nuclides for SFR Experiments
Table F3. Hazard category 2 threshold for one gram of spent fuel UO2 (continued)
H. B. Robinson 72 GWd/MTU
Surry Average Power 38.6 GWd/MTU
Surry Real Power 38.6 GWd/MTU
Nuclides
Hazard Category 2 Threshold
(Ci) Activity (Ci/g)
HC2 (fraction/g)
Activity (Ci/g)
HC2 (fraction/g)
Activity (Ci/g)
HC2 (fraction/g)
Tm-170 1.20E+06 1.270E-13 1.06E-19 6.589E-31 5.49E-37 6.172E-31 5.14E-37Hf-181 2.20E+06 Ir-192 1.20E+06 1.708E-13 1.42E-19 1.256E-14 1.05E-20 1.261E-14 1.05E-20Po-210 3.50E+02 1.309E-14 3.74E-17 2.349E-25 6.71E-28 1.769E-25 5.05E-28Ra-224 9.90E+03 1.160E-07 1.17E-11 2.537E-08 2.56E-12Th-228 9.20E+01 1.158E-07 1.26E-09 2.537E-08 2.76E-10Th-230 8.90E+01 1.059E-10 1.19E-12 U-233 2.20E+02 3.803E-11 1.73E-13 U-234 2.20E+02 8.401E-07 3.82E-09 9.737E-07 4.43E-09 1.011E-06 4.59E-09U-235 2.40E+02 1.722E-09 7.17E-12 1.120E-08 4.67E-11 1.123E-08 4.68E-11U-238 2.40E+02 2.681E-07 1.12E-09 2.782E-07 1.16E-09 2.782E-07 1.16E-09Np-237 5.80E+01 5.265E-07 9.08E-09 3.371E-07 5.81E-09 3.357E-07 5.79E-09Np-238 9.10E+05 1.944E-07 2.14E-13 2.934E-08 3.22E-14 5.146E-08 5.66E-14Pu-238 6.20E+01 1.396E-02 2.25E-04 2.741E-03 4.42E-05 3.191E-03 5.15E-05Pu-239 5.60E+01 3.249E-04 5.80E-06 2.934E-04 5.24E-06 2.936E-04 5.24E-06Pu-240 5.60E+01 6.643E-04 1.19E-05 5.240E-04 9.35E-06 5.296E-04 9.45E-06Pu-241 2.90E+03 1.287E-01 4.44E-05 4.708E-02 1.62E-05 4.617E-02 1.59E-05Pu-242 5.94E+01 6.094E-06 1.03E-07 2.609E-06 4.40E-08 2.578E-06 4.34E-08Am-241 5.50E+01 2.566E-03 4.67E-05 3.010E-03 5.47E-05 3.029E-03 5.51E-05Am-242m 5.60E+01 3.888E-05 6.94E-07 6.519E-06 1.16E-07 1.144E-05 2.04E-07Am-243 5.50E+01 1.327E-04 2.41E-06 3.201E-05 5.82E-07 3.104E-05 5.64E-07Cm-242 1.70E+03 3.319E-05 1.95E-08 5.367E-06 3.16E-09 9.411E-06 5.54E-09Cm-244 1.15E+02 3.295E-02 2.87E-04 1.936E-03 1.68E-05 1.855E-03 1.61E-05Cm-245 5.30E+01 6.100E-06 1.15E-07 3.417E-07 6.45E-09 3.249E-07 6.13E-09Cf-252 2.20E+02 1.250E-08 5.68E-11 Totals 4.431E-01 6.26E-04 1.711E-01 1.48E-04 1.663E-01 1.55E-04

June 2004 100 PWR Nuclides for SFR Experiments
Table F4. Nuclides in the spent fuel UO2 without a hazard category 2 threshold
Spent Fuel Nuclides Without a Hazard
Category 2 Threshold
H. B. Robinson 72 GWd/MTU Activity (Ci/g)
Surry Average Power 38.6 GWd/MTU Activity (Ci/g)
Surry Real Power 38.6 GWd/MTU Activity (Ci/g)
Be10 9.200E-12 3.135E-12 3.105E-12 Si32 6.073E-14 Ar37 3.060E-32 Ar39 1.518E-10 8.164E-11 8.130E-11 K42 1.400E-18 3.606E-19 3.031E-19 Ca41 3.983E-10 1.564E-10 1.561E-10 V50 7.633E-22 Mn54 1.946E-09 3.965E-14 2.719E-14 Co58 4.747E-18 Co58m 2.049E-39 1.899E-39 Ni59 1.892E-08 1.184E-08 1.183E-08 Se79 7.302E-07 6.804E-07 6.788E-07 Sr89 9.984E-19 Y90 6.844E-02 4.210E-02 Nb93m 1.708E-06 7.482E-07 7.721E-07 Mo93 1.552E-09 1.092E-09 1.087E-09 Nb95 2.712E-14 5.396E-38 4.360E-38 Nb95m 9.068E-17 2.881E-40 2.327E-40 Nb96m Rh102 3.812E-07 8.614E-09 7.704E-09 Ru103 3.781E-23 Rh103m 3.409E-23 Rh106 2.217E-03 1.983E-07 1.443E-07 Pd107 3.431E-07 1.316E-07 1.305E-07 Ag108 2.109E-09 1.215E-09 1.204E-09 Ag108m 2.370E-08 1.397E-08 2.295E-08 Ag109m 1.408E-08 5.547E-12 4.778E-12 Ag110 4.431E-08 1.486E-14 1.212E-14 Cd113m 1.144E-04 1.366E-05 1.291E-05 In113m 1.422E-14 2.043E-27 1.586E-27 In114 8.653E-23 Cd115m 2.397E-23 In115 2.308E-20 In115m 1.661E-27 Sn119m 6.393E-08 5.754E-13 5.404E-13 Sn121 1.487E-06 1.461E-06 Sn121m 4.238E-07 1.916E-06 1.883E-06 Te123m 3.862E-12 6.250E-26 5.322E-26 Sb125 6.098E-18 3.280E-05 2.594E-05 Te125m 3.894E-04 8.011E-06 6.334E-06 Sn126 1.811E-06 Sb126m 1.811E-06 5.933E-07 5.912E-07 Te127 8.015E-11 1.000E-24 7.863E-25 Xe127 2.173E-31 3.332E-08 Te129 1.149E-28
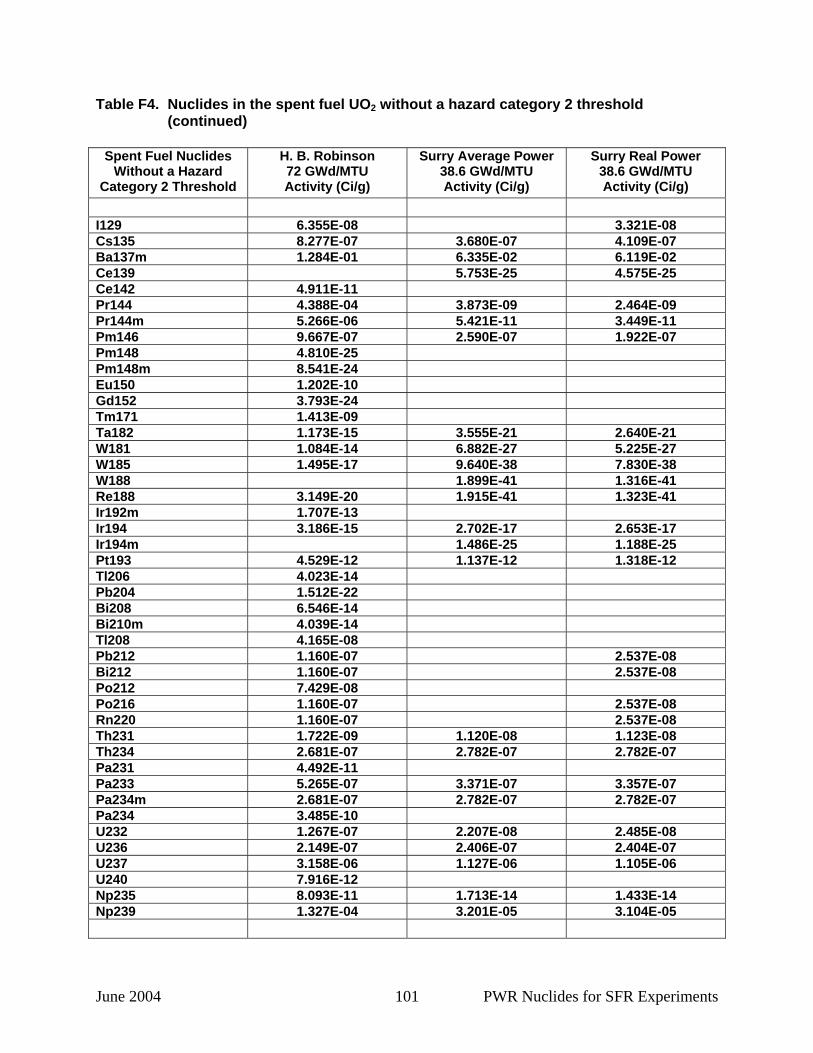
June 2004 101 PWR Nuclides for SFR Experiments
Table F4. Nuclides in the spent fuel UO2 without a hazard category 2 threshold (continued)
Spent Fuel Nuclides
Without a Hazard Category 2 Threshold
H. B. Robinson 72 GWd/MTU Activity (Ci/g)
Surry Average Power 38.6 GWd/MTU Activity (Ci/g)
Surry Real Power 38.6 GWd/MTU Activity (Ci/g)
I129 6.355E-08 3.321E-08 Cs135 8.277E-07 3.680E-07 4.109E-07 Ba137m 1.284E-01 6.335E-02 6.119E-02 Ce139 5.753E-25 4.575E-25 Ce142 4.911E-11 Pr144 4.388E-04 3.873E-09 2.464E-09 Pr144m 5.266E-06 5.421E-11 3.449E-11 Pm146 9.667E-07 2.590E-07 1.922E-07 Pm148 4.810E-25 Pm148m 8.541E-24 Eu150 1.202E-10 Gd152 3.793E-24 Tm171 1.413E-09 Ta182 1.173E-15 3.555E-21 2.640E-21 W181 1.084E-14 6.882E-27 5.225E-27 W185 1.495E-17 9.640E-38 7.830E-38 W188 1.899E-41 1.316E-41 Re188 3.149E-20 1.915E-41 1.323E-41 Ir192m 1.707E-13 Ir194 3.186E-15 2.702E-17 2.653E-17 Ir194m 1.486E-25 1.188E-25 Pt193 4.529E-12 1.137E-12 1.318E-12 Tl206 4.023E-14 Pb204 1.512E-22 Bi208 6.546E-14 Bi210m 4.039E-14 Tl208 4.165E-08 Pb212 1.160E-07 2.537E-08 Bi212 1.160E-07 2.537E-08 Po212 7.429E-08 Po216 1.160E-07 2.537E-08 Rn220 1.160E-07 2.537E-08 Th231 1.722E-09 1.120E-08 1.123E-08 Th234 2.681E-07 2.782E-07 2.782E-07 Pa231 4.492E-11 Pa233 5.265E-07 3.371E-07 3.357E-07 Pa234m 2.681E-07 2.782E-07 2.782E-07 Pa234 3.485E-10 U232 1.267E-07 2.207E-08 2.485E-08 U236 2.149E-07 2.406E-07 2.404E-07 U237 3.158E-06 1.127E-06 1.105E-06 U240 7.916E-12 Np235 8.093E-11 1.713E-14 1.433E-14 Np239 1.327E-04 3.201E-05 3.104E-05

June 2004 102 PWR Nuclides for SFR Experiments
Table F4. Nuclides in the spent fuel UO2 without a hazard category 2 threshold (continued)
Spent Fuel Nuclides
Without a Hazard Category 2 Threshold
H. B. Robinson 72 GWd/MTU Activity (Ci/g)
Surry Average Power 38.6 GWd/MTU Activity (Ci/g)
Surry Real Power 38.6 GWd/MTU Activity (Ci/g)
Np240m 7.916E-12 Pu236 2.428E-07 2.472E-09 2.250E-09 Pu237 5.568E-25 Pu243 3.175E-11 5.811E-13 5.460E-13 Am242 3.868E-05 6.490E-06 1.139E-05 Am245 3.443E-14 Cm241 3.179E-32 Cm243 3.150E-04 1.249E-05 2.478E-05 Cm246 4.083E-06 1.038E-07 9.825E-08 Cm247 3.175E-11 Cm248 2.360E-10 Bk249 2.374E-09 4.855E-16 4.433E-16 Bk250 7.285E-14 Cf249 4.409E-09 Cf250 1.609E-08 Cf251 1.871E-10 Es254 7.280E-14 Total 2.005E-01 6.346E-02 1.034E-01 Spent Fuel Total 6.436E-01 2.784E-01 2.697E-01 Table F5. Activity and hazard category 3 and 2 per gram and per SFR experiment sample
rod of spent fuel UO2
H. B. Robinson 72 GWd/MTU
36.8 g UO2/Rod
Surry Average Power 38.6 GWd/MTU 42.4 g UO2/Rod
Surry Real Power 38.6 GWd/MTU 42.4 g UO2/Rod
Spent Fuel UO2 Sample
Spent Fuel UO2
Mass (g)
Activity (Ci)
HC3 Fraction
HC2 Fraction
Activity (Ci)
HC3 Fraction
HC2 Fraction
Activity (Ci)
HC3 Fraction
HC2 Fraction
Per gram 1.0 0.6436 0.0730 0.000626 0.2784 0.0191 0.000148 0.2697 0.0197 0.000155Per rod 36.8 23.7 2.69 0.0265 Per rod 42.4 11.8 0.810 0.00628 11.4 0.835 0.00657

DISTRIBUTION 1 U.S. Dept. of Energy, NNSA
Office of International Safeguards Attn: Russell S. Hibbs, NA-243 1000 Independence Ave., SW Washington, DC 20585
2 U.S. Nuclear Regulatory
Commission Attn: Tin Mo, RES, MS T-9F31 F. I. Young, NSIR, MS T4-D8 Washington, DC 20555-0001
2 Institut de Radioprotection et de
Surete Nucleaire, IRSN/DSMR/SATE, BP17 Attn: Bruno Autrusson Olivier Loiseau 92262 Fontenay-aux-Roses Cedex, France
1 Gesellschaft fur Anlagen- und
Reaktorsicherheit (GRS) mbH Attn: Gunter Pretzsch Kurfuerstendamm 200 10719 Berlin, Germanyi
2 Argonne National Laboratory
Energy Technology Div., Bldg 212 Attn: Mike C. Billone Hanchung Tsai 9700 S. Cass Ave Argonne, IL 60439-3838
1 Robert E. Einziger, Consultant
434 Saratoga Drive Aurora, IL 60504
1 Robert E. Luna, Consultant
10025 Barrinson NE Albuquerque, NM 87111
1 MS 0718 M. A. Molecke, 6141 1 0718 R. H. Yoshimura, 6141 1 1141 R. L. Coats, 6883 1 1141 M. W. Gregson, 6883 6 1141 R. E. Naegeli, 6883 1 1141 S. A. Walker, 6883 1 1143 D. T. Berry, 6882 1 1146 K. O. Reil, 6871 1 9018 Central Technical Files, 8945-1 2 0899 Technical Library, 9616


![[Frontiers in Bioscience 13, 2757-2773, January 1, 2008] … · 2009-03-16 · [Frontiers in Bioscience 13, 2757-2773, January 1, 2008] 2757 Fundamental principles and applications](https://img.pdfslide.us/doc/110x75/5f46768ef970013bc94661bf/frontiers-in-bioscience-13-2757-2773-january-1-2008-2009-03-16-frontiers.jpg)