Embed Size (px)
Citation preview

SANDIA REPORT SAND2004-28 12 Unlimited Release Printed September 2004
Calendar Year 2003 Annual Site Environmental Report for Tonopah Test Range, Nevada and Kauai Test Facility, Hawaii
Katrina Wagner, Susan Koss, Stephanie Salinas, Rebecca Sanchez, and Lucie Mayeux
Prepared by Sandia National Laboratories Albuquerque, New Mexico 87 185
Sandia is a multiprograrn laboratory operated by Sandia Corporation, a Lockheed Martin Company, for the United States Department of Energy's National Nuclear Security Administration under Contract DE-AC04-94AL85000.
Approved for public release; further dissemination unlimited.
@ Sandia National Labmtaies
Issued by Sandia National Laboratories, operated for the United States Department of Energy bySandia Corporation.
NOTICE: This report was prepared as an account of work sponsored by an agency of the United StatesGovernment. Neither the United States Government, nor any agency thereof, nor any of their employees,nor any of their contractors, subcontractors, or their employees, make any warranty, express or implied,or assume any legal liability or responsibility for the accuracy, completeness, or usefulness of anyinformation, apparatus, product, or process disclosed, or represent that its use would not infringe privatelyowned rights. Reference herein to any specific commercial product, process, or service by trade name,trademark, manufacturer, or otherwise, does not necessarily constitute or imply its endorsement,recommendation, or favoring by the United States Government, any agency thereof, or any of theircontractors or subcontractors. The views and opinions expressed herein do not necessarily state or reflectthose of the United States Government, any agency thereof, or any of their contractors.
Printed in the United States of America. This report has been reproduced directly from the best availablecopy.
Available to DOE and DOE contractors fromU.S. Department of EnergyOffice of Scientific and Technical InformationP.O. Box 62Oak Ridge, TN 37831Telephone: (865)576-8401Facsimile: (865)576-5728E-Mail: [email protected] ordering: http://www.doe.gov/bridge
Available to the public fromU.S. Department of CommerceNational Technical Information Service5285 Port Royal RdSpringfield, VA 22161Telephone: (800)553-6847Facsimile: (703)605-6900E-Mail: [email protected] order: http://www.ntis.gov/help/ordermethods.asp?loc=7-4-0#online

SAND 2004-2812Unlimited Release
Printed September 2004
Calendar Year 2003Annual Site
Environmental ReportTonopah Test Range, Nevada &
Kauai Test Facility, Hawaii
Project LeadStephanie Salinas
Associate Chief Editor and Document SpecialistKatrina Wagner
Graphics and Document Specialist Susan Koss
Reference Librarian Database Administrator Lucie Mayeux Rebecca Sanchez
Produced by:Sandia National Laboratories
P.O. Box 5800Albuquerque, New Mexico 87185-1042
ABSTRACT
Tonopah Test Range (TTR) in Nevada and Kauai Test Facility (KTF) in Hawaii are government-owned,contractor-operated facilities operated by Sandia Corporation, a subsidiary of Lockheed Martin Corporation.The U.S. Department of Energy (DOE), National Nuclear Security Administration (NNSA), through theSandia Site Office (SSO), in Albuquerque, NM, manages TTR and KTF’s operations. Sandia Corporationconducts operations at TTR in support of DOE/NNSA’s Weapons Ordnance Program and has operated thesite since 1957. Westinghouse Government Services subcontracts to Sandia Corporation in administeringmost of the environmental programs at TTR. Sandia Corporation operates KTF as a rocket preparationlaunching and tracking facility. This Annual Site Environmental Report (ASER) summarizes data and thecompliance status of the environmental protection and monitoring program at TTR and KTF through CalendarYear (CY) 2003. The compliance status of environmental regulations applicable at these sites include stateand federal regulations governing air emissions, wastewater effluent, waste management, terrestrialsurveillance, and Environmental Restoration (ER) cleanup activities. Sandia Corporation is responsible onlyfor those environmental program activities related to its operations. The DOE/NNSA, Nevada Site Office(NSO) retains responsibility for the cleanup and management of ER TTR sites. Currently, there are no ERSites at KTF. Environmental monitoring and surveillance programs are required by DOE Order 450.1,Environmental Protection Program (DOE 2003) and DOE Order 231.1 Chg 2., Environment, Safety,and Health Reporting (DOE 1996).
Calendar Year 2003 Annual Site Environmental ReportSandia National Laboratories, Tonopah Test Range, Nevada &Kauai Test Facility, HawaiiFinal Approval date: August 2004
Work performed under Contract No. DE-ACO4-94AL85000
Prepared for:U.S. Department of Energy, National Nuclear Security AdministrationSandia Site Office, Albuquerque, NM
Prepared by:Sandia Corporation, Albuquerque, New MexicoES&H and Emergency Management CenterEnvironmental Management Department (6321)

ACKNOWLEDGMENTS
We wish to thank the following individuals who contributed their time and expertise assisting in the productionof the TTR and KTF annual reports:
NOTE TO THE READER
The goals for the TTR and KTF Annual Site Environmental Reports are to present summary environmentalperformance, compliance with environmental standards and requirements, and to highlight significant facilityprograms. In addition, DOE views this document as a valuable tool for maintaining a dialogue with ourcommunity about the environmental health of these sites.
If you are interested in reading chapter highlights, a one-page summary is provided at the beginning of eachchapter for TTR (chapter summaries are not provided for KTF because document is one chapter [Chapter5] in length).
We are striving to improve the quality of the contents as well as include information that is important to you.You are invited to fill out the questionnaire at the end of this document or provide feedback, comments, orquestions to:
U.S. Department of EnergyNational Nuclear Security Administration
Sandia Site OfficeP.O. Box 5400
Albuquerque, NM 87185-5400Attention: Karen Agogino
Karen Agogino William Forston Dean Manning Brenda Bailey-White Joe Guerrero Lucie Mayeux Linda Bayliss Joan Harris Amber Montoya Joe Bonaguidi Heidi Herrera Hans Oldewage Kevin Cabble Adrian Jones Jennifer Payne Michael du Mond Susan Koss Stephanie Salinas Charles Fink Al Lopez Rebecca Sanchez Katrina Wagner

This page intentionally left blank.

CONTENTS i
ACRONYMS AND ABBREVIATIONS................................................................................................... ivTTR & KTF EXECUTIVE SUMMARY................................................................................................ S-1
1.0 TTR INTRODUCTION (Chapter Summary) .......................................................................... 1-1
1.1 TTR History and Operations ........................................................................................... 1-21.2 Site Description and Demographics ................................................................................ 1-41.3 Regional Geology, Hydrology, Climate, and Fauna .......................................................... 1-41.4 Clean Slate and Double Track Sites ................................................................................ 1-5
2.0 TTR COMPLIANCE SUMMARY (Chapter Summary) .......................................................... 2-1
2.1 Compliance Status with Federal Regulations .................................................................. 2-22.1.1 Comprehensive Environmental Response, Compensation,
and Liability Act (CERCLA) ............................................................................. 2-22.1.2 Emergency Planning and Community Right-to-Know Act (EPCRA) ............... 2-22.1.3 Resource Conservation and Recovery Act (RCRA) ......................................... 2-22.1.4 Federal Facility Compliance Act (FFCA) .......................................................... 2-42.1.5 Clean Air Act (CAA) and Clean Air Act Amendments (CAAA) of 1990 ........ 2-42.1.6 Clean Water Act (CWA) .................................................................................... 2-52.1.7 Safe Drinking Water Act (SDWA) .................................................................... 2-52.1.8 Toxic Substances Control Act (TSCA) .............................................................. 2-52.1.9 Federal Insecticide, Fungicide, and Rodenticide Act (FIFRA) .......................... 2-52.1.10 National Environmental Policy Act (NEPA) ...................................................... 2-52.1.11 Endangered Species Act (ESA) ......................................................................... 2-62.1.12 Migratory Bird Treaty Act (MBTA) .................................................................. 2-62.1.13 Cultural Resources Acts ..................................................................................... 2-62.1.14 Environmental Compliance Executive Orders (EOs) ........................................ 2-6
2.2 2003 Audits ...................................................................................................................... 2-82.3 2003 Issues and Actions for TTR ................................................................................... 2-82.4 Environmental Permits .................................................................................................... 2-82.5 Occurrence Reporting ..................................................................................................... 2-9
3.0 TTR ENVIRONMENTAL PROGRAMS INFORMATION (Chapter Summary) ................... 3-1
3.1 ER Project Activities ....................................................................................................... 3-23.2 Waste Management Programs ........................................................................................ 3-63.3 Spill Prevention Control and Countermeasures (SPCC) Plan ......................................... 3-63.4 NEPA Program................................................................................................................ 3-63.5 Environmental Monitoring Performed by Outside Agencies ........................................... 3-83.6 Summary of Release Reporting ...................................................................................... 3-8
4.0 TTR ENVIRONMENTAL MONITORING (Chapter Summary) ............................................ 4-1
4.1 Terrestrial Surveillance .................................................................................................... 4-24.1.1 Program Objectives ............................................................................................ 4-24.1.2 Regulatory Standards and Comparisons ............................................................ 4-24.1.3 Statistical Analyses ............................................................................................. 4-24.1.4 Sampling Locations ............................................................................................ 4-34.1.5 Radiological Parameters and Results ................................................................. 4-34.1.6 Non-Radiological Parameters and Results ........................................................ 4-7

CONTENTS ii
4.2 Water Monitoring ............................................................................................................. 4-94.2.1 Production Well Monitoring ................................................................................ 4-94.2.2 Sewage System and Septic Tank Monitoring ..................................................... 4-94.2.3 Storm Water Monitoring ................................................................................... 4-10
4.3 Radiological Air Monitoring ........................................................................................... 4-104.4 Non-Radiological Air Emissions .....................................................................................4-11
5.0 2003 ANNUAL SITE ENVIRONMENTAL REPORT FOR KAUAI TEST FACILITY ........ 5-15.1 Facilities and Operations ................................................................................................. 5-15.2 2003 Rocket Launches .................................................................................................... 5-35.3 Demographics .................................................................................................................. 5-35.4 Compliance Summary ..................................................................................................... 5-35.5 Environmental Program Activities ................................................................................. 5-105.6 Environmental Surveillance and Monitoring Activities .................................................. 5-11
6.0 TTR & KTF REFERENCES....................................................................................................... 6-1
APPENDIX A Terrestrial Surveillance Results and Sampling Location Maps for TTR .................... A-1
FIGURES
1-1 Location of the Tonopah Test Range (TTR), Within the Boundaries of theNevada Test and Training Range (NTTR), Nevada ....................................................................... 1-3
1-2 Location of Facilities Operated by SNL/NSO at TTR................................................................... 1-64-1 Tonopah Test Range TLD Exposure (1999-2003) .......................................................................... 4-95-1 Map of the Pacific Missile Range Facility (PMRF) and the Adjacent Area ................................... 5-2
TABLES
1-1 Project Roller Coaster Test Information ..................................................................................... 1-72-1 2003 SARA Title III (or EPCRA) Reporting Requirements Applicable to TTR ........................ 2-42-2 Protected Species Potentially Occurring in Nye County, Nevada. ............................................ 2-72-3 Summary of Environmental Audits Performed at TTR in 2003.................................................. 2-82-4 2003 Summary of Permit Ownership at TTR............................................................................. 2-93-1 DOE/NNSA/NSO ER Project TTR CAUs and CASs Calendar Year 2003 Status .................. 3-33-2 Sandia Corporation TTR Generated RCRA-Regulated
Hazardous Waste Shipped Off-site in 2003 ................................................................................ 3-73-3 Non-RCRA-Regulated Hazardous or Toxic Waste Shipped Off-site in 2003 ........................... 3-73-4 Recycled Regulated Hazardous or Toxic Waste Shipped Off-site in 2003. ............................... 3-74-1 Decision Matrix for Determining Priority Action Levels ............................................................ 4-34-2 On-site Terrestrial Surveillance Locations at TTR ..................................................................... 4-44-3 Off-site Terrestrial Surveillance Locations at TTR .................................................................... 4-44-4 Perimeter Terrestrial Surveillance Locations at TTR ................................................................. 4-54-5 Summary Statistics for Soil Locations ........................................................................................ 4-64-6 Summary Statistics for Soil Locations Noted as Priority-2 ........................................................ 4-64-7 Summary Statistics for Soil Locations Noted as Priority-3 ........................................................ 4-74-8 Metal in Soil Concentration Data (compiled from various sources) ........................................... 4-84-9 Production Well Monitoring at TTR .......................................................................................... 4-104-10 Calculated Dose Assessment Results for On-site Receptor .....................................................4-11

CONTENTS iii
5-1 Permit Registrations in Place at SNL/KTF ................................................................................ 5-45-2 2003 SARA Title III (or EPCRA) Reporting Requirements Applicable to SNL/KTF ............... 5-45-3 Threatened and Endangered Species Potentially Occurring on KTF......................................... 5-76-1 State of Nevada Administrative Code (NAC) Applicable to the TTR ....................................... 6-8

CONTENTS iv
ACRONYMS AND ABBREVIATIONS
A AEA Atomic Energy ActACM Asbestos Containing MaterialAEC U.S. Atomic Energy CommissionAIRFA American Indian Religious Freedom ActAQC Air Quality ComplianceARPA Archaeological Resources Protection ActASER Annual Site Environmental ReportAST aboveground storage tank
B BLM U.S. Bureau of Land ManagementBMD Ballistic Missile DefenseBMDO Ballistic Missile Defense OrganizationBMP Best Management PracticeBSA Bulk Storage Areas
C CAA Clean Air ActCAAA Clean Air Act AmendmentsCAS Corrective Action SiteCAU Corrective Action UnitCEMP Community Environmental Monitoring ProgramCERCLA Comprehensive Environmental Response, Compensation, and Liability ActCFR Code of Federal RegulationsCIS Chemical Inventory SystemCOD chemical oxygen demandCV Coefficient of VariationCWA Clean Water ActCY calendar year
D D&D decontamination and demolitionDMR Discharge Monitoring ReportDoD U.S. Department of DefenseDOE U.S. Department of EnergyDOE/AL U.S. Department of Energy, Albuquerque Operations OfficeDRI Desert Research Institute, Water Resource Center, University of Nevada SystemDU depleted uranium
E EA environmental assessmentEDE effective dose equivalentEHS extremely hazardous substanceEIS Environmental Impact StatementEM Environmental Management (Department)EO Executive OrderEPA U.S. Environmental Protection AgencyEPCRA Emergency Planning and Community Right-to-Know ActER Environmental RestorationERDA U.S. Energy Research and Development AdministrationES&H Environment, Safety, and HealthESA Endangered Species Act
F FFCA Federal Facilities Compliance ActFFACO Federal Facilities Agreement and Consent OrderFIDLER field instrument for the detection of low-energy radiationFIFRA Federal Insecticide, Fungicide, and Rodenticide Act

CONTENTS v
FONSI Finding of No Significant ImpactFTU-1 Flight Test Unit 1
H HAR Hawaii Administrative RulesHQ headquarters
I ICP-20 Inductively Coupled Plasma-20 (stable metals)ICP-AES Inductively Coupled Plasma-Atomic Emission SpectrumIDW Investigation Derived WasteIOC Inorganic Compounds
J JASSM Joint Air to Surface Stand-off Missile System
K KTF Kauai Test Facility
L LDR Land Disposal RestrictionLLW low-level waste
M MBTA Migratory Bird Treaty ActMDA minimum detectable activityMOA Memorandum of AgreementMEI maximally exposed individualMSDS Material Safety Data SheetMW mixed waste
N NAEG Nevada Applied Ecology GroupNAFB Nellis Air Force Base (Range Complex)NEDS Non Explosive Destruction SiteNDEP Nevada Department of Environmental ProtectionNEPA National Environmental Policy ActNESHAP National Emission Standards for Hazardous Air PollutantsNFA No Further ActionNFEC National Facilities Engineer CommandNHPA National Historic Preservation ActNNSA National Nuclear Security AdministrationNOS not otherwise specifiedNPDES National Pollutant Discharge Elimination SystemNPL National Priorities ListN/R Not requiredNSP Non-covered Source PermitNSPS New Source Performance StandardNSO Nevada Site OfficeNTS Nevada Test SiteNTTR Nevada Test and Training RangeNV Nevada
O O&M Operations and MaintenanceOIG Office of Inspector General
P PA Preliminary AssessmentPCB polychlorinated biphenylpH potential of HydrogenPMRF Pacific Missile Range FacilityPMS portable monitoring stationPPE personal protective equipmentPSD Prevention of Significant Deterioration
Q QA quality assurance

CONTENTS vi
R RBIFF Reentry Body Impact Fuze FlightR&D research and developmentRCRA Resource Conservation and Recovery ActROD Record of DecisionRQ Reportable QuantityRY reporting year
S SAIC Science Applications International CorporationSARA Superfund Amendments and Reauthorization ActSDI Strategic Defense InitiativeSDWA Safe Drinking Water ActSHPO State Historic Preservation OfficeSNL/KTF Kauai Test FacilitySNL/NM Sandia National Laboratories, New MexicoSOC Synthetic Organic CompoundsSPCC Spill Prevention, Control, and CountermeasuresSSO Sandia Site OfficeSTARS Strategic Targeting SystemSVOC semi-volatile organic compound
T TLD thermoluminescent dosimeterTQ threshold quantityTRPH total recoverable petroleum hydrocarbonTRI Toxic Release InventoryTSCA Toxic Substances Control ActTSD treatment, storage, and disposal (facility)TTR Tonopah Test Range
U UDP underground discharge pointUSAF U.S. Air ForceUSFS U.S. Forest ServiceUSGS U.S. Geological SurveyUST underground storage tankUXO unexploded ordnance
V VOC volatile organic compound
Units of Measure
ºC Celsius degree m metercm centimeter m2 square meterºF Fahrenheit degree m3 cube meterft feet mg milligramg gram mi milein. inch ppm parts per millionkm kilometer yr yearkg kilogram Std Dev standard deviation
Radioactivity Measurements
Ci curie (unit of radioactivity) pCi/g picocurie per grammrem millirem (unit of radiation dose) rem roentgen equivalent manmrem/yr millirem per year (unit of radiation dose)mR/yr milliroentgen per year mSv millisievert (unit of radiation dose)pCi picocurie µg/m2 microgram per square meterµR/hr microroentgen per hour

CONTENTS vii
Approximate Conversion Factors for Selected SI (Metric) Units
Multiply Si (metric) unit by To obtain U.S. customary unit
Celsius (ºC) °F = 9/5 °C + 32 Fahrenheit (ºF)centimeter (cm) 0.39 inch (in.)cubic meter (m3) 35 cubic feet (ft3)gram (g) 0.035 ounce (oz)hectare (ha) 2.5 acrekilogram (kg) 2.2 pound (lb)kilometer (km) 0.62 mile (mi)liter (L) 0.26 gallon (gal)meter (m) 3.3 feet (ft)milligram per liter (mg/L) 1 parts per million (ppm)microgram per gram (mg/g) 1 parts per million (ppm)square kilometer (km2) 0.39 square mile (mi2)
Chemical Abbreviations
Am-241 americium-241 Cs-137 cesium-137Pu-238 plutonium-238 Pu-239 plutonium-239Pu-240 plutonium-240 Utot uranium, total
CONTENTS viii
This page intentionally left blank.

Sandia National Laboratories (a wholly-owned susidiary of LockheedMartin Corporation) at Tonopah Test Range (TTR) and Kauai TestFacility (KTF) are government-owned, contractor-operated facilitiesowned by the U.S Department of Energy (DOE), National NuclearSecurity Administration (NNSA) and managed by the Sandia Site Office,in Albuquerque, New Mexico. This report was prepared in accordancewith, and as required, by DOE Order 450.1, Environmental ProtectionProgram (DOE 2003) and DOE Order 231.1 Chg 2, Environment,Safety, and Health Reporting (DOE 1996). This report summarizesdata from environmental protection and monitoring programs at TTRand KTF for Calendar Year (CY) 2003. It also discusses SandiaCorporation’s compliance with environmental statutes, regulations, andpermit provisions and highlights other significant environmental programsand efforts at TTR and KTF. This report is a key component of SandiaCorporation and DOE’s effort to keep the public informed aboutenvironmental conditions throughout the DOE/NNSA complex. If youare interested in reading chapter highlights, a one-page summary isprovided at the beginning of each chapter for TTR (chapter summariesare not provided for KTF because document is one chapter [Chapter5] in length).
Tonopah Test RangeSandia Corporation conducts operations at TTR in support of the DOE/NNSA’s Weapons Ordnance Program. Sandia Corporation’s activitiesinvolve research and development and testing of weapon componentsand delivery systems. Many of these activities require a remote testrange with a long flight corridor for air drops and rocket launches.Other activities include explosive tests and gun firings.
Environmental ProgramsThe following environmental programs are in place at TTR:
• Waste management,• Environmental Restoration (ER),• Terrestrial surveillance,• Water quality monitoring,• Air quality compliance, and• National Environmental Policy Act (NEPA).
Waste ManagementWaste generated at TTR in 2003 included hazardous waste regulatedby the Resource Conservation and Recovery Act (RCRA) and non-hazardous industrial and sanitary waste. All hazardous waste was shippedto permitted treatment, storage, and disposal facilities. (SandiaCorporation does not handle waste generated by ER activities).
TTR & KTFExecutive SummaryIn this Chapter ...
Tonopah Test RangeEnvironmental ProgramsWaste ManagementEnvironmental Restoration ProjectTerrestrial SurveillanceWater QualityAir QualityNational Environmental
Policy Act ActivitiesKauai Test Facility
Environmental ProgramsNational Environmental Policy Act ActivitiesWater QualityAir Quality
Lycium andersonni at TTR

2003 Annual Site Environmental Report, TTR & KTFS-2
ER ProjectER activities at TTR areconducted through the DOE/NNSA, Nevada Site Office(NSO). ER sites remaining atTTR include areas contaminatedfrom target tests and detonations,non-impacted surface debris, andareas impacted by ordnance anddepleted uranium.
Terrestrial SurveillanceSoil samples were collected from14 off-site, eight perimeter, and21 on-site locations in 2003. Soilis the only terrestrial mediumsampled at TTR. Samples arecollected to detect air-depositedpollutants or contaminants thatmay have transported anddeposited as a result of surfacewater runoff.
Thermoluminescent dosimeterresults (a measure of ambientgamma radiation) showed nodistinguishable statisticaldifference between on-site andoff-site locations in 2003. Non-radiological soil analyses werenot performed in 2003. Non-radiological analysis areperformed every other year(during even numbered years).To date, there have been noterrestrial sample results thathave indicated a significant levelof concern (Priority-1) that wouldtrigger actions at locations thatare not already being addressedby the ER Project.
Water QualityWastewater monitoring resultsconfirmed that all permitconditions set by the State ofNevada were met in 2003.
Water quality samples areroutinely taken from ProductionWell 6, which supplies potablewater for Sandia Corporation’sMain Compound at TTR. WaterQuality sample results showedthat all permit conditions weremet in 2003. Westinghouse hastwo State of Nevada certifiedwater operators on staff at TTR.
Air QualityRadiological air emissions areregulated by National EmissionStandards for Hazardous AirPollutants. The only radionuclidesources at TTR are the threeClean Slate Sites, which aresources of diffused radionuclideemissions as a result of the re-suspension of contaminated soils.These sites are currently beingaddressed by DOE/NNSA/NSOunder the ER Project. Thecalculated dose for the maximallyexposed individual was0.024 millirem/year (mrem/yr),which is approximately 400 timesless than the 10 mrem/yr standardset by the U.S. EnvironmentalProtection Agency. Based on thisvalue, an annual dose assessmentis not required to be calculatedfor the TTR site.
TTR’s Class II Air Quality Permitrequires emission reports fromsignificant non-radionuclidesources. At TTR, these sourcesinclude the screening plant andportable screen. In 2003, the totalemissions reported to the Stateof Nevada were 0.001 ton/yrfrom the portable screenreplacement.
NEPAAt KTF, NEPA compliance iscoordinated between SandiaCorporation and DOE/NNSA/SSO. Compliance is alsosupported with the assistance ofthe Desert Research Institute, abranch of the University ofNevada System. A total of eightNEPA Checklists were submittedto DOE/NNSA/SSO forproposed actions in 2003.
Kauai Test FacilityKTF is operated by SandiaCorporation as a rocketpreparation, launching, andtracking facility for DOE/NNSA,as well as in support of otherU.S. Military agencies. SNL/KTFexists as a facility within theboundaries of the U.S.Department of Defense Pacific
Missile Range Facility. SNL/KTF, located on the island ofKauai at the north end of thePacific Missile Range Facilitynear Nohili Point, has been anactive rocket-launching facilitysince 1962. There were tworockets launched from SNL/KTFin 2003.
The following environmentalprograms are in place at KTF:
• Air quality compliance,• NEPA,• Water quality monitoring, and• Terrestrial surveillance
(every five years).
Air QualityKTF’s non-covered sourcepermit requires biannualmonitoring reports fromsignificant stationary sources. AtKTF, these sources include twodiesel engine generators. In 2003,the total usage reported to theState of Hawaii was 12,098gallons of fuel fired during 12hours of operation.
NEPAAt KTF, NEPA compliance iscoordinated between SandiaCorporation and DOE/NNSA/SSO. In 2003, Sandia NationalLaboratories/New Mexico(SNL/NM) completed one NEPAcompliance review for proposedactions at SNL/KTF.
Water QualitySeptic tanks do not requirepermitting or sampling, but as abest management practice, septictanks were sampled in September2003. No contaminants wereidentified above the reportinglimits.
Terrestrial SurveillanceTerrestrial surveillance isconducted every five years. Nosampling occurred this year.

Chapter OneTTR IntroductionChapter Summary
Sandia Corporation (a subsidiary of Lockheed Martin Corporation through itscontract with the U.S. Department of Energy [DOE]), National Nuclear SecurityAdministration (NNSA), Sandia Site Office (SSO), operates the Tonopah TestRange (TTR) in Nevada. Westinghouse Government Service, TTR’s operationsand maintenance contractor, performs most environmental program functions.
This Annual Site Environmental Report (ASER), which is published to informthe public about environmental conditions at TTR, describes environmentalprotection programs and summarizes the compliance status with majorenvironmental laws and regulations during Calendar Year (CY) 2003.
TTR is located within the boundries of the Nevada Test and Training Range(NTTR) withdrawal. The principal DOE activities performed at TTR arestockpile reliability testing, research and development (R&D) testing supportof structural development; arming, fusing, and firing systems testing; and testingnuclear weapon delivery systems.
In 1963, Project Roller Coaster included a series of four nuclear weaponsdestruction tests, which left plutonium dispersal in the surrounding soils. TheDOE/NNSA, Nevada Site Office (NSO) is responsible for the remediation ofenvironmental restoration (ER) and related (legacy) activities, while SSO andSandia Corporation are responsible for the environmental compliance of ongoingoperations.
Environmental Snapshot
• TTR’s annual rainfall is 4 inches on the desert floor and 12 inches in the mountains.
• The NTTR land withdrawal generally provides a positive effect on local plant and animal life species since it is relatively undisturbed by human activity.
In this Chapter ...TTR History and OperationsSite Description and DemographicsRegional Geology, Hydrology, Climate, and FaunaClean Slate and Double Track Sites
Wild horses at TTR
Evening Primrose at TTR

2003 Annual Site Environmental Report, TTR & KTF1-2
Sandia Corporation’s TTR islocated on approximately 280square miles (128,000 acres)within the boundaries of theNTTR withdrawal and is used tosupport DOE/NNSA and U.S.Air Force (USAF) activities andmissions. TTR is owned by theDOE/NNSA, managed by theSSO in Albuquerque, NewMexico and operated by SandiaCorporation, a subsidiary ofLockheed Martin Corporation.As the operations andmaintenance contractor for TTR,Westinghouse GovernmentService performs mostenvironmental program functions,including environmental mediasampling, wastewater effluentand drinking water monitoring,spill response, and wastemanagement operations.Westinghouse GovernmentService also supports TTRduring tests by operating opticsequipment, recovering testobjects, and performingradiography.
This ASER is prepared inaccordance with the followingDOE Orders that pertain toenvironmental protection andmanagement:
• DOE Order 231.1 Chg 2,Environment , Safe ty,and Health Reporting(DOE 1996);
• DOE Order 232.1A,Occurrence Reporting andProcessing of OperationsInformation (DOE 1997) ;
• DOE Order 435.1,Radioactive WasteManagement (DOE 2001);
• DOE Order 450.1,Environmental ProtectionProgram (DOE 2003);
• DOE Order 5400.5,Radiation Protection ofthe Public and theEnvironment (DOE 1993);
• SEN-22-90, DOE Policy onSignatures of RCRA PermitApplications (DOE 1990).
This ASER summarizes datafrom environmental protectionand monitoring programs at TTRfor CY03. The environmentalprograms summarized includewaste management, air, water,terrestrial monitoring andsurveillance, the ER Project, andthe National EnvironmentalPolicy Act (NEPA). DOE Order450.1 specifies the requirementsfor environmental monitoringconducted at and around theTTR site. The ASER representsan important component of DOEand Sandia Corporation’s effortto keep the public informed aboutenvironmental conditions atDOE/NNSA facilities.
1.1 TTR HISTORY ANDOPERATIONS
In 1940, President Rooseveltestablished the “Las VegasBombing and Gunnery Range”(now referred to as NTTR),which is part of the Nellis AirForce Base (NAFB) Complex.The NAFB Complex, locatedeight miles north of Las Vegas,Nevada, includes severalauxiliary small arm ranges, andthe NTTR—divided into a NorthRange and a South Range(Figure 1-1). The Nevada TestSite (NTS) is located betweenthese two ranges. The entireNAFB Complex is comprised ofapproximately three million acres.TTR is located 32 miles (mi)southeast of Tonopah, Nevada.
TTR Site CharacteristicsThe topography at TTR ischaracterized by a broad, flat,valley bordered by two north andsouth trending mountain ranges:the Cactus Range to the west(occurring mostly within theboundaries of TTR) and theKawich Range to the east.Cactus Flat is the valley floorwhere the main operational area
of TTR is located. An area oflow hills outcrops in the south.Elevations within TTR rangefrom 5,347 ft at the valley floorto 7,482 ft at Cactus Peak. Theelevation within the town ofTonopah is 6,030 ft.
TTR Site SelectionTTR was selected as a bombingrange after similar facilities at theSalton Sea Test Base inCalifornia, as well as Yucca Flaton the NTS, became inadequate.By the mid-1950s, theatmosphere at the Salton Sea TestBase became permeated withhaze, which limited visibility andhampered photography.Nevada’s Yucca Flat site alsobecame inadequate due to theincreasing emphasis on low-altitude approaches and deliveriesthat required flat terrain and along approach corridor. The TTRsite was located in the northwestcorner of the then Las VegasBombing and Gunnery Range.The site, which wasapproximately seven times thesize of the Salton Sea Test Base,was well suited because it hadimmense areas of flat terrainneeded for the increasing use ofrockets and low-altitude, high-speed aircraft operations. Thearea was withdrawn in 1956 andTTR became operational in 1957to operate and test new weaponsystems. In the years followingWorld War II, facilities that werebuilt at TTR were originallydesigned and equipped to gatherdata on aircraft delivered inerttest vehicles under U.S. AtomicEnergy Commission (AEC)cognizance (now DOE). Overthe years, the facilities andcapabilities at TTR wereexpanded to accommodate testsrelated to the DOE/NNSA’sWeapons Ordnance Program.
Operations Control CenterThe Main Compound in Area 3is the heart of the test rangeactivities. The OperationsControl Center controls and

TTR Introduction 1-3
FIGURE 1-1. Location of the Tonopah Test Range (TTR), Within the Boundaries of the Nevada Test and Training Range (NTTR), Nevada.
Nevada
Tonopah
Goldfield
WarmSprings
Luning
To Reno
Cactus Pk.
7,482 ft
Alamo
Las Vegas
To Salt Lake City
ToLos Angeles
North Range
LasVegas
Reno
C
a
lifo
rn
ia
N
e
va
d
a
93
6
95
6
95
93
Beatty
Cactu
s R
ange
NTSSouth
Range
Nevada Test
and Training
Range
IndianSprings
NTTR
Kaw
ich R
ange
375
Not to Scale03_Fig_1-1_T T R .ai
NOTE:
NTS = Nevada Test Site
N
15
9515
TTR

2003 Annual Site Environmental Report, TTR & KTF1-4
coordinates all test functions andaffords a 360-degree view of thesite. During test operations, thetest director, range safety officer,test project engineer, cameracontroller, and rangecommunicator operate theconsoles in the OperationsControl Center to control andcoordinate all test functions.
TTR ActivitiesPrincipal DOE activities at TTRinclude stockpile reliabilitytesting; R&D testing support ofstructural development; arming,fusing and firing systems testing;and testing nuclear weapondelivery systems. No nucleardevices are tested at TTR.
TTR is instrumented with a widearray of signal tracking equipmentincluding video, high-speedcameras, radar tracking devicesused to characterize ballistics,aerodynamics, and parachuteperformance on artillery shells,bomb drops, missiles, androckets.
In recent years, specific testactivities at TTR have consistedof the following:
• Air drops (trajectory studiesof simulated weapons);
• Gun firings;• Ground-launched rockets
(study of aeroballistics andmaterial properties);
• Air-launched rockets(deployed from aircraft);
• Explosive testing (e.g.,shipping and storagecontainers);
• Static rocket tests (relatedto the Trident SubmarineProgram); and
• Ground penetrator tests.
These activities require a remoterange for both public safety andto maintain national security. Themajority of test activities at TTRoccur within Cactus Flat, a valleywith almost no topographical
relief flanked by mountains andhills.
Site ResponsibilityOn October 1, 1997, aMemorandum of Agreement(MOA) was signed betweenDOE/SSO and the DOE/NSO inregards to operational testactivities at TTR (DOE 1994). Itwas determined that DOE/SSOis responsible for the oversight ofTTR; however, DOE/NSO willcontinue with the oversight of ERactivities at TTR. Environmentalprogram management, asdiscussed in this ASER, is a jointeffort between SandiaCorporation’s TTR and SandiaNational Laboratories, NM(SNL/NM) employees andcontractors with oversight fromDOE/SSO. In April 2002, a leaseagreement was signed betweenthe USAF and NNSA entitled,“Department of the Air ForcePermit to the National NuclearSecurity Administration To UseProperty Located On TheNevada Test and Training Range,Nevada.” The current size ofTTR is approximately 200 squaremiles (128,000 acres). Prior tothe April 2002 lease agreement,the footprint was 336,665 acres.
1.2 SITE DESCRIPTION ANDDEMOGRAPHICS
TTR is located within the NTTRat the northern boundary. Thearea north of the TTR boundaryis sparsely populated public landsadministered by both the U.S.Bureau of Land Management(BLM) and the U.S. ForestService (USFS). The land iscurrently used to graze cattle.There is a substantial irrigatedfarming operation to the north ofthe range as well. To the east ofTTR, and within the NTTR, is theNevada Wild Horse Range,which is also administered by theBLM.
The nearest residents are locatedin the town of Goldfield(population 659), approximately22 mi west of the site boundary.The town of Tonopah (population4,400) is approximately 30 minorthwest of the site(DOC 2004). Las Vegas,Nevada is 140 mi from TTR.The total population within a 50-mi radius around TTR isapproximately 7,000, whichincludes the potential populationat TTR if all housing units at thesite were occupied.
1.3 REGIONAL GEOLOGY,HYDROLOGY, CLIMATE,AND FAUNA
GeologyThe regional area around TTR islocated in the western part of theBasin and Range geophysicalprovince. This area is markedby horst and graben topography,a system of mountains and down-dropped fault valleys formedthrough regional extension. TTRlies northeast of the Walker Lane,a zone of transcurrent faultingand shear, and the Las VegasValley shear zone to thesoutheast (Sinnock 1982).
The Cactus Range to the westof TTR is the remnants of amajor volcanic center consistingof relatively young (six million-year-old) folded and faultedtertiary volcanics. This range isone of at least five northwesttrending, raised structural blocksthat lie along the Las VegasValley-Walker Lane lineaments(ERDA 1975).
Surface WaterDrainage patterns within and nearTTR are intermittent (ephemeralstream channels) and end inclosed basins. Ephemeralstreams occasionally carry springrunoff to the center of Cactus Flatwhere there is a string of north-south trending dry lakebeds;

TTR Introduction 1-5
however, due to the high rate ofevaporation, little is recharged tothe groundwater (DRI 1991).
There are several small springswithin the Cactus and KawichRanges. Three springs occurwithin TTR boundaries: Cactus,Antelope, and Silverbow Springs.Water from these springs doesnot travel more than several tensof meters dissipating rapidlythrough evaporation andinfiltration. The effect on thelandscape is purely local.
GroundwaterTTR obtains its water from localwells. The U.S. GeologicalSurvey (USGS) has recordedgroundwater depths from 21 to454 ft at the site. Groundwateris encountered at the AntelopeMine well in the Cactus Rangeat 21 ft and at the EH2 well nearthe TTR Airport at 454 ft. Thedepth to groundwater at the Area9 well located at the north end ofthe site is approximately 131 ft.South of the Area 9 well,groundwater is encountered at361 to 394 ft in Area 3. Thestatic water level at the mainwater supply well (Well 6) isapproximately 350 ft.
ClimateThe climate at TTR is typical ofhigh desert, mid-latitude locations,with large diurnal and seasonalchanges in temperature, andlittle total rainfall. Temperatureextremes on the test range can varyfrom a high near 40 ºC (104 ºF) inthe summer and approach -30 ºC(-22 ºF) in the winter. July andAugust are the hottest months withdaily highs ranging from 32 to 37ºC (90s ºF) and temperaturesbetween 10 and 15 ºC (50s ºF) atnight. January conditions varyfrom highs 5 to 10ºC (40s ºF) tolows -7 to -11ºC (teens ºF). Aneight-year climatology developedfrom data taken in the 1960sidentifies a record high of 38.8ºC(102 ºF) and a record low of -31ºC(-24 ºF) (Schaeffer 1970).
Rainfall, though sparse, isdependent on elevation. Annualaverage rainfall on the desertfloor is 4 inches with as much as12 inches falling in the mountains(USAF 1978).
Winds are generally from thenorthwest in the winter and earlyspring, switching to southerlydirections during the summer.The mountain/valley systemchannels the wind so that thewind seldom blows from the eastor southwest directions. Duststorms are common in the spring,when monthly average windspeeds reach 6.7 m/s (15 milesan hour). During the spring andfall months a diurnal cycle to thewind may be seen with northwestdrainage winds for a time, andsoutherly winds by afternoon.
VegetationTemperature extremes and aridconditions of the high desert limitvegetation coverage. Sparsevegetation that occurs in CactusFlat is predominantly rangegrasses and low shrubs typical ofthe Great Basin Desert flora(ERDA 1975; EG&G 1979).
Vegetation is divided into twobasic types at the site byelevation—salt desert shrub inthe low areas and northern desertshrub in the higher elevations(USAF 1978, DRI 1991). Saltdesert shrub is characteristic ofpoorly drained soils and iscommon along dry lakebeds.Specific plants in this group includeshadescale (Atriplex confertilfolia),Russian thistle (Salsola kali), andsagebrush (Artemesia tridentata).Northern desert shrub, found inthe Cactus Range, includes avariety of sagebrush, rabbitbrush(Chrysothamnus nauseosus),squirrel tail (Elymus longifolius),juniper (Juniperus), and Nevadabluegrass (Poa nevadensis).Joshua tree (Yucca brevifolia) andjuniper grow in the transitionzone at the base of the mountains.
WildlifeThe Nevada Wild Horse Rangeand other wild horse land-useareas compose a significantportion of the North Range withherds common in Cactus andGold Flats, Kawich Valley,Goldfield Hills, and the StonewallMountains. Hundreds of wildhorses (Equus caballus) grazefreely throughout TTR andactivities on-site have had littleaffect on the horse population ortheir grazing habits. The BLMroutinely rounds up a portion ofthe herds for dispersal through theHorse Adoption Program.
Other mammals common tothe area include pronghorn(Antilocapra americana), muledeer (Odocoileus hemionus), kitfox (Vulpes macrotis), bobcat(Zynx rufus), coyote (Canislatrans), and gray fox (Urocyoncinereoargenteus). To a lesserextent, bighorn sheep (Oviscanadensis), mountain lion (Felisconcolor), and burros (Equusasinus) are also present (USAF1978, DRI 1991).
In general, the NTTR landwithdrawal has provided apositive effect on local plant andanimal life. Since much of thewithdrawal area is undisturbed byhuman activity, large habitatareas are protected from theaffects of public use. Forexample, recreational off-roadvehicles can cause significantimpacts to desert flora and faunaand it can take years for fragiledesert ecosystems to recoverfrom disturbances.
1.4 CLEAN SLATE ANDDOUBLE TRACK SITES
In May and June 1963, ProjectRoller Coaster included a seriesof four nuclear weaponsdestruction tests that resulted inplutonium dispersal in thesurrounding soils. Three of thesetests were conducted within theboundaries of TTR; the fourth

2003 Annual Site Environmental Report, TTR & KTF1-6
was conducted on the NTTR justwest of TTR. The three ProjectRoller Coaster test sites at TTRare referred to as Clean Slates1, 2, and 3 (Figure 1-2). Thefourth test site at NTTR isreferred to as Double Tracks. In1996, Double Tracks was closedafter soil contamination wasremediated to a level of less thanor equal to 200 picocurie pergram (pCi/g) of transuranics.
Table 1-1 summarizes testinformation related to the fourProject Roller Coaster sites.DOE/NNSA/NSO is responsiblefor the remediation of these andall other ER sites (see Chapter3) at TTR. Sandia Corporationwill continue to be responsible forenvironmental compliance atthese sites.
The initial cleanup of each CleanSlate site was conducted shortlyafter each test. Test-relateddebris was bladed into a hole attest ground zero and backfilled.An initial fence was built around
each test area where the soilcontamination was set atapproximately 1,000 µg/m2 ofplutonium. The soil survey wasconducted on 61-m grids with ahand-held survey meter or fieldinstrument for the detection oflow-energy radiation (FIDLER).In 1973, additional outer fenceswere set at 40 pCi/g of plutoniumin soil also using the hand-heldmeter method. Soil sampling isconducted periodically at thesesites and the areas are visuallyinspected twice a year todetermine whether any fencerepairs are required. Any horsesthat may wander inside thefenced areas are promptlyrelocated.
In 1977, an aerial radiologicalsurvey was performed by EG&G,Inc. for the Nevada AppliedEcology Group (NAEG) (EG&G1995). The aerial radiologicalsurveys were undertaken tosupplement the FIDLER andprevious soil samplemeasurements of transuranics.
The objective was to determinethe extent of surficial distributionof plutonium and othertransuranic elements dispersedduring the Project Roller Coastertests. Radiation isopleths showingsoil activity due to americium-241(Am-241), plutonium-239 (Pu-239), and plutonium-240 (Pu-240)were drawn for each area. Thecumulative area of the diffusesources, as determined by theaerial radiological survey, is 20million m2 (approximately 4900acres). The results of the surveyfound transuranic contaminationoutside the fenced area in thedownwind direction (EG&G1995).
Air Monitoring at ER sitesRemediation activities wereconducted at Clean Slate 1 in1997. The Desert ResearchInstitute (DRI) collected airmonitoring data from severallocations in the vicinity of CleanSlate 1 before, during, and afterremediation activities. Althoughthese data have been validated,
Sandia
Moody A
venue
Main
Road S
outh
Gold Flat R
oad
Trailer Pass Road
Cedar Pass Road
Ave
nue 4
6
Lake Road
Drive
Main Gate
Base Housing
Airport Area
RangeOperations
Center
Antelope Lake(Dry)
Clean
Slate 3
Clean
Slate 1
Clean
Slate 2
Not to Scale
N
FIGURE 1-2. Location of Facilities Operated by SNL/NSO at TTR
G
old M
ountain Road
Mellan R
d
01_Fig_1-2_T T R .ai
Main
Road N
orth

TTR Introduction 1-7
TABLE 1-1. Project Roller Coaster Test Information
Test Name Date of Test Location Status
Clean Slate 1
May 25, 1963 TTR Closed
Clean Slate 2
May 31, 1963 TTR Remediation phase
Clean Slate 3
June 9, 1963 TTR Remediation has not started
Double Tracks May 15, 1963 NTTR, North Range (west of TTR)
Closed
NOTE: TTR = Tonopah Test Range NTTR = Nevada Test and Training Range Source : Sampling and Analysis Plan for Clean Slate 1, September 1996
(IT 1996)
they have only as of yet beenpresented to DOE/NSO in theform of a draft report (DRI 1997).A final report is pending. BechtelNevada has two air monitoringstations available for use at TTR.DOE/NSO suspended a i rmonitoring in April 2000 and willnot resume until active remediationefforts at the Clean Slate sitesbegin again. Clean Slates 1,2, 3, andDouble Tracks and a number ofother sites at the Nevada Test Siteare Corrective Action Units(CAUs) in the Soils Project, whichhas been suspended because ofcleanup level issues.

2003 Annual Site Environmental Report, TTR & KTF1-8
This page intentionally left blank.

Chapter Summary
Sandia Corporation is responsible for Environment, Safety, and Health (ES&H)compliance activities performed at Tonopah Test Range (TTR). A variety ofprograms at TTR work together to strive for 100 percent compliance with federal,state, and locally mandated regulations. TTR must adhere to strict reporting andpermitting requirements.
External and internal audits were conducted in 2003 to identify issues that mayhave arisen from operations at TTR. There was one reportable environmentaloccurrence at TTR in 2003.
In 2003, Sandia Corporation and Westinghouse Government Service cooperatedto ensure that TTR was in compliance with all permitting requirements.
There are many species of plants, animals, and insects that are protected underthe Endangered Species Act (ESA) in Nye County, Nevada (thereby potentiallyoccurring at TTR).
Chapter Two
TTR ComplianceSummary
Environmental Monitoring at TTR
Environmental Snap-
In this Chapter ...Compliance Status with
Federal Regulations2003Audits2003 Issues and Actions for
TTREnvironmental Permits
• In 2003, SandiaCorporationsubmitted fiveNationalEnvironmental PolicyAct (NEPA) Checkliststo the U.S. Departmentof Energy (DOE) forproposed projects atTTR.
Environmental Monitoring atTTR

2003 Annual Site Environmental Report, TTR & KTF2-2
This chapter discusses SandiaCorporation’s responsibility andthe status of ES&H compliancewith federal environmentalstatutes, regulations, ExecutiveOrders (EOs), and DOE Ordersapplicable to TTR.Environmental audit summaries,occurrence reporting, andenvironmental permit status for2003 are presented in thischapter.
Sandia Corporation and the DOE,National Nuclear SecurityAdministration (NNSA) strive tomeet 100 percent compliancewith environmental laws,regulations, and otherrequirements established byfederal and state agencies. TheState of Nevada administersmost environmental regulationsapplicable to TTR. Specific stateregulations listed in Chapter 6include regulations governingsolid and hazardous wastemanagement, wildlife,wastewater effluent, andradiation control. Radionuclideair emission regulations areadministered directly by the U.S.Environmental ProtectionAgency (EPA).
2.1 COMPLIANCE STATUS
WITH FEDERAL
REGULATIONS
This section summarizes DOEand Sandia Corporation’scompliance status with majorenvironmental regulations,statutes, EOs, and DOE Ordersthat pertain to the environment.
Major federal laws applicable toenvironmental compliance atTTR are presented on page 2-3(see shaded box).
2.1.1 ComprehensiveEnvironmentalResponse,Compensation, andLiability Act(CERCLA)
CERCLA defines assessmentactivities and reportingrequirements for inactive wastesites at federal facilities. Asrequired by CERCLA, aPreliminary Assessment (PA)was submitted in 1988 for allfacilities listed on the federalagency hazardous wastecompliance docket. Sites withsignificant contamination wereput on the National Priorities List(NPL) for cleanup (EPA 2004).There are no NPL or“Superfund” sites located atTTR.
Additional CERCLArequirements are given in theSuperfund Amendments andReauthorization Act (SARA)Title III for reportable quantity(RQ) releases and chemicalinventory reporting. SandiaCorporation at TTR was in fullcompliance with CERCLA,SARA, and RQ in 2003. Table2-1 lists SARA Title III reportingrequirements.
2.1.2 Emergency Planningand Community Right-to-KnowAct(EPCRA)
SARA Title III (also known asEPCRA) requires the submittalof a Toxic Release Inventory(TRI) report for chemicalreleases over a given thresholdquantity (TQ). The releasereporting limit for lead is 100 lbs.The TTR Firing Range releasedapproximately 741 lbs of non-recovered lead in 2003. This
information will be reported in theReporting Year (RY) 2003 TRIReport.
2.1.3 ResourceConservation andRecovery Act(RCRA)
Under the RCRA HazardousWaste Permit Program (40 CFR270), TTR is permitted as a“small quantity generator.”Under this designation, hazardouswaste can only be stored on-sitefor 270 days before it must beshipped off-site for treatment anddisposal at an EPA-permittedfacility. At TTR, hazardous wasteshipments are scheduled to occurat least two to three times a year.
Sanitary solid waste, which isalso regulated under RCRA, isdisposed of at landfills on-site.There is one Class II sanitarylandfill in operation at TTRoperated by the U.S. Air Force(USAF) Operations andMaintenance (O&M) contractor.The landfill is used cooperativelyby all organizations at TTR.
Underground Storage Tanks(USTs) and AbovegroundStorage Tanks (ASTs) –RCRA, Subchapter I (40 CFR280) sets forth requirements forUSTs that contain hazardousmaterials or petroleum products.There are no USTs requiringregistration at TTR. The last fiveUSTs (two diesel tanks and twogasoline tanks were removedfrom Area 3 at the site of a formergas station and one diesel tankwas removed from Area 9 thathad supplied generator fuel) wereremoved in August 1995. Thereare no ASTs requiring registrationwith the State of Nevada at TTR.

TTR Compliance Summary 2-3
Major Environmental Regulations & Statutes Applicable to TTR
Clean Air Act (CAA) and CAA Amendments (CAAA )Provides standards to protect the nation’s air quality http://www.epa.gov/oar/oaq_caa.html
Clean Water Act (CWA)Provides general water quality standards to protect the nation’s water sources and bywayswww.epa.gov/region5/water/cwa.htm
Comprehensive Environmental Response, Compensation, and Liability Act (CERCLA)Provides federal funding for cleanup of inactive waste sites on the National Priorities List (NPL) andmandates requirements for reportable releases of hazardous substanceswww.epa.gov/region5/defs/html/cercla.htm
Cultural resources actsIncludes various acts that protect archeological, historical, religious sites, and resourceshttp://water.usgs.gov/eap/env_guide/cultural.html
Endangered Species Act (ESA)Provides special protection status for federally-listed endangered or threatened specieswww.epa.gov/region5/defs/html/esa.htm
Executive Orders (EOs)Several EOs provide specific protection for wetlands, floodplains, environmental justice in minority andlow-income populations, and greening the government through leadership in environmental managementwww.archives.gov/federal_register/executive_order/disposition_table.html
Federal Facility Compliance Act (FFCA)Directs federal agencies regarding environmental compliancehttp://tis.eh.doe.gov/oepa/laws/ffca.htm
Federal Insecticide, Fungicide, and Rodenticide Act (FIFRA)Controls the distribution and use of various pesticides www.epa.gov/region5/defs/html/fifra.htm
Migratory Bird Treaty Act (MBTA) of 1918Prevents the taking, killing, possession, transportation and importation of migratory birds, their eggs,parts, and nests http://tis.eh.doe.gov/oepa/laws/mbta.html
National Emission Standards for Hazardous Air Pollutants (NESHAP)Specifies standards for radionuclide air emissions and other hazardous air releaseswww.epa.gov/radiation/neshaps/
National Environmental Policy Act (NEPA)Ensures that federal agencies review all proposed activities and include environmental consideration inagency decision-making http://tis.eh.doe.gov/NEPA/
Resource Conservation and Recovery Act (RCRA)Mandates the management of solid and hazardous waste and certain materials stored in undergroundstorage tanks (USTs) www.epa.gov/region5/defs/html/rcra.htm
Safe Drinking Water Act (SDWA)Provides specific standards used for drinking water sources www.epa.gov/safewater/sdwa/sdwa.html
Superfund Amendments and Reauthorization Act (SARA) SARA,Title III, also known as the EmergencyPlanning and Community-Right-to-Know Act (EPCRA), mandates communication standards for hazardousmaterials over a threshold amount that are stored or used in a community
www.epa.gov/region5/defs/html/sara.htm
Toxic Substance Control Act (TSCA)Specifies rules for the manufacture, distribution, and disposal of specific toxic materials such as asbestosand polychlorinated biphenyls (PCBs) www.epa.gov/compliance/civil/federal/tsca.html

2003 Annual Site Environmental Report, TTR & KTF2-4
2.1.4 Federal FacilityCompliance Act(FFCA)
The FFCA amendments toRCRA specifically address LandDisposal Restriction (LDR)requirements for the treatment ofmixed waste (MW) at federalfacilities. Since TTR does notgenerate MW and currently hasno MW stored on-site, thisstatute is not applicable to SandiaCorporation’s operations at TTR.
2.1.5 Clean Air Act (CAA)and Clean Air ActAmendments(CAAA) of 1990
CAA and CAAA of 1990requirements are regulated by the
State of Nevada air qualityregulations. Air emissions fromnon-radionuclide sources, such asa screening plant and a portablescreen, are permitted under aClass II Air Quality Permit.Sandia Corporation tracksemissions and pays a fee to theState of Nevada based on thetotal standard tons emitted.Sandia Corporation met all airquality permit conditions in 2003.
National Emission Standardsfor Hazardous Air Pollutants(NESHAP) ComplianceThe EPA retains complianceauthority for all radionuclide airreleases, which are regulated byNESHAP and implementedunder 40 CFR 61, Subpart H.
TABLE 2-1. 2003 SARA Title III (or EPCRA) Reporting Requirements Applicable to TTR Requires
Reporting? Section SARA Title III
Section Title
Yes No
Description
302 - 303 Notification/ Plans
! Sandia Corporation submits an annual report listing chemical inventories above the reportable Threshold Planning Quantities listed in 40 CFR Part 355 Appendix B, location of the chemicals and emergency contacts. The report is prepared for the DOE/NNSA/SSO, which distributes it to the required entities.
304 Emergency Notification
! No RQ releases of an EHS, or as defined under CERCLA, occurred in 2003.
311-312 MSDSs/ Chemical Purchase Inventory Report
! There are two “Community Right-to-Know” reporting requirements: (a) Sandia National Laboratories CIS Program completes the EPA Tier II forms for all hazardous chemicals present at the facility at any one time in amounts equal to or greater than 10,000 lbs and for all EHSs present at the facility in an amount greater than or equal to 500 lbs or the Threshold Planning Quantity, whichever is lower; (b) TTR provides MSDSs for each chemical entry on a Tier II form unless it decides to comply with the EPA’s alternative MSDS reporting, which is detailed in 40 CFR Part 370.21.
313 Toxic Chemical Release Forms
! EPCRA, Section 313, requires that facilities that use toxic chemicals listed in SARA Title III over a threshold value must submit a TRI report. For RY 2003, a report was submitted for lead.
NOTE: MSDS = Material Safety Data Sheets (gives relevant chemical information) RQ = reportable quantity EHS = extremely hazardous substance TRI = Toxic Release Inventory DOE = U.S. Department of Energy SSO = Sandia Site Office EPA = U.S. Environmental Protection Agency NNSA = National Nuclear Security Administration RY = reporting year CIS = Chemical Inventory System lbs = pounds CERCLA = Comprehensive Environmental Response, Compensation, and Liability Act EPCRA = Emergency Planning and Community Right-to-Know Act SARA = Superfund Amendments and Reauthorization Act
The Clean Slate sites, asdiscussed in Chapter 1, have beenthe only source of radionuclide airemissions at TTR. Continuousair monitoring was conductedfrom February 22, 1996 toFebruary 25, 1997 (SNL 1997).The TTR Airport was determinedto be the location of themaximally exposed individual(MEI). The result of0.024 millirems per year (mrem/yr)was below the threshold of 0.1mrem/yr for which continuous airmonitoring would be required andapproximately 400 times less thanthe EPA standard of 10 mrem/yr.The NESHAP Annual Reportfor CY 2003 and Chapter 4 ofthis report discuss thesemonitoring results (SNL 2004).
TTR Compliance Summary 2-5
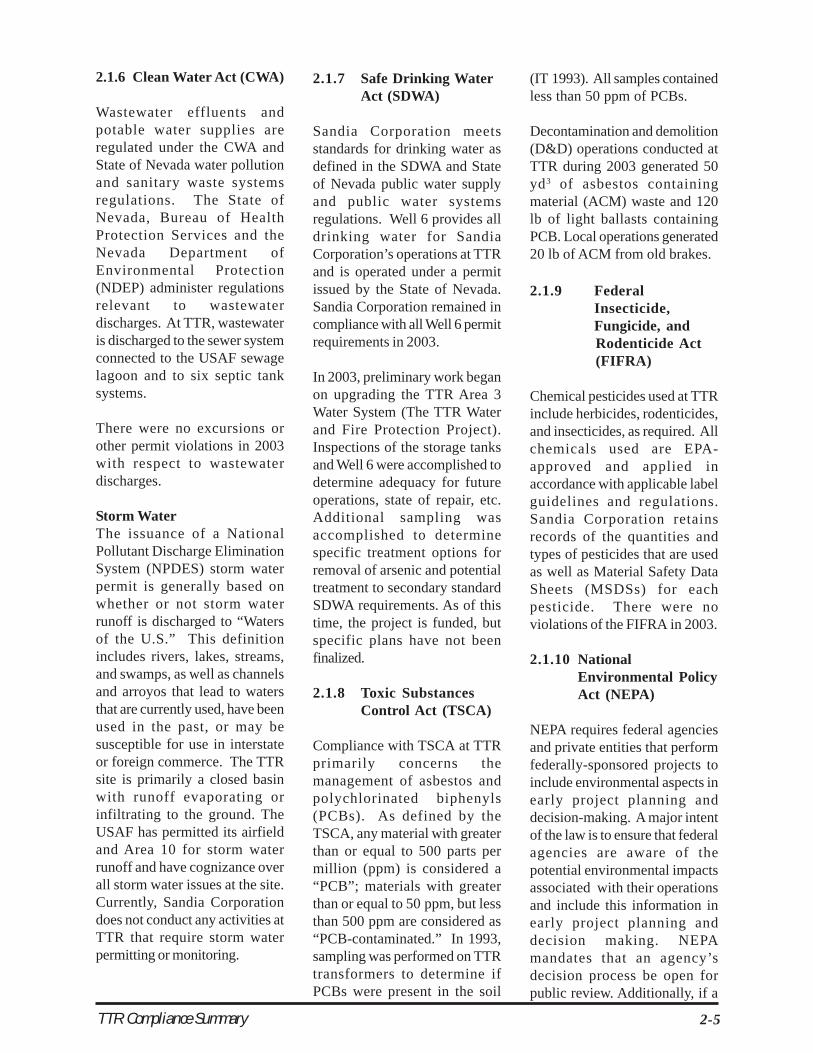
2.1.6 Clean Water Act (CWA)
Wastewater effluents andpotable water supplies areregulated under the CWA andState of Nevada water pollutionand sanitary waste systemsregulations. The State ofNevada, Bureau of HealthProtection Services and theNevada Department ofEnvironmental Protection(NDEP) administer regulationsrelevant to wastewaterdischarges. At TTR, wastewateris discharged to the sewer systemconnected to the USAF sewagelagoon and to six septic tanksystems.
There were no excursions orother permit violations in 2003with respect to wastewaterdischarges.
Storm WaterThe issuance of a NationalPollutant Discharge EliminationSystem (NPDES) storm waterpermit is generally based onwhether or not storm waterrunoff is discharged to “Watersof the U.S.” This definitionincludes rivers, lakes, streams,and swamps, as well as channelsand arroyos that lead to watersthat are currently used, have beenused in the past, or may besusceptible for use in interstateor foreign commerce. The TTRsite is primarily a closed basinwith runoff evaporating orinfiltrating to the ground. TheUSAF has permitted its airfieldand Area 10 for storm waterrunoff and have cognizance overall storm water issues at the site.Currently, Sandia Corporationdoes not conduct any activities atTTR that require storm waterpermitting or monitoring.
2.1.7 Safe Drinking WaterAct (SDWA)
Sandia Corporation meetsstandards for drinking water asdefined in the SDWA and Stateof Nevada public water supplyand public water systemsregulations. Well 6 provides alldrinking water for SandiaCorporation’s operations at TTRand is operated under a permitissued by the State of Nevada.Sandia Corporation remained incompliance with all Well 6 permitrequirements in 2003.
In 2003, preliminary work beganon upgrading the TTR Area 3Water System (The TTR Waterand Fire Protection Project).Inspections of the storage tanksand Well 6 were accomplished todetermine adequacy for futureoperations, state of repair, etc.Additional sampling wasaccomplished to determinespecific treatment options forremoval of arsenic and potentialtreatment to secondary standardSDWA requirements. As of thistime, the project is funded, butspecific plans have not beenfinalized.
2.1.8 Toxic SubstancesControl Act (TSCA)
Compliance with TSCA at TTRprimarily concerns themanagement of asbestos andpolychlorinated biphenyls(PCBs). As defined by theTSCA, any material with greaterthan or equal to 500 parts permillion (ppm) is considered a“PCB”; materials with greaterthan or equal to 50 ppm, but lessthan 500 ppm are considered as“PCB-contaminated.” In 1993,sampling was performed on TTRtransformers to determine ifPCBs were present in the soil
(IT 1993). All samples containedless than 50 ppm of PCBs.
Decontamination and demolition(D&D) operations conducted atTTR during 2003 generated 50yd3 of asbestos containingmaterial (ACM) waste and 120lb of light ballasts containingPCB. Local operations generated20 lb of ACM from old brakes.
2.1.9 FederalInsecticide,Fungicide, andRodenticide Act(FIFRA)
Chemical pesticides used at TTRinclude herbicides, rodenticides,and insecticides, as required. Allchemicals used are EPA-approved and applied inaccordance with applicable labelguidelines and regulations.Sandia Corporation retainsrecords of the quantities andtypes of pesticides that are usedas well as Material Safety DataSheets (MSDSs) for eachpesticide. There were noviolations of the FIFRA in 2003.
2.1.10 NationalEnvironmental PolicyAct (NEPA)
NEPA requires federal agenciesand private entities that performfederally-sponsored projects toinclude environmental aspects inearly project planning anddecision-making. A major intentof the law is to ensure that federalagencies are aware of thepotential environmental impactsassociated with their operationsand include this information inearly project planning anddecision making. NEPAmandates that an agency’sdecision process be open forpublic review. Additionally, if a

2003 Annual Site Environmental Report, TTR & KTF2-6
proposed action is determined tohave environmentally“significant” impacts, the agencymust prepare an environmentalassessment (EA) or anenvironmental impact statement(EIS) before an irretrievablecommitment of resources orfunding occurs. Although a majorobjective of NEPA is to preservethe environment for futuregenerations, the law does notrequire an agency to select theproposed action alternative withthe least environmental impacts.2003 NEPA activities arediscussed in Section 3.4.
2.1.11 Endangered SpeciesAct (ESA)
The ESA applies to both privateindividuals and federal agencies.Federal agencies must ensurethat any action authorized,funded, or carried out by themwill not jeopardize the continuedexistence of a threatened orendangered species, or result inadverse modifications of itshabitat. The ESA is addressedunder the NEPA Program andEcology Program. If potentiallysignificant impacts to sensitivespecies or habitats are found asa result of the proposed action,an EA or an EIS must beprepared.
Table 2-2 lists all Federal andState protected species occurringwithin Nye County; therefore,having the potential to occur atTTR.
2.1.12 Migratory Bird TreatyAct (MBTA)
The MBTA of 1918, as amended,was established between theconventions of Canada, Japan,Russia, Mexico, and the United
States. The MBTA prevents thetaking, killing, possession,transportation and importation ofmigratory birds, their eggs, parts,and nests. Federal institutionsare not exempt from the MBTA.New guidance is being developedby the U.S. Fish and WildlifeService to assist federalinstitutions in interpreting this Act.At Sandia Corporation’s TTR, theMBTA is coordinated withNEPA compliance reviews andEcology Program.
2.1.13 Cultural ResourcesActs
Federal cultural resourcesmanagement responsibilities areapplicable to activities at TTR.These include but are not limitedto compliance with the followinglaws and their associatedregulations:
• National Historic Preservation Act (NHPA)• Archaeological Resources Protection Act (ARPA)• American Indian Religious Freedom Act (AIRFA)
DOE/NNSA/SSO is responsiblefor determining the level ofapplicability of cultural resourcesrequirements. In 2003, SandiaCorporation’s operations did notimpact any known culturalresources sites at TTR.
2.1.14 EnvironmentalCompliance EOs
EO 11988, FloodplainManagement, as amended, andEO 11990, Protection ofWetlands, as amended, requireevaluation of the potential effectsof actions taken in theseenvironmentally sensitive areas.There are no floodplains or
significant wetlands at TTR;however, some very limitedwetlands exist in the vicinity ofseveral springs. These providean important source of drinkingwater for wildlife in the area.Sandia Corporation complies withall applicable mandates stated inthese EOs.
EO 12898, Federal Actions toAddress Environmental Justicein Minority Populations andLow-Income Populations, asamended, requires that to thegreatest extent practicable andpermitted by law, and consistentwith the principles set forth in theReport on the NationalPerformance Review (Gore1993), each federal agency shallmake achieving environmentaljustice part of its mission byidentifying and addressing, asappropriate, disproportionatelyhigh and adverse human healthor environmental effects of itsprograms, policies, and activitieson minority populations and low-income populations in the UnitedStates and its territories andpossessions. Sandia Corporationmust include in the assessmentof its operations anydisproportionate impacts onminority or low-incomepopulations within the area ofinfluence of the Laboratories’operations.
EO 13148, Greening theGovernment ThroughLeadership in EnvironmentalManagement, requires federalagencies to ensure that “allnecessary actions are taken tointegrate environmentalaccountability into agency day-to-day decision-making and long-term planning processes, acrossall agency missions, activities,and functions.” Among theprimary agency goals is support

TTR Compliance Summary 2-7
TABLE 2-2. Protected Species Potentially Occurring in Nye County, Nevada
Common Name Scientific Name Federal Status State of Nevada
Status PLANTS Sodaville milkvetch Astragalus lentiginosus var. sesquimetralis -- State Protected Halfring milkvetch Astragalus mohavensis var hemigyrus -- State Protected Milkvetch Astragalus phoenix Threatened State Protected Spring-loving centaury Centaurium namophilum Threatened State Protected Ash Meadows sunray Enceliopsis nudicaulis var. corrugata Threatened State Protected Sunnyside green gentian Frasera gypsicola -- State Protected Ash Meadows gumplant Grindelia fraxinopratensis Threatened State Protected Ash Meadows ivesia Ivesia kingii var. eremica Threatened State Protected Ash Meadows blazingstar Mentzelia leucophylla Threatened State Protected Amargosa niterwort Nitrophila mohavensis Endangered State Protected Sand cholla Opuntia pulchella -- State Protected Williams combleaf Polyctenium williamsiae -- State Protected Tonopah fishhook cactus Sclerocactus nyensis -- State Protected Hermit cactus Sclerocactus polyancistrus -- State Protected INSECTS Ash Meadows naucorid Ambrysus amargosus Threatened FISH White River desert sucker Catostomus clarki intermedius -- State Protected Moorman White River springfish Crenichthys baileyi thermophilus -- State Protected Railroad Valley springfish Crenichthys nevadae Threatened State Protected Devils Hole pupfish Cyprinodon diabolis Endangered State Protected Ash Meadows Amargosa pupfish Cyprinodon nevadensis mionectes Endangered State Protected Warm Springs Amargosa pupfish Cyprinodon nevadensis pectoralis Endangered State Protected Pahrump poolfish Empetrichthys latos latos Endangered State Protected Big Smoky Valley tui chub Gila bicolor ssp. -- State Protected Hot Creek Valley tui chub Gila bicolor ssp. -- State Protected Little Fish Lake Valley tui chub Gila bicolor ssp. -- State Protected Railroad Valley tui chub Gila bicolor ssp. -- State Protected White River spinedace Lepidomeda albivallis Endangered State Protected Moapa dace Moapa coriacea Endangered State Protected Lahontan cutthroat trout Oncorhynchus clarki henshawi Threatened State Protected Big Smoky Valley speckled dace Rhinichthys osculus lariversi -- State Protected Nevada speckled dace Rhinichthys osculus nevadensis Endangered State Protected AMPHIBIANS Amargosa toad Bufo nelsoni -- State Protected REPTILES Banded Gila monster Heloderma suspectum cinctum -- State Protected Desert tortoise (Mojave Desert pop.)
Gopherus agassizii Threatened State Protected
MAMMALS Spotted bat Euderma maculatum -- State Protected Pygmy rabbit Brachylagus idahoensis -- State Protected BIRDS Northern goshawk Accipiter gentilis -- State Protected Western burrowing owl Athene cunicularia hypugaea -- State Protected Ferruginous hawk Buteo regalis -- State Protected Swainson's hawk Buteo swainsoni -- State Protected Sage grouse Centrocercus urophasianus -- State Protected Western snowy plover Charadrius alexandrinus nivosus Threatened State Protected Mountain Plover Charadrius montanus Proposed Threatened State Protected Black tern Chlidonias niger -- State Protected Western least bittern Ixobrychus exilis hesperis -- State Protected Flammulated owl Otus flammeolus -- State Protected Phainopepla Phainopepla nitens -- State Protected White-faced Ibis Plegadis chihi -- State Protected Yuma clapper rail Rallus longirostris yumanensis Endangered State Protected

2003 Annual Site Environmental Report, TTR & KTF2-8
to the development andimplementation of environmentalcompliance audit programs andpolicies “that emphasize pollutionprevention as a means to bothachieve and maintainenvironmental compliance.”Sandia Corporation is workingunder guidance from DOE/NNSA/SSO toward compliancewith this EO.
2.2 2003 AUDITS
Table 2-3 lists audits conductedin 2003, including an assessmentmade by Sandia Corporation.
2.3 2003 ISSUES AND
ACTIONS FOR TTR
Ongoing self-assessments ofSandia Corporation’s compliancestatus continue to identifycompliance issues. Resolution ofthese issues is coordinated withregulatory agencies to ensurethat they are adequatelyaddressed.
Federal Facility Agreementand Consent Order (FFACO)Compliance for ER ActivitiesAn ongoing action started in 1996is the FFACO with the State of
TABLE 2-3. Summary of Environmental Audits Performed at TTR in 2003 Type/Subject Date Audit Organization Findings Summary
Hazardous Waste Management
July 7 – 10 NNSA/SSO There were no findings.
Safe Drinking Water Protection Program
July 7 – Sept. 26 NNSA/SSO The Safe Drinking Water Protection Program Assessment identified five findings mostly related to TTR’s old drinking water distribution system. These findings will be corrected once construction begins on the TTR Water and Fire Protection Replacement Project in late 2004.
Wastewater Sampling July 7 – Sept. 8 NNSA/SSO There were no findings. NOTE: NNSA/SSO = National Nuclear Security Administration, Sandia Site Office TTR = Tonopah Test Range
Nevada. This agreement wasimplemented in May 1996between the State of Nevada,DOE, and the U.S. Departmentof Defense (DoD) (DoD/DOE/State of NV 1996). All DOEcleanup activities in the State ofNevada must be conducted inconformance with therequirements of this agreement.The FFACO is an enforceableagreement with stipulatedpenalties for violations. The ERsites for which DOE hasassumed responsibility, and whichare subject to the FFACO:
• NTS,• Areas within TTR,• Areas within the NTTR,• Central Nevada Test Area,
and• Project Shoal Area (east of
Carson City in ChurchillCounty).
A summary of DOE/NNSA’s ERsites in Nevada can be found inthe FFACO report(DOD/DOE/State of NV 1996).The list of sites has been modifiedfor consistency with NDEPrequirements and grouped intoCorrective Action Units (CAUs),which are listed by Corrective
Action Site (CAS) numbers.Each CAU is listed in the FFACOunder Appendices II (inactiveCAUs) and III (active CAUs)and are updated every sixmonths. A listing of ER siteslocated at TTR is shown inChapter 3, Table 3-1.
2.4 ENVIRONMENTAL
PERMITS
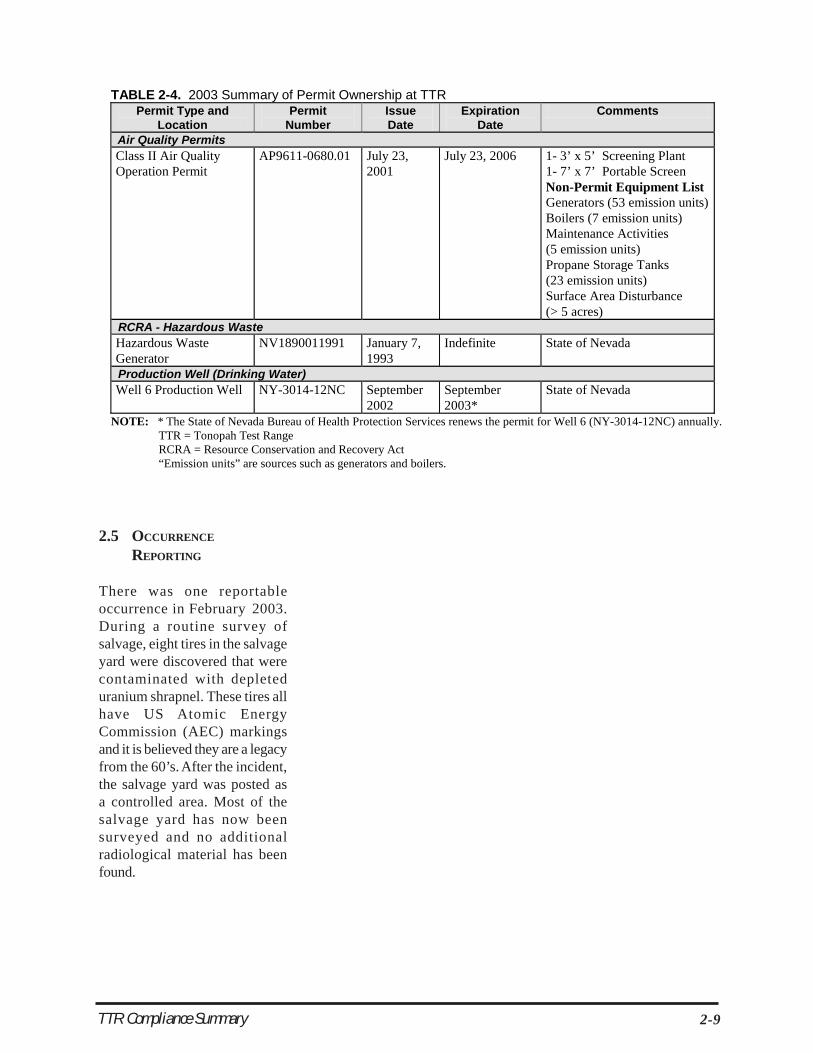
Environmental compliancepermits for TTR include those forpotable water supply, RCRA, andspecific air emission units, suchas generators. The permitapplication and registration ofSandia Corporation activities atTTR are issued directly by theState of Nevada to eitherDOE/NNSA, Nevada Site Office(NSO) or DOE/NNSA/SSO andadministered by WestinghouseGovernment Service. SandiaCorporation and WestinghouseGovernment Service ensure thatall permit conditions are met.Table 2-4 lists all permits andregistrations in effect in 2003.TTR was in full compliance withall permitting requirements for2003.
TTR Compliance Summary 2-9
TABLE 2-4. 2003 Summary of Permit Ownership at TTR Permit Type and
Location Permit
Number Issue Date
Expiration Date
Comments
Air Quality Permits Class II Air Quality Operation Permit
AP9611-0680.01 July 23, 2001
July 23, 2006 1- 3’ x 5’ Screening Plant 1- 7’ x 7’ Portable Screen Non-Permit Equipment List Generators (53 emission units) Boilers (7 emission units) Maintenance Activities (5 emission units) Propane Storage Tanks (23 emission units) Surface Area Disturbance (> 5 acres)
RCRA - Hazardous Waste Hazardous Waste Generator
NV1890011991 January 7, 1993
Indefinite State of Nevada
Production Well (Drinking Water) Well 6 Production Well NY-3014-12NC September
2002 September 2003*
State of Nevada
NOTE: * The State of Nevada Bureau of Health Protection Services renews the permit for Well 6 (NY-3014-12NC) annually. TTR = Tonopah Test Range RCRA = Resource Conservation and Recovery Act “Emission units” are sources such as generators and boilers.
2.5 OCCURRENCE
REPORTING
There was one reportableoccurrence in February 2003.During a routine survey ofsalvage, eight tires in the salvageyard were discovered that werecontaminated with depleteduranium shrapnel. These tires allhave US Atomic EnergyCommission (AEC) markingsand it is believed they are a legacyfrom the 60’s. After the incident,the salvage yard was posted asa controlled area. Most of thesalvage yard has now beensurveyed and no additionalradiological material has beenfound.

2003 Annual Site Environmental Report, TTR & KTF2-10
This page intentionally left blank.

Chapter ThreeTTREnvironmentalProgramsInformationChapter Summary
The Environmental Restoration (ER) Project, the Waste ManagementProgram, and the National Environmental Policy Act (NEPA) Program aresome of the programs and activities Sandia Corporation’s Tonopah Test Range(TTR) utilizes to meet compliance with various state and federal regulations,Executive Orders (EOs), and U.S. Department of Energy (DOE) Orders.
In 2003, Sandia Corporation progressed with many environmental initiatives.The ER Project generated 3,176,047 kg (6,987,303 lb) of non-ResourceConservation and Recovery Act (RCRA) waste, 3 kg (7 lb) of RCRA waste,and 108,862 kg (239,496 lb) of low-level waste (LLW) at cleanup sitesthroughout TTR.
TTR is dedicated to significantly reducing the amount of chemical andhazardous wastes generated on-site, which includes recycling and recoveryof various materials, such as solvents, fuels, and oil.
Environmental Snapshot
In this Chapter ...ER Project ActivitiesWaste Management ProgramsSpill Prevention Control and Countermeasures (SPCC)PlanNEPA ProgramEnvironmental Monitoring Performed by Outside AgenciesSummary of Release Reporting
Wild Horses at TTR
• There were no shipmentsof radioactive waste at TTR
in 2003.
Wild horses at TTR

2003 Annual Site Environmental Report, Tonopah Test Range3-2
Programs and activities discussedin this chapter include the ERProject, the Waste ManagementProgram, NEPA complianceactivities, and environmentalmonitoring by outside agencies.Terrestrial surveillance, drinkingwater, wastewater, and air qualityprograms are discussed inChapter 4 of this report.
3.1 ER PROJECT ACTIVITIES
The ER Project at TTR began in1980 to address contaminationresulting primarily from nuclearweapons testing and relatedsupport activities. In late 1992and early 1993, an agreement wasreached between DOEHeadquarters (HQ), the DOE/National Nuclear SecurityAdministration (NNSA) ServiceCenter and the DOE, NevadaSite Office (NSO) regarding themanagement of ER activities atTTR. The decision was made todesignate the responsibility of allER sites to DOE/NSO.
Since 1996, cleanup activities forsites located in the State ofNevada have been regulated bythe Federal Facility Agreementand Consent Order (FFACO)(DoD/DOE/State of NV 1996).The FFACO was negotiatedbetween DOE/SSO, the NevadaDivision of EnvironmentalProtection (NDEP), and the U.S.Department of Defense (DoD).The FFACO took effect on May10, 1996 and accomplished thefollowing:
• Established a framework foridentifying Corrective ActionSites (CASs),
• Grouped CASs intoCorrective Action Units(CAUs),
• Prioritized CAUs, and• Implemented corrective
action activities.
The FFACO is also discussed inSection 2.3. CAUs located atTTR are addressed by two ERDivision Projects:
(1) Industrial Sites Project –Past sites used to support nucleartesting activities, and
(2) Soil Sites Project – Areaswhere tests resulted in extensivesurface and/or shallowsubsurface contamination.
ER site contamination includesradiological (e.g., depleteduranium [DU] and plutonium)and non-radiological constituents(e.g., artillery, solvents, septicsludges, and heavy metals).
CAS IdentificationThe initial identification,description, and listing of CASsat TTR were derived from thePreliminary Assessment (PA)and the Federal FacilityPreliminary Assessment Review(E&E 1989). In 1993, thepotential TTR CASs identified inthe PA were subdivided into four“Soil Sites CAUs” and 43“Industrial Sites CAUs.”Twelve additional potential CASsnot included in the PA were alsoidentified. These CASs wereidentified through:
• ER sites inventory process,• Ordnance removal activities,• Geophysical surveys,• Former worker interviews,• Archive reviews,• Site visits, and• Aerial radiological and
multispectral surveys(1993 to 1996).
The remediation activities at theClean Slate and Double Trackssites (Project Roller Coaster) arediscussed in Chapter 1. Thesesites are listed under Soil SitesCAUs/CASs in Table 3-1 asCAU-411, -412, -413, and -414.
Table 3-1 summarizes the existingIndustrial and Soil Sites CAUsand CASs at TTR. The ERactivities planned for these CASsrange from “no activitiescurrently planned” to “NDEP-approved closure.” The CASinformation presented in Table 3-1 is contained in Appendices II,III, and IV of the FFACO (DoD/DOE/State of NV 1996).
2003 ER ActivitiesIn 2003, cleanup activitiescompleted at ER sites generateda total of 3,284,909 kg (7,226,800lb) of waste including 3,176,047kg (6,987,303 lb) of non-RCRAwaste, 3 kg (7 lb) of RCRAwaste, and 108,862 kg (239,496lb) of low-level waste (LLW). Atotal of 1,443,914 kg (3,176,611lb) of non-RCRA waste, 108,862kg (239,496 lb) of LLW waste,was shipped to the Nevada TestSite (NTS) for disposal. TheRCRA waste included spentfield-testing kits and associateddebris. All RCRA-hazardouswaste will be shipped off-site topermitted treatment, storage, anddisposal (TSD) facilities in 2004.Non-RCRA waste consisted of1,436,088 kg (3,159,393 lb) ofhydrocarbon-impacted soil, 750kg (1,650 lb) of non-impactedpersonal protective equipment(PPE), 7,076 kg (15,567 lb) ofinert ordinance debris, and1,732,133 kg (3,818,700 lb) ofconstruction debris. Much of thewaste discussed was generatedfrom three large trenches underCAU-410 in 2003. This site wasclosed in December of 2003.

TTR Environmental Programs Information 3-3
TABLE 3-1. DOE/NNSA/NSO ER Project TTR CAUs and CASs Calendar Year (CY) 2003 Status Industrial Sites CAUs/CASs
CAS Number CAS Description General Location CAU-400 - Closed Bomblet Pit and Five Points Landfill, TTR TA-19-001-05PT Ordnance Disposal Pit Five Points Intersection TA-55-001-TAB2 Ordnance Disposal Pit Bunker 2 Road CAU-401 - Closed Area 3 Gas Station UST Site, TTR 03-02-003-0357 UST, Gas First Gas Station, Area 3 CAU-402 - Closed Area 3 Bldg. 0353 UST Site, TTR 03-02-001-0353 UST, Diesel Bldg. 0353 CAU-403 - Closed Area 3 Second Gas Station UST, TTR 03-02-004-0360 USTs Second Gas Station CAU-404 - Closed Roller Coaster Lagoons and Trench, TTR TA-03-001-TARC Roller Coaster Lagoons NW of Antelope Lake TA-21-001-TARC Roller Coaster North Disposal Trench NW of Antelope Lake CAU-405 – Closed Area 3 Septic Systems, TTR 03-05-002-SW03 Septic Waste System Area 3 03-05-002-SW04 Septic Waste System Area 3 03-05-002-SW07 Septic Waste System Area 3 CAU-406 - Closed Area 3 Bldg. 03-74 and Bldg. 03-58 UDPs, TTR 03-51-002-0374 Heavy Duty Shop UDP, Sumps Bldg. 0374 03-51-003-0358 UPS Building UDP UPS Building, Area 3 CAU-407 - Closed Roller Coaster Rad Safe Area, TTR TA-23-001-TARC Roller Coaster Rad Safe Area Northwest of Antelope Lake CAU-408 - Not Started Bomblet Target Area, TTR TA-55-002-TAB2 Bomblet Target Areas Antelope Lake CAU-409 - Closed Other Waste Sites, TTR RG-24-001-RGCR Battery Dump Site Cactus Repeater TA-53-001-TAB2 Septic Sludge Disposal Pit Bunker 2 TA-53-002-TAB2 Septic Sludge Disposal Pit Bunker 2 CAU-410 - Closed Area 9 Underground Vault and Disposal Trench, TTR 09-21-001-09MG Former Bunker or Underground Vault East of Area 9 Magazines 09-21-001-TA09 Disposal Trenches Area 9 TA-19-002-TAB2 Debris Mound Bunker 2 TA-21-003-TANL Disposal Trench NEDS Lake TA-21-002-TAAL Disposal Trench South Antelope Lake
Refer to notes at end of table.

2003 Annual Site Environmental Report, Tonopah Test Range3-4
TABLE 3-1. DOE/NNSA/NSO ER Project TTR CAUs and CASs CY 2003 Status (continued) Industrial Sites CAUs/CASs
CAS Number CAS Description General Location CAU-423 – Closed Area 3 UDP, Bldg. 0360, TTR 03-02-002-0308 UDP Bldg. 0360 03-02-002-0308 UDP Bldg. 0360 CAU-424 - Closed Area 3 Landfill Complex, TTR 03-08-001-A301 Landfill Cell A3-1 Area 3 Landfill Complex 03-08-002-A302 Landfill Cell A3-2 Area 3 Landfill Complex 03-08-002-A303 Landfill Cell A3-3 Area 3 Landfill Complex 03-08-002-A304 Landfill Cell A3-4 Area 3 Landfill Complex 03-08-002-A305 Landfill Cell A3-5 Area 3 Landfill Complex 03-08-002-A306 Landfill Cell A3-6 Area 3 Landfill Complex 03-08-002-A307 Landfill Cell A3-7 Area 3 Landfill Complex 03-08-002-A308 Landfill Cell A3-8 Area 3 Landfill Complex CAU-425 – Closed Area 9 Main Lake Construction Debris Disposal Area, TTR 09-08-001-TA09 Construction Debris Disposal Area Area 9/Main Lake CAU-426 - Closed Cactus Spring Waste Trenches, TTR RG-08-001-RGCS Waste Trenches Cactus Spring Ranch CAU-427 - Closed Area 3 Septic Waste Systems 2 and 6, TTR 03-05-002-SW02 Septic Waste System No. 2 Area 3 03-05-002-SW06 Septic Waste System No. 6 Area 3 CAU-428 - Closed Area 3 Septic Waste Systems 1 and 5, TTR 03-05-002-SW01 Septic Waste System No. 1 Area 3 03-05-002-SW05 Septic Waste System No. 5 Area 3 CAU-429 - Closed Area 3 Bldg. 03-55 and Area 9 Bldg. 09-52 UDPs, TTR 03-51-001-0355 Photo Shop UDPs, Drains Photo Shop Area 3 09-51-001-0952 Mobile Photographic Lab UDPs Area 9 CAU-430 - Closed DU Artillery Round #1, TTR TA-55-003-0960 DU Artillery Round South of Area 9 CAU-453 - Closed Area 9 UXO Landfill, TTR 09-55-001-0952 Area 9 Landfill Area 9 CAU-461 - Closed Test Area JTA Sites, TTR TA-52-002-TAML DU Impact Site Main Lake TA-52-003-0960 DU Artillery Round #2 South of Area 9 TTR-001 1987 W-79 JTA Unknown – South of Area 9 CAU-484 – Investigation Phase Antelope and NEDS Lakes Waste Sites, TTR TA-52-001-TANL NEDS Detonation Area NEDS Lake TA-52-004-TAAL Metal Particle Dispersion Test Antelope Lake TA-52-005-TAAL JTA DU Sites Antelope Lake TA-54-001-TANL Rocket Propellant Burn Area NEDS Lake RG-52-007-TAML Davis Gun Site – Mellan Test Range TA-52-006-TAPL DU Surface Debris Colimbo Detonation Area, NEDS Lake
Refer to notes at end of table.

TTR Environmental Programs Information 3-5
TABLE 3-1. DOE/NNSA/NSO ER Project TTR CAUs and CASs CY 2003 (concluded) Industrial Sites CAUs/CASs
CAS Number CAS Description General Location CAU-485 - Closed Cactus Spring Ranch Pu and DU Site, TTR TA-39-001-TAGR Cactus Spring Ranch, Soil Contamination West of Target Areas CAU-486 - Closed Double Tracks Rad Safe Area, Nellis Range 71 North 71-23-001-71DT Double Tracks Rad Safe Area Nellis Range 71 North CAU-487 - Closed Thunderwell Site, TTR RG-26-001-RGRV Thunderwell Site Thunderwell Site CAU-489 - Not Started WWII UXO Sites, TTR RG-55-001-RGMN WWII Ordnance Site Mellan Airstrip RG-55-002-RGHS WWII Ordnance Site H-Site Road RG-55-003-RG36 WWII Ordnance Site Gate 36E CAU-490 - Closed Station 44 Burn Area, TTR RG-56-001-RGBA Fire Training Area Station 44 03-56-001-03BA Fire Training Area Area 3 03-58-001-03FN Sandia Service Yard Area 3 09-54-001-09L2 Solid Propellant Burn Site Area 9 CAU-495 - Closed Unconfirmed JTA Sites, TTR TA-55-006-09SE Buried Artillery Round Test Area TA-55-007-09SE Buried Artillery Round Test Area CAU-496 – Investigation Phase Buried Rocket Site – Antelope Lake, TTR TA-55-008-TAAL Buried Rocket Antelope Lake CAU-499 - Closed Hydrocarbon Spill Site, TTR RG-25-001-RD24 Hydrocarbon Spill Site Radar 24 Site Soil Sites CAUs/CASs: CAU-411 - Closed Double Tracks Plutonium Dispersion, Nellis NAFR-23-01 Pu-contaminated Soil Double Tracks CAU-412 - Closed Clean Slate 1 Plutonium Dispersion, TTR TA-23-01CS Pu-Contaminated Soil Clean Slate 1 CAU-413 - Remediation Phase Clean Slate 2 Plutonium Dispersion, TTR TA-23-02CS Pu-Contaminated Soil Clean Slate 2 CAU-414 - Not Started Clean Slate 3 Plutonium Dispersion, TTR TA-23-03CS Pu-Contaminated Soil Clean Slate 3
SOURCE: DoD/DOE/State of NV 1996 and ongoing updates NOTE: DOE = U.S. Department of Energy NNSA = National Nuclear Security Administration CAU = Corrective Action Unit NSO = Nevada Site Office CAS = Corrective Action Site UDP = underground discharge points DU = depleted uranium UST = underground storage tank ER = Environmental Restoration UXO = unexploded ordnance NEDS = Non-Explosive Destruction Site TTR = Tonopah Test Range WWII = World War II JTA = Joint Test Assembly Pu = Plutonium

2003 Annual Site Environmental Report, Tonopah Test Range3-6
Hydrocarbon-impacted soil andLLW was transported to theNTS for disposal. Constructiondebris and PPE was disposed ofat the U.S. Air Force (USAF)sanitary landfill in 2003. Inaddition, 272 kg (600 lb) ofsanitary rinsate was disposed ofin the TTR sanitary lagoons in2003. Westinghouse GovernmentService participates inenvironmental cleanup andrestoration activities.
3.2 WASTE MANAGEMENT
PROGRAMS
All waste generated by SandiaCorporation activities at TTR ismanaged by WestinghouseGovernment Service under theWaste Management Program.(Sandia Corporation does nothandle waste generated by ERactivities.) Waste categoriesinclude radioactive waste,RCRA-hazardous waste, otherchemical waste, and non-hazardous solid waste. Wasteminimization and recyclingefforts are integrated into WasteManagement Program activities.
Waste generated and handled bySandia Corporation at TTR in2003 was as follows:
Waste Type WeightRCRA hazardous 1,068 kgwaste (2,350 lb)
Non-RCRA-regulated 2,110 kghazardous or toxic (4,782 lb)waste
Radioactive waste 0 kgSandia Corporation shipped allregulated waste to off-sitepermitted TSD facilities.
Table 3-2 shows a detailedbreakdown of the RCRA waste
categories and quantities.Table 3-3 lists regulated non-RCRA waste categories andquantities. Table 3-4 lists wastecategories transported off-sitefor recycling or alternative fueluse. A Hazardous WasteBiennial Report is prepared bySNL/NM and submitted to theU.S Environmental ProtectionAgency (EPA) through DOE/NNSA/NSO (SNL 2002).
Waste Minimization ProgramTTR is committed to achievingsignificant reductions in theamount of chemical andhazardous wastes generated on-site. Waste minimization includesrecycling and recovery of thefollowing materials:
• Solvents,• Fuels and oil,• Antifreeze (on-site recycling
unit),• Lead acid batteries,• Freon (on-site recovery unit),• Fluorescent and sodium
bulbs, and• Mercury-containing
equipment.
Recyclable waste totaling 3,508kg (7,717 lb) and 2,055 gallons ofused oil was sent for recyclingor disposed of through the wastedisposal contractor.
Radioactive WasteManagementThere were no shipments ofradioactive waste in 2003.
3.3 SPILL PREVENTION
CONTROL AND
COUNTERMEASURES
(SPCC) PLAN
The SPCC Plan for SNLTonopah Test Range (SNL1999), which was revised in
1999, pertains to oil storageequipment and secondarycontainments subject to 40 CFR112, “Oil Pollution Prevention”and 40 CFR 110, “Discharge ofOil.”
There are three abovegroundstorage tanks (ASTs), two BulkStorage Areas (BSA), and onetransformer storage area that areregulated with a capacity ofgreater than 660 gallons that areapplicable to the SPCC Plan atTTR.
3.4 NEPA PROGRAM
NEPA Activities at TTRAt TTR, NEPA compliance iscoordinated between SandiaCorporation at TTR, SandiaCorporation at Sandia NationalLaboratories, New Mexico(SNL/NM), and DOE/NNSA,Sandia Site Office (SSO).Additionally, under the directionof Sandia Corporation,compliance is supported by theWater Resources Center at theDesert Research Institute (DRI)through the University ofNevada System. DRI preparesarchaeological and biologicalsurveys and reports. Finalreports are submitted to SandiaCorporation for transmittal toDOE/NNSA/SSO for reviewand decision-making andconsultation with state andfederal agencies.
The Final Environmental ImpactStatement (EIS) for the NTS andOff-Site Locations in the State ofNevada, which includes the TTRsite, was completed in 1996; theDOE Record of Decision (ROD)was filed on December 9, 1996(DOE 1996a).

TTR Environmental Programs Information 3-7
TABLE 3-2. Sandia Corporation TTR Generated RCRA-Regulated Hazardous W aste Shipped Off-site in 2003
Waste Description Waste Codes Generated (lbs)
WASTE MANAGEMENT W aste W ater Reactive Solid, NOS, (Lithium Battery) D001, D003, D005, D007 20 Hazardous W aste Solid, NOS, (Rag with M ethylene Chloride) F002, F003, F005, D035 215 W aste Aerosol Flammable (Petroleum Distillates) D001 220 W aste Petroleum Distillates D001 145 W aste Paint Related M aterial D001 905 W asted Batteries Dry, Containing Potassium Hydroxide (Nickel-Cadmium Batteries
D006
25
W aste Flammable Liquid, NOS (Petroleum Distillates) D001 165 W aste Flammable Liquide, NOS (Gasoline/Diesel Fuel) D001, D018 85 W aste Disel Fuel D001, D018 445 W aste Corrosive Liquid Acidic, Inorganic, NOS, (Hydrofluoric Acid)
D002
50
Hazardous W aste, Solid, NOS, (Lead) D008 5 Hazardous W aste, Solid, NOS D009, U151 25 Hazardous W aste, Solid, NOS D008, D009 45
TOTAL 2,350 NOTE: NOS = not otherwise specified RCRA = Resource Conservation and Recovery Act TTR = Tonopah Test Range lbs = pounds
TABLE 3-4. Recycled Regulated Hazardous or Toxic Waste Shipped Off-site in 2003 Recycled Material or Energy Recovered Material Generated (lbs)
WASTE MANAGEMENT Waste Batteries Wet, Filled with Acid 70 Lead For Recycle 675 Ammo Brass for Recycle 2,400 Empty Drums 300 Automotive/Equipment Lead Acid Batteries 5,752 Waste Batteries Dry, Alkaline 1,060 Fluorescent Lights 560 Incandescent Bulbs 35 Hazardous Waste, Solid, NOS,(Sodium Vapor Bulbs, Barium) 10
TOTAL 10,862 Non-RCRA, Non Hazardous Liquid, NOS (Used Oil) 2,055
NOTE: NOS = not otherwise specified RCRA = Resource Conservation and Recovery Act lbs = pounds
TABLE 3-3. Non-RCRA-Regulated Hazardous or Toxic W aste Shipped Off-site in 2003 Waste Description Waste Codes Shipped Generated (lbs)
Non-Reg Solid W aste NRM 3,667 Non-Reg Liquid W aste (Ethylene Glycol)
NRM 765
Regulated Medical W aste NRM 210 Asbestos TSCA 20 lb 20 D&D Polychlorinated Biphenyl’s (PCB) Ballasts
TSCA 120 lb 120
Total 4,782 D&D Asbestos W aste TSCA 50 yd3 50 yd3 Environmental Restoration (ER) Hydrocarbon impacted soil & debris 3,694,033 Soil IDW 1,654 LLW (soil, debris, and PPE) 240,000 Inert UXO debris 15,600
Total 3,951,287 NOTE: NRM = Non-Regulated Material TSCA = Toxic Substances Control Act RCRA = Resource Conservation and Recovery Act LLW = low level waste IDW = Investigation-Derived Waste UXO = unexploded ordnance D & D = decontamination and demolition PPE = personal protective equipment yd3 = cubic yard lbs = pounds

2003 Annual Site Environmental Report, Tonopah Test Range3-8
2003 NEPA DocumentationDuring 2003, Sandia Corporationsubmitted eight NEPA Checkliststo DOE/NNSA/SSO forproposed projects at TTR thatwere determined to be within theNTS EIS envelope.
In support of activities at TTR,DOE completed consultation withthe Nevada State HistoricPreservation Office (SHPO) on68 buildings. None were found tobe of historic interest.
3.5 ENVIRONMENTAL
MONITORING
PERFORMED BY
OUTSIDE AGENCIES
In addition to Sandia Corporation,other agencies performenvironmental monitoringactivities at TTR, as describedbelow.
EPAThe EPA EnvironmentalMonitoring Systems Laboratoryin Las Vegas, NV, monitoredbackground radiation in the areaof TTR as part of its Off-siteRadiation Monitoring ReportsProgram (EPA 1999), which isnow being done by DRI.
DRI, University of NevadaSystemThe DRI trains and providesmonitoring station managers(generally they are local scienceteachers) to run the EPA airmonitoring equipment set up atlocations within the localcommunity including the towns ofTonopah and Goldfield. TheEPA laboratory in Las Vegas,Nevada provides the equipmentand performs the analysis andreporting.
DRI also provides external qualityassurance (QA) on fieldmeasurements taken by the EPAat these community-monitoringstations. DRI monitors selectedlocations concurrently using aportable monitoring station(PMS) and thermoluminescentdosimeters (TLDs). DRI’sCommunity RadiationMonitoring Program AnnualReport now appears as part ofthe NTS Annual SiteEnvironmental Report (ASER)(DOE 2003a).
DRI also performs otherm o n i t o r i n g — p r i m a r i l yhydrological—for the DOE, asrequested. This may includeevaluating environmental impactsdue to construction projects atTTR.
Westinghouse GovernmentServiceAs part of its TTR supportactivities, WestinghouseGovernment Service personnelperform environmentalmonitoring activities for DOEand/or Sandia Corporation whenneeded as follows:
• Drinking water andwastewater sampling;
• National Emission Standardsfor Hazardous Air Pollutants
(NESHAP) 40 CFR 61, Subpart H (radionuclides) air quality monitoring;
• Soil sampling and sitecharacterization of spillsites;
• Waste sampling andcharacterization; and
• ER support activities.
3.6 SUMMARY OF RELEASE
REPORTING
The following four releasereporting documents must besubmitted to external regulatoryagencies if releases exceedapplicable threshold quantities(TQ):
• NESHAP Annual Report forCY 2003, SNL/NV (SNL2004), requires that an annualreport be submitted fromeach DOE/NNSA site wherefacility sources contribute apublic dose of over 0.1 mrem/yr. The NESHAP reportmust be submitted to the EPAby June 30th each year,following the reporting year.The report includes the calculatedeffective dose equivalent (EDE)in mrem/yr for the maximallyexposed individual (MEI).
• State of Nevada Reports –The State of Nevada requirescopies of each hazardouswaste manifest thataccompanies each wasteshipment.
• State of Nevada ExtremelyHazardous MaterialReporting Requirements –This is not currently requiredsince Sandia Corporationdoes not use any extremelyhazardous materials during itsroutine operations.
• Toxic Chemical ReleaseReporting CommunityRight-to-Know: CalendarYear 2003 (SNL 2004b)submitted for lead released atthe TTR firing range.
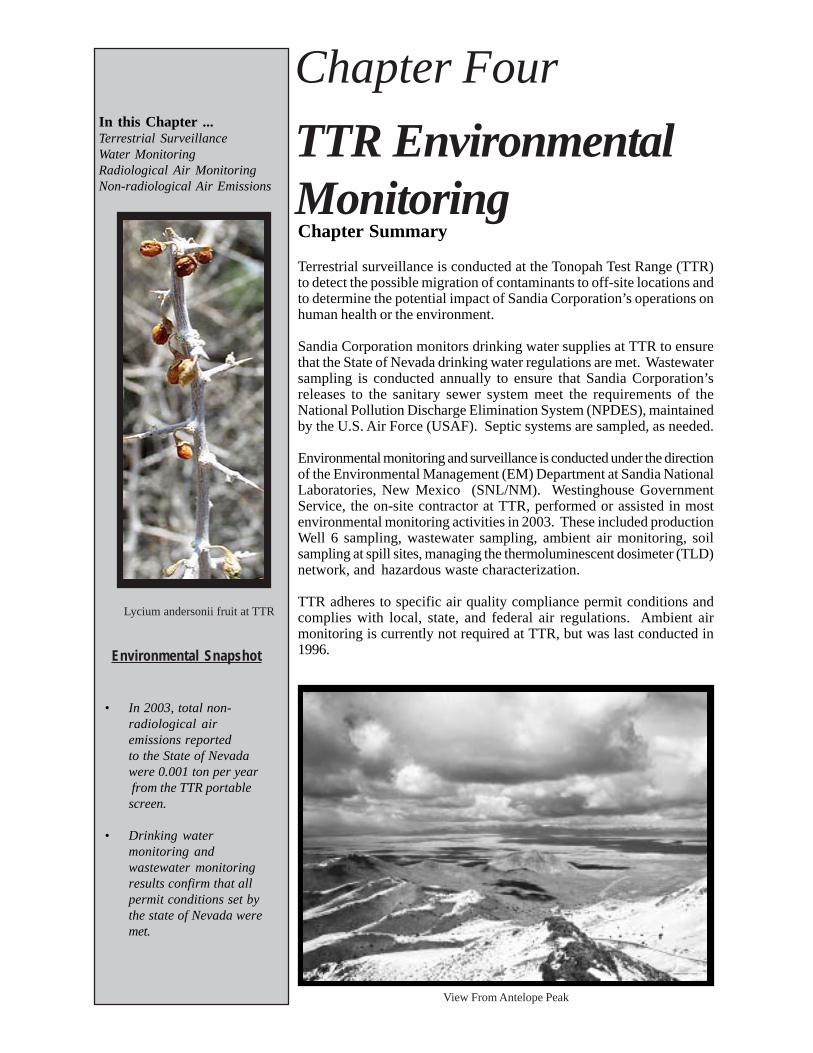
Chapter FourTTR EnvironmentalMonitoringChapter Summary
Terrestrial surveillance is conducted at the Tonopah Test Range (TTR)to detect the possible migration of contaminants to off-site locations andto determine the potential impact of Sandia Corporation’s operations onhuman health or the environment.
Sandia Corporation monitors drinking water supplies at TTR to ensurethat the State of Nevada drinking water regulations are met. Wastewatersampling is conducted annually to ensure that Sandia Corporation’sreleases to the sanitary sewer system meet the requirements of theNational Pollution Discharge Elimination System (NPDES), maintainedby the U.S. Air Force (USAF). Septic systems are sampled, as needed.
Environmental monitoring and surveillance is conducted under the directionof the Environmental Management (EM) Department at Sandia NationalLaboratories, New Mexico (SNL/NM). Westinghouse GovernmentService, the on-site contractor at TTR, performed or assisted in mostenvironmental monitoring activities in 2003. These included productionWell 6 sampling, wastewater sampling, ambient air monitoring, soilsampling at spill sites, managing the thermoluminescent dosimeter (TLD)network, and hazardous waste characterization.
TTR adheres to specific air quality compliance permit conditions andcomplies with local, state, and federal air regulations. Ambient airmonitoring is currently not required at TTR, but was last conducted in1996.
View From Antelope Peak
Environmental Snapshot
In this Chapter ...Terrestrial SurveillanceWater MonitoringRadiological Air MonitoringNon-radiological Air Emissions
• In 2003, total non-radiological airemissions reportedto the State of Nevadawere 0.001 ton per year from the TTR portablescreen.
• Drinking watermonitoring andwastewater monitoringresults confirm that allpermit conditions set bythe state of Nevada weremet.
Lycium andersonii fruit at TTR

2003 Annual Site Environmental Report, TTR & KTF4-2
4.1 TERRESTRIALSURVEILLANCE
4.1.1 Program Objectives
The objectives of the TerrestrialSurveillance Program can besummarized by the followingexcerpts of the requirementsgiven in U.S. Department ofEnergy (DOE) Order 450.1,Environmental ProtectionProgram (DOE 2003):
• Collect and analyzesamples to characterizeenvironmental conditionsand define increasing ordecreasing trends.
• Establish background levelsof pollutants to definebaseline conditions (off-sitesampling).
• Provide cont inu ingassessment of pollutionabatement programs.
• Identify and quantify new orexisting environmentalquality problems and theirpotential impacts, if any.
• Verify compliance withapplicable environmentallaws and regulations andcommitments made inNational EnvironmentalPolicy Act (NEPA) documents,such as Envi ronmenta lImpact Statements (EISs),as well as other officialdocuments.
4.1.2 Regulatory Standardsand Comparisons
The Terrestrial SurveillanceProgram is des igned andconducted in accordance withthe requi rements of DOEOrder 450.1, Environmental
Protection Program (DOE 2003).Concent ra t ion limits forradionuclides and metals interrestrial media are not welldefined; however, the EMDepartment does compare theresults from on-site andperimeter locations to off-siteresults to determine the impact,if any, of Sandia Corporation’soperations on the environment.In addition, sample results formetal in surface soils arecompared to U.S. surface soilaverage concentrations,published in Trace Elements inSoils and Plants (Kabata-Pendias and Pendias, 1992), orlocal/regional surface soilaverage concentrations,published in Elements in NorthAmerican Soils (Dragun andChiasson, 1991).
4.1.3 Statistical Analyses
Samples are generally collectedfrom fixed locations to effectivelymake statistical comparisons withresults from previous years.Statistical analyses areperformed to determine if aspecific result or group of on-siteor perimeter results, differs fromoff-site values, and to identifytrends at a specific samplinglocation. Since multiple datapoints are necessary to providean accurate view of a system, theTerrestrial Surveillance Programdoes not rely on the results fromany single year’s sampling eventto characterize on-siteenvironmental conditions.Results from a single samplingpoint may vary from year to year,due to slight changes in samplinglocations, differences in climaticconditions, and laboratoryvar ia t ions or e r rors .Therefore, as the amount ofdata increases, the accuracy
of the charac te r iza t ionincreases.
The results of the statisticalanalyses allow the EMDepartment to prioritize samplelocations for possible follow-upaction. The prioritization processis a decision-making tool to assistin determining the appropriatelevel of concern for each sampleresult. The Statistical AnalysisPrioritization Method (Shyr,Herrera, and Haaker, 1998) isbased on two “yes or no”questions resulting in a matrix offour priority levels (Table 4-1).
To date, there have been noterrestrial sample results thathave indicated a significant levelof concern (Priority-1) that wouldtrigger actions at locations thatare not already being addressedby the Environmental Restoration(ER) Project.
In past years, the period of timecovered by the statistical analysiswas from 1994 to present. Incalendar year (CY) 2001, theanalysis was limited to a five-yearperiod (this year beginning in1999). The reason for thechange was that SNL/NMchanged analytical laboratories inCY 2000, with lower detectioncapabilities for many of themetals and radiological analyses.As a result, a large number offalse decreasing trends werenoted for many of the parameterswhen the whole data set wasanalyzed. By limiting the analysisto a five-year period, the numberof apparent decreasing trendswas reduced, and should beeliminated over the next coupleof years.
Non-radiological soil analyses arescheduled to occur every otheryear (during even numbered

TTR Environmental Monitoring 4-3
years). Non-radiologicalanalyses were not performed inCY 2003.
4.1.4 Sampling Locations
Terrestrial surveillance began atTTR in 1992. In addition toroutine sampling, a large-scalebaseline sampling was performedin 1994 in areas where SandiaCorporation had a long-term orcontinued presence.
Routine terrestrial surveillance isconducted at on-site, perimeter,and off-site locations that remainessentially the same from year toyear. Sample locations may bemodified as necessary to reflectcurrent operations or tosupplement data from existinglocations. For example, prior to2000, locations formerly knownas T-20 and T-21 were used tomonitor around an areacontaminated with depleteduranium (DU). That site has beenremediated and the samplinglocations were disturbed.Location T-21 was deleted fromthe Terrestrial SurveillanceProgram and, due to remediationefforts, T-20 was moved a shortdistance from the originalsampling location.
The sampling locations, numberof samples, and analysesperformed are prioritized basedon the following criteria:
• On-s i te locat ions a renear a reas of knowncontamination, potentialsources of contamination,or in a reas wherecontamination, if present,would be expec ted toaccumulate, such as in thevicinity of ER sites. A list ofon-site sampling locations isshown in Table 4-2.Appendix A, Figures A-3, A-4a, A-5a, A-5b, and A-5ccontain maps of the samplinglocations. A total of 21locations were sampled on-site.
• Off-site locations are selectedto provide a measurement ofenvironmental conditionsunaffected by SandiaCorporation’s activities atTTR. Data collected fromoff-site locations serve as areference point to comparedata collected at perimeterand on-site locations.Multiple years of samplingdata are compiled to
TABLE 4-1. Decision Matrix for Determining Priority Action Levels Priority Are results higher
than off-site?* Is there an
increasing trend ? Priority for further investigation
1 Yes Yes Immediate attention needed. Specific investigation planned and/or notifications made to responsible parties.
2 Yes No
Some concern based on the level of contaminant present. Further investigation and/or notifications as necessary.
3 No Yes
A minor concern since contaminants present are not higher than off-site averages. Further investigation and/or notifications as necessary.
4 No No No concern. No investigation required. NOTE: Based on Statistical Analysis Prioritization Methodology (Shyr, Herrera, and Haaker 1998). *While some sites may appear higher than off-site, there may not be a statistically significant difference.
determine statisticalaverages for off-siteconcentrations. Off-sitelocations are chosen both inremote, natural settings aswell as in areas near localpopulation centers andalong highways. Table 4-3 contains a list of the off-s i te sample loca t ions .The 14 off-site locationssampled a re shown inFigure A-1 of Appendix A.
• Perimeter locations areselected to establish ifcontaminants are migratingeither onto or off SandiaCorporation property at TTR.A list of perimeter samplinglocations is shown in Table4-4. A map of the eightperimeter locations is shownin Figure A-2 of Appendix A.All perimeter locations are inareas to which SandiaCorporation does not controlaccess within TTR.
4.1.5 RadiologicalParameters andResults
Soil is the only terrestrial mediumsampled at TTR. There are nobodies of water, other than the

2003 Annual Site Environmental Report, TTR & KTF4-4
TABLE 4-2. On-site Terrestrial Surveillance Locations at TTR Revised Location Number
Old Location Number
Sample Location
Replicate* Location
South Plume S-48 T-14 N/S Mellan Airstrip – Antelope Tuff Yes S-49 T-16 N/S Mellan Airstrip – SW of S-48 -- S-50 T-17 N/S Mellan Airstrip – sign post -- S-51 T-18 N/S Mellan Airstrip – NE of S-50 -- S-52 T-19 NE of NW/SE Mellan Airstrip -- Range Operations Center S-40 OC-02 Waste Water Monitoring Station -- S-41 OC-03 “Danger Powerline Crossing” Sign -- S-42 OC-04 Main Road/Edward’s Freeway -- S-43 OC-10 SW Corner of Sandia Corporation, TTR Operations
Center --
S-44 OC-13 NE Corner of Sandia Corporation, TTR Operations Center
--
S-45 OC-19 Storage Shelters, 03-38/03-39 -- S-46 OC-22 Sand Building -- S-47 OC-23 Generator Storage Area -- Various On-site Locations S-02 T-02 N/S Mellan Airstrip (TLD at south fence post) -- S-03 T-03 TLD at Clean Slate 2 Yes S-04 T-04 TLD at Clean Slate 3 -- S-09 D-01 Roller Coaster Decon Yes S-10 T-10 Brownes Road/Denton Freeway -- S-38 MH-03 Mellan Hill – Metal Scrap Pile -- S-39 MH-04 Mellan Hill – North -- S-53 T-20 Main Road/Lake Road SE --
NOTE: TLD = thermoluminescent dosimeter TTR = Tonopah Test Range N/S = North/South (runway runs North/South)
-- = There is not a replicate location for this sample location * In addition to single samples taken for each location, two replicated samples are collected for internal checks on comparability of sampling and analysis.
TABLE 4-3. Off-site Terrestrial Surveillance Locations at TTR Revised Location Number
Old Location Number
Sample
Location
Replicate* Location
C-20 B-08 State Road 6 Rest Area -- C-21 B-04 State Road 6/95 Rest Area -- C-22 B-07 Rocket -- C-23 B-01 Alkali/Silver Peak Turnoff -- C-24 B-02 Cattle Guard -- C-25 B-03 Tonopah Ranger Station -- C-26 B-05 Gabbs Pole Line Road -- C-27 B-06 State Roads 6/376 Junction -- C-28 B-09 Stone Cabin/Willow Creek -- C-29 B-10 State Roads 6 and 375 Junction Yes C-30 B-11 State Road 375 Ranch Cattle Gate -- C-31 B-12 Golden Arrow/Silver Bow -- C-32 B-13 Five miles south of Rocket -- C-33 B-14 Nine miles south of Rocket --
NOTE: TTR = Tonopah Test Range -- = There is not a replicate location for this sample location
* In addition to single samples taken for each location, two replicated samples are collected for internal checks on comparability of sampling and analysis.

TTR Environmental Monitoring 4-5
playa lakes (dry lake beds withonly occasional standing water),and vegetation is scarce. Soilsamples are collected to ascertainthe presence of air-depositedpollutants or contaminants thathave been transported anddeposited as a result of surfacewater runoff. Samples arecollected from the top two inchesof soil using a hand trowel. TheCY 2003 analytical results arefound in Appendix A of this reportand are summarized in thissection. The detailed statisticalanalyses are documented in theTonopah Test Range DataAnalysis in Support of theAnnual Site EnvironmentalReport, 2003 (SNL 2004a).Radiological parameters includegamma-emitting radionuclides,plutonium and uranium.
••••• G a m m a - e m i t t i n gradionuclides – gammaspectroscopy is used to detectthe emission of gammaradiation from radioactivematerials. Radionuclideidentification is possible bymeasuring the spectrum ofgamma energies associatedwith a sample, since each
past testing conducted atTTR. Total uranium (Utot)analysis is used to measureall uranium isotopes presentin a sample. A high Utot
measurement may trigger anisotope-specific analysis todetermine the possible sourceof uranium (i.e., natural, man-made, enriched, or depleted).
••••• External gamma radiationexposure rates - TLDs areused to measure ambientgamma exposure rates.Several natural gammaradiation sources exist,including cosmic radiation andradioactive materials thatexist in geologic materials atTTR. The TLD network wasestablished to determine theregional gamma exposure ratedue to natural sources and todetermine the impact, if any,of Sandia Corporation’soperations on these levels. Thedosimeters are placed onaluminum poles at a height ofapproximately one meter, andare exchanged and measuredquarterly (January, April, July,and October) at 22 on-site,perimeter and off-sitelocations.
TABLE 4-4. Perimeter Terrestrial Surveillance Locations at TTR Revised Location Number
Old Location Number
Sample
Location
Replicate* Location
P-06 T-06 Cedar Pass Road Guard Station -- P-08 T-08 On-Base Housing (Main guard gate/power pole
CP17) --
P-11 T-13 Cactus Springs (TLD south of P-35) Yes P-12 T-12 TLD at “US Gov’t Property” Sign -- P-34 OM-03 O&M Complex (Owan Drive post) -- P-35 T-11 Cactus Springs (north fence post) -- P-36 T-36 On-Base Housing (NE fence line) -- P-37 T-37 On-Base Housing (guard station) --
NOTE: TLD = thermoluminescent dosimeter TTR = Tonopah Test Range O&M = Operations & Maintenance -- = There is not a replicate location for this sample location
* In addition to single samples taken for each location, two replicated samples are collected for internal checks on comparability of sampling and analysis.
radionuclide has a unique andconsistent series of gammaemissions. Cesium-137 (Cs-137) is an example of a long-lived gamma emitter that isprevalent in the environment(as fallout from historicalnuclear weapons testing).Other gamma-emitters ofin te res t a t TTR areAmericium-241 (Am-241)and DU f rom pas texplosives testing.
••••• Plutonium – Due to pastexplosive testing, plutonium ispresent in some areas ofTTR. One of the indicatorsof the presence of weapons-grade plutonium is theradionuclide Am-241.Isotopic plutonium analysis isnormally performed on anysample for which gammaspectroscopy identified Am-241 in concentrations greaterthan its minimum detectableactivity (MDA). It should benoted that no plutonium wasreported in 2002.
••••• Uranium – Uranium occursnaturally in soils and mayalso be present as a pollutantin the environment due to

2003 Annual Site Environmental Report, TTR & KTF4-6
Radiological ResultsThe results of the statisticalanalysis showed no on-site orperimeter locations that wereboth higher than off-site and withan increasing trend (Priority-1).Overall summary statistics for allradiological results are presentedin Table 4-5. One location wasidentified as Priority-2 (higherthan off-site) for Am-241. Twolocations were reported asPriority-2 (higher than off-site)for Cs-137. One location wasidentified as Priority-2 (higherthan off-site) for Plutonium-239/240. The Priority-2 locations
TABLE 4-6. Summary Statistics for Soil Locations Noted as Priority-2 (All units in pCi/g)
Analyte
Location Sample
Size
Average
Median Std Dev
Minimum
Maximum
Am-241 S-09 5 2.198 2.59 1.49 0.546 3.58 Cs-137 S-38 5 0.554 0.526 0.115 0.458 0.742 S-50 5 0.576 0.552 0.118 0.443 0.767 Pu-239/240 S-09 4 3.69 3.54 0.90 2.77 4.92
NOTE: pCi/g = picocurie per gram Std Dev = Standard Deviation
TABLE 4-5. Summary Statistics for Soil Locations (All Units in pCi/g Unless Otherwise Noted)
Analyte Location
Class Sample
Size
Average
Median Std Dev
Minimum
Maximum
Am-241 On-site 105 0.137 0.011 0.556 -0.162 3.580 Perimeter 40 -0.002 0.004 0.053 -0.145 0.175 Off-site 70 -0.003 0.001 0.043 -0.152 0.103 Cs-137 On-site 105 0.291 0.305 0.203 -0.014 0.886 Perimeter 40 0.216 0.149 0.176 0.004 0.642 Off-site 70 0.231 0.196 0.167 0.000 0.930 Pu-238 On-site 31 0.0168 0.0080 0.0209 -0.0102 0.0823 Perimeter 8 0.0068 0.0040 0.0088 0.0018 0.0280 Off-site 14 0.0058 0.0049 0.0069 -0.0022 0.0238 Pu-239/240 On-site 31 0.6889 0.1220 1.2480 0.0011 4.9200 Perimeter 8 0.0163 0.0122 0.0141 0.0014 0.0431 Off-site 14 0.0115 0.0109 0.0095 -0.0011 0.0319 U-235 On-site 105 0.1184 0.1090 0.0712 -0.0428 0.389 Perimeter 40 0.0970 0.0892 0.0603 0.0093 0.252 Off-site 70 0.0949 0.0815 0.0672 -0.0347 0.293 U-238 On-site 105 1.585 1.610 0.551 0.315 3.13 Perimeter 40 1.481 1.510 0.614 0.0476 2.65 Off-site 70 1.594 1.575 0.615 0.178 3.37 Total On-site 105 0.655 0.655 0.203 0.287 1.82 Uranium Perimeter 40 0.629 0.623 0.182 0.301 1.11 (µg/g) Off-site 70 0.682 0.644 0.229 0.301 1.44
NOTE: pCi/g = picocurie per gram µg/g = microgram per gram Std Dev = Standard Deviation
along with the associatedsummary statistics are listed inTable 4-6. There were multiplelocations listed as Priority-3(increasing trend). While thisincreasing trend is “statisticallysignificant,” it is not operationallysignificant (of no importance anddoes not pose a safety and healththreat to human health or theenvironment). These arediscussed below in theappropriate section. ThePriority-3 locations along withtheir associated summarystatistics are listed in Table 4-7.
Am-241One on-site location (S-09,formerly D-01) was identified asPriority-2 (higher than off-site)for Am-241. The highest valueobserved for this location was3.58 pCi/g in 2000. No other on-site locations were identified asPriority-2. No perimeter locationwas identified as either Priority-2 or Priority-3.
Cs-137Two on-site locations (S-38 andS-50) were identified as Priority-2 (higher than off-site) and twoon-site locations (S-40 and S-49)were identified as Priority-3

TTR Environmental Monitoring 4-7
(increasing trend) for Cs-137.The values observed for S-38 andS-50 ranged from 0.443 pCi/gto 0.767 pCi/g while the valuesobserved for S-40 and S-49ranged from 0.075 pCi/g to 0.574pCi/g. Locations S-38, S-49 andS-50 are associated with theMellan Hill area while S-40 islocated at the Waste WaterMonitoring station. There wereno perimeter locations identifiedas either Priority-2 or Priority-3.
Pu-239/240One on-site location (S-09,formerly D-01) was identified asPriority-2 (higher than off-site)for Pu-239/240. The highestvalue observed for this locationwas 4.92 pCi/g in 2003. No othersite was identified as Priority-2and no site was identified asPriority-3 (increasing trend).
U-238One on-site location (S-38) wasidentified as Priority-3(increasing trend) for U-238.The values at this location rangedfrom 0.888 pCi/g to 2.39 pCi/gwith the highest value occurring
TABLE 4-7. Summary Statistics For Soil Locations Noted As Priority-3 (All Units In pCi/g)
Analyte
Location Sample
Size
Average
Median Std Dev
Minimum
Maximum
Cs-137 S-40 5 0.151 0.132 0.064 0.075 0.235 S-49 5 0.431 0.418 0.106 0.311 0.574 U-238 S-38 5 1.719 1.730 0.566 0.888 2.390 Total S-02 5 0.738 0.777 0.179 0.479 0.962 Uranium S-04 5 0.692 0.744 0.211 0.363 0.919 (µg/g) S-09 5 0.541 0.590 0.148 0.287 0.648 S-10 5 0.679 0.745 0.163 0.403 0.799 S-38 5 0.515 0.537 0.126 0.312 0.661 S-39 5 0.705 0.795 0.219 0.361 0.882 S-40 5 0.731 0.736 0.234 0.359 0.971 S-50 5 0.521 0.515 0.093 0.386 0.618 S-51 5 0.640 0.704 0.132 0.445 0.760 S-52 5 0.706 0.719 0.137 0.553 0.842 P-06 5 0.605 0.653 0.183 0.301 0.774 P-11 5 0.518 0.506 0.123 0.327 0.639 P-34 5 0.595 0.555 0.200 0.321 0.820
NOTE: pCi/g = picocurie per gram Std Dev = Standard Deviation µg/g = microgram per gram
in 2003. No on-site or perimeterlocation was noted to be Priority-2 (higher than off-site).
Total Uranium (Utot)Ten on-site locations (S-02, S-04,S-09, S-10, S-38, S-39, S-40, S-50, S-51 and S-52) were identifiedas Priority-3 (increasing trend)for Utot. Three perimeterlocations (P-06, P-11, and P-34)were identified as Priority-3(increasing trend) for Utot as well.The on-site values ranged from0.287 ug/g to 0.971 ug/g while theperimeter locations ranged from0.301 ug/g to 0.820 ug/g. Therewere no Priority-2 (higher thanoff-site) locations noted for Utot.
TLD ResultsSampling for 2003 was conductedfrom January 2003 throughJanuary 2004. TLD’s wereunrecovered (missing) at severallocations during CY2003; when aTLD has a missing quarter thedata is not included in thesummary statistics.
On-site and perimeter locationsare statistically indistinguishable
from off-site locations. Theredoes appear to be a statisticaldifference between years with2002 being the highest recordedon-site year and 2001 being thelowest recorded off-site year.The results in 1999 are alsostatistically higher for on-site andoff-site than those of 2001. Figure4-1 graphically portrays the TLDresults from 1999 to 2003. TLDresults and TLD measurementsby quarter and location type for2003 are shown in Tables A-7 andA-8 of Appendix A, respectively.
4.1.6 Non-RadiologicalParameters andResults
TTR soil samples are analyzed for20 stable metals (ICP-20) plusmercury every other year (duringeven numbered years). Table 4-8shows soil sample concentrationdata for these metals. In CY2003,non-radiological analyses werenot performed. No statisticalanalyses were performed on thenon-radiological data.

2003 Annual Site Environmental Report, TTR & KTF4-8
TABLE 4-8. Metal in Soil Concentration Data (complied from various sources)
NV Surface Soil
Concentration EPA Region 9
PRG's U.S. Surface
Soil Concentration
Parameter Range (mg/kg) Residential
(mg/kg) Industrial (mg/kg)
Range (mg/kg)
Aluminum 5000 - 100,000 76,000 100,000 4,500 - 100,000 Antimony <1 - 1.0 31 410 0.25 - 0.6 Arsenic 2.9 - 24 22 260 <1 - 93 Barium 150 - 3,000 5,400 67,000 20 - 1500 Beryllium ND - 5.0 150 1,900 0.04 - 2.54 Cadmium ND - 11 37 450 0.41 - 0.57 Calcium 600 - 320,000 NA NA NA
Chromium 7.0 - 150 210(1) 450(1) 7 - 1500 Cobalt ND - 20 900 1,900 3 - 50 Copper 7.0 - 150 3,100 41,000 3 - 300 Iron 1000 - >100,000 23,000 100,000 5,000 - 50,000 Lead ND - 70 400 750 <10 - 70 Magnesium 300 - >100,000 NA NA NA Manganese 30 - 5000 1,800 19,000 20 - 3000
Mercury 0.01 - 0.82 23(2) 310(2) 0.02 - 1.5 Molybdenum ND - 7.0 390 5,100 0.8 - 3.3 Nickel 5.0 - 50 1,600 20,000 <5 - 150 Potassium 1900 - 63,000 NA NA NA Selenium <0.1 - 1.1 390 5,100 <0.1 - 4.0 Silica (Silicon) 150,000 - 440,000 NA NA 24,000 - 368,000 Silver <0.5 - 5 390 5,100 0.2 - 3.2 Sodium <500 - 100,000 NA NA NA Strontium 100 - 1500 47,000 100,000 7 - 1000 Thallium NA 5.2 67 .02 - 2.8 Titanium 700 - 5000 NA NA 20 - 1000 Vanadium 30 - 150 550 7,200 0.7 - 98
Zinc 25 - 128 23,000 100,000 13 - 300 ND = not detectable (1) total chromium (2) mercury and compounds NV Surface Soil Concentrations: Dragun, James, A. Chiasson, Elements in North American Soils, 1991, Hazardous Materials Control Resources Institute (Used "Nevada Soils" to determine values, if available, otherwise Western US values used.) EPA Region 9 Preliminary Remediation Goals (PRGs): Environmental Protection Region 9, “Region 9 PRGs Table Users Guide/Technical Background Document” EPA 2002 (http://www.epa.gov/region09/waste/sfund/prg/index.htm) US Surface Soil Concentrations: Kabata-Pendias, A., Pendias, H., CRC, Trace Elements in Soils and Plants, 2nd Edition, 1992

TTR Environmental Monitoring 4-9
4.2 WATER MONITORING
Results for potable water,wastewater effluent sampling,and the issue of storm watermonitoring are discussed in thissection.
The Water Conservation Planfor the Tonopah Test Rangecomplies with State WaterResources Division regulationsrequiring a water conservationplan for permitted water systemsand major water users in Nevada(DOE 1992).
4.2.1 Production WellMonitoring
There are three active wells usedby Sandia Corporation at TTR.Production Well 6, Well 7, and theRoller Coaster Well. ProductionWell 6 and the Roller CoasterWell are the most active.Production Well 6, which suppliesdrinking water to the SandiaCorporation Main Compound inArea 3, is the only well that hasbeen sampled for contaminants.
Outlying areas use bottled water.The other wells are not used forpotable purposes (constructionand dust suppression) and thereis no regulatory samplingrequirement.
All sampling is conducted inaccordance with requirementsset by the state (State of Nevada1997). Analytes are sampled atdifferent intervals, as shown inTable 4-9.
Sampled parameters included, butwere not limited to, totalcoliforms, nitrates, nitrites,volatile organic compounds(VOCs), lead, copper, andarsenic.
4.2.2 Sewage System andSeptic TankMonitoring
Sewage from SandiaCorporation’s facilities in theMain Compound at Area 3 goesto the USAF facultative sewagelagoon. Either SNL/NM orWestinghouse Government
FIGURE 4-1. Tonopah Test Range TLD Exposure (1999-2003)
80.0
90.0
100.0
110.0
120.0
130.0
140.0
150.0
160.0
170.0
180.0
1998 1999 2000 2001 2002 2003 2004Year
Tot
al E
xpos
ure
OnsitePerimeterOffsite
Service takes annual wastewatersamples from Area 3 at the pointwastewater leaves SandiaCorporation property and entersthe USAF system.
The USAF holds the NPDESpermit for its wastewaterdischarges. The USAF takesquarterly samples from theheadwater end of the lagoon. Inthe past, Sandia Corporationprovided quarterly samplingresults to the USAF for inclusioninto their USAF DischargeMonitoring Report (DMR);however, the NPDES permit wasmodified in 1997 and no longerstipulates the requirement ofquarterly data from SandiaCorporation. Therefore, SandiaCorporation now only providesannual sample results to theUSAF.
Forty eight hour compositewastewater samples arecollected on an annual basis andhave the following parametersanalyzed:

2003 Annual Site Environmental Report, TTR & KTF4-10
• Total coliforms;
• Total cyanide (SandiaCorporation does not usecyanide-containingcompounds at TTR);
• pH (potential of hydrogen[acidity]) and non-filteredresidue;
• Phenolics (SandiaCorporation does not usephenol-containingcompounds at TTR);
• Chemical oxygen demand(COD);
• VOCs;
• Semi-Volatile OrganicCompounds (SVOCs);
• Metals (cadmium,chromium, copper, nickel,silver, zinc, lead, selenium,and mercury);
• Total recoverablepetroleum hydrocarbons(TRPH);
• Oil and grease; and
• Tritium, gammaspectroscopy, gross alpha,and gross beta.
All analytical results forwastewater sampled at Area 3were within regulatory limits in2003.
Septic Tank SystemsSeptic tank systems are sampled,as needed. There are six septicsystems located on-site, whichare owned by Sandia Corporationat TTR. These six active septictanks are used in remotelocations and are maintained bythe TTR facilities group. Thesewage from these locationsflows into septic tanks andassociated drain fields. None ofthese systems requiredmaintenance, sampling, orpumping in 2003. All otherremaining septic systems havebeen closed or are undergoingclosure and are being addressedby the ER Project.
4.2.3 Storm Water Monitoring
Currently, Sandia Corporationhas no requirement to performstorm water monitoring at TTR.All storm water issues andmonitoring are managed by theUSAF.
4.3 RADIOLOGICAL AIRMONITORING
Air quality compliance at theTTR is met by adherence tospecific permit conditions andcompliance with local, state, andfederal air regulations. Ambientair quality monitoring is notcurrently required at TTR.Ambient air monitoring was lastconducted in 1996 to ascertainthe level of radiologicalconstituents in the air asdiscussed below.
Operations by SandiaCorporation at TTR do notinvolve activities that releaseradioactive emissions from eitherpoint sources (stacks and vents)
TABLE 4-9. Production Well Monitoring at TTR Analyte Sampling
Frequency Total Coliform Monthly Nitrate, Secondary (13) Drinking Water Standards 2003 Dioxin,Nitrate, Total Trihalomethanes/Haloacetic Acids (5) 2004 Arsenic, IOC’s Phase II, IOC’s Phase V, Nitrate, Nitrite Nitrate and Nitrite (Total), SOC’s Phase II, SOC’s Phase V Total Trihalomethanes/Haloacetic Acids (5), VOC’s Phase I and II, VOC’s Phase V,
2005
Asbestos, Lead/Copper, Nitrate, Secondary (13) Drinking Water Standards Total Trihalomethanes/Haloacetic Acids (5)
2006
Dioxin, Nitrate 2007 Arsenic, IOC’s Phase II, IOC’s Phase V, Nitrate, Nitrite, Nitrate and Nitrite (Total) SOC’s Phase II, SOC’s Phase V, VOC’s Phase I and II, VOC’s Phase V
2008
Lead/Copper, Nitrate, Secondary (13) Drinking Water Standards 2009 Dioxin, Nitrate 2010 NOTE: IOC = inorganic compounds
VOC = volatile organic compounds SOC = synthetic organic compounds

TTR Environmental Monitoring 4-11
TABLE 4-10. Calculated Dose Assessment Results for On-site Receptor Dose to
Receptor Location 1997 Measured
Dose* NESHAP Standard
Natural Background
On-site Receptor (EDE to the MEI)
Airport TTR Area 0.024 mrem/yr (0.00024 mSv/yr)
10 mrem/yr (0.1 mSv/yr)
250 mrem/yr1
NOTE: *Dose calculated from continuous monitoring February 1996 to February 1997. EDE = effective dose equivalent MEI = maximally exposed individual mrem/yr = millirem per year
mSv/yr = millisievert per year TTR = Tonopah Test Range
1 Natural background is estimated at 250 mrem/yr nationwide.
or diffuse sources such asoutdoor testing. However,diffuse radiological emissions areproduced from the re-suspensionof americium and plutoniumpresent at the Clean Slate ERsites. Other ER sites with minorradiological contamination, suchas DU, do not produce significantair emission sources from re-suspension.
National Emission Standardsfor Hazardous Air Pollutants(NESHAP)NESHAP, 40 CFR 61,Subpart H, “National EmissionStandards for Emissions ofRadionuclides Other than Radonfrom Department of EnergyFacilities,” has set a maximum of10 mrem/yr for all combined airemission pathway sources fromany DOE/NNSA facility.Although the dose calculatedfrom the Clean Slate sites is manytimes less than this standard,there was a question of whetherthe site would require continuousradiological air monitoring.
The 1995 NESHAP report forTTR reported a calculatedeffective dose equivalent (EDE)to the maximally exposedindividual (MEI) of 1.1 mrem/yras a result of diffuse emissionsfrom the Clean Slate sites (SNL1996). Because the EPArequires continuous air monitoringfor any radionuclide source that
contributes a dose in excess of0.1 mrem/yr to the MEI, SandiaCorporation instituted continuousair monitoring at the site for oneyear, from February 22, 1996 toFebruary 25, 1997. Themonitoring site was chosen at theTTR Airport, the location of thehighest calculated dose for amember of the public. This siteselection is discussed in the 1996NESHAP report (SNL 1997).The dose assessment result fromthe continuous monitoring was0.024 mrem/yr. This was aboutfour times less than the 0.1 mrem/yr threshold cutoff for whichcontinuous monitoring would berequired by the EPA. Theaverage air concentration incuries per cubic meter (Ci/m3)were measured as follows:
Am-241 4.1 x 10⁻¹⁸ Ci/m3
Pu-238 1.6 x 10⁻¹⁸ Ci/m3
Pu-239/240 9.5 x 10⁻¹⁹ Ci/m3
Although an annual calculateddose assessment is not requiredfor the site, Sandia Corporationcontinues to produce an annualNESHAP report for TTR (SNL2004). The results from the 1996to 1997 monitoring will continueto be used for as long as there isno change in the status of theClean Slate sites. Table 4-10summarizes these doseassessment results. Future TTRactivities are not expected tochange; however, if new sources
or modifications to the existingsources are anticipated, they willbe evaluated for NESHAPapplicability.
4.4 NON-RADIOLOGICALAIR EMISSIONS
The TTR Class II Air QualityOperating Permit Renewal in2002 exempted most emissionsources used at TTR with theexception of the screening plantand portable screen. In 2003, thetotal emissions reported to theState of Nevada were 0.001 tonper yr from the portable screen.The screening plant was notused.
2003 Annual Site Environmental Report, TTR & KTF4-12
This page intentionally left blank.

The Kauai Test Facility (KTF) is operated by Sandia Corporation as a rocketpreparation, launching, and tracking facility for the U.S. Department of Energy(DOE), National Nuclear Security Administration (NNSA), as well as in supportof other U.S. military agencies. Sandia National Laboratories, Kauai Test Facility(SNL/KTF) refers to the facilities at KTF. SNL/KTF is owned by the DOE/NNSA and managed by the Sandia Site Office (SSO) in Albuquerque, NewMexico. SNL/KTF exists as a facility within the boundaries of the U.S.Department of Defense (DoD) Pacific Missile Range Facility (PMRF). SNL/KTF is located on the island of Kauai at the north end of the PMRF, near NohiliPoint (Figure 5-1). This Annual Site Environmental Report (ASER) summarizesdata and the compliance status of the environmental protection and monitoringprograms at SNL/KTF for calendar year (CY) 2003. This report was prepared inaccordance with DOE Order 450.1, Environmental Protection Program (DOE2003) and DOE Order 231.1, Environment, Safety, and Health Reporting (DOE1996).
5.1 FACILITIES AND OPERATIONS
SNL/KTF has been an active rocket-launching facility since 1962. The KTF andRemote Range Interfaces Department, under Sandia Corporation, manages andconducts the rocket-launching activities at SNL/KTF. The site is primarily usedfor testing rocket systems with scientific and technological payloads, advanceddevelopment of maneuvering re-entry vehicles, scientific studies of atmosphericand exoatmospheric phenomena, and Ballistic Missile Defense Organization(BMDO) programs. Nuclear devices have never been launched from SNL/KTF, nor have radiological materials been used at SNL/KTF.
Chapter Five2003 Annual SiteEnvironmentalReport for theKauai Test Facility
In this Chapter ...Facilities and Operations2003 Rocket LaunchesDemographicsCompliance SummaryEnvironmental Program ActivitiesEnvironmental Surveillance & Monitoring Activities
Environmental Snapshot
Mountain Range in Kauai
On-site meteorologicalinstruments are use duringtest periods to characterizeatomspheric transport,diffusion conditions, andstability classes.
There was one reportableoccurrence at SNL/KTF in2003.
Hala Tree
•
• .

5-2 2003 Annual Site Environmental Report for TTR & KTF
FIGURE 5-1. Map of the Pacific Missile Range Facility (PMRF) and the Adjacent Area (The Kauai Test Facility (KTF) is to the north, near Nohili Point)
Pacific MissileRange Facility
Nihau
Kauai
Oahu
Molokai
Lanai
Hawaii
Kahoolawe
Maui
Honlolulu
N
0 1 2 3 Miles
Barking Sands
Nohili Point
Waieli Point
Kauai Test Facility
(KTF)
Pacific Missile
Range Facility
(PMRF) Private
Polihale State Park
Private
ManaReservoir
Mana Point
Waiokapoua Bay
Kaum
ualii H
ighw
ay
PMRF FamilyHousing
KekahaAirstrip
KTF Kokole PointLaunch Complex
P a c i f i c O c e a n
N. Sidewinder Road
Tartar Drive
N. Nohili Road
Palai Olani Road
Hoku Road
50
50

5-3KTF ASER
The first facilities at KTF wereconstructed in the early 1960s tosupport the National ReadinessProgram. The most recentconstruction, completed in 1994,added four buildings to supportDOE and Strategic DefenseInitiative (SDI) launches. From1992 to 2003, there have been 16launches.
The KTF launcher field wasoriginally designed toaccommodate 40 launch pads, butonly 15 pads were constructed.Of these, 11 have had theirlaunchers removed. Beyond theimplementation of portions of theoriginal plan, two additional launchpads were constructed: Pad 41 atKokole Point, and Pad 42, theStrategic Targeting System(STARS) launch pad. Thelauncher field site has a numberof permanent facilities used tosupport rocket operations. Inaddition to rocket launch pad sites,SNL/KTF facilities include missileassembly areas, data acquisitionand operations facilities, amaintenance shop, and a trailercompound for administration andtechnical support personnel. Otherfeatures at SNL/KTF includeextensive radar tracking andworldwide radio communicationaccess to other DoD facilities.
The administrative area of SNL/KTF, known as the MainCompound, is located within afenced area near the North Nohiliaccess road from PMRF. Insidethe fenced compound, a numberof trailers and vans are connectedtogether with a network ofconcrete docks and coveredwalkways. The majority of thesetemporary facilities are usedduring operational periods tosupport the field staff at SNL/
KTF. During non-operationalperiods, general maintenancecontinues and dehumidifiersremain in operation (to protectequipment). Additionally, thereare a number of permanentbuildings, most of which are in useyear-round to support and maintainSNL/KTF facilities.
5.2 2003 ROCKET
LAUNCHES
There were two rockets launchedfrom SNL/KTF in 2003. Thelaunches were covered by the KTFEnvironmental Assessment (EA),published in July 1992 (DOE1992a).
• AEGIS BMD, FM-4June 18, 2003
• AEGIS BMD, FM-5December 11, 2003
This system uses a single stageM56 (Second stage of the MinuteMan I System) rocket motor. Therocket was employed as asurrogate target in support of theNavy’s AEGIS Ballistic MissileDefense (BMD) Program.
5.3 DEMOGRAPHICS
There are 13 permanent on-sitepersonnel at SNL/KTF. Duringoperational periods when rocketlaunches occur, an additional 15 to130 persons from the U.S.mainland are brought to SNL/KTF(DOE 1992a). The closestpopulation center to SNL/KTF isthe town of Kekaha (population3,300), which is eight miles fromthe site.
5.4 COMPLIANCE SUMMARY
The list of statutes on page 5-5provides an overview ofcompliance status for SandiaCorporation’s operations at SNL/KTF in 2003. Table 5-1 lists theapplicable permits in place at SNL/KTF.
ComprehensiveEnvironmental Response,Compensation, and LiabilityAct (CERCLA)CERCLA, also known as“Superfund,” addresses areas ofpast spills and releases. SNL/KTFhas no current EnvironmentalRestoration (ER) areas located on-site.
The U.S. Environmental ProtectionAgency (EPA) designated ongoingoversight of SNL/KTF to theHawaii Department of HealthHazard Evaluation andEmergency Response Office. TheEPA recommended continuedreevaluation for environmentalcontamination due to the launchingfacility. Rocket exhaust continuesto be the main source of metalsand other non-reportable airemission releases.
Superfund Amendments andReauthorization Act (SARA)SARA Title III requires chemicalinventory information andthreshold quantity reporting asdirected by the EmergencyPlanning and Community Right-to-Know Act (EPCRA), Sections 311and 312. All required informationhas been submitted to the State ofHawaii. There were no reportablereleases at SNL/KTF underEPCRA or CERCLA in 2003.Table 5-2 lists SARA Title IIIreporting requirements.

5-4 2003 Annual Site Environmental Report for TTR & KTF
TABLE 5-1. Permit Registrations in Place at SNL/KTF Type Permit
Number Date
Issued Expiration
Date Regulatory
Agency
Non-covered Source Permit (NSP) (two stand-by diesel generators)
NSP 0429-01-N Sept. 15, 1998 Extension Approved
State of Hawaii
Resource Conservation and Recovery Act (RCRA)
HI-0000-363309 Sept. 23, 1994 Not specified EPA Region IX and Hawaii Dept. of Health
UST (2,500) Not applicable Sept. 13, 1991 Indefinite EPA Region IX and Hawaii Dept. of Health
NOTE: In 1999, there was a change in reporting fuel through put from annual reporting to biannual reporting to the State of Hawaii.
SNL/KTF = Sandia National Laboratories, Kauai Test Facility EPA = U.S. Environmental Protection Agency UST = Underground Storage Tank
TABLE 5-2. 2003 SARA Title III (or EPCRA) Reporting Requirements Applicable to SNL/KTF Requires Reporting? Section SARA Title III
Section Title Yes No Description
302 - 303 Notification/ Plans
! Sandia Corporation submits an annual report listing chemical inventories above the reportable Threshold Planning Quantities listed in 40 CFR Part 355 Appendix B, location of the chemicals and emergency contacts. The report is prepared for the DOE/NNSA/SSO, which distributes it to the required entities.
304 Emergency Notification
! No RQ releases of an EHS, or as defined under CERCLA, occurred in 2003.
311-312 MSDSs/ Chemical Purchase Inventory Report
! There are two “Community Right-to-Know” reporting requirements: (a) SNL/KTF completes the EPA Tier II forms for all hazardous chemicals present at the facility at any one time in amounts equal to or greater than 10,000 lbs and for all EHSs present at the facility in an amount greater than or equal to 500 lbs or the Threshold Planning Quantity, whichever is lower; (b) SNL/KTF provides MSDSs for each chemical entry on a Tier II form unless it decides to comply with the EPA’s alternative MSDS reporting, which is detailed in 40 CFR Part 370.21.
313 Toxic Chemical Release Forms
! Sandia Corporation is below the reporting threshold in 2003 for producing a TRI Report for SNL/KTF operations.
NOTE: MSDS = Material Safety Data Sheets (gives relevant chemical information) EHS = extremely hazardous substance TRI = Toxic Release Inventory RQ = reportable quantity SNL/KTF = Sandia National Laboratories, Kauai Test Facility EPA = U.S. Environmental Protection Agency DOE/NNSA/SSO = U.S. Department of Energy, National Nuclear Security Administration, Sandia Site Office CERCLA = Comprehensive Environmental Response, Compensation, and Liability Act SARA = Superfund Amendments and Reauthorization Act EPCRA = Emergency Planning and Community Right-to-Know Act

5-5KTF ASER
Major Environmental Regulations & Statutes Applicable to KTF
Clean Air Act (CAA) and CAA Amendments (CAAA )Provides standards to protect the nation’s air quality http://www.epa.gov/oar/oaq_caa.html
Clean Water Act (CWA)Provides general water quality standards to protect the nation’s water sources and bywayswww.epa.gov/region5/water/cwa.htm
Comprehensive Environmental Response, Compensation, and Liability Act (CERCLA)Provides federal funding for cleanup of inactive waste sites on the National Priorities List (NPL) andmandates requirements for reportable releases of hazardous substanceswww.epa.gov/region5/defs/html/cercla.htm
Cultural resources actsIncludes various acts that protect archeological, historical, religious sites, and resourceshttp://water.usgs.gov/eap/env_guide/cultural.html
Endangered Species Act (ESA)Provides special protection status for federally-listed endangered or threatened specieswww.epa.gov/region5/defs/html/esa.htm
Executive Orders (EOs)Several EOs provide specific protection for wetlands, floodplains, environmental justice in minority andlow-income populations, and greening the government through leadership in environmentalmanagementwww.archives.gov/federal_register/executive_order/disposition_table.html
Federal Facility Compliance Act (FFCA)Directs federal agencies regarding environmental compliancehttp://tis.eh.doe.gov/oepa/laws/ffca.htm
Federal Insecticide, Fungicide, and Rodenticide Act (FIFRA)Controls the distribution and use of various pesticides www.epa.gov/region5/defs/html/fifra.htm
Migratory Bird Treaty Act (MBTA) of 1918Prevents the taking, killing, possession, transportation and importation of migratory birds, their eggs,parts, and nests http://tis.eh.doe.gov/oepa/laws/mbta.html
National Emission Standards for Hazardous Air Pollutants (NESHAP)Specifies standards for radionuclide air emissions and other hazardous air releaseswww.epa.gov/radiation/neshaps/
National Environmental Policy Act (NEPA)Ensures that federal agencies review all proposed activities and include environmental consideration inagency decision-making http://tis.eh.doe.gov/NEPA/
Resource Conservation and Recovery Act (RCRA)Mandates the management of solid and hazardous waste and certain materials stored in undergroundstorage tanks (USTs) www.epa.gov/region5/defs/html/rcra.htm
Safe Drinking Water Act (SDWA)Provides specific standards used for drinking water sources www.epa.gov/safewater/sdwa/sdwa.html
Superfund Amendments and Reauthorization Act (SARA) SARA,Title III, also known as the EmergencyPlanning and Community-Right-to-Know Act (EPCRA), mandates communication standards forhazardous materials over a threshold amount that are stored or used in a community
www.epa.gov/region5/defs/html/sara.htm
Toxic Substance Control Act (TSCA)Specifies rules for the manufacture, distribution, and disposal of specific toxic materials such as asbestosand polychlorinated biphenyls (PCBs) www.epa.gov/compliance/civil/federal/tsca.html

5-6 2003 Annual Site Environmental Report for TTR & KTF
Resource Conservation andRecovery Act (RCRA)In 1994, SNL/KTF reached “smallquantity hazardous wastegenerator” status as defined byRCRA, and therefore, obtained anEPA Identification Number.However, the volume of wastegenerated in 2003 qualified SNL/KTF to maintain “conditionallyexempt small quantity generator”status.
Federal Facility ComplianceAct (FFCA)The FFCA addresses thedisposition of mixed waste (MW)at federal facilities. No radioactivewaste of any kind has beengenerated or stored at SNL/KTFand, therefore, this statute is notapplicable to the site.
National EnvironmentalPolicy Act (NEPA)NEPA requires federal agenciesand private entities that performfederally-sponsored projects toinclude environmental aspects inearly project planning anddecision-making. A major intent ofthe law is to ensure that federalagencies are aware of the potentialenvironmental impacts associatedwith their operations and includethis information in early projectplanning and decision-making.NEPA mandates that an agency’sdecision process be open for publicreview. Additionally, if a proposedaction is determined to haveenvironmentally “significant”impacts, the agency must preparean EA or an environmental impactstatement (EIS) before anirretrievable commitment ofresources or funding occurs.Although a major objective ofNEPA is to preserve theenvironment for futuregenerations, the law does notrequire an agency to select the
proposed action alternative withthe least environmental impacts.The DOE/NNSA/SSO coordinatesNEPA compliance at SNL/KTFwith Sandia National Labs, NewMexico (SNL/NM).
Endangered Species Act (ESA)ESA applies to both privateindividuals and federal agencies(Section 7 of ESA specificallyapplies to federal agencies). AtSNL/KTF, ESA compliance iscoordinated with NEPAcompliance. The law ensures thatany action authorized, funded, orcarried out by a federal agencywill not jeopardize the continuedexistence of a “threatened orendangered species,” or result inadverse modifications to itshabitat. Table 5-3 lists allthreatened and endangered stateand federal listed species occurringon the island of Kauai.
Cultural Resources ActsThe three primary cultural resourcesacts applicable at SNL/KTF are asfollows:
• National Historic PreservationAct (NHPA);
• Archaeological ResourcesProtection Act (ARPA); and
• American Indian ReligiousFreedom Act (AIRFA).
At SNL/KTF, cultural resourcescompliance is coordinated throughthe NEPA Program. Actions thatcould adversely affect culturalresources are initially analyzed in aNEPA Checklist.
Migratory Bird Treaty Act(MBTA) of 1918In addition to the specialconsideration afforded to specieslisted as threatened andendangered, most birds areprotected under the MBTA of
1918, as amended. At SNL/KTF,construction sites are surveyedprior to digging or earth movementto avoid possible impacts to nestingbirds.
Environmental ComplianceExecutive Orders (EOs)The four primary EOs related toenvironmental compliance at SNL/KTF are as follows:
• EO 11990, Protection ofWetlands, as amended
• EO 11988, FloodplainManagement, as amended
• EO 12898, Federal Actions toAddress Environmental Justicein Minority Populations andLow-Income Populations, asamended
• EO 13148, Greening theGovernment ThroughLeadership in EnvironmentalManagement
Clean Air Act (CAA) and CleanAir Act Amendments (CAAA)of 1990Ambient air quality is regulated byHawaii Administrative Rules(HAR), Title 11, Chapter 59 underthe jurisdiction of the HawaiiDepartment of Health, Clean AirBranch. Currently, there are nofacilities at SNL/KTF that requireair permits or compliance with theNew Source PerformanceStandards (NSPS), “Prevention ofSignificant Deterioration (PSD),”or 40 CFR 61, “National EmissionStandards for Hazardous AirPollutants” (NESHAP). Withinthe boundaries of PMRF, nofederal air emission permits areheld either by DOE for SNL/KTF,or by DoD for PMRF. However,the two electrical generators atSNL/KTF are permitted for

5-7KTF ASER
TABLE 5-3. Threatened and Endangered Species Potentially Occurring on KTF
Common Name Scientific Name Federal Status State Status
Plants Liliwai Acaena exigua Endangered Endangered No common name Achyranthes mutica Endangered Endangered Pendant kihi fern Adenophorus periens Endangered Endangered
Mahoe Alectryon macrococcus var. macrococcus Endangered Endangered
Kuawawaenohu Alsinidendron lychnoides Endangered Endangered No common name Alsinidendron viscosum Endangered Endangered No common name Bonamia menziesii Endangered Endangered Olulu Brighamia insignis Endangered Endangered Uhiuhi Caesalpinia kavaiensis Endangered Endangered 'Awiwi Centaurium sebaeoides Endangered Endangered 'Akoko Chamaesyce halemanui Endangered Endangered Pauoa Ctenitis squamigera Endangered Endangered Haha Cyanea asarifolia Endangered Endangered Haha Cyanea recta Threatened Threatened Haha Cyanea remyi Endangered Endangered Haha Cyanea undulata Endangered Endangered Pu'uka'a Cyperus trachysanthos Endangered Endangered Ha'iwale Cyrtandra limahuliensis Threatened Threatened Mapele Cyrtandra cyaneoides Endangered Endangered No common name Delissea rhytidosperma Endangered Endangered 'Oha Delissea rivularis Endangered Endangered No common name Delissea undulata ssp. kauaiensis Endangered Endangered Asplenium leaved diella Diellia erecta Endangered Endangered
No common name Diellia pallida (proposed as D. laciniata) Endangered Endangered
No common name Diplazium molokaiense Endangered Endangered Kahalapehu Dubautia pauciflorula Endangered Endangered Na’ena’e Dubautia latifolia Endangered Endangered 'Akoko Euphorbia haeleeleana Endangered Endangered Heau Exocarpos luteolus Endangered Endangered Mehamehame Flueggea neowawraea Endangered Endangered No common name Gouania meyenii Endangered Endangered No common name Haplostachys haplostachya Endangered Endangered 'Awiwi Hedyotis cookiana Endangered Endangered Na Pali beach hedyotis Hedyotis st.-johnii Endangered Endangered No common name Hesperomannia lydgatei Endangered Endangered Hau kuahiwi Hibiscadelphus distans Endangered Endangered Hau kuahiwi Hibiscadelphus woodii Endangered Endangered
Ma'o hau hele Hibiscus brackenridgei ssp. mokuleianus Endangered Endangered
Koki'o 'ula'ula; aloalo Hibiscus clayi Endangered Endangered Koki'o ke'oke'o Hibiscus waimeae ssp. hannerae Endangered Endangered Hilo ischaemum Ischaemum byrone Endangered Endangered

5-8 2003 Annual Site Environmental Report for TTR & KTF
TABLE 5-3. Threatened and Endangered Species Potentially Occurring on KTF (continued) Aupaka Isodendrion laurifolium Endangered Endangered Aupaka Isodendrion longifolium Threatened Threatened Koki’o Kokis Kauaiensis Endangered Endangered Kamakahala Labordia lydgatei Endangered Endangered Kamakahala Labordia tinifolia var. wahiawaensis Endangered Endangered Nehe Lipochaeta fauriei Endangered Endangered Nehe Lipochaeta micrantha var. exigua Endangered Endangered Nehe Lipochaeta micrantha var. micrantha Endangered Endangered Nehe Lipochaeta waimeaensis Endangered Endangered No common name Lobelia niihauensis Endangered Endangered No common name Lysimachia filifolia Endangered Endangered No common name Mariscus pennatiformis ssp. pennatiformis Endangered Endangered Alani Melicope haupuensis Endangered Endangered Alani Melicope knudsenii Endangered Endangered Alani Melicope pallida Endangered Endangered Alani Melicope quadrangularis Endangered Endangered No common name Munroidendron racemosum Endangered Endangered Kolea Myrsine linearifolia Threatened Threatened 'Aiea Nothocestrum peltatum Endangered Endangered Lau 'ehu Panicum niihauense Endangered Endangered Makou Peucedanum sandwicense Threatened Threatened
Wawae'iole Phlegmariurus mannii (listed as Huperzia mannii) Endangered Endangered
Wawae'iole Phlegmariurus nutans (listed as Lycopodium nutans) Endangered Endangered
No common name Phyllostegia glabra var. lanaiensis Endangered Endangered No common name Phyllostegia knudsenii Endangered Endangered No common name Phyllostegia waimeae Endangered Endangered No common name Phyllostegia wawrana Endangered Endangered Ale Plantago princeps var. anomala Endangered Endangered Ale Plantago princeps var. longibracteata Endangered Endangered No common name Platanthera holochila Endangered Endangered Mann's bluegrass Poa mannii Endangered Endangered Hawaiian bluegrass Poa sandvicensis Endangered Endangered No common name Poa siphonoglossa Endangered Endangered Loulu Pritchardia napaliensis Endangered Endangered Loulu Pritchardia viscosa Endangered Endangered Kaulu Pteralyxia kauaiensis Endangered Endangered No common name Remya kauaiensis Endangered Endangered No common name Remya montgomeryi Endangered Endangered Dwarf naupaka Scaevola coriacea Endangered Endangered Ma'oli'oli Schiedea apokremnos Endangered Endangered No common name Schiedea helleri Endangered Endangered No common name Schiedea kauaiensis Endangered Endangered No common name Schiedea membranacea Endangered Endangered No common name Schiedea nuttallii Endangered Endangered No common name Schiedea spergulina var. leiopoda Endangered Endangered No common name Schiedea spergulina var. spergulina Threatened Threatened Laulihilihi Schiedea stellarioides Endangered Endangered 'Ohai Sesbania tomentosa Endangered Endangered No common name Silene lanceolata Endangered Endangered Popolo ku mai Solanum incompletum Endangered Endangered
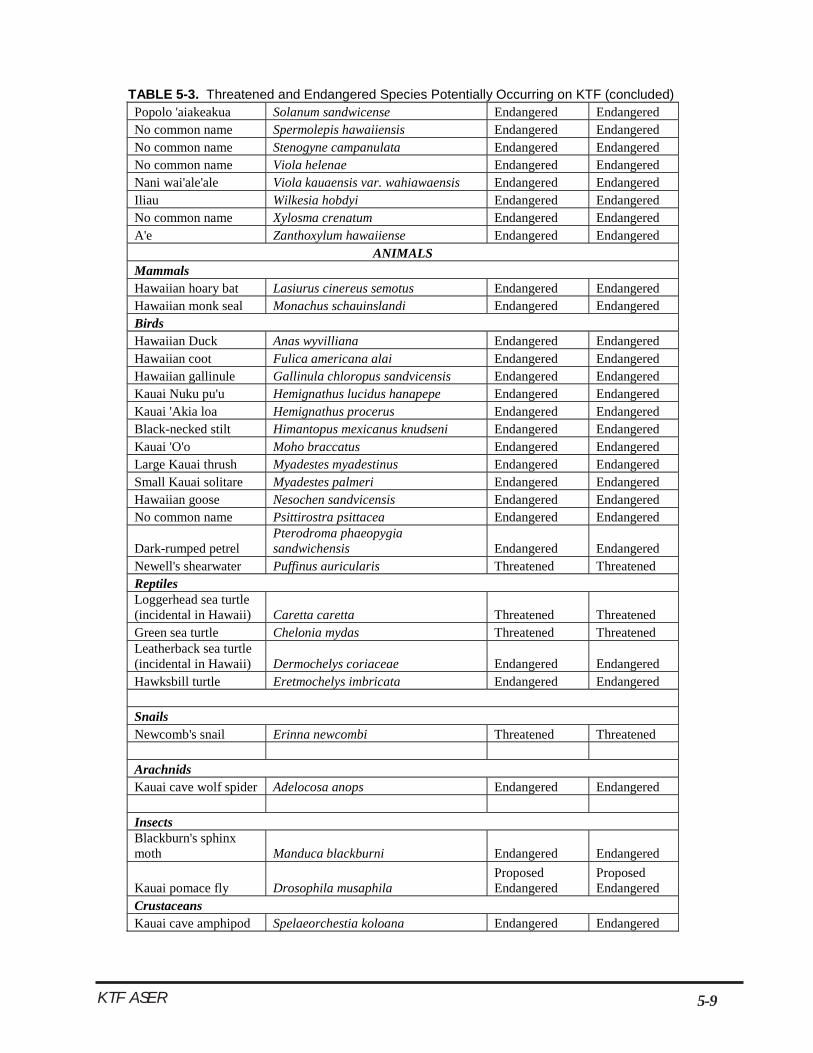
5-9KTF ASER
TABLE 5-3. Threatened and Endangered Species Potentially Occurring on KTF (concluded) Popolo 'aiakeakua Solanum sandwicense Endangered Endangered No common name Spermolepis hawaiiensis Endangered Endangered No common name Stenogyne campanulata Endangered Endangered No common name Viola helenae Endangered Endangered Nani wai'ale'ale Viola kauaensis var. wahiawaensis Endangered Endangered Iliau Wilkesia hobdyi Endangered Endangered No common name Xylosma crenatum Endangered Endangered A'e Zanthoxylum hawaiiense Endangered Endangered
ANIMALS Mammals Hawaiian hoary bat Lasiurus cinereus semotus Endangered Endangered Hawaiian monk seal Monachus schauinslandi Endangered Endangered Birds Hawaiian Duck Anas wyvilliana Endangered Endangered Hawaiian coot Fulica americana alai Endangered Endangered Hawaiian gallinule Gallinula chloropus sandvicensis Endangered Endangered Kauai Nuku pu'u Hemignathus lucidus hanapepe Endangered Endangered Kauai 'Akia loa Hemignathus procerus Endangered Endangered Black-necked stilt Himantopus mexicanus knudseni Endangered Endangered Kauai 'O'o Moho braccatus Endangered Endangered Large Kauai thrush Myadestes myadestinus Endangered Endangered Small Kauai solitare Myadestes palmeri Endangered Endangered Hawaiian goose Nesochen sandvicensis Endangered Endangered No common name Psittirostra psittacea Endangered Endangered
Dark-rumped petrel Pterodroma phaeopygia sandwichensis Endangered Endangered
Newell's shearwater Puffinus auricularis Threatened Threatened Reptiles Loggerhead sea turtle (incidental in Hawaii) Caretta caretta Threatened Threatened Green sea turtle Chelonia mydas Threatened Threatened Leatherback sea turtle (incidental in Hawaii) Dermochelys coriaceae Endangered Endangered Hawksbill turtle Eretmochelys imbricata Endangered Endangered Snails Newcomb's snail Erinna newcombi Threatened Threatened Arachnids Kauai cave wolf spider Adelocosa anops Endangered Endangered Insects Blackburn's sphinx moth Manduca blackburni Endangered Endangered
Kauai pomace fly Drosophila musaphila Proposed Endangered
Proposed Endangered
Crustaceans Kauai cave amphipod Spelaeorchestia koloana Endangered Endangered

5-10 2003 Annual Site Environmental Report for TTR & KTF
operation by the State of Hawaiiunder a “Noncovered SourcePermit (NSP)” (HawaiiDepartment of Health 1998), forwhich we have received anextension in 2003.
Rocket launches are mobilesources and do not requirereporting of reportable quantity(RQ) releases.
As required by the EPA, the 2003Annual Fee and Monitoring Report(air emissions) was submitted tothe State of Hawaii at the end ofFebruary 2003 (SNL 2003). SandiaCorporation was in compliancewith all air quality regulations in2003.
Clean Water Act (CWA)There were no compliance issueswith respect to any state or federalwater pollution regulations in 2003.There are three septic tanks on-site owned by SNL/KTF facilities,which currently do not requirepermits from the State of Hawaii.
A National Pollutant DischargeElimination System (NPDES)permit is not required due to thelack of significant storm waterrunoff discharging into “Waters ofthe U.S,” as defined in 40 CFR122. However, this is not to saythat there is no runoff. The EPAhas concern with storm waterrunoff washing off the launcherpads and discharging to the ocean.Some of the downstreampathways include habitat forseveral federally-designatedendangered or threatened species.The EPA has thereforerecommended periodic evaluationsfor environmental contamination.
Oil Storage – There is oneunderground storage tank (UST)at SNL/KTF, which is owned bythe DOE. There is also one10,000-gallon aboveground fueltank inside the Main Compound.Sandia Corporation cooperateswith the U.S. Navy’s spill controlguidelines contained in the SpillPrevention Control andCountermeasures (SPCC) Plan,Pacific Missile Range Facility(NFEC 1997).
A minor procedural error in ourannual monitoring program led toa minor EPA violation whichresulted in a fine of $50.00 (seeReleases and Occurrences foradditional information). We havecorrected this oversight byscheduling our annual inspectionsin conjunction with PMRF.
Safe Drinking Water Act(SDWA)The SDWA does not apply directlyto Sandia Corporation activities atSNL/KTF because all drinkingwater is obtained through PMRF’sfacilities or is purchased fromcommercial suppliers.
Toxic Substances Control Act(TSCA)TSCA regulates the distribution ofpolychlorinated biphenyls (PCBs)and asbestos. The transformers onthe SNL/KTF site have beentested and are free of PCBs, andthere are no asbestos issues at thesite.
Federal Insecticide, Fungicide,and Rodenticide Act (FIFRA)FIFRA controls the distribution andapplication of pesticides includingherbicides, insecticides, androdenticides. All pesticide use atSNL/KTF follows EPArequirements.
Releases and OccurrencesThere was one reportableoccurrence at SNL/KTF in 2003:On April 29, 2003, a programmanager for the EPA and asupervisor for the HawaiiDepartment of Health visited KTFto conduct a leak detectioncompliance inspection of regulatedunderground storage tanks. SNL/KTF was in compliance with allrequirements except for the sensorannual maintenance, which had notbeen done since January 2000.The EPA inspector wrote a fieldcitation, No. UST-09 1433, whichstated that the violation was“Failure to have annualmaintenance on leak detectionsystem.” The citation carried withit a $50.00 fine.
5.5 ENVIRONMENTAL
PROGRAM
ACTIVITIES
This section describes threeenvironmental programs: NEPA,the ER Project, and the SpillPrevention Program.
NEPA Program ActivitiesIn accordance with NEPA, acomprehensive Site-wide EA wascompleted for SNL/KTF in 1992(DOE 1992a), which resulted in aFinding of No Significant Impact(FONSI), issued on July 17, 1992.This EA is the current NEPAdocument covering all rocket-launching activities at SNL/KTF.Additionally, an EIS specific to theSTARS Program is in place forrocket launches of this type (DoD1998).
Prior to Sandia Corporationbeginning any proposed action thatmay potentially affect sensitivespecies or habitats, a NEPAChecklist is submitted to DOE/

5-11KTF ASER
NNSA/SSO for a determination.As it is applicable, DOE/NNSA/SSO must consult with thefollowing agencies:
• U.S. Fish and Wildlife Service
• State of Hawaii Department ofLand and Natural Resources
In 2003, SNL/NM NEPA staffcompleted one NEPA compliancereview for proposed actions at SNL/KTF. This review referencedexisting NEPA documentation forKTF.
ER Project ActivitiesThere are no ER sites at SNL/KTF. The three ER sites identifiedin 1995 were given a No FurtherAction (NFA) determination by theEPA on September 30, 1996. Thisconfirmed that SNL/KTF met allCERCLA requirements and noadditional sampling or remediationwould be necessary in the threeareas. This, however, does notpreclude that other environmentalsampling activities will take placeat SNL/KTF.
5.6 ENVIRONMENTAL
SURVEILLANCE
AND MONITORING
ACTIVITIES
Wastewater MonitoringSandia Corporation’s activities atSNL/KTF produce only sanitarysewage, which is directed into fivewastewater systems—three septictanks and two French drains—inaccordance with HawaiiUnderground Injection Controlregulations (HAR Title 11, Chapter23). The septic systems areperiodically pumped by licensedstate-certified contractors andinspected by state officials. Thelimited quantity of sewage
released does not impact anyprotected waters and, as notedearlier, there are no drinking waterwells in the area of SNL/KTF.Currently, septic tanks do notrequire permitting or sampling. Asa best management practice(BMP), Sandia Corporationperiodically performs sampling. InSeptember 2003, the septic tankswere sampled and nocontaminants were identifiedabove the reporting limits.
Air Emission MonitoringBased on effluent air monitoringresults of the STARS Flight TestUnit 1 (FTU-1) in February 1993and the CDX rocket launch in thesummer of 1992 (SNL 1992), itwas determined that rocketlaunches at SNL/KTF were not asignificant source of air pollutants.Launches are infrequent andemissions recorded did not exceedfederal and state standards.Because the STARS type rocketproduces the greatest air emissionsand remained within acceptablelimits, it can be assumed thatfuture launches of this type will alsobe within acceptable limits.Therefore, no further air emissionmonitoring is planned at this time.If a new rocket type is launchedfrom SNL/KTF that differs inemission substance from theSTARS rocket, or air emissionrequirements change, futuremonitoring may be considered.
Meteorological MonitoringOn-site meteorologicalinstruments are used during testperiods to characterizeatmospheric transport, diffusionconditions, and stability classes.Due to the infrequency oflaunches, no formal meteorologicalmonitoring plan is in place forSNL/KTF. Climatic information
representative of SNL/KTF isobtained from the PMRF.
Noise MonitoringIn accordance with the QuietCommunities Act of 1978 (42U.S.C. 4901 et seq.), noisemonitoring was conducted inFebruary 1993 during the STARSFTU-1 launch to confirm thedetermination made in the STARSEIS that noise produced from thelargest launch would be belowmaximum acceptable levels (SNL1993). Data collected in thenearest town of Kekaha indicatedthat levels were no louder thannoise generated from passingvehicles on a nearby highway.
Terrestrial SurveillanceTerrestrial surveillance samplingof soil is conducted every fiveyears. No sampling occurred in2003.

5-12 2003 Annual Site Environmental Report for TTR & KTF
Third Annual KTF Photo Contest Winner
First Place Winner:Reginald Tibbetts Jr.
ASI 1990 Archaeological Survey and Testing, Department of Energy, KauaiTest Facility. Prepared for Sandia National Laboratories, byAdvanced Sciences, Inc., San Diego, CA (1990).
Brock 1990 Brock, Richard E., A Survey of the Green Sea Turtle PopulationFronting the Kauai Test Facility, Pacific Missile Range, BarkingSands, Kauai: An Analysis of Potential Impacts withImplementation of the Strategic Defense Initiative. Prepared for ITCorporation by Environmental Assessment Co., Honolulu, HI (1990).
Brookins 1992 Brookins, D., “Background Radiation in the Albuquerque, NewMexico, U.S.A., Area,” in Environmental Geology and WaterScience, Vol. 19, No. 1, pp. 11-15 (1992).
DOC 2004 U.S. Department of Commerce, U.S. Census Bureau, website at<http://www.census.gov/> (2004).
DoD 1998 U.S. Department of Defense, Pacific Missile Range FacilityEnhanced Capability Final Environmental Impact Statement (EIS).U.S. Department of Defense, Department of the Navy, Kauai, HI(December 1998).
DoD/DOE/ U.S. Department of Defense, U.S. Department of Energy, and NevadaState of NV Department of Conservation and Natural Resources,1996 Federal Facility Agreement and Consent Order (FFACO).
State of Nevada Department of Conservation and Natural Resources,Division of Environmental Protection and the U.S. DOE and the U.SDoD in the Matter of Federal Facility Agreement and Consent Order(March 15, 1996). Available on the Web at: http://ndep.nv.gov/boff/ffco.htm.
DOE 2003 DOE Order 450.1 (See DOE Orders Section).
DOE 2003a U.S. Department of Energy, Nevada Test Site Annual SiteEnvironmental Report for CY 2002, DOE/NV 11718-842 (Section.5, “Radiological Environmental Programs”). Preparedby Bechtel for the U.S. DOE/NNSA, , Las Vegas NV (2003).
DOE 2002a DOE Order 470.2B (See DOE Orders Section).
DOE 2001 DOE Order 451.1B (See DOE Orders Section).
DOE 2001a DOE Order 435.1 (See DOE Orders Section).
DOE 2000 DOE Manual 231.1-1 (See DOE Orders Section).
DOE 1996 DOE Order 231.1 (See DOE Orders Section).
Chapter Six
TTR & KTF ReferencesIn this Chapter ...ReferencesExecutive OrdersDOE OrdersCode of Federal RegulationsAct and StatutesState of Hawaii Environmental RegulationsState of Nevada Environmental Regulations

6-2 2003 Annual Site Environmental Report for TTR & KTF
DOE 1996a U.S. Department of Energy, Final Environmental Impact Statement for the Nevada Test Site andOff-Site Locations in the State of Nevada, DOE/EIS-0243. DOE, Nevada Operations Office, LasVegas, NV (August 1996).
DOE 1994 U.S. Department of Energy, Memorandum of Agreement Between the Nevada Operations Officeand the Albuquerque Operations Office, DE-GM08-98NV13555, as amended (Appendix C,Tonopah Test Range, signed October 1997). U.S. Department of Energy, Albuquerque, NM andLas Vegas, NV (1994).
DOE 1993 DOE Order 5400.5 (See DOE Orders Section).
DOE 1993a DOE/AL Order 5400.2A (See DOE Orders Section).
DOE 1992 U.S. Department of Energy, Water Conservation Plan for the Tonopah Test Range, 4809. U.S.Department of Energy/Nevada Operations Office, Las Vegas, NV (1992).
DOE 1992a U.S Department of Energy, Kauai Test Facility Environmental Assessment, DOE/EA-0492. U.SDepartment of Energy, Albuquerque Operations Office (DOE/AL), Albuquerque, NM (1992).
DOE 1990 DOE Order 5400.1 (See DOE Orders Section).
Dragun and Dragun, J. and A. Chiasson, Elements in North American Soils. Hazardous Materials ControlChiasson Resources Institute, Greenbelt, MD (1991).1991
DRI 1997 Desert Research Institute (DRI), Draft Analysis of Ambient Airborne Particulate Matter forPlutonium; Clean Slate 1 During Excavation and Truck Loading, Tonopah Test Range, May1997 - June 1997, DRI Document Number 6357-683-7562.1D1. Prepared by DRI for the U.S.Department of Energy/Nevada Field Office, Las Vegas, NV (November 14, 1997).
DRI 1991 Desert Research Institute, Special Nevada Report, DOE/NV/10715-T1. Prepared by ScienceApplications International Corporation (SAIC) for the Department of the Air Force (September 23,1991).
DRI/DOE 2003 Desert Research Institute/U. S. Department of Energy, Community Environmental MonitoringProgram ( CEMP) website: http://www.wrcc.dri.edu/cemp/ (2003).
Dunaway Dunaway, P.B. and M.G. White, The Dynamics of Plutonium in Desert Environments, Nevadaand White, Applied Ecology Group Progress Report, NVO-142. U.S. Atomic Energy Commission, Nevada1974 Operations Office, Las Vegas, NV (1974).
E&E 1989 Ecology and Environment, Inc., Federal Facility Preliminary Assessment Review, EPA Region IX,F9-8903-021, NV3570090016. Ecology and Environment, Inc., San Francisco, CA (1989).
EG&G 1995 Edgerton, Germeshausen & Grier Corporation, Aerial Radiological Survey of the Tonopah TestRange Including Clean Slate 1, 2, 3, Roller Coaster, Decontamination Area, Cactus SpringsRanch Target Areas, Central Nevada, EGG-11265-1145. EG&G Energy Measurements, Inc., LasVegas, NV (1995).
EG&G 1979 Edgerton, Germeshausen & Grier Corporation, Status of Endangered and Threatened PlantSpecies on Tonopah Test Range - A Survey, EGG-1183-2387. EG&G, Las Vegas, NV (1979).
EPA 2004 U.S. Environmental Protection Agency, “National Priorities List (NPL) Sites in the United States,”available on the Web at http://www.epa.gov/superfund/sites/npl/npl.htm. U.S. EnvironmentalProtection Agency, Washington, DC (2004).

Chapter 5 6 -3
EPA 1999 U.S. Environmental Protection Agency, Off-site Environmental Monitoring Report: RadiationMonitoring Around United States Nuclear Test Areas, Calendar Year 1997, EPA/402-R-98-013,U.S. Environmental Protection Agency, Las Vegas, NV (1999).
ERDA 1975 U.S. Energy Research and Development Administration, Environmental Assessment, Tonopah TestRange, EIA/MA/76-2. U.S. Energy Research and Development Administration (ERDA),Washington, DC (1975).
Essington and Essington, E. H., and E. B. Fowler, “Distribution of Transuranic Nuclides in Soils,”Fowler 1976 a review in Transuranics in Natural Environments, Report NVO-178. U.S. Energy Research and
Development Administration, Las Vegas, NV (1976).
Funk 1985 Funk, Evangeline J., Flora, Fauna, and Water Resources Report of the Pacific Missile RangeFacility, Hawaiian Area, Kauai, HI. Prepared for the U.S. Navy by Botanical Consultants,Honolulu, HI (1985).
Gilbert et al. Gilbert, R. O., et al., “Statistical Analysis of 239-240Pu and 241Am Contamination of Soil and1975 Vegetation on NAEG Study Sites,” in The Radioecology of Plutonium and Other Transuranics in
Desert Environments, Report NVO-153. U.S. Energy Research and Development Administration,Las Vegas, NV (1975).
Gore 1993 Gore, Al., From Red Tape to Results: Creating a Government that Works Better and Costs Less(Report of the National Performance Review). U.S. Government Printing Office, Washington, DC(1993).
Hawaii Dept. “State of Hawaii Noncovered Source Permit No. 0429-01-N, ” Expiration Date 09/01/2003. State ofof Health, Hawaii DOH. Honolulu, HI (9/15/98).(DOH) 1998
IT 1996 IT Corporation, Sampling and Analysis Plan for Clean Slate 1. IT Corporation (September 1996).
IT 1994 IT Corporation, Sandia National Laboratories/New Mexico Septic Tank Monitoring Report,Kauai Test Facility. IT Corporation, prepared for Sandia National Laboratories, Albuquerque, NM(1994).
IT 1993 IT Corporation, Analytical Results for Tonopah Test Range, Transformer Oil Samples, CollectedJuly 16-18, 1993. IT Corporation, Albuquerque, NM (September 1993).
Kabata- Kabata-Pendias and Pendias, 1992, Trace Elements in Soils and Plants, 2nd. Ed. CRC Press, Inc.,Pendias and Boca Raton, FL (1992).Pendias, 1992
Leavitt 1980 Leavitt, V., Soil Profiles of Mounds on Plutonium-Contaminated Areas of the Nevada Test RangeComplex. Environmental Monitoring Systems Laboratory, U.S. Environmental ProtectionAgency, Las Vegas, NV (1980).
Leavitt 1976 Leavitt, V., “Soil Surveys of Five Plutonium-Contaminated Areas on the Test Range Complex inNevada,” in Nevada Applied Ecology Group Procedures Handbook for EnvironmentalTransuranics, Report NVO-166, Volume 1. National Environmental Research Center, Las Vegas,NV (1976).
NFEC 1997 Sandia National Laboratories, Spill Prevention Control and Countermeasures (SPCC) Plan,Pacific Missile Range Facility, Kauai, Hawaii. Prepared for Sandia National Laboratories by theNaval Facilities Engineer Command (NFEC), Environmental Division, Pearl Harbor, HI (January1997).

2003 Annual Site Environmental Report, Tonopah Test Range6-4
Romney et al. Romney, E. M., et al., “239-240Pu and 241Am Contamination of Vegetation in Aged Plutonium1975 Fallout Areas,” in The Radioecology of Plutonium and Other Transuranics in Desert Environments,
Report NVO-153. U.S. Energy Research and Development Administration, Las Vegas, NV (1975).
Schaeffer 1970 Schaeffer, J. R., Climatology of Tonopah Test Range, Nevada 1961-1969, SC-TM-70-0215. SandiaNational Laboratories, Albuquerque, NM (1970).
Shyr, Herrera, Shyr, L, H. Herrera, R. Haaker, The Role of Data Analysis in Sampling Design ofHaaker 1998 Environmental Monitoring, SAND98-0612. Sandia National Laboratories, Albuquerque, NM
(March 1998).
Sinnock 1982 Sinnock, S., Geology of the Nevada Test Site and Nearby Areas - Southern Nevada, SAND82-2207.Sandia National Laboratories, Albuquerque, NM (1982).
SNL 2004 Sandia National Laboratories, NESHAP Annual Report for CY 2003, Sandia National Laboratories,Nevada, Internal Doc # 75-1021-7. Sandia National Laboratories, Albuquerque, NM (June 2004).
SNL 2004a Sandia National Laboratories, Tonopah Test Range Data Analysis in Support of the Annual SiteEnvironmental Report, 2003. Sandia National Laboratories, Albuquerque, NM (July 2004).
SNL 2004b Sandia National Laboratories, Toxic Chemical Release Reporting Community Right-to-Know:Calendar Year 2003. Sandia National Laboratories, Albuquerque, NM (June 2004).
SNL 2003 Sandia National Laboratories, “Noncovered Source Permit No. 0429-01-N: 2002 Annual Fee andMonitoring Report” (for Kauai Test Facility). Sandia National Laboratories, Albuquerque, NM.(February 18, 2003).
SNL 2002 Sandia National Laboratories, 2001 Hazardous Waste Biennial Report for Sandia NationalLaboratories/New Mexico and Sandia National Laboratories/Tonopah Test Range, Sandia NationalLaboratories, Albuquerque, NM (March 2002).
SNL 1999 Sandia National Laboratories, Spill Prevention Control and Countermeasures (SPCC) Plan for SNLTonopah Test Range, Plan 90-12, Rev. 4. Sandia National Laboratories, Albuquerque, NM (October1999).
SNL 1997 Sandia National Laboratories, (1) NESHAP Annual Report for CY 1996 (EPA Summary) and (2)Radiological Dose Calculations and Supplemental Dose Assessment Data for NESHAP Compliancefor Sandia National Laboratories, Nevada, CY 1996. Sandia National Laboratories, Albuquerque,NM (1997).
SNL 1996 Sandia National Laboratories, (1) NESHAP Annual Report for CY 1995 (EPA Summary) and (2)Radiological Dose Calculations and Supplemental Dose Assessment Data for NESHAP Compliancefor Sandia National Laboratories, Nevada, CY 1995. Sandia National Laboratories, Albuquerque,NM (1996).
SNL 1995 Sandia National Laboratories, Site Inspection Report for the Kauai Test Facility. Sandia NationalLaboratories, Albuquerque, NM (April 1995).
SNL 1993 “SNL Acoustic Monitoring Plan of the STARS Flight Test Unit 1.” Memo to Linda Ninh from B.E.Swanson. Sandia National Laboratories, Albuquerque, NM (1993).
SNL 1992 Sandia National Laboratories, “CDX Rocket Motor Effluent Monitoring,” Memo from W.E. Stocum(7712) to R.G. Hay (2723). Sandia National Laboratories, Albuquerque, NM (1992).
State of State of Nevada, State of Nevada Bureau of Health Protection Services Vulnerability AssessmentNevada Contamination Monitoring Waiver. State of Nevada, (Sampling protocols for water quality,1997 expiration date 2010) (October 21, 1997).

References 6-5
Tamura 1977 Tamura, T., “Plutonium Distribution in a Desert Pavement - Desert Mound Soil System in Area 11,” inEnvironmental Plutonium on the Nevada Test Site and Environs, Report NVO-171. U.S. EnergyResearch and Development Administration, Las Vegas, NV (1977).
Tamura 1976 Tamura, T., “Plutonium Association in Soils,” in Transuranics in Natural Environments, Report NVO-178. U.S. Energy Research and Development Administration, Las Vegas, NV (1976).
Tamura 1975 Tamura, T., “Characterization of Plutonium in Surface Soils from Area 13 of the Nevada Test Site,” inThe Radioecology of Plutonium and Other Transuranics in Desert Environments, Report NVO-153.U.S. Energy Research and Development Administration, Las Vegas, NV (1975).
USAF/DOE U.S. Air Force/DOE/NNSA, Department of the Air Force Permit to the National Nuclear Security/NNSA 2002 Administration to use Property Located on the Nevada Test and Training Range, Nevada. U.S. Air/
DOE/NNSA, Tonopah, Nevada (2002).
USAF 1978 United States Air Force, Final Environmental Impact Statement, Proposed Public Land Withdrawal,Nellis Air Force Bombing Range: Nye, Clark, and Lincoln Counties, Nevada. Department of the AirForce, Washington, DC (1978).
EXECUTIVE ORDERSEO 11990 Protection of Wetlands, as amended (May 24, 1977).
EO 11988 Floodplain Management, as amended (May 24, 1977).
EO 12898 Federal Actions To Address Environmental Justice in Minority Populations and Low-IncomePopulations, as amended (February 11, 1994).
EO 13101 Greening the Government Through Waste Prevention, Recycling, and Federal Acquisition (September 14, 1998).
EO 13123 Greening the Government Through Efficiency Energy Management (June 3, 1999).
EO 13148 Greening the Government Through Leadership in Environmental Management (April 21, 2000).
EO 13149 Greening the Government Through Federal Fleet and Transportation Efficiency (April 21, 2000).
DOE ORDERSDOE 2003 U.S. Department of Energy, Environmental Protection Program, DOE Order 450.1, U.S. Department of
Energy, Washington, DC (January 15, 2003).
DOE 2002a U.S. Department of Energy, Independent Oversight and Performance Assurance Program, DOE Order470.2B. U.S. Department of Energy, Washington, DC (October 31, 2002).
DOE 2001 U.S. Department of Energy, National Environmental Policy Act Compliance Program, DOE Order 451.1B.U.S. Department of Energy, Washington, DC (Stepember 28, 2001).
DOE 2001a U.S. Department of Energy, Radioactive Waste Management, DOE Order 435.1, Change 1. U.S. Departmentof Energy, Washington, DC (August 28, 2001).
DOE 2000 U.S. Department of Energy, Environment, Safety, and Health Reporting Manual, DOE Manual 231.1-1,Change 2. U.S. Department of Energy, Washington, DC (January 28, 2000).
DOE 1996 U.S. Department of Energy, Environment, Safety, and Health Reporting, DOE Order 231.1, Change 2.U.S. Department of Energy, Washington, DC (November 7, 1996).

2003 Annual Site Environmental Report, Tonopah Test Range6-6
DOE 1993 U.S. Department of Energy, Radiation Protection of the Public and the Environment, DOE Order 5400.5.U.S. Department of Energy, Washington, DC (January 7, 1993).
DOE 1993a U.S. Department of Energy, Environmental Compliance Issue Coordination, DOE/AL 5400.2A. U.S.Department of Energy, Albuquerque Field Office, Albuquerque, NM (July 13,1993).
DOE 1990 U.S. Department of Energy, General Environmental Protection Program, DOE Order 5400.1, Change 1.DOE, Washington, DC (June 29, 1990).
CODE OF FEDERAL REGULATIONS10 CFR 1021 “National Environmental Policy Act Implementing Procedures”
40 CFR 61 “National Emission Standards for Hazardous Air Pollutants (NESHAP)”
40 CFR 110 “Discharge of Oil”
40 CFR 112 “Oil Pollution Prevention”
40 CFR 141.26 “Monitoring Frequency for Radioactivity in Community Water Systems”
40 CFR 270 “EPA Administered Permit Programs: The Hazardous Waste Permit Program”
40 CFR 280 “Technical Standards and Corrective Action Requirements for Owners and Operators ofUnderground Storage Tanks”
40 CFR 355 “Emergency Planning and Notification”
40 CFR 370 “Hazardous Chemical Reporting: Community Right-to-Know”
40 CFR 122 “EPA Administered Permit Programs: The National Pollutant Discharge Elimination System”

References 6-7
ACTS & STATUTES
• American Indian Religious Freedom Act (AIRFA) of 1978 (42 U.S.C. §1996).• Archaeological Resources Protection Act (ARPA) of 1979 (16 U.S.C. § 470aa).• Atomic Energy Act (AEA) of 1954 (42 U.S.C. §2011 et seq.).• Clean Air Act (CAA) and CAA Amendments (CAAA) of 1990 (42 U.S.C. §7401).• Clean Water Act (CWA) of 1977 (The Federal Water Pollution Control Act) (33 U.S.C. §1251).• Comprehensive Environmental Response, Compensation, and Liability Act (CERCLA) of 1980
(42 U.S.C. §9601) (Amended by SARA).• Emergency Planning and Community Right-to-Know Act (EPCRA) of 1986 (42 U.S.C. § 11001 et seq.) (Also known as
SARA Title III).• Endangered Species Act (ESA) (16 U.S.C. §1531 et seq.).• Federal Facility Compliance Act (FFCA) of 1992 (42 U.S.C. § 6961).• Federal Insecticide, Fungicide, and Rodenticide Act (FIFRA) (7 U.S.C. § 136).• Migratory Bird Treaty Act (MBTA) of 1918, as amended (16 U.S.C. § 703 et seq.).• National Environmental Policy Act (NEPA) of 1969 (42 U.S.C.§4321).• National Historic Preservation Act of 1966 (16 U.S.C.§470).• Pollution Prevention Act of 1990 (42 U.S.C.§13101 et seq.).• Quiet Communities Act of 1978 (42 U.S.C. §4901 et seq.).• Resource Conservation and Recovery Act (RCRA) of 1976 (42 U.S.C. § 6901 et seq.).• Safe Drinking Water Act (SDWA) (42 U.S.C. §300f).• Superfund Amendments and Reauthorization Act (SARA) of 1986 (see CERCLA).• Toxic Substances Control Act (TSCA) of 1976 (15 U.S.C. §2601 et seq).
STATE OF HAWAIIENVIRONMENTAL REGULATIONS
Hawaii Administrative Rules (HAR), Title 11, Chapter 23, “Underground Injection Control”
Hawaii Administrative Rules (HAR), Title 11, Chapter 59, “Ambient Air Quality Standards”

2003 Annual Site Environmental Report, Tonopah Test Range6-8
Nevada regulatory information can be found at the Nevada State Legislature website: http://www.leg.state.nv.us/
A listing of the Nevada Administrative Code (NAC) can be found at: http://www.leg.state.nv.us/NAC/CHAPTERS.HTML
STATE OF NEVADAENVIRONMENTAL REGULATIONS
TABLE 6-1. State of Nevada Administrative Code (NAC) Applicable to the TTR
Chapter 444, Sanitation Applicable Sources or Activities
• Disposal of construction debris • Disposal of routine non-hazardous solid
wastes
NAC 444.570 to 444.7499, "Solid Waste Disposal"
• Disposal of septic sludge
NAC 444A.005 to 444A.500, "Programs for Recycling" • Recyclable materials including waste tires
Chapter 445A, Water Controls
NAC 445A.070 to 445A.348, "Water Pollution Control" • Septic tanks • Surface water runoff
NAC 445A.450 to 445A. 6731, "Public Water Systems" •• Production well sampling
Chapter 445B, Air Controls
NAC 445B.001 to 445B.3497, "Air Pollution" • Open burning
• Hazardous air pollutants from stacks and vents
• Disturbance of soils during construction (particulate matter)
NAC 445B.400 to 445B.774, "Emissions From Engines" • Generators • Mobile sources Chapter 504, Wildlife Management and Propagation*
NAC 504.110 to 504.340, "Wildlife Management Areas"
• Road construction
NAC 504.510 to 504.550, "Alteration of Stream System or Watershed"
• Construction activities
NAC 504.800 to 504.865, "Preservation of Wild Horses"**
• General activities on the range in wild horse areas
Chapter 534, Underground Water and Wells
NAC 534.010 to 534.450, "Underground Water and Wells"
• Drilling, operation, and abandonment of wells
NOTE: *This regulation provides protection to endangered, threatened, and sensitive species. **Two wild horse units encompass areas within the Nellis Air Force Range:
"Unit 252: That portion of Nye County ….. and those portions of the Nellis Air Force Range as authorized by the United States Department of Defense." "Unit 253: That portion of Nye County … including those portions of the Nellis Air Force Range as authorized by the United States Department of Defense and the Nevada Test Site as authorized by the United States Department of Energy." TTR = Tonopah Test Range
Appendix A
Terrestrial Surveillance Results and
Sampling Location Maps For TTR

2003 Annual Site Environmental Report, Tonopah Test RangeA-ii
B2 Drop at Tonopah Test Range

Appendix A A-iii
CONTENTS FIGURES A-1 Off-site Soil Sampling Locations (14 Locations) .......................................................................... A-4 A-2 Perimeter Soil Sampling Locations (Eight Locations).................................................................. A-7 A-3 Soil Sampling Locations in the South Plume Area (On-site) (Five locations).............................. A-9 A-4a Soil Sampling Locations in the Range Operations Center and Compound (On-site) (Six locations)............................................................................................................................. A-12 A-5a Various On-site Soil Sampling Locations (Five locations) ......................................................... A-15 A-5b Various Soil Sampling Locations at Mellan Hill Area (Two locations)........................................ A-16 A-5c Soil Sampling Locations Near the Hard Target/Depleted Uranium Area (One location) .................................................................................................................... A-17 TABLES A-1 Radiological Results for Off-site Soil Sampling Locations at TTR, 2003..................................... A-1 A-2 Radiological Results for Perimeter Soil Sampling Locations at TTR, 2003................................. A-5 A-3 Radiological Results for South Plume Area On-site Soil Sampling Locations at TTR, 2003................................................................................................................ A-8 A-4 Radiological Results for Range Operations Center On-site Soil Sampling Locations at TTR, 2003....................................................................................... A-10 A-5 Radiological Results for Various On-site Soil Sampling Locations at TTR, 2003...................... A-13 A-6 Radiological Replicate Sampling for Soil Sampling Locations, 2003......................................... A-18 A-7 Summary TLD Results for Calendar Year 2003, Tonopah Test Range .................................... A-20 A-8 TLD Measurements by Quarter and Location Class for Calendar Year 2003 ........................... A-21

2003 Annual Site Environmental Report, Tonopah Test RangeA-iv
This page intentionally left blank.

A-1Appendix A
TABLE A-1. Radiological Results for Off-site Soil Sampling Locations at TTR, 2003
Location Analyte Units Activity (± 2 σ) Decision
Level Detection
Limit Lab
Qualifier C-20 Americium-241 pCi/g 0 ± 0.0868 0.055 0.111 UX Cesium-137 pCi/g 0.26 ± 0.0335 0.00837 0.0171 Potassium-40 pCi/g 31.7 ± 3.08 0.0647 0.135 Uranium-235 pCi/g 0.0678 ± 0.109 0.0591 0.12 U Uranium-238 pCi/g 1.79 ± 1.1 0.46 0.929 Uranium mg/kg 0.565 0.00589 0.0393 C-21 Americium-241 pCi/g 0.00401 ± 0.0408 0.0388 0.0785 U Cesium-137 pCi/g 0.203 ± 0.0285 0.00769 0.0158 Potassium-40 pCi/g 27.4 ± 2.54 0.0638 0.134 Uranium-235 pCi/g 0.0789 ± 0.0997 0.0484 0.0979 U Uranium-238 pCi/g 1.48 ± 0.669 0.311 0.628 Uranium mg/kg 0.738 ± 0 0.00593 0.0395 C-22 Americium-241 pCi/g -0.0275 ± 0.0236 0.0193 0.039 U Cesium-137 pCi/g 0.0804 ± 0.0286 0.0155 0.0318 Potassium-40 pCi/g 31.2 ± 2.85 0.129 0.271 Uranium-235 pCi/g 0.128 ± 0.13 0.0667 0.135 U Uranium-238 pCi/g 2.19 ± 0.653 0.187 0.378 Uranium mg/kg 0.557 0.00595 0.0397 C-23 Americium-241 pCi/g -0.003 ± 0.0467 0.0424 0.0858 U Cesium-137 pCi/g 0.177 ± 0.0234 0.00944 0.0193 Potassium-40 pCi/g 26 ± 1.69 0.079 0.165 Uranium-235 pCi/g 0.0684 ± 0.13 0.0591 0.119 U Uranium-238 pCi/g 1.41 ± 0.788 0.344 0.694 Uranium mg/kg 0.541 ± 0 0.00598 0.0398 C-24 Americium-241 pCi/g -0.0148 ± 0.0527 0.0442 0.0894 U Cesium-137 pCi/g 0.254 ± 0.0337 0.01 0.0205 Potassium-40 pCi/g 29.2 ± 3.06 0.0875 0.183 Uranium-235 pCi/g 0.0798 ± 0.0865 0.0587 0.119 U Uranium-238 pCi/g 2.1 ± 0.897 0.362 0.731 Uranium mg/kg 1.28 ± 0 0.00599 0.0399 C-25 Americium-241 pCi/g -0.0138 ± 0.052 0.046 0.093 U Cesium-137 pCi/g 0.445 ± 0.0584 0.0109 0.0223 Potassium-40 pCi/g 21.8 ± 2.12 0.631 1.27 Uranium-235 pCi/g 0.0646 ± 0.108 0.0625 0.126 U Uranium-238 pCi/g 2.08 ± 0.991 0.37 0.748 Uranium mg/kg 1.11 ± 0 0.00599 0.0399 C-26 Americium-241 pCi/g -0.000463 ± 0.0787 0.0639 0.129 U Cesium-137 pCi/g 0.515 ± 0.0606 0.0111 0.0228 Potassium-40 pCi/g 28.4 ± 2.75 0.0945 0.198 Uranium-235 pCi/g 0.0832 ± 0.106 0.0611 0.124 U Uranium-238 pCi/g 1.87 ± 1.07 0.475 0.962 Uranium mg/kg 0.789 ± 0 0.00599 0.0399 See notes at end of table.

A-2 2003 Annual Site Environmental Report, TTR & KTF
TABLE A-1. Radiological Results for Off-site Soil Sampling Locations at TTR, 2003 (continued)
Location Analyte Units Activity (± 2 σ) Decision
Level Detection
Limit Lab
Qualifier C-27 Americium-241 pCi/g 0 ± 0.0491 0.0422 0.0854 UX Cesium-137 pCi/g 0.38 ± 0.0463 0.00914 0.0187 Potassium-40 pCi/g 28.8 ± 2.79 0.0838 0.175 Uranium-235 pCi/g 0.033 ± 0.0991 0.0535 0.108 U Uranium-238 pCi/g 1.5 ± 0.752 0.343 0.694 Uranium mg/kg 0.747 ± 0 0.00591 0.0394 C-28 Americium-241 pCi/g 0.0173 ± 0.0479 0.0383 0.0774 U Cesium-137 pCi/g 0.107 ± 0.056 0.0176 0.0362 Potassium-40 pCi/g 27 ± 2.53 0.132 0.282 Uranium-235 pCi/g 0.155 ± 0.208 0.0963 0.195 U Uranium-238 pCi/g 0.883 ± 0.805 0.348 0.704 Uranium mg/kg 0.726 0.00596 0.0398 C-29 Americium-241 pCi/g 0.0408 ± 0.0916 0.0715 0.145 U Cesium-137 pCi/g 0.222 ± 0.0321 0.0109 0.0224 Potassium-40 pCi/g 24.4 ± 2.39 0.105 0.221 Uranium-235 pCi/g 0.0731 ± 0.13 0.069 0.14 U Uranium-238 pCi/g 1.89 ± 1.04 0.547 1.11 Uranium mg/kg 0.913 0.00592 0.0394 C-30 Americium-241 pCi/g -0.145 ± 0.107 0.0819 0.166 U Cesium-137 pCi/g 0.317 ± 0.0304 0.0106 0.0217 Potassium-40 pCi/g 31.2 ± 1.95 0.085 0.179 Uranium-235 pCi/g 0.0876 ± 0.132 0.0778 0.157 U Uranium-238 pCi/g 0.969 ± 1.31 0.637 1.29 U Uranium mg/kg 0.556 ± 0 0.00594 0.0396 C-31 Americium-241 pCi/g 0.00526 ± 0.0583 0.0525 0.106 U Cesium-137 pCi/g 0.163 ± 0.0281 0.0138 0.0282 Potassium-40 pCi/g 31.7 ± 2.07 0.0993 0.209 Uranium-235 pCi/g 0.0249 ± 0.082 0.0703 0.142 U Uranium-238 pCi/g 1.11 ± 0.899 0.429 0.868 Uranium mg/kg 0.65 0.00599 0.0399 C-32 Americium-241 pCi/g -0.00198 ± 0.0162 0.0144 0.0291 U Cesium-137 pCi/g 0.17 ± 0.0289 0.0103 0.0211 Potassium-40 pCi/g 30.9 ± 2.79 0.078 0.165 Uranium-235 pCi/g 0.0361 ± 0.0878 0.0505 0.102 U Uranium-238 pCi/g 1.57 ± 0.475 0.137 0.277 Uranium mg/kg 0.557 0.00588 0.0392 See notes at end of table.

A-3Appendix A
TABLE A-1. Radiological Results for Off-site Soil Sampling Locations at TTR, 2003 (concluded)
Location Analyte Units Activity (± 2 σ) Decision
Level Detection
Limit Lab
Qualifier C-33 Americium-241 pCi/g 0.00457 ± 0.0214 0.0187 0.0378 U Cesium-137 pCi/g 0.235 ± 0.0396 0.0129 0.0264 Potassium-40 pCi/g 29.6 ± 2.66 0.112 0.233 Uranium-235 pCi/g 0.173 ± 0.134 0.0661 0.134 Uranium-238 pCi/g 2.07 ± 0.583 0.18 0.363 Uranium mg/kg 0.603 0.00592 0.0394 Notes: pCi/g = picocurie per gram mg/kg = milligrams per kilogram TTR = Tonopah Test Range U = The analyte was analyzed for, but not detected, below this concentration. For organic and
inorganic analytes the result is less than the effective Decision Level. For radiochemical analytes the result is less than the decision level. X = Presumptive evidence that analyte is not present.

A-4 2003 Annual Site Environmental Report, TTR & KTF
C-26
(26)
Silverpeak
Tonopah
Goldfield
Lida
Gold
PointScotty's
Junction
Montezuma Pk.8,376 ft
Magruder Mtn.9,046 ft
Warm
Springs
266
C-21
(21)
C-32
(32)
Kawich Pk.
Nevada Test and
Training Range
9,404 ft
C-31
(31)
C-29
(29)
C-30
(30)
C-23 (23)
C-33
(33)
C-25
(25)
C-24
(24)
C-27 (27)
C-22
(22)
C-28
(28)C-20
(20)
Nevada
California
N
Sampling Location
Town
Rest Stop
FIGURE A-1. Off-site Soil Sampling Locations
(14 Locations)
6
95
95
6
265
376
375
Tolicha Pk.
7,058 ft
Quartzite Mt. 7,766 ft
Pinion Pk.9,327 ft
NOTE: The elevation of the town of Tonopah is 6,030 ft.
KEY
267
01_B-1.ai
50 miles
Tonopah
Test
Range

A-5Appendix A
TABLE A-2. Radiological Results for Perimeter Soil Sampling Locations at TTR, 2003
Location Analyte Units Activity (± 2 σ) Decision
Level Detection
Limit Lab
Qualifier P-06 Americium-241 pCi/g -0.0156 ± 0.0797 0.0553 0.112 U Cesium-137 pCi/g 0.172 ± 0.0272 0.00925 0.0189 Potassium-40 pCi/g 30.6 ± 2.94 0.0707 0.148 Uranium-235 pCi/g 0.081 ± 0.0976 0.0525 0.106 U Uranium-238 pCi/g 2.35 ± 1.26 0.425 0.859 Uranium mg/kg 0.774 ± 0 0.00588 0.0392 P-08 Americium-241 pCi/g -0.00809 ± 0.048 0.0427 0.0866 U Cesium-137 pCi/g 0.082 ± 0.0263 0.00975 0.02 Potassium-40 pCi/g 30.8 ± 3 0.0841 0.177 Uranium-235 pCi/g 0.129 ± 0.11 0.0528 0.107 Uranium-238 pCi/g 1.18 ± 0.789 0.344 0.696 Uranium mg/kg 0.571 0.00599 0.0399 P-11 Americium-241 pCi/g 0.0213 ± 0.0253 0.0218 0.0439 U Cesium-137 pCi/g 0.164 ± 0.0343 0.0144 0.0295 Potassium-40 pCi/g 31.8 ± 2.87 0.129 0.268 Uranium-235 pCi/g 0.2 ± 0.0892 0.075 0.152 Uranium-238 pCi/g 2.41 ± 0.724 0.208 0.42 Uranium mg/kg 0.506 ± 0 0.00594 0.0396 P-12 Americium-241 pCi/g 0.0222 ± 0.0582 0.0503 0.102 U Cesium-137 pCi/g 0.408 ± 0.0527 0.0119 0.0243 Potassium-40 pCi/g 31.8 ± 3.1 0.0947 0.199 Uranium-235 pCi/g 0.0651 ± 0.115 0.0636 0.129 U Uranium-238 pCi/g 1.47 ± 0.96 0.408 0.826 Uranium mg/kg 0.483 ± 0 0.00595 0.0397 P-34 Americium-241 pCi/g -0.00245 ± 0.0496 0.0462 0.0933 U Cesium-137 pCi/g 0.456 ± 0.056 0.00966 0.0197 Potassium-40 pCi/g 31.8 ± 2.94 0.0738 0.154 Uranium-235 pCi/g 0.0369 ± 0.104 0.0571 0.115 U Uranium-238 pCi/g 1.52 ± 0.95 0.375 0.757 Uranium mg/kg 0.82 ± 0 0.00598 0.0398 P-35 Americium-241 pCi/g -0.0344 ± 0.0646 0.0567 0.115 U Cesium-137 pCi/g 0.573 ± 0.0669 0.0125 0.0257 Potassium-40 pCi/g 26 ± 2.56 0.103 0.215 Uranium-235 pCi/g 0.0938 ± 0.137 0.0765 0.155 U Uranium-238 pCi/g 1.8 ± 0.911 0.474 0.957 Uranium mg/kg 0.936 ± 0 0.006 0.04 P-36 Americium-241 pCi/g 0 ± 0.0491 0.0476 0.0964 UX Cesium-137 pCi/g 0.042 ± 0.0202 0.0102 0.0209 Potassium-40 pCi/g 29.8 ± 2.77 0.083 0.174 Uranium-235 pCi/g 0.144 ± 0.117 0.0588 0.119 Uranium-238 pCi/g 1.69 ± 1.01 0.372 0.753 Uranium mg/kg 0.696 0.00594 0.0396 See notes at end of table.

A-6 2003 Annual Site Environmental Report, TTR & KTF
TABLE A-2. Radiological Results for Perimeter Soil Sampling Locations at TTR, 2003 (concluded)
Location Analyte Units Activity (± 2 σ) Decision
Level Detection
Limit Lab
Qualifier P-37 Americium-241 pCi/g -0.00328 ± 0.0678 0.0598 0.121 U Cesium-137 pCi/g 0.0228 ± 0.0172 0.00958 0.0197 Potassium-40 pCi/g 30.9 ± 2.99 0.0779 0.164 Uranium-235 pCi/g 0.0168 ± 0.115 0.0566 0.115 U Uranium-238 pCi/g 0.833 ± 1.12 0.45 0.911 U Uranium mg/kg 0.737 0.00595 0.0397 Notes: pCi/g = picocurie per gram mg/kg = milligrams per kilogram TTR = Tonopah Test Range U = The analyte was analyzed for, but not detected, below this concentration. For organic and
inorganic analytes the result is less than the effective Decision Level. For radiochemical analytes the result is less than the decision level. X = Presumptive evidence that analyte is not present.

A-7Appendix A
Main
Gate
Cle
an
Sla
te 3
Cle
an
Sla
te 2
Cedar
Pass R
oad
Gold
Mounta
in R
oad
Tra
iler
Pass R
oad
La
nd
ing
Fie
ld
Gold Reed Road
Gold Flat Road
Cle
an
Sla
te 1
Radar
Hill
Main Road South
Mellan
Air
Str
ip
Mel
lan
Roa
d
Edwards F
wy
Moody Avenue
P-0
8P
-37
P-3
6
P-3
5
P-1
1
P-1
2
P-0
6
FIG
UR
E A
-2. P
erim
ete
r S
oil
Sam
plin
g L
ocations
(
Eig
ht Locations)
N
P-3
4
Nix
on P
k.
7,6
30 f
t
Ante
lope
Pk.
7,5
74 f
t
Ced
ar
Pk.
Ura
nia
Pk.
7,3
29 f
t
Sam
plin
g L
ocation
TT
R B
oundary
Cle
an S
late
Test A
rea
(clo
sed)
KE
Y
01_B-2.ai
TL
D
TL
D
TL
D
TL
D
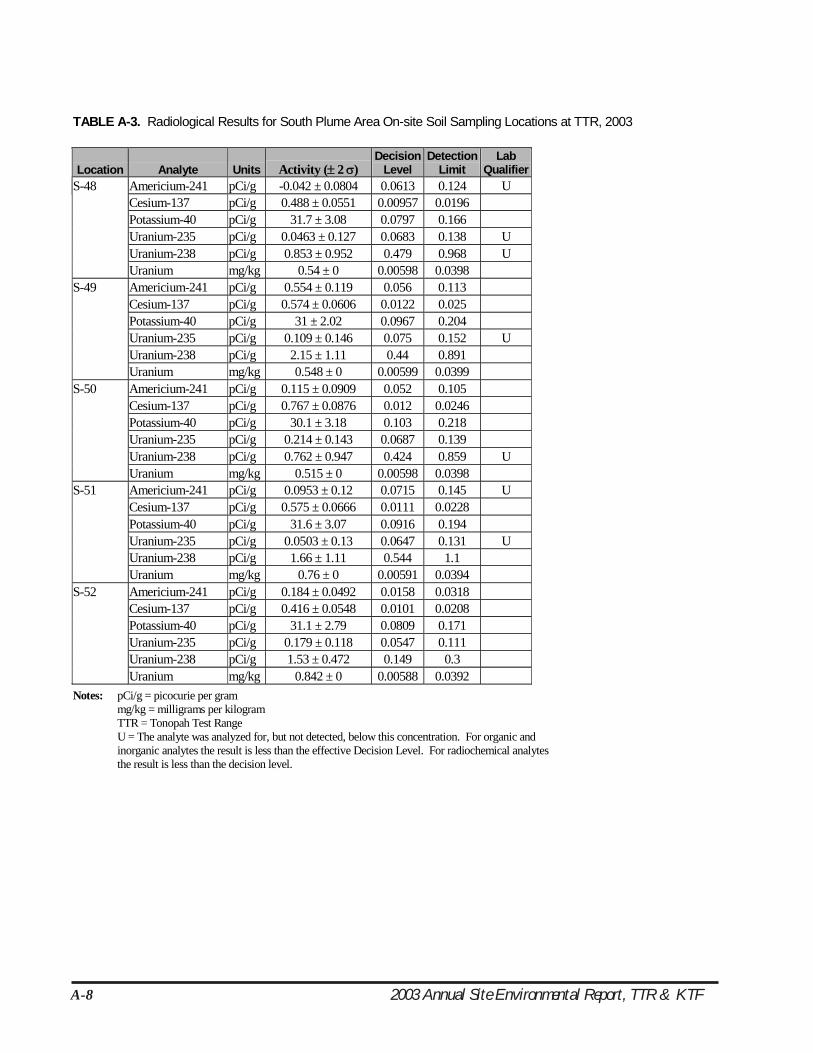
A-8 2003 Annual Site Environmental Report, TTR & KTF
TABLE A-3. Radiological Results for South Plume Area On-site Soil Sampling Locations at TTR, 2003
Location Analyte Units Activity (± 2 σ) Decision
Level Detection
Limit Lab
Qualifier S-48 Americium-241 pCi/g -0.042 ± 0.0804 0.0613 0.124 U Cesium-137 pCi/g 0.488 ± 0.0551 0.00957 0.0196 Potassium-40 pCi/g 31.7 ± 3.08 0.0797 0.166 Uranium-235 pCi/g 0.0463 ± 0.127 0.0683 0.138 U Uranium-238 pCi/g 0.853 ± 0.952 0.479 0.968 U Uranium mg/kg 0.54 ± 0 0.00598 0.0398 S-49 Americium-241 pCi/g 0.554 ± 0.119 0.056 0.113 Cesium-137 pCi/g 0.574 ± 0.0606 0.0122 0.025 Potassium-40 pCi/g 31 ± 2.02 0.0967 0.204 Uranium-235 pCi/g 0.109 ± 0.146 0.075 0.152 U Uranium-238 pCi/g 2.15 ± 1.11 0.44 0.891 Uranium mg/kg 0.548 ± 0 0.00599 0.0399 S-50 Americium-241 pCi/g 0.115 ± 0.0909 0.052 0.105 Cesium-137 pCi/g 0.767 ± 0.0876 0.012 0.0246 Potassium-40 pCi/g 30.1 ± 3.18 0.103 0.218 Uranium-235 pCi/g 0.214 ± 0.143 0.0687 0.139 Uranium-238 pCi/g 0.762 ± 0.947 0.424 0.859 U Uranium mg/kg 0.515 ± 0 0.00598 0.0398 S-51 Americium-241 pCi/g 0.0953 ± 0.12 0.0715 0.145 U Cesium-137 pCi/g 0.575 ± 0.0666 0.0111 0.0228 Potassium-40 pCi/g 31.6 ± 3.07 0.0916 0.194 Uranium-235 pCi/g 0.0503 ± 0.13 0.0647 0.131 U Uranium-238 pCi/g 1.66 ± 1.11 0.544 1.1 Uranium mg/kg 0.76 ± 0 0.00591 0.0394 S-52 Americium-241 pCi/g 0.184 ± 0.0492 0.0158 0.0318 Cesium-137 pCi/g 0.416 ± 0.0548 0.0101 0.0208 Potassium-40 pCi/g 31.1 ± 2.79 0.0809 0.171 Uranium-235 pCi/g 0.179 ± 0.118 0.0547 0.111 Uranium-238 pCi/g 1.53 ± 0.472 0.149 0.3 Uranium mg/kg 0.842 ± 0 0.00588 0.0392 Notes: pCi/g = picocurie per gram mg/kg = milligrams per kilogram TTR = Tonopah Test Range U = The analyte was analyzed for, but not detected, below this concentration. For organic and
inorganic analytes the result is less than the effective Decision Level. For radiochemical analytes the result is less than the decision level.

A-9Appendix A
Clean
Slate 3
Clean
Slate 2
Clean
Slate 1
MellanTower
LandingStrips
AntelopeLake
MellanMountain
Limit of Clean Slate Survey
S-52(52)
S-48(48)S-49
(49)
S-51(51)
S-50(50)
0.5 mi
Clean Slates 1, 2, and 3
Sampling location
Limit of Survey
Detectable Contamination
Outside of Each Area
Not to Scale
N
FIGURE A-3. Soil Sampling Locations in the South Plume Area (on-site) (Five Locations)
KEY
02_B-3.ai
S-02(2)

A-10 2003 Annual Site Environmental Report, TTR & KTF
TABLE A-4. Radiological Results for Range Operations Center On- site Soil Sampling Locations at TTR, 2003
Location Analyte Units Activity (± 2 σ) Decision
Level Detection
Limit Lab
Qualifier S-40 Americium-241 pCi/g -0.0882 ± 0.152 0.116 0.234 U Cesium-137 pCi/g 0.132 ± 0.0324 0.0167 0.0341 Potassium-40 pCi/g 33.4 ± 2.16 0.122 0.257 Uranium-235 pCi/g 0 ± 0.131 0.104 0.21 UX Uranium-238 pCi/g 1.82 ± 1.67 0.894 1.81 Uranium mg/kg 0.736 0.00596 0.0398 S-41 Americium-241 pCi/g -0.0228 ± 0.0198 0.0157 0.0317 U Cesium-137 pCi/g 0.141 ± 0.0269 0.0109 0.0224 Potassium-40 pCi/g 32.4 ± 2.92 0.0892 0.188 Uranium-235 pCi/g 0.206 ± 0.13 0.056 0.113 Uranium-238 pCi/g 1.44 ± 0.494 0.155 0.314 Uranium mg/kg 0.609 0.00588 0.0392 S-42 Americium-241 pCi/g 0 ± 0.0551 0.0482 0.0976 UX Cesium-137 pCi/g 0.461 ± 0.0575 0.0115 0.0235 Potassium-40 pCi/g 28.7 ± 2.8 0.0896 0.189 Uranium-235 pCi/g 0.122 ± 0.117 0.0591 0.12 Uranium-238 pCi/g 1.42 ± 0.85 0.383 0.776 Uranium mg/kg 0.602 0.00595 0.0397 S-43 Americium-241 pCi/g -0.000521 ± 0.0588 0.0532 0.108 U Cesium-137 pCi/g 0.053 ± 0.0222 0.012 0.0246 Potassium-40 pCi/g 29 ± 1.9 0.108 0.227 Uranium-235 pCi/g 0.178 ± 0.145 0.0728 0.147 Uranium-238 pCi/g 1.63 ± 1.01 0.433 0.875 Uranium mg/kg 0.71 0.00594 0.0396 S-44 Americium-241 pCi/g -0.00172 ± 0.0423 0.0379 0.0765 U Cesium-137 pCi/g 0.175 ± 0.0463 0.0164 0.0337 Potassium-40 pCi/g 27.5 ± 2.56 0.139 0.292 Uranium-235 pCi/g 0.165 ± 0.173 0.0922 0.187 U Uranium-238 pCi/g 1.56 ± 0.835 0.342 0.691 Uranium mg/kg 0.969 0.00589 0.0393 S-45 Americium-241 pCi/g -0.153 ± 0.144 0.109 0.221 U Cesium-137 pCi/g 0.015 ± 0.0247 0.0126 0.0259 U Potassium-40 pCi/g 33.8 ± 2.16 0.107 0.226 Uranium-235 pCi/g 0.0809 ± 0.146 0.101 0.205 U Uranium-238 pCi/g 0.833 ± 1.49 0.857 1.73 U Uranium mg/kg 0.669 0.00594 0.0396 S-46 Americium-241 pCi/g 0.0968 ± 0.0937 0.0499 0.101 U Cesium-137 pCi/g 0.0373 ± 0.0184 0.0126 0.0259 Potassium-40 pCi/g 29.7 ± 1.95 0.097 0.204 Uranium-235 pCi/g 0.0944 ± 0.142 0.0707 0.143 U Uranium-238 pCi/g 1.75 ± 1.06 0.408 0.826 Uranium mg/kg 0.698 0.00598 0.0398 See notes at end of table.

A-11Appendix A
TABLE A-4. Radiological Results for Range Operations Center On- site Soil Sampling Locations at TTR, 2003 (concluded)
Location Analyte Units Activity (± 2 σ) Decision
Level Detection
Limit Lab
Qualifier S-47 Americium-241 pCi/g 0.0149 ± 0.052 0.0486 0.0986 U Cesium-137 pCi/g 0.136 ± 0.0261 0.0111 0.0228 Potassium-40 pCi/g 30.7 ± 2.96 0.0832 0.178 Uranium-235 pCi/g 0.0938 ± 0.128 0.0658 0.133 U Uranium-238 pCi/g 1.51 ± 0.988 0.398 0.806 Uranium mg/kg 0.519 0.00592 0.0394 Notes: pCi/g = picocurie per gram mg/kg = milligrams per kilogram TTR = Tonopah Test Range U = The analyte was analyzed for, but not detected, below this concentration. For organic and
inorganic analytes the result is less than the effective Decision Level. For radiochemical analytes the result is less than the decision level. X = Presumptive evidence that analyte is not present.

A-12 2003 Annual Site Environmental Report, TTR & KTF
Cam
era
Sta
tion
TT
R F
reew
ay
Radar
Contr
ol
Tow
er
Wate
r T
ow
er
Hydra
nt
DO
E
Opera
tions
Tra
ilers
Adm
in B
ldg
Fire
Sta
tion
Fueling Station
Dru
mS
tora
ge
Air
Sam
plin
gS
yste
m
Cafe
teria
Gravel
Well
S-4
5
(45)
FIG
UR
E A
-4a. S
oil
Sam
plin
g L
ocations in the R
ange O
pera
tions C
ente
r and C
om
pound (
on-s
ite)
(
Six
Locations)
xx
xx
x x x x x x x x x x x x xx
xx
xx
xx
xx
xx
xxxxxxxx
xx
xx
xxx
xx
x
x
xx
x
x
No
t to
Sca
le
N
Sam
plin
g location
01_B-4a.ai
S-4
3
S-4
4
(44)
S-4
2
(42)
S-4
1
(41)
S-4
0
(40)
Edwar
ds F
reew
ay
KE
Y
S-4
6
(46)
S-4
7
(47)
(43)

A-13Appendix A
TABLE A-5. Radiological Results for Various On-Site Soil Sampling Locations at TTR, 2003
Location Analyte Units Activity (± 2 σ) Decision
Level Detection
Limit Lab
Qualifier S-02 Americium-241 pCi/g 0.0254 ± 0.0581 0.0542 0.11 U Cesium-137 pCi/g 0.37 ± 0.0484 0.0106 0.0218 Potassium-40 pCi/g 31.4 ± 2.92 0.0893 0.188 Uranium-235 pCi/g 0.0915 ± 0.117 0.066 0.134 U Uranium-238 pCi/g 0.666 ± 0.986 0.438 0.886 U Uranium mg/kg 0.808 ± 0 0.00592 0.0394 S-03 Americium-241 pCi/g -0.0357 ± 0.12 0.0952 0.192 U Cesium-137 pCi/g 0.459 ± 0.0418 0.0136 0.0277 Potassium-40 pCi/g 33.4 ± 2.07 0.0922 0.193 Uranium-235 pCi/g 0.165 ± 0.143 0.0841 0.17 U Uranium-238 pCi/g 1.03 ± 1.48 0.703 1.42 U Uranium mg/kg 0.761 ± 0 0.006 0.04 S-04 Americium-241 pCi/g 0.0568 ± 0.107 0.0522 0.105 U Cesium-137 pCi/g 0.236 ± 0.0297 0.0076 0.0155 Potassium-40 pCi/g 32.8 ± 3.17 0.0645 0.134 Uranium-235 pCi/g 0.104 ± 0.0996 0.0562 0.114 U Uranium-238 pCi/g 1.08 ± 0.766 0.39 0.787 Uranium mg/kg 0.802 ± 0 0.00596 0.0398 S-09 Americium-241 pCi/g 2.59 ± 0.369 0.0528 0.107 Cesium-137 pCi/g 0.168 ± 0.0253 0.00994 0.0203 Potassium-40 pCi/g 28.5 ± 2.78 0.0798 0.167 Uranium-235 pCi/g 0.147 ± 0.117 0.0635 0.128 Uranium-238 pCi/g 1.64 ± 0.782 0.436 0.879 Uranium mg/kg 0.648 ± 0 0.00595 0.0397 S-10 Americium-241 pCi/g 0.00279 ± 0.0203 0.0179 0.0362 U Cesium-137 pCi/g 0.228 ± 0.04 0.0135 0.0277 Potassium-40 pCi/g 31.7 ± 2.87 0.107 0.224 Uranium-235 pCi/g 0.0726 ± 0.116 0.0597 0.121 U Uranium-238 pCi/g 1.36 ± 0.497 0.169 0.342 Uranium mg/kg 0.799 ± 0 0.00591 0.0394 S-38 Americium-241 pCi/g 0.0548 ± 0.0342 0.0162 0.0327 Cesium-137 pCi/g 0.458 ± 0.0583 0.0108 0.022 Potassium-40 pCi/g 30.6 ± 2.73 0.0956 0.198 Uranium-235 pCi/g 0.059 ± 0.113 0.0572 0.116 U Uranium-238 pCi/g 2.39 ± 0.582 0.156 0.315 Uranium mg/kg 0.54 ± 0 0.00589 0.0393 S-39 Americium-241 pCi/g 0.0263 ± 0.0684 0.0584 0.118 U Cesium-137 pCi/g 0.422 ± 0.0479 0.00869 0.0177 Potassium-40 pCi/g 33 ± 3.18 0.0711 0.147 Uranium-235 pCi/g 0.1 ± 0.11 0.0644 0.13 U Uranium-238 pCi/g 1.38 ± 0.925 0.456 0.92 Uranium mg/kg 0.867 ± 0 0.006 0.04 See notes at end of table.

A-14 2003 Annual Site Environmental Report, TTR & KTF
TABLE A-5. Radiological Results for Various On-Site Soil Sampling Locations at TTR, 2003 (concluded)
Location Analyte Units Activity (± 2 σ) Decision
Level Detection
Limit Lab
Qualifier S-53 Americium-241 pCi/g -0.00679 ± 0.0608 0.0538 0.109 U Cesium-137 pCi/g 0.102 ± 0.0241 0.0114 0.0235 Potassium-40 pCi/g 31.9 ± 3.12 0.0903 0.191 Uranium-235 pCi/g 0.194 ± 0.148 0.0754 0.153 Uranium-238 pCi/g 1.05 ± 0.844 0.458 0.926 Uranium mg/kg 0.748 0.00596 0.0398 Notes: pCi/g = picocurie per gram mg/kg = milligrams per kilogram TTR = Tonopah Test Range U = The analyte was analyzed for, but not detected, below this concentration. For organic and
inorganic analytes the result is less than the effective Decision Level. For radiochemical analytes the result is less than the decision level.

A-15Appendix A
FIG
UR
E A
-5a
. V
ario
us O
n-s
ite
So
il S
am
plin
g L
oca
tio
ns
(Fiv
e L
oca
tio
ns)
01_B-5a.ai
Main
Gate A
irport
S-0
9S-0
4
S-0
2
S-0
3
Sandia Dr.
Lake
Roa
d
Main Road South
Main Road North
Moody Avenue
Mell
an R
oad
Range
Opera
tions
Cente
r
Cle
an S
late
3 Cle
an S
late
2C
ed
ar
Pa
ss R
oa
d
Gold Flat Road
Avenue 45
Tra
ile
r P
ass R
oa
d
Cle
an S
late
1
Mella
n A
ir S
trip
Gold
Mounta
in R
oad
Not to
Scale
N
Sam
plin
g L
ocation
KE
Y
Ante
lope
Lake
(Dry
)
S-1
0
TL
D
TL
D
TL
D
TL
D

A-16 2003 Annual Site Environmental Report, TTR & KTF
FIGURE A-5b Various Soil Sampling Locations at Mellan Hill Area (Two Locations)
S-39
(39)
S-38
(38)
STA-14
Dirt R
oad
Dirt Road
MetalScrapPile
STA-14 sign
0.6
mi
Not to Scale
N
01_B-5b.ai
Sampling Location
KEY

A-17Appendix A
Dirt Road
Dirt Road
Dirt Road
Mellan Road(Paved)
Edw
ards
Fre
eway
(Pav
ed)
Bld
g.
Me
teo
rolo
gic
al
Sta
tio
ns
Ha
rd T
arg
et
23
-16
S-5
3
FIG
UR
E A
-5c
. S
oil S
am
plin
g L
oca
tio
n N
ea
r th
e H
ard
Ta
rge
t/D
ep
lete
d U
ran
ium
Are
a
(O
ne
Lo
ca
tio
n)
Not to
Scale
N
Sa
mp
lin
g lo
ca
tio
n
01
_B
-5c.a
i
KE
Y

A-18 2003 Annual Site Environmental Report, TTR & KTF
TABLE A-6. Radiological Replicate Sampling for Soil Sampling Locations, 2003 Location
Type
Location
Analyte
Units Sample
ID
Activity (± 2 σ) Decision
Level Detection
Limit Lab
Qualifier
Avg Std Dev
Min
Max
CV%
Off-Site C-29 Americium-241 pCi/g 061499-001 0.0408 ± 0.0916 0.0715 0.145 U 0.0077 0.0306 -0.0195 0.0408 4.00%
061499-002 -0.0195 ± 0.0633 0.0529 0.107 U
061499-003 0.00165 ± 0.0502 0.0462 0.0934 U
Cesium-137 pCi/g 061499-001 0.222 ± 0.0321 0.0109 0.0224 0.1840 0.0396 0.1430 0.2220 0.22%
061499-002 0.143 ± 0.0259 0.0112 0.0232
061499-003 0.187 ± 0.0272 0.0097 0.0199
Potassium-40 pCi/g 061499-001 24.4 ± 2.39 0.105 0.221 24.2667 0.1528 24.1000 24.4000 0.01%
061499-002 24.3 ± 2.58 0.105 0.22
061499-003 24.1 ± 2.32 0.0912 0.191
Uranium µg/g 061499-001 0.913 0.00592 0.0394 0.9893 0.1057 0.9130 1.1100 0.11%
061499-002 0.945 0.006 0.04
061499-003 1.11 ± 0 0.00595 0.0397
Perimeter P-11 Americium-241 pCi/g 061523-001 0.0213 ± 0.0253 0.0218 0.0439 U 0.0333 0.0407 0.0000 0.0787 1.22%
061523-002 0.0787 ± 0.0378 0.0198 0.04
061523-003 0 ± 0.0454 0.0363 0.0731 UX
Cesium-137 pCi/g 061523-001 0.164 ± 0.0343 0.0144 0.0295 0.5173 0.3421 0.1640 0.8470 0.66%
061523-002 0.847 ± 0.0993 0.015 0.0307
061523-003 0.541 ± 0.0745 0.0171 0.035
Potassium-40 pCi/g 061523-001 31.8 ± 2.87 0.129 0.268 30.9000 1.0817 29.7000 31.8000 0.04%
061523-002 31.2 ± 2.84 0.117 0.247
061523-003 29.7 ± 2.73 0.131 0.275
Uranium µg/g 061523-001 0.506 ± 0 0.00594 0.0396 0.4790 0.0503 0.4210 0.5100 0.10%
061523-002 0.421 ± 0 0.00592 0.0394
061523-003 0.51 ± 0 0.00594 0.0396
South S-48 Americium-241 pCi/g 061516-001 -0.042 ± 0.0804 0.0613 0.124 U -0.0752 0.0805 -0.1670 -0.0167 -1.07% Plume Area 061516-002 -0.0167 ± 0.0512 0.0481 0.0975 U
(on-site) 061516-003 -0.167 ± 0.151 0.114 0.231 U
Cesium-137 pCi/g 061516-001 0.488 ± 0.0551 0.00957 0.0196 0.4717 0.0534 0.4120 0.5150 0.11%
061516-002 0.515 ± 0.0571 0.011 0.0226
061516-003 0.412 ± 0.0433 0.016 0.0328
Potassium-40 pCi/g 061516-001 31.7 ± 3.08 0.0797 0.166 31.1667 1.5695 29.4000 32.4000 0.05%
061516-002 29.4 ± 2.83 0.0888 0.188
061516-003 32.4 ± 2.07 0.114 0.241
Uranium µg/g 061516-001 0.54 ± 0 0.00598 0.0398 0.5487 0.0913 0.4620 0.6440 0.17%
061516-002 0.462 ± 0 0.00589 0.0393
061516-003 0.644 ± 0 0.00594 0.0396

A-19Appendix A
TABLE A-6. Radiological Replicate Sampling for Soil Sampling Locations, 2003
Various On-Site S-03 Americium-241 pCi/g 061510-001 -0.0357 ± 0.12 0.0952 0.192 U 0.0952 0.1481 -0.0357 0.2560 1.56%
061510-002 0.256 ± 0.105 0.0479 0.0966
061510-003 0.0653 ± 0.0761 0.0416 0.084 U
Cesium-137 pCi/g 061510-001 0.459 ± 0.0418 0.0136 0.0277 0.4113 0.0600 0.3440 0.4590 0.15%
061510-002 0.344 ± 0.0337 0.00972 0.0199
061510-003 0.431 ± 0.0498 0.00999 0.0204
Potassium-40 pCi/g 061510-001 33.4 ± 2.07 0.0922 0.193 32.1000 1.3000 30.8000 33.4000 0.04%
061510-002 30.8 ± 1.97 0.0883 0.183
061510-003 32.1 ± 3.08 0.0793 0.166
Uranium µg/g 061510-001 0.761 ± 0 0.006 0.04 0.7417 0.0633 0.6710 0.7930 0.09%
061510-002 0.793 ± 0 0.00596 0.0398
061510-003 0.671 ± 0 0.00599 0.0399
S-09 Americium-241 pCi/g 061507-001 2.59 ± 0.369 0.0528 0.107 1.4027 1.1001 0.4180 2.5900 0.78%
061507-002 0.418 ± 0.0689 0.0168 0.0339
061507-003 1.2 ± 0.128 0.0145 0.0292
Cesium-137 pCi/g 061507-001 0.168 ± 0.0253 0.00994 0.0203 0.1440 0.0235 0.1210 0.1680 0.16%
061507-002 0.121 ± 0.0294 0.0121 0.0247
061507-003 0.143 ± 0.0238 0.00938 0.0192
Potassium-40 pCi/g 061507-001 28.5 ± 2.78 0.0798 0.167 28.4667 0.6506 27.8000 29.1000 0.02%
061507-002 29.1 ± 2.6 0.0969 0.201
061507-003 27.8 ± 2.5 0.0772 0.161
Uranium µg/g 061507-001 0.648 ± 0 0.00595 0.0397 0.6590 0.0135 0.6480 0.6740 0.02%
061507-002 0.655 ± 0 0.00599 0.0399
061507-003 0.674 ± 0 0.00594 0.0396
Notes: pCi/g = picocurie per gram µg/g = microgram per gram U = The analyte was analyzed for, but not detected, below this concentration. For organic and
inorganic analytes the result is less than the effective decision level. For radiochemical analytes the result is less than the decision level.
X = Preseumptive evidence that analyte is not present. Std Dev = Standard deviaition CV = Coefficient of variation

A-20 2003 Annual Site Environmental Report, TTR & KTF
TABLE A-7. Summary TLD Results for Calendar Year 2003, Tonopah Test Range
NOTES: µR = microroentgen (10-6 roentgen)
Location Class
Number of Locations
Mean Exposure Rate
(µR/hour)
Median Exposure Rate
(µR/hour) Std Dev.
Minimum
Maximum
Off-Site 3 16.3 17.1 1.5 14.6 17.4 Perimeter 4 17.5 17.9 1.1 15.8 18.3 On-Site 13 17.5 17.7 1.4 14.1 20.6

A-21Appendix A
TABLE A-8. TLD Measurements by Quarter and Location Class for Calendar Year 2003
1st Quarter (78 Days)
2nd Quarter (97 Days)
3rd Quarter (84 Days)
4th Quarter (99 Days) Exposure Rate
Location Class
Location Number
Exposure (mR) Error
Exposure (mR) Error
Exposure (mR) Error
Exposure (mR) Error
?R per hour
Error
Off-Site T-19 28.1 1.7 34.7 2.6 21.9 1 40.9 1.4 14.6 0.4 T-22 36.4 0.6 40.2 1.3 28.2 2 40 0.9 16.9 0.3 T-21 38 0.9 42.9 1.3 29.6 1.9 39.3 2.1 17.4 0.4
Perimeter T-06 35.7 2.7 45.1 1.6 31.4 1 39.5 1.9 17.7 0.4 T-08 33.2 1.9 39.5 1.2 25.8 0.9 * * 15.8 0.4 T-11 38.2 1.9 43.8 1.4 30.2 1.3 45.2 4 18.3 0.6 T-12 36.9 2.9 46.4 3.4 29.5 0.9 42.8 1.8 18.1 0.6
On-Site T-01 40.6 1 50.9 3.6 35.9 1.2 49.9 4.3 20.6 0.7
T-02 36.3 0.9 45.7 1.2 29.7 1.4 43.7 3.6 18.1 0.5 T-03 * * * 0 29.5 1.8 44.4 4.8 16.8 1.2 T-04 36.6 1.2 43.5 1.7 30.6 0.8 43.7 2 18.0 0.3 T-05 35.2 1.1 41 2.7 28.7 0.8 42.9 1.5 17.2 0.4 T-07 33.2 2.3 39.6 1.4 26.2 0.8 42.8 1 16.5 0.3 T-09 34 1 40 1.7 27.7 0.8 42.7 0.9 16.8 0.3 T-10 37.5 0.8 44.6 1.2 30.9 4.4 * * 18.2 0.7 T-13 37.1 1.2 43 1.3 29.3 0.9 40.6 1.8 17.5 0.3
T-14 7.4 0.6 40.6 1.3 28.4 2.5 44.5 2.6 14.1 0.5 T-15 35.7 3.8 44.3 2.3 28.9 1.5 46.1 4.5 18.0 0.8 T-16 37 2 44.1 1.1 29.7 1.2 42.3 1.2 17.8 0.3 T-17 36.6 1.9 43.2 2.7 27.8 1.4 42.9 0.9 17.5 0.4
NOTES: mR = Milliroentgen (10-3 roentgen) µR = microroentgen (10-6 roentgen) * TLD lost, stolen, not exchanged, or data invalid and not used in calculation of average
exposure rate

A-22 2003 Annual Site Environmental Report, TTR & KTF
This page intentionally left blank.

Dist-1
UNLIMITED RELEASE DISTRIBUTION
U.S. Department of Energy/NNSA (14 HC/6 CDs) Sandia Site Office (SSO) Office of Oversight and Assessments Attn: Karen Agogino P.O. Box 5400 Albuquerque, NM 87185-5400 U.S. Department of Energy/NNSA (1) Nevada Site Office (NS) Attn: Bruce Hurley P.O. Box 98518 Las Vegas, NV 89193-8518 U.S. Department of Energy/HQ (2) Office of Engineering (EM-22) Attn: James Fiore 19901 Germantown Road Germantown, MD 20874 U.S. Department of Energy/HQ (1) Office of Security and Safety Performance (SP-1) Attn: Glenn Podonsky 1000 Independence Ave. SW Washington, DC 20585 U.S. Department of Energy/HQ (2) Office of Facilities Management and ES&H Support (NA-117) Attn: Alv D. Youngberg and Dennis Miolta 19901 Germantown Road Germantown, MD 20874 U.S. Department of Energy/HQ (1) Office of Field Operation Support and Field Analysis (EH-2) Attn: Dave Stadler 1000 Independence Ave. SW Washington, DC 20585 U.S. Department of Energy/HQ (1) Attn: J. Mangeno Environment, Safety, and Health Office (NA-1) 1000 Independence Ave. SW Washington, DC 20585 Vuong Trinh (1) Lockheed-Martin Corporation 6801 Rockledge Drive Mail Stop DM315 Rockville, MD 20817 U.S. Department of Energy/HQ (1) Small Sites Closure Office (EM-1) Attn: K. Chaney 19901 Germantown Road Germantown, MD 20874
U.S. Department of Energy/HQ (3) Office of Air, Water, and Radiation (EH-41) Attn: Ross L. Natoli 1000 Independence Ave. SW Washington, DC 20585 U.S. Department of Energy/NNSA (3) NNSA Service Center (NZ) Environmental Safety and Health Department Attn: C. Soden P.O. Box 5400 Albuquerque, NM 87185-5400 John Dietrich (1) Lockheed-Martin Corporation 6801 Rockledge Drive Mail Stop DM315 Rockville, MD 20817 Environmental Protection Agency (1) Headquarters Office 1200 Pennsylvania Ave, NW Washington, DC 20460 Environmental Protection Agency (1) Region IX Office 75 Hawthorne Street San Francisco, CA 94105 Environmental Restoration Division (1) Nevada Operations Office (NV) Attn: Kevin Cabble P.O. Box 98518 Las Vegas, NV 81913-8518 Division of Environmental Protection (1) Attn: Allen Biaggi 333 W. Nye Lane, Room 138 Carson City, NV 89706-0851 Frank Grossman (1) Nevada Test Site PO Box 98521 MS NTS 273 Las Vegas, NV 89193 Dan Barkley (1 w/disk) Government Information Department Zimmerman Library-UNM 1 University of New Mexico MSC05 3020 Albuquerque, NM 87131-0001

Dist-2
Jeff Irwin (MS 9221) (1) Sandia National Laboratories, California P.O. Box 969 Livermore, CA 94551-9221 Environmental Health Administration (1) Environmental Management Division Attn: Thomas E. Arizumi Room 300 919 Ala Moana Blvd. Honolulu, HI 96814-4920 Adeline Sasaki (1) Kauai District Health Office 3040 Umi Street P.O. Box 671 Lihue, HI 96766 U.S. Department of Energy/HQ (1) Attn: R. Hardwick EH-2 19901 Germantown Road Germantown, MD 20874 U.S. Department of Energy/HQ (1) Office of Core Technical Group (EM-23) Attn: J. Lehr 19901 Germantown Road Germantown, MD 20874

Dist-3
SANDIA NATIONAL LABORATORIES, INTERNAL DISTRIBUTION 2 (MS 0141) A. Blumberg, 11100 1 (MS 1042) S. Hwang, 3121 1 (MS 0361) M. L. Jones, 7000 1 (MS 1042) A. Jones, 3121 1 (MS 0918) S. Ward, 10741 1 (MS 1042) M.L. Miller, 3121* 1 (MS 0651) IS&S Records Center, 9612* 1 (MS 1042) J. Payne, 3121 1 (MS 0612) Review & Approval Desk, 9612
For DOE/OSTI* 3 (MS 1042) S. Salinas, 3121* (10CDs)
1 (MS 1042) R. V. Sanchez, 3121* 1 (MS 0890) J. Harris, 3135 4 (MS 1042) K. Wagner, 3121* 1 (MS 0899) Central Technical Files, 8945-1* 6 (MS 1043) ES&H Library, 3131* 2 (MS 0899) Technical Library, 9616* 1 (MS 0342) A. West, 3100 1 (MS 1042) L. Bayliss, 3121 1 (MS 1374) G. E. Chavez, 6927 1 (MS 1042) J. Bonaguidi, 3121 1 (MS 1185) R. G. Hay, 15406 1 (MS 1042) C. Fink, 3121 4 (MS 1392) W. Forston, 15421* (1 CD) 1 (MS 1042) J. Guerrero, 3121 1 (MS 1392) R. A. Smith, 15421* (10 CDs) 1 (MS 1042) J. Eckstein, 3121 1 (MS 1392) V. Gabbard, 15421* 1 (MS 0890) H. Herrera, 3135 1 (MS 1183) A. Lopez, 15419* 1 (MS 1183) D. Manning, 154191 1 (MS 1042) A. Montoya, 3121 1 (MS 1042) S. Koss, 3121* 1 (MS 1050) B. Forbes, 3127 1 (MS 1087) D. Stockham, 6133 NOTE: *Require published copies of this report.

This page intentionally left blank.

2003 Annual Site Environmental Report for Sandia National Laboratories Tonopah Test Range and Kauai Test Facility, Hawaii
Reader Questionnaire
Our goal in providing this report is to give the public a clear understanding of the environmental activities conducted at Sandia National Laboratories, New Mexico. It is important that the information we provide is easily understood, is of interest, and communicates Sandia’s efforts to protect the environment and comply with environmental regulations. Thank you for your time and effort in helping us evaluate this report. 1. Is the technical level too high? too low? just right? 2. Is the writing too concise? too wordy? just right? 3. Is the amount of detail satisfactory? Yes No 4. Are the data tables of interest? Yes No 5. Are there enough photos? Yes No 6. Do the summary pages provide relevant information? Yes No 7. Is the compact disk version easy to use? Yes No 8. What additional environmental topics are you interested in at Sandia National Laboratories? 9. How can we improve future reports? 10. Additional Comments: