Embed Size (px)
Citation preview
BUYERS
Relationships
Environmental Forces
CompetitiveRivalrySuppliers
SocialRegulatory
TechnologicalEconomic Special Interest
OtherOrganizations
Alliances
Partnerships
Ownership
MARKETING “BIG PICTURE”
PRICEPRODUCT
PROMOTION
DISTRIBUTION SERVICE
Target Customer
Intl.
Trends
CONVENIENCE
Internal Forces
Substitutes
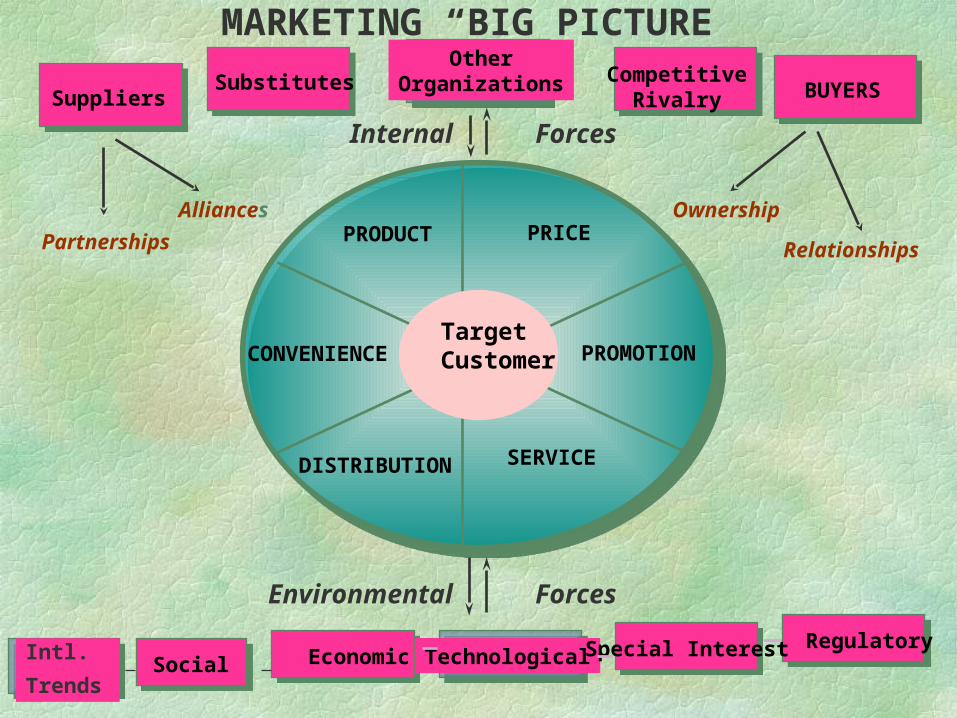
Forces Driving International Competition
Industrycompetitors
Rivalry amongexisting firms
Potentialentrants
Potentialentrants
SubstitutesSubstitutes
SuppliersSuppliersBuyersBuyers
Capabilities & Ability to MeetNeeds
Number and Economic Ability
Threat ofnew entrants
Threat ofSubstitute Productsor Services; Currentand PotentialDevelopments
ComplementorsComplementors
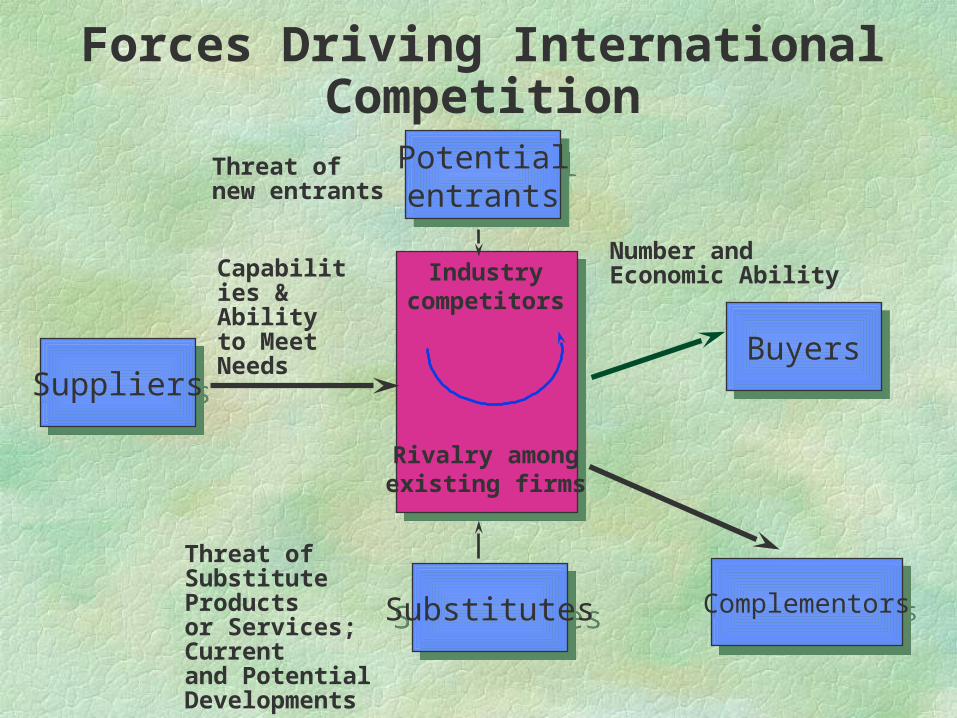
EVOLUTION OF MARKETING CONCEPT
PRODUCTION ORIENTATION
PRODUCT ORIENTATION
SELLING ORIENTATION
MARKET ORIENTATION
SOCIETAL ORIENTATION
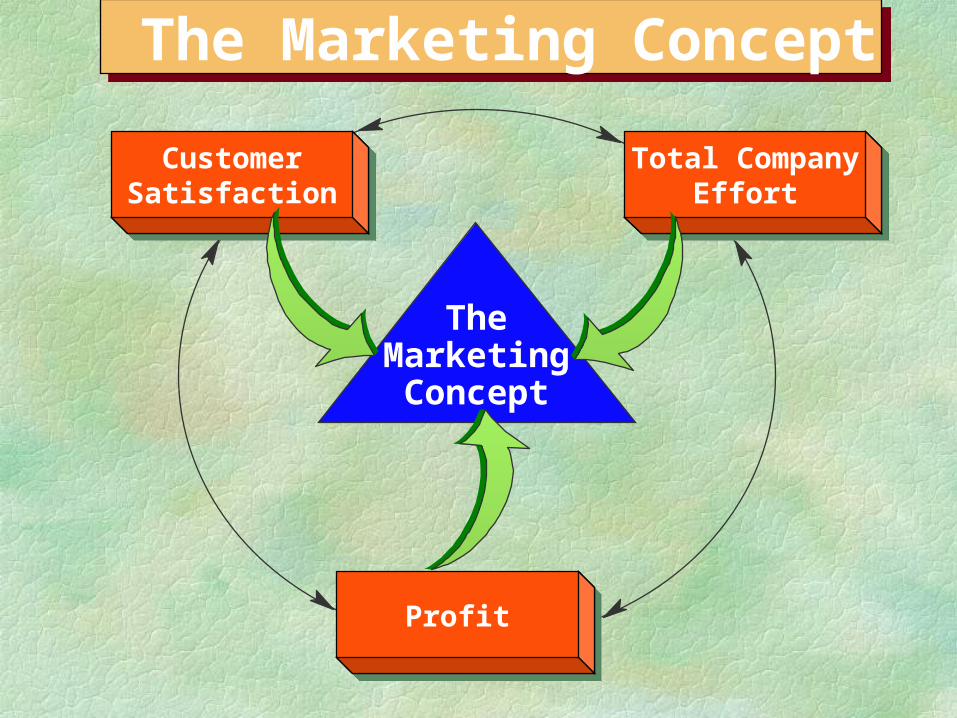
The Marketing Concept The Marketing Concept
ProfitProfit
CustomerSatisfaction
CustomerSatisfaction
Total CompanyEffort
Total CompanyEffort
TheMarketingConcept
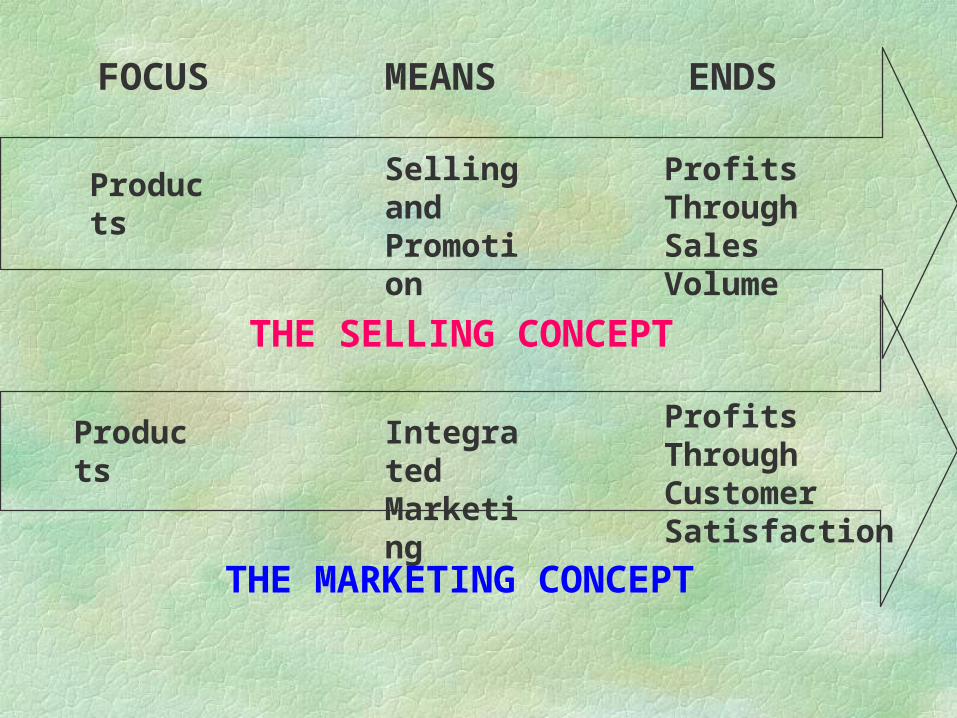
FOCUS MEANS ENDS
Products Selling and Promotion
Profits Through Sales Volume
THE SELLING CONCEPT
Products Integrated Marketing
Profits Through Customer Satisfaction
THE MARKETING CONCEPT
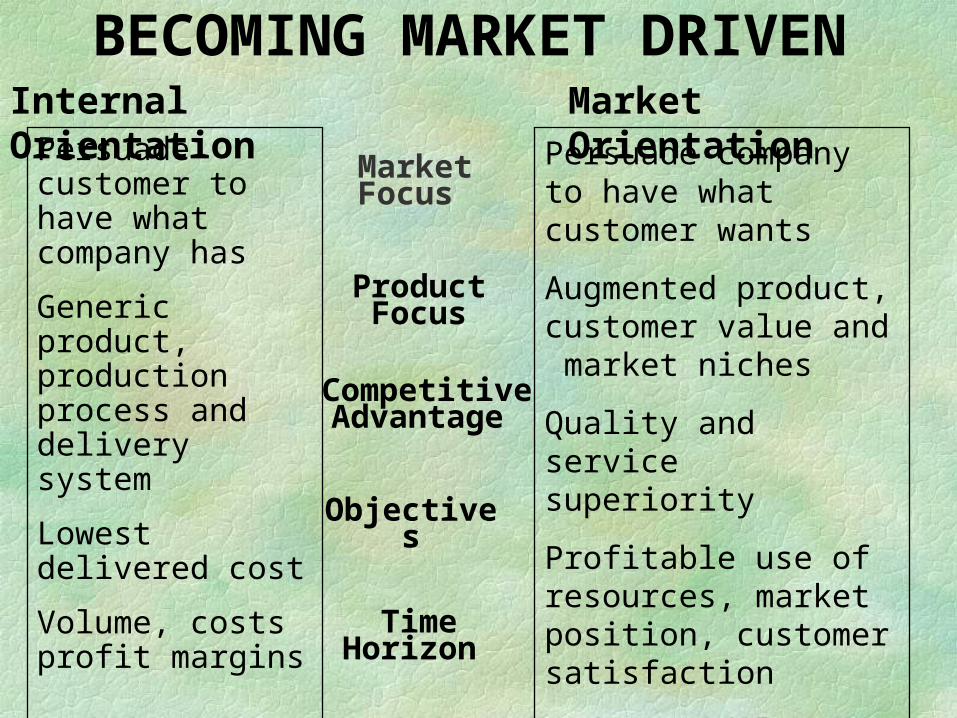
BECOMING MARKET DRIVEN Internal Orientation
Persuade customer to have what company has
Generic product, production process and delivery system
Lowest delivered cost
Volume, costs profit margins
Short term, reactive
Market Focus
Product Focus
Competitive Advantage
Objectives
Time Horizon
Market OrientationPersuade company to have what customer wants
Augmented product, customer value and market niches
Quality and service superiority
Profitable use of resources, market position, customer satisfaction
Medium and long run view of threats and opportunities
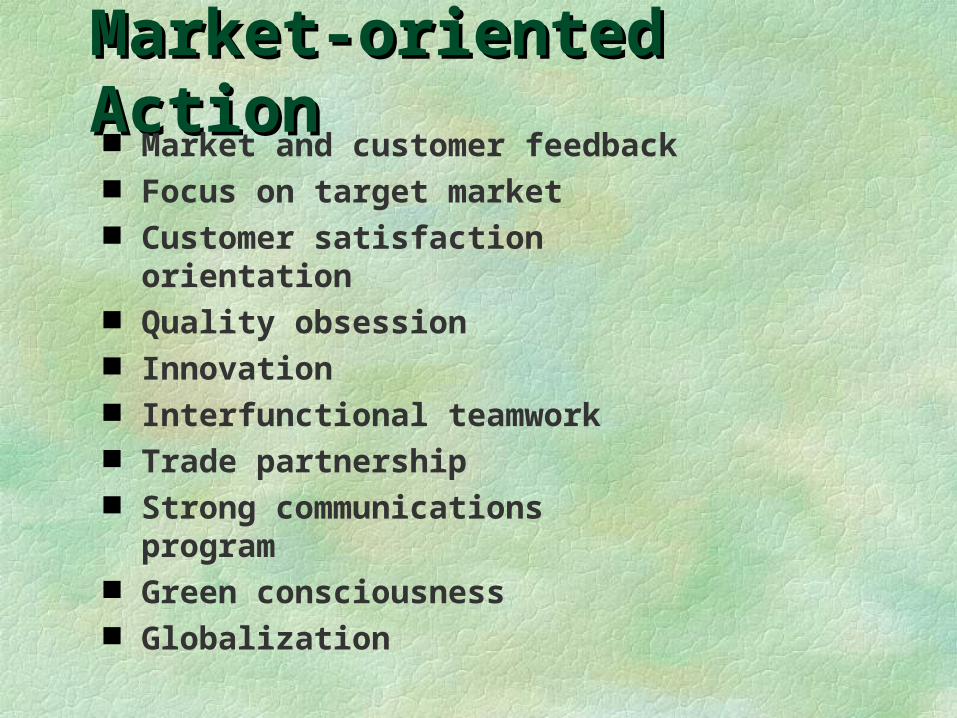
Market-oriented ActionMarket-oriented Action Market and customer feedback Focus on target market Customer satisfaction orientation Quality obsession Innovation Interfunctional teamwork Trade partnership Strong communications program Green consciousness Globalization
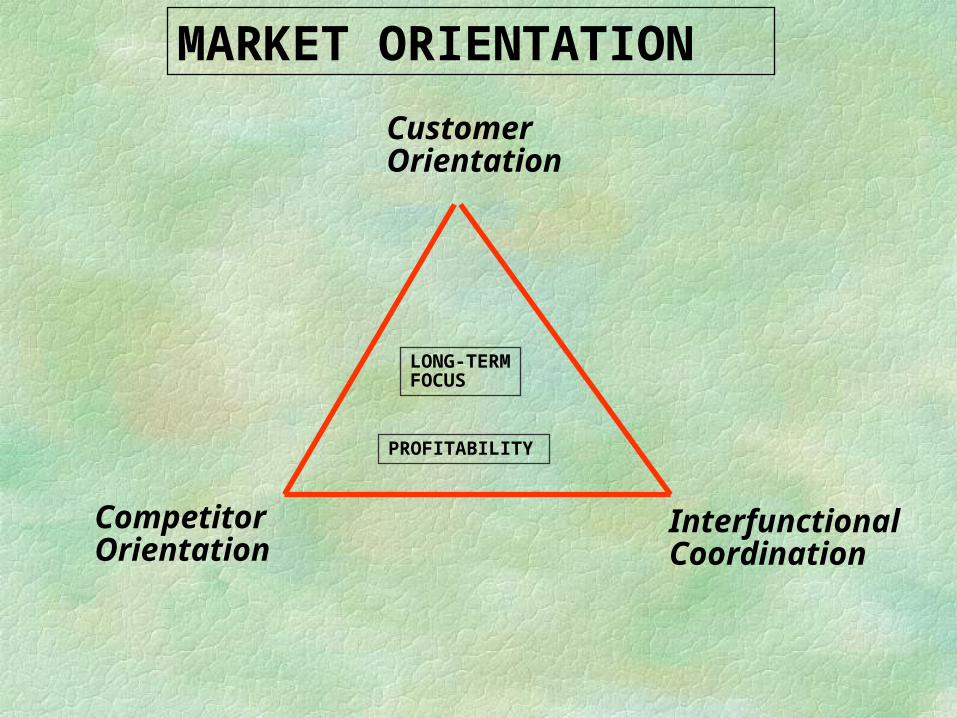
Customer Orientation
Competitor Orientation
Interfunctional Coordination
LONG-TERMFOCUS
PROFITABILITY
MARKET ORIENTATION
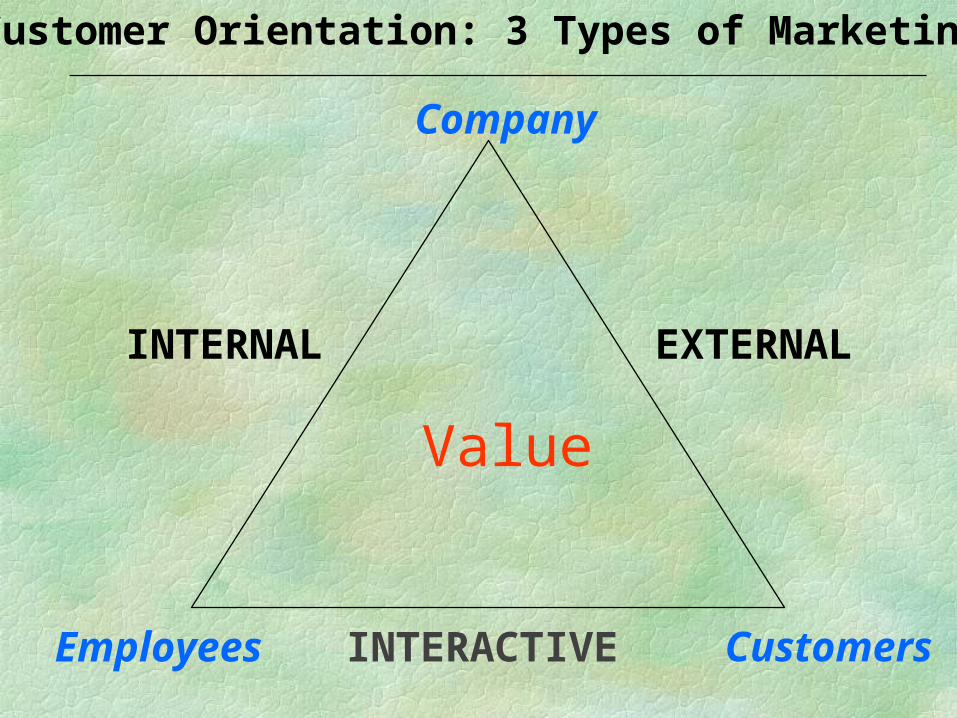
Customer Orientation: 3 Types of Marketing
Employees INTERACTIVE Customers
INTERNAL EXTERNAL
Company
Value
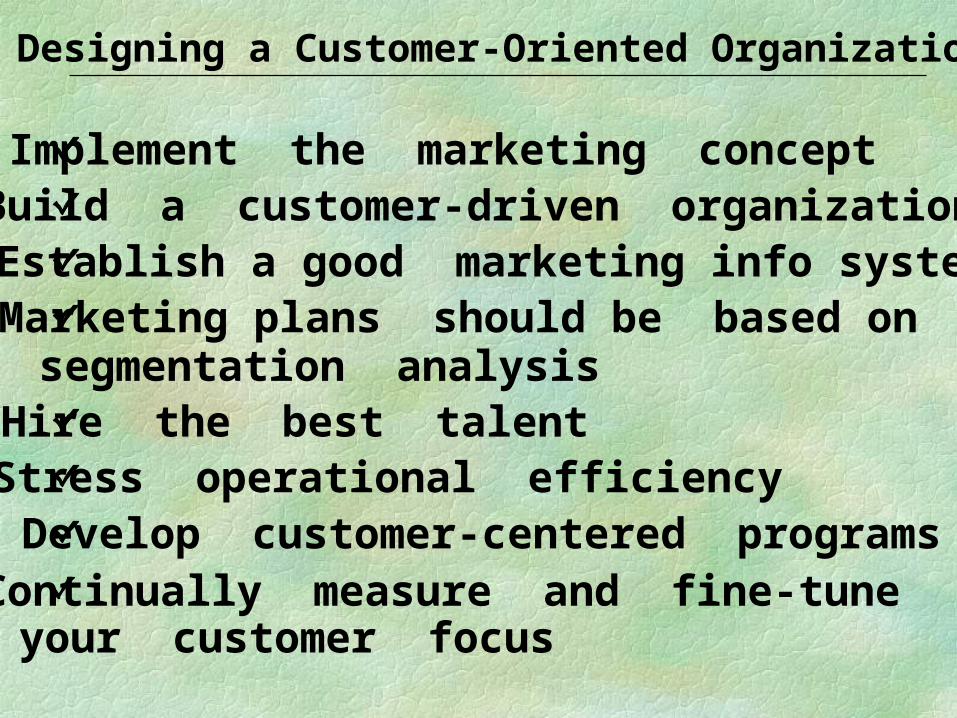
Designing a Customer-Oriented Organization
Implement the marketing conceptBuild a customer-driven organizationEstablish a good marketing info systemMarketing plans should be based on segmentation analysisHire the best talentStress operational efficiencyDevelop customer-centered programsContinually measure and fine-tune your customer focus
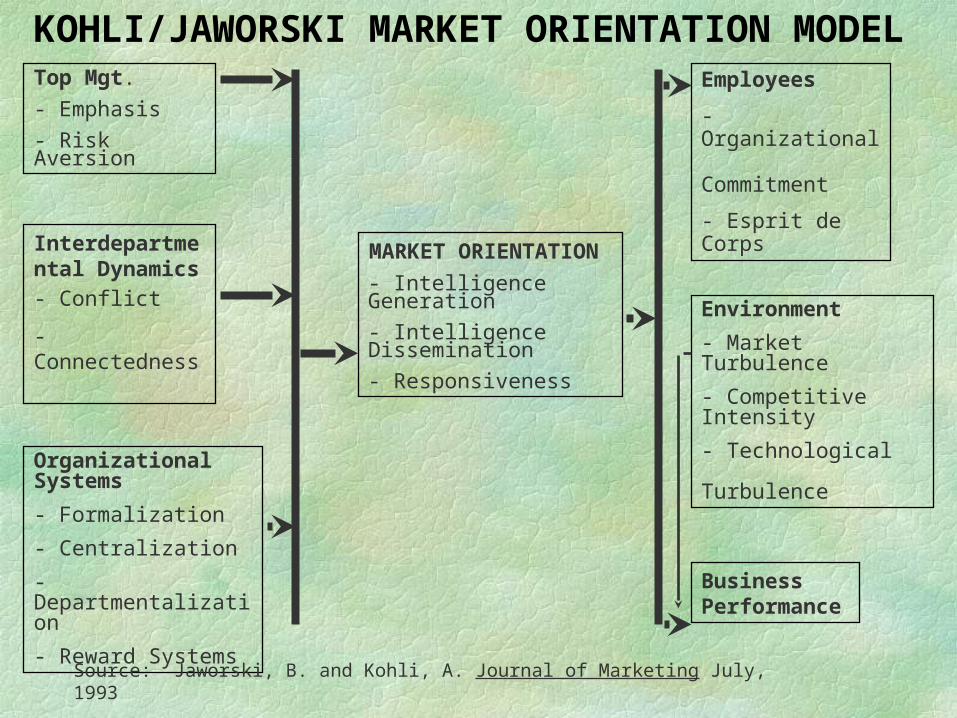
KOHLI/JAWORSKI MARKET ORIENTATION MODEL Top Mgt.
- Emphasis
- Risk Aversion
Interdepartmental Dynamics
- Conflict
- Connectedness
Organizational Systems
- Formalization
- Centralization
- Departmentalization
- Reward Systems
MARKET ORIENTATION
- Intelligence Generation
- Intelligence Dissemination
- Responsiveness
Employees
- Organizational Commitment
- Esprit de Corps
Environment
- Market Turbulence
- Competitive Intensity
- Technological Turbulence
Business Performance
Source: Jaworski, B. and Kohli, A. Journal of Marketing July, 1993
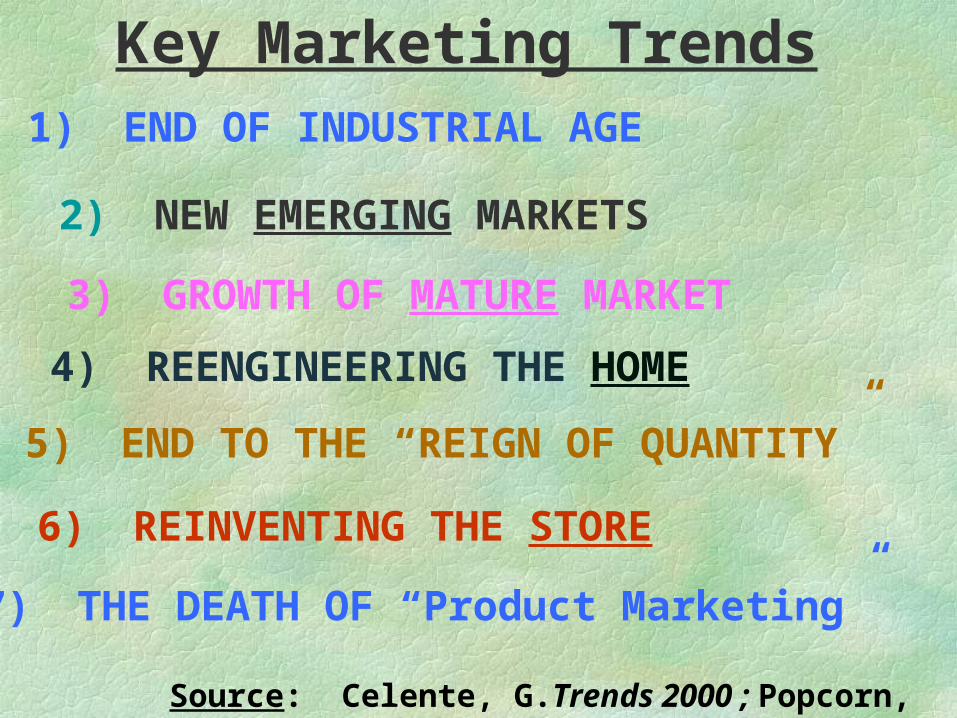
Key Marketing Trends1) END OF INDUSTRIAL AGE
2) NEW EMERGING MARKETS
3) GROWTH OF MATURE MARKET
4) REENGINEERING THE HOME
5) END TO THE “REIGN OF QUANTITY”
6) REINVENTING THE STORE
7) THE DEATH OF “Product Marketing”
Source: Celente, G.Trends 2000 ; Popcorn, F Clicking
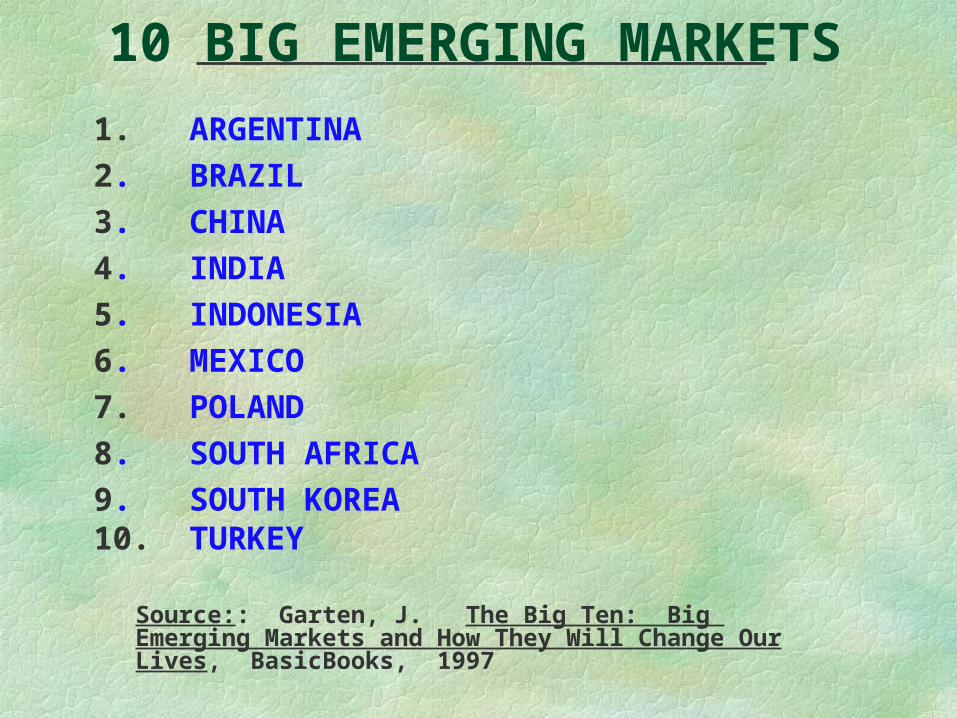
10 BIG EMERGING MARKETS
1. ARGENTINA2. BRAZIL3. CHINA4. INDIA5. INDONESIA6. MEXICO7. POLAND8. SOUTH AFRICA9. SOUTH KOREA10. TURKEY
Source:: Garten, J. The Big Ten: Big Emerging Markets and How They Will Change Our Lives, BasicBooks, 1997
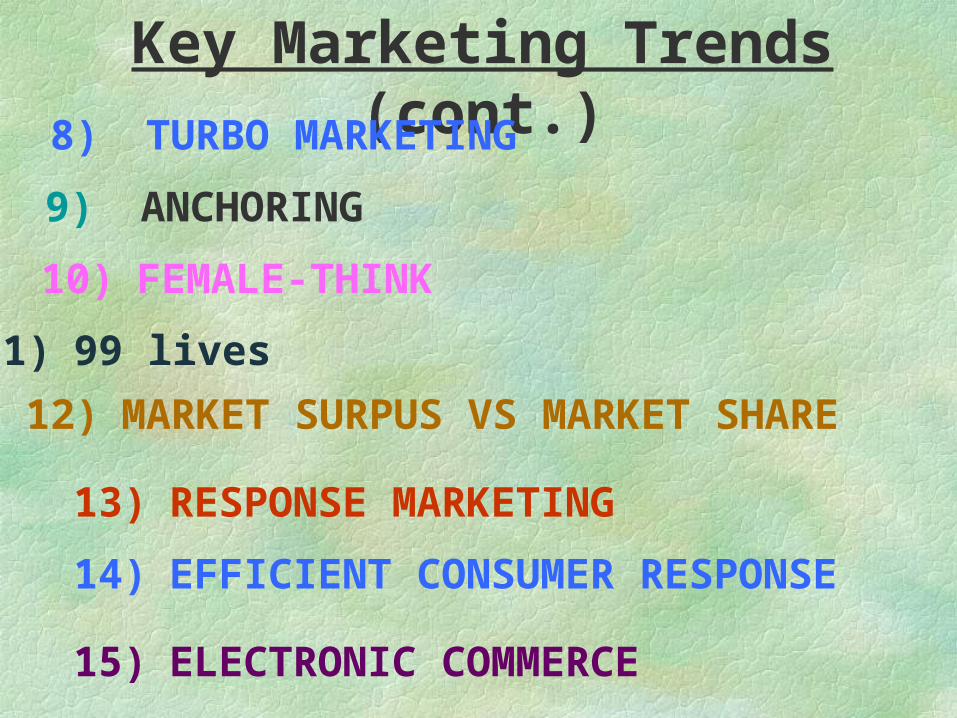
Key Marketing Trends (cont.)
8) TURBO MARKETING
9) ANCHORING
10) FEMALE-THINK
11) 99 lives
12) MARKET SURPUS VS MARKET SHARE
13) RESPONSE MARKETING
14) EFFICIENT CONSUMER RESPONSE
15) ELECTRONIC COMMERCE
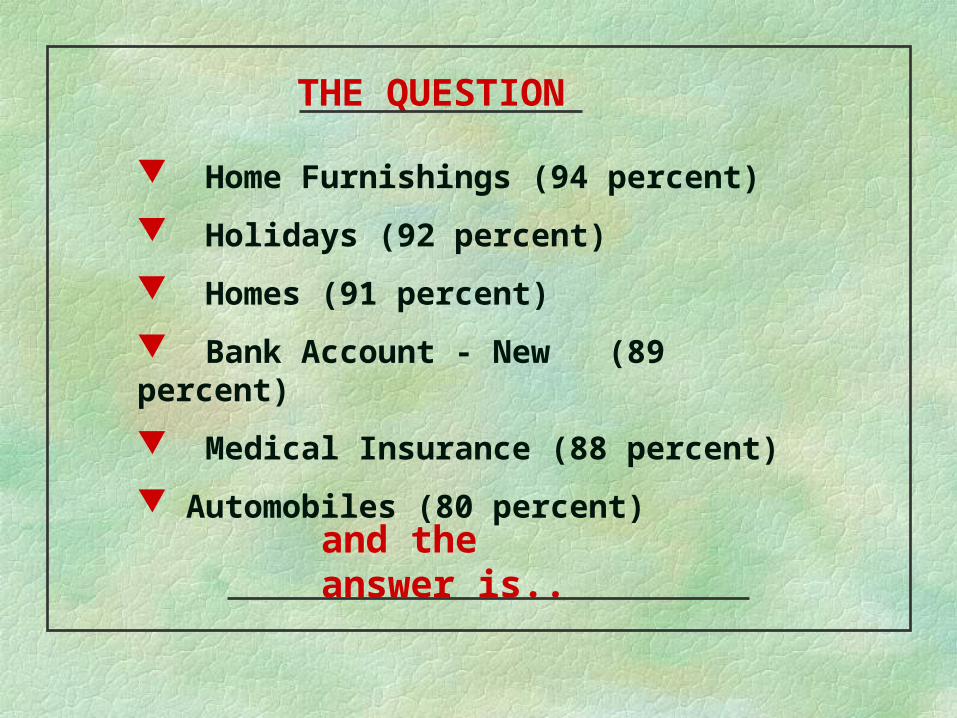
THE QUESTION
Home Furnishings (94 percent)
Holidays (92 percent)
Homes (91 percent)
Bank Account - New (89 percent)
Medical Insurance (88 percent)
Automobiles (80 percent)
and the answer is..
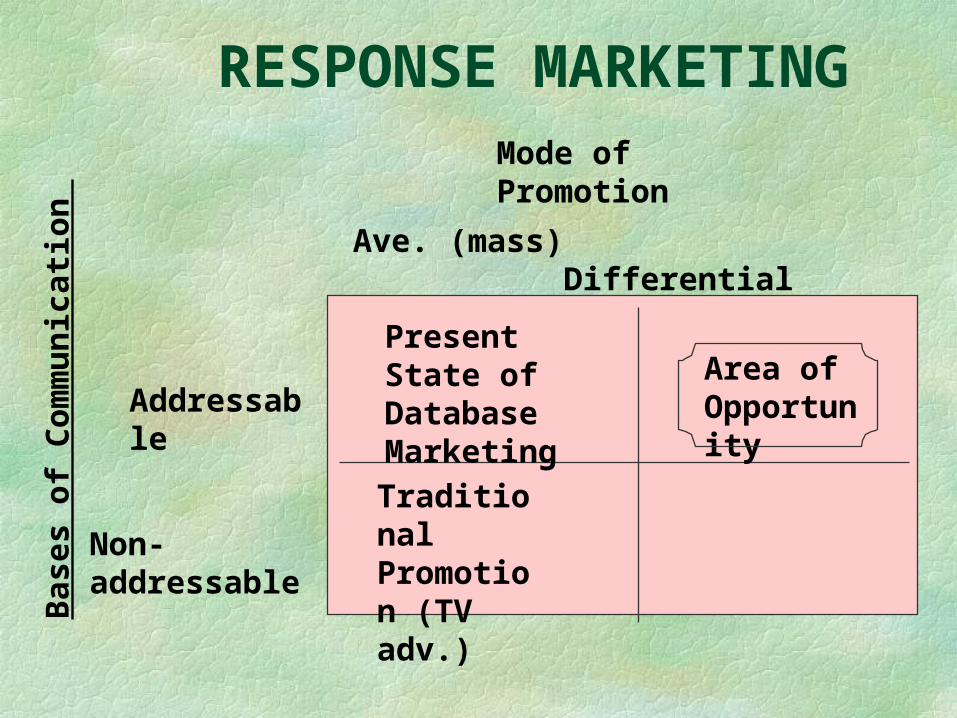
RESPONSE MARKETING B
ases
of
Com
mu
nic
atio
n
Present State of Database Marketing
Traditional Promotion (TV adv.)
Area of Opportunity Addressable
Non-addressable
Mode of Promotion
Ave. (mass) Differential
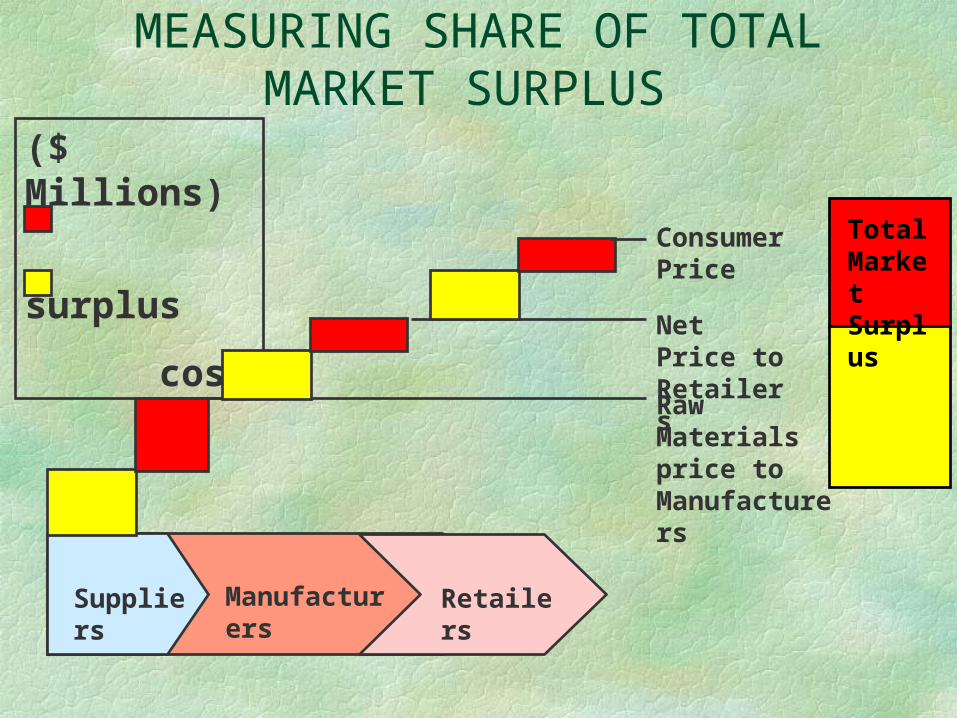
MEASURING SHARE OF TOTAL MARKET SURPLUS
($ Millions)
surplus
cost
Suppliers Retailers Manufacturers
Total Market Surplus
Consumer Price
Net Price to Retailers
Raw Materials price to Manufacturers

Key Marketing Trends (cont.)
16) THE “VALUE” IMPERATIVE
17) TRANSPARANCY OF THE CORPORATION
18) CULTURAL, HISTORICAL TOURISM
19) EATING SCARED
20) INTEGRATED MARKETING
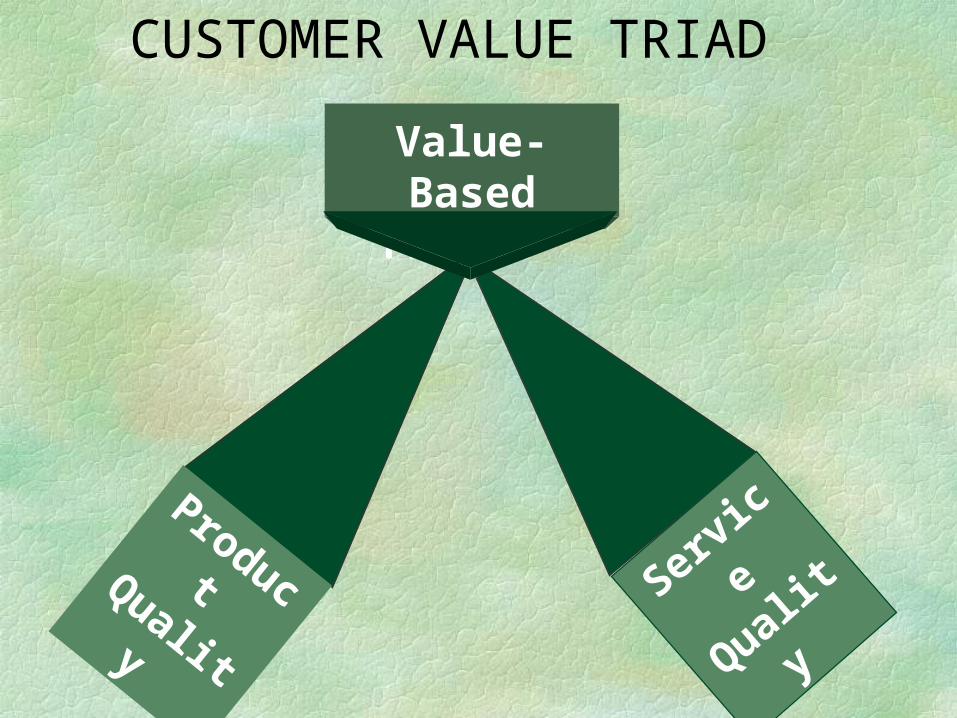
CUSTOMER VALUE TRIAD
Value-Based Prices
Service
Quality
Product Quality
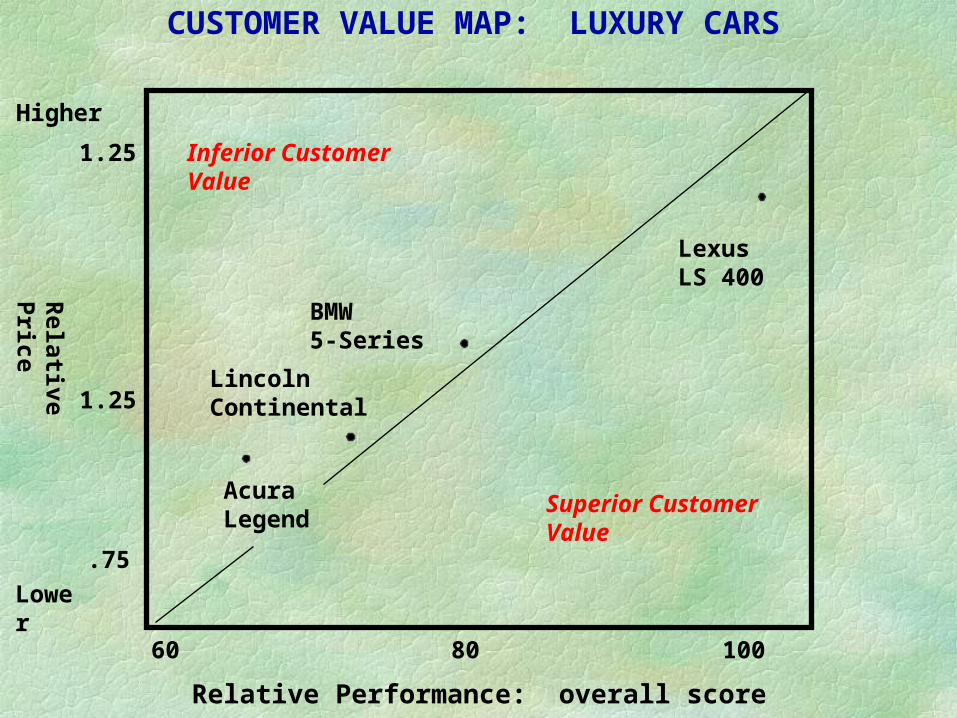
CUSTOMER VALUE MAP: LUXURY CARS
Higher
Relative
Price
Lower
Relative Performance: overall score
1.25
1.25
.75
60 80 100
Inferior CustomerValue
Superior CustomerValue
BMW5-Series
LexusLS 400
*
*
LincolnContinental
*
AcuraLegend
*
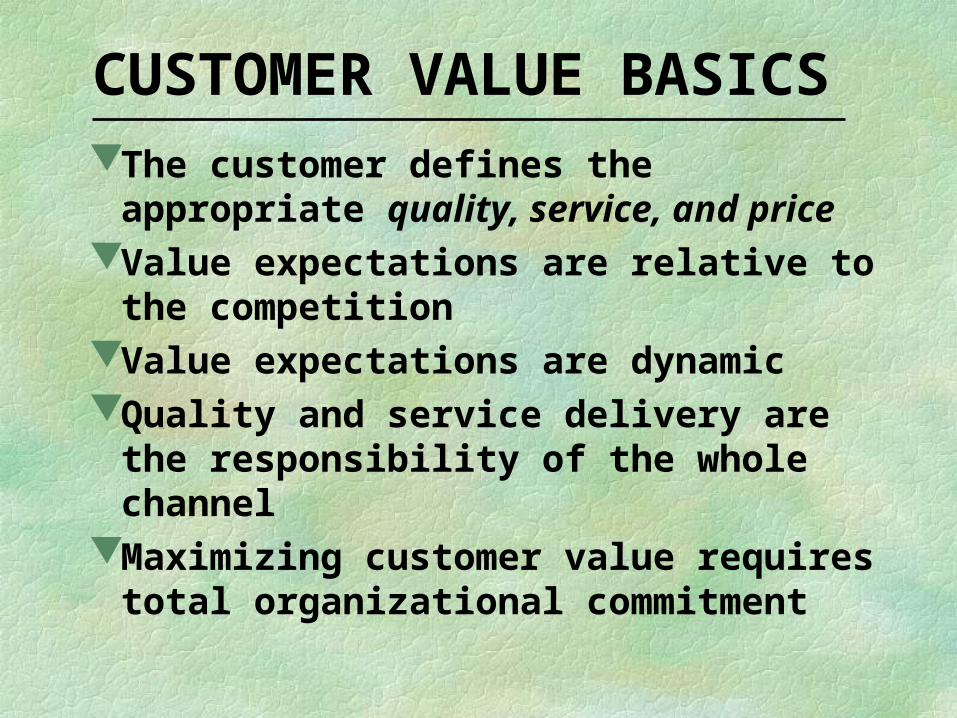
CUSTOMER VALUE BASICS
The customer defines the appropriate quality, service, and price
Value expectations are relative to the competition
Value expectations are dynamicQuality and service delivery are the
responsibility of the whole channelMaximizing customer value requires
total organizational commitment
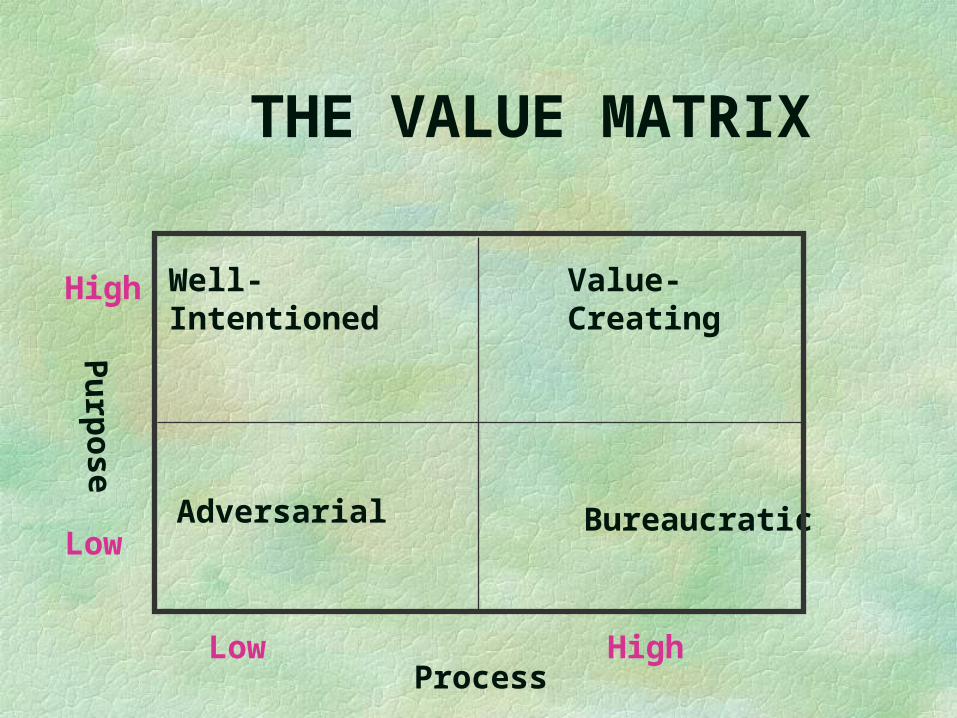
THE VALUE MATRIX
Process
Pu
rpose
High
Low
Low High
Well-Intentioned
Adversarial
Value-Creating
Bureaucratic
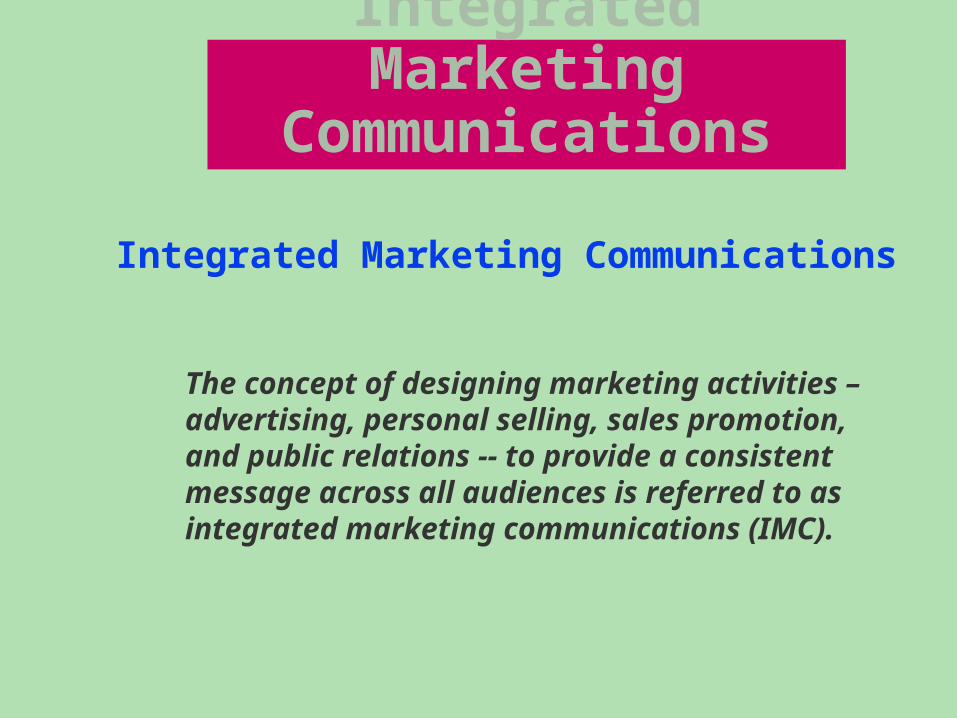
Integrated Marketing Communications
The concept of designing marketing activities –advertising, personal selling, sales promotion,and public relations -- to provide a consistentmessage across all audiences is referred to as integrated marketing communications (IMC).
Integrated Marketing Communications
IRWIN©Times Mirror Higher Education Group, Inc.
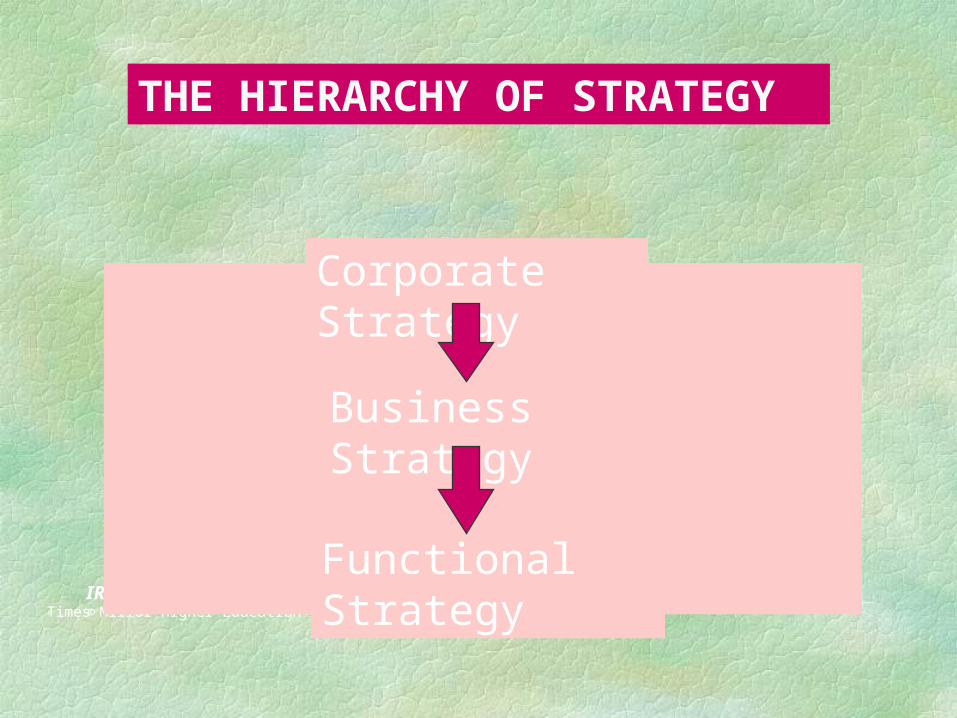
Corporate Strategy
Business Strategy
Functional Strategy
THE HIERARCHY OF STRATEGY
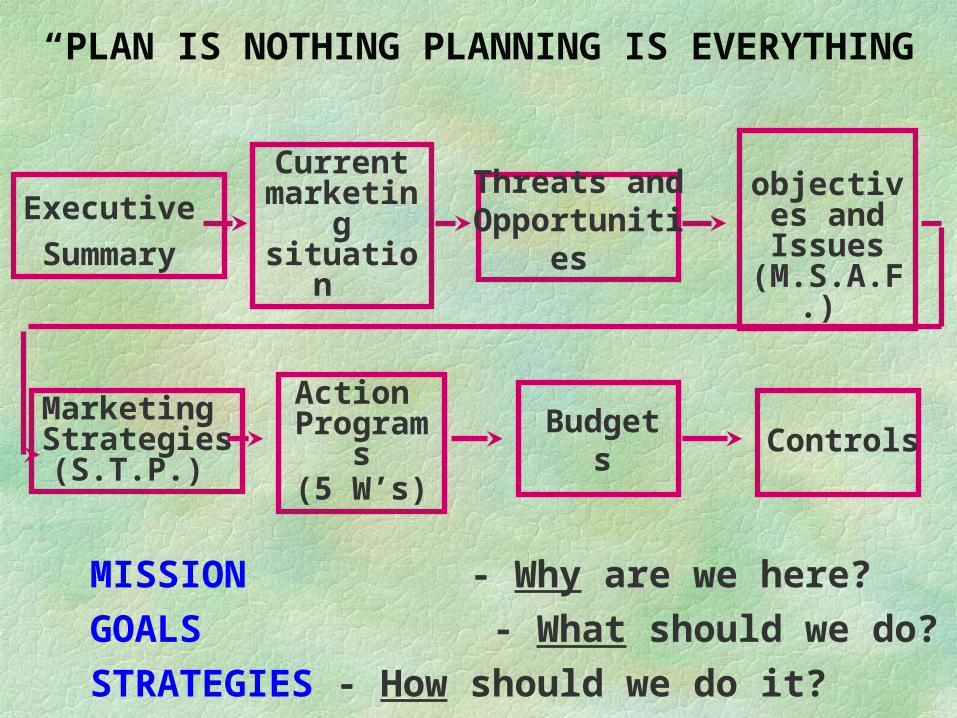
Executive
Summary
Current marketing situation
objectives and Issues (M.S.A.F.)
Marketing Strategies(S.T.P.)
Action Programs(5 W’s)
Budgets Controls
“PLAN IS NOTHING PLANNING IS EVERYTHING”
Threats and Opportunities
MISSION - Why are we here?
GOALS - What should we do?
STRATEGIES - How should we do it?
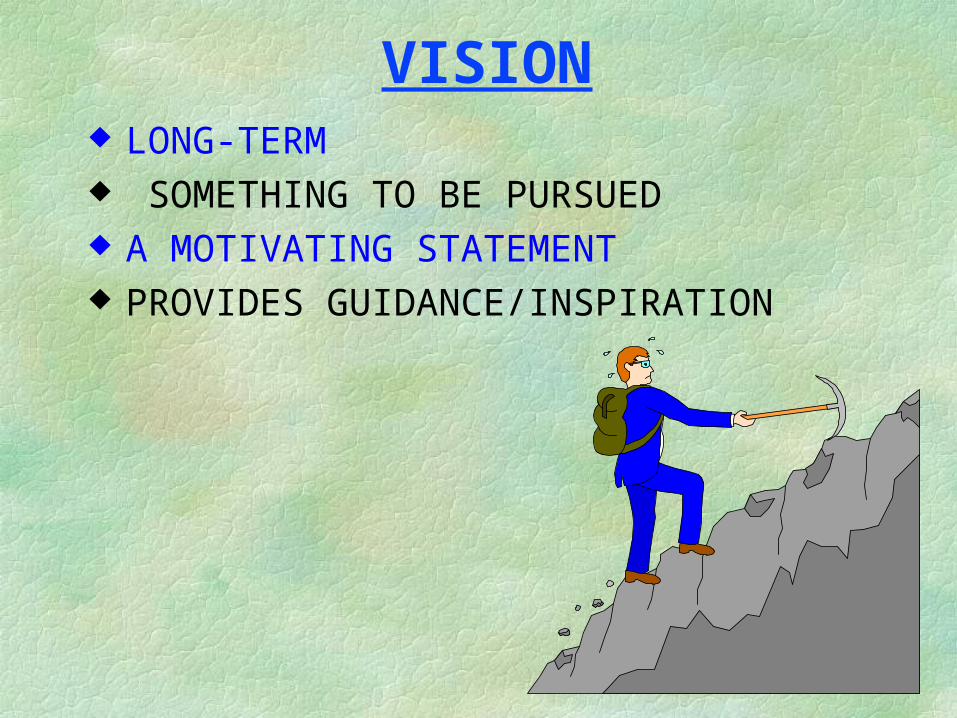
VISION LONG-TERM SOMETHING TO BE PURSUED A MOTIVATING STATEMENT PROVIDES GUIDANCE/INSPIRATION
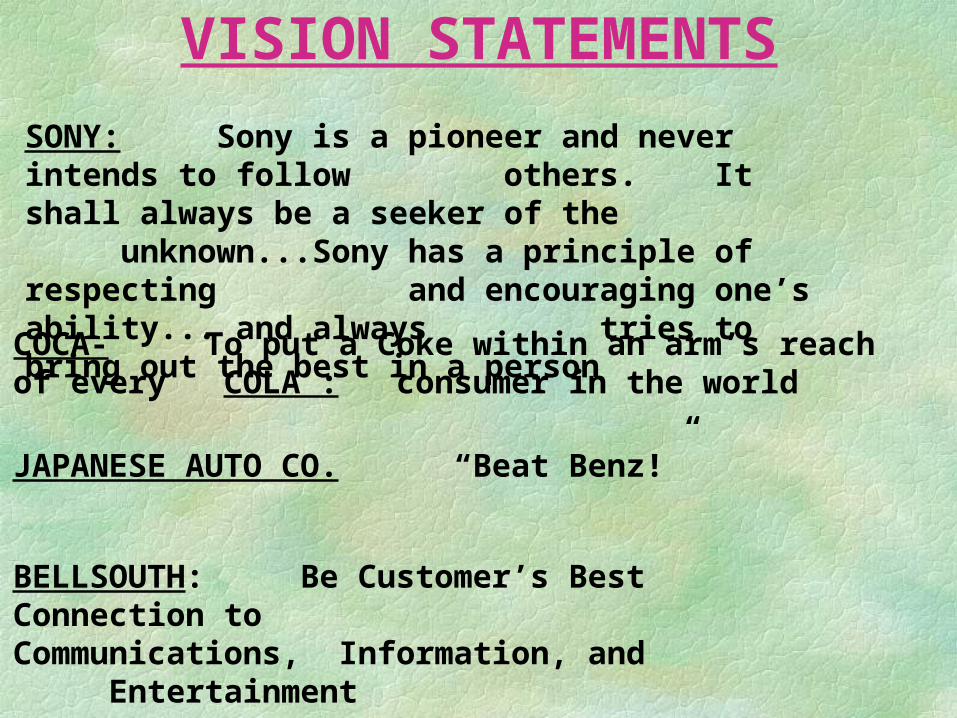
SONY: Sony is a pioneer and never intends to follow others. It shall always be a seeker of the unknown...Sony has a principle of respecting and encouraging one’s ability... and always tries to bring out the best in a person
COCA- To put a Coke within an arm’s reach of every COLA : consumer in the world
JAPANESE AUTO CO. “Beat Benz!”
BELLSOUTH: Be Customer’s Best Connection to Communications, Information, and Entertainment
VISION STATEMENTS
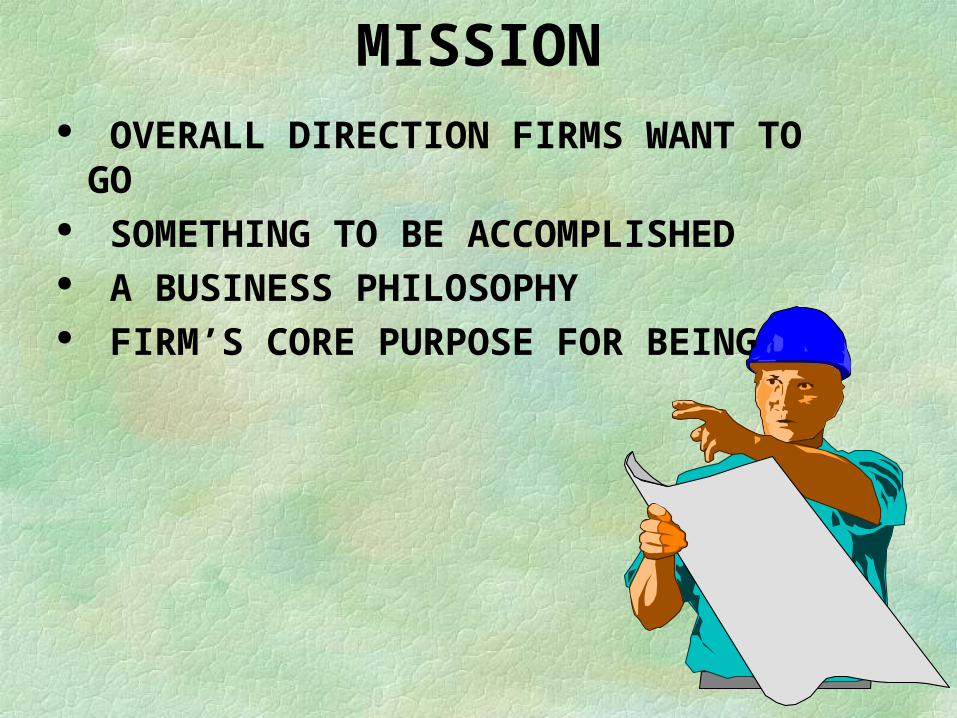
MISSION OVERALL DIRECTION FIRMS WANT
TO GO SOMETHING TO BE ACCOMPLISHED A BUSINESS PHILOSOPHY FIRM’S CORE PURPOSE FOR BEING
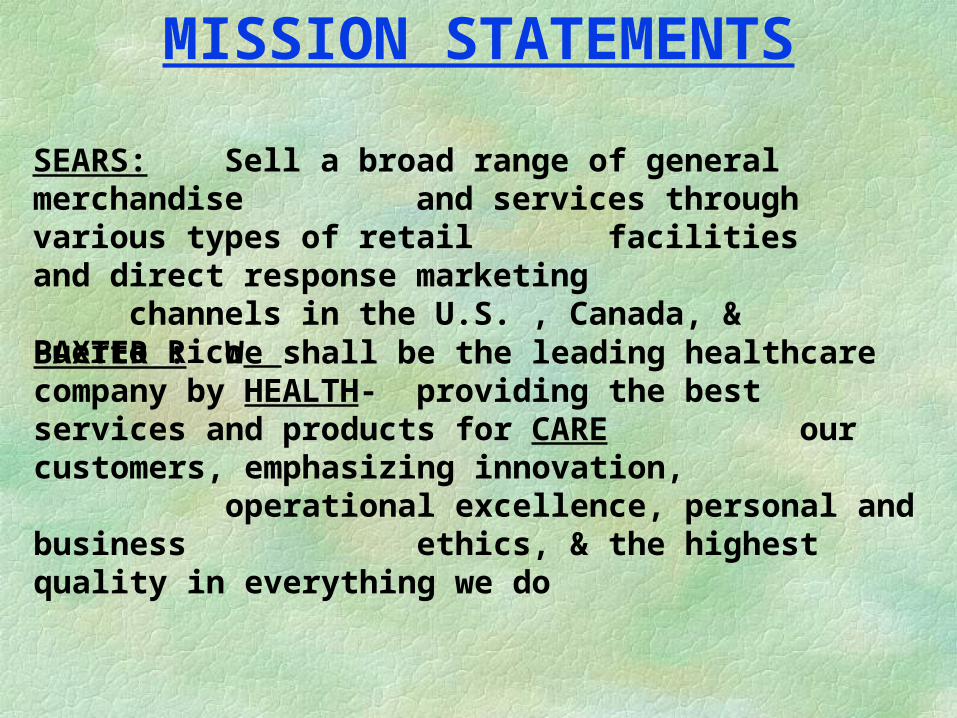
MISSION STATEMENTS
SEARS: Sell a broad range of general merchandise and services through various types of retail facilities and direct response marketing channels in the U.S. , Canada, & Puerto Rico
BAXTER : We shall be the leading healthcare company by HEALTH- providing the best services and products for CARE our customers, emphasizing innovation,
operational excellence, personal and business ethics, & the highest quality in everything we do
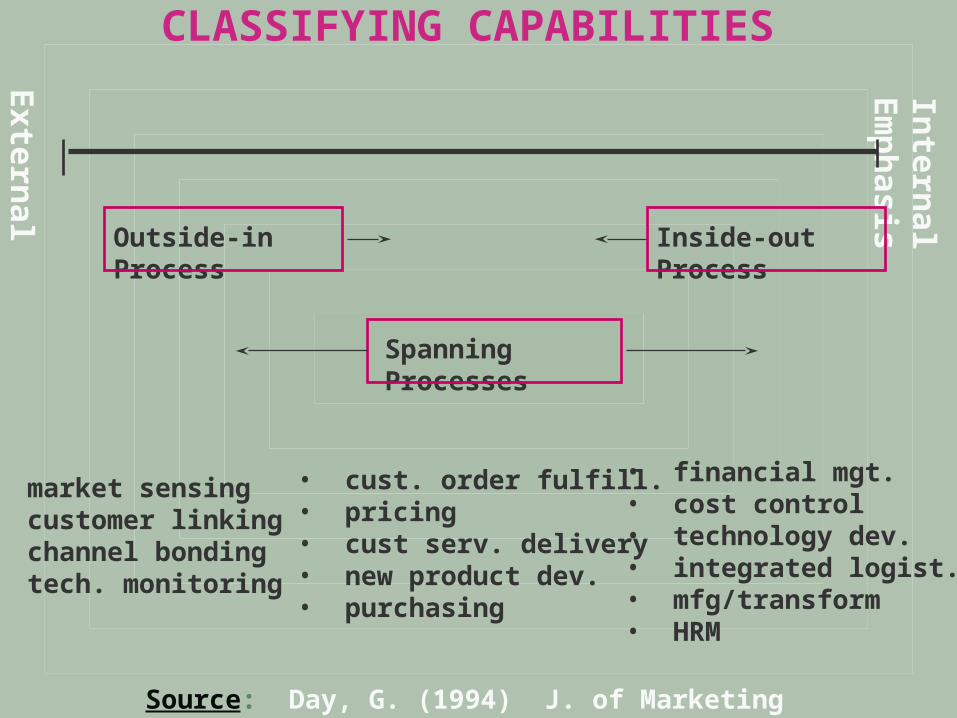
CLASSIFYING CAPABILITIES
Extern
al Em
ph
asis
Intern
al Em
ph
asis
Outside-in Process
Inside-out Process
Spanning Processes
• market sensing• customer linking• channel bonding• tech. monitoring
• cust. order fulfill.• pricing• cust serv. delivery• new product dev.• purchasing
• financial mgt.• cost control• technology dev.• integrated logist.• mfg/transform• HRM
Source: Day, G. (1994) J. of Marketing (58) October 37-52
Generic Strategies
Overall Cost Leadership Differentiation Focus
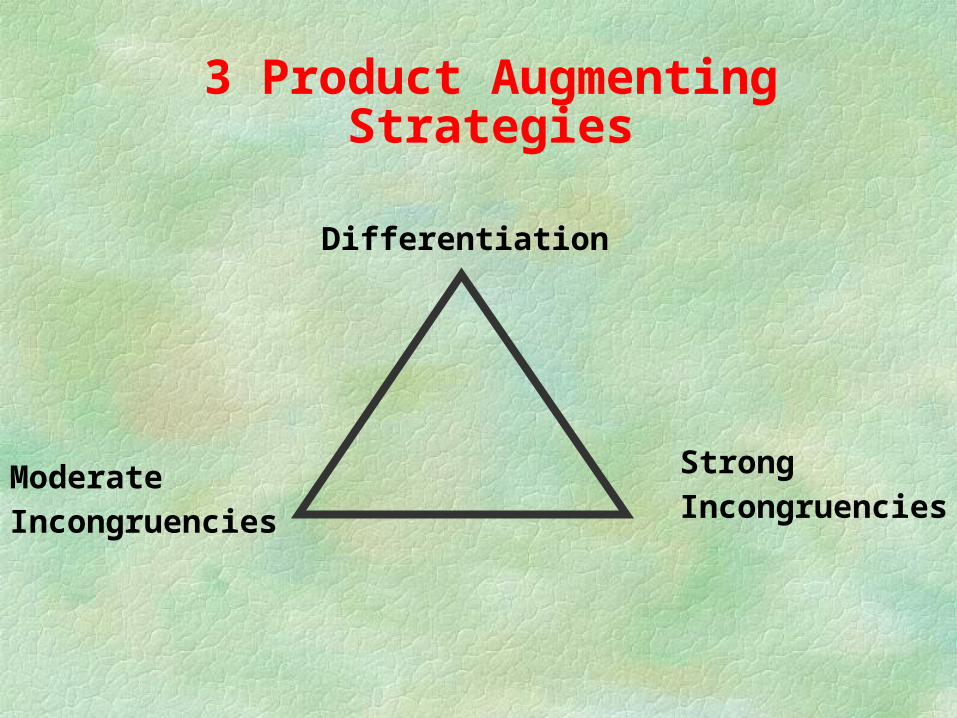
Differentiation
ModerateIncongruencies
Strong Incongruencies
3 Product Augmenting Strategies
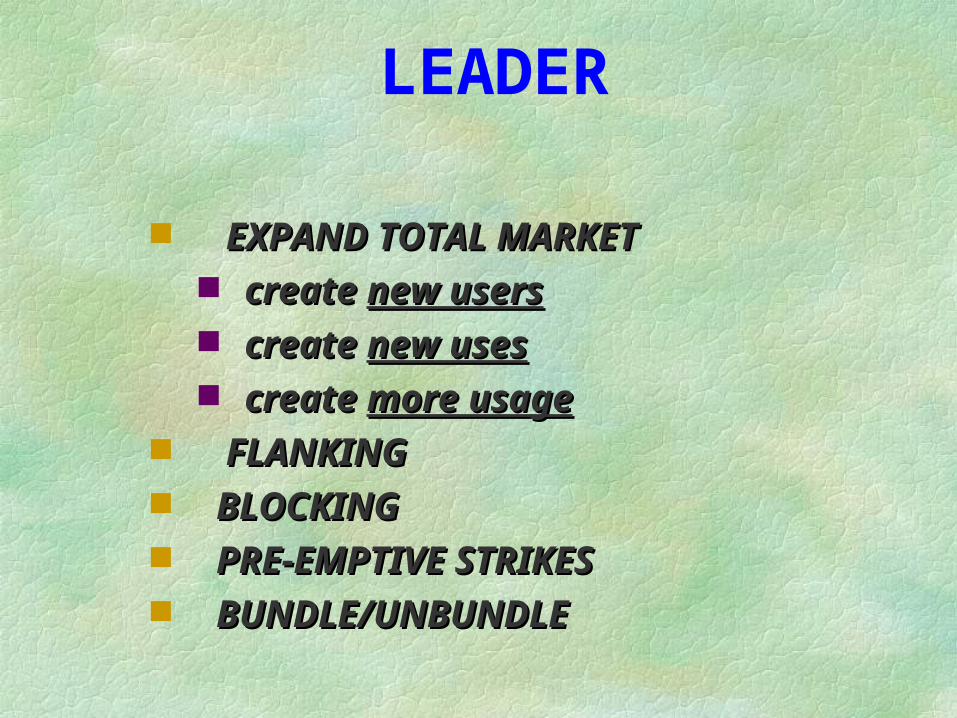
LEADER
EXPAND TOTAL MARKETEXPAND TOTAL MARKET create create new usersnew users create create new usesnew uses create create more usagemore usage
FLANKING FLANKING BLOCKINGBLOCKING PRE-EMPTIVE STRIKESPRE-EMPTIVE STRIKES BUNDLE/UNBUNDLEBUNDLE/UNBUNDLE
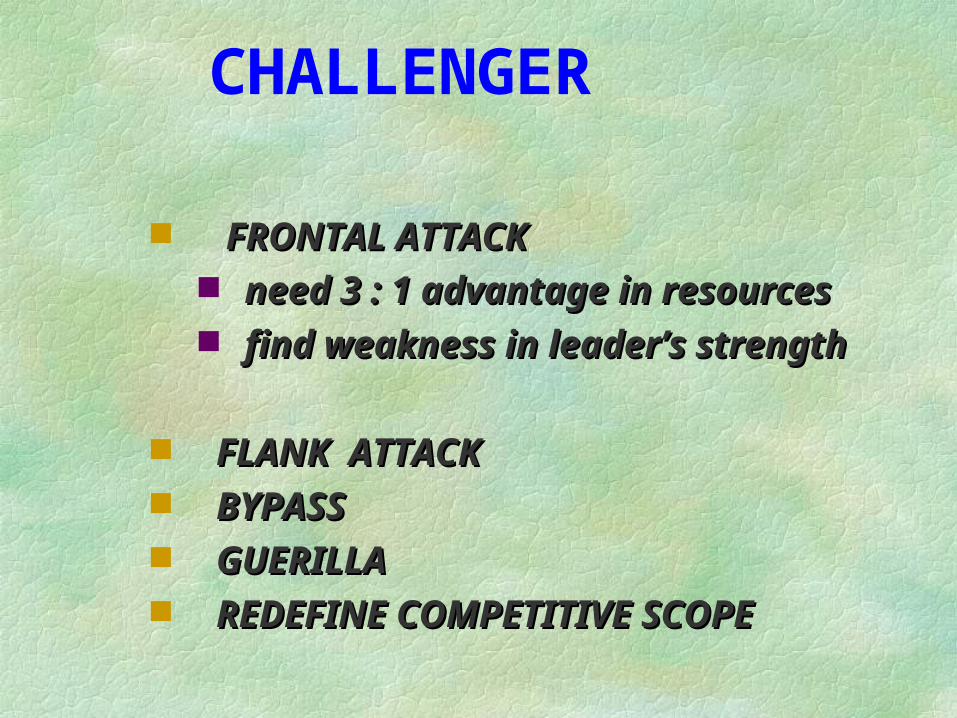
CHALLENGER
FRONTAL ATTACKFRONTAL ATTACK need 3 : 1 advantage in resourcesneed 3 : 1 advantage in resources find weakness in leader’s strengthfind weakness in leader’s strength
FLANK ATTACK FLANK ATTACK BYPASSBYPASS GUERILLAGUERILLA REDEFINE COMPETITIVE SCOPEREDEFINE COMPETITIVE SCOPE
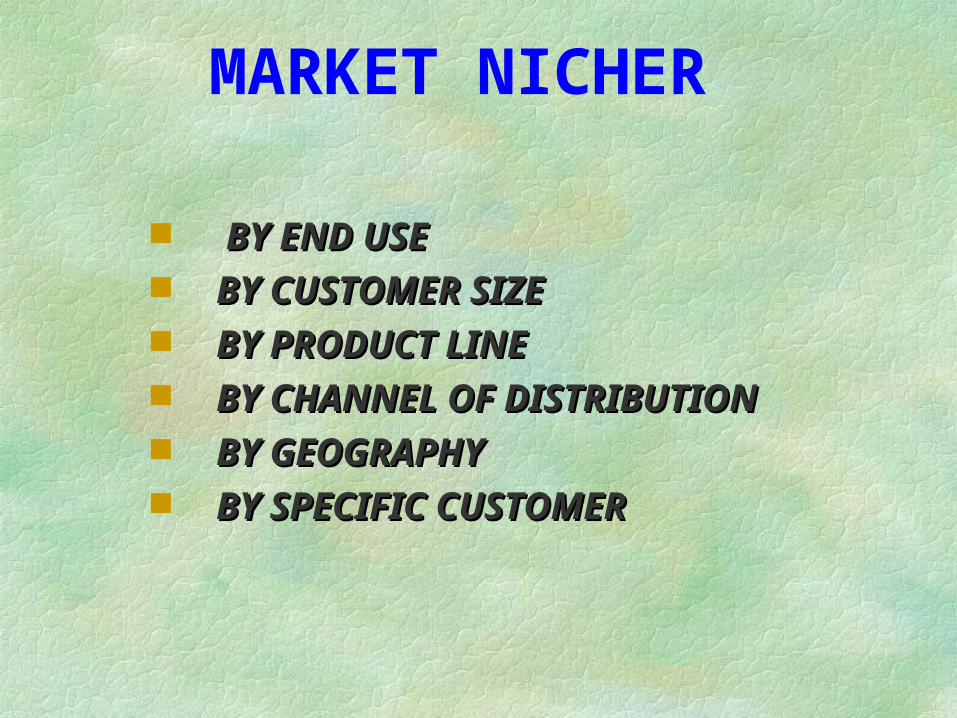
MARKET NICHER
BY END USEBY END USE BY CUSTOMER SIZE BY CUSTOMER SIZE BY PRODUCT LINEBY PRODUCT LINE BY CHANNEL OF DISTRIBUTIONBY CHANNEL OF DISTRIBUTION BY GEOGRAPHYBY GEOGRAPHY BY SPECIFIC CUSTOMERBY SPECIFIC CUSTOMER
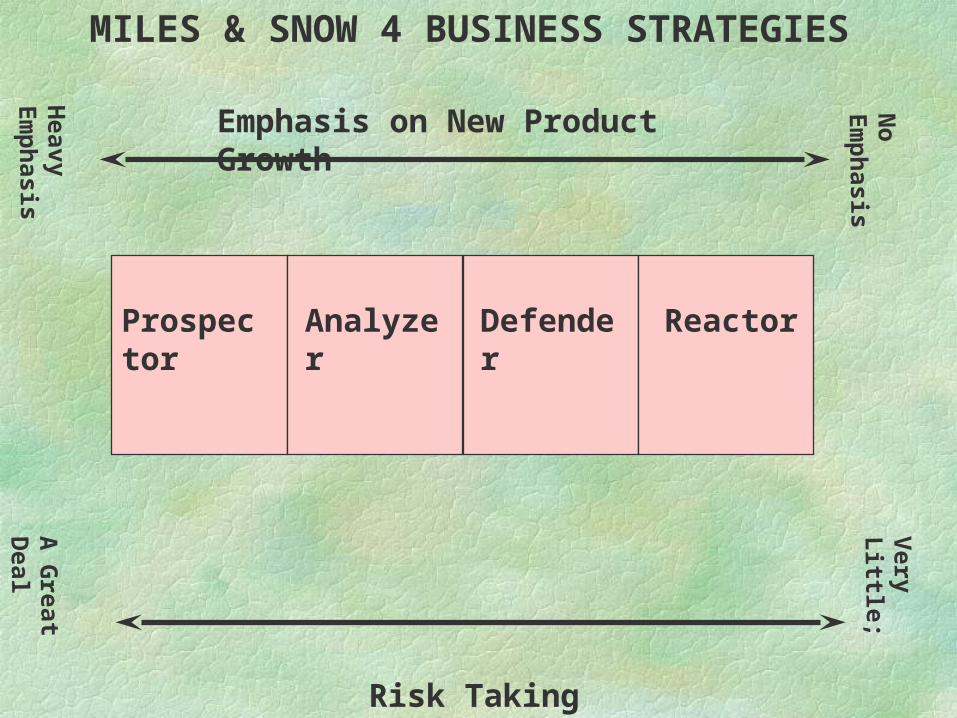
MILES & SNOW 4 BUSINESS STRATEGIES
Emphasis on New Product Growth
Risk Taking
No E
mph
asis
Heavy E
mphasis
A G
reat Deal
Very L
ittle;
Prospector
Analyzer
Defender
Reactor
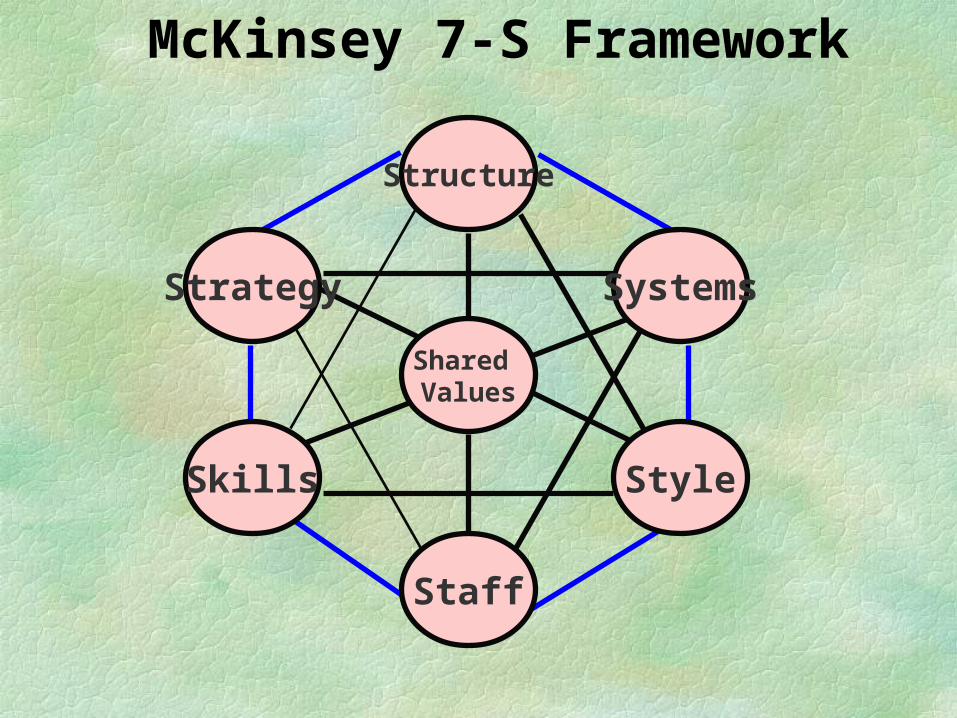
Structure
StyleSkills
Shared Values
Systems
Staff
Strategy
McKinsey 7-S Framework
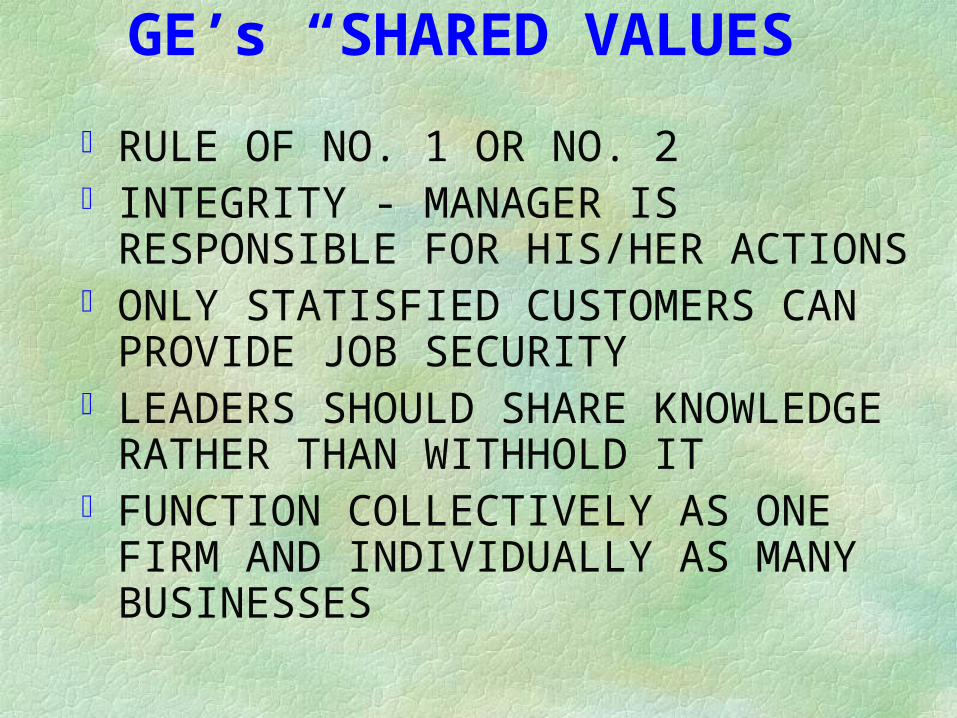
GE’s “SHARED VALUES”
RULE OF NO. 1 OR NO. 2 INTEGRITY - MANAGER IS RESPONSIBLE
FOR HIS/HER ACTIONS ONLY STATISFIED CUSTOMERS CAN
PROVIDE JOB SECURITY LEADERS SHOULD SHARE KNOWLEDGE
RATHER THAN WITHHOLD IT FUNCTION COLLECTIVELY AS ONE FIRM
AND INDIVIDUALLY AS MANY BUSINESSES
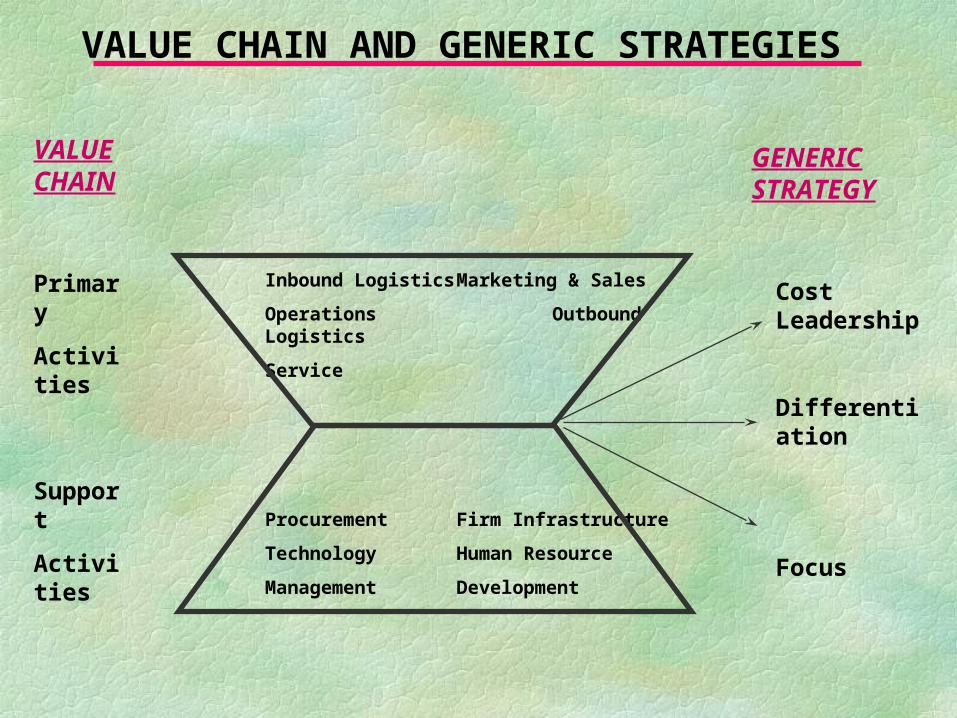
VALUE CHAIN AND GENERIC STRATEGIES
VALUE CHAIN
Primary
Activities
Support
Activities
Inbound Logistics Marketing & Sales
Operations Outbound Logistics
Service
Procurement Firm Infrastructure
Technology Human Resource
Management Development
GENERIC STRATEGY
Cost Leadership
Differentiation
Focus
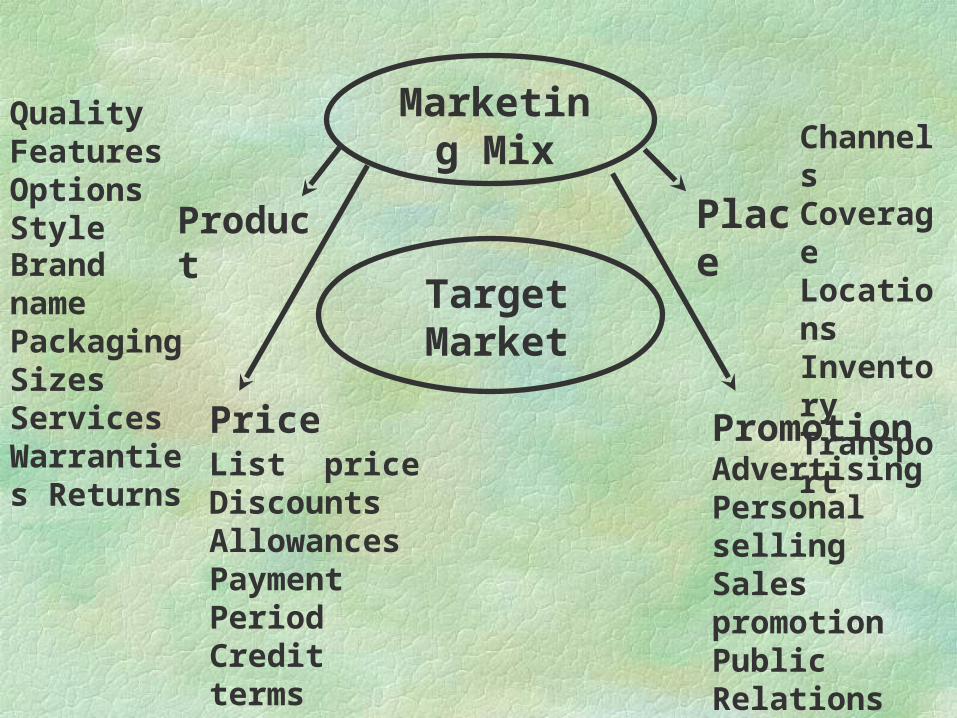
Marketing Mix
Target Market
Place
Channels Coverage Locations Inventory Transport
Promotion Advertising Personal selling Sales promotion Public Relations
Product
Quality Features Options Style Brand name Packaging Sizes Services Warranties Returns
Price List price Discounts Allowances Payment Period Credit terms
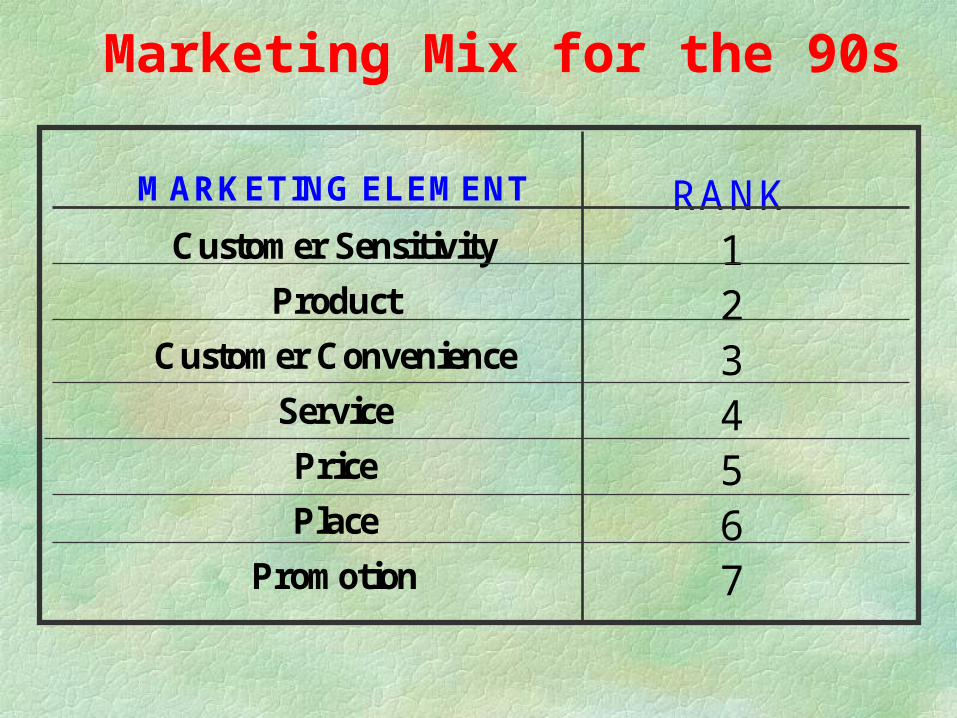
Marketing Mix for the 90s
MARKETING ELEMENT RANKCustomer Sensitivity 1
Product 2Customer Convenience 3
Service 4Price 5Place 6
Promotion 7
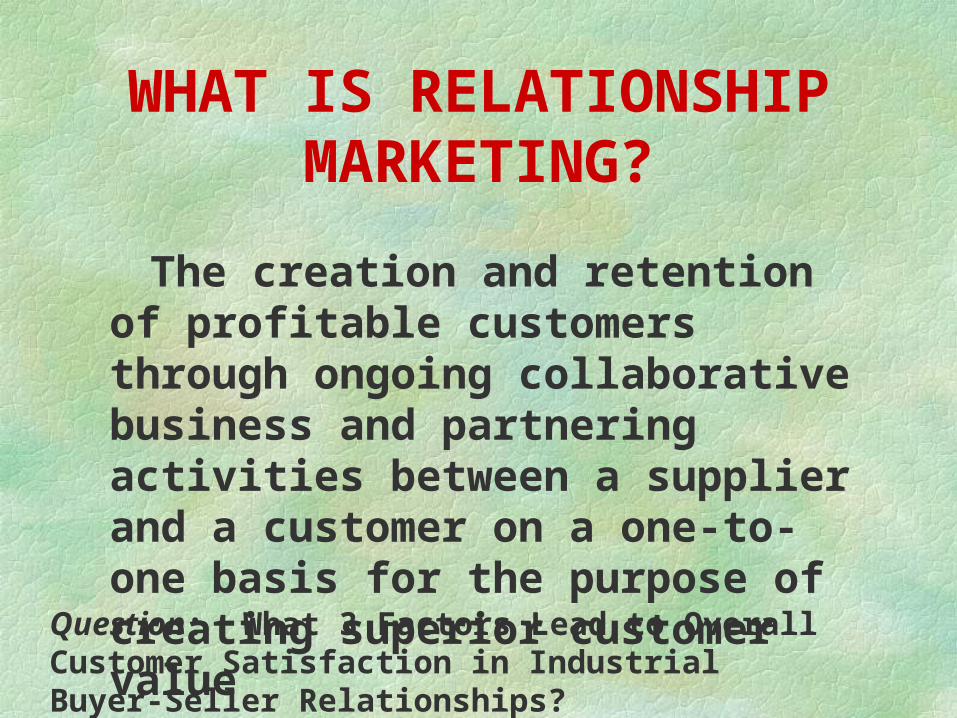
WHAT IS RELATIONSHIP MARKETING?
The creation and retention of profitable customers through ongoing collaborative business and partnering activities between a supplier and a customer on a one-to-one basis for the purpose of creating superior customer value
Question: What 3 Factors Lead to Overall Customer Satisfaction in Industrial Buyer-Seller Relationships?
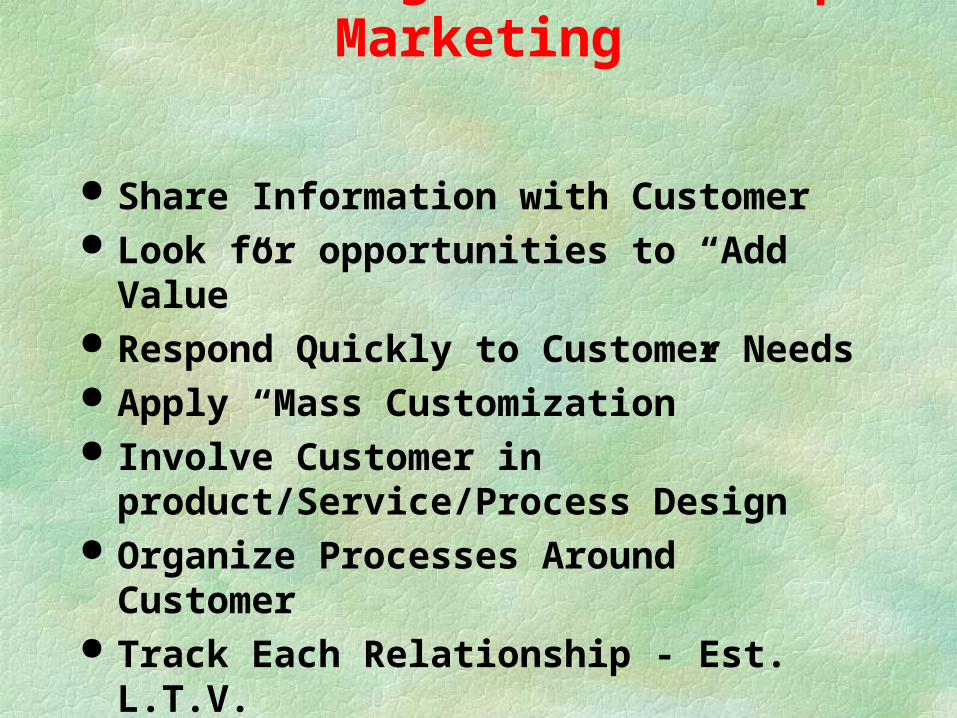
Practicing Relationship Marketing
Share Information with Customer Look for opportunities to “Add Value” Respond Quickly to Customer Needs Apply “Mass Customization” Involve Customer in
product/Service/Process Design Organize Processes Around Customer Track Each Relationship - Est. L.T.V. Deliver Differentiated Messages Based on
Customer Characteristics/Preferences
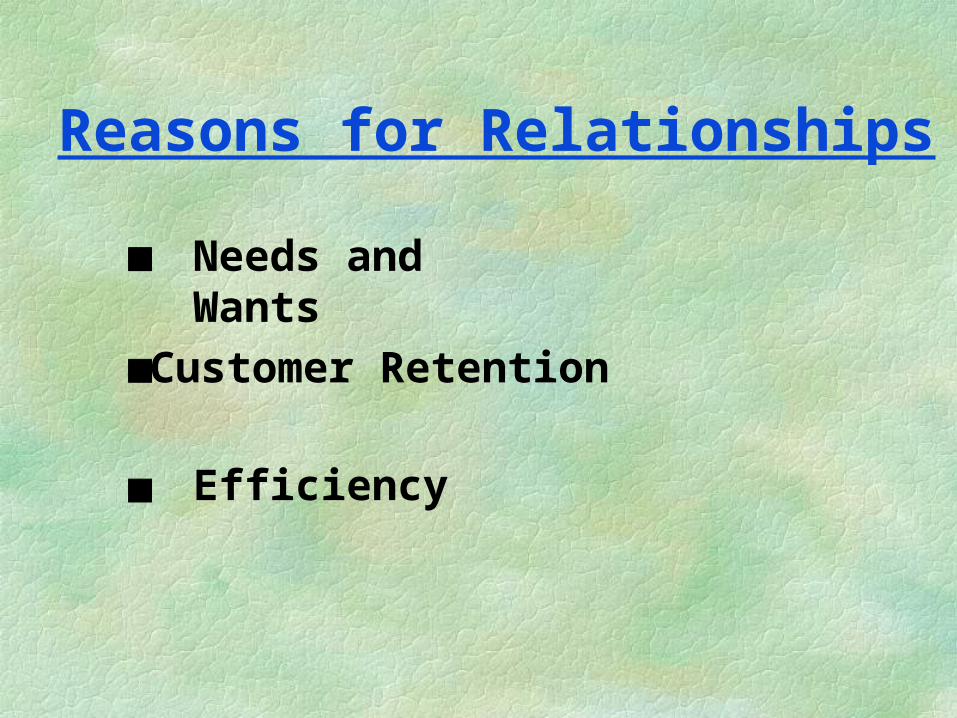
Reasons for Relationships
Efficiency
Needs and Wants
Customer Retention
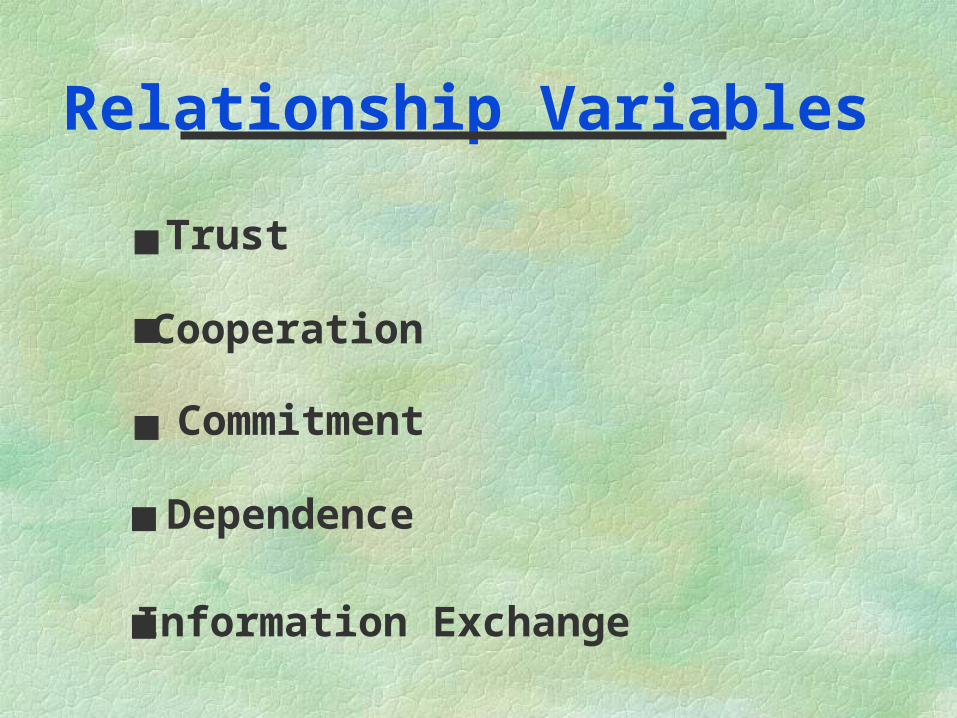
Relationship Variables
Trust
Cooperation
Commitment
Dependence
Information Exchange
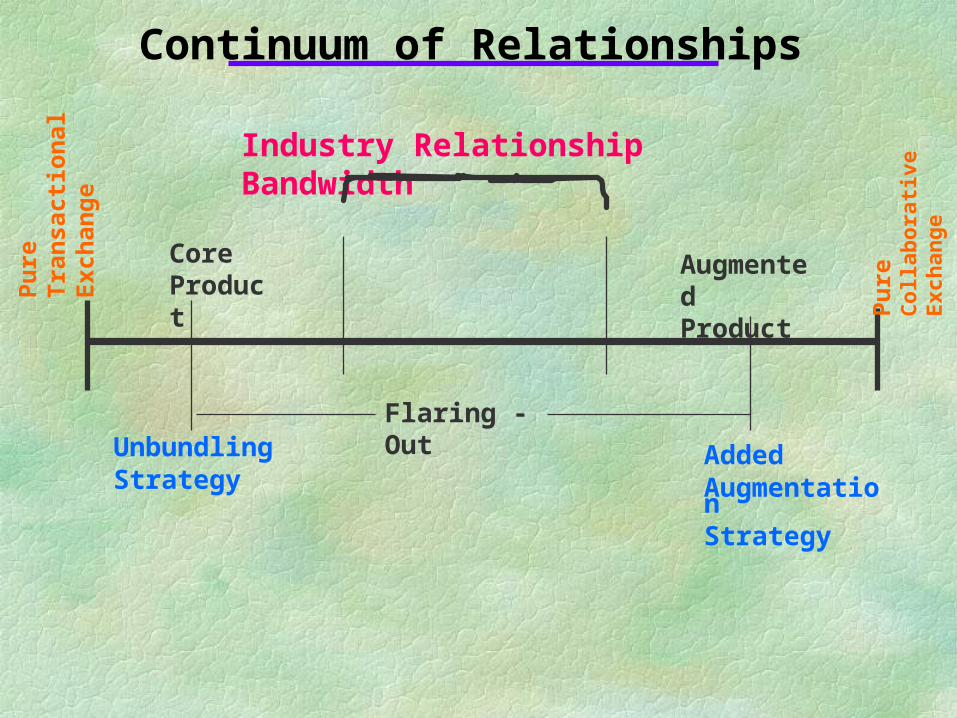
Continuum of Relationships
Industry Relationship Bandwidth
Pu
re
Tra
nsa
ctio
nal
Exc
han
ge
Pu
reC
olla
bor
ativ
e E
xch
ange
Flaring - OutUnbundlingStrategy
Added AugmentationStrategy
Core Product
Augmented Product
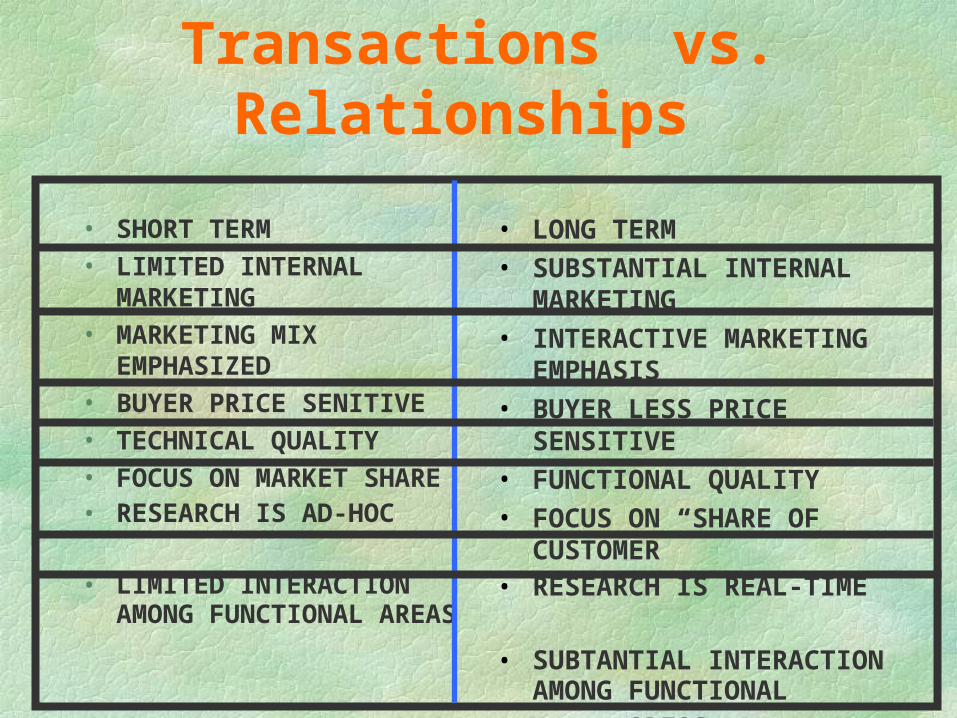
Transactions vs. Relationships
• SHORT TERM• LIMITED INTERNAL
MARKETING• MARKETING MIX
EMPHASIZED• BUYER PRICE SENITIVE• TECHNICAL QUALITY• FOCUS ON MARKET SHARE• RESEARCH IS AD-HOC
• LIMITED INTERACTION AMONG FUNCTIONAL AREAS
• LONG TERM
• SUBSTANTIAL INTERNAL MARKETING
• INTERACTIVE MARKETING EMPHASIS
• BUYER LESS PRICE SENSITIVE
• FUNCTIONAL QUALITY
• FOCUS ON “SHARE OF CUSTOMER”
• RESEARCH IS REAL-TIME
• SUBTANTIAL INTERACTION AMONG FUNCTIONAL
• AREAS
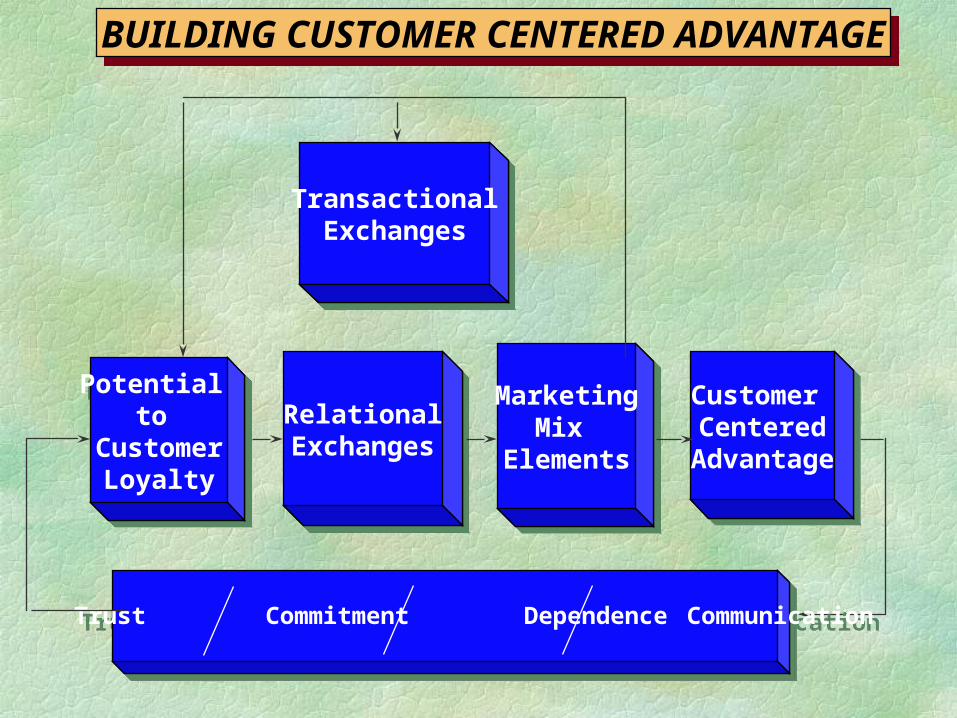
BUILDING CUSTOMER CENTERED ADVANTAGEBUILDING CUSTOMER CENTERED ADVANTAGE
Potential to
CustomerLoyalty
Potential to
CustomerLoyalty
RelationalExchanges
RelationalExchanges
MarketingMix
Elements
MarketingMix
Elements
Customer Centered
Advantage
Customer Centered
Advantage
TransactionalExchanges
TransactionalExchanges
Trust Commitment Dependence Communication Trust Commitment Dependence Communication
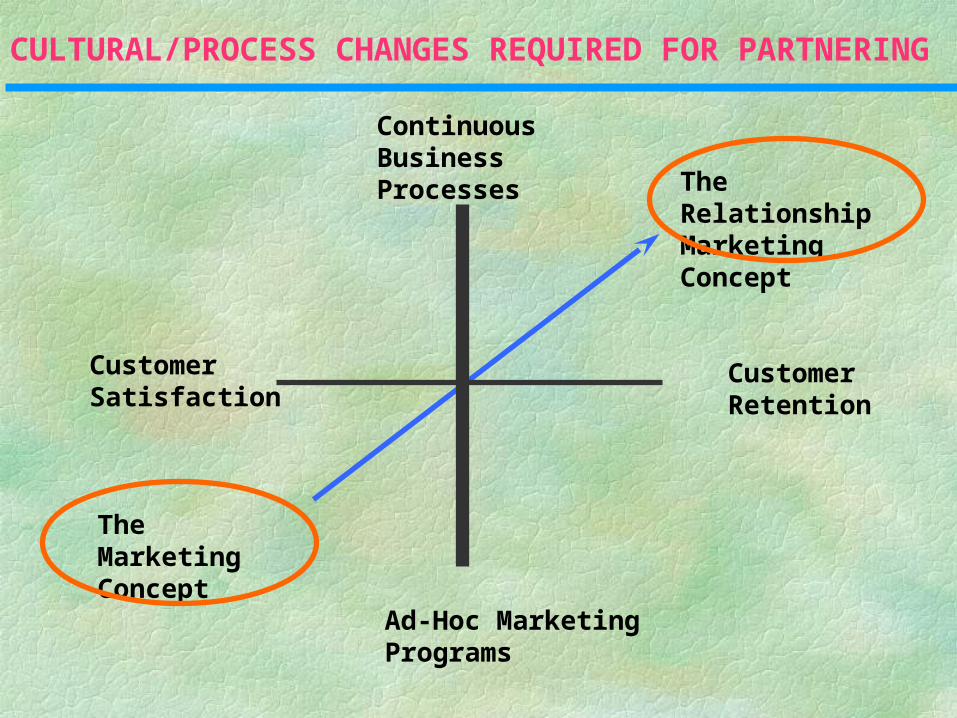
CULTURAL/PROCESS CHANGES REQUIRED FOR PARTNERING
The Relationship Marketing Concept
The Marketing Concept
Continuous Business Processes
Customer Retention
Customer Satisfaction
Ad-Hoc Marketing Programs
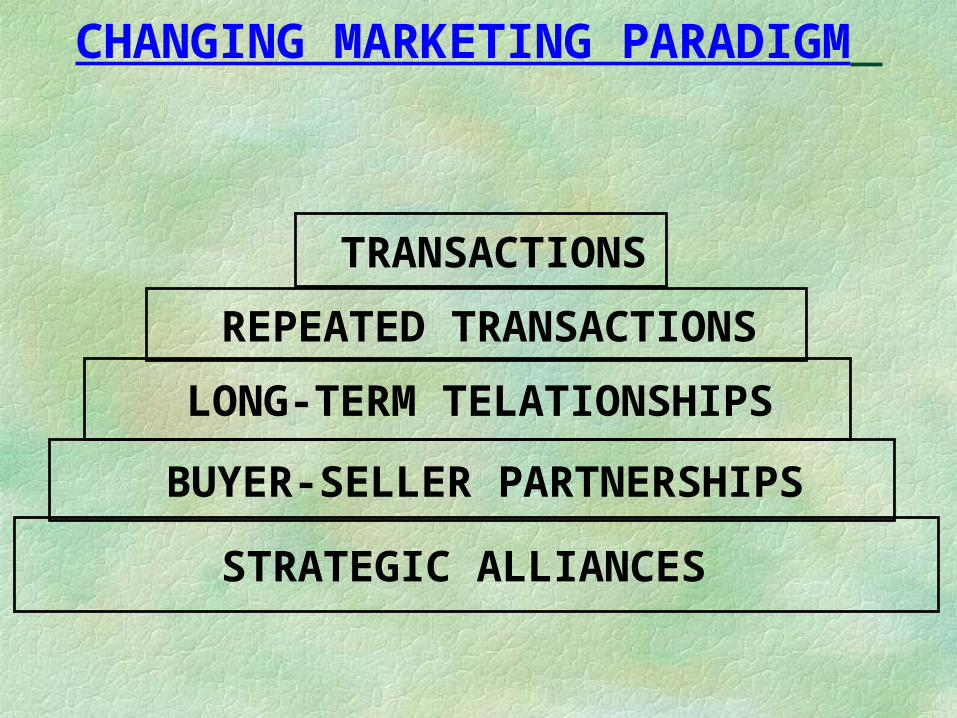
TRANSACTIONS
REPEATED TRANSACTIONS
LONG-TERM TELATIONSHIPS
BUYER-SELLER PARTNERSHIPS
STRATEGIC ALLIANCES
CHANGING MARKETING PARADIGM
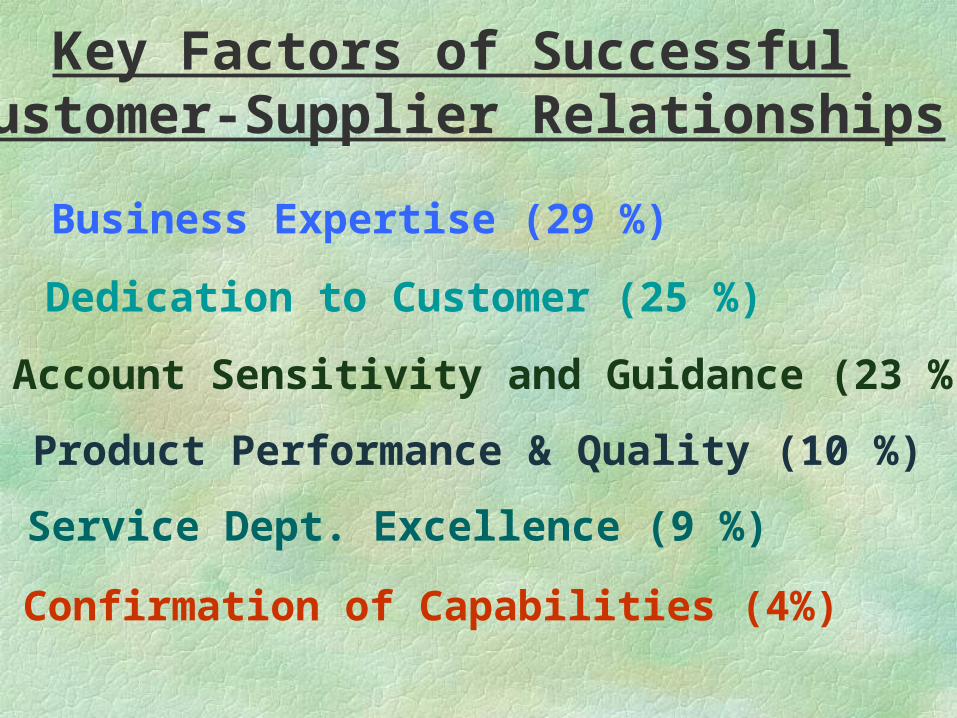
Key Factors of SuccessfulCustomer-Supplier Relationships
1) Business Expertise (29 %)
2) Dedication to Customer (25 %)
3) Account Sensitivity and Guidance (23 %)
4) Product Performance & Quality (10 %)
5) Service Dept. Excellence (9 %)
6) Confirmation of Capabilities (4%)
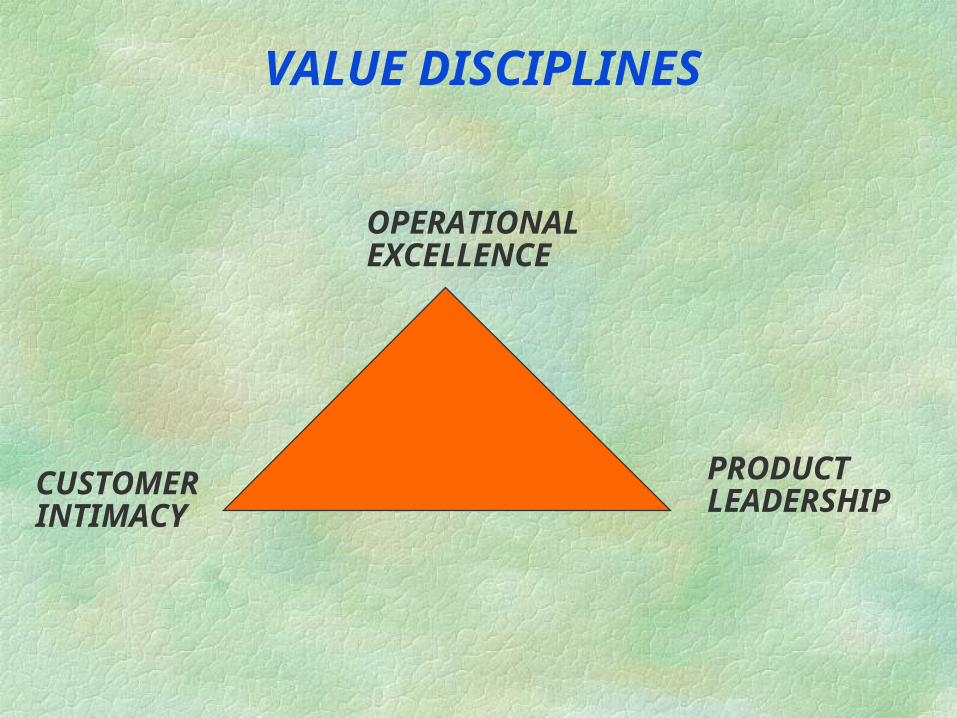
OPERATIONALEXCELLENCE
CUSTOMER INTIMACY
PRODUCTLEADERSHIP
VALUE DISCIPLINES
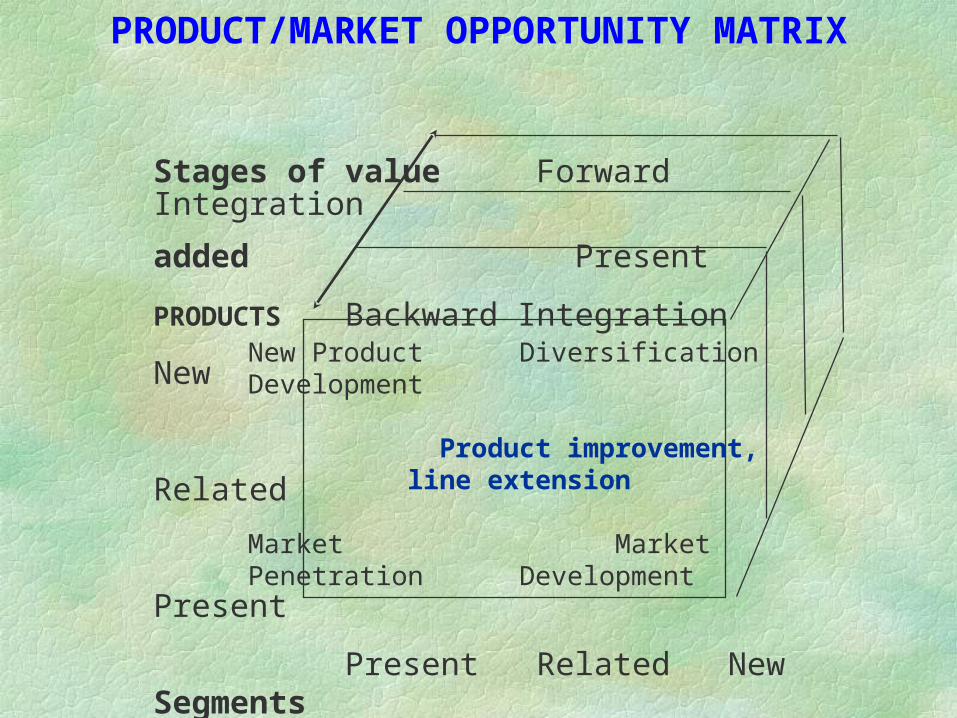
PRODUCT/MARKET OPPORTUNITY MATRIX
Stages of value Forward Integration
added Present
PRODUCTS Backward Integration
New
Related
Present
Present Related New Segments
New Product DiversificationDevelopment
Product improvement, line extension
Market MarketPenetration Development
Market Segmentation,Targeting, and Positioning
Dividing market into distinct customer subsetsWhich buyers to targetDesigning the fit between product offer and needs of
the target mkt.
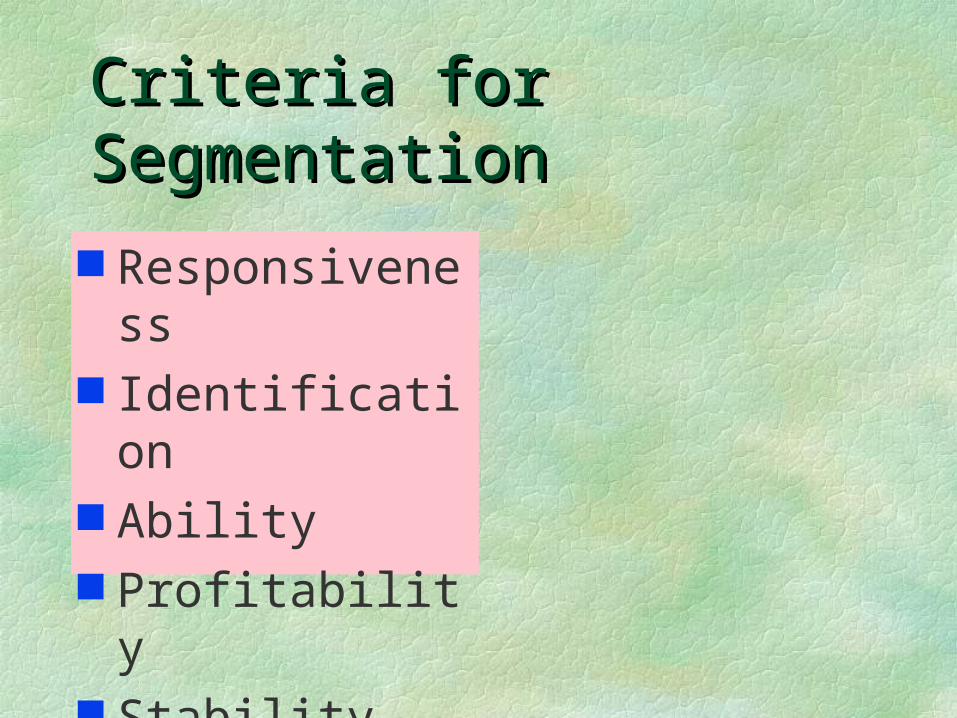
Criteria for SegmentationCriteria for Segmentation
Responsiveness Identification Ability Profitability Stability
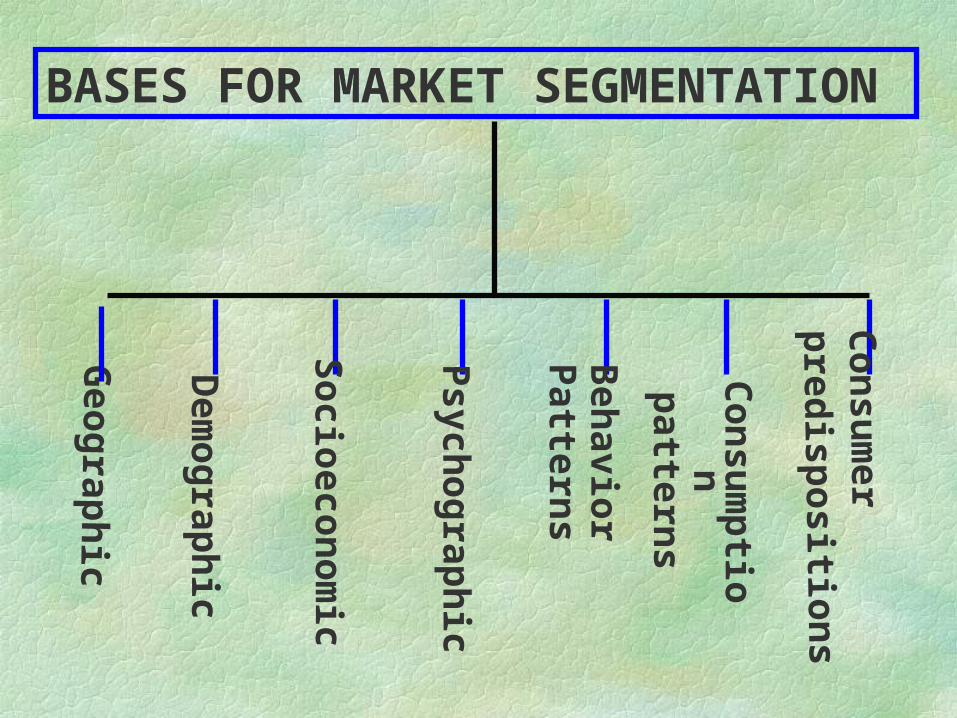
BASES FOR MARKET SEGMENTATION C
onsu
mer
pred
isposition
s
Con
sum
ption
p
atterns
Beh
avior P
atterns
Psych
ograph
ic
Socioecon
omic
Dem
ograph
ic
Geograp
hic
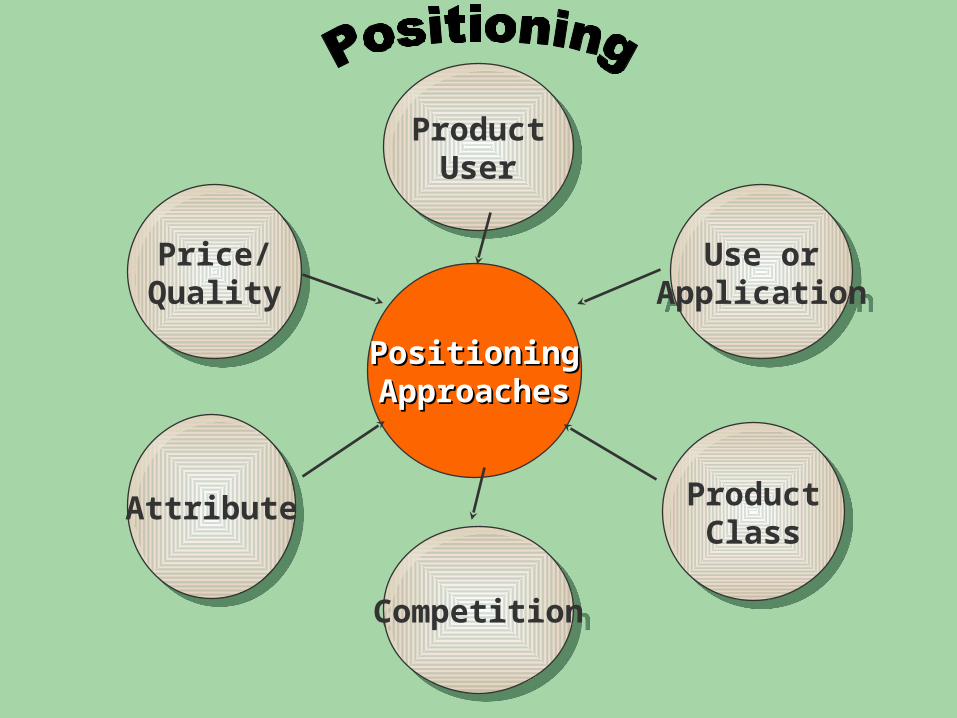
PositioningPositioningApproachesApproaches
Price/Quality
Price/Quality
Use orApplication
Use orApplication
AttributeAttribute ProductClass
ProductClass
CompetitionCompetition
ProductUser
ProductUser
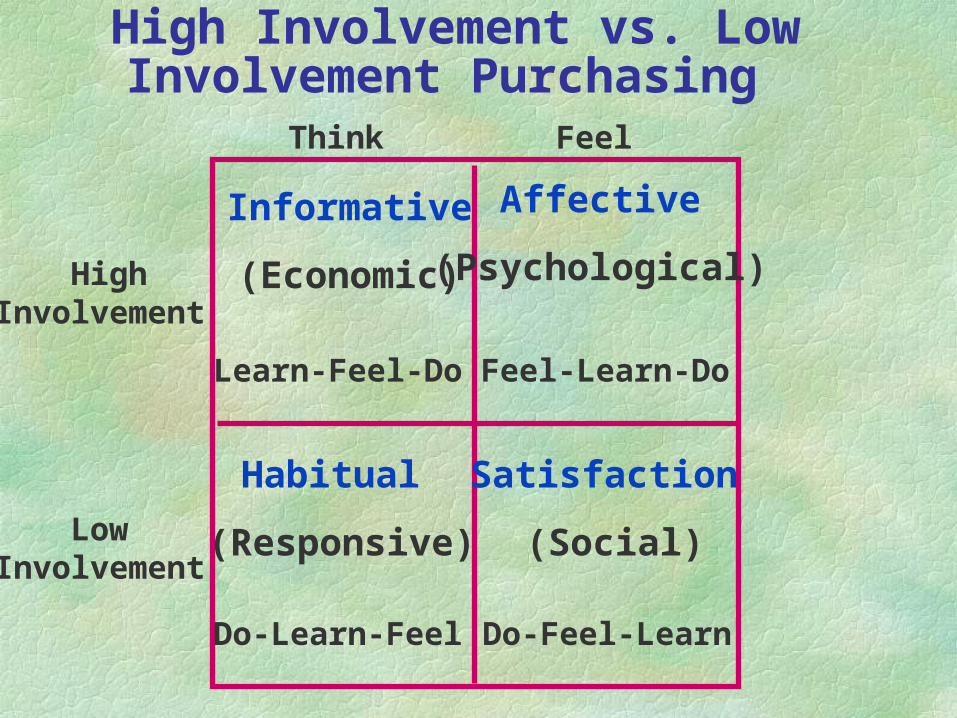
High Involvement vs. Low Involvement Purchasing
Think Feel
HighInvolvement
Low Involvement
Learn-Feel-Do Feel-Learn-Do
Informative
(Economic)
Affective
(Psychological)
Habitual
(Responsive)
Satisfaction
(Social)
Do-Learn-Feel Do-Feel-Learn
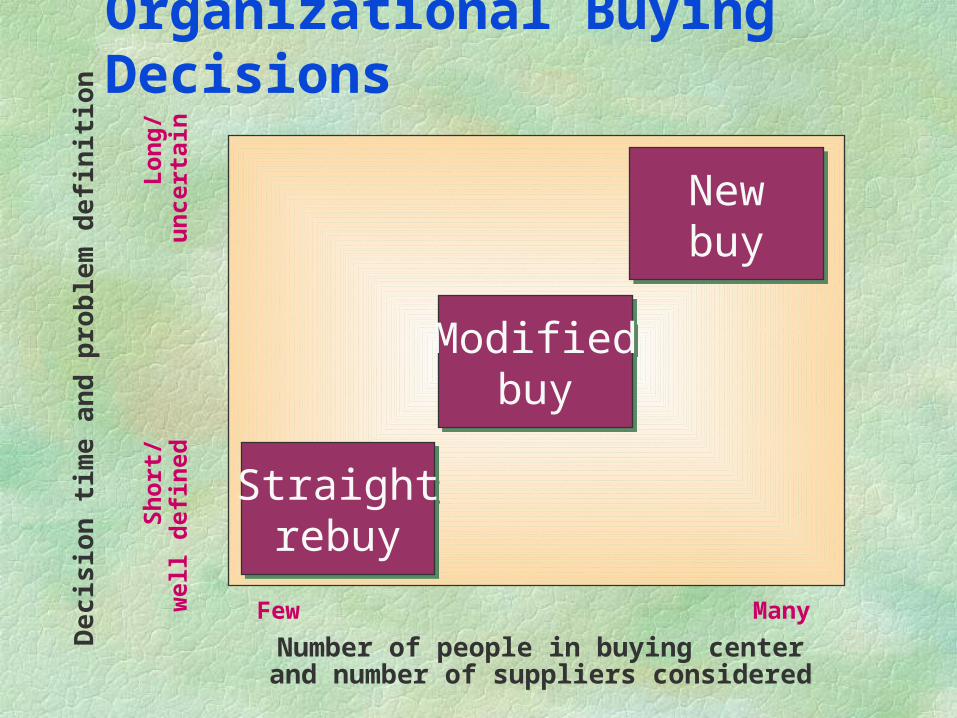
Organizational Buying DecisionsD
ecis
ion
tim
e an
d p
rob
lem
def
init
ion
Shor
t/w
ell d
efin
ed
Few Many
Number of people in buying centerand number of suppliers considered
Straightrebuy
Straightrebuy
Modifiedbuy
Modifiedbuy
Newbuy
Newbuy
Lon
g/un
cert
ain
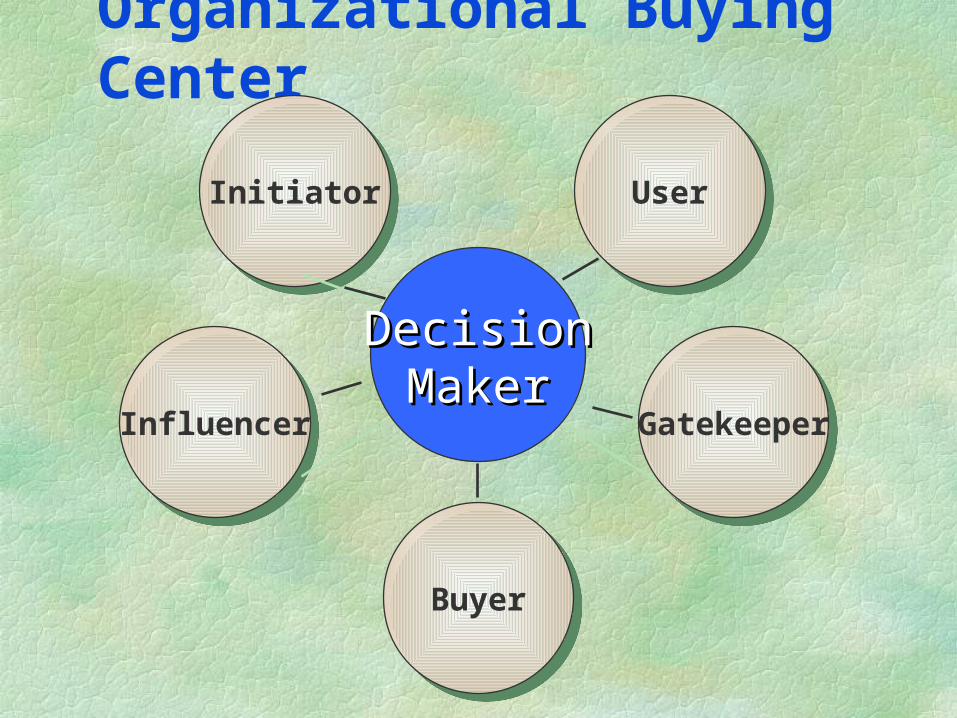
Organizational Buying Center
DecisionDecisionMakerMaker
InitiatorInitiator UserUser
InfluencerInfluencer GatekeeperGatekeeper
BuyerBuyer
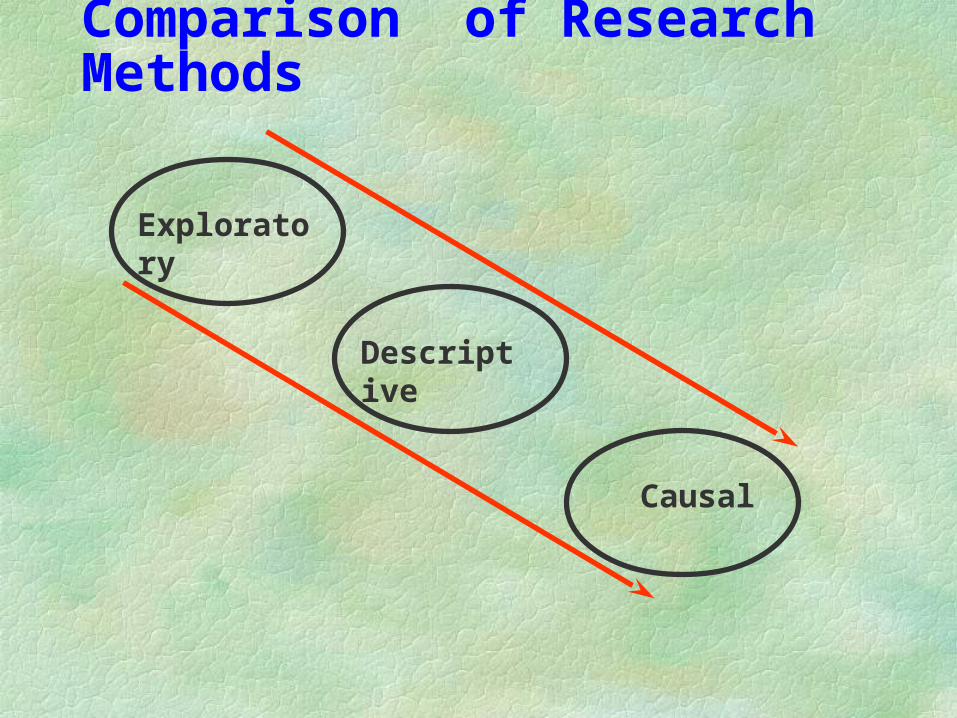
Comparison of Research Methods
Exploratory
Descriptive
Causal
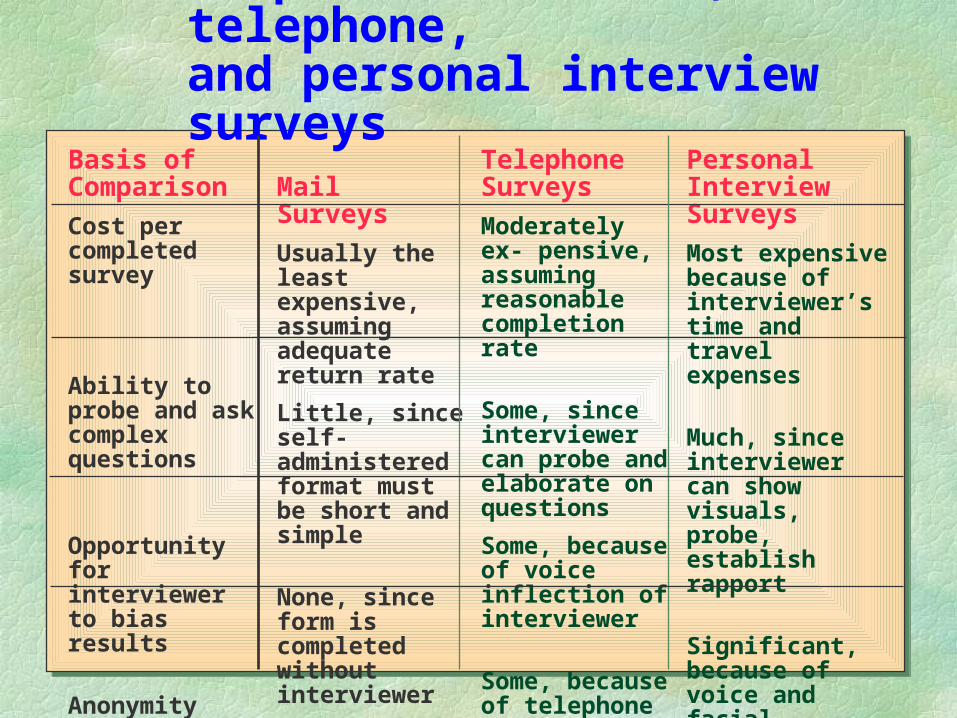
Comparison of mail, telephone,and personal interview surveys
Basis of Comparison
Cost per completed survey
Ability to probe and ask complex questions
Opportunity for interviewer to bias results
Anonymity given respondent
Mail Surveys
Usually the least expensive, assuming adequate return rate
Little, since self-administered format must be short and simple
None, since form is completed without interviewer
Complete, since no signature is needed
Telephone Surveys
Moderately ex- pensive, assuming reasonable completion rate
Some, since interviewer can probe and elaborate on questions
Some, because of voice inflection of interviewer
Some, because of telephone contact
Personal Interview Surveys
Most expensive because of interviewer’s time and travel expenses
Much, since interviewer can show visuals, probe, establish rapport
Significant, because of voice and facial expressions of interviewer
Little, because of face-to-face contact
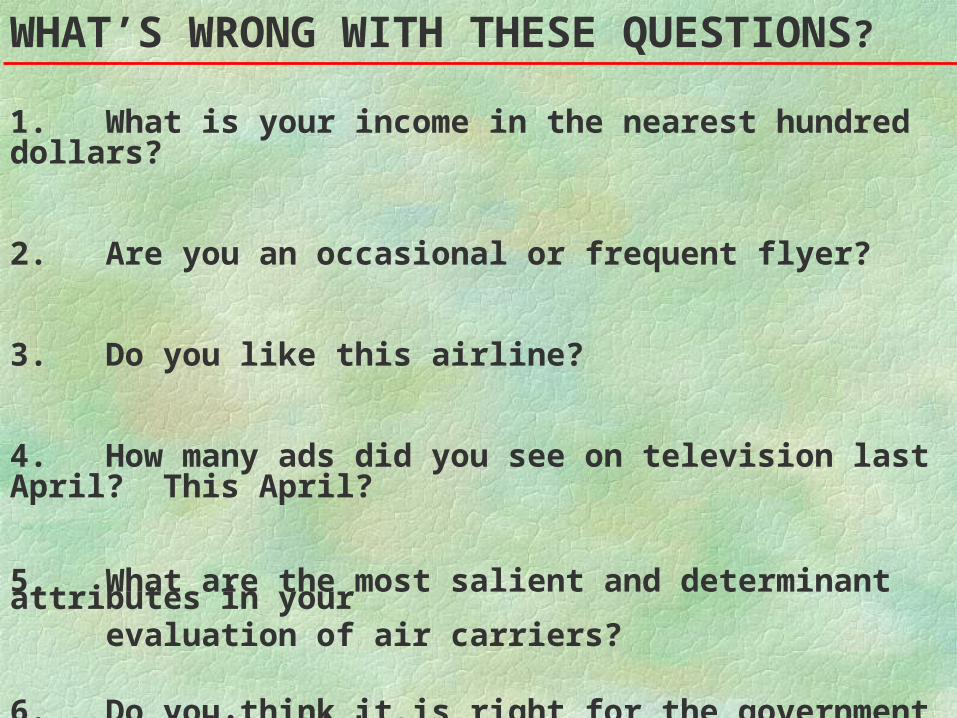
WHAT’S WRONG WITH THESE QUESTIONS?
1. What is your income in the nearest hundred dollars?
2. Are you an occasional or frequent flyer?
3. Do you like this airline?
4. How many ads did you see on television last April? This April?
5. What are the most salient and determinant attributes in your evaluation of air carriers?
6. Do you think it is right for the government to tax airline tickets and deprive a lot of people the chance to fly?
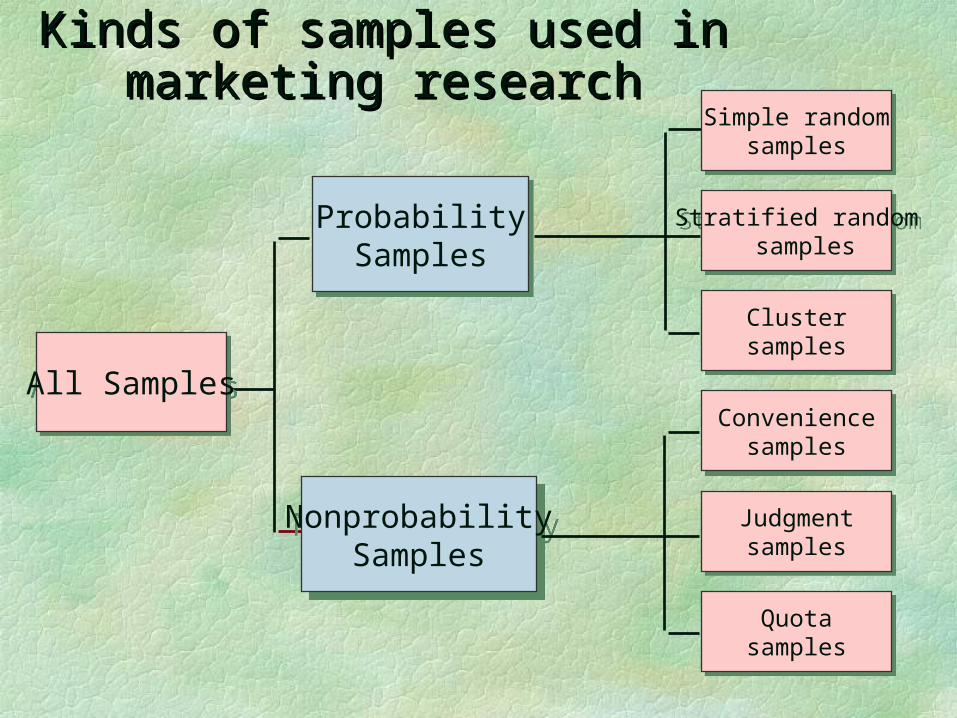
Kinds of samples used inKinds of samples used inmarketing researchmarketing research
Simple randomsamples
Simple randomsamples
ProbabilitySamples
ProbabilitySamples
NonprobabilitySamples
NonprobabilitySamples
Stratified randomsamples
Stratified randomsamples
ClustersamplesClustersamples
Conveniencesamples
Conveniencesamples
Judgmentsamples
Judgmentsamples
QuotasamplesQuota
samples
All SamplesAll Samples
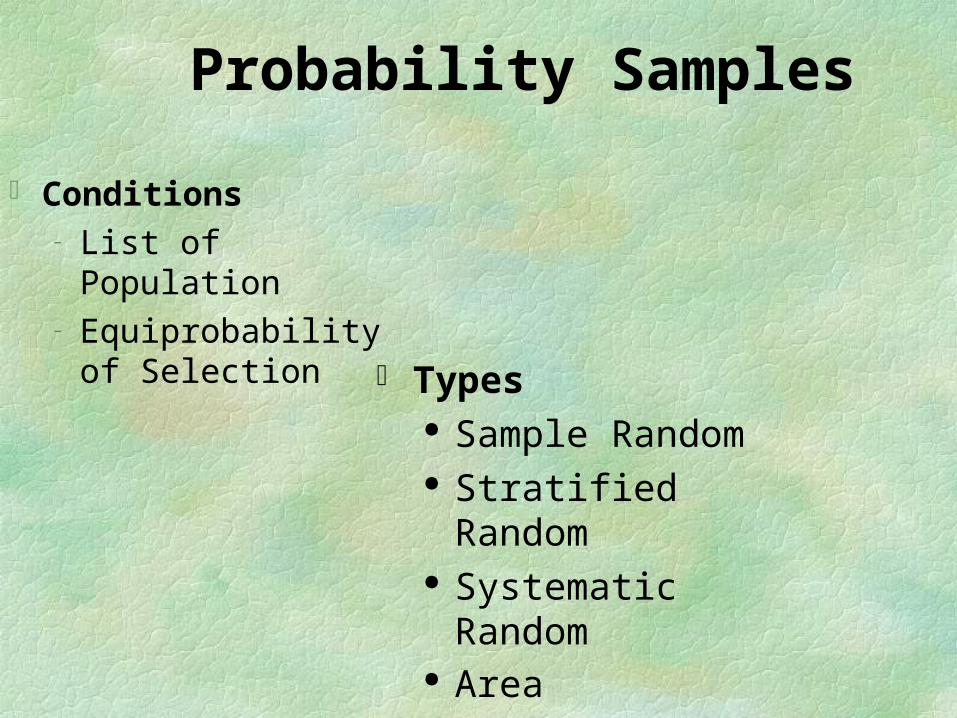
Probability Samples
Conditions– List of Population– Equiprobability of
Selection Types
Sample Random Stratified Random Systematic Random Area
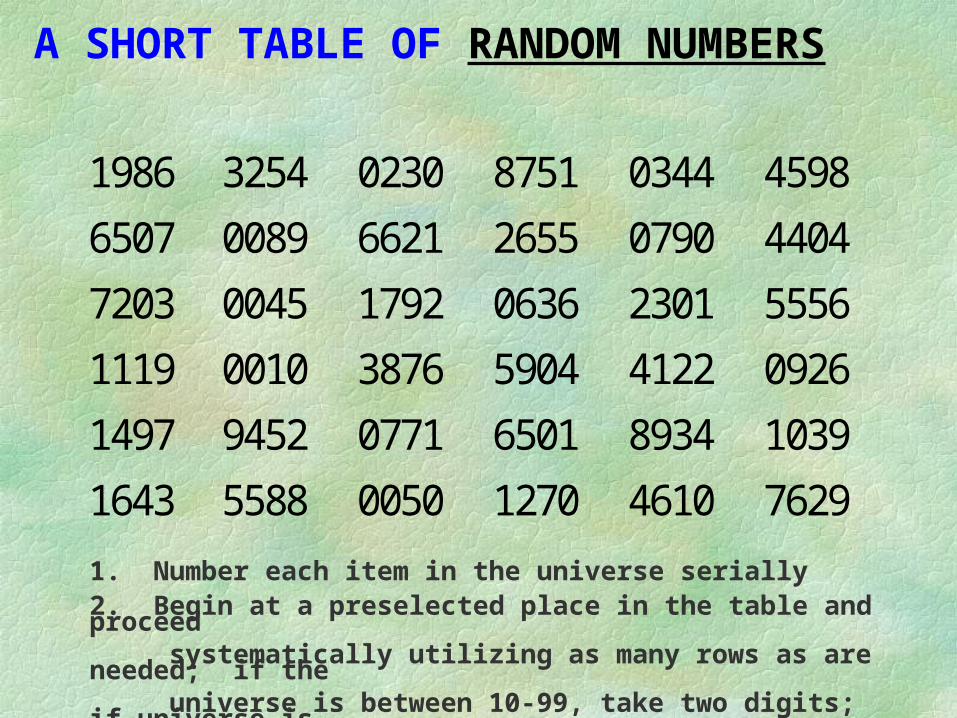
A SHORT TABLE OF RANDOM NUMBERS
1986 3254 0230 8751 0344 4598
6507 0089 6621 2655 0790 4404
7203 0045 1792 0636 2301 5556
1119 0010 3876 5904 4122 0926
1497 9452 0771 6501 8934 1039
1643 5588 0050 1270 4610 7629
1. Number each item in the universe serially2. Begin at a preselected place in the table and proceed systematically utilizing as many rows as are needed; if the universe is between 10-99, take two digits; if universe is between 100-999, take three digits at a time
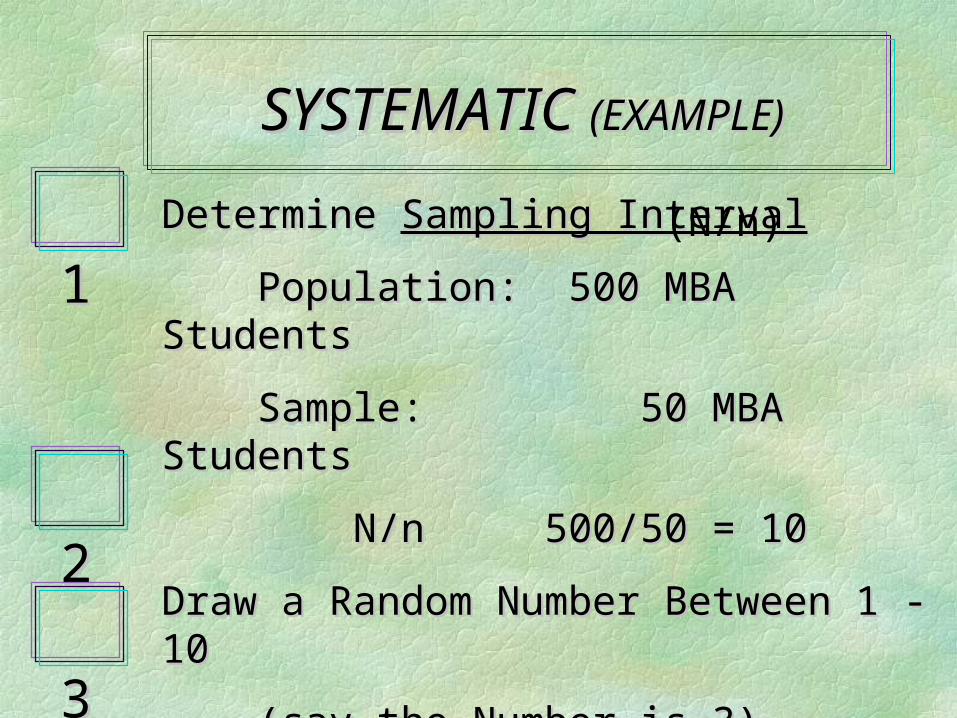
SYSTEMATIC SYSTEMATIC (EXAMPLE)(EXAMPLE)
Determine Determine Sampling IntervalSampling Interval
Population: 500 MBA StudentsPopulation: 500 MBA Students
Sample: 50 MBA StudentsSample: 50 MBA Students
N/n 500/50 = 10N/n 500/50 = 10
Draw a Random Number Between 1 - 10Draw a Random Number Between 1 - 10
(say the Number is 3)(say the Number is 3)
Include students numbered: 3, 13, 23 . . . .Include students numbered: 3, 13, 23 . . . .
11
22
33
(N/n)
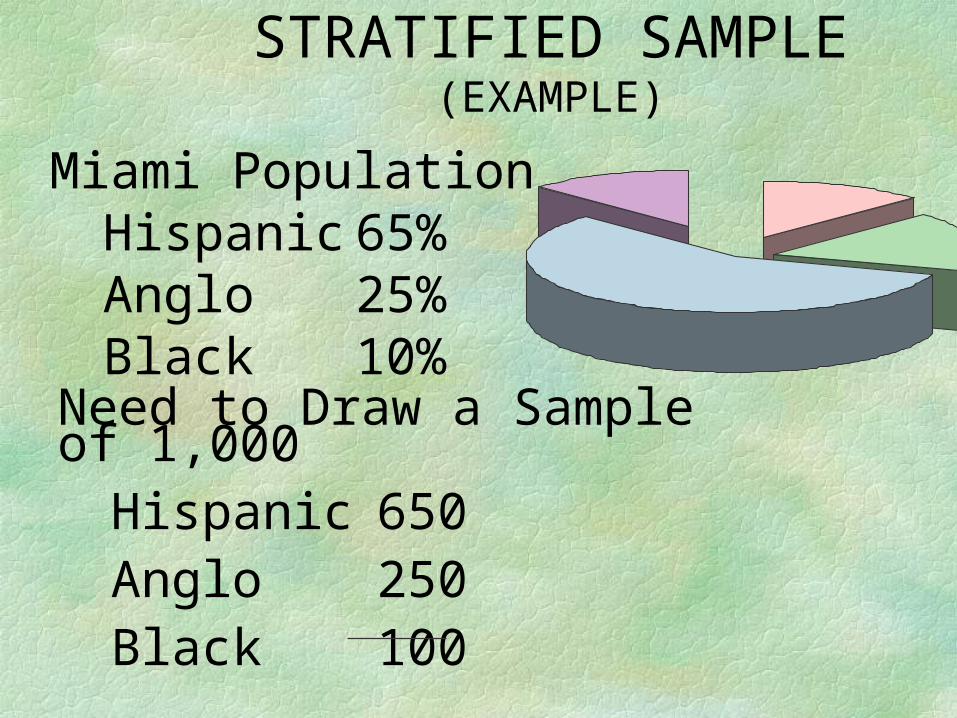
STRATIFIED SAMPLE (EXAMPLE)
Miami PopulationHispanic 65%Anglo 25%Black 10%
Need to Draw a Sample of 1,000Hispanic 650Anglo 250Black 100 1,000
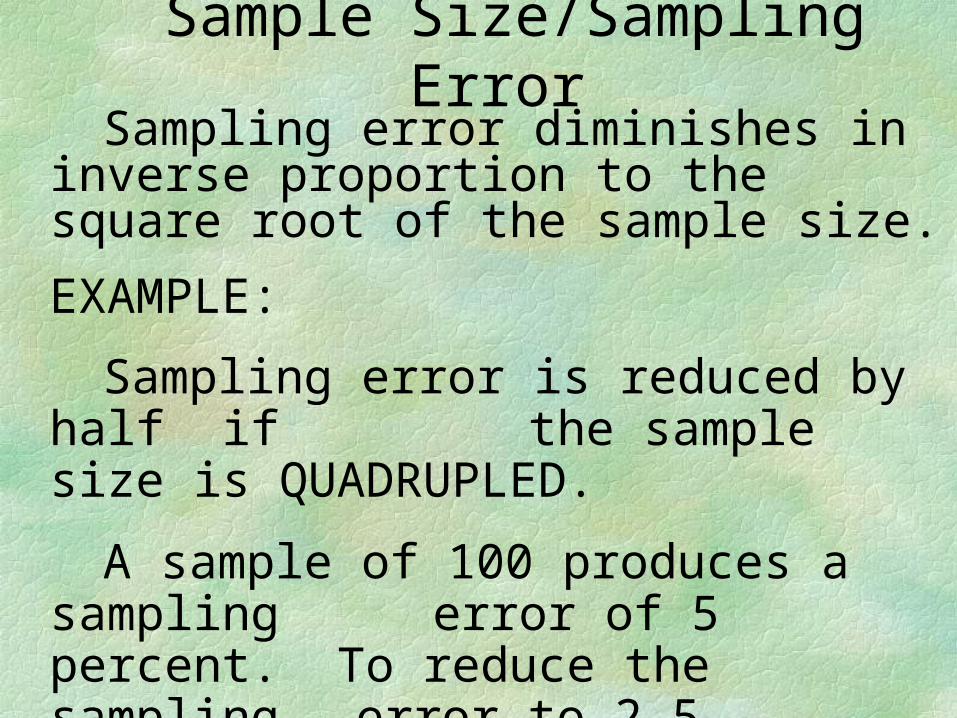
Sample Size/Sampling Error Sampling error diminishes in inverse
proportion to the square root of the sample size.
EXAMPLE:
Sampling error is reduced by half if the sample size is QUADRUPLED.
A sample of 100 produces a sampling error of 5 percent. To reduce the sampling error to 2.5 percent, we must increase the sample size to 400.
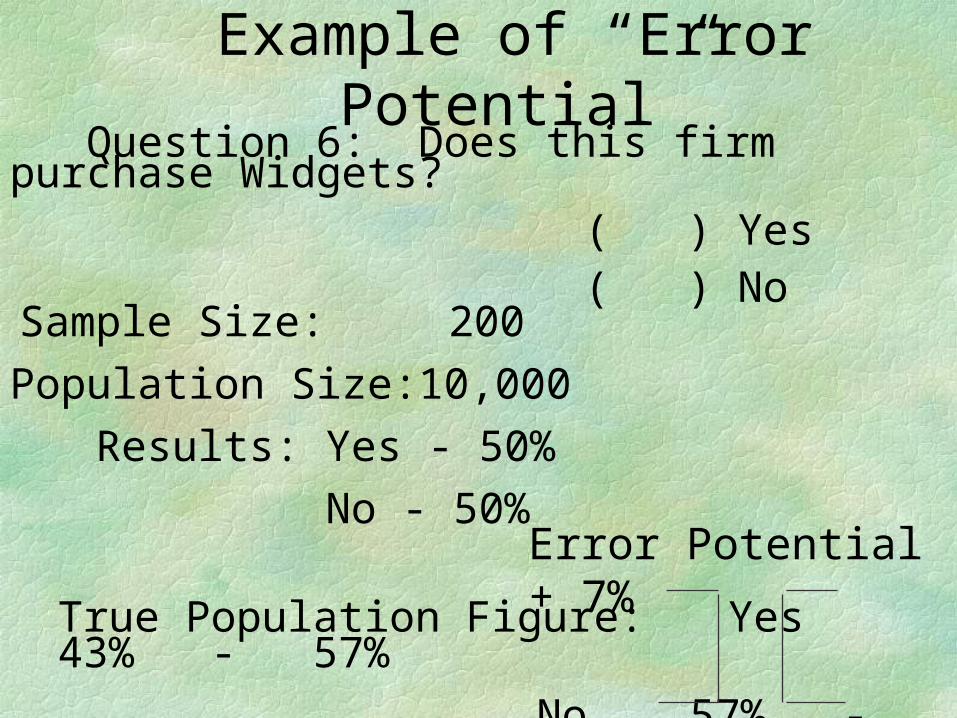
Example of “Error Potential” Question 6: Does this firm purchase Widgets?
( ) Yes( ) No
Sample Size: 200
Population Size: 10,000
Results: Yes - 50%
No - 50%Error Potential + 7%
True Population Figure: Yes 43% - 57%
No 57% - 43%
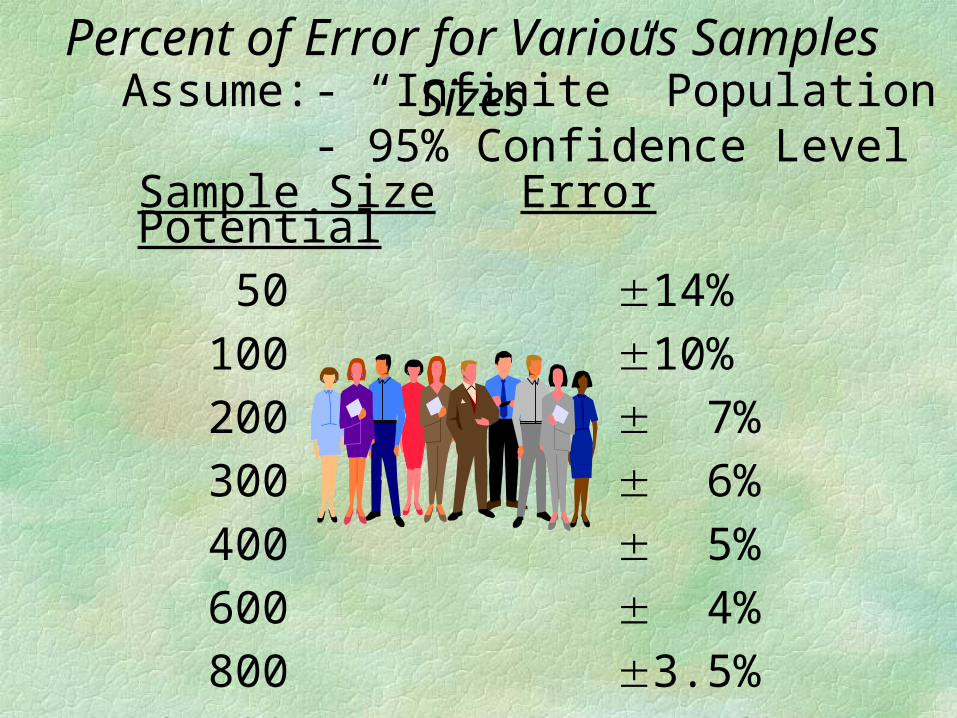
Sample Size Error Potential
50 14%
100 10%
200 7%
300 6%
400 5%
600 4%
800 3.5%
2,500 2%
Percent of Error for Various Samples Sizes Assume: - “Infinite” Population
- 95% Confidence Level
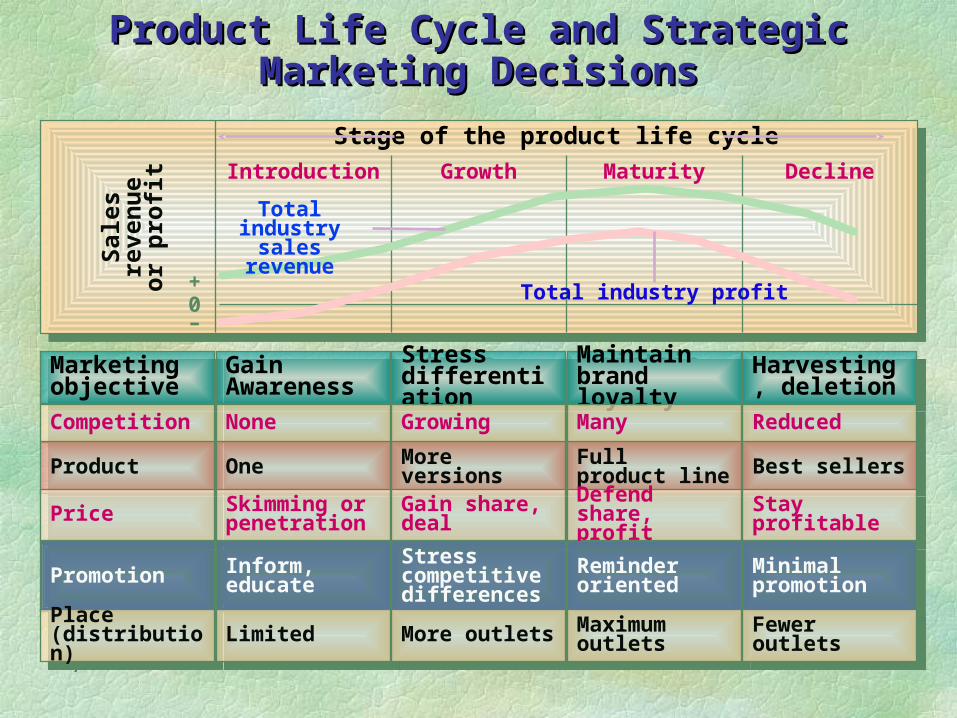
Product Life Cycle and Strategic Marketing DecisionsProduct Life Cycle and Strategic Marketing Decisions
Marketing objective
Marketing objective
Gain Awareness
Gain Awareness
Stress differentiation
Stress differentiation
Maintain brand loyalty
Maintain brand loyalty
Harvesting, deletion
Harvesting, deletion
CompetitionCompetition NoneNone GrowingGrowing ManyMany ReducedReduced
ProductProduct OneOne More versionsMore versions Full product line
Full product line Best sellersBest sellers
PricePrice Skimming or penetration
Skimming or penetration Gain share, dealGain share, deal Defend share,
profitDefend share, profit Stay profitableStay profitable
PromotionPromotion Inform, educateInform, educate Stress competitive differences
Stress competitive differences
Reminder oriented
Reminder oriented Minimal
promotionMinimal promotion
Place(distribution)
Place(distribution) LimitedLimited More outletsMore outlets Maximum
outletsMaximum outlets Fewer outletsFewer outlets
Stage of the product life cycleSa
les
reve
nue
or p
rofi
t Introduction Growth Maturity Decline
+0–
Total industrysales revenue
Total industry profit
Growing Your Existing Business
KEEP IN TOUCHKEEP IN TOUCH REORGANIZE YOUR SALESFORCE REORGANIZE YOUR SALESFORCE
(“Farmers” & “Hunters”) (“Farmers” & “Hunters”) ADD VALUE FOR CUSTOMERSADD VALUE FOR CUSTOMERS CONDUCT SEMINARSCONDUCT SEMINARS THINK AND ACT LIKE A PARTNERTHINK AND ACT LIKE A PARTNER
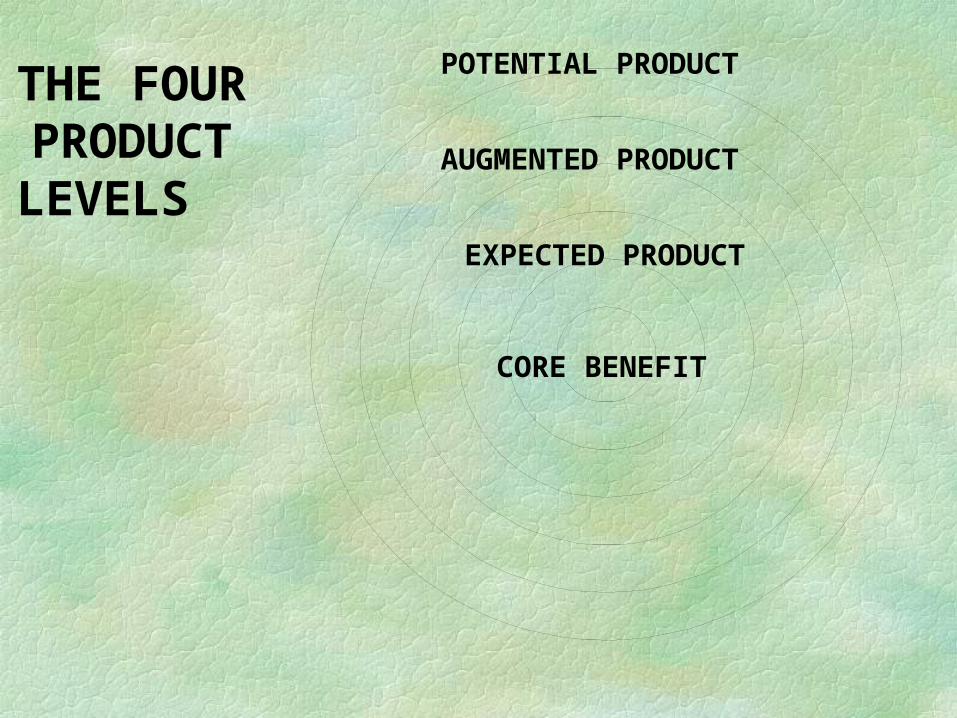
THE FOUR
PRODUCT LEVELS
CORE BENEFIT
EXPECTED PRODUCT
AUGMENTED PRODUCT
POTENTIAL PRODUCT
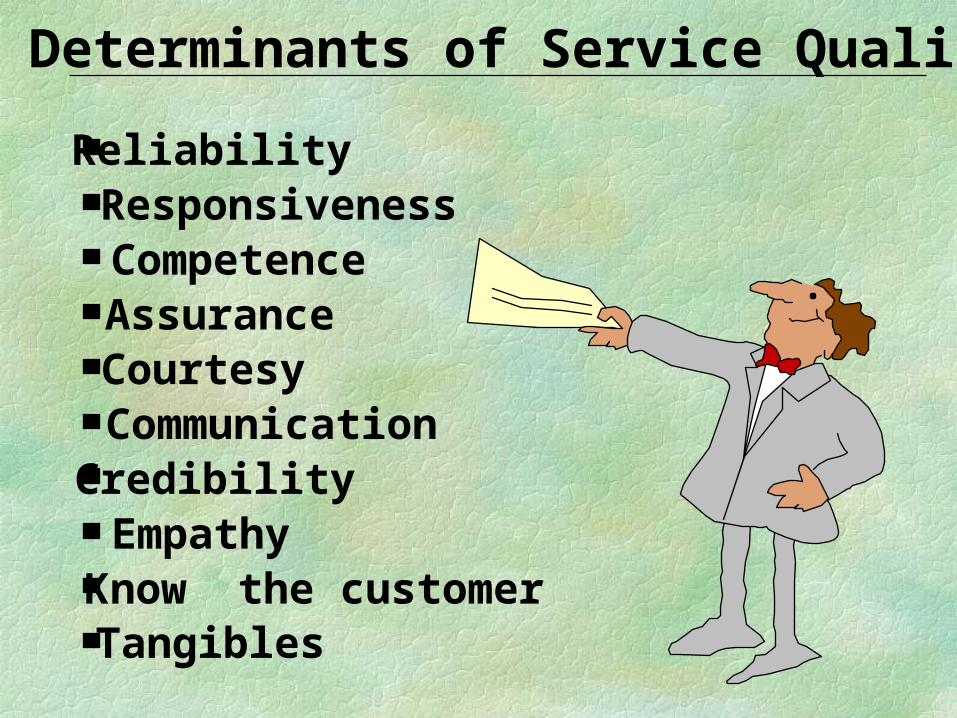
Determinants of Service Quality
ReliabilityResponsivenessCompetenceAssuranceCourtesyCommunicationCredibilityEmpathyKnow the customerTangibles
PREFERENCE BUILDING MODES
NEED ASSOCIATION
MOOD ASSOCIATION
SUBCONSCIOUS MOTIVATION
BEHAVIOR MODIFICATION
COGNITIVE PROCESSING
MODEL EMULATION
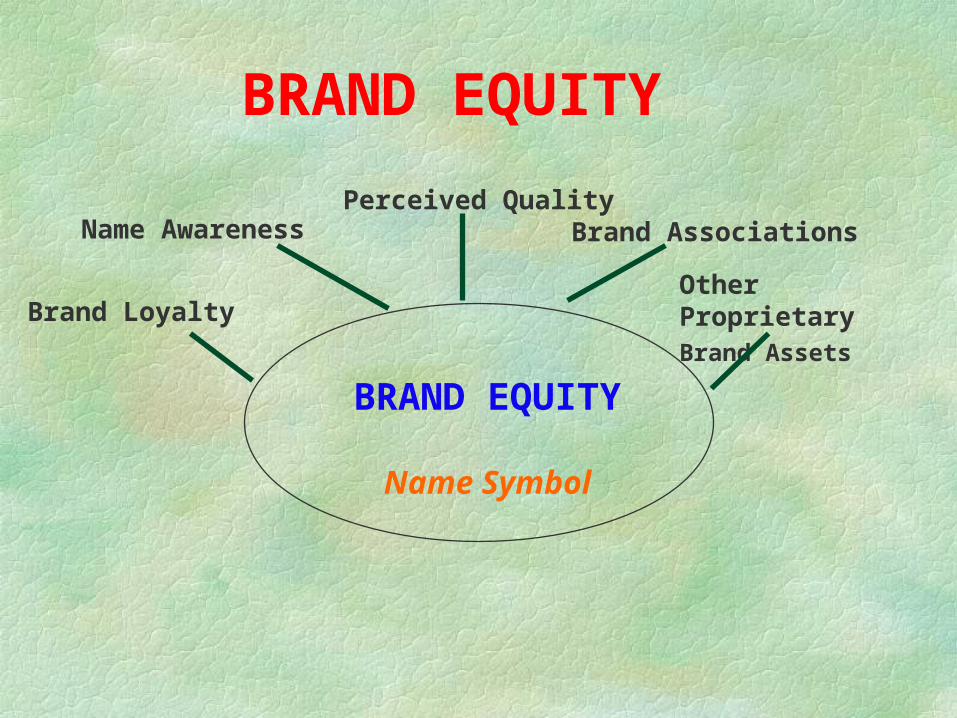
BRAND EQUITY
Name Awareness Brand Associations
Brand Loyalty
Perceived Quality
Other ProprietaryBrand Assets
BRAND EQUITY
Name Symbol
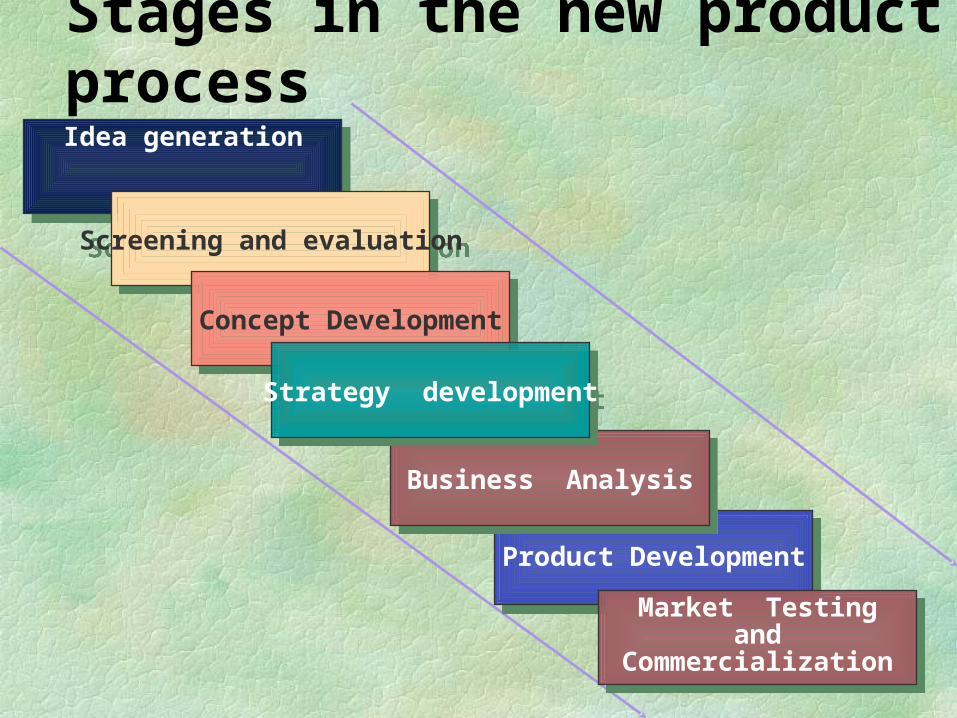
Stages in the new product process
Idea generationIdea generation
Screening and evaluationScreening and evaluation
Concept DevelopmentConcept Development
Product DevelopmentProduct Development
Business AnalysisBusiness Analysis
Market Testingand
Commercialization
Market Testingand
Commercialization
Strategy developmentStrategy development
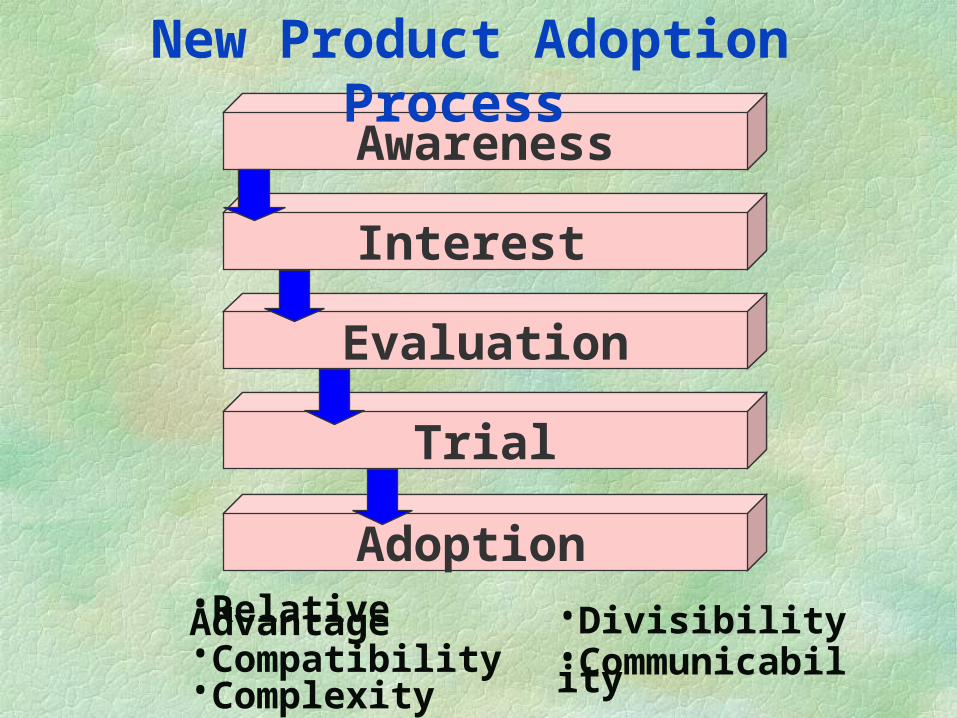
Interest
Awareness
Evaluation
Trial
Adoption
New Product Adoption Process
•Relative Advantage•Compatibility•Complexity
•Divisibility•Communicability
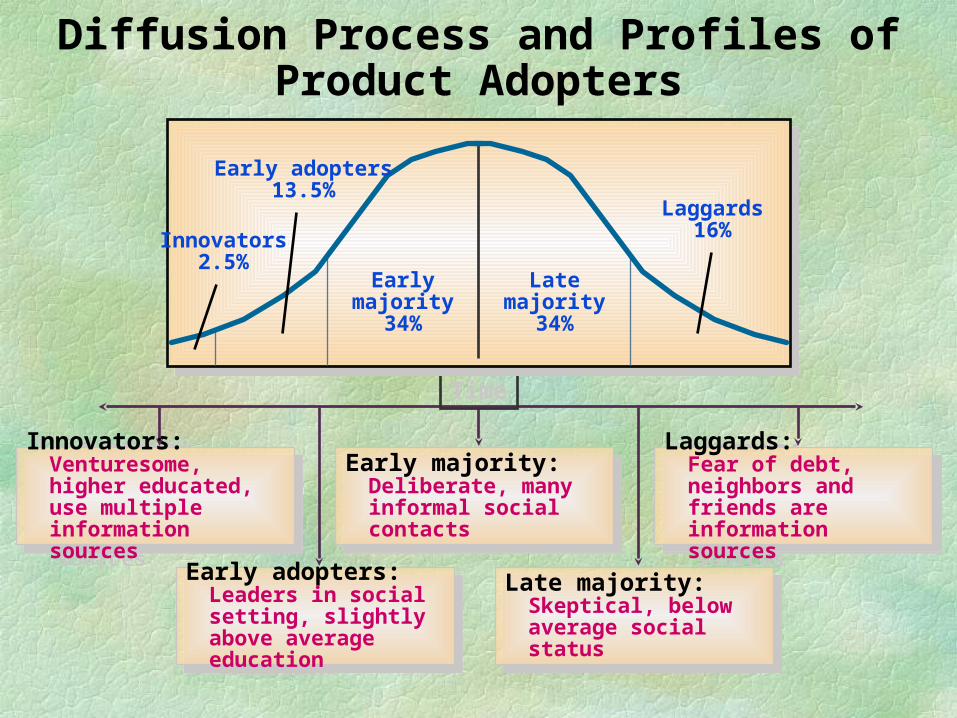
Diffusion Process and Profiles of Product Adopters
Laggards:Fear of debt, neighbors and friends are information sources
Laggards:Fear of debt, neighbors and friends are information sources
Early adopters:Leaders in social setting, slightly above average education
Early adopters:Leaders in social setting, slightly above average education
Late majority:Skeptical, below average social status
Late majority:Skeptical, below average social status
Innovators:Venturesome, higher educated, use multiple information sources
Innovators:Venturesome, higher educated, use multiple information sources
Early majority:Deliberate, many informal social contacts
Early majority:Deliberate, many informal social contacts
Time
Innovators2.5%
Early adopters13.5%
Early majority34%
Late majority34%
Laggards16%
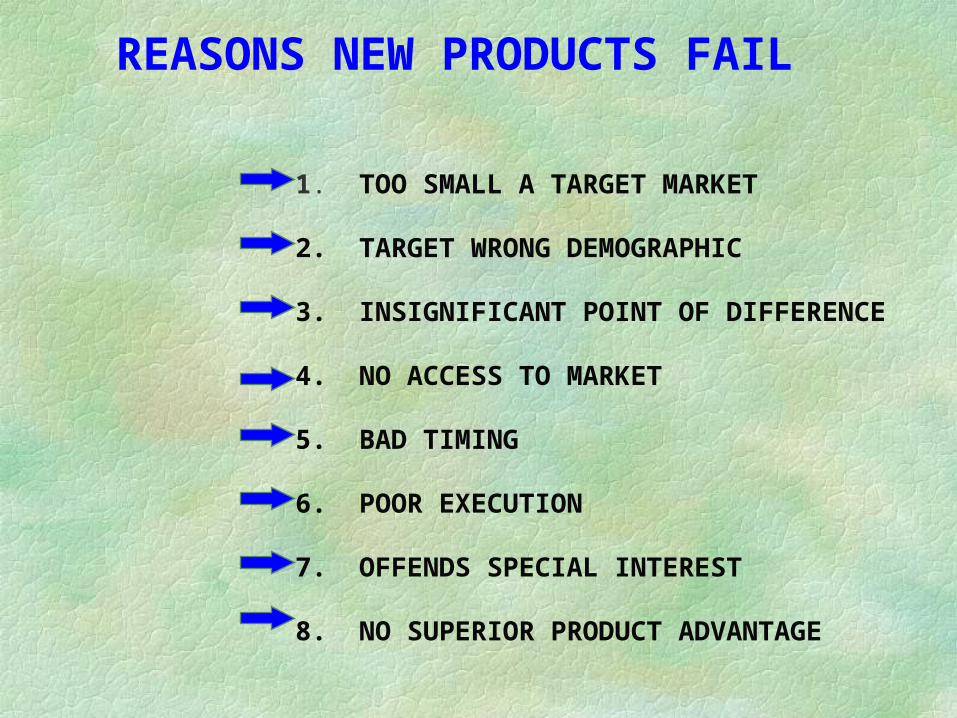
REASONS NEW PRODUCTS FAIL
1. TOO SMALL A TARGET MARKET
2. TARGET WRONG DEMOGRAPHIC
3. INSIGNIFICANT POINT OF DIFFERENCE
4. NO ACCESS TO MARKET
5. BAD TIMING
6. POOR EXECUTION
7. OFFENDS SPECIAL INTEREST
8. NO SUPERIOR PRODUCT ADVANTAGE
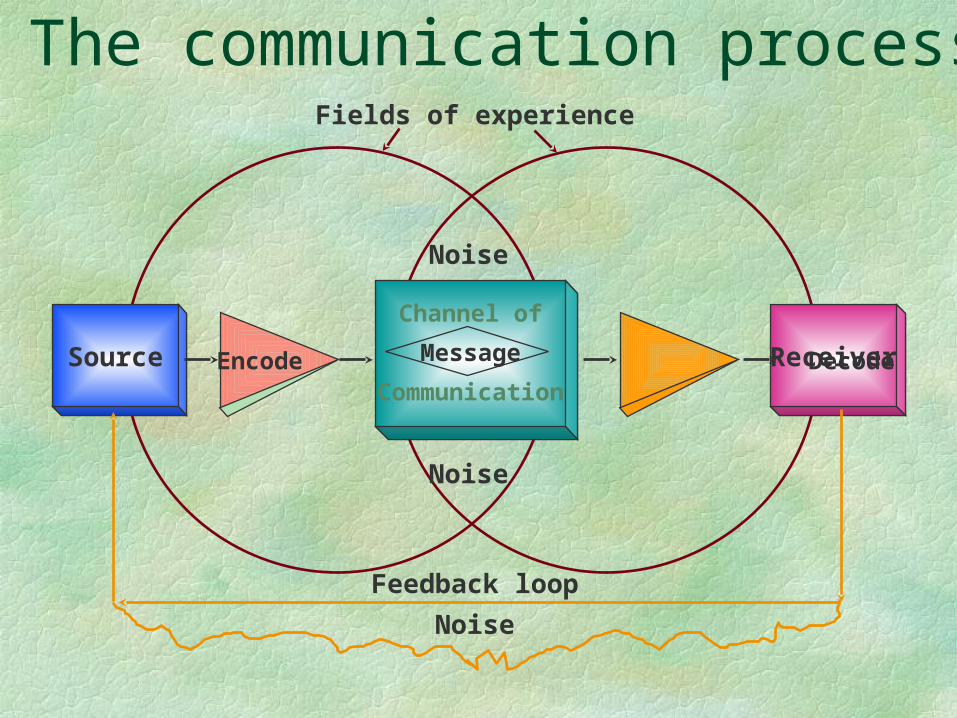
The communication process
Source
Channel of
Message
CommunicationEncode Receiver Decode
Noise
Noise
Feedback loop
Noise
Fields of experience
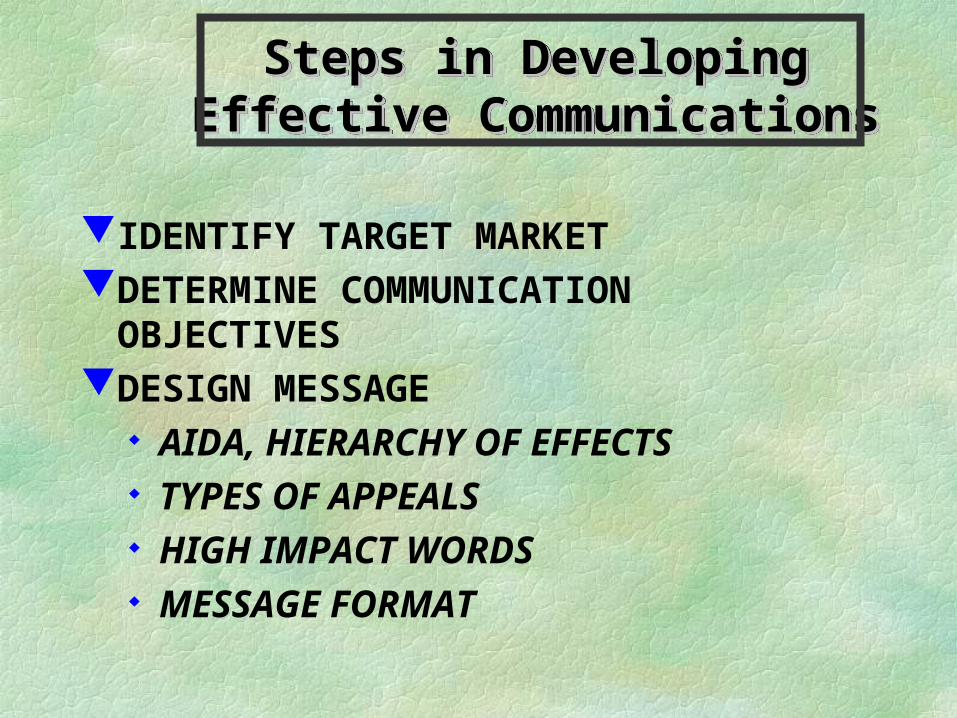
Steps in Developing Effective Steps in Developing Effective CommunicationsCommunications
Steps in Developing Effective Steps in Developing Effective CommunicationsCommunications
IDENTIFY TARGET MARKETDETERMINE COMMUNICATION
OBJECTIVESDESIGN MESSAGE
AIDA, HIERARCHY OF EFFECTS TYPES OF APPEALS HIGH IMPACT WORDS MESSAGE FORMAT
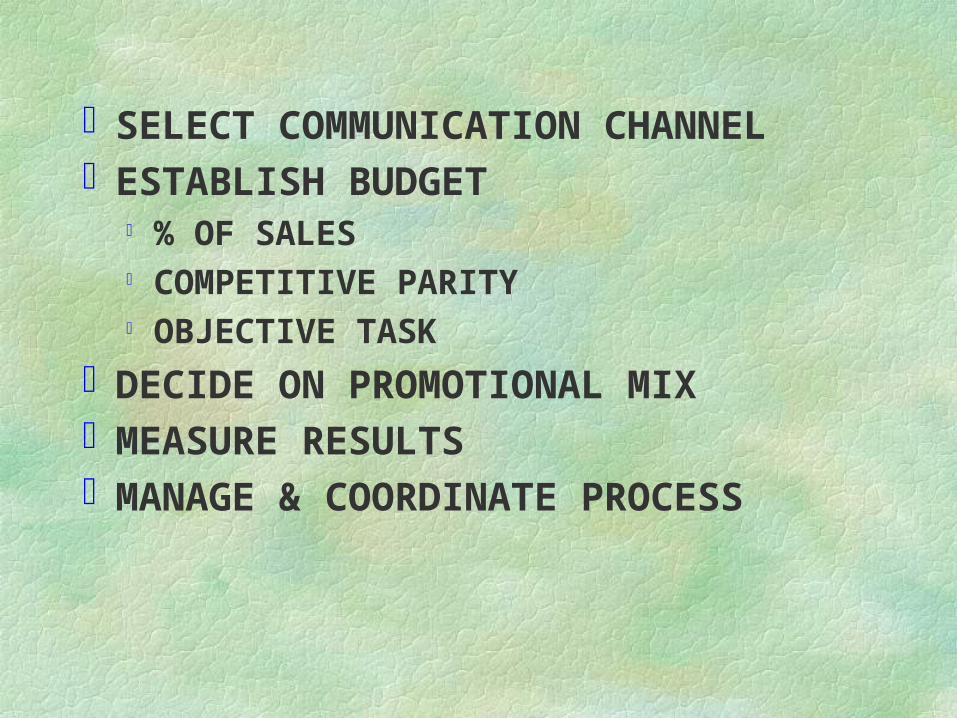
SELECT COMMUNICATION CHANNELESTABLISH BUDGET
% OF SALES COMPETITIVE PARITY OBJECTIVE TASK
DECIDE ON PROMOTIONAL MIXMEASURE RESULTSMANAGE & COORDINATE PROCESS
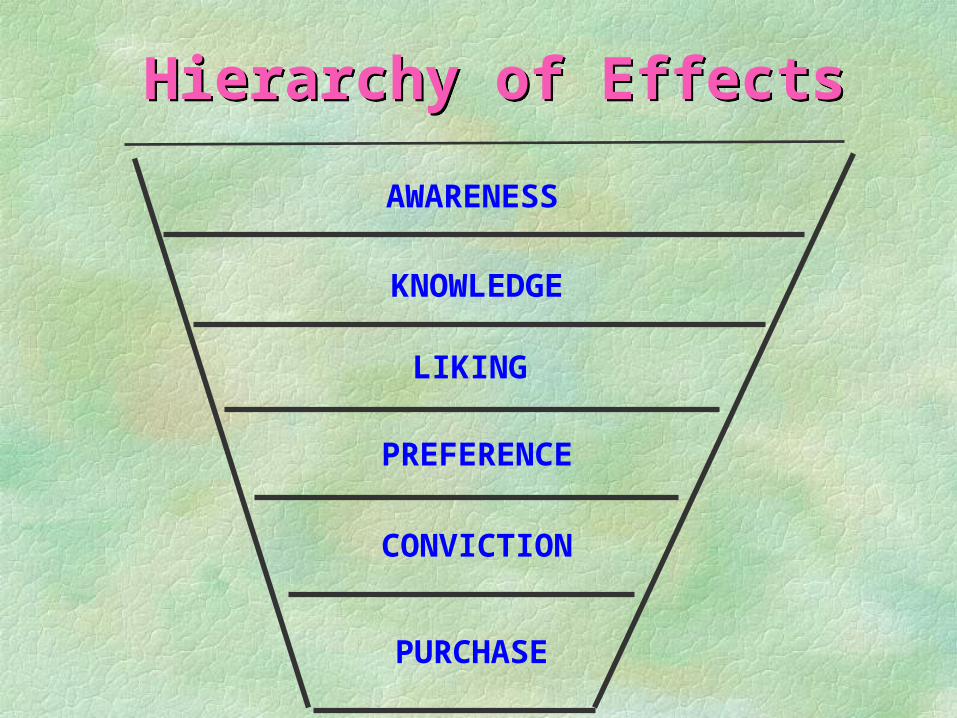
Hierarchy of EffectsHierarchy of Effects
AWARENESS
KNOWLEDGE
LIKING
PREFERENCE
CONVICTION
PURCHASE
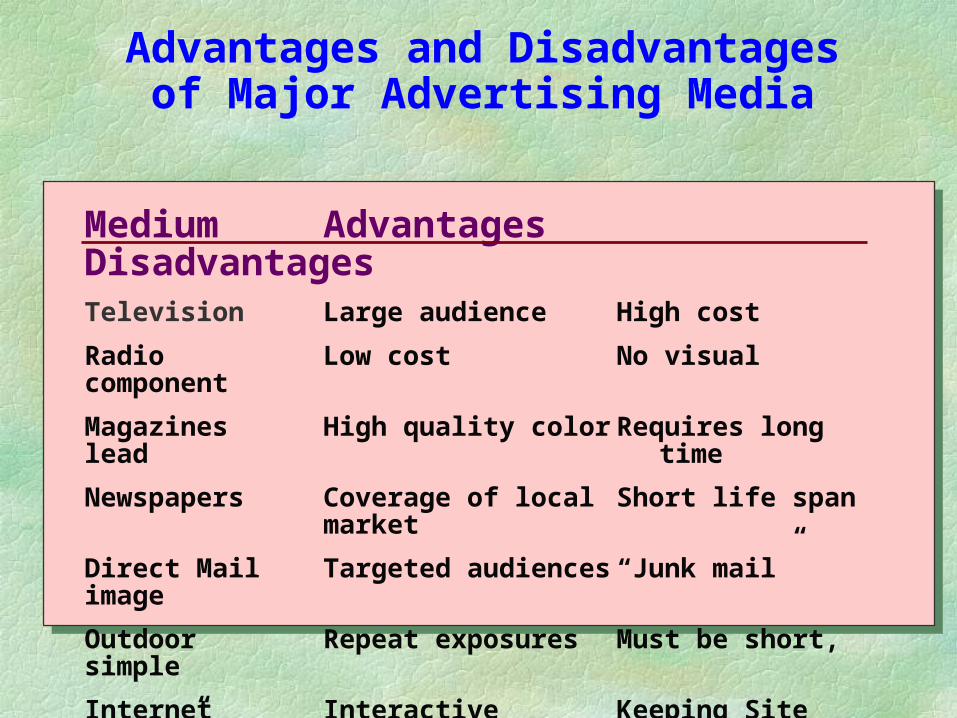
Advantages and Disadvantagesof Major Advertising Media
Medium Advantages DisadvantagesTelevision Large audience High cost
Radio Low cost No visual component
Magazines High quality color Requires long lead time
Newspapers Coverage of local Short life spanmarket
Direct Mail Targeted audiences “Junk mail” image
Outdoor Repeat exposures Must be short, simple
Internet Interactive Keeping Site “Fresh”
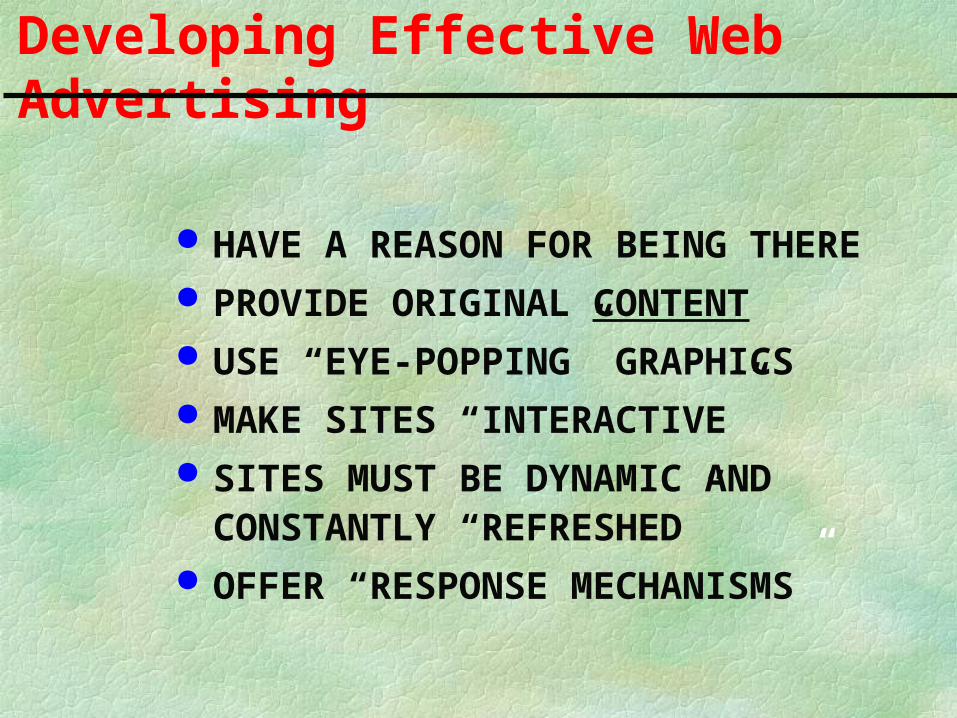
Developing Effective Web Advertising
HAVE A REASON FOR BEING THERE PROVIDE ORIGINAL CONTENT USE “EYE-POPPING” GRAPHICS MAKE SITES “INTERACTIVE” SITES MUST BE DYNAMIC AND
CONSTANTLY “REFRESHED” OFFER “RESPONSE MECHANISMS”
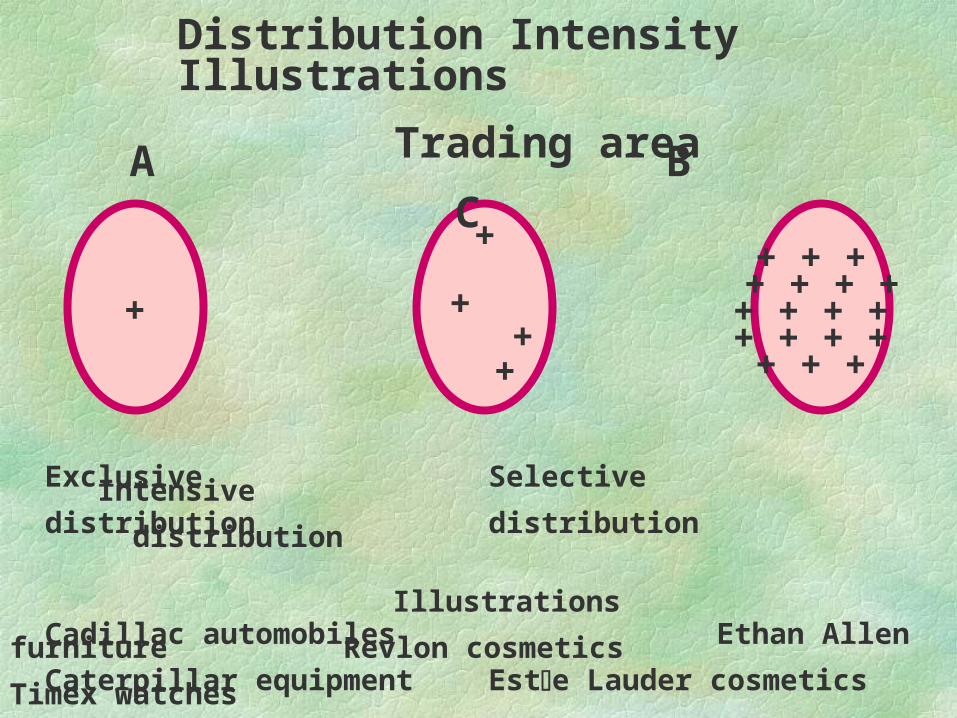
+ + + + + + ++ + + + + + + + + + +
Distribution Intensity Illustrations
Trading area
A B C
Exclusive Selective Intensive distribution distribution distribution
Illustrations Cadillac automobiles Ethan Allen furniture Revlon cosmetics Caterpillar equipment Este Lauder cosmetics Timex watches
+
+
+
++
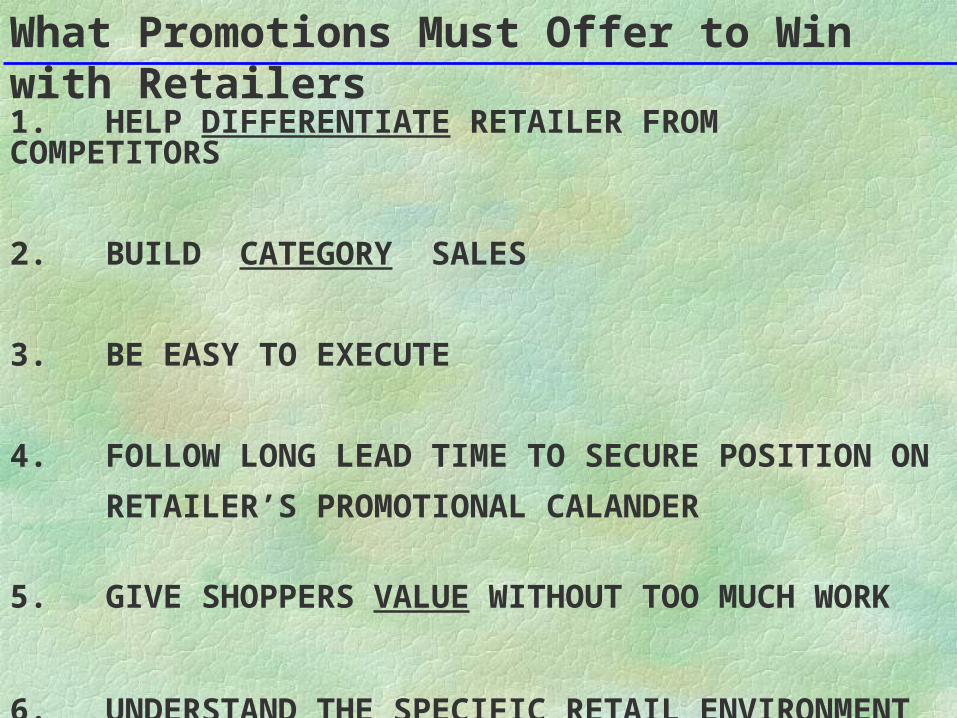
What Promotions Must Offer to Win with Retailers1. HELP DIFFERENTIATE RETAILER FROM COMPETITORS
2. BUILD CATEGORY SALES
3. BE EASY TO EXECUTE
4. FOLLOW LONG LEAD TIME TO SECURE POSITION ON
RETAILER’S PROMOTIONAL CALANDER
5. GIVE SHOPPERS VALUE WITHOUT TOO MUCH WORK
6. UNDERSTAND THE SPECIFIC RETAIL ENVIRONMENT
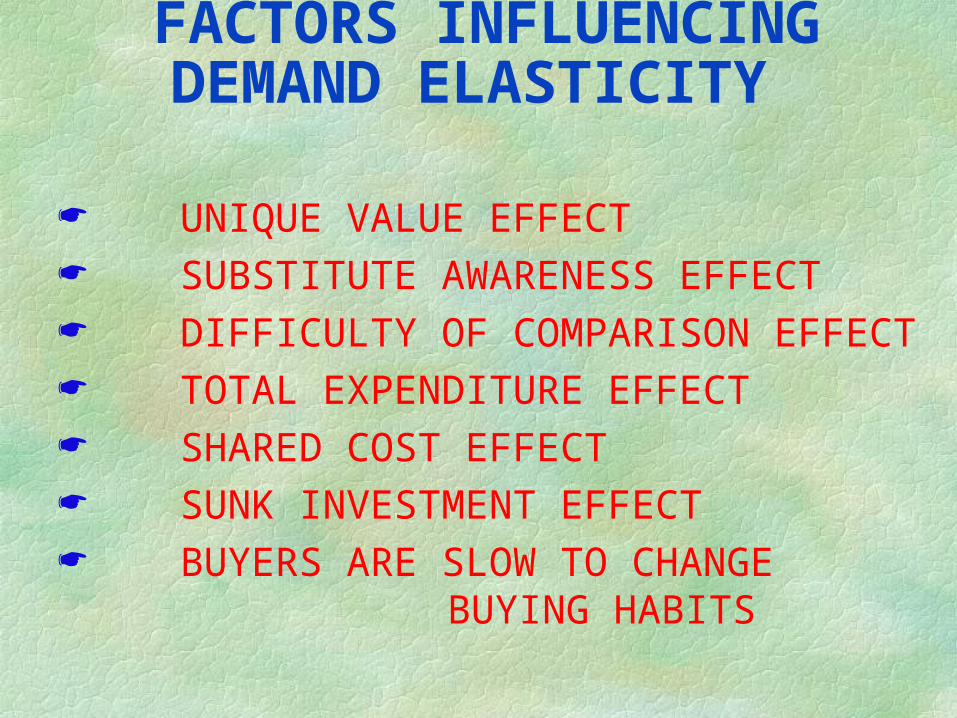
FACTORS INFLUENCING DEMAND ELASTICITY
UNIQUE VALUE EFFECT SUBSTITUTE AWARENESS EFFECT DIFFICULTY OF COMPARISON EFFECT TOTAL EXPENDITURE EFFECT SHARED COST EFFECT SUNK INVESTMENT EFFECT BUYERS ARE SLOW TO CHANGE
BUYING HABITS
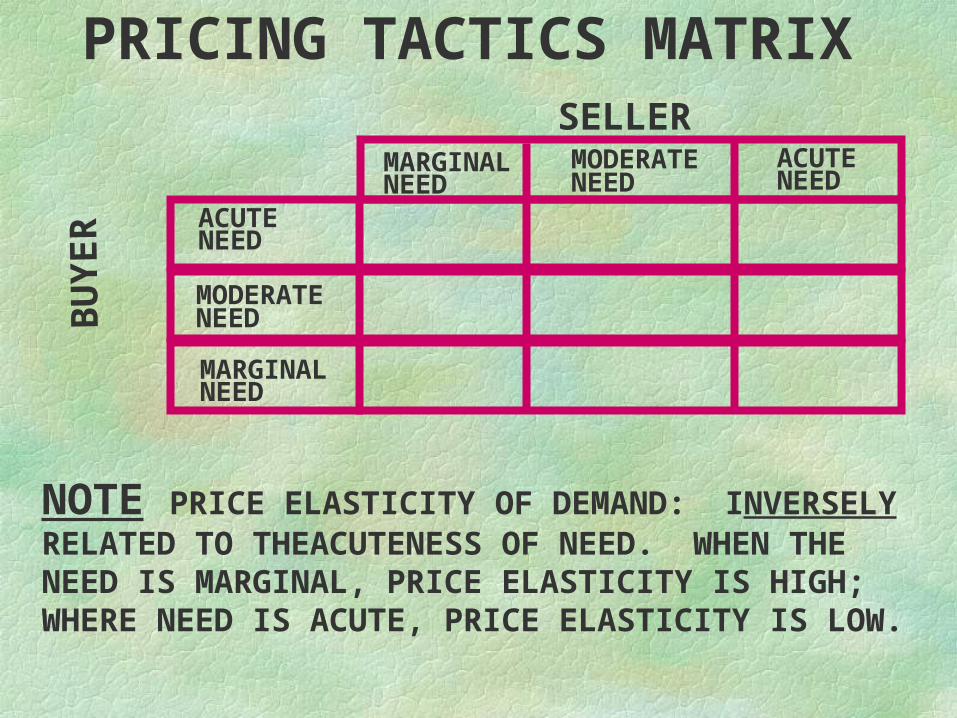
PRICING TACTICS MATRIX
NOTE PRICE ELASTICITY OF DEMAND: INVERSELY RELATED TO THEACUTENESS OF NEED. WHEN THE NEED IS MARGINAL, PRICE ELASTICITY IS HIGH; WHERE NEED IS ACUTE, PRICE ELASTICITY IS LOW.
SELLERB
UY
ER
MARGINALNEED
MODERATE NEED
ACUTENEED
ACUTENEED
MODERATE NEED
MARGINALNEED
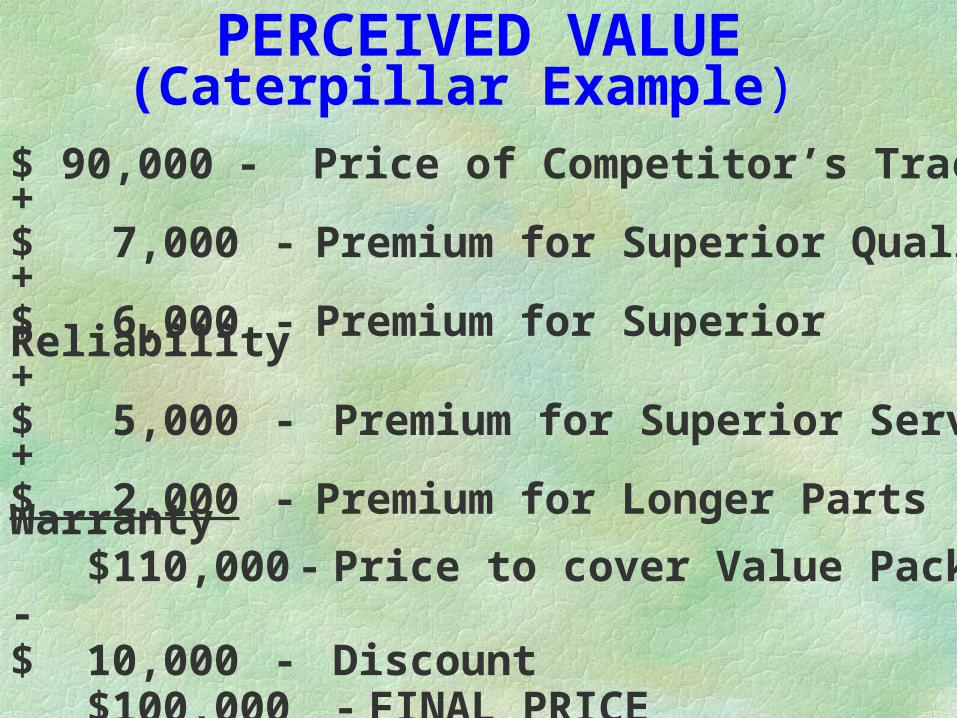
PERCEIVED VALUE(Caterpillar Example)
$ 90,000 - Price of Competitor’s Tractor+
$ 7,000 - Premium for Superior Quality+
$ 6,000 - Premium for Superior Reliability+
$ 5,000 - Premium for Superior Service+
$ 2,000 - Premium for Longer Parts Warranty $110,000 - Price to cover Value Package-
$ 10,000 - Discount $100,000 - FINAL PRICE
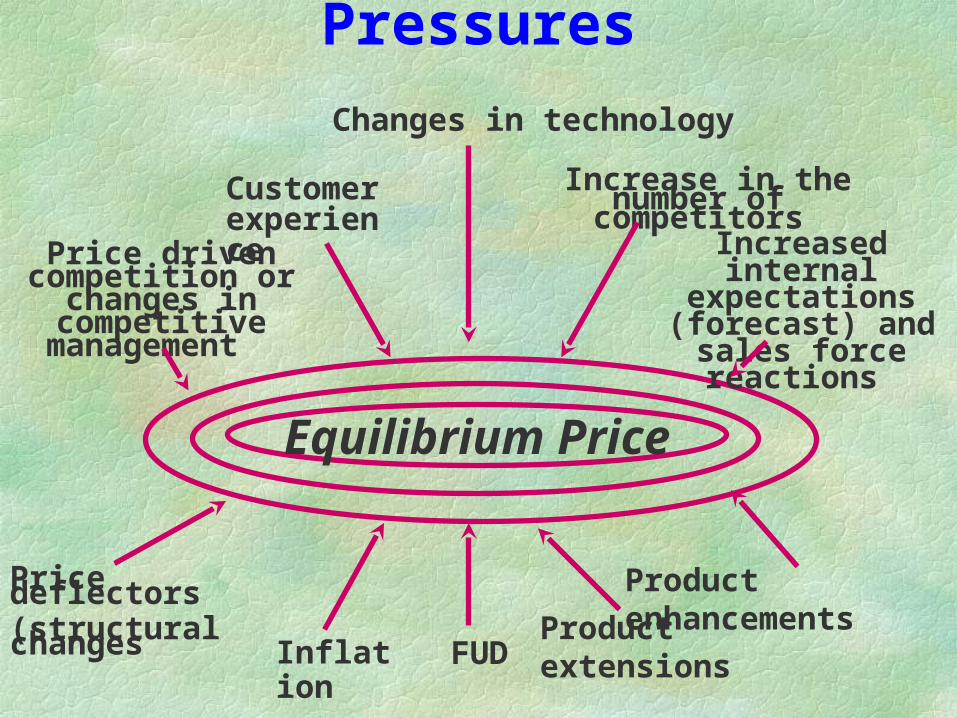
Equilibrium Price
Sources of Pricing Pressures
Changes in technology
Increase in the number of competitors
Increased internal expectations (forecast)
and sales force reactions
Customer experience
Price driven competition or
changes in competitive
management
Price deflectors(structural changes
Inflation FUDProduct extensions
Product enhancements
Major Challenges Facing International Marketers
Cultural Misunderstanding Political Unrest Barriers in Entering Foreign Markets Exchange/Ownership Restrictions Shifting Economic Conditions Selection of Local Partners Proper “Local” Positioning